

CO2 Removal in Hydrogen Production Plants


GASP—Group on Advanced Separation Processes & GAS Processing, Dipartimento di Chimica, Materiali e Ingegneria Chimica “Giulio Natta”, Politecnico di Milano, Piazza Leonardo da Vinci 32, I-20133 Milano, Italy
*
Author to whom correspondence should be addressed.
Energies 2024, 17(13), 3089; https://doi.org/10.3390/en17133089
Submission received: 31 May 2024
/
Revised: 14 June 2024
/
Accepted: 19 June 2024
/
Published: 22 June 2024
(This article belongs to the Special Issue Advances in Hydrogen Energy III)
Abstract
:Hydrogen is an industrial raw material both for the production of chemicals and for oil refining with hydrotreating. It is the subject of increasing attention for its possible use as an energy carrier and as a flexible energy storage medium. Its production is generally accomplished in Steam Methane Reforming (SMR) plants, where a gaseous mixture of CO and H2, with a limited number of other species, is obtained. The process of production and purification generates relevant amounts of carbon dioxide, which needs to be removed due to downstream process requirements or to limit its emissions to the atmosphere. A work by IEAGHG focused on the study of a state-of-the-art Steam Methane Reforming plant producing 100 kNm3/h of H2 and considered chemical absorption with MethylDiEthanolAmine (MDEA) solvent for removing carbon dioxide from the PSA tail gas in a baseline scheme composed of the absorber, one flash vessel and the regeneration column. This type of process is characterized by high energy consumption, in particular at the reboiler of the regeneration column, usually operated by employing steam, and modifications to the baseline scheme can allow for a reduction of the operating costs, though with an increase in the complexity of the plant. This work analyses three configurations of the treatment section of the off gas obtained after the purification of the hydrogen stream in the Pressure Swing Adsorption unit with the aim of selecting the one which minimizes the overall costs so as to further enhance Carbon Capture and Storage in non-power industries as well.
1. Introduction
1.1. Hydrogen Production
The key factors for mitigating CO2 emission are recognized as an improvement in efficiency, the use of renewable and alternative energies and CCS/CCU, i.e., Carbon Capture and Storage and Carbon Capture and Utilization [1].
“Hydrogen is today enjoying unprecedented momentum. The world should not miss this unique chance to make hydrogen an important part of our clean and secure energy future.” as stated by Dr. Faith Birol, Executive Director of the International Energy Agency [2]. Indeed, the use of hydrogen as an energy carrier is subject to increasing attention as a possible way to decarbonize energy consumption. According to the 2024 IEA Energy Technology RD&D Budgets data, hydrogen and fuel cell investments have increased to 9%. It could act as a flexible storage medium for intermittent renewable energy, and its use could reduce carbon dioxide emissions in several key sectors, mainly transport, industry and residential buildings. Chapman et al. [3] detailed the potential of the hydrogen economy since hydrogen can be employed as follows:
- Heat source or as raw material for the chemical industry;
- Alternative source of fossil fuels for space heating or for power generation in thermal power plants;
- Energy storage medium to provide flexibility to the grid;
- Means of transport by the use of fuel cells or after conversion to synthetic fuels.
Although there are still considerable challenges related to fuel cells, hydrogen storage and infrastructures [3,4,5,6,7], H2 consumption has been estimated to grow at a rate of about 3–4% per year [8]. For instance, the transportation of H2 can be performed by using LOHC, such as toluene and dibenzyltoluene [9]. Herrmann et al. [10] stated in a recent study that the use of hydrogen for energy supply is technically, ecologically and economically appropriate. A positive effect on the environment is expected in the case of hydrogen utilization in engines [11].
In the field of hydrogen production, syngas generation may be carried out starting from coal or hydrogen-based fuels or, as has been under research and development for the last decade [12,13,14,15], from renewable primary raw materials based on biomass. The main technology for hydrogen production is based on the reforming of fossil fuels for the generation of syngas, which are then purified. A total of 80% of the worldwide hydrogen demand is produced from natural gas and refinery off-gases [8,16]. In addition to Steam Methane Reforming (SMR), the conventional technology widely used at the commercial scale [17,18], other technologies under development have started to be considered, such as AutoThermal Reforming (ATR), which employs high-purity oxygen and steam, thus avoiding the presence of nitrogen, the syngas chemical looping or the chemical looping reforming. Reforming is also employed for the production of hydrogen from mixtures of CH4 and H2S [19,20], which are studied for obtaining simultaneous H2S valorization and H2 production.
Among the feasible clean-H2 production routes, water electrolysis (low temperature and high temperature) and thermochemical water splitting (pure and hybrid) are considered carbon-free potential technologies for near-term, large-scale hydrogen production, covering about 4% of the world’s H2 demand [21]. Biomass, solar, wind and geothermal are renewable energy sources which could be employed for green hydrogen production [22]. Considering the fact that biomass is carbon dioxide neutral, the environmental impact of its gasification is lower than the one of fossil-fuel-based methods [21]. Solar energy is the largest resource among other renewable options; however, its intermittency, cost-effectiveness, and limited operating efficiency are relevant issues. Similarly, limited availability is a characteristic of wind energy, which, in addition, generally requires large land area occupations [23,24,25]. The use of geothermal energy for effective H2 production is still under study since complete investigations of the technical and economic aspects of this process have started to be carried out only recently. Studies in the literature concluded that hydrogen production based on this type of energy has great potential, with a lower cost [26] and higher sustainability performance [27] than the one based on other renewable sources, such as wind or solar.
Despite the possible use of renewables, SMR is currently recognized as the most economical way to produce hydrogen compared to other fossil fuels and other renewable processes [21,28]. Using electrolysis operated with renewable energy (or other types of energy, such as nuclear energy) is still too expensive for extensive industrial application. Two relevant factors in the production cost are source availability and uninterrupted energy supply. Bouvart and Prieur [29] carried out a detailed study on several combined electricity and hydrogen production pathways based on technologies fueled by natural gas, bituminous coal and lignite. They found that CCS leads to a significant reduction in greenhouse gas emissions while leading to a relevant increase in the energy consumption of this type of plant. However, to consider hydrogen production viable in a decarbonized scenario, which is related to blue hydrogen production, emissions of carbon dioxide from the production plant should be kept at a low level.
When considering hydrogen production in an SMR plant, the removal of carbon dioxide can be accomplished for two main purposes:
- To purify the gaseous stream rich in hydrogen;
- To meet environmental regulations or, generally, to reduce the greenhouse gas impact of the plant due to the emissions of CO2 to the atmosphere.
In the SMR-based H2-producing plant, three types of CO2-containing streams can be found. They are the shifted syngas stream upstream of the Pressure Swing Adsorption (PSA) purification technique; the PSA tail gas, which is employed for the steam reforming, and the flue gas exiting from this unit [30]. The removed CO2 can be used downstream or recovered for use in Enhanced Oil Recovery (EOR). A variety of products can be synthesized from CO2, and its utilization is considered with great attention because it could contribute to cycling carbon or reduce the climate change impact [31]. Carbon dioxide can be employed as raw material for the production of chemicals [32,33], for the production of fuels [34,35,36] or to enhance biological processes [37,38]. It could also be used for technological aims that do not require CO2 conversion, as EOR [39]. To this purpose, a fixed standard for the composition of the concentrated carbon dioxide stream exiting the plant is not known; however, the literature makes reference to a molar fraction of CO2 of at least 0.95 [1,40], which has been taken into account in this work.
1.2. CO2 Removal
This work focuses on the study of the removal phase of carbon dioxide from the PSA tail gas stream of a plant for an hourly production of 100 kNm3 of hydrogen, also provided with a power island, which produces electricity by means of a condensing steam turbine. Any energy consumption within the plant reduces the amount of excess electricity that can be sold to the grid. As reported in the literature [8,41], the cost and efficiency losses due to carbon dioxide removal in SMR plants are a challenge in commercial hydrogen plants. Reddy and Vyas [42] stated that PSA off-gases are ideally suited to be used as a fuel in the hydrogen plant’s reformer. However, carbon dioxide emissions should be limited for environmental issues. Indeed, the potential of CO2 removal from tail gas is under consideration [43], though only a few studies can be found. Chen and Ahn [44] performed a preliminary feasibility study considering two Vacuum Pressure Swing Adsorption and the process based on the MDEA solution. Then, in 2023, Shahid and Kim [45] also focused on this topic, confirming its relevance in recent times. Indeed, detailed studies, such as the one reported in this work, have not been presented yet. Considering the climate change regulations, which aim at the reduction of global warming and the achievement of the targets of the Paris Agreement [46], the removal of carbon dioxide from the PSA tail gas is fundamental to guaranteeing reduced carbon dioxide emissions from hydrogen production plants.
The purification is performed by employing an aqueous solution of MethylDiEthanolAmine (MDEA), with a concentration of 50% wt. on a free basis. Aroonwilas and Veawab compared the performance of carbon dioxide absorption in the aqueous solutions of several amines [47]. Monoetanolamine (MEA) has a fast rate of reaction with CO2. However, a significant amount of energy is required for solvent regeneration, and issues of corrosion and degradation are relevant. Other amines, such as diethanolamine (DEA) and diisopropanolamine (DIPA), are characterized by lower rates of reaction, though they are subject to solvent degradation and are active in corrosion. MDEA is considered a relevant amine because of its high equilibrium loading, high thermal stability, low losses in the vapor phase and lower enthalpy of reaction, thus requiring lower energy for regeneration if compared to MEA [48,49,50].
Amine scrubbing has been applied to CO2 removal from natural gas streams [51] and can also be successfully applied [52] to CO2 removal from syngas streams both for the production of hydrogen and for its combustion for power production. However, the amine-based CO2 removal process is highly energy intensive due to the heat required at the reboiler of the regeneration column of the CO2 capture plant. Therefore, the application of this technology on a large scale is mainly subject to the optimization of the process’ energy performance, with the aim of specifically reducing the energy requirement at the reboiler of the regeneration column for solvent purification [53].
Because of its high energy requirement, CO2 capture represents a step toward affecting the overall efficiency of the plant. In coal-fired power plants, for instance, up to 30% of the power produced can be lost by running this section of the plant, so flexible operation may be considered to reduce the economic losses [54,55,56,57,58,59,60]. For a selected solvent, when operating at full capacity, to avoid uneconomic energy demands, it is fundamental to account for a careful design of the regeneration section by optimizing its configuration and its operating conditions.
Objectives of the Study
This work aims to analyze possible flowsheet modifications of a plant considered in previous work [61] so to reduce the energy penalty and the overall costs due to the investment and the operation associated with solvent absorption-based CO2 capture, focusing on the purification of the PSA tail gas. This work also aims to contribute to the understanding of the possible impact on the energy consumption of this section of the plant.
The study of alternative schemes for energy saving has been widely considered in the literature for other types of CO2 removal applications, such as flue gas from power plants; however, no papers have been found that are related to the analysis of different configurations for the application to PSA tail gas (works in the literature focused on applications to the capture of near atmospheric flue gases, mainly from coal-fired power plants, with maximum carbon dioxide content of about 15% [62,63,64,65]). Without a detailed analysis, the point of whether similar benefits could be obtained for a stream with different conditions and compositions as the PSA tail gas of the H2 production plant cannot be immediately outsourced.
2. The PSA Tail Gas
Table 1 reports the characteristics of the PSA tail gas to be treated.
The amount of carbon dioxide is high, with a mole fraction equal to more than 50%. The remaining species are CO and hydrogen, which are present in relevant amounts (about 24%), and methane (with a molar fraction close to 10%). For this reason, this gas can be exploited for its energetic content and employed in the burners of the Steam Methane Reformer. CO2 needs to be removed to avoid the lowering of the calorific value and to reduce the amount of carbon dioxide in the flue gas exiting from the SMR reformer.
3. The Considered Schemes
Three alternative configurations, with an increase in complexity, have been considered.
The three schemes are characterized by the same feed and the same product in order to ensure the comparison of the three alternatives for the same process performance. The rationale at the basis of the alternatives is employing the change in operating conditions (for instance the pressure in the flash unit) for favoring the desorption of CO2 from the solvent without the use of external energy sources. This would reduce the energy consumption needed in the regeneration column and, therefore, would favor energy saving, with a reduction of the operating costs related to the utilities.
3.1. Scheme (a)
In this configuration of the CO2 capture plant, whose simulation flowsheet is reported in Figure 1, the rich solvent leaving the bottom of the absorption column is sent to a flash drum. The pressure reduction in this unit favors the release of part of the acid gas species previously absorbed in the rich solvent, enhancing the CO2 removal from the solvent stream. Indeed, by flashing the rich solvent, some CO2 is separated from the amine solution and a different composition of the solvent stream fed to the regeneration column, characterized by a lower CO2 content, is obtained. As a consequence, the introduction of the flash drum in the process flowsheet ensures a partial regeneration of the solvent, theoretically allowing for the removal of a significant CO2 flow rate in the vapor phase and thus resulting in lower heat duty at the reboiler. From the top and the bottom of the flash drum, respectively, the vapor gas and the rich solvent are recovered. The vapor gas (FLASHCO2) is then employed as additional fuel to the steam reformer burners, and the rich solvent (TOREG1) is sent to the lean/rich heat exchanger to be heated by the stream of the hot lean solvent coming from the reboiler. After being heated in the lean/rich cross-heat exchanger, the warm, rich solvent is fed to the top of the distillation column to be fully regenerated. This column is a distillation unit with a partial condenser, from which a stream rich in CO2 is obtained, with full reflux, and with a partial reboiler, from which the lean solvent exits.
3.2. Scheme (b)
Scheme (b) is characterized by the presence of a second flash drum, which operates at a different pressure if compared to the first flash unit, to take advantage of the gas expansion and, thus, to favor the release of the most volatile species from the rich solution (Figure 2).
The aim is to obtain two different gaseous streams with different compositions on the basis of the operated pressure.
The rich solvent leaving the bottom of the absorption column (RICHOUT) is expanded to the operating pressure of the first flash drum (high-pressure flash), corresponding to an intermediate pressure between the absorption and regeneration operating pressures. The gaseous stream released by the first gas–liquid separator (HPCO2) is characterized by a smaller flow rate due to the higher flash operating pressure. However, it is characterized by a composition richer in hydrogen, which can be recovered.
The flashed solution from the first flash drum (HPLIQ) is further flashed at lower pressure in the second flash drum (low-pressure flash). The gaseous stream released by the second gas–liquid separator (FLASHCO2) mainly consists of CO2, depending on the flash operating pressure, and the liquid solution (LPLIQ), with lower CO2-rich loading than RICHOUT, is sent to the regeneration section. As detailed in Section 5, because the operating pressure of the second flash drum is lower than the one of the first stage, a larger vaporization extent is achieved in this case, resulting in a higher vapor flow rate.
3.3. Scheme (c)
In Scheme (c), in order to minimize the process energy requirements and to take advantage of the capability of the MDEA solvent to be partially regenerated by simple pressure reduction, two sections for CO2 absorption, fed with two solvent streams of different compositions, have been considered. The bulk of the CO2 is removed in the lower section of the absorption column with a semi-lean MDEA solution, and the residual amounts of CO2 are removed in the top section of the absorber with a steam-regenerated solution. The regeneration occurs with two different degrees in two different sections. The rich solvent leaving the absorber is then sent through two successive flash stages, constituting the first section of regeneration that provides a semi-lean regenerated solvent before being fed (partially) to the lean-rich cross heat exchanger where the cold-rich stream to the regenerator exchanges heat with the hot lean stream exiting from the reboiler. The second regeneration section consists of a reboiled stripping column, different from the distillation unit considered in Scheme (a) and in Scheme (b). It treats only part of the total semi-lean solution, leaving the low-pressure flash drum, thus providing the required lean solvent, which is finally recycled to the top of the absorption column. Part of the vapors coming from the stripping section of the regenerator is recycled back to the low-pressure flash drum to strip and heat the semi-lean solution, and vapors from the low-pressure flash drum are used in the bottom section of the regenerator to condense most of the water contained in the gas. For the two-stage absorption process, only a portion of the semi-lean solution (stream TOREG1) is regenerated, thus reducing the energy requirements [66]. The remaining part of the semi-lean solvent (stream SEMILEAN) is pumped to the absorption section without further regeneration.
By feeding a semi-lean solution to it, the absorber can be divided into two main sections. In the lower section of the unit, the semi-lean solvent ensures the removal of the bulk of the CO2 contained in the gaseous stream. The residual CO2 traces are removed in the top section of the absorber with the more purified solvent.
Considering the flowsheet of the simulation of Scheme (c) (Figure 3), the rich solution exiting the absorption column (RICHOUT) is first sent to the two flash stages to release, by expansion, part of the CO2 contained in this stream. After being partially regenerated by pressure reduction, it is split into two streams so that part of the semi-regenerated solution is recycled upstream to the absorption section (SEMILEAN), and the remaining one (TOREG1) is sent to the regeneration section after exchanging heat with the hot lean solution from the regeneration (LEAN1). By doing so, a lower fresh solvent flow rate is required at the absorption section to achieve the same CO2 capture rate. As a consequence, the amount of the lean solvent flow rate is lower, though the overall amount of circulating solvent is higher than in the other configurations because the semi-lean solvent is characterized by a lower absorption capacity. Stream CO2REG1 could be split to recycle part of the vapors (stream TOFLASH) to the low-pressure flash to provide some benefit to the regeneration section, if any. Stream CO2OUT is then cooled to 30 °C to compare the different considered schemes.
4. Methodology
4.1. Tool for Simulation and Economic Evaluation
The process has been simulated in ASPEN Plus® V11, previously modified by the GASP research group of Politecnico di Milano [67] to take into account both the thermodynamics and the mass transfer with reactions occurring when absorbing carbon dioxide with aqueous solutions of MDEA. The tool can also perform the calculation considering gases with the presence of aromatic species [68] and mercaptans [69], often found in natural gas processing.
For the simulation, the packed unit of the absorber has been divided into 51 stages. When considering rate-based simulations, this number represents the number of segments into which the total height of the packed column is divided in order to perform the calculations of equilibrium, heat and material balances.
The different schemes have also been compared in terms of capital and operating costs, which have been calculated considering the methodologies by Turton [70] and Peters and Timmerhaus [71].
For determining the cost of the utilities, 50.58 USD/MWh has been assumed for the cost of low-pressure steam available at 5 barg and 160 °C, 60.48 USD/MWh for the cost of electricity and 1.2744 USD/MWh (or 14.8 USD/1000 m3 water) for the cost of cooling water.
4.2. Procedure Employed in this Study
The analysis of these alternative configurations has been carried out by considering for each scheme the same column dimensions and the same amount of CO2 to be removed (96.49% of the CO2 entering the AGR plant [61]). The characteristics of the two columns have been taken from Pellegrini et al. [61], who developed a detailed study on the choice of column internals for the considered system. In detail, Scheme (a) with the flash unit operated at 4.5 bar [61] is taken as a reference. The CO2 compression section downstream of the carbon dioxide removal section is assumed to be the same for all the schemes. The operating conditions of the added equipment and the amount of solvent flow rates may have been modified in order to achieve the desired specifications according to the different schemes. As for the lean-rich heat exchanger, a minimum ΔT approach of 10 K has been considered.
For each configuration, one or more sensitivity assessments have been carried out in order to choose the optimal process parameters, mainly for the energy requirements. The investment and operating costs have also been considered. The details for each scheme are reported in the following.
4.2.1. Methodology Employed for the Analysis of Scheme (a)
The effect of the operating pressure of the flash in Scheme (a) has been analyzed. In particular, the sensitivity analysis has been carried out on the outlet pressure of the valve downstream of the absorption column, and the flash drum operating conditions have been defined considering the pressure of the stream entering the flash drum (LOWPRICH) and a temperature of 347.15 K. It is assumed that this temperature is reached by using waste heat available in the condensate stream exiting the reboiler of the regeneration column. For the sensitivity analysis, the outlet pressure of the lamination valve has been varied in the range of 2.9–9.8 bar, corresponding to the two conditions of the range between the operating pressure of the regenerator and the one of the absorber. The effect of this parameter on the massive flow rates and molar compositions of the vapor (FLASHCO2) and liquid (TOREG1) streams exiting the flash drum has been analyzed.
4.2.2. Methodology Employed for the Analysis of Scheme b)
As for Scheme (b), different sensitivity analyses have been carried out for all the examined cases with the aim of determining the optimal values of the operating pressure for the two-stage flash. It should be noted that the operating pressures of the two flash vessels have a strong influence on the amount of vapor released and, as a consequence, on the amount of CO2 which can be removed from the liquid-rich solution in these units.
After having studied the influence of the operating pressure of the high-pressure (HP) flash on the energy requirements with the same range of variation of pressure defined for Scheme (a), a second sensitivity analysis has been carried out for all the examined cases to study the effect of the low-pressure (LP) flash operating pressure on the reboiler duty to determine the optimal value of this parameter.
4.2.3. Methodology Employed for the Analysis of Scheme (c)
For analyzing Scheme (c), after having identified the optimal feed stage of the semi-regenerated solution to the absorption column, the effect of the flow rate of the recycled semi-lean solution on the reboiler energy consumption has been investigated by varying the split percentage of the semi-lean solution recycled to the absorption section (SEMILEAN). For each value of the split fraction investigated, the minimum flow rate of lean solvent fed to the absorber has been calculated to guarantee the fixed CO2 capture rate.
The split percentage of the recycle stream has varied up to 50% for all the examined cases, assuming that it has not regenerated more than half of the total solvent flow rate, which would have caused a relevant increase in the total circulating solvent in the plant, in particular in the absorption section, similarly to increasing the total lean loading of a solvent as in Moioli et al. [72]. Higher values of the split fraction have not been investigated because, for these values, the contributions of the regeneration column become negligible. The feed stage of the recycle stream has been set to equal the optimal one resulting from the related sensitivity analysis on all the heights of the column (not reported here for reasons of limited space), and different configurations have been considered for each case with different split fractions of the CO2-rich stream exiting from the top of the stripping column (CO2REG1).
5. Results and Discussion
5.1. Scheme (a)
The flow rate of the gaseous stream leaving the flash drum (FLASHCO2) decreases by increasing the flash operating pressure (Figure 4). Significant vaporization of the rich solvent at the gas–liquid separator is achieved, involving a flow rate of the gaseous stream released at the separator equal to 9.47 kg/s for a flash operating pressure of 2.9 bar. The same considerations can be derived in particular for the massive CO2 flow rate in the vapor phase, CO2 being the main component of this stream (Figure 5a). Also, the massive H2O flow rate in the gaseous stream varies significantly with the flash operating pressure, while the H2 content in this stream is much lower, and thus, its variation is almost negligible if compared to one of the other species.
As a result of this sensitivity analysis, operating the flash drum at the lowest pressure (2.9 bar) allows for maximizing the flow rate and, therefore, the recovery of CO2 in the vapor stream leaving the gas–liquid separator (FLASHCO2), though with content in water of more than 10%, which must be removed before downstream utilization of carbon dioxide. The amount of hydrogen present in the vapor stream exiting the flash is very low due to low co-absorption in the absorption column.
As for the solvent stream separated in the flash drum (TOREG1), the massive flow rates of the individual components of this stream increase as well by increasing the operating pressure of the flash drum, with CO2 apparent molar fractions due to the lower amount of this gas released to the vapor phase (Figure 5c). The apparent molar fraction is defined as the molar fraction including both the molecular solute (CO2 in this case) and its ions.
By increasing the flash operating pressure, the CO2 loading, defined as the ratio of moles of CO2 and moles of MDEA in the liquid phase, of the solvent stream entering the regenerator (HOTREG1) increases almost linearly, so an increasing profile for the reboiler duty is obtained (Figure 6).
As a consequence, the optimal operating pressure of the flash drum is the lowest of the investigated range (2.9 bar), as it ensures the maximum recovery of CO2 in the vapor phase and, thus, the optimal solvent purification in the above-mentioned operating conditions, resulting in the minimum reboiler duty. Operating the flash drum at a pressure of 3 bar (taking into account the pressure drop in the lean–rich heat exchanger), about a 16% reduction in reboiler duty is obtained with respect to its operation at 4.5 bar and at the same temperature.
5.2. Scheme (b)
The effect of the HP flash operating pressure on the massive flow rates and molar compositions of the vapor (HPCO2) and liquid (HPLIQ) streams exiting the HP gas–liquid separator has been firstly analyzed. The trend of the obtained results is similar to that of Scheme (a).
Differently from Scheme (a), however, the reboiler heat duty required for generating the stripping vapor is not influenced by the operating pressure of the HP flash drum. This is due to the presence of the second gas–liquid separator, which levels out the CO2 loading and the flow rate of the solvent stream fed to the regeneration section. Consequently, operating the first flash unit at the highest pressure of the investigated range (9.8 bar) provides a benefit for the process only in terms of minimization of the amount of water exiting in the CO2-rich vapor stream.
Another analysis has been carried out on the outlet pressure of the lamination valve downstream of the first flash drum, considering the LP flash is operated at 347.15 K [61] and at the pressure of the stream entering the gas–liquid separator (LOWP).
As a result, operating the first flash drum at 9.8 bar and the second flash unit at 3 bar, a reboiler heat duty of 8.94 MW is obtained, with a 16% reduction in the energy requirements with respect to Scheme (a) where the single stage-flash is operated at 347.15 K and 4.5 bar.
No difference between the optimized Scheme (a) (with flash operated at 3 bar) and Scheme (b) can be found for energy saving. The main advantage is related to the availability of a stream rich in carbon dioxide with a very low content of water, which does not need water removal treatments as stream FLASHCO2 needs.
5.3. Scheme (c)
For Scheme (c), several analyses have been performed to take into account the different main parameters.
5.3.1. Analysis of the Split Fraction of the CO2-Rich Vapor Stream
The analysis of the split fraction of the CO2-rich vapor stream has been first carried out, considering the range of 0.05–0.95. Results show that this split fraction does not significantly modify the energy requirements (if compared, for instance, to the effect of the split fraction of the semi-lean solvent analyzed in Section 5.3 and considering that the minimum reboiler duty is obtained for the minimum value of split fraction (5%)). A further study carried out for a split fraction of 0% confirmed the trend, with the minimum value of reboiler duty obtained equal to 0.56 MJ/kgCO2.
On the basis of these results, a split percentage of the regeneration vapors recycled to the low-pressure flash equal to 0% has been considered.
When all the stream CO2REG1 is fully sent directly to compression for a solvent flow rate (LEANIN) of 93 kg/s, the minimum specific reboiler duty results in 0.56 MJ/kg CO2, with about 33.50% saving in comparison with the reference Scheme (a). This leads to the conclusion that operating the recycle of the vapors exiting the stripping column to the low-pressure flash provides no benefit to the operation of this plant because of the specific composition of this system and of the operation of the flash at quite high temperatures. Indeed, the main benefit should come from the warming effect on the flash unit due to the hot vapor streams exiting from the top of the regeneration column, which should enhance the vaporization of the part of the rich solvent. This additional benefit is negligible when operating the flash unit at a high temperature (347.15 K).
5.3.2. Effect of the Semi-Lean Feed Stage
In addition to analyzing the negligible effect of the split of vapors exiting from the top of the regenerator column and before defining the optimal split fraction for the semi-lean solvent, the influence of the feed stage of the semi-lean solvent on the absorption column has been considered.
The overall circulating flow rate is set to achieve the target CO2 removal by changing the feed stage of the semi-lean stream to the absorption column. No significant variations are observed for the flow rate of the purified gaseous stream leaving the top of the column (GASOUT).
The total massive and molar flow rates of the rich liquid solution leaving the absorber (RICHOUT) vary significantly, and a minimum trend of the reboiler duty of the regeneration column is observed due to the different operations of the absorption column. The trend is due to the variation of the circulating flow rate in the absorption column, which influences the increase in the temperature along the absorber because of the exothermicity of the chemical reactions of CO2 with the solvent. The temperature also influences the chemical equilibrium and the kinetics of reactions, determining the total solvent flow rate required for a given % of CO2 removal. Therefore, in the regeneration column, the reboiler duty varies significantly, depending on the characteristics of the solvent stream to be regenerated.
Feeding the semi-lean solvent at simulation stage 12 results in requiring the minimum energy at the reboiler (Figure 7), for a split percentage of the vapor stream recycled to the low-pressure flash equal to 0% and for a split percentage of the semi-lean stream equal to 10%. The obtained specific reboiler duty is 0.79 MJ per kilogram of absorbed carbon dioxide, with about a 5.5% reduction obtained with respect to Scheme (a) with reference conditions.
5.3.3. Effect of the Split Fraction
For each value of the recycle percentage, the flow rate of lean solution fed to the absorber has been determined as the one that achieves the required value of CO2 capture rate (96.49%), accounting specifically for the contribution represented by the recycle stream in terms of absorption capacity. For this analysis, by increasing the flow rate of the semi-lean solution recycled to the absorber (SEMILEAN), the LEANIN flow rate moves from 139 kg/s, in correspondence with a recycling percentage of 5%, to 93 kg/s when recycling 50% of the semi-lean solution. Indeed, the introduction of the semi-lean solution recycling to the absorber increases the absorption capacity within the column and reduces the amount of carbon dioxide fed to the stripping column for regeneration. This causes an increase in the flow rate of the solution to split and be recycled. The flow rate of the semi-lean solution in the closed recycle loop results equal to 8 kg/s and 97 kg/s for a recycle percentage of 5% and 50%, respectively.
The absorber performances in terms of CO2 removal remain unchanged, and the profiles of flow rate, composition of the species and temperature of the vapor phase and of the liquid phase vary. No substantial variations are observed for what concerns the characteristics of the purified gaseous stream leaving the top of the absorber (GASOUT).
The effect of the investigated parameter on the temperature of the main process streams upstream of the regeneration section is reported in Figure 8. The observed increasing temperatures of the streams leaving the absorber (RICHOUT) and entering the high-pressure flash drum (LOWPRICH) are related to the introduction in the absorption column of a recycle stream available at a higher temperature than the temperature level of the absorber. As a result, the temperature of the rich solution leaving the absorber (RICHOUT) increases by increasing the flow rate of the semi-lean solution recycled to the absorption section.
Figure 9 shows the effect of the recycle percentage on the energy consumption of the regeneration section in terms of specific reboiler duty.
A decreasing trend of the reboiler duty results from increasing the flow rate of the semi-regenerated solvent recycled upstream to the absorption section (SEMILEAN) due to the reduction in the flow rate of the solvent employed in the purification process, which influences the flow rate of the stream fed to the stripping column. The minimum energy consumption at the reboiler is obtained in correspondence with the maximum value of the recycle percentage in the investigated range (50%). For a solvent flow rate (LEANIN) of 93 kg/s, the minimum reboiler duty and specific reboiler duty are, respectively, 7.10 MW and 0.56 MJ/kg CO2. A reduction of 33.22% is achieved if compared to the reference Scheme (a).
6. Comparison among the Schemes
6.1. Technical Comparison
Table 2 reports a comparison of the most relevant schemes analyzed in this paper.
On the basis of the results obtained in Section 5, Scheme (c) is the most promising one because it is characterized by the lowest energy consumption at the reboiler of the regeneration column. It is, however, composed of a higher number of units and presents a more complex configuration.
6.2. Economic Comparison
An economic evaluation, taking into account both the investment and the operating costs, has been performed, and Scheme (c) has been compared to the optimized Scheme (a). Results of Scheme (b) are not reported because this configuration shows no relevant benefits in terms of energy saving if compared to the optimized Scheme (a), as concluded in Section 5.2.
Figure 10a) reports the comparison in terms of the cost of investment and the cost of utilities. Among these costs, steam is the most relevant for both configurations if compared to electricity and cooling water (Figure 10b). The electricity cost for Scheme (c) is about 1.4 times the one needed in Scheme (a) because of the added pump for the semi-lean solvent and because of the higher amount of circulating solvent through the plant. Despite this, it only accounts for less than 3% of the total costs of utilities.
Because of the higher complexity of the plant, Scheme (c) requires higher investment costs. The complexity of the configuration also influences the total cost of manufacturing, composed of the cost of maintenance and repair, the cost of part of the local taxes and insurances, the cost of part of the overhead plant costs and the cost of the administration. For instance, the costs for maintenance and repairs, estimated to equal 7% of the Fixed Capital Investment, is about 272,000 USD higher for Scheme (c). It, however, allows for a lower steam consumption, so that, considering the expenses due to the utilities consumption of the plant, Scheme (c)’s results are more advantageous.
The estimated Net Present Value (NPV) of the project is equal to −118.3 MUSD for Scheme (a) and to −120.41 MUSD for Scheme (c). The USD per ton of CO2 avoided is −32.29 USD/tCO2 for Scheme (a) and −32.78 USD/tCO2 for Scheme (c). The carbon tax is a way to have carbon emitters pay for the climate change caused by releasing CO2 into the atmosphere. Its application, with a value of only 35 USD/tCO2, would make the NPV of this hydrogen-producing plant favorable with the CO2 removal section in operation.
The choice of Scheme (c) is also favored because of the lower environmental impact in terms of emissions and the use of energy sources that would result from the lower energy consumption.
7. Conclusions
This paper focuses on the study of a purification process for CO2 removal from the PSA tail gas within an SMR-based hydrogen plant. In particular, the analysis of three alternative configurations has been carried out with the aim of understanding whether some benefits in energy saving could be obtained and to what extent. In the end, it is the one that minimizes the energy consumption for the process of treatment of the PSA tail gas stream by employing an aqueous solution of MethylDiEthanolAmine.
On the basis of the obtained results, Scheme (c) provides the lowest reboiler duty if operated with a split fraction of the semi-lean solvent equal to 50% and without recycling the CO2-rich stream in the flash unit.
The work highlights that process modifications can result in energy savings and cost reduction for the carbon dioxide removal section applied to the purification unit of the PSA tail gas, for which no detailed works on this specific topic can be found in the literature. It provides a starting point for its widespread application at the industrial level, especially considering the increasing attention to hydrogen utilization. Indeed, although renewable hydrogen produced from the electrolysis of water using renewable power is thought to be a long-term solution, it has been estimated that it may not achieve economic sustainability until at least about 2045. By operating the CO2 removal plant as studied in this work, the carbon intensity of hydrogen produced from non-renewable sources can be mitigated substantially, favoring the reduction of greenhouse gas emissions.
Despite the higher initial investment costs for a more complex configuration as for Scheme (c), the resulting cost of manufacturing, strongly dependent on the utility consumption, results significantly reduced. This reduction creates benefits on the overall costs of the plant and favors a further reduction of the CO2 emissions to the atmosphere. All the considered alternatives are characterized by the same performance in terms of CO2 removal. They differ, such as in the total CO2 emissions related to the generation of the utilities, particularly in the low-pressure steam to be used at the reboiler of the regeneration section, which is often produced in a steam generator by the combustion of fossil fuels.
The findings obtained in this study can be applied to other PSA tail gas streams. As also reported by Voss [1], adsorption processes can contribute to carbon dioxide removal from several gaseous streams and much research on this topic is being performed. For instance, a five-step PSA cycle for CO2 separation in a single column, employing an adsorbent with similar performances to those already commercially employed and which could be regenerated, is being considered [73]. The selection of the best configuration for energy saving while avoiding carbon dioxide emissions into the atmosphere when emitting PSA tail gas streams from several industrial applications can be a further development of this work.
Author Contributions
Conceptualization, S.M. and L.A.P.; methodology, S.M. and L.A.P.; software, S.M.; validation, S.M. and L.A.P.; formal analysis, S.M. and L.A.P.; investigation, S.M. and L.A.P.; resources, S.M. and L.A.P.; data curation, S.M. and L.A.P.; writing—original draft preparation, S.M.; writing—review and editing, L.A.P.; visualization, L.A.P.; supervision, L.A.P.; project administration, S.M. and L.A.P. All authors have read and agreed to the published version of the manuscript.
Funding
This research received no external funding.
Data Availability Statement
The original contributions presented in the study are included in the article; further inquiries can be directed to the corresponding author.
Conflicts of Interest
The authors declare no conflicts of interest.
Nomenclature
| Acronyms | |
| CCS | CO2 Capture and Storage |
| CCSU | CO2 Capture, Storage and Utilization |
| CCU | CO2 Capture and Utilization |
| IEAGHG | International Energy Agency Greenhouse Gas R&D Programme |
| MDEA | MethylDiEthanolAmine |
| NPV | Net Present Value |
| PSA | Pressure Swing Adsorption |
| SMR | Steam Methane Reforming |
References
- Voss, C. CO2 removal by PSA: An industrial view on opportunities and challenges. Adsorption 2014, 20, 295–299. [Google Scholar] [CrossRef]
- IEA. The Future of Hydrogen. Available online: https://www.iea.org/reports/the-future-of-hydrogen (accessed on 15 April 2024).
- Chapman, A.; Itaoka, K.; Hirose, K.; Davidson, F.T.; Nagasawa, K.; Lloyd, A.C.; Webber, M.E.; Kurban, Z.; Managi, S.; Tamaki, T.; et al. A review of four case studies assessing the potential for hydrogen penetration of the future energy system. Int. J. Hydrogen Energy 2019, 44, 6371–6382. [Google Scholar] [CrossRef]
- Mori, D.; Hirose, K. Recent challenges of hydrogen storage technologies for fuel cell vehicles. Int. J. Hydrogen Energy 2009, 34, 4569–4574. [Google Scholar] [CrossRef]
- Ball, M.; Wietschel, M. The future of hydrogen—Opportunities and challenges. Int. J. Hydrogen Energy 2009, 34, 615–627. [Google Scholar] [CrossRef]
- Papadias, D.D.; Ahmed, S.; Kumar, R.; Joseck, F. Hydrogen quality for fuel cell vehicles—A modeling study of the sensitivity of impurity content in hydrogen to the process variables in the SMR–PSA pathway. Int. J. Hydrogen Energy 2009, 34, 6021–6035. [Google Scholar] [CrossRef]
- Baroutaji, A.; Wilberforce, T.; Ramadan, M.; Olabi, A.G. Comprehensive investigation on hydrogen and fuel cell technology in the aviation and aerospace sectors. Renew. Sust. Energ Rev. 2019, 106, 31–40. [Google Scholar] [CrossRef]
- Salkuyeh, Y.K.; Mofarahi, M. Reduction of CO2 capture plant energy requirement by selecting a suitable solvent and analyzing the operating parameters. Int. J. Energy Res. 2013, 37, 973–981. [Google Scholar] [CrossRef]
- Spatolisano, E.; Restelli, F.; Matichecchia, A.; Pellegrini, L.A.; de Angelis, A.R.; Cattaneo, S.; Roccaro, E. Assessing opportunities and weaknesses of green hydrogen transport via LOHC through a detailed techno-economic analysis. Int. J. Hydrogen Energy 2024, 52, 703–717. [Google Scholar] [CrossRef]
- Herrmann, A.; Mädlow, A.; Krause, H. Key performance indicators evaluation of a domestic hydrogen fuel cell CHP. Int. J. Hydrogen Energy 2019, 44, 19061–19066. [Google Scholar] [CrossRef]
- Akal, D.; Öztuna, S.; Büyükakın, M.K. A review of hydrogen usage in internal combustion engines (gasoline-Lpg-diesel) from combustion performance aspect. Int. J. Hydrogen Energy 2020, 45, 35257–35268. [Google Scholar] [CrossRef]
- Pakpour, F.; Najafpour, G.; Tabatabaei, M.; Tohidfar, M.; Younesi, H. Biohydrogen production from CO-rich syngas via a locally isolated Rhodopseudomonas palustris PT. Bioprocess Biosyst. Eng. 2014, 37, 923–930. [Google Scholar] [CrossRef] [PubMed]
- Dutta, A.; Acharya, B. 16—Production of bio-syngas and biohydrogen via gasification. In Handbook of Biofuels Production; Luque, R., Campelo, J., Clark, J., Eds.; Woodhead Publishing: Sawston, UK, 2011; pp. 420–459. [Google Scholar]
- Kumar, A.; Sarkar, S. Chapter 21—Biohydrogen Production from Bio-oil. In Biofuels; Pandey, A., Larroche, C., Ricke, S.C., Dussap, C.-G., Gnansounou, E., Eds.; Academic Press: Amsterdam, The Netherlands, 2011; pp. 481–497. [Google Scholar]
- Bermudez, J.M.; Fidalgo, B. 15—Production of bio-syngas and bio-hydrogen via gasification. In Handbook of Biofuels Production, 2nd ed.; Luque, R., Lin, C.S.K., Wilson, K., Clark, J., Eds.; Woodhead Publishing: Sawston, UK, 2016; pp. 431–494. [Google Scholar]
- Muradov, N. Low to near-zero CO2 production of hydrogen from fossil fuels: Status and perspectives. Int. J. Hydrogen Energy 2017, 42, 14058–14088. [Google Scholar] [CrossRef]
- Riis, T.; Hagen, E.F.; Vie, P.J.; Ulleberg, Ø. Hydrogen Production and Storage-R&D Priorities and Gaps; International Energy Agency (IEA): Paris, France, 2005. [Google Scholar]
- Rostrup-Nielsen, J.R.; Rostrup-Nielsen, T. Large-Scale Hydrogen Production. Cattech 2002, 6, 150–159. [Google Scholar] [CrossRef]
- Spatolisano, E.; De Guido, G.; Pellegrini, L.A.; Calemma, V.; de Angelis, A.R.; Nali, M. Hydrogen sulphide to hydrogen via H2S methane reformation: Thermodynamics and process scheme assessment. Int. J. Hydrogen Energy 2022, 47, 15612–15623. [Google Scholar] [CrossRef]
- Spatolisano, E.; De Guido, G.; Pellegrini, L.A.; Calemma, V.; de Angelis, A.R.; Nali, M. Process sensitivity analysis and techno-economic assessment of hydrogen sulphide to hydrogen via H2S methane reformation. J. Clean Prod. 2022, 330, 129889. [Google Scholar] [CrossRef]
- El-Emam, R.S.; Ozcan, H.; Dincer, I. Comparative cost evaluation of nuclear hydrogen production methods with the Hydrogen Economy Evaluation Program (HEEP). Int. J. Hydrogen Energy 2015, 40, 11168–11177. [Google Scholar] [CrossRef]
- Spatolisano, E.; Pellegrini, L.A. Haber-Bosch process intensification: A first step towards small-scale distributed ammonia production. Chem. Eng. Res. Des. 2023, 195, 651–661. [Google Scholar] [CrossRef]
- Denholm, P.; Hand, M.; Jackson, M.; Ong, S. Land-Use Requirements of Modern Wind Power Plants in the United States; NREL/TP-6A2-45834; National Renewable Energy Lab. (NREL): Golden, CO, USA, 2009. [Google Scholar]
- Palmer-Wilson, K.; Donald, J.; Robertson, B.; Lyseng, B.; Keller, V.; Fowler, M.; Wade, C.; Scholtysik, S.; Wild, P.; Rowe, A. Impact of land requirements on electricity system decarbonisation pathways. Energy Policy 2019, 129, 193–205. [Google Scholar] [CrossRef]
- Roque, L.A.C.; Paiva, L.T.; Fernandes, M.C.R.M.; Fontes, D.B.M.M.; Fontes, F.A.C.C. Layout optimization of an airborne wind energy farm for maximum power generation. Energy Rep. 2020, 6, 165–171. [Google Scholar] [CrossRef]
- Ghazvini, M.; Sadeghzadeh, M.; Ahmadi, M.H.; Moosavi, S.; Pourfayaz, F. Geothermal energy use in hydrogen production: A review. Int. J. Energy Res. 2019, 43, 7823–7851. [Google Scholar] [CrossRef]
- Dincer, I.; Acar, C. Innovation in hydrogen production. Int. J. Hydrogen Energy 2017, 42, 14843–14864. [Google Scholar] [CrossRef]
- Simbeck, D.; Chang, E. Hydrogen Supply: Cost Estimate for Hydrogen Pathways—Scoping Analysis; National Renewable Energy Lab. (NREL): Golden, CO, USA, 2002. [Google Scholar]
- Bouvart, F.; Prieur, A. Comparison of life cycle GHG emissions and energy consumption of combined electricity and H2 production pathways with CCS: Selection of technologies with natural gas, coal and lignite as fuel for the European HYPOGEN Programme. Energy Procedia 2009, 1, 3779–3786. [Google Scholar] [CrossRef]
- Del Ben, L. Study of Energy Saving Configurations in the CO2 Removal Section of a SMR-Based H2 Plant. Master’s Thesis, Politecnico di Milano, Milano, Italy, 2018. [Google Scholar]
- Aresta, M.; Dibenedetto, A.; Angelini, A. Catalysis for the Valorization of Exhaust Carbon: From CO2 to Chemicals, Materials, and Fuels. Technological Use of CO2. Chem. Rev. 2014, 114, 1709–1742. [Google Scholar] [CrossRef]
- Huang, C.-H.; Tan, C.-S. A Review: CO2 Utilization. Aerosol Air Qual. Res. 2014, 14, 480–499. [Google Scholar] [CrossRef]
- Alper, E.; Yuksel Orhan, O. CO2 utilization: Developments in conversion processes. Petroleum 2017, 3, 109–126. [Google Scholar] [CrossRef]
- Olah, G.A.; Mathew, T.; Goeppert, A.; Surya Prakash, G.K. Difference and Significance of Regenerative Versus Renewable Carbon Fuels and Products. Top. Catal. 2018, 61, 522–529. [Google Scholar] [CrossRef]
- Armstrong, K.; Styring, P. Assessing the Potential of Utilization and Storage Strategies for Post-Combustion CO2 Emissions Reduction. Front. Energy Res. 2015, 3, 8. [Google Scholar] [CrossRef]
- Hunt, A.J.; Sin, E.H.K.; Marriott, R.; Clark, J.H. Generation, Capture, and Utilization of Industrial Carbon Dioxide. ChemSusChem 2010, 3, 306–322. [Google Scholar] [CrossRef]
- Wang, B.; Li, Y.; Wu, N.; Lan, C.Q. CO2 bio-mitigation using microalgae. Appl. Microbiol. Biotechnol. 2008, 79, 707–718. [Google Scholar] [CrossRef]
- Nagatoshi, Y.; Fujita, Y. Accelerating Soybean Breeding in a CO2-Supplemented Growth Chamber. Plant Cell Physiol. 2018, 60, 77–84. [Google Scholar] [CrossRef]
- Thorne, R.J.; Sundseth, K.; Bouman, E.; Czarnowska, L.; Mathisen, A.; Skagestad, R.; Stanek, W.; Pacyna, J.M.; Pacyna, E.G. Technical and environmental viability of a European CO2 EOR system. Int. J. Greenh. Gas Control 2020, 92, 102857. [Google Scholar] [CrossRef]
- Melzer, L.S. CO2 Transport—Building on the current framework to meet the demands of widely deployed, commercial scale CCS systems. In Proceedings of the 6th annual Conference on Carbon Capture and Sequestration, Pittsburgh, PA, USA, 7–10 May 2007. [Google Scholar]
- Tarun, C.B.; Croiset, E.; Douglas, P.L.; Gupta, M.; Chowdhury, M.H.M. Techno-economic study of CO2 capture from natural gas based hydrogen plants. Int. J. Greenh. Gas Control 2007, 1, 55–61. [Google Scholar] [CrossRef]
- Reddy, S.; Vyas, S. Recovery of Carbon Dioxide and Hydrogen from PSA Tail Gas. Energy Procedia 2009, 1, 149–154. [Google Scholar] [CrossRef]
- Shi, W.; Yang, H.; Shen, Y.; Fu, Q.; Zhang, D.; Fu, B. Two-stage PSA/VSA to produce H2 with CO2 capture via steam methane reforming (SMR). Int. J. Hydrogen Energy 2018, 43, 19057–19074. [Google Scholar] [CrossRef]
- Chen, Y.; Ahn, H. Feasibility Study of Vacuum Pressure Swing Adsorption for CO2 Capture From an SMR Hydrogen Plant: Comparison Between Synthesis Gas Capture and Tail Gas Capture. Front. Chem. Eng. 2021, 3, 742963. [Google Scholar] [CrossRef]
- Shahid, M.Z.; Kim, J.-K. Design and economic evaluation of a novel amine-based CO2 capture process for SMR-based hydrogen production plants. J. Clean Prod. 2023, 402, 136704. [Google Scholar] [CrossRef]
- United Nation. The Paris Agreement. Available online: http://unfccc.int/paris_agreement/items/9485.php (accessed on 15 April 2024).
- Aroonwilas, A.; Veawab, A. Characterization and Comparison of the CO2 Absorption Performance into Single and Blended Alkanolamines in a Packed Column. Ind. Eng. Chem. Res. 2004, 43, 2228–2237. [Google Scholar] [CrossRef]
- Khan, S.N.; Hailegiorgis, S.M.; Man, Z.; Shariff, A.M.; Garg, S. Thermophysical properties of concentrated aqueous solution of N-methyldiethanolamine (MDEA), piperazine (PZ), and ionic liquids hybrid solvent for CO2 capture. J. Mol. Liq. 2017, 229 (Suppl. C), 221–229. [Google Scholar] [CrossRef]
- Rochelle, G.T. Thermal degradation of amines for CO2 capture. Curr. Opin. Chem. Eng. 2012, 1, 183–190. [Google Scholar] [CrossRef]
- Lepaumier, H.; Picq, D.; Carrette, P.-L. New Amines for CO2 Capture. I. Mechanisms of Amine Degradation in the Presence of CO2. Ind. Eng. Chem. Res. 2009, 48, 9061–9067. [Google Scholar] [CrossRef]
- Oyenekan, B.A.; Rochelle, G.T. Energy Performance of Stripper Configurations for CO2 Capture by Aqueous Amines. Ind. Eng. Chem. Res. 2005, 45, 2457–2464. [Google Scholar] [CrossRef]
- Kohl, A.L.; Nielsen, R. Gas Purification, 5th ed.; Gulf Publishing Company, Book Division: Houston, TX, USA, 1997. [Google Scholar]
- Rochelle, G.T. Amine Scrubbing for CO2 Capture. Science 2009, 325, 1652–1654. [Google Scholar] [CrossRef] [PubMed]
- Moioli, S.; Spatolisano, E.; Pellegrini, L.A. Techno-Economic Assessment for the Best Flexible Operation of the CO2 Removal Section by Potassium Taurate Solvent in a Coal-Fired Power Plant. Energies 2024, 17, 1736. [Google Scholar] [CrossRef]
- Chalmers, H.; Lucquiaud, M.; Gibbins, J.; Leach, M. Flexible Operation of Coal Fired Power Plants with Postcombustion Capture of Carbon Dioxide. J. Environ. Eng.-ASCE 2009, 135, 449–458. [Google Scholar] [CrossRef]
- Lucquiaud, M.; Fernandez, E.S.; Chalmers, H.; Mac Dowell, N.; Gibbins, J. Enhanced operating flexibility and optimised off-design operation of coal plants with post-combustion capture. Energy Procedia 2014, 63, 7494–7507. [Google Scholar] [CrossRef]
- Moioli, S.; Pellegrini, L.A. Operating the CO2 absorption plant in a post-combustion unit in flexible mode for cost reduction. Chem. Eng. Res. Des. 2019, 147, 604–614. [Google Scholar] [CrossRef]
- Moioli, S.; Pellegrini, L.A. Optimal Operation of a CO2 Absorption Plant in a Post-Combustion Unit for Cost Reduction. Chem. Eng. Trans. 2018, 69, 151–156. [Google Scholar]
- Errey, O.; Chalmers, H.; Lucquiaud, M.; Gibbins, J. Valuing Responsive Operation of Post-combustion CCS Power Plants in Low Carbon Electricity Markets. Energy Procedia 2014, 63, 7471–7484. [Google Scholar] [CrossRef]
- Moioli, S.; Pellegrini, L.A. Fixed and Capture Level Reduction operating modes for carbon dioxide removal in a Natural Gas Combined Cycle power plant. J. Clean Prod. 2020, 254, 120016. [Google Scholar] [CrossRef]
- Pellegrini, L.A.; De Guido, G.; Moioli, S. Design of the CO2 removal section for PSA tail gas treatment in hydrogen production plant. Front. Energy Res. 2020, 8, 77. [Google Scholar] [CrossRef]
- Cohen, S.M.; Rochelle, G.T.; Webber, M.E. Optimal operation of flexible post-combustion CO2 capture in response to volatile electricity prices. Energy Procedia 2011, 4, 2604–2611. [Google Scholar] [CrossRef]
- Alie, C.; Backham, L.; Croiset, E.; Douglas, P.L. Simulation of CO2 capture using MEA scrubbing: A flowsheet decomposition method. Energy Convers. Manag. 2005, 46, 475–487. [Google Scholar] [CrossRef]
- Davison, J. Performance and costs of power plants with capture and storage of CO2. Energy 2007, 32, 1163–1176. [Google Scholar] [CrossRef]
- Husebye, J.; Anantharaman, R.; Fleten, S.-E. Techno-economic assessment of flexible solvent regeneration & storage for base load coal-fired power generation with post combustion CO2 capture. Energy Procedia 2011, 4, 2612–2619. [Google Scholar]
- Meissner, R.E.; Wagner, U. Low-energy process recovers CO2. Technol 1983, 7, 55–58. [Google Scholar]
- Moioli, S.; Pellegrini, L.A.; Picutti, B.; Vergani, P. Improved rate-based modeling of H2S and CO2 removal by MDEA scrubbing. Ind. Eng. Chem. Res. 2013, 52, 2056–2065. [Google Scholar] [CrossRef]
- Pellegrini, L.A.; Langé, S.; Moioli, S.; Picutti, B.; Vergani, P. Influence of Gas Impurities on Thermodynamics of Amine Solutions. 1. Aromatics. Ind. Eng. Chem. Res. 2013, 52, 2018–2024. [Google Scholar] [CrossRef]
- Langé, S.; Pellegrini, L.A.; Moioli, S.; Picutti, B.; Vergani, P. Influence of Gas Impurities on Thermodynamics of Amine Solutions. 2. Mercaptans. Ind. Eng. Chem. Res. 2013, 52, 2025–2031. [Google Scholar] [CrossRef]
- Turton, R.; Bailie, R.C.; Whiting, W.B.; Shaeiwitz, J.A.; Bhattacharyya, D. Analysys, Synthesis & Design of Chemical Processes, 4th ed.; Prentice Hall International Series in the Physical and Chemical Engineering Sciences; Prentice Hall: Upper Saddle River, NJ, USA, 2012. [Google Scholar]
- Peters, M.S.; Timmerhaus, K.D. Plant Design and Economics for Chemical Engineers; McGraw Hill Book Co.: Singapore, 1991. [Google Scholar]
- Moioli, S.; De Guido, G.; Pellegrini, L.A.; Fasola, E.; Riva, E.R.; Alberti, D.; Carrara, A. Techno-economic assessment of the CO2 value chain with CCUS applied to a waste-to-energy Italian plant. Chem. Eng. Sci. 2024, 287, 119717. [Google Scholar] [CrossRef]
- Dasgupta, S.; Nanoti, A.; Gupta, P.; Jena, D.; Goswami, A.N.; Garg, M.O. Carbon Di-Oxide Removal with Mesoporous Adsorbents in a Single Column Pressure Swing Adsorber. Sep. Sci. Technol. 2009, 44, 3973–3983. [Google Scholar] [CrossRef]
Figure 1.
Flowsheet of the simulation of Scheme (a).

Figure 2.
Flowsheet of the simulation of Scheme (b).

Figure 3.
Flowsheet of the simulation of Scheme (c).
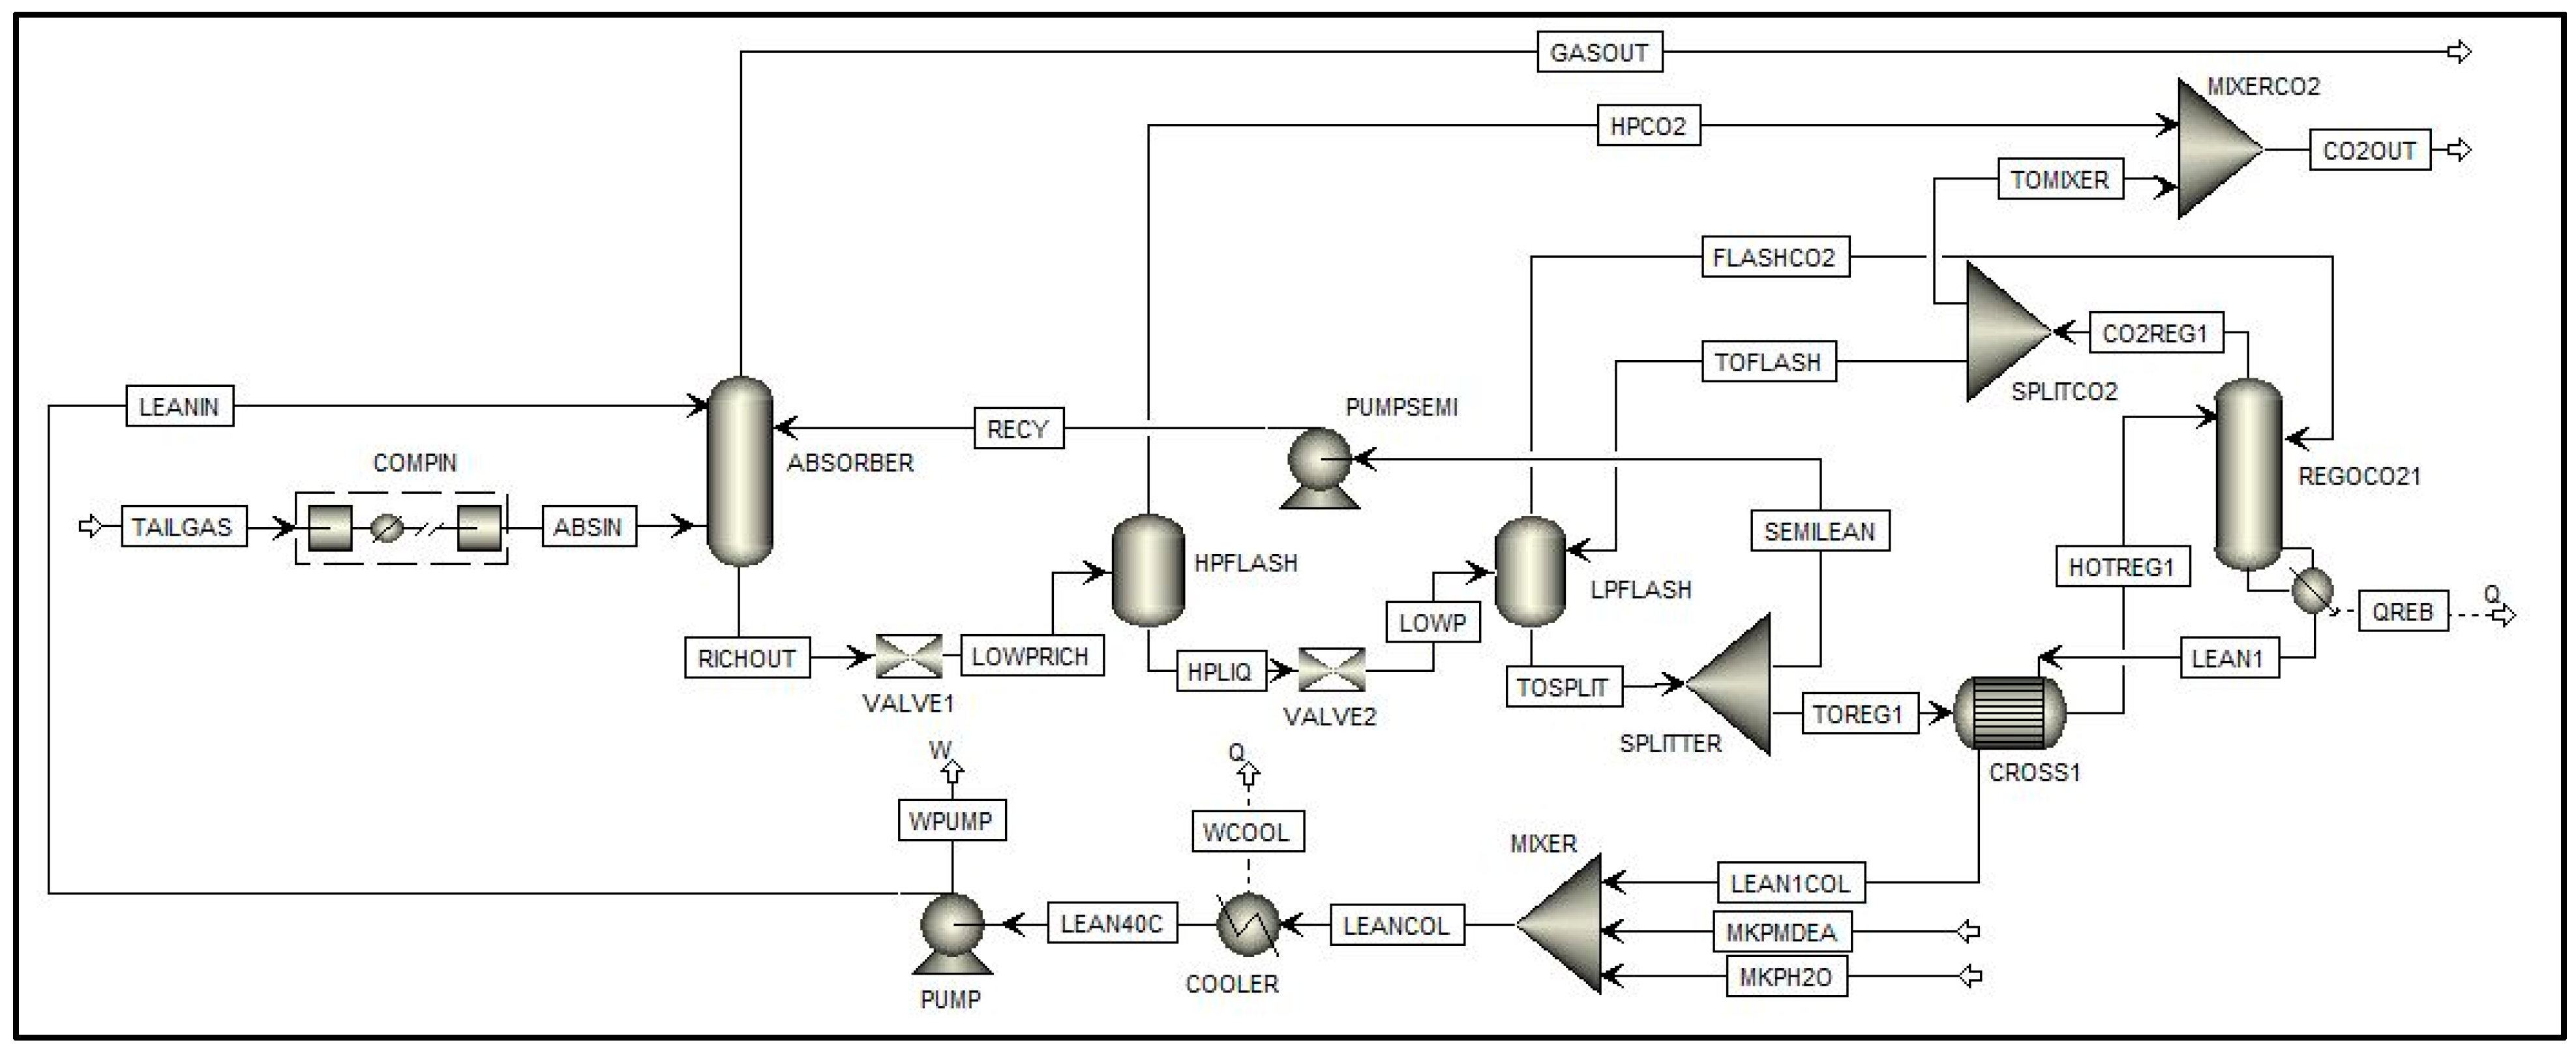
Figure 4.
Trends of the total massive flow of the vapor stream released at the flash stage (FLASHCO2) and of the liquid stream leaving the flash stage (TOREG1) as function of the flash operating pressure for Scheme (a).
Figure 4.
Trends of the total massive flow of the vapor stream released at the flash stage (FLASHCO2) and of the liquid stream leaving the flash stage (TOREG1) as function of the flash operating pressure for Scheme (a).

Figure 5.
(a) Molar fraction; (b) mass flow rates of CO2, H2 and H2O (right axis) in the vapor stream released at the flash stage (FLASHCO2) and (c) CO2 apparent molar fraction in the liquid stream exiting from the flash unit (TOREG1) as function of the flash operating pressure for Scheme (a).
Figure 5.
(a) Molar fraction; (b) mass flow rates of CO2, H2 and H2O (right axis) in the vapor stream released at the flash stage (FLASHCO2) and (c) CO2 apparent molar fraction in the liquid stream exiting from the flash unit (TOREG1) as function of the flash operating pressure for Scheme (a).

Figure 6.
Specific reboiler duty as function of the flash operating pressure for Scheme (a).
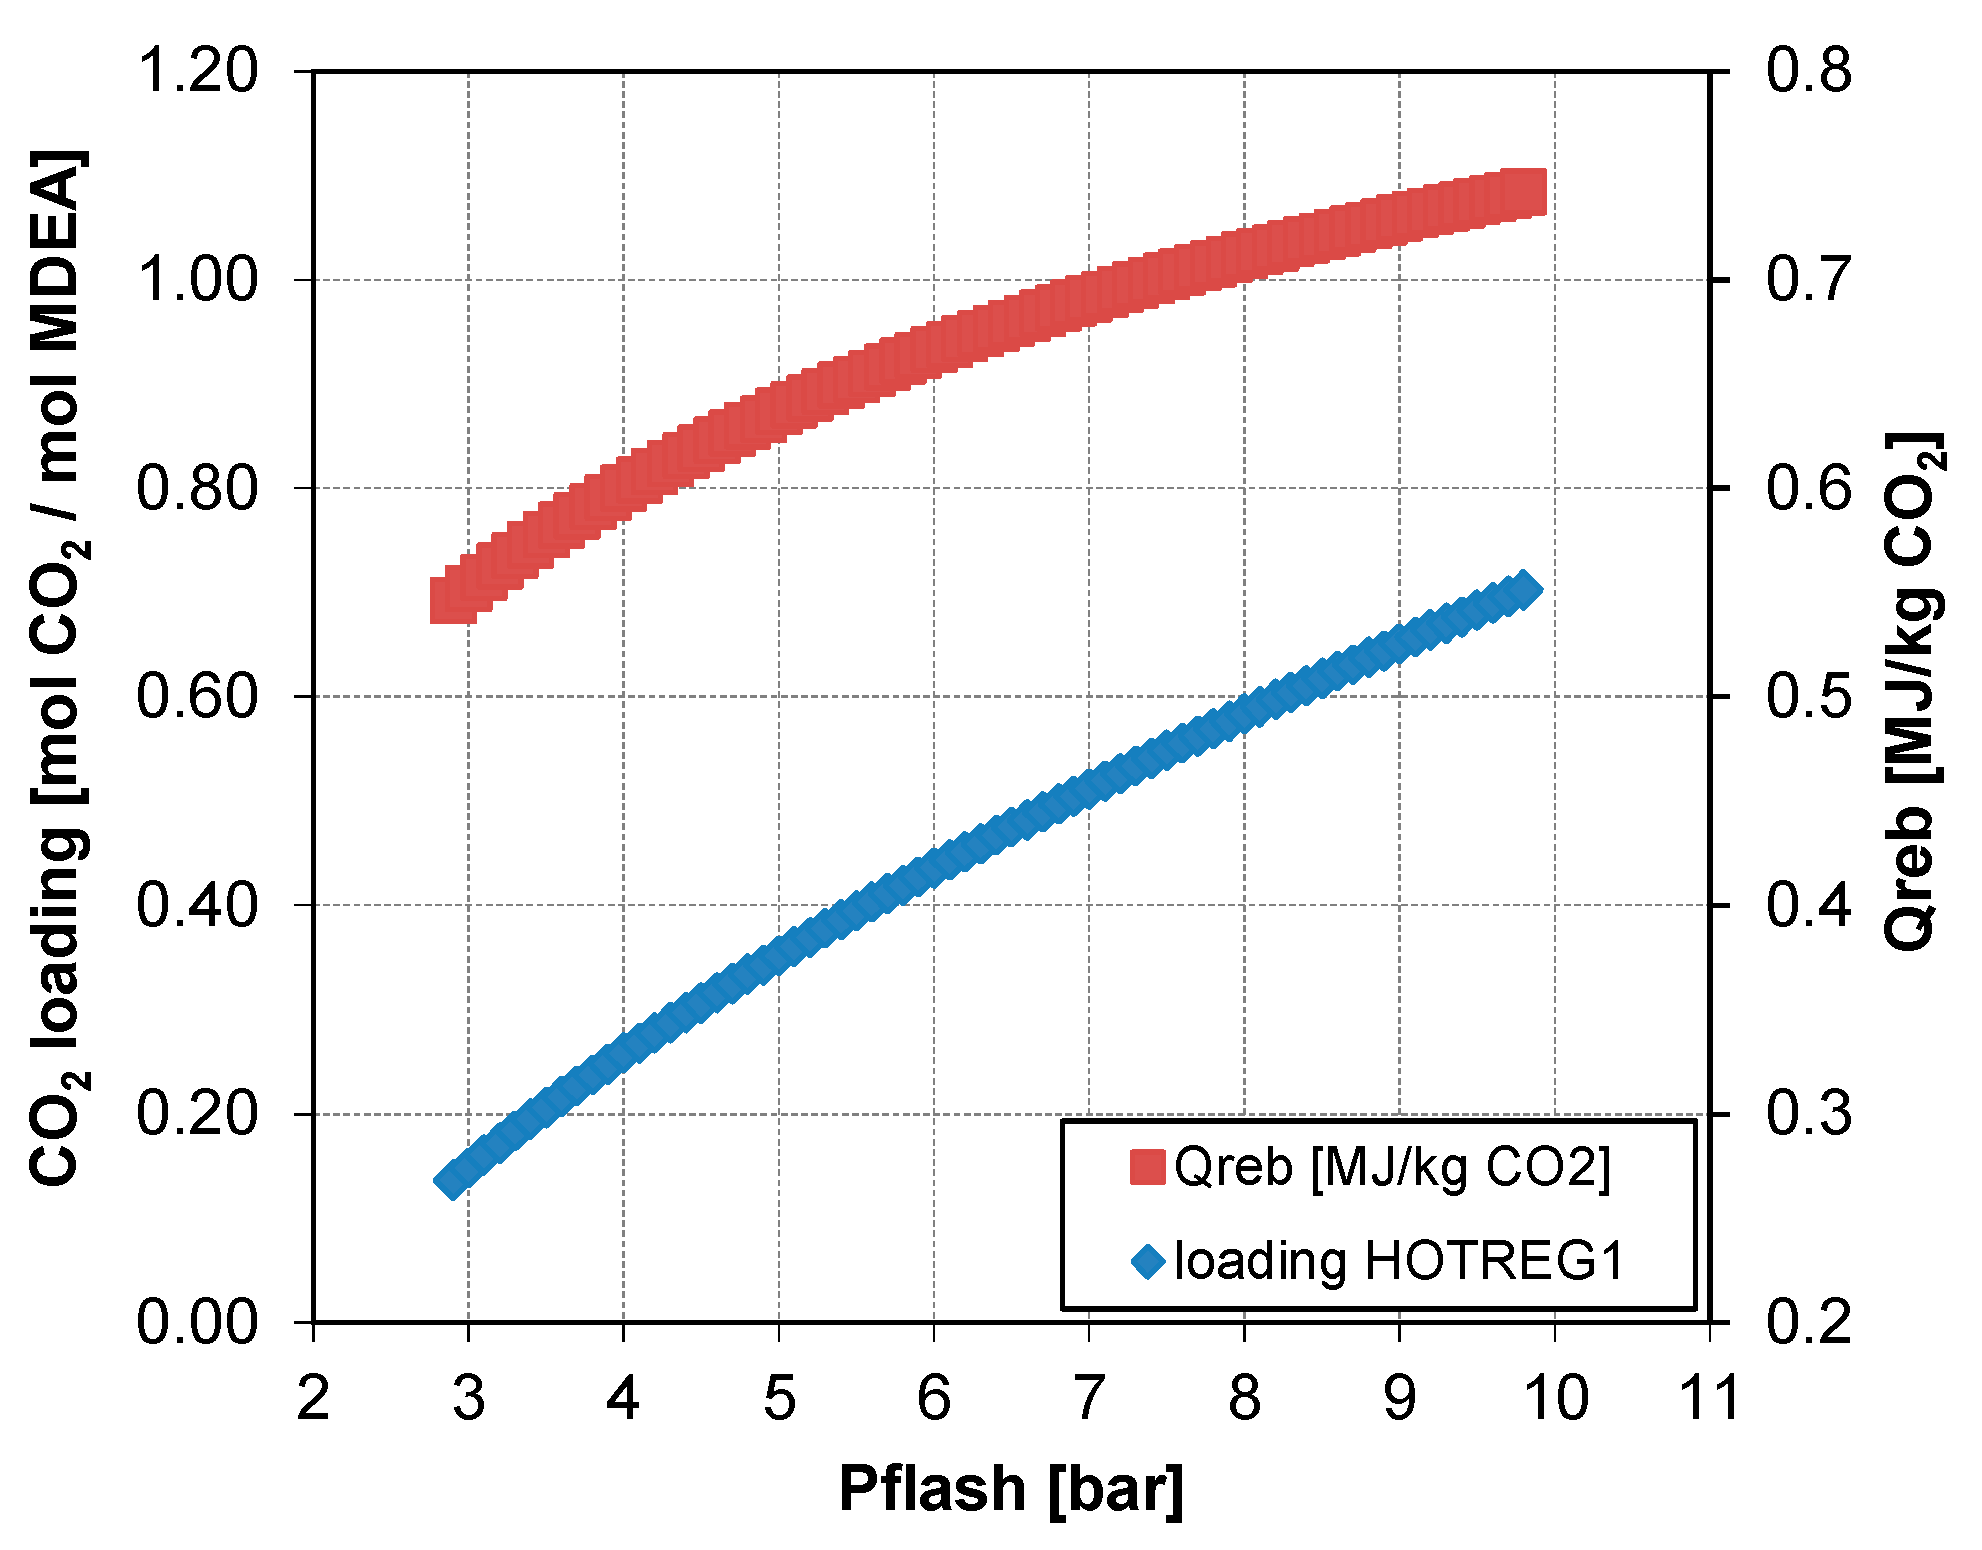
Figure 7.
Specific reboiler duty as function of the feed stage for Scheme (c) operating with a split percentage of the regeneration vapor stream recycled to the LP flash stage of 0% and with a split fraction of the semi-lean solvent equal to 10%.
Figure 7.
Specific reboiler duty as function of the feed stage for Scheme (c) operating with a split percentage of the regeneration vapor stream recycled to the LP flash stage of 0% and with a split fraction of the semi-lean solvent equal to 10%.
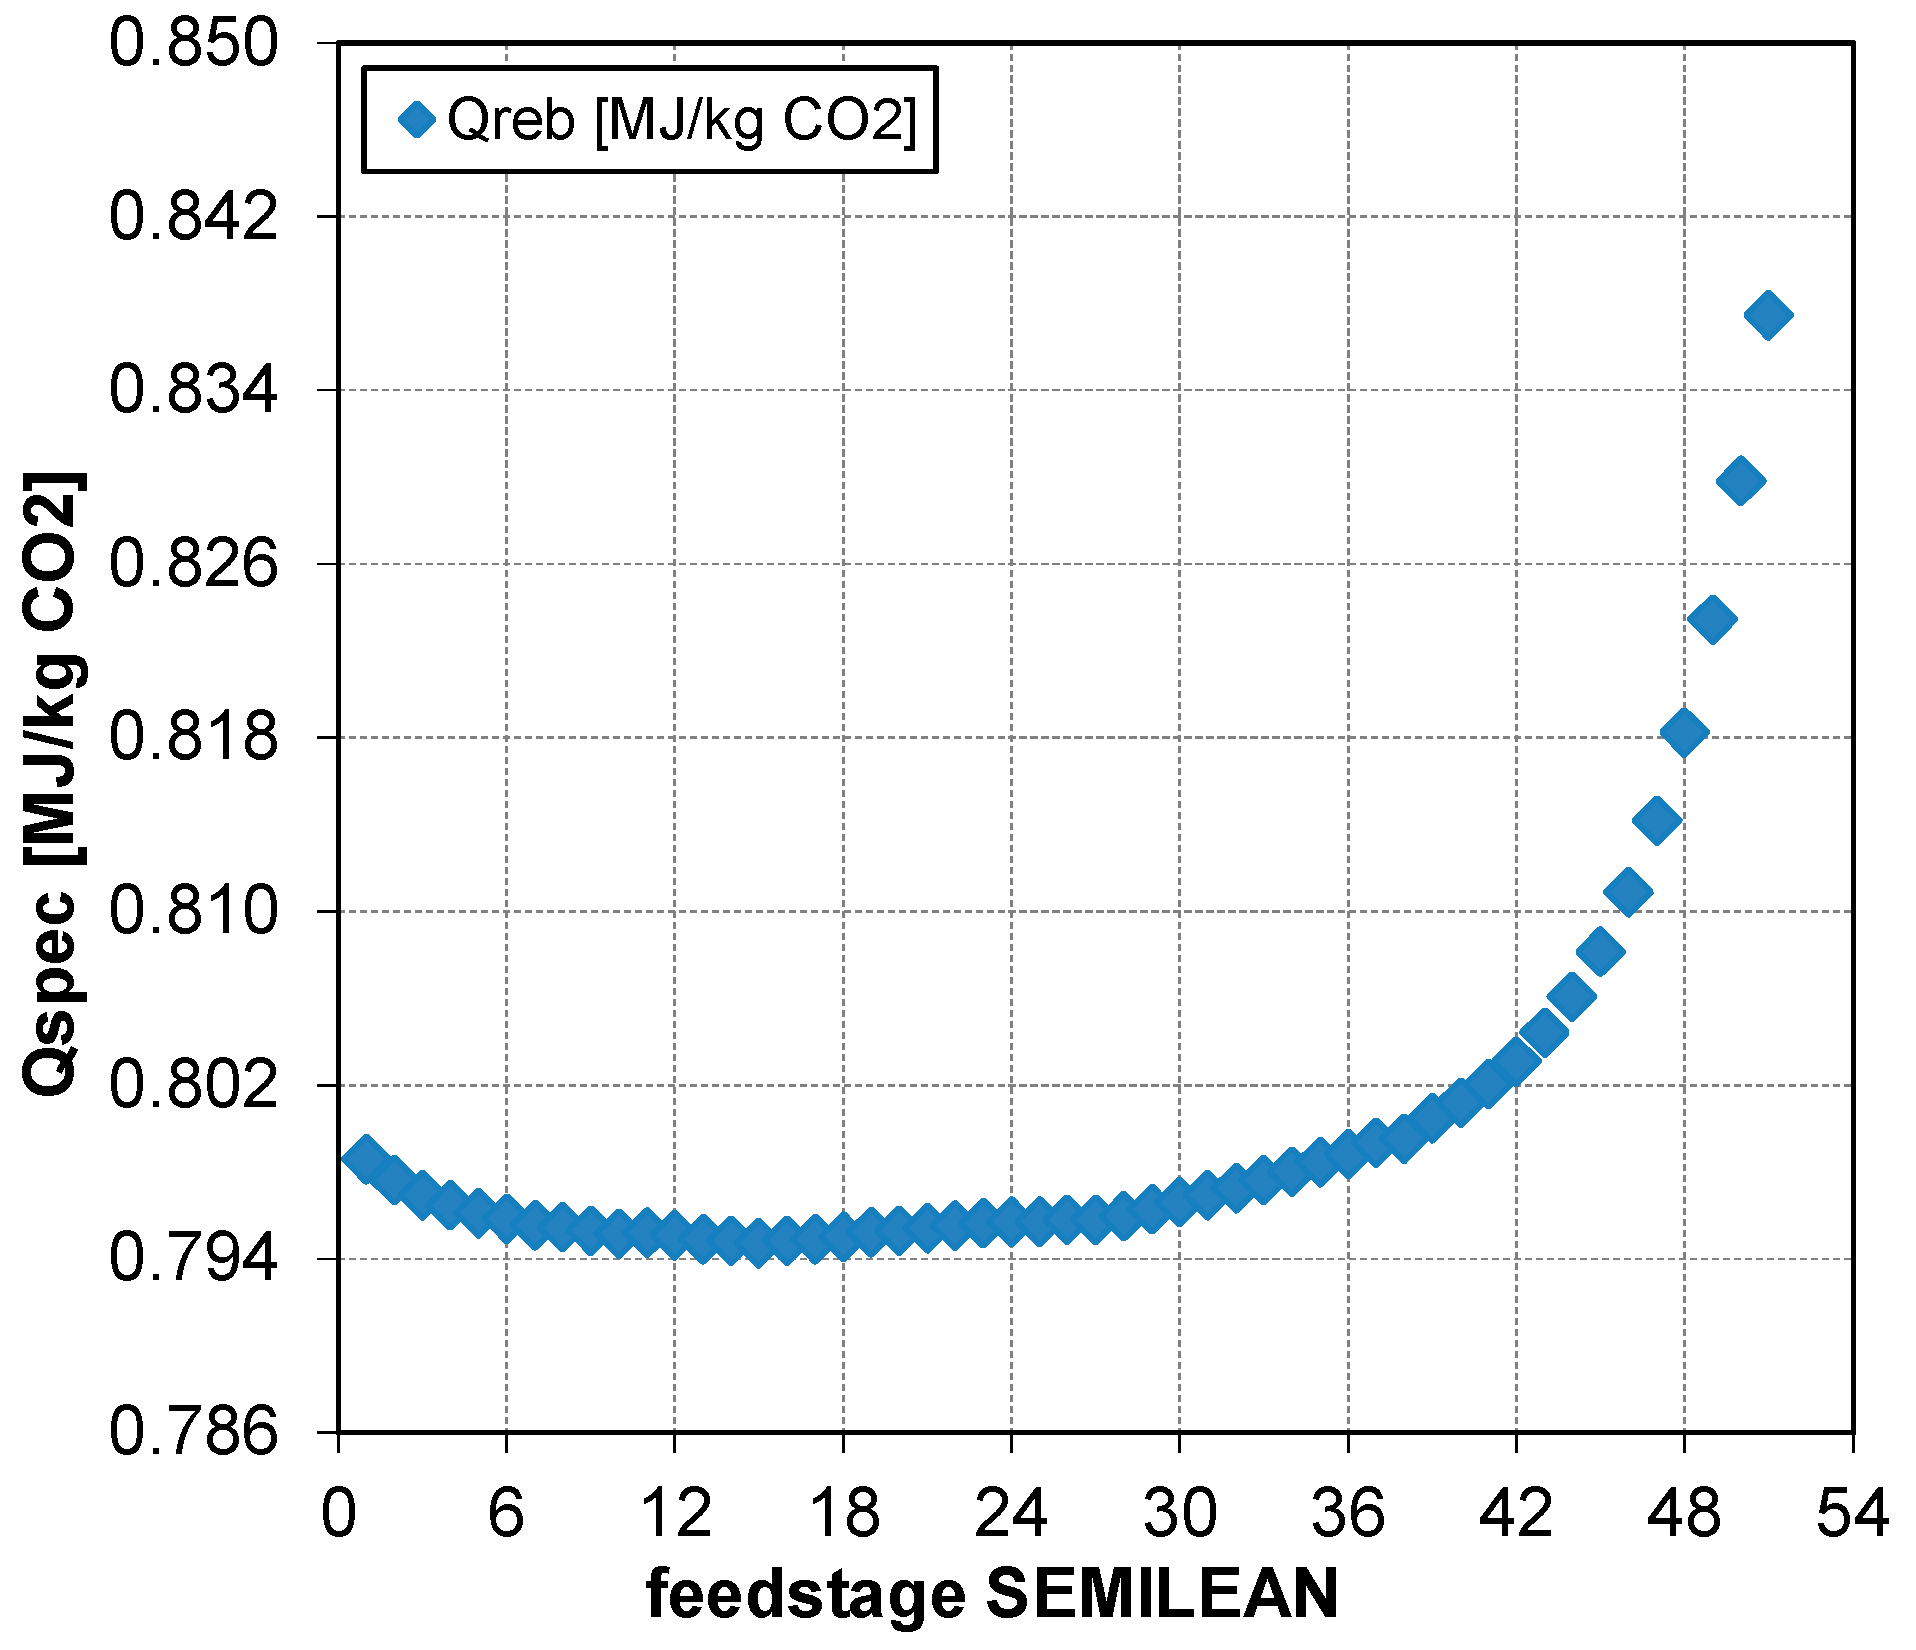
Figure 8.
Temperature of the main process streams upstream the regeneration section as function of the split fraction for Scheme (c) operating with a split percentage of the regeneration vapor stream recycled to the LP flash stage of 0%.
Figure 8.
Temperature of the main process streams upstream the regeneration section as function of the split fraction for Scheme (c) operating with a split percentage of the regeneration vapor stream recycled to the LP flash stage of 0%.

Figure 9.
Specific reboiler duty as function of the split fraction for Scheme (c) operating with a split percentage of the regeneration vapor stream recycled to the LP flash stage of 0%.
Figure 9.
Specific reboiler duty as function of the split fraction for Scheme (c) operating with a split percentage of the regeneration vapor stream recycled to the LP flash stage of 0%.
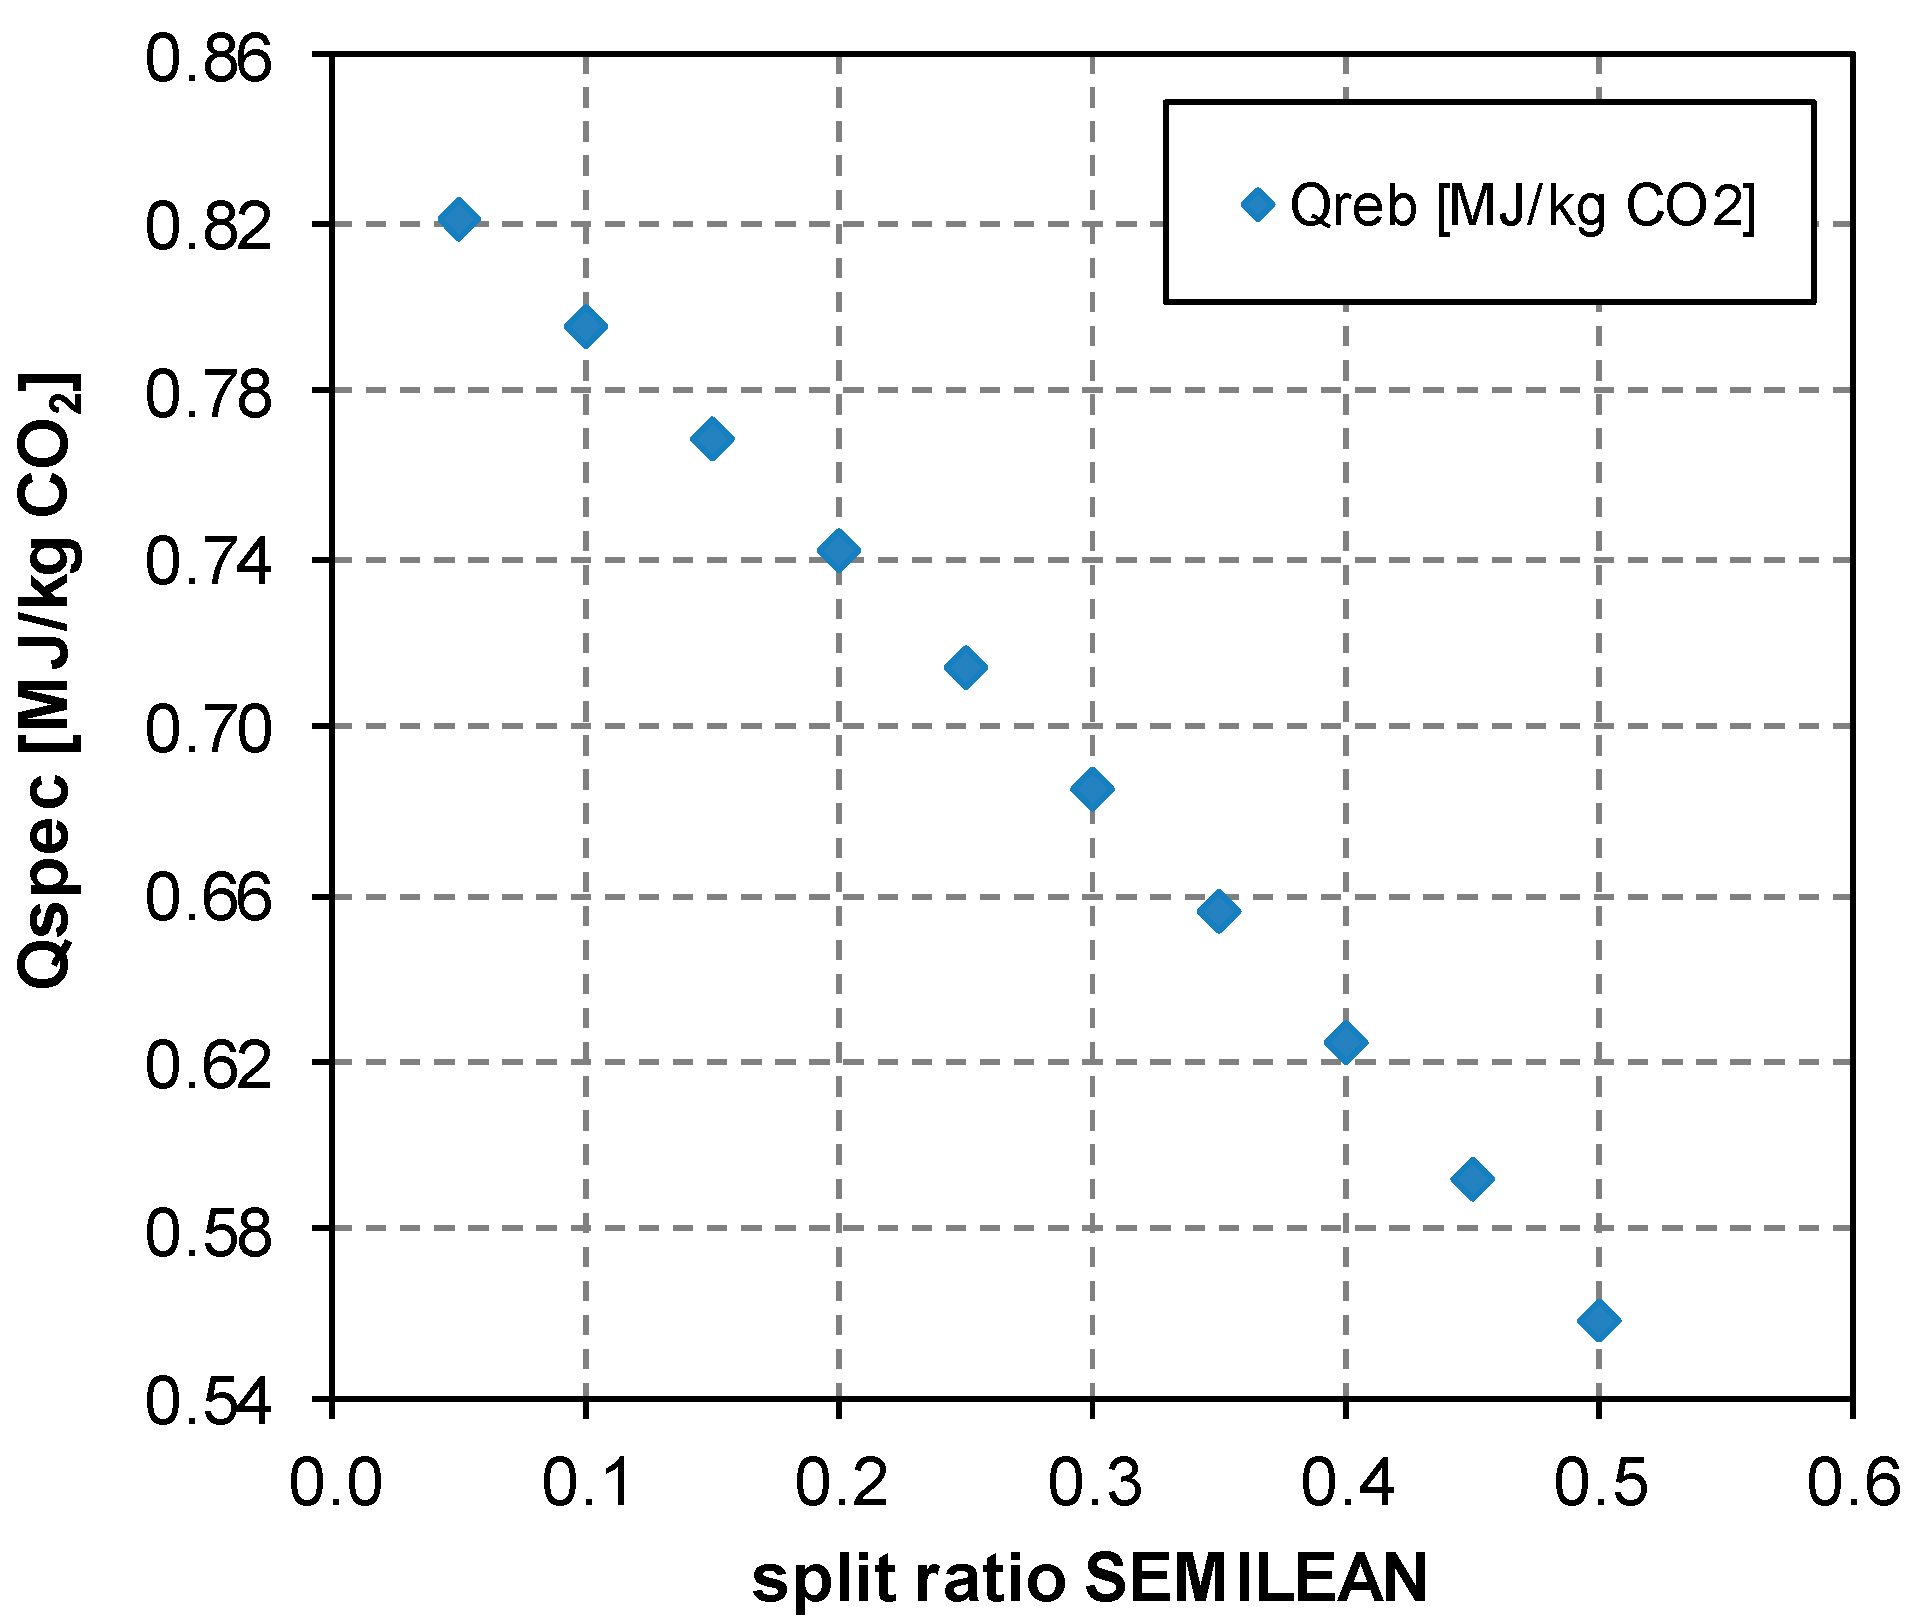
Figure 10.
Comparison of Scheme (a) and of Scheme (c) in terms of (a) capital and utility costs and (b) steam, electricity and cooling water costs.
Figure 10.
Comparison of Scheme (a) and of Scheme (c) in terms of (a) capital and utility costs and (b) steam, electricity and cooling water costs.


Table 1.
Characteristics of the PSA tail gas stream entering the absorber after compression.
| Parameter | Unit | Value |
|---|---|---|
| Temperature | [°C] | 28 |
| Pressure | [MPa] | 1.1 |
| Molar Flow | [kmol/h] | 2106.3 |
| Mass Flow | [kg/h] | 60,658 |
| Composition | ||
| CO2 | [mol/mol] | 0.5095 |
| CO | [mol/mol] | 0.1454 |
| Hydrogen | [mol/mol] | 0.2369 |
| Nitrogen | [mol/mol] | 0.0062 |
| Methane | [mol/mol] | 0.0945 |
| H2O | [mol/mol] | 0.0076 |
Table 2.
Main differences among the considered configurations.
| Scheme (a) | Scheme (a) | Scheme (c) | ||
|---|---|---|---|---|
| Variable | Unit | Scheme (a)—4.5 bar | Optimized Scheme (a)—3 bar | Optimized Scheme (c) |
| Number of flash units | [-] | 1 | 1 | 2 |
| Pressure of the first flash | [MPa] | 0.45 | 0.3 | 0.98 |
| Pressure of the second flash | [MPa] | NA | NA | 0.3 |
| % split TOSPLIT to SEMILEAN | [%] | NA | NA | 50 |
| Regenerator type | [-] | distillation | distillation | reboiled stripping |
| Condenser duty | [MW] | 0.67 | 0.67 | NA |
| Reboiler duty | [MW] | 10.63 | 8.94 | 7.07 |
| COOLER duty | [MW] | 22.2 | 22.2 | 12.3 |
| Cooler of CO2-rich stream duty | [MW] | NA | NA | 1.62 |
| PUMP duty | [MWel] | 0.126 | 0.126 | 0.085 |
| PUMPSEMI duty | [MWel] | NA | NA | 0.091 |
Disclaimer/Publisher’s Note: The statements, opinions and data contained in all publications are solely those of the individual author(s) and contributor(s) and not of MDPI and/or the editor(s). MDPI and/or the editor(s) disclaim responsibility for any injury to people or property resulting from any ideas, methods, instructions or products referred to in the content. |
© 2024 by the authors. Licensee MDPI, Basel, Switzerland. This article is an open access article distributed under the terms and conditions of the Creative Commons Attribution (CC BY) license (https://creativecommons.org/licenses/by/4.0/).
Share and Cite
MDPI and ACS Style
Moioli, S.; Pellegrini, L.A. CO2 Removal in Hydrogen Production Plants. Energies 2024, 17, 3089. https://doi.org/10.3390/en17133089
AMA Style
Moioli S, Pellegrini LA. CO2 Removal in Hydrogen Production Plants. Energies. 2024; 17(13):3089. https://doi.org/10.3390/en17133089
Chicago/Turabian StyleMoioli, Stefania, and Laura A. Pellegrini. 2024. "CO2 Removal in Hydrogen Production Plants" Energies 17, no. 13: 3089. https://doi.org/10.3390/en17133089
Note that from the first issue of 2016, this journal uses article numbers instead of page numbers. See further details here.