Abstract
A 2D walkway vertical seismic profile (VSP) survey was conducted using a distributed acoustic sensing (DAS) system in southwest Utah, which is part of an enhanced geothermal system (EGS) project. The VSP was undertaken to obtain detailed structural information for a better understanding of the area’s subsurface geology and associated fracture development. By combining a 3D composite velocity model from previous studies and considering the complex geological structure beneath this region, we processed the data to create P-P depth image. We also modified the interval Q calculation using a moving window over the gauge-length corrected DAS record to generate the velocity profile and the comparable interval attenuation curve. The correlated P-P images from two DAS records successfully indicate not only the main contact between shallow unconsolidated sediments and the metamorphic basement rocks at 2650 ft (807.72 m) but also several distinct reflections related to the geological contacts. The refined velocity profiles and the depth images can provide baseline results for further seismic modeling and time-lapse imaging.
1. Introduction
Fiber-optic sensing can play a pivotal role in unconventional resource reservoir characterization and optimization as well as monitoring drilling and fracture stimulation. In particular, it may provide full data coverage along the entire length of the well with the possibility of improved spatial resolution compared to conventional point sensors such as geophones or hydrophones. While conventional geophone data might have a higher signal-to-noise ratio (SNR) than fiber-optic sensor data, this issue can be mitigated by several approaches such as increasing the stacking or increasing the number of fiber cables installed [1]. Distributed acoustic sensing (DAS) is now a widespread technique used for seismic surveys, time-lapse seismic monitoring, and microseismic detection. For unconventional development, the fiber cable is commonly deployed along the horizontal well [2,3,4]. A further promising application is the detection of earthquakes [5,6] using the vertical downhole DAS arrays recording relatively distant events.
A P- and S-wave velocity model generated by the downhole DAS array recording along the vertical well with perforation shots was generated by [7]; in addition, the DAS data were further processed to locate the events and estimate their magnitudes. The ambient noise data recorded by the borehole DAS array during hydraulic stimulation was analyzed by [8] and created the ambient noise RMS profiles, which show the correlations between noise peaks and major faults/interfaces, low-velocity layers, or lithological boundaries to the well logs.
In April 2022, a walkaway VSP (WVSP) survey was conducted after the stimulation, which is part of the Frontier Observatory for Research in Geothermal Energy (FORGE) project, to obtain detailed structural information for a better understanding of the subsurface geology and fracture development. The survey was acquired by various sensors deployed and distributed in four nearby wells, including two 8-level 3C geophone strings, a wireline DAS array, and two DAS arrays installed behind the casing. A southeast-northwest surface shot line was performed using vibroseis sources. DAS measurement is sensitive to the seismic wave’s incident angle of various elastic waves; converted and more complex events are observed in the shot records as the source location moves away from the wellhead.
In this paper, we applied the modified DAS VSP processing workflow to the DAS datasets collected by Silixa iDAS (intelligent Distributed Acoustic Sensor) deployed outside of the casing in separated wells. We first generated the 1D P- and S-wave velocity from the first arrivals and compared them to well logs, calculated the interval Q attenuation profile with gauge-length correction, expanded the 1D velocity profile to 3D velocity volume by compositing with the surface seismic velocity model, and finally imaged the subsurface structure using Kirchhoff migration. The ultimate goal was to provide detailed geophysical information and to image the subsurface structure using the complete set of elastic events recorded by DAS in two vertical wells.
2. Study Area
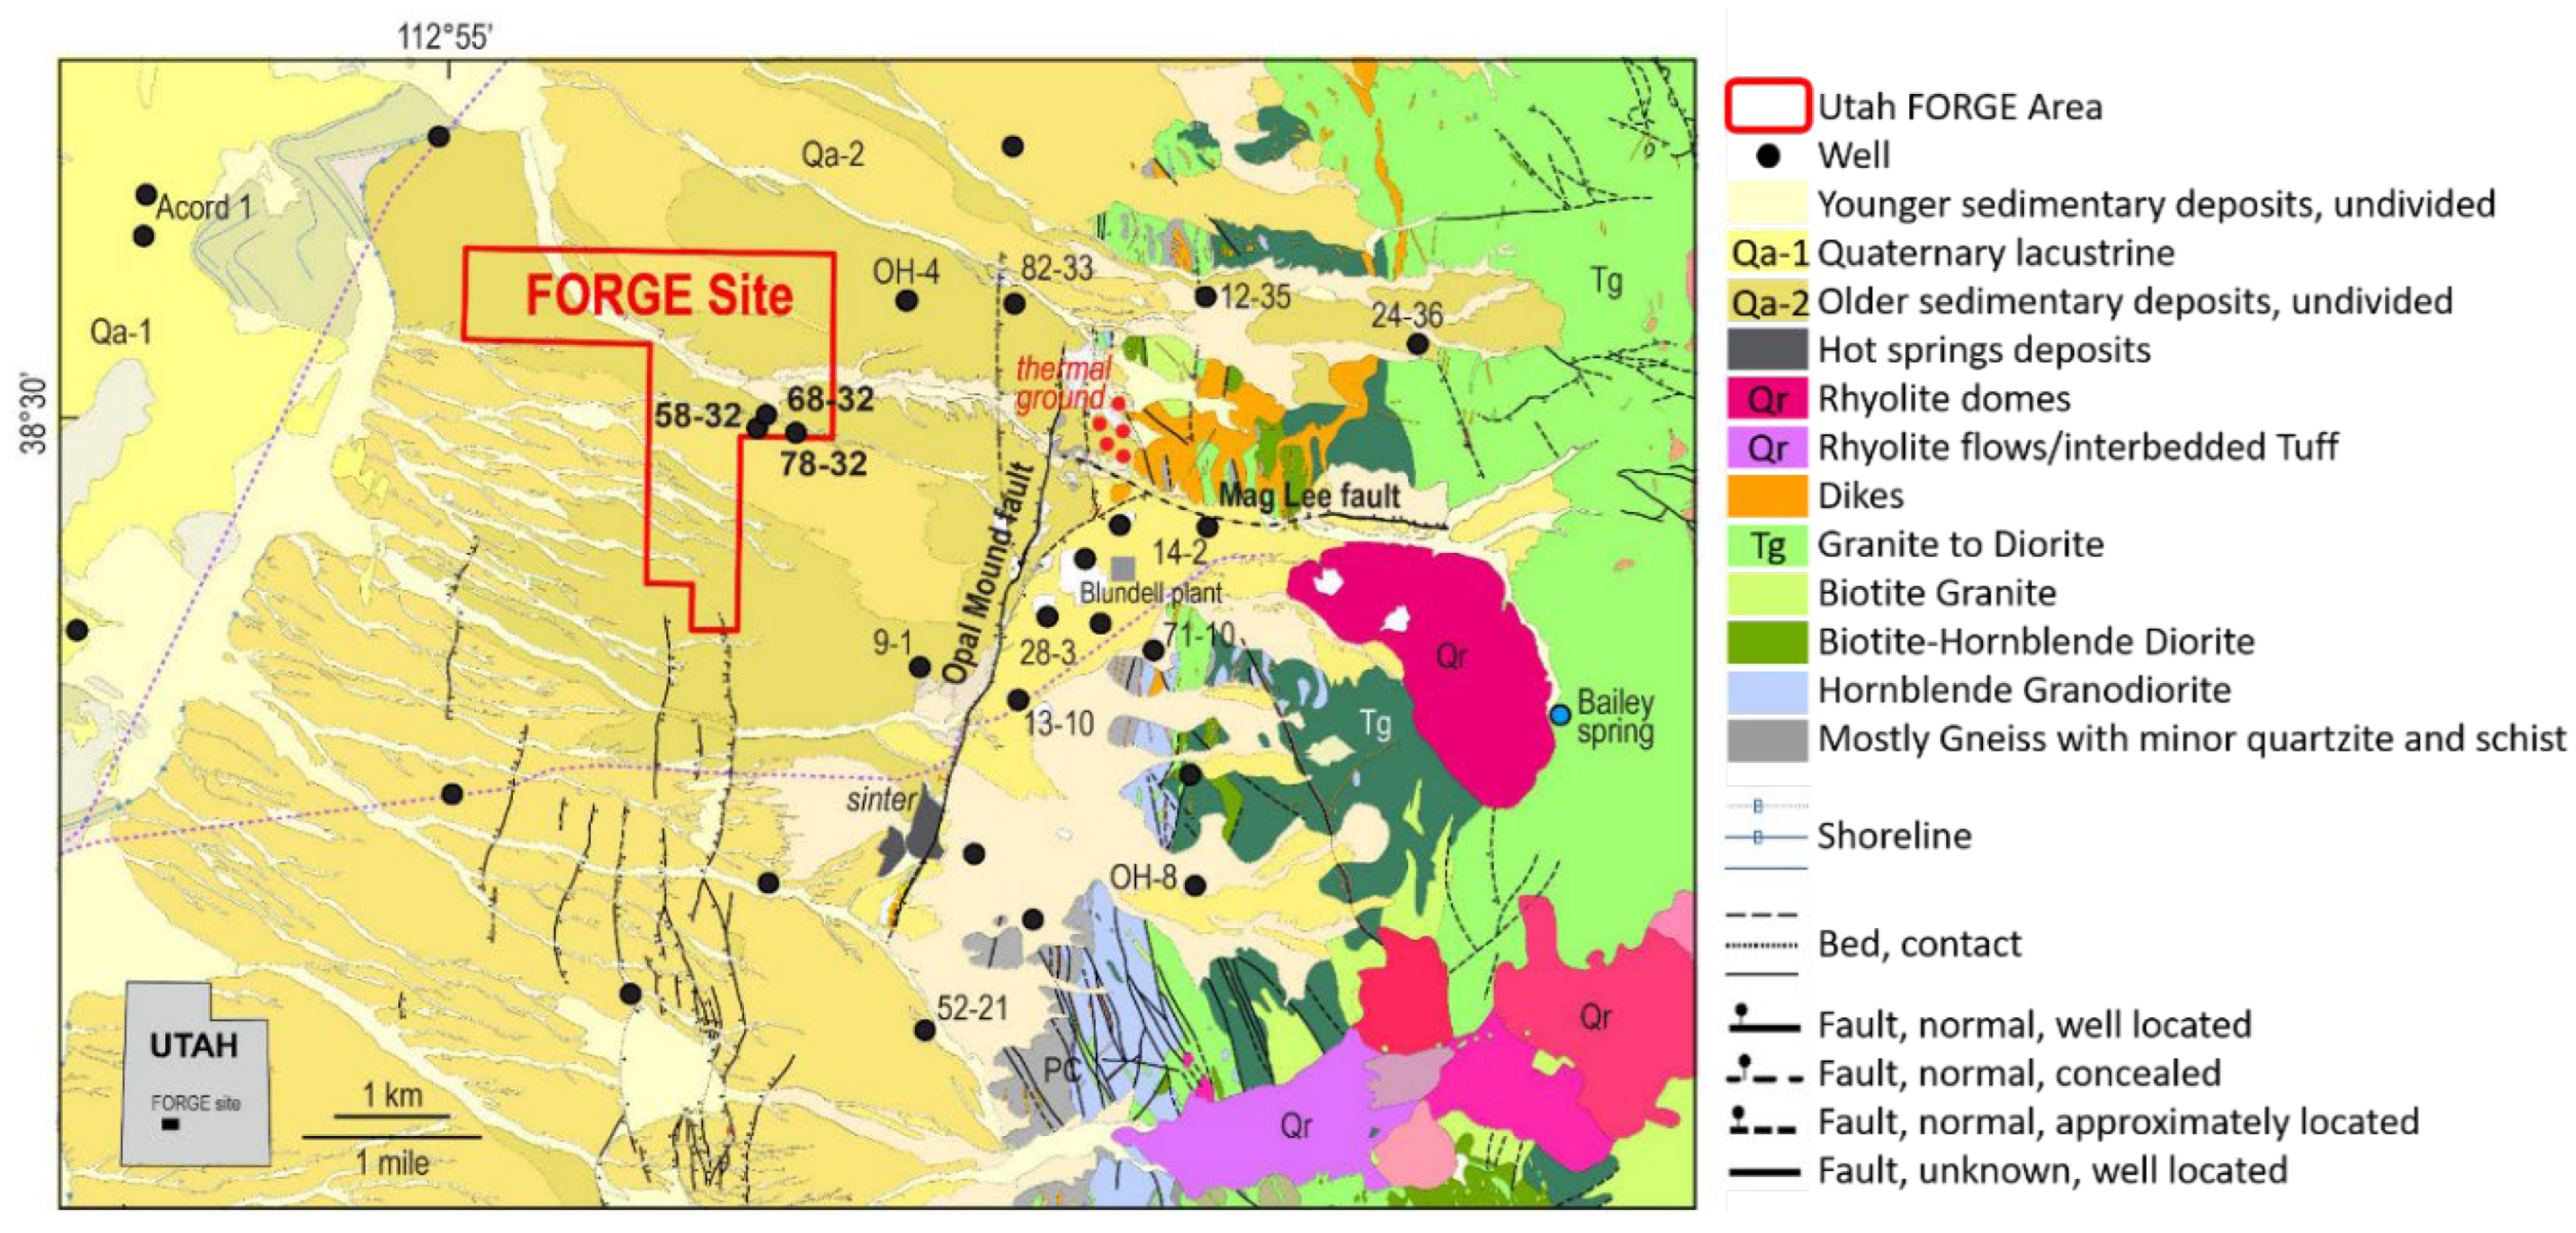
The U.S. Department of Energy (DOE) Geothermal Technologies Office (GTO) supports the Frontier Observatory for Research in Geothermal Energy (FORGE) installation, which is an integrated project aiming for breakthroughs in enhanced geothermal system (EGS) development. It was initiated in 2015 and is managed by the Energy & Geoscience Institute at the University of Utah. Starting in 2018, numerous scientific studies and in situ tests were conducted covering 2 mi2 in southwest Utah (Figure 1), which is 10 miles northeast of Milford and 200 miles southwest of Salt Lake City. The FORGE site is situated within Utah’s Renewable Energy Corridor and close to a wind farm, a solar field, and an early geothermal production field (Blundell at Roosevelt Hot Springs), which was commissioned in 1984 [9,10].
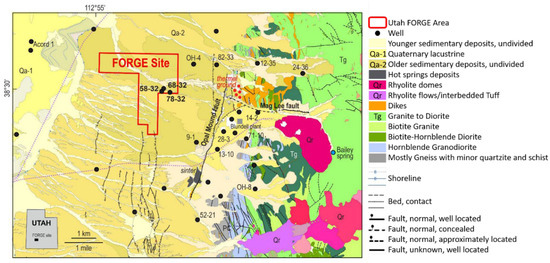
Figure 1.
Utah FORGE geological map (modified from [11]). Abbreviations: Qa-1 = Lake Bonneville silts and sands; Qa-2 = alluvial fan deposits; Qr = Quaternary rhyolite lava and pyroclastic deposits’ Tg = Tertiary granitoid; PC = Preca.
Figure 2 schematically shows the geology of the FORGE site, which is basically composed of two main intervals. The unconformity between the two intervals dips around 20 degrees to the west. The shallow interval of layered alluvial fan deposits (e.g., Qa in Figure 1) consists of gravel to silt-sized sediments overlying the deep interval of crystalline basement mostly composed of plutonic igneous rocks (Tg in Figure 1), which hosts the proposed EGS reservoir; the latter are collectively referred to as granitoid [12,13].
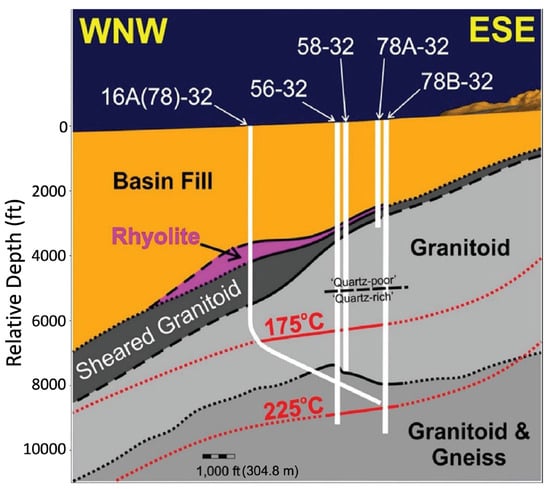
Figure 2.
Cross-section of the Utah FORGE project site (modified from the original figure courtesy of Utah FORGE and Utah Geological Survey).
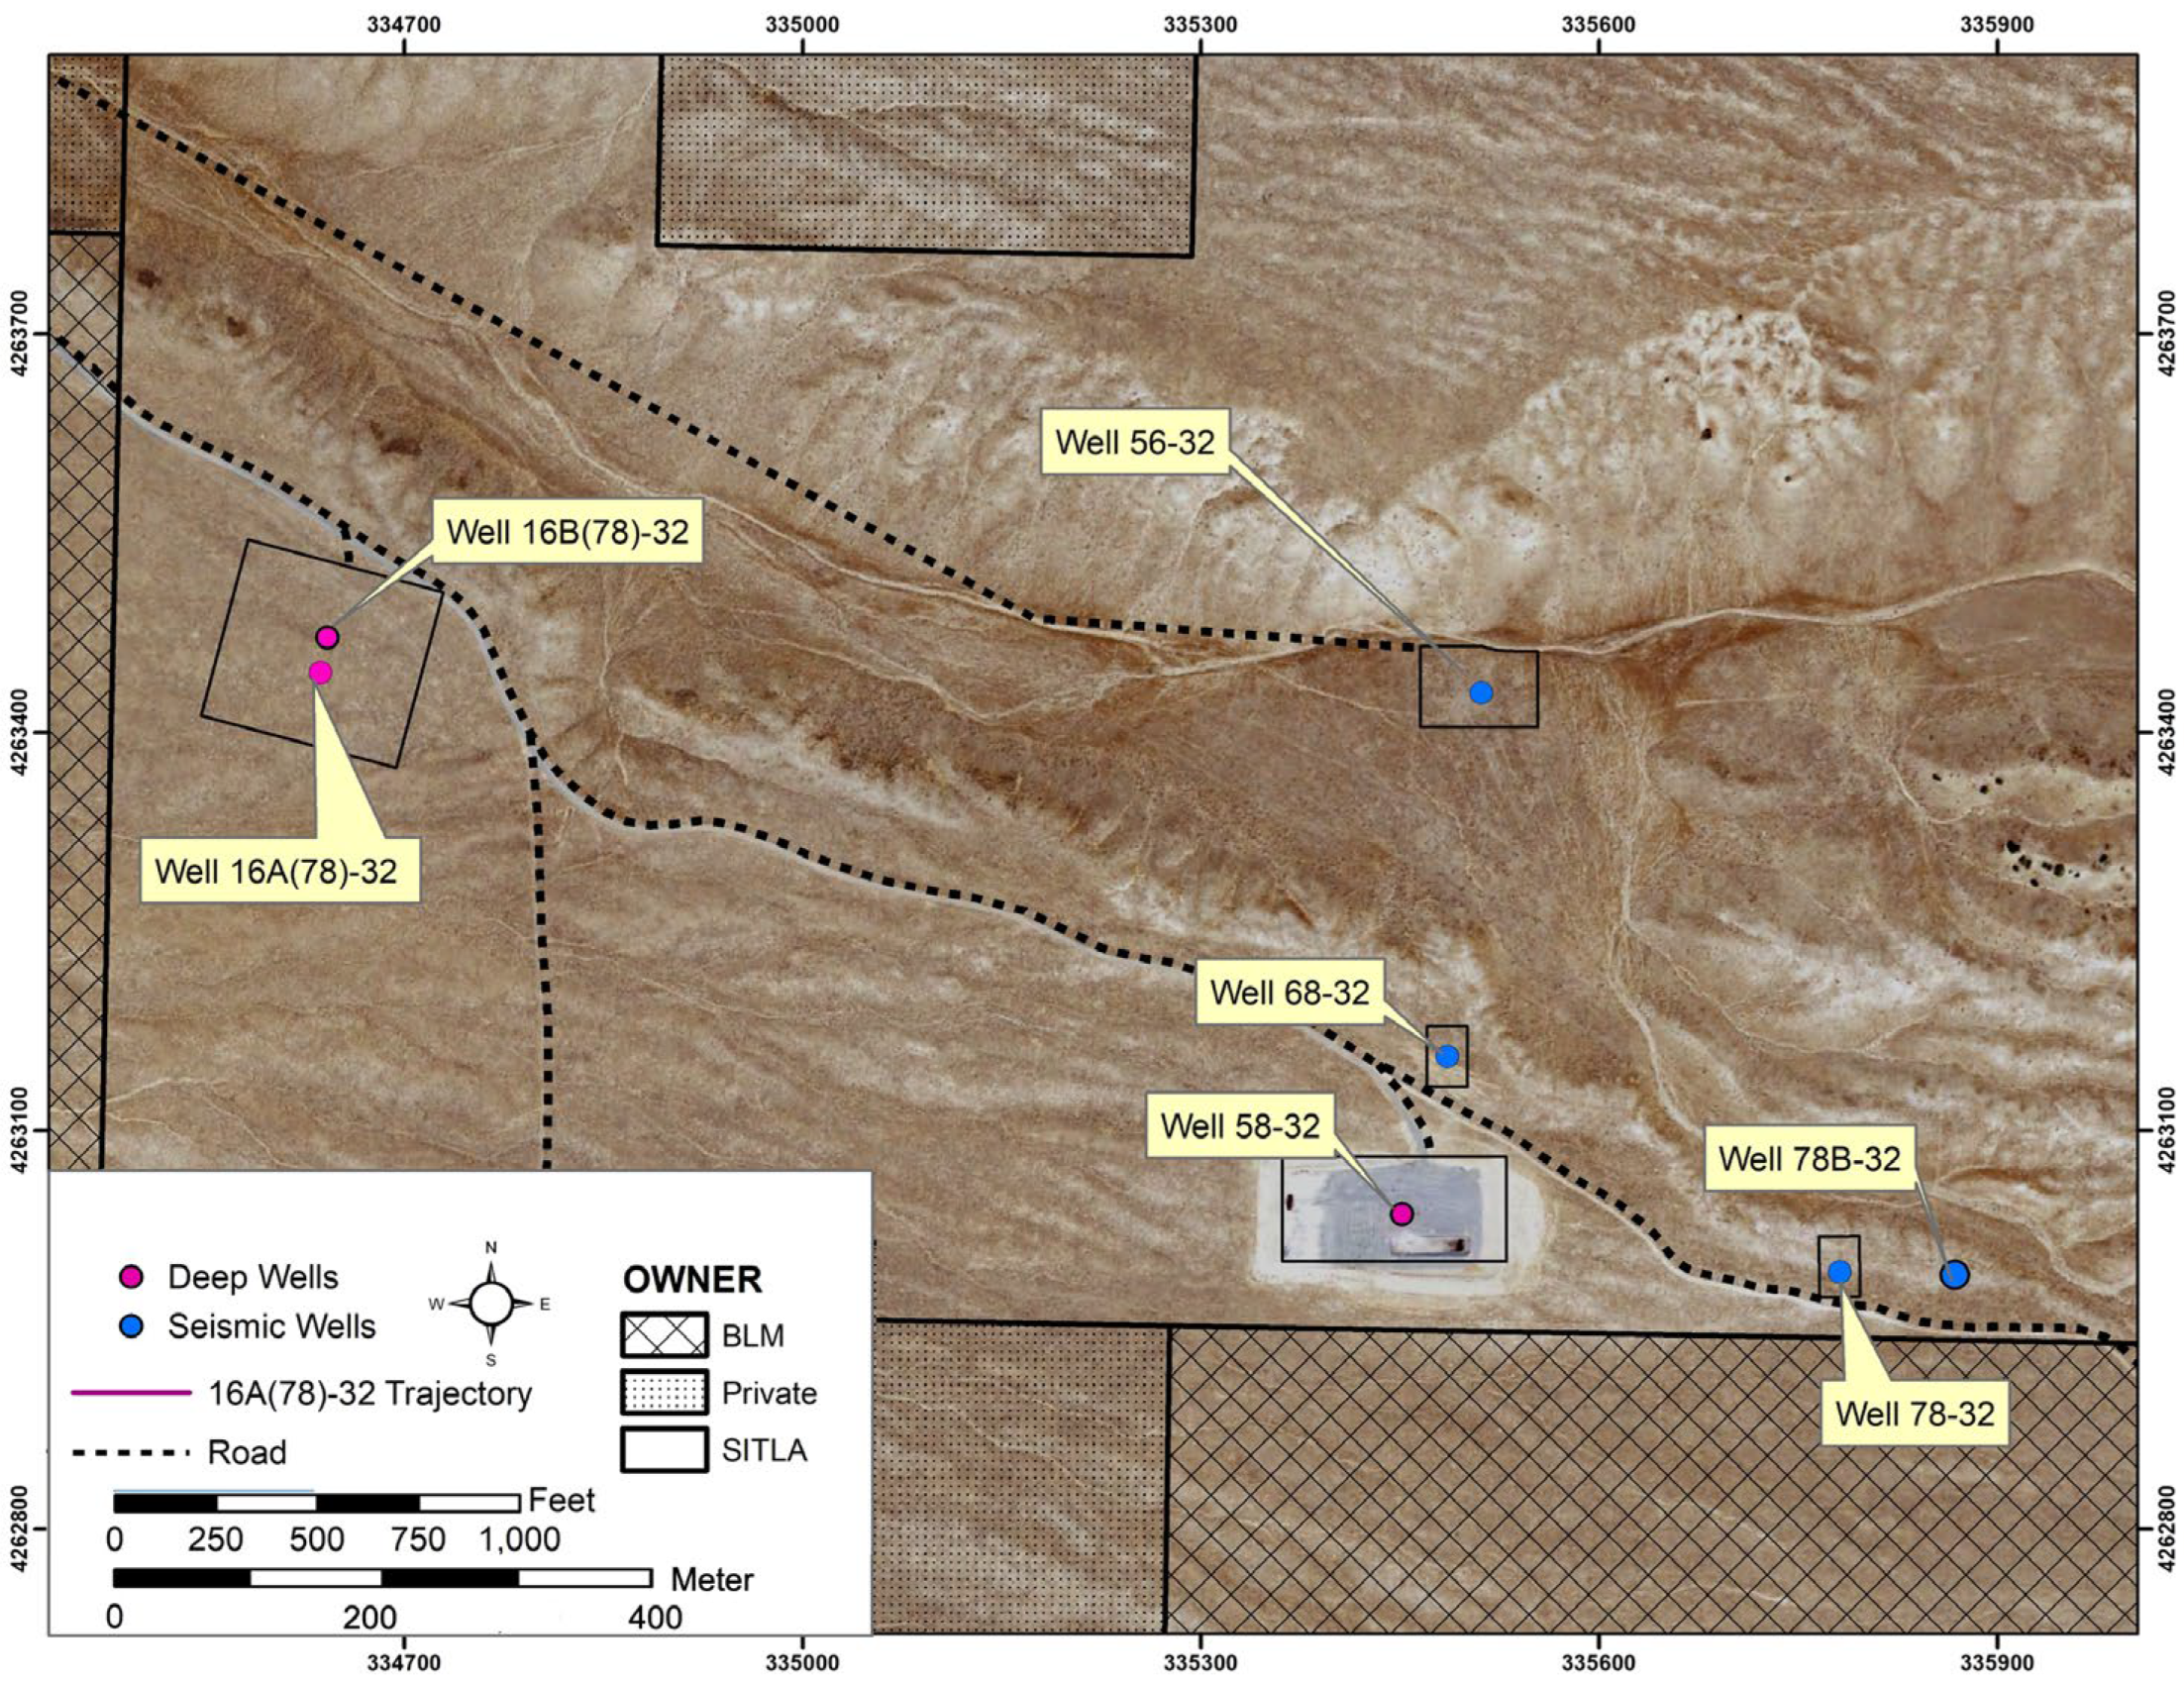
Three geothermal production fields near the FORGE site provide supportive evidence of the potential for geothermal resource development in this region. The first deep pilot well (58-32) was drilled in 2017 to investigate the reservoir conditions for EGS development. Ultimately, six wells have been drilled, including two stimulation wells (58-32 and 16A(78)-32) and four seismic monitoring wells (68-32, 78-32, 56-32, and 78B-32), since the project inception (Figure 3). The top of the basement is around 3176 ft (968.04 m) and 2610 ft (795.53 m) deep at wells 58-32 and 78-32. The top of the EGS reservoir, defined by temperature, was reached at a depth of 6507 ft (1983.33 m) in well 58-32 [10].

Figure 3.
Utah FORGE wells (modified from the original figure courtesy of Utah FORGE and Utah Geological Survey).
3. Data Acquisition
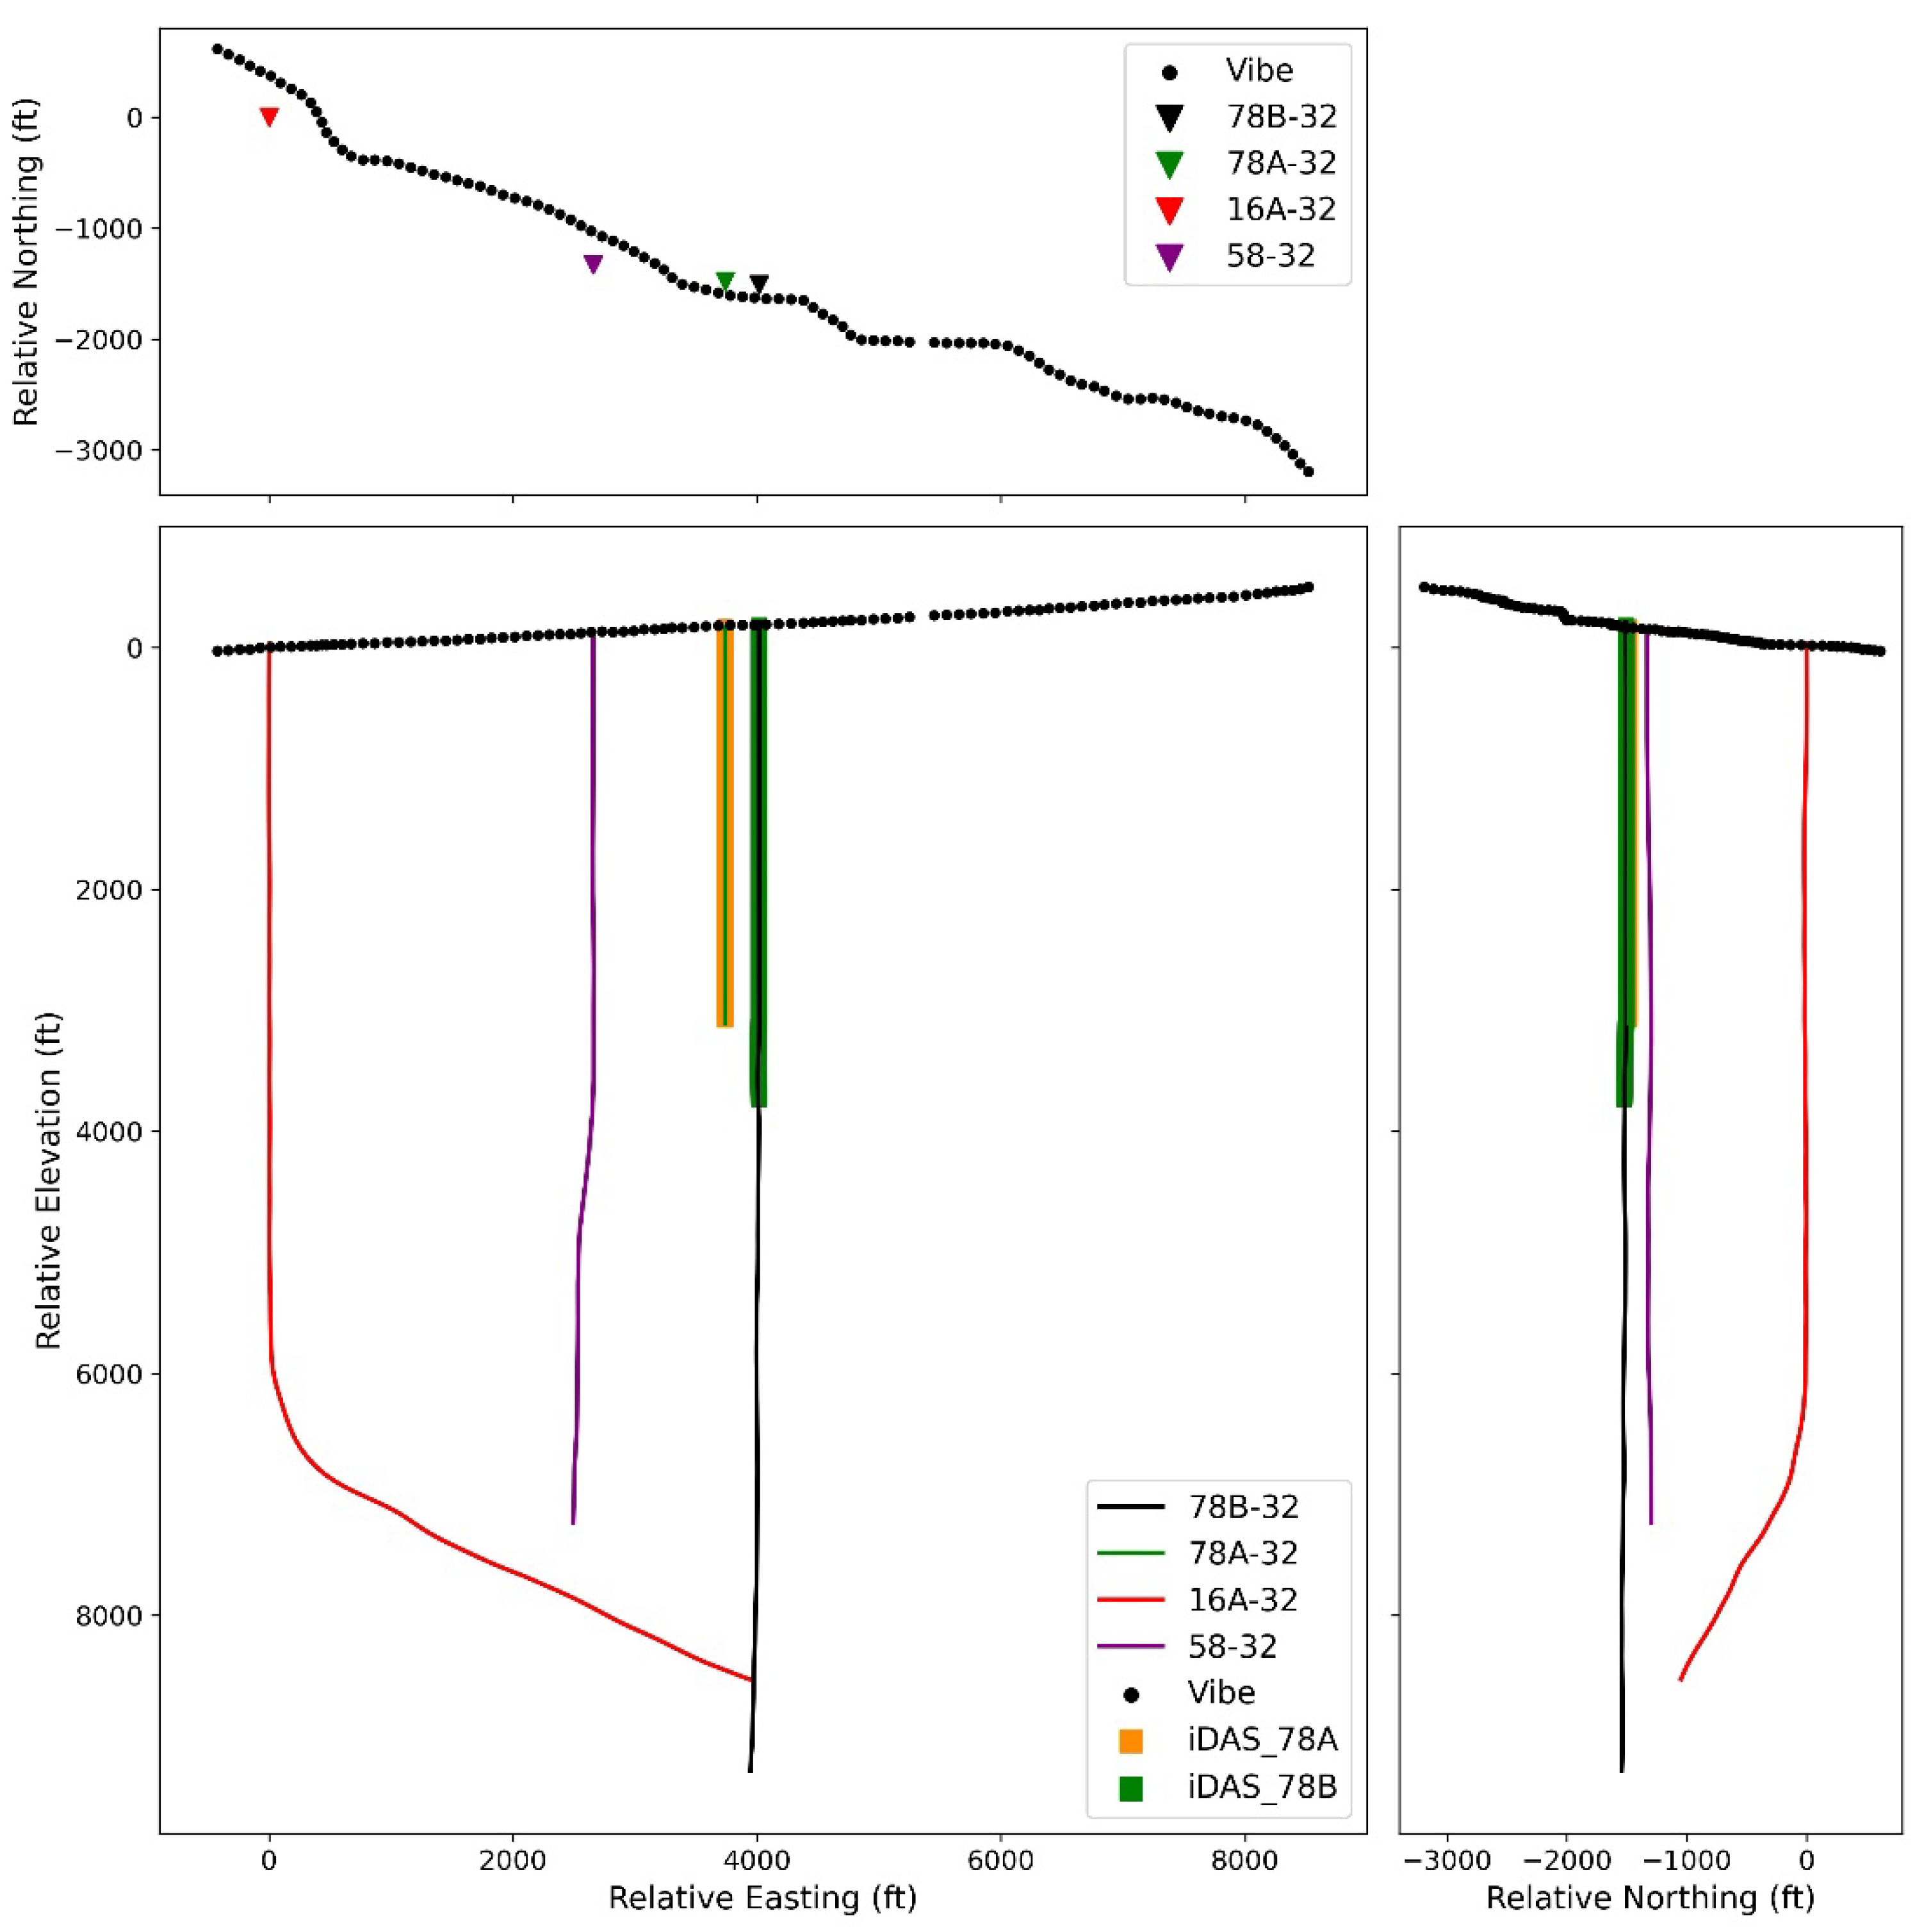
After the stimulation in April 2022, a walkaway VSP survey was conducted to obtain detailed structural information and images of the EGS site. A total of 100 vibrator source points with 98.4 ft (30 m) spacing along the NW–SE direction across the FORGE site was performed, and the data were recorded for 4 s using two DAS systems (Silixa iDAS) strapped outside the casing of wells 78A-32 and 78B-32 (Figure 4). Ultimately, the data were processed with a 10 m (32.8 ft) gauge length, and 971 and 1170 channels were output at 1.02 m (~3.35 ft) intervals from the raw recordings in wells 78A-32 and 78B-32.
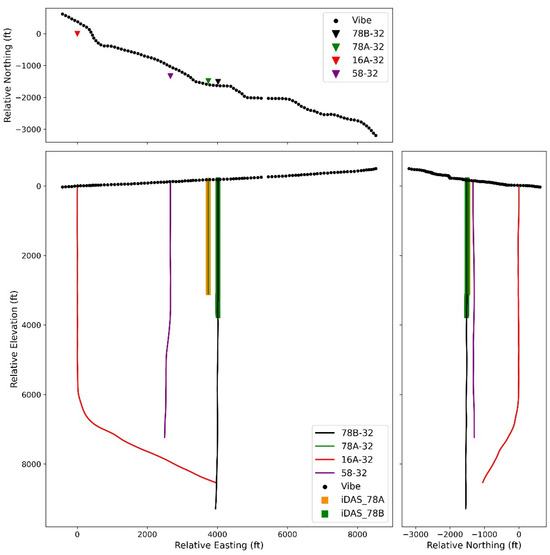
Figure 4.
Diagram of walkaway DAS VSP geometry and wells. The local coordinate with respect to well 16A-32 wellhead.
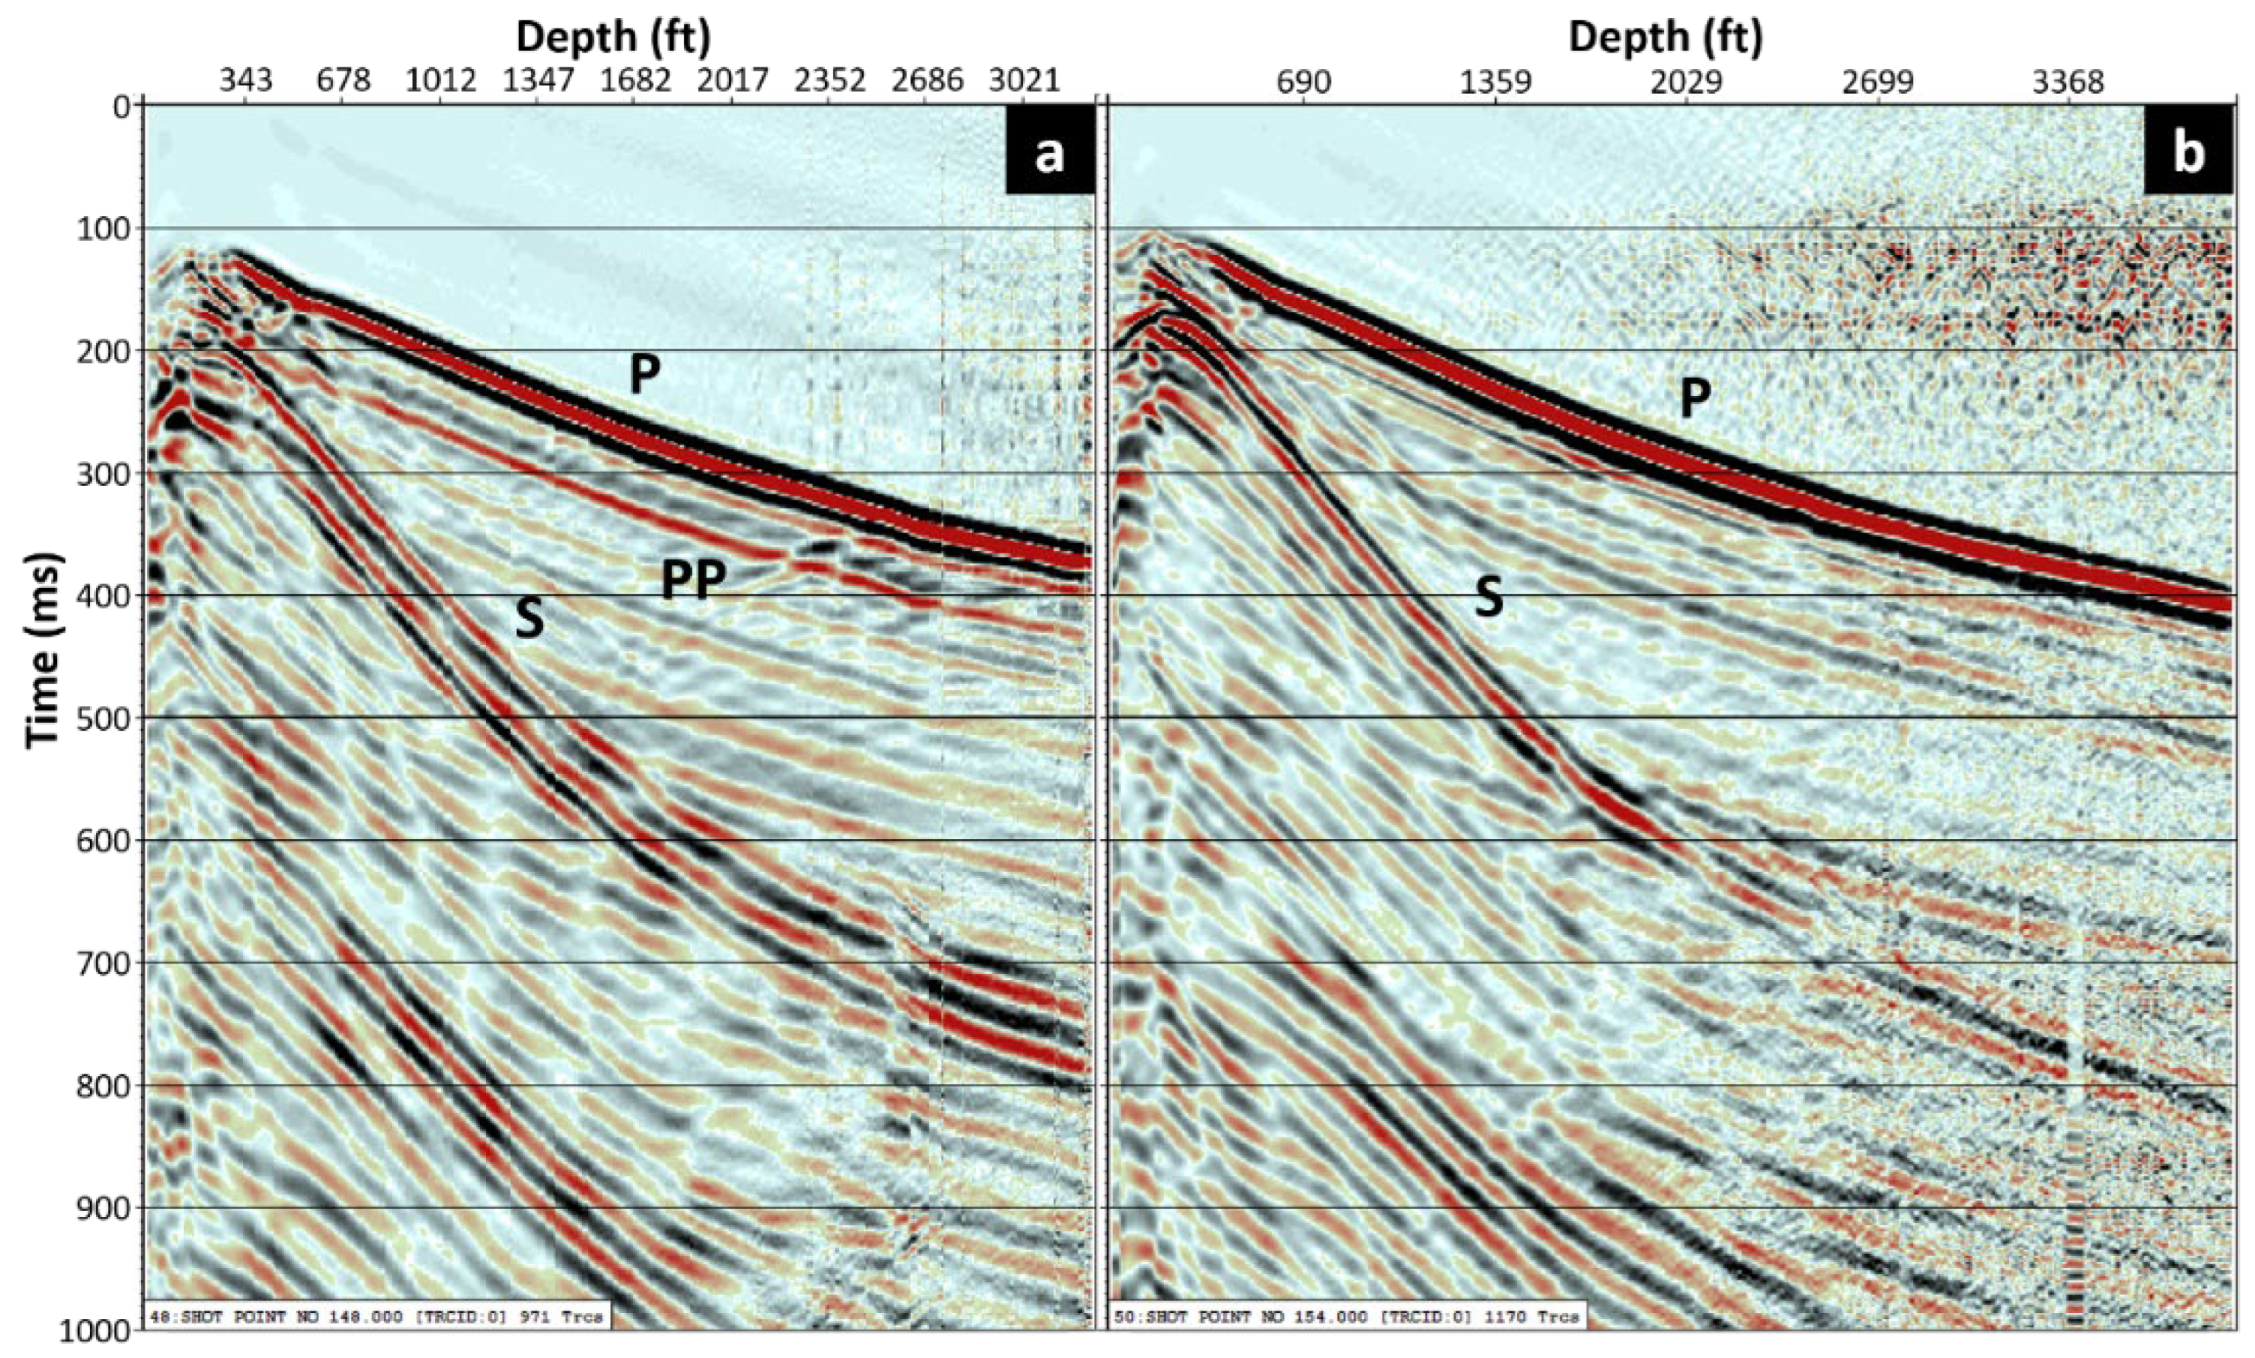
With the varied geometry of the source location and DAS array, different wavefields were visible in the shot records at different offsets. In two zero-offset VSP (ZVSP) records (Figure 5), the direct P-wave (annotated as P in the figure), reflected P-wave (PP), direct S-wave (S), tube wave (Tube), and reflected tube wave (TubeUG) were clearly recorded by the vertical DAS array. The apparent velocity of the tube wave (the strongly linear event) is about 4750 ft/s (1447.8 m/s) and the S-wave has a lower apparent velocity, which is around 3500 ft/s (1066.8 m/s) than the tube wave in the shallow section. Surprisingly, the ZVSP from well 78B-32 did not record the strong tube wave, which was identifiable in the record from well 78A-32 with the offset up to 350 ft (106.68 m) from the wellhead. According to the end of well report (EOWR), the fiber-optic cable was strapped outside of the 5-1/2 in casing in well 78A-32 and 7 in casing in well 78B-32. We imagine that this could be attributed to changes in the casing on which the fiber was cemented, the fluid level, or some kind of baffling.
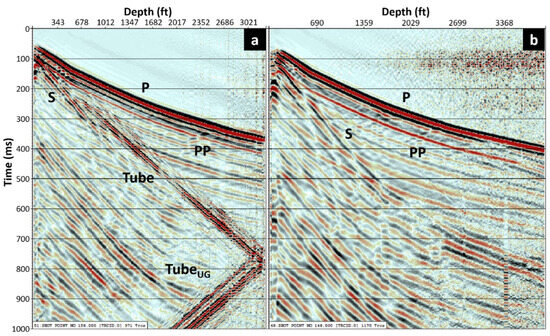
Figure 5.
Two raw ZVSP shot records from (a) well 78A-32 with an offset of 118 ft (~35.97 m) and (b) well 78B-32 with an offset of 122 ft (~37.19 m). Several interpreted events (P, S, tube waves) are annotated.
The prominent direct S-wave became more apparent when the source location moved to 279 ft (~85.04 m) and 257 ft (~78.33 m) from the wellhead of wells 78A-32 and 78B-32 (Figure 6). While the S-wave event was diminished when reached the deeper receivers at well 78B-32, the S-wave arrivals were clear enough to identify in the record from well 78A-32. We then generate the 1D S-wave velocity profiles by tracking the S-wave arrivals, which are presented and compared with the well log in the next section.
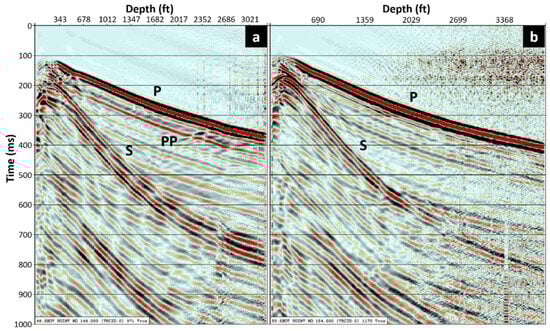
Figure 6.
Two raw near-offset records from (a) well 78A-32 with an offset of 279 ft (~85.04 m) and (b) well 78B-32 with an offset of 257 ft (~78.33 m). Several events are annotated.
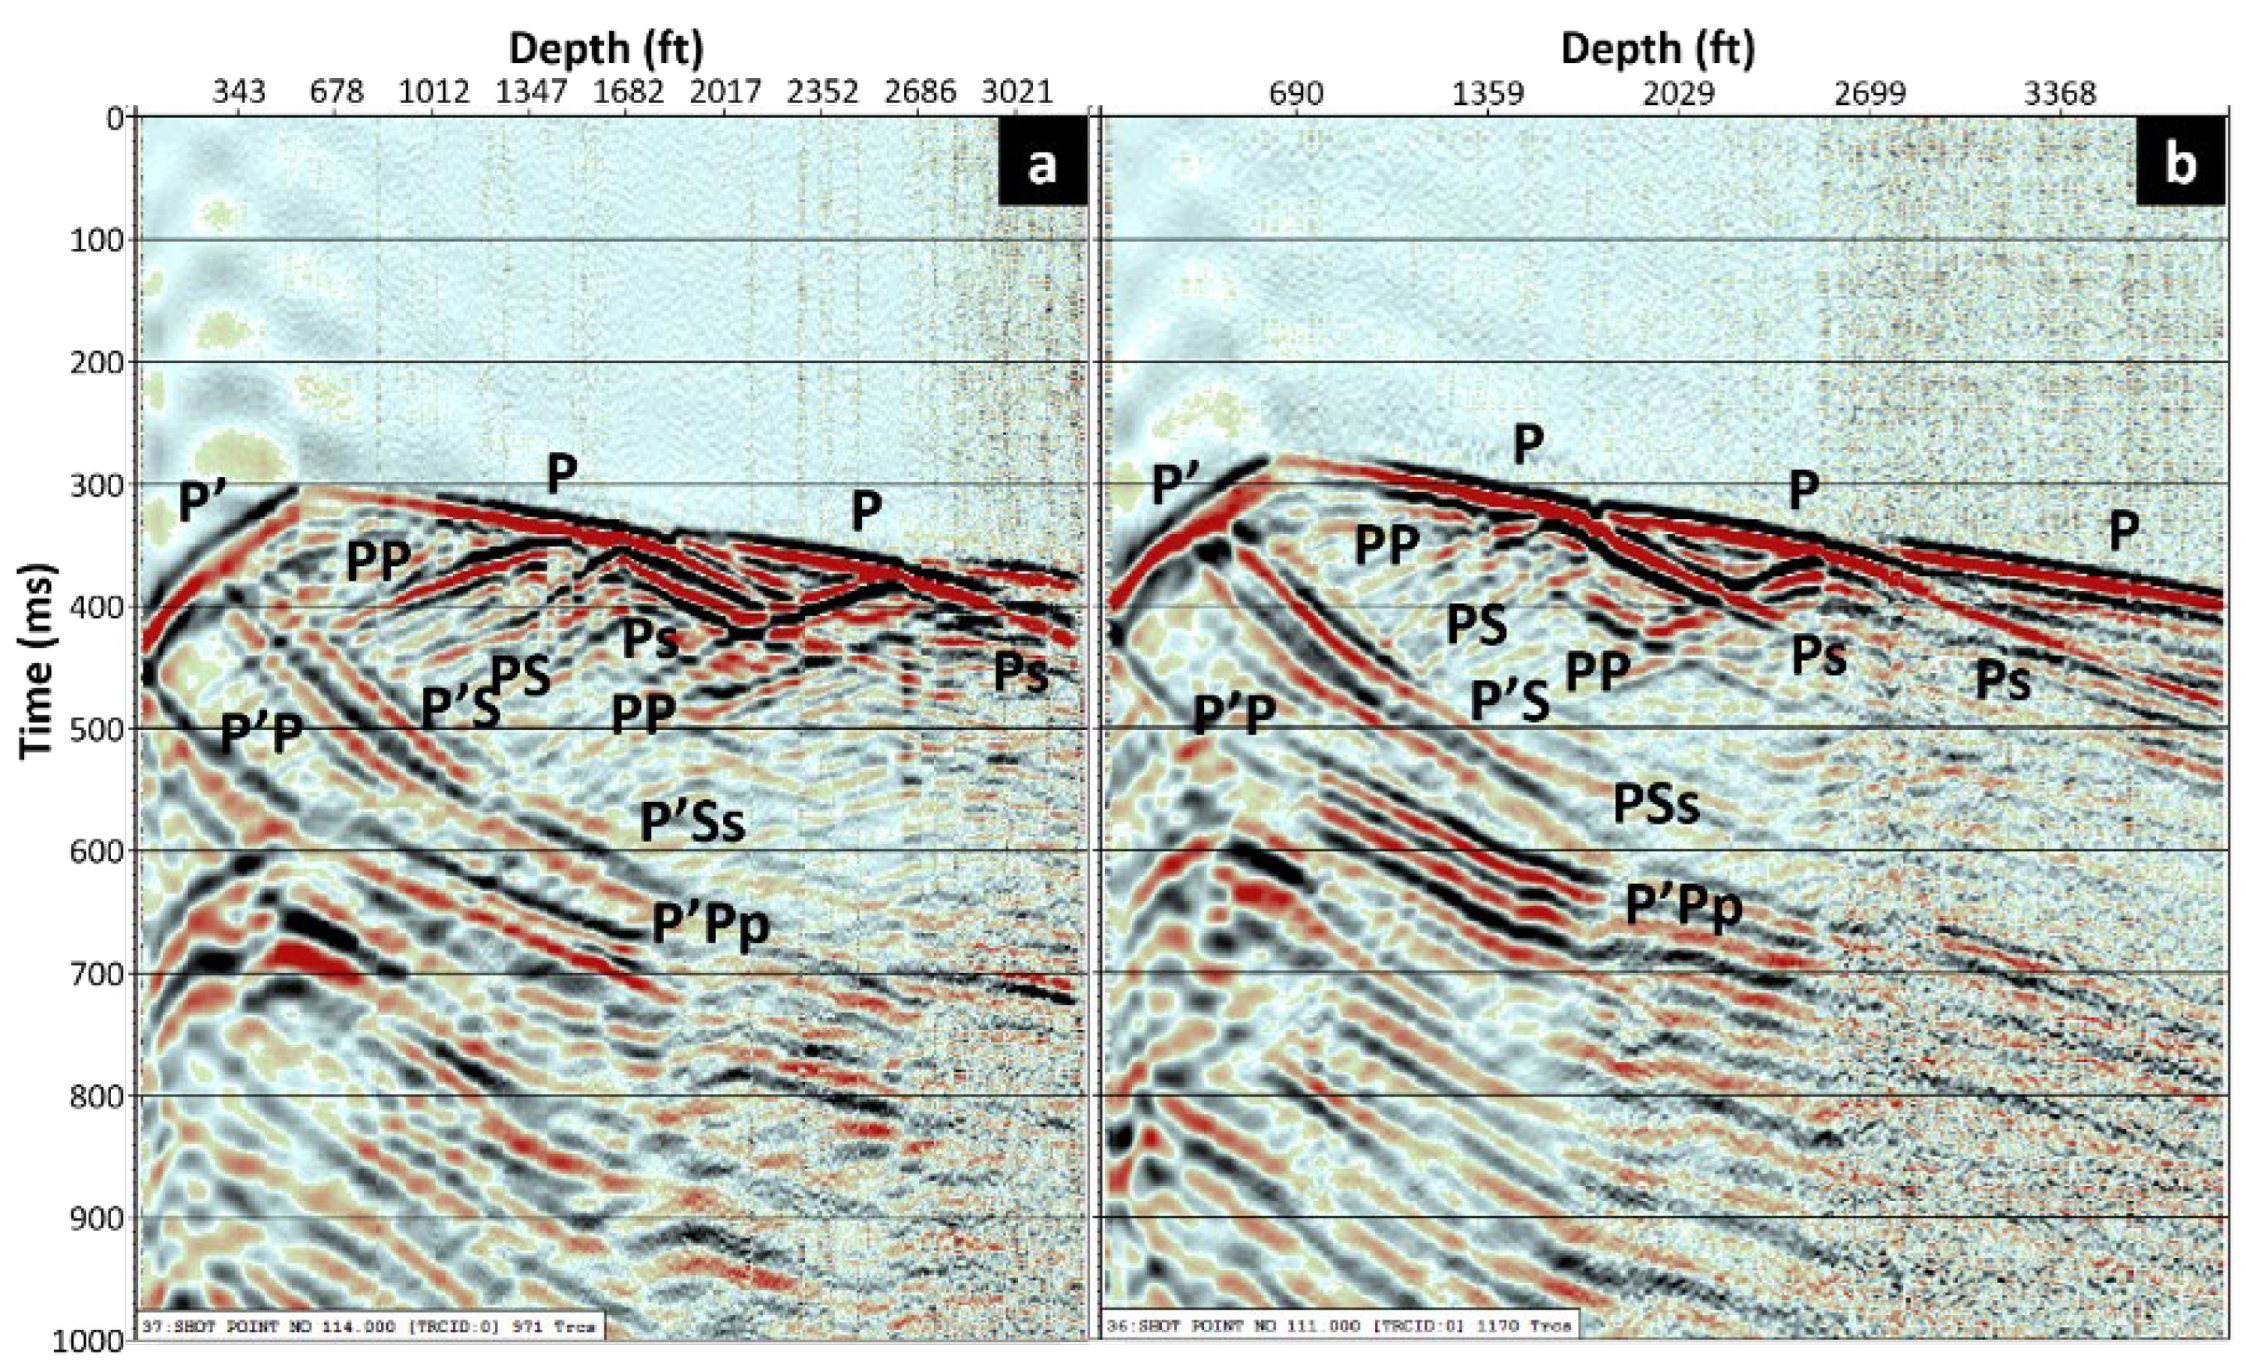
As the source location moved away from the wellhead, the records showed more complex wavefields (Figure 7). The DAS array recorded not only the primary events, the direct P-wave (P), and the reflected P-wave (PP), but also the converted waves, including down-going P-to-S (Ps) and reflected P-to-S (PS) waves as well as the refracted from high velocity formation (P’) appeared as the up-going event.

Figure 7.
Two raw far-offset records from (a) well 78A-32 with an offset of 1416 ft (~431.60 m) and (b) well 78B-32 with an offset of 1241 ft (~378.26 m). Many elastic events, including mode conversions, are evident.
4. Methodology
This section explains how the DAS VSP processing workflow was adjusted and applied to this dataset. Next, we demonstrate how the velocity model was constructed by combining the previous local studies, including the geological structure and seismic velocity model, and the DAS VSP from this study.
4.1. Processing Workflow
Figure 8 shows the revised processing workflow adapted from a 3D DAS VSP workflow that was modified from the conventional geophone VSP procedures to account for this survey geometry [14]. The main differences in geometry and observations are: (1) two wells that have DAS arrays installed are vertical instead of deviated, (2) the formations gently dipped to the west, and (3) no conspicuous ringing noise appeared in the raw record, indicating good coupling. One of the optical sources of noise that was commonly observed in the raw DAS record is common mode noise (CMN), which is generated inside the DAS interrogator unit. This type of noise will appear as an infinite velocity event in the raw record; hence, the median filter along the depth (or channel) axis was applied to remove most of the CMN energy. The gauge length has a substantial impact on the data quality and further analysis results, thus we believe that gauge-length correction is required during preprocessing. The gauge length correction, which was demonstrated in the next section, was applied after picking the first arrivals. As the DAS is most sensitive to the axial strain along the fiber, which can be thought of as the single component record, the 3C rotation operation is not required in the DAS data.
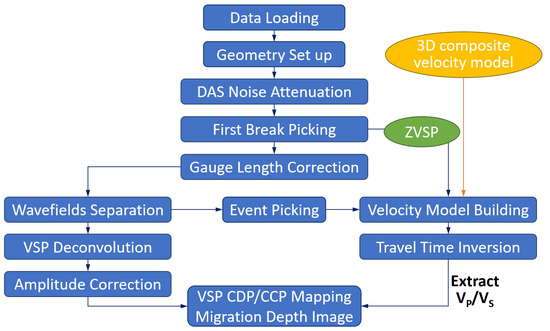
Figure 8.
Processing workflow for 2D walkaway DAS VSP.
4.2. Velocity and Attenuation Profiles
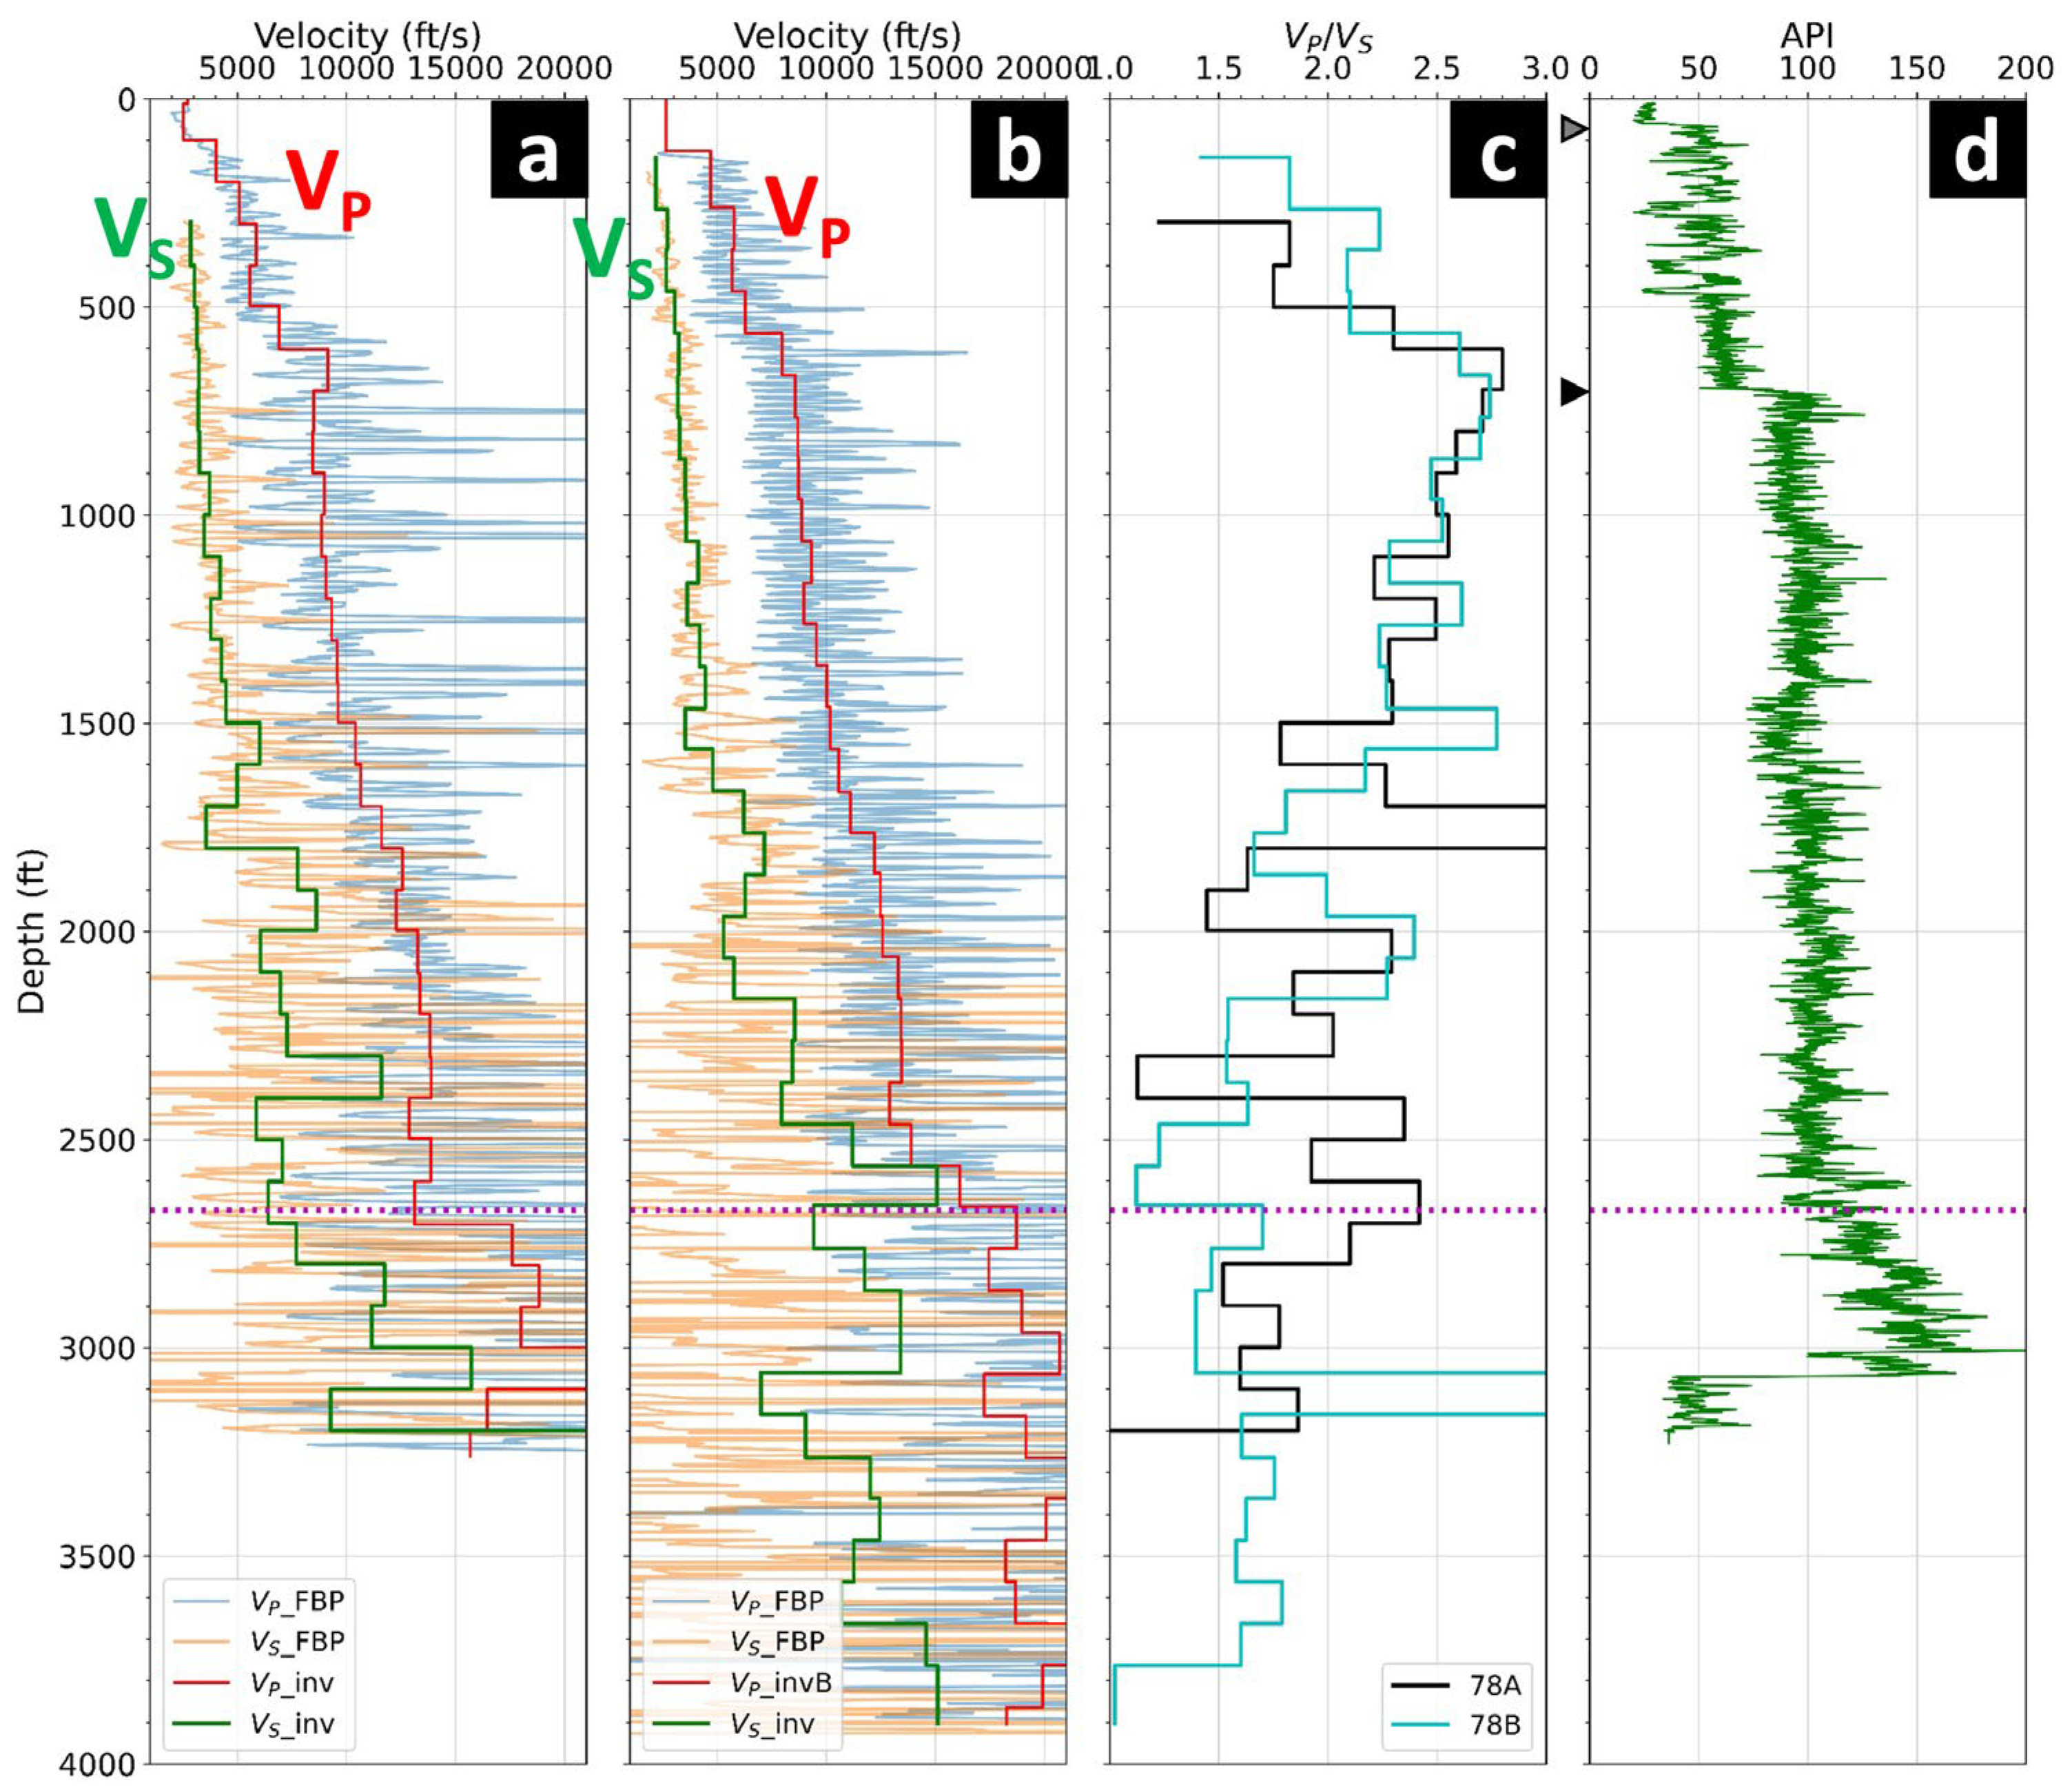
The 1D P-wave velocity profiles were generated by picking the first arrival in the zero-offset VSP records, smoothed by a linear filter (Figure 9) then inverted for velocity. The direct S-waves became distinguishable as the source location moved away from the wellbore, and the VP/VS values were calculated from two near-offset records with shot locations was 279 ft (~85.04 m) and 257 ft (~78.33 m) from the wellhead of wells 78A-32 and 78B-32, respectively. The apparent VP/VS from two wells are mostly between 1.5 and 2.7 in this area and applied to generate the P-S CCP profile and P-S migration depth image (Figure 9c). The magenta dotted line represents the basement contact (granitoid) recorded at the depth of 2616 ft (~797.36 m) from ground level in well 78A-32.
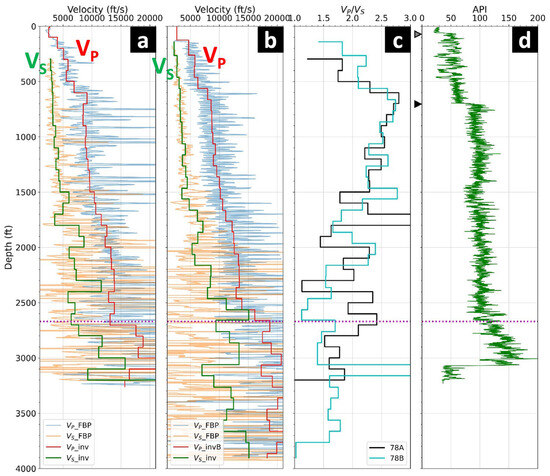
Figure 9.
1D velocity profiles and interval attenuation in comparison to gamma-ray log. (a) P-wave (red) and S-wave (green) velocity calculated from the first break DAS picks (blue and orange) at well 78A-32. (b) P-wave (red) and S-wave (green) velocity calculated from the first break DAS picks (blue and orange) at well 78B-32. (c) VP/VS curve calculated from the velocity profiles at well 78A-32 (black) and 78B-32 (cyan). (d) gamma ray curve (green) acquired at well 78A-32. The magenta line represents basement contact at about 2616 ft (~797.36 m). The grey and black inverted triangles indicate the changes in casing sections at 69 ft (~21.03 m) and 704 ft (~214.58 m).
The gamma-ray log, acquired in well 78A-32, was influenced by the casing properties in the shallow section (Figure 9d). There are three sections of casing in well 78A-32. The first 14 in casing was set at 69 ft from ground level (pointed by grey triangle), the second section with 9.625 in casing was run to 706 ft (pointed by black triangle), and the third 5-1/2 in casing was run down to 3268 ft. The gamma-ray log obtained a relatively low value down to 706 ft as the lithology log indicates there is no significant lithological change at this interval. According to the drilling report, there were three casing sections in well 78A-32, Conductor (14 in casing), Surface (9.625 in), and Production (5.5 in). The gamma ray measurement at this interval might be influenced by changes in casing sections at 69 ft (end of Conductor section; grey inverted triangle) and 704 ft (end of Surface section; black inverted triangle). Beneath the basement contact, a gamma ray log drops at about 3080 ft, as reported by the lithology log, which indicates the lithological change from granite to granodiorite with a transition from 3060 ft to 3100 ft.
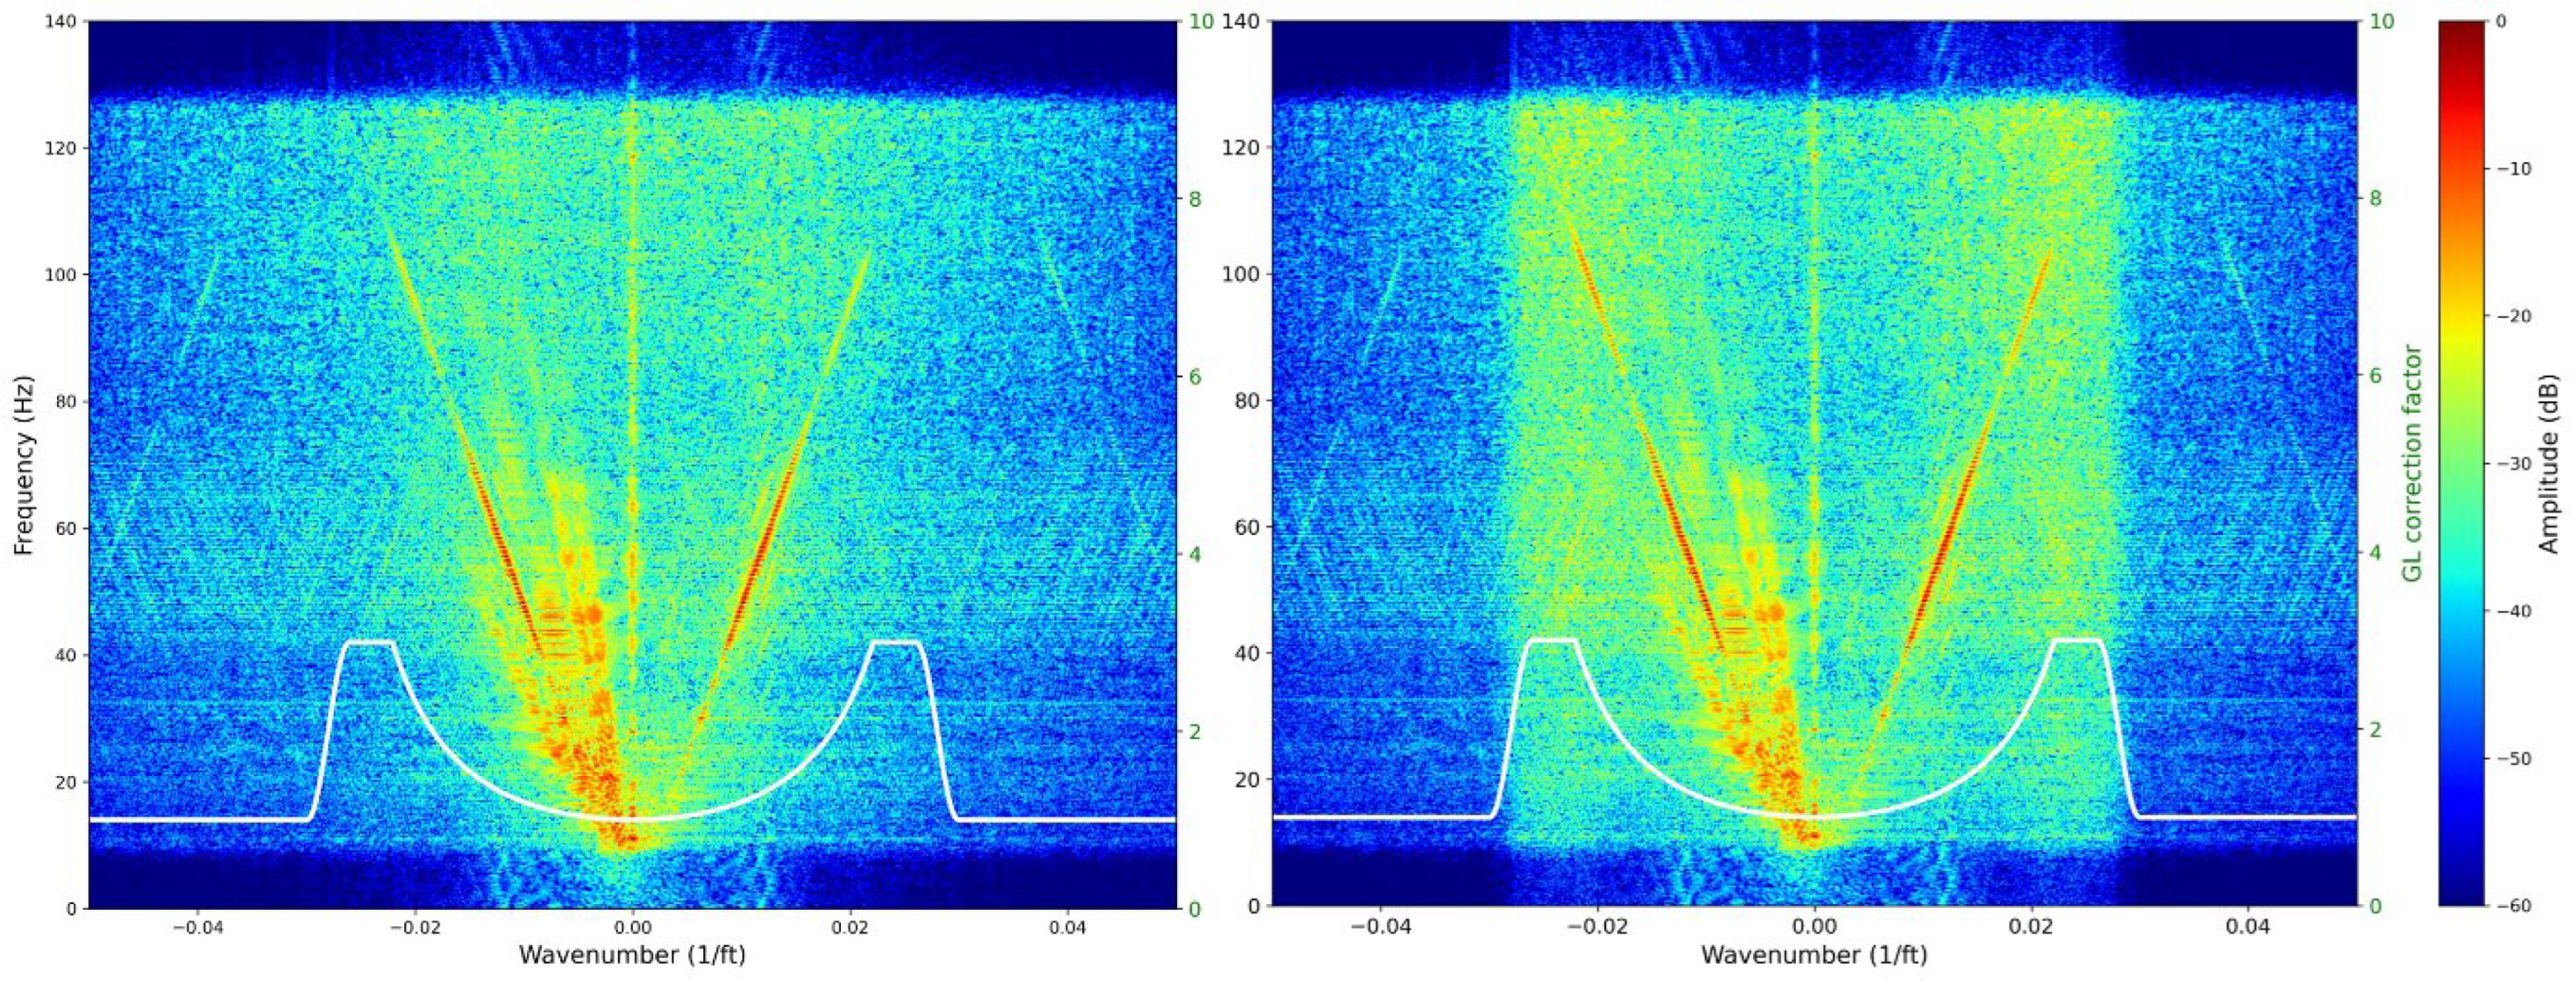
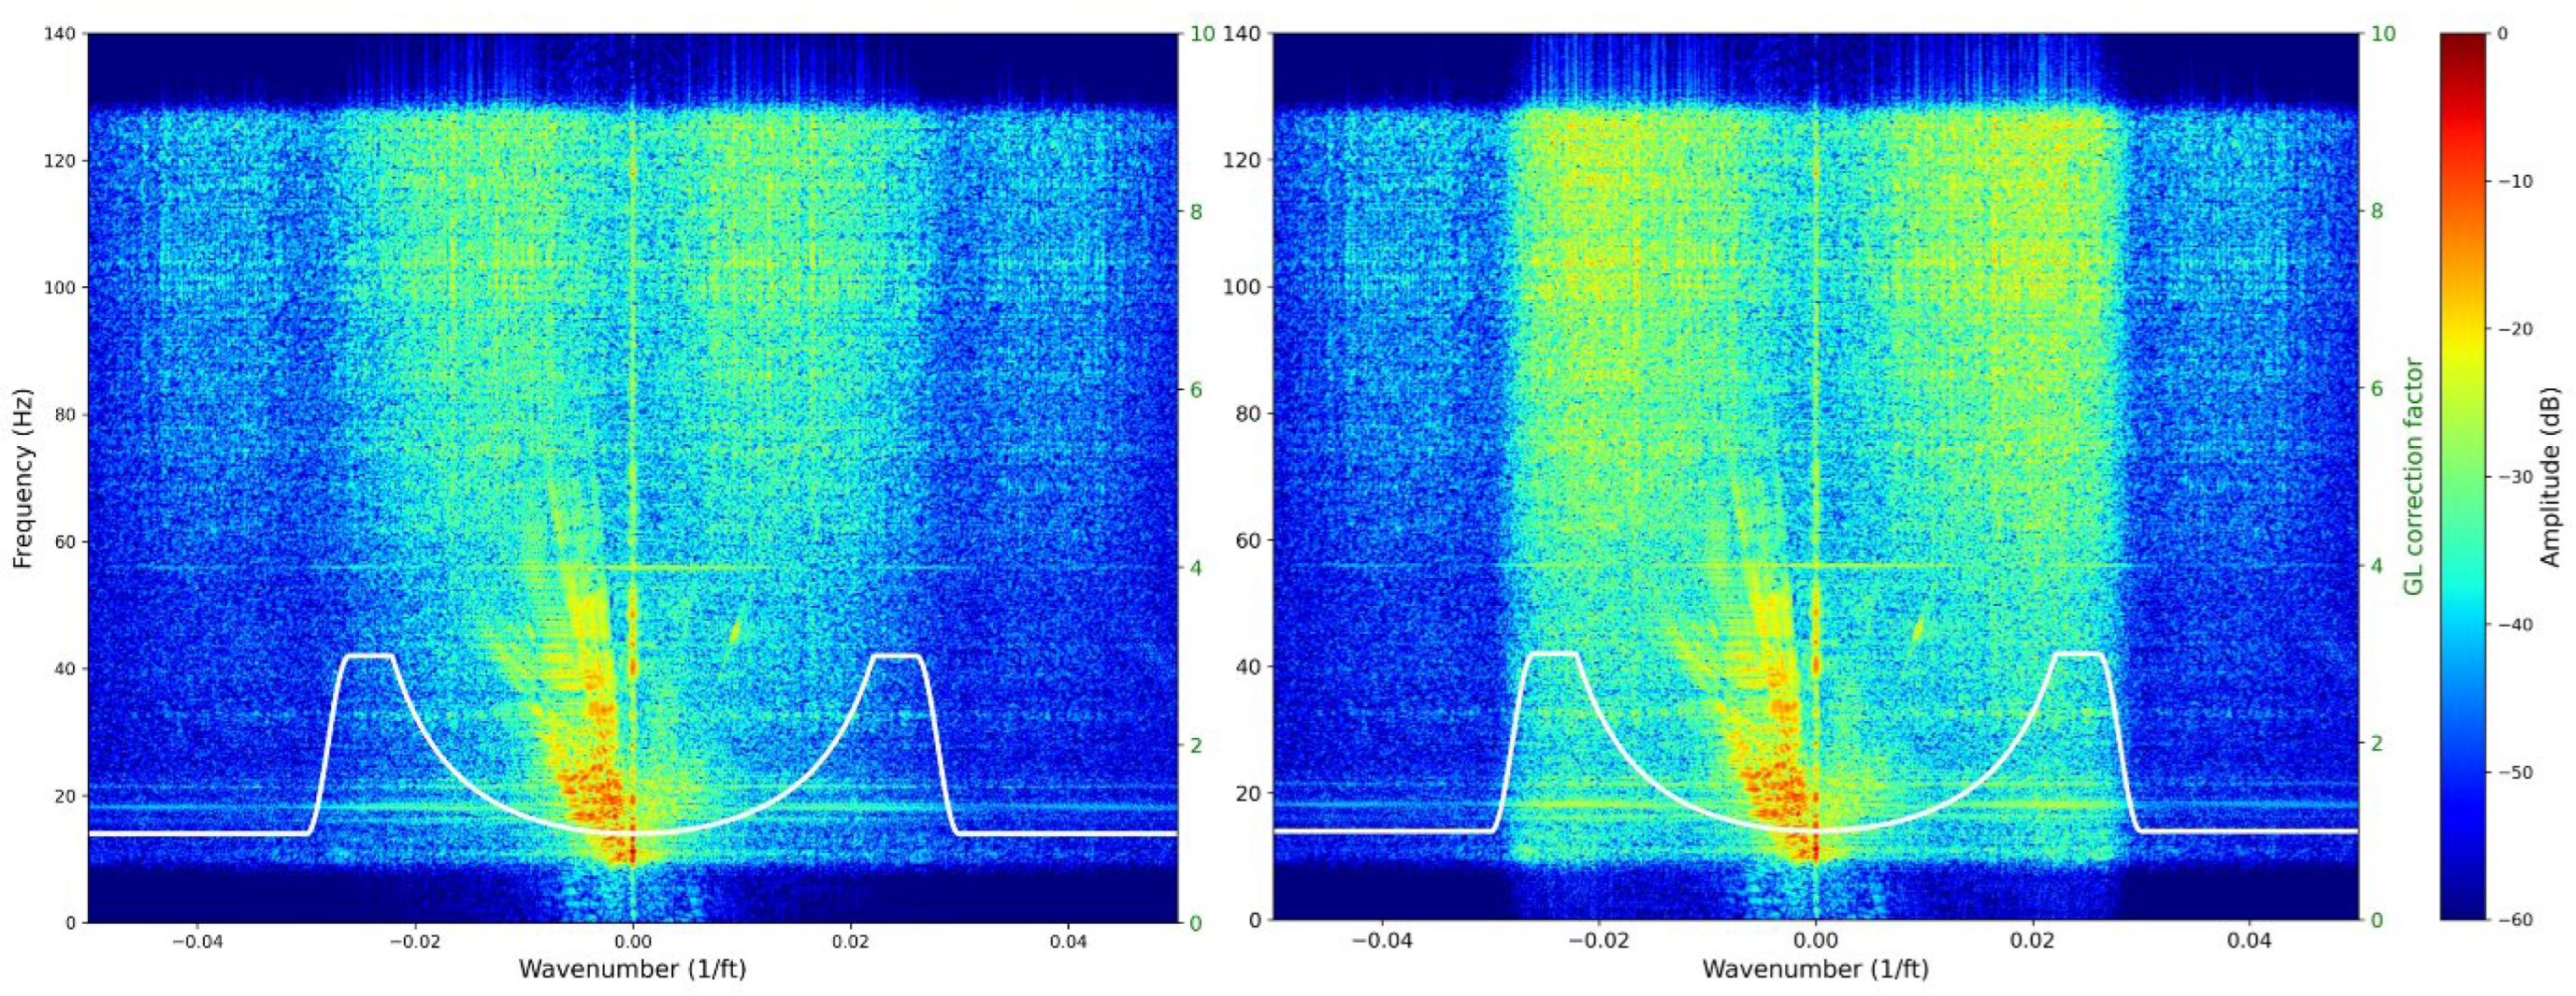
We applied the gauge-length correction [15,16] to the DAS data to avoid mis-estimation. The gauge length used in the WVSP acquisition was 10 m (~32.80 ft). According to the relation between DAS measurement and the actual axial strain shown in Equation (1 8), the amplitude response of the normalized sinc function (amplitude colored in blue and red) and corresponding correction factor (light green dashed line) are shown in Figure 10. The final correction factor (green solid line) was limited to 3 with a tapper to 1 on both sides of the signal bandwidth within the main lobe of the sinc function. The adjusted correction factor was applied to all frequencies in the f-k domain. The comparison shows that the correction factor magnifies the higher apparent velocities and suppresses the lower apparent velocities that were thought of as the noise (Figure 11 and Figure 12).
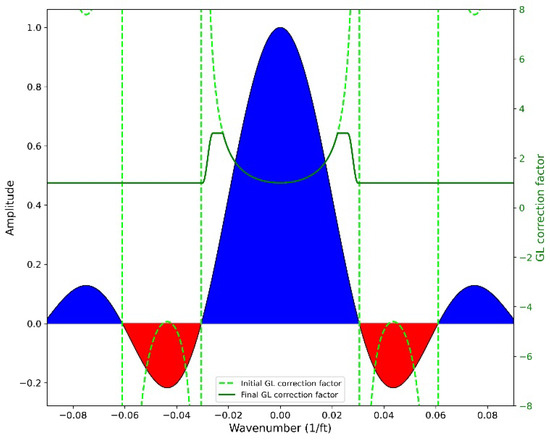
Figure 10.
The amplitude response of the normalized sinc function and gauge-length correction factor for 10 m (32.8 ft) gauge-length acquisition. The designed correction factor (green solid line) was adjusted from the initial correction factor (light green dashed line). The amplitude is shown on the left vertical axis and the gauge-length correction factor on the right vertical axis.

Figure 11.
Comparison of f-k spectrum (left) without and (right) with GL correction from ZVSP at well 78A-32. Frequency on the left vertical axis and the gauge-length correction factor on the right vertical axis for each figure.
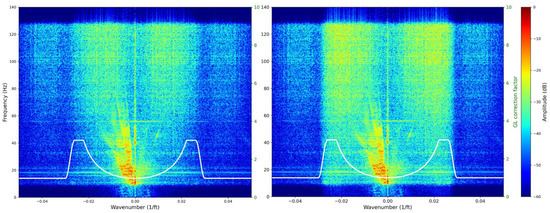
Figure 12.
12Comparison of f-k spectrum (left) without and (right) with GL correction from ZVSP at well 78B-32. Frequency on the left vertical axis and the gauge-length correction factor on the right vertical axis for each figure.
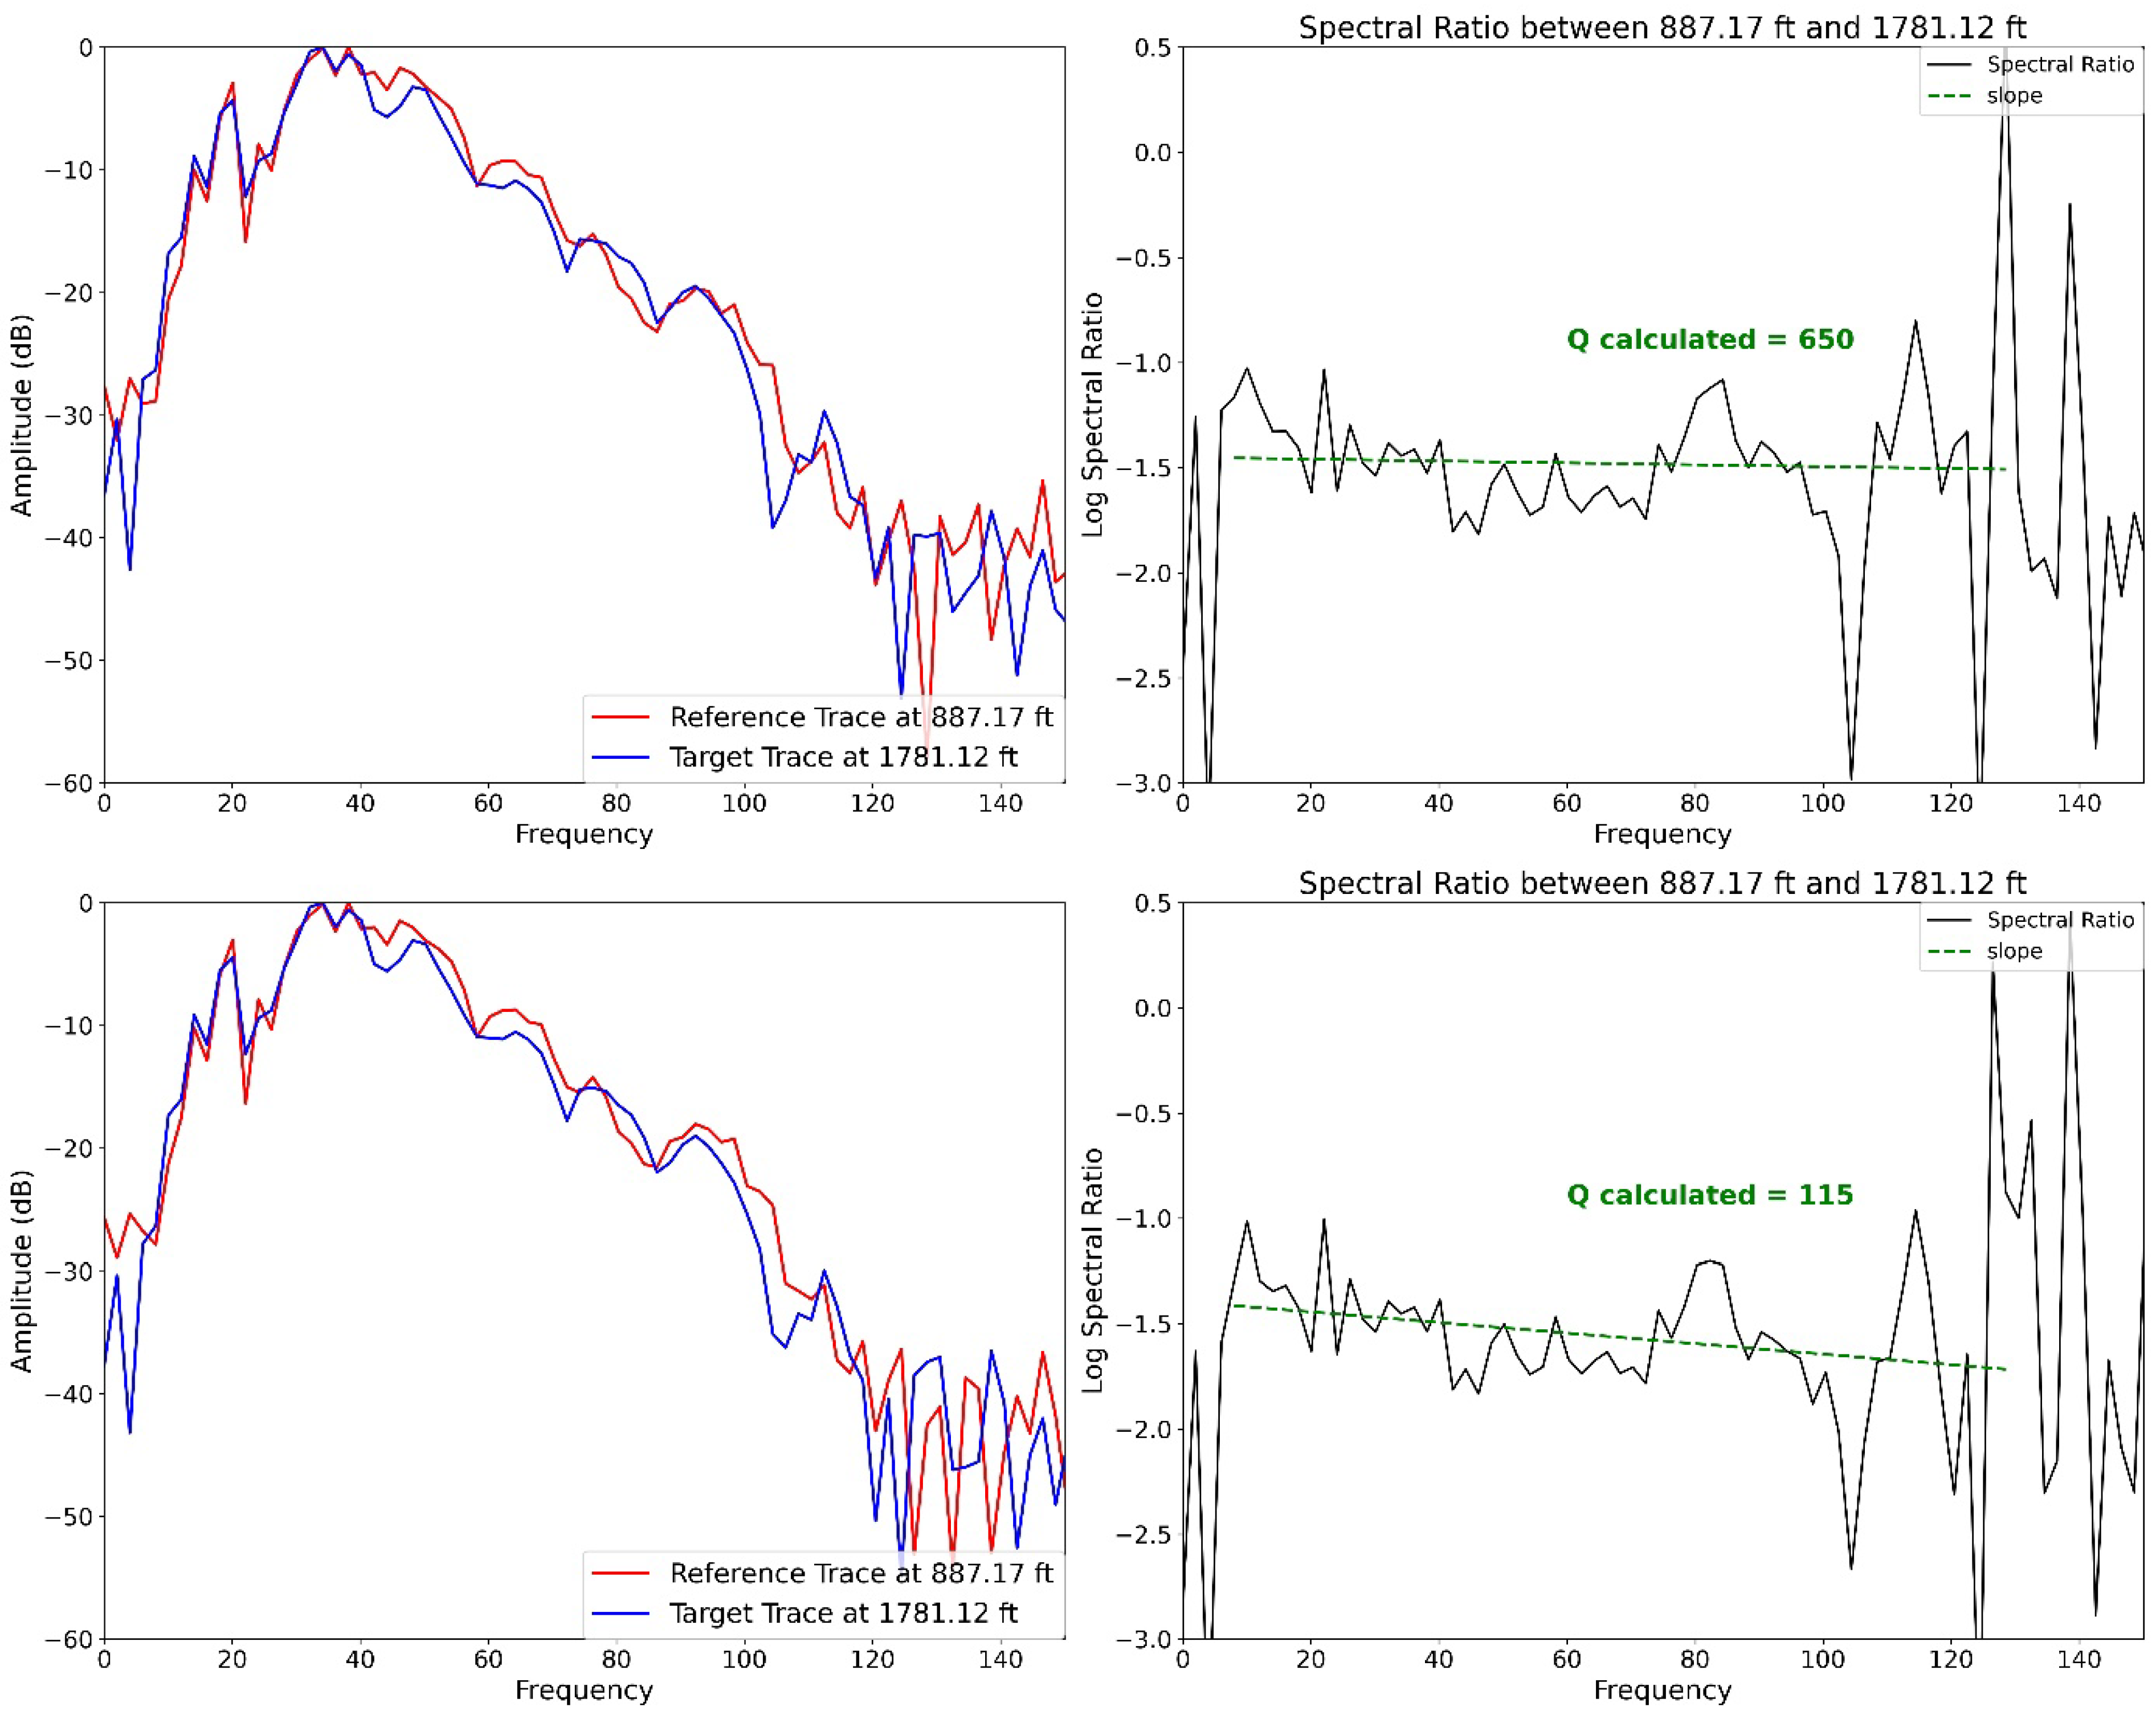
The corrected DAS records were transformed back to the time domain. Next, we eliminated the common mode noise and separated the down-going P-wave by a median filter to calculate the Q value from two ZVSP records at wells 78A-32 and 78B-32. We calculated the interval Q with a similar interval at well 78A-32 and 78B-32, respectively, to demonstrate the effect of the gauge length on Q estimation. Interval Q values were calculated between two DAS channels at 885.09 ft (~269.78 m) and 1722.12 ft (~524.9 m) for well 78A-32 and 887.17 ft (~270.41 m) and 1781.12 ft (~542.89 m) for well 78B-32 (Figure 13 and Figure 14). The calculated Q before gauge-length correction is 438 from the 78A-32 record and 650 from well 78B-32 record. With gauge-length correction, the interval Q value was lowered to 118 and 115, which is about a quarter of the initial estimation.
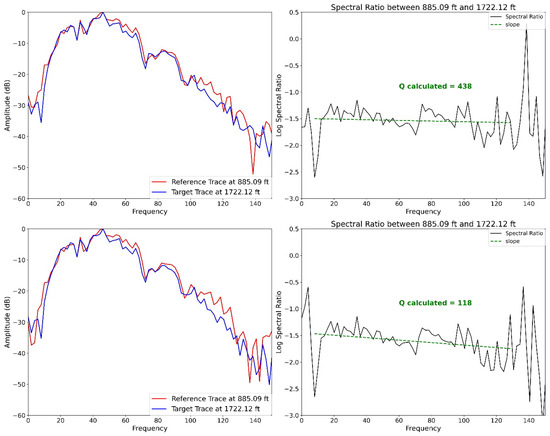
Figure 13.
Comparison of (left) spectra and Q-estimation (right) of DAS ZVSP record from well 78A-32 (top) without and (bottom) with GL correction. The spectral ratios are plotted in black and the slope calculated using the linear fit is plotted in green. The interval Q was calculated between two DAS channels at 885.09 ft (~269.78 m) and 1722.12 ft (~524.9 m).
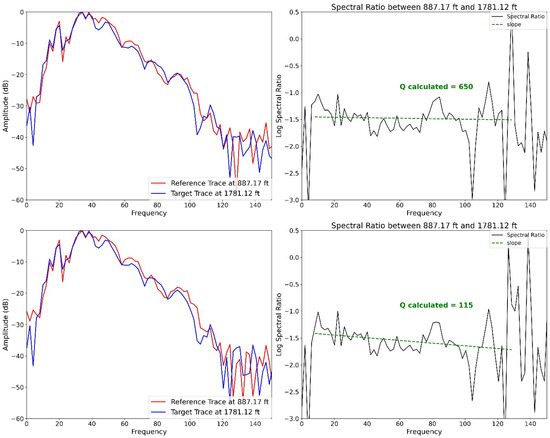
Figure 14.
Comparison of (left) spectra and Q-estimation (right) of DAS ZVSP record from well 78B-32 (top) without and (bottom) with GL correction. The spectral ratios are plotted in black and the slope calculated using the linear fit is plotted in green. The interval Q was calculated between two DAS channels at 887.17 ft (~270.41 m) and 1781.12 ft (~542.89 m).
4.3. Velocity Model Building
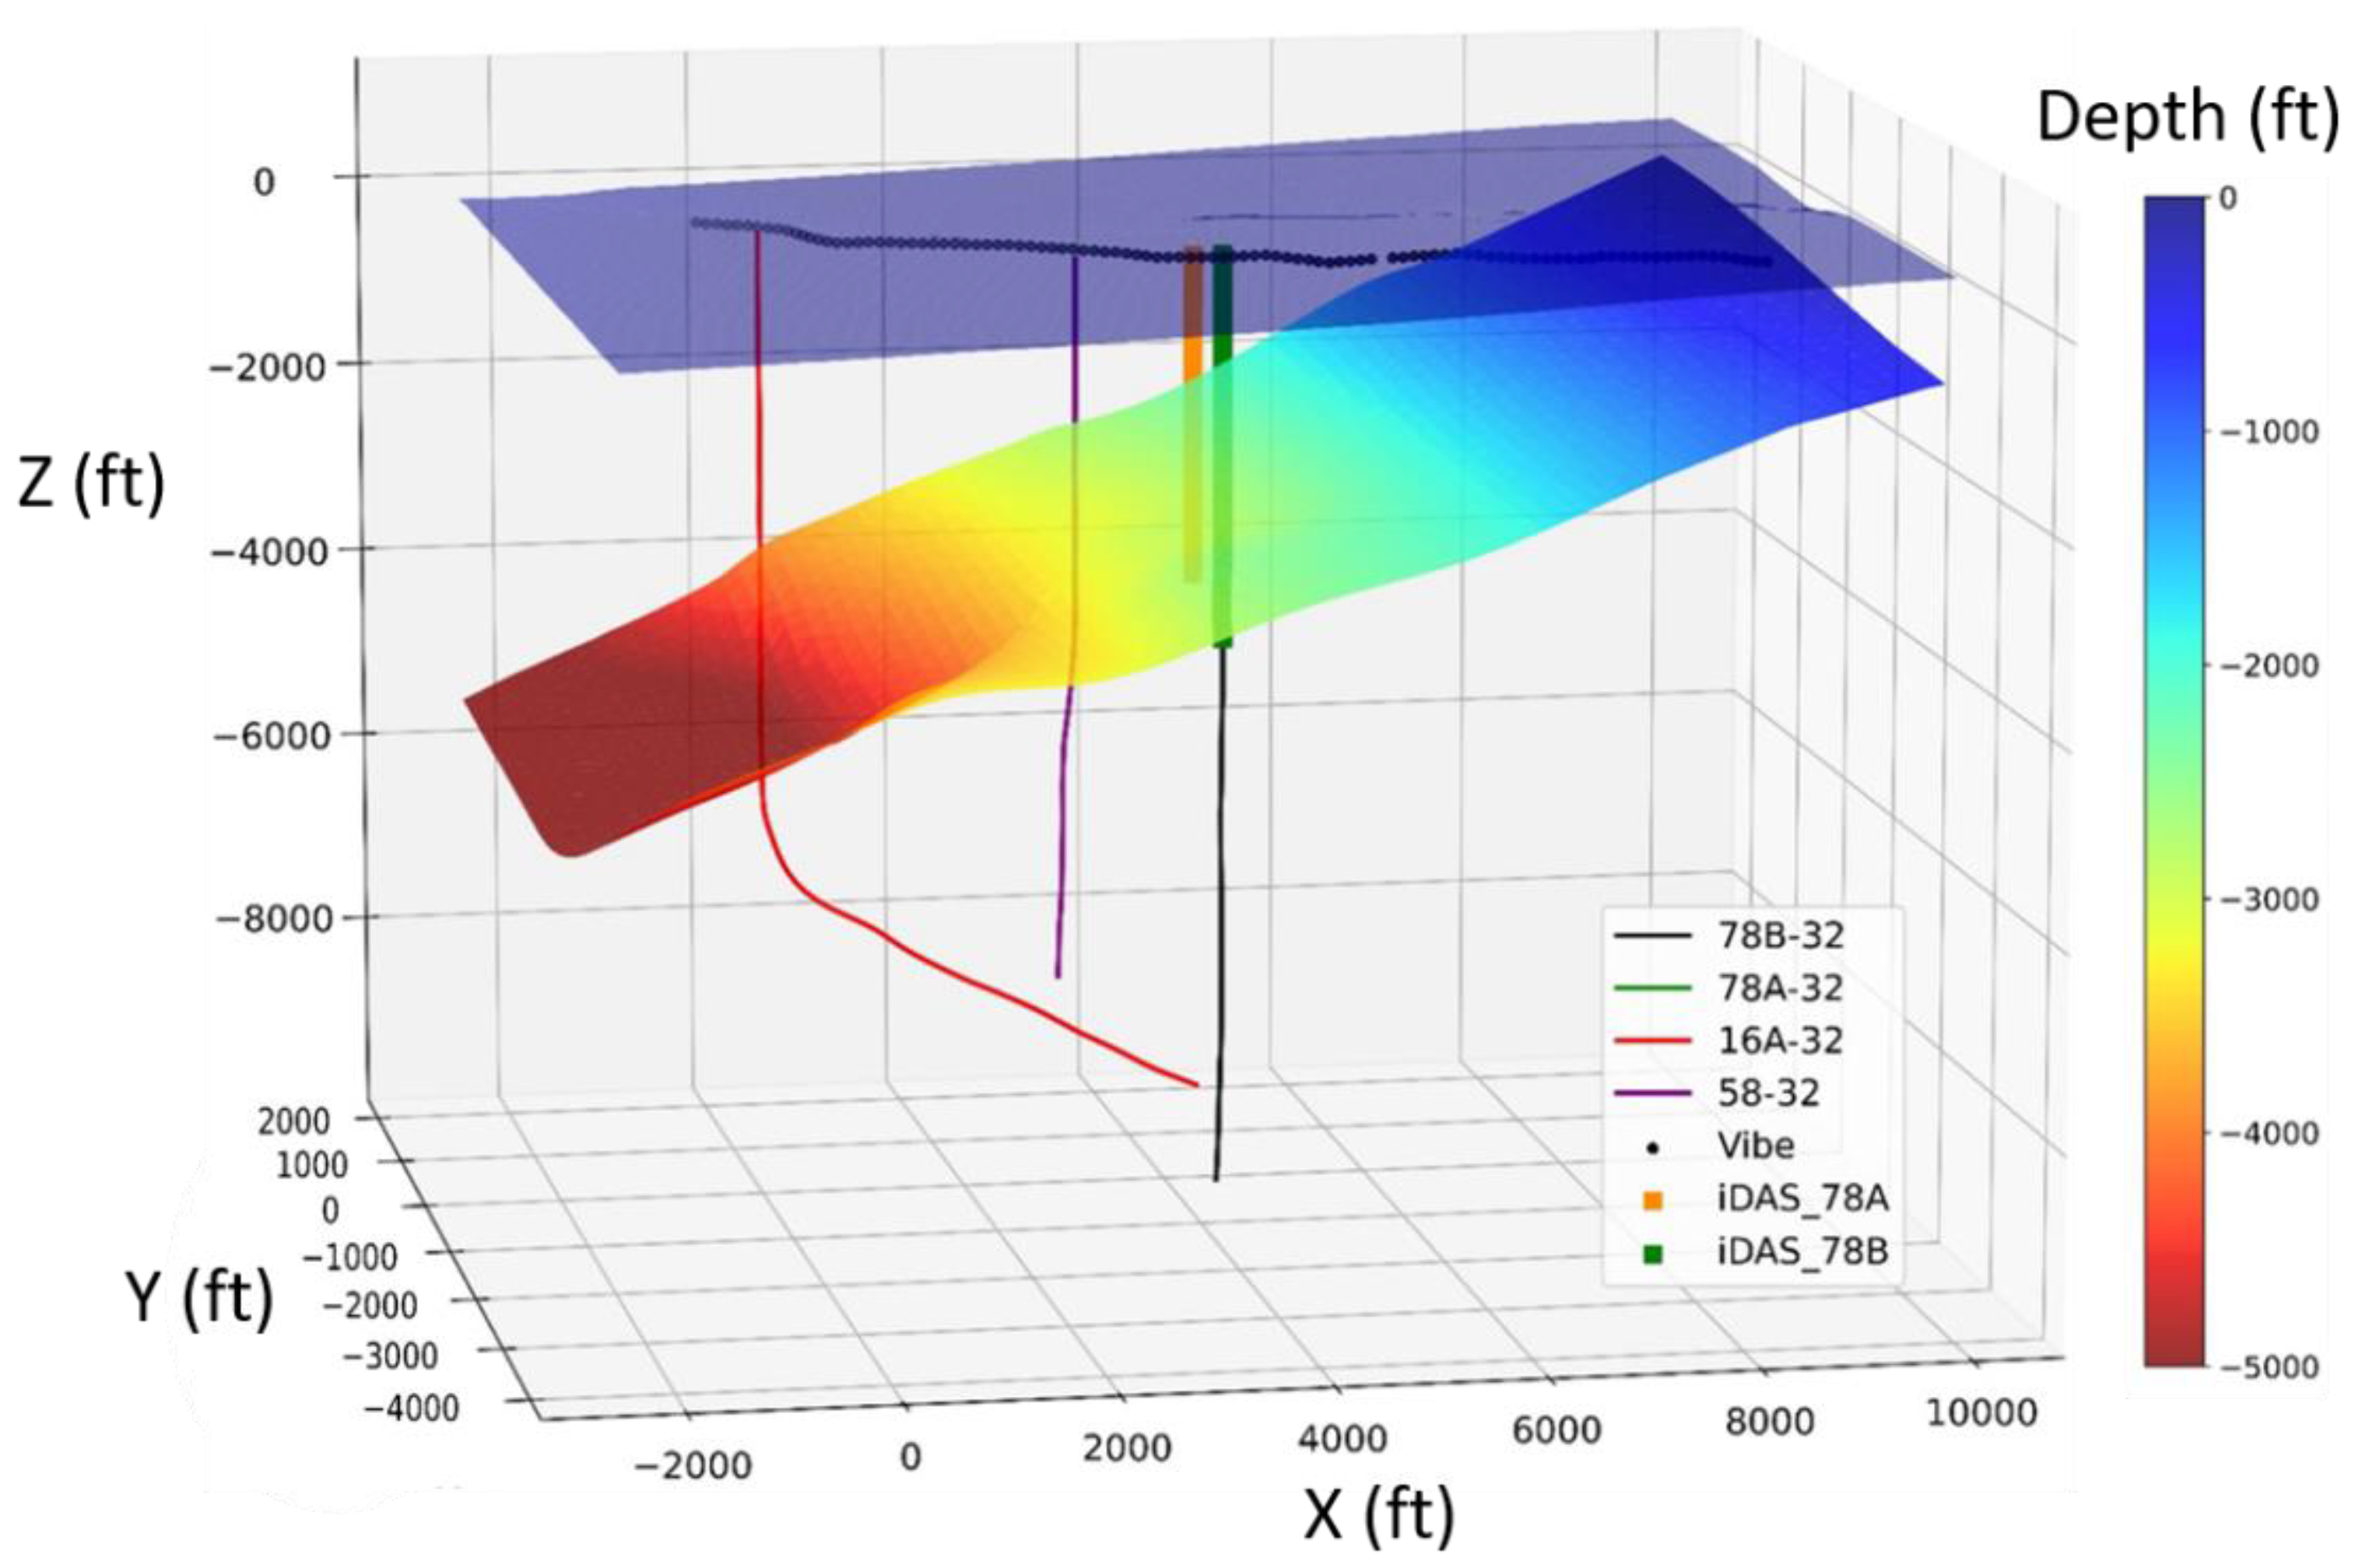
Based on previous studies and seismic reflection surveys, the basement boundary beneath the FORGE site is a westward dipping ramp that forms a sharp lithology (velocity) contrast between the basin fill-layered sediments and the granitoid (Figure 2 and Figure 15). Sequentially, the 1D P-wave velocity model from ZVSP was expanded to 3D by correlating with a 3D composite velocity model from [17] and the basement interface (Figure 15).
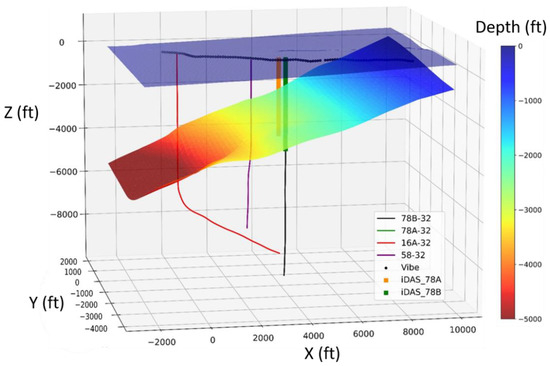
Figure 15.
Geometry of walkaway DAS VSP wells. The mapped surface and top of the granite (basement) are shown with color in depth.
The 3D composite velocity model was contributed from two velocity models, a base model from the quasi-3D VS model of [18] and VP and VS profiles from [7]. A quasi-3D S-wave velocity model was constructed [18] by applying spatial autocorrelation (SPAC) over 61 1D VS profiles over an approximately 3.5 km by 3.5 km (11,482.94 ft by 11,482.94 ft) area via Bayesian Monte Carlo inversion (BMCI). Their quasi-3D SPAC VS model provides reliable velocity images with a resolvable depth down to 2.0 km (6561.68 ft). [7] derived 1D P- and S-wave velocity models from first arrivals recorded by a DAS array along a vertical monitoring well (78-32). The P-wave velocity profile was generated based on the perforation shots conducted in the stimulation well (58-32), and the S-wave velocity model was constructed from the microseismic events that generate stronger DAS-recorded shear energy.
The final 3D composite velocity model was constructed by applying a linear interpolation between elevation-adjusted velocity profiles from the base model and VP/VS profile over a 3D grid with 50 m (164.04 ft) spacing, smoothing the velocity contrast with a Gaussian filter, and fixing the P- and S-wave velocities below the basement boundary. See [17] for further details on building the 3D composite velocity model from compiled local studies.
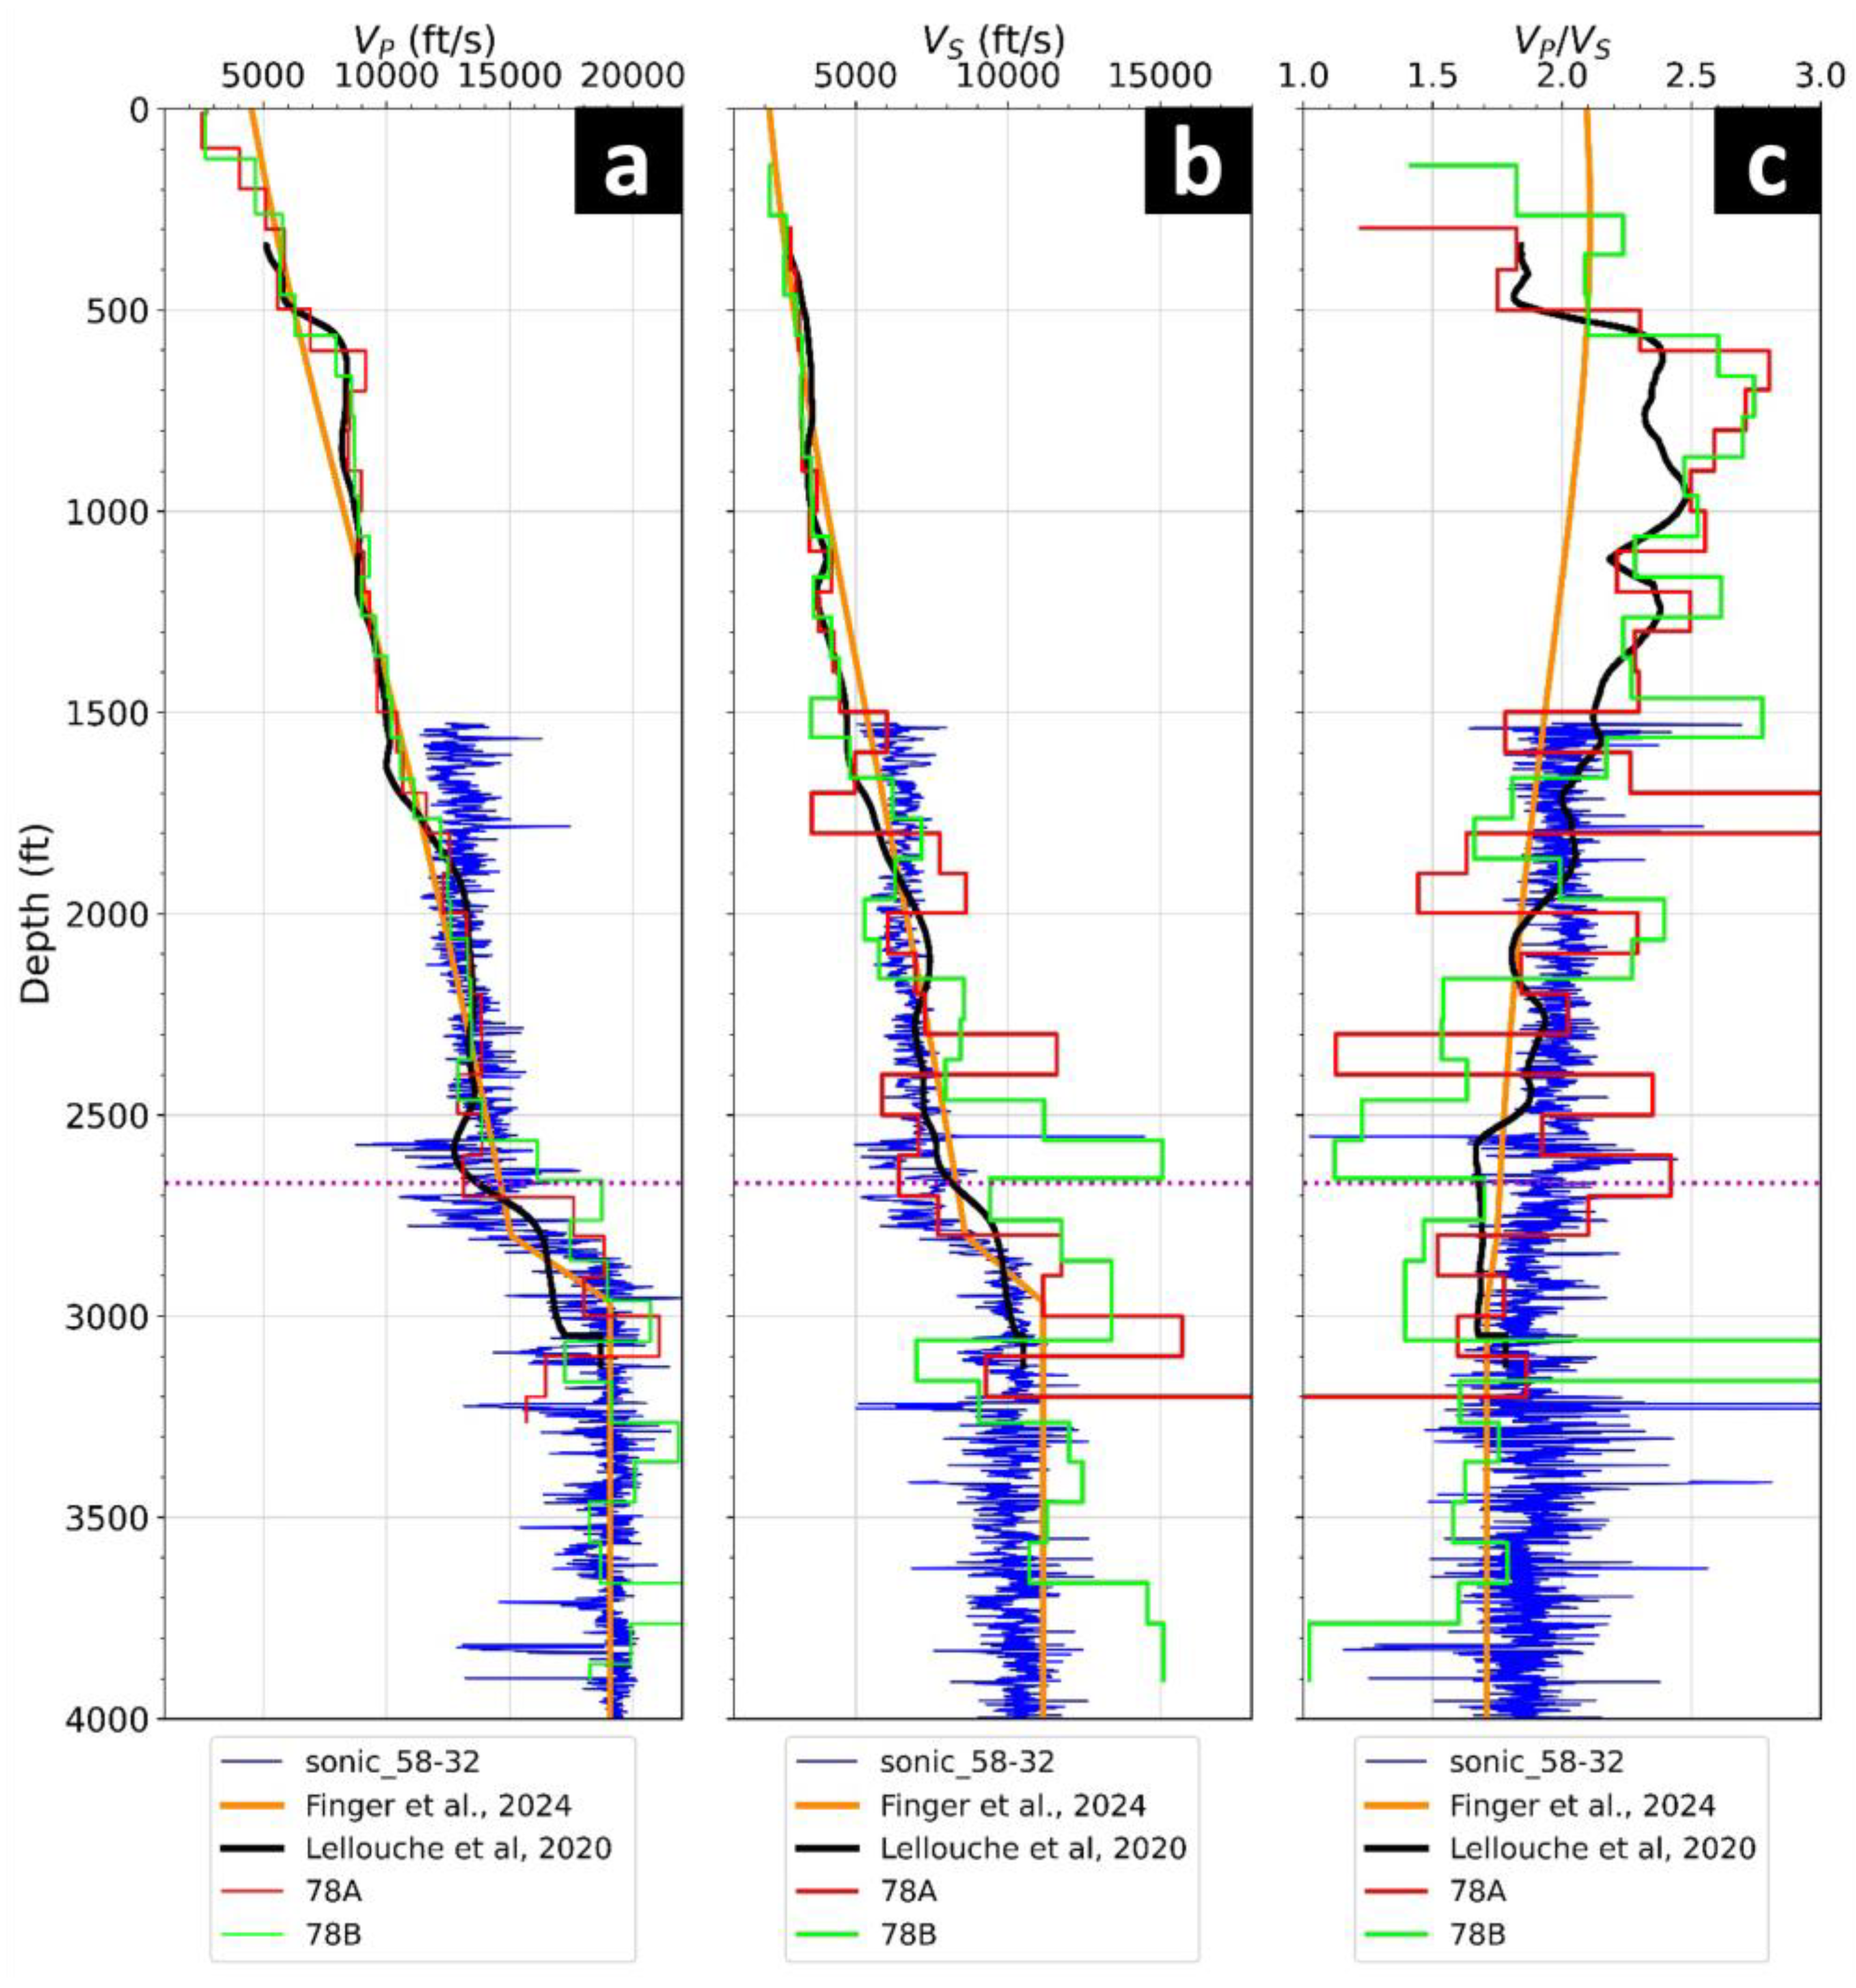
We shifted the elevation of the 3D composite velocity model from [17] to the reference elevation set in this study and correlated it with our 1D VP profile from ZVSP (Figure 16). The P- and S-wave velocities from ZVSP correlate with previous results. A lower similarity between velocity profiles occurs in the deeper area, where the interval velocities calculated by the first-break picks were affected by the low signal-to-noise ratio of DAS data. Combining the topography of the sediment-basement interface mapped from [19], we adjusted and expanded the 1D P-wave velocity profile to a 3D P and S-waves velocity model covering the entire walkaway VSP survey area (Figure 17).

Figure 16.
Comparison of 1D (a) VP profiles, (b) VS profiles, and (c) VP/VS curves between this research and previous local studies. The magenta-dotted line represents the basement contact (granitoid) recorded in well 78A-32. Data is from [7,17].

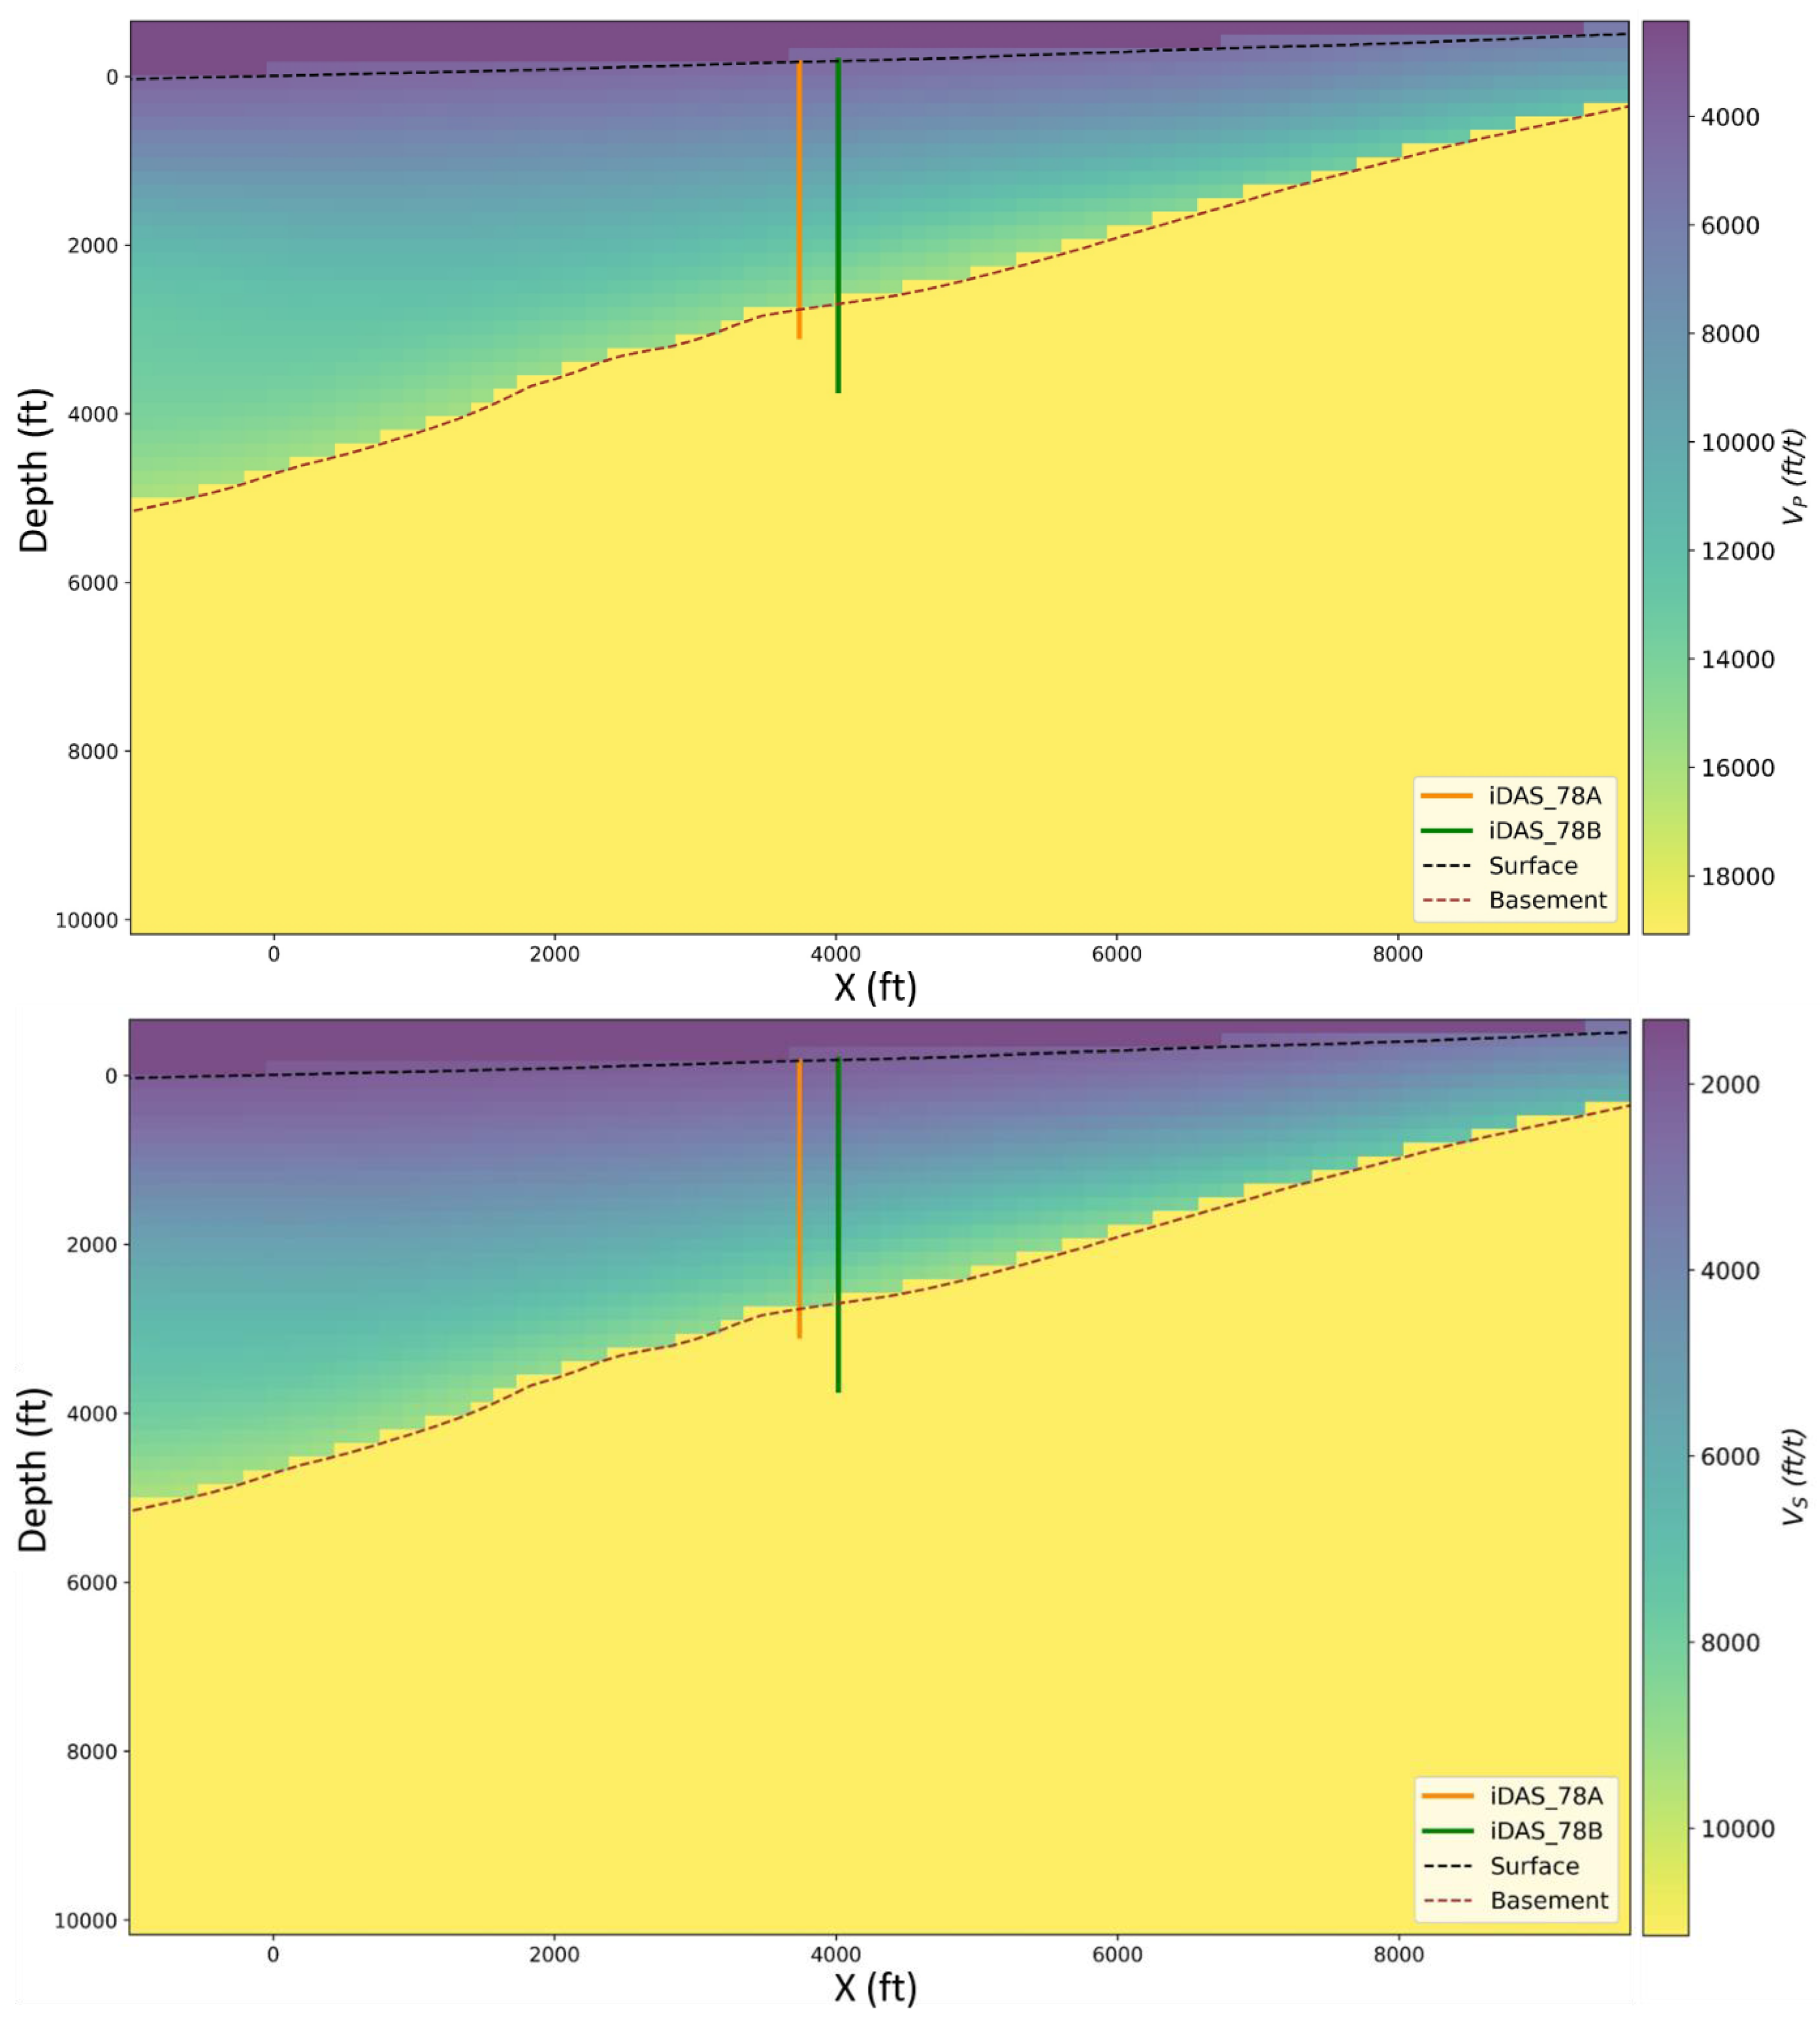
Figure 17.
Cross-section of 3D velocity model for (top) P-wave and (bottom) S-wave.
5. Results
A comparison of two inline depth images extracted from 3D P-P volumes after the VSP Kirchhoff migration is presented in (Figure 18). The inverted triangle indicates the wellhead of 78A-32 (green) and well 78B-32 (black), which is close to cross-line no. 104 and no. 98 in the 2D depth images.
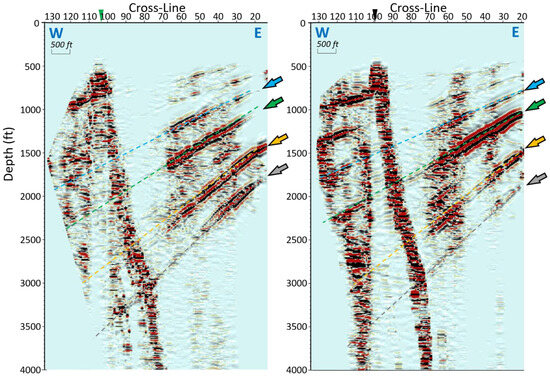
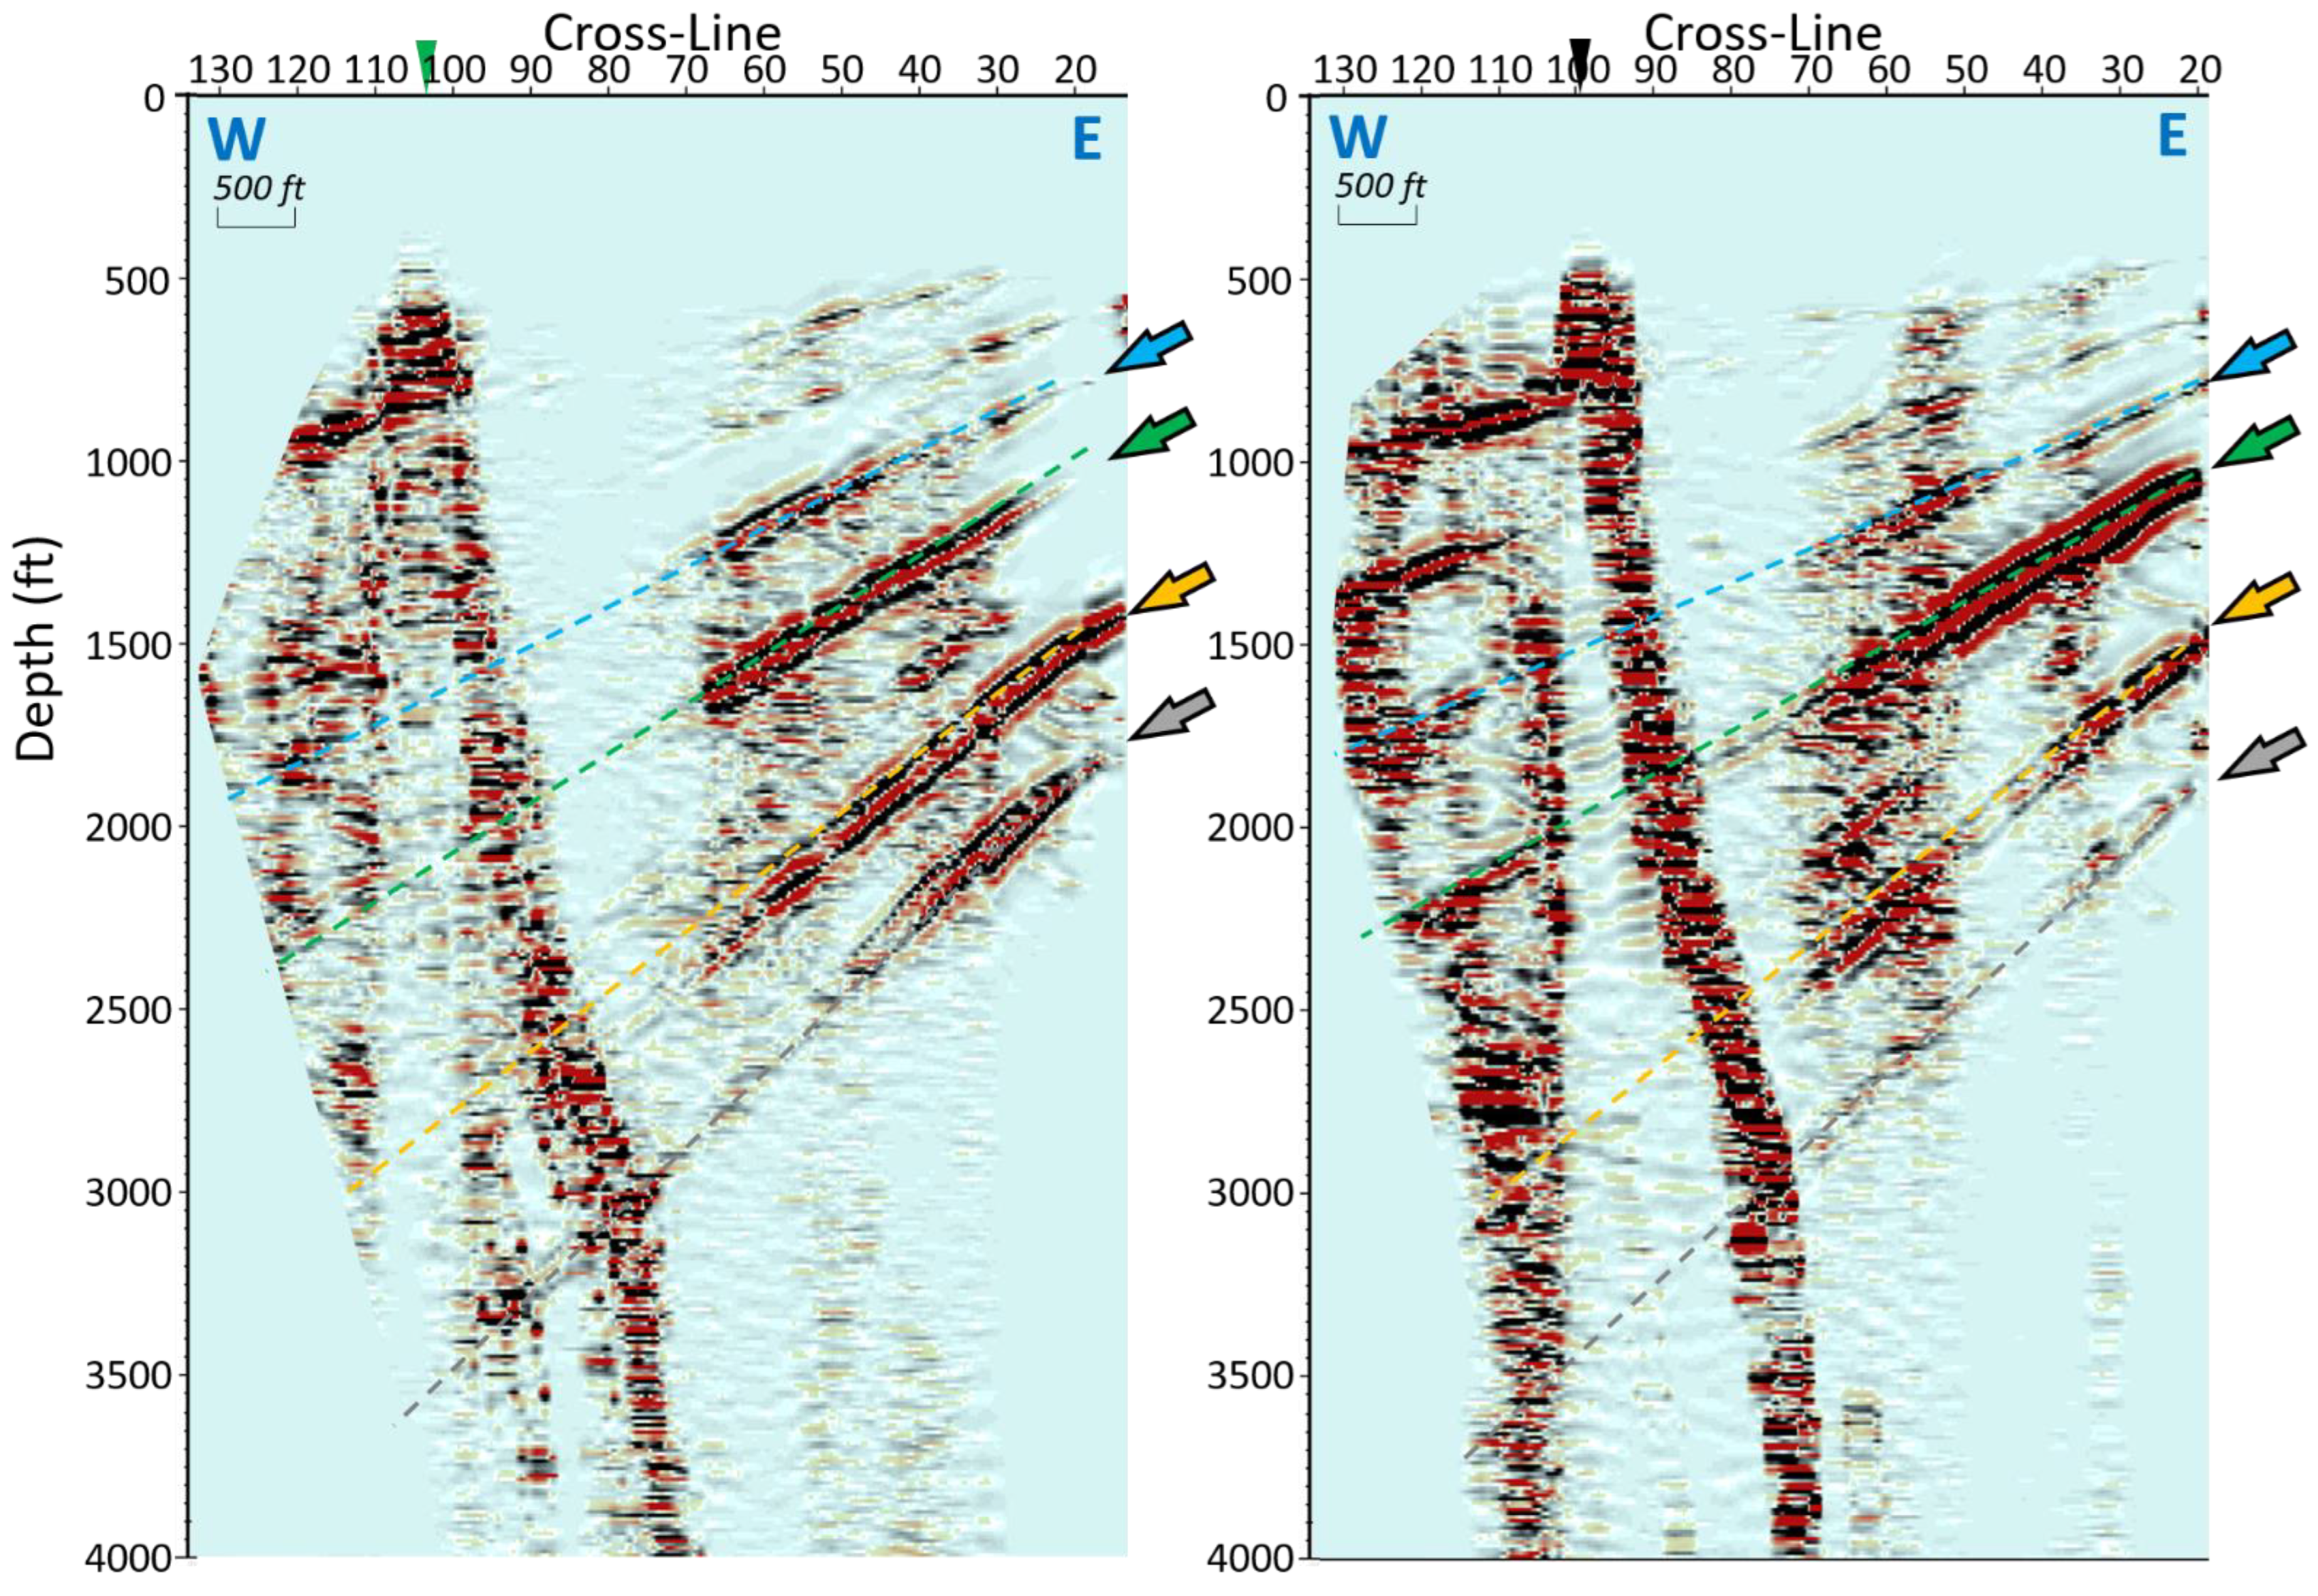
Figure 18.
Comparison of P-P migration images from wells 78A-32 (left) and 78B-32 (right). The inverted triangle indicates the wellhead. Four notable reflections (blue, green, yellow, and gray arrows) are imaged, and the yellow arrow indicates the basement contact.
Four notable west-dipping reflections were imaged at the depth of 1700 ft (518.16 m), 2100 ft (640.08 m), 2850 ft (868.68 m), and 3550 ft (1082.04 m) in well 78A-32, and 1500 ft (457.2 m), 2000 ft (609.6 m), 2750 ft (828.2 m), and 3450 ft (1051.56 m) in well 78B-32 (indicated by the blue, green, yellow, and gray dashed lines and arrows in the figure). By shifting the depth image to the same reference elevation as the velocity model (Figure 19), the evident reflection (yellow) is the interface between the basin fills and basement, where the actual depth from the surface is about 2550 ft (777.24 m) in well 78A-32 and 2450 ft (746.76 m) in well 78B-32. The depth of basement contact from the two wells is correlated to the top of the basement reported from the lithology log in both wells. Two shallow reflections within a 1000 ft (304.8 m) interval were also imaged in both wells, which could be related to the changes in basin sediment contents. The deepest reflection (gray) imaged by both wells is down to 3500 ft (1066.8 m) where beneath the basement contact, as reported in the lithology log, we interpreted that could indicate lithology change from granite to diorite.
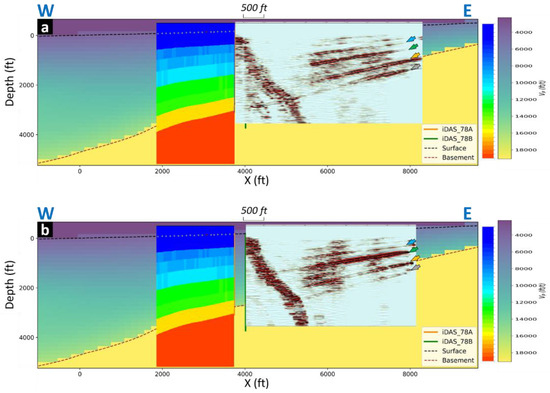
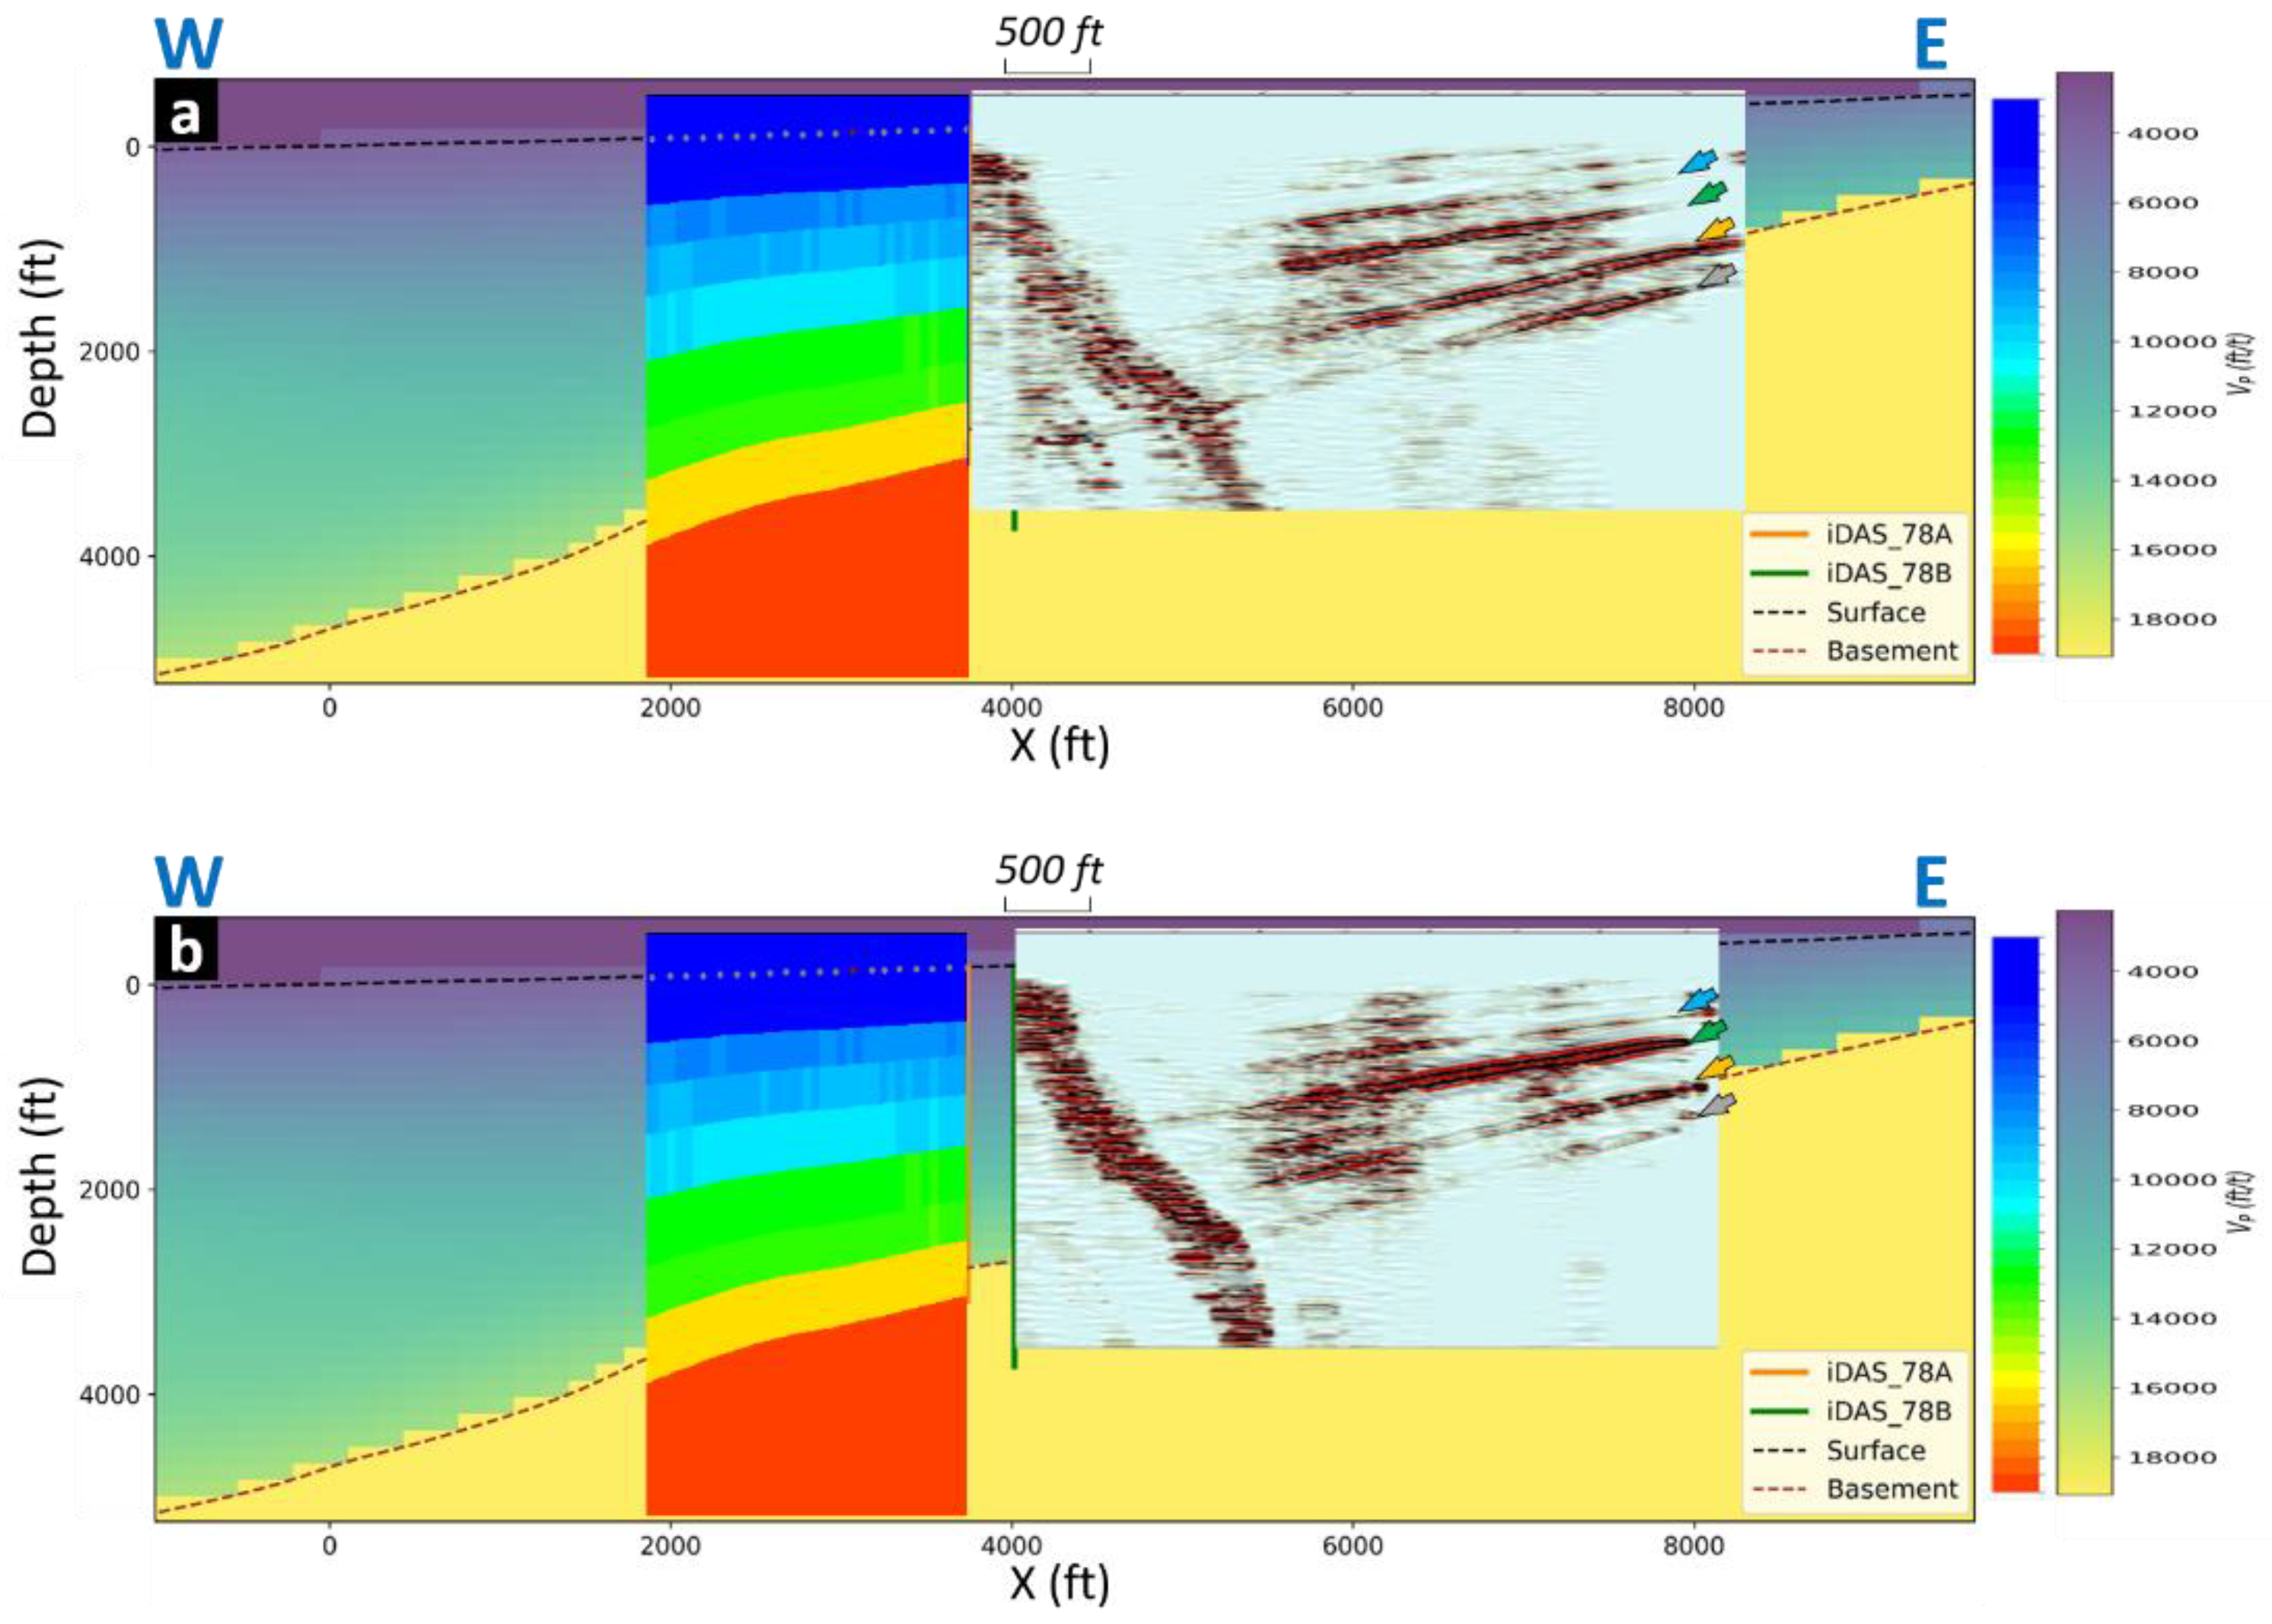
Figure 19.
Cross-section of migration velocity model and image overlay of the 3D P-wave velocity model. The migration images derived from wells 78A-32 (a) and 78B-32 (b) images four notable reflections (blue, green, yellow, and gray arrow) at the survey site. The yellow arrow indicates the basement contact.
6. Discussion
Since the role of the DAS in unconventional resource exploration was usually reservoir monitoring, the DAS VSP survey conducted at the geothermal site to image the reservoirs is still rare in the industry. A few known practical examples in the geothermal field were demonstrated at Brady Hot Springs, NV, USA [20], Ohuma geothermal power plant, Japan [21], and Groß Schönebeck, Germany [22]. Although these datasets were acquired at different geothermal fields with unique acquisition settings, the results derived from processing the DAS data provide detailed velocity profiles and comparable images, which show the efficiency and reliability of DAS in geothermal reservoir imaging.
In this paper, we also analyzed the attenuation factor and presented the impact of gauge length. To generate a comparable Q estimation curve with the velocity profile and well log, we calculated the interval attenuation, which is equal to the reciprocal of Q value, between two DAS channels with a 334 ft (101.8 m) interval window moving across the entire DAS record. However, the interval attenuation measurement in the shallow section might be affected by the source energy where high attenuation occurs in the Q estimation from both wells. The measurements calculated from the deeper section were controlled by the SNR. The gauge length effect was demonstrated by the interval attenuation which was calculated between two fixed depths.
The reflections attributed to the basement contact in our depth images agree with the surface seismic reflection results. [23] present a cross-section image from the 3D surface seismic reflection survey that indicates two distinct lithofacies, basin-fill sediments, and crystalline basement rocks, beneath wells 78A-32 and 78B-32. The top of the basement from the reflection images is about 800 m (~2624 ft) from the ground surface. We also correlated the depth images with the reverse-time migration (RTM) images from well 78A-32 using [24]. The main reflections at 1000 ft (304.8 m), 1500 ft (457.2 m), 2200 ft (670.56 m), and 2650 ft (807.72 m) in our P-P from well 78A-32 show the correlation with the RTM image.
According to the current open-access documents and reports, three vibroseis sweeps were performed at each shot location. Even though the DAS system gives complete coverage than the geophone, a low stacking number might produce a low SNR of DAS data. The subsurface geological complexity also exaggerates the difficulties in imaging as the final output will come with severe artifacts. In the previous section, we showed an example of complex wavefields captured by a DAS array with a far-offset source location, which indicates the subsurface complex structure in this survey area.
Combining the lithology logs, geological investigation results, and surface seismic reflection survey images, the Utah FORGE site is situated in the area covered by the young alluvial fan deposits with a thickness of over 2000 ft (609.6 m). The contact between the basin fill and basement, which forms an inclined ramp with 20–35 degrees dipping to the west, is the first notable change in the lithology beneath the monitoring well. The basement contact occurs at a measured depth of 2560 ft (780.29 m) in well 78A-32 and 2350 ft (716.28 m) in well 78B-32 [25]. The second lithological change can be found from the lithology log reached in the basement interval at about 3060 ft (932.69 m) from ground level, where the transition from granite to diorite occurs.
7. Conclusions
A 2D walkaway VSP survey was conducted after the hydraulic stimulation in southwest Utah, which is part of the enhanced geothermal system development project led by the U.S. Department of Energy and the University of Utah. This project is aimed at gaining a better understanding of detailed structure information, including seismic velocity models, physical properties, and seismic images. We started by building the velocity and analyzing the interval attenuation profiles from ZVSP acquired by two DAS arrays deployed in two nearby wells after applying the gauge-length correction, which presented the huge impact caused by the gauge length on DAS data. Next, along with processing and imaging the P-P event, depth images obtained from the walkaway DAS VSP image groups of acoustic impendence contrasts that correspond to the lithological changes. In particular, the major interface between basin fills, mainly composed of young alluvial deposits, and the basement, consisting of granite and diorite, presents at the depth of 2650 ft (807.72 m) and 2300 ft (701.04 m) in wells 78A-32 and 78B-32 individually. The joint velocity model of this research and the previous studies share a better estimation for further usage in seismic imaging and modeling. Additionally, the correlated depth images provide a baseline product for subsequent time-lapse imaging.
Author Contributions
Conceptualization, Y.-K.W. and R.R.S.; methodology, Y.-K.W.; software, Y.-K.W.; validation, Y.-K.W.; formal analysis, Y.-K.W.; resources, R.R.S.; writing—original draft preparation, Y.-K.W.; writing—review and editing, Y.-K.W. and R.R.S.; visualization, Y.-K.W.; supervision, R.R.S.; project administration, R.R.S.; funding acquisition, R.R.S. All authors have read and agreed to the published version of the manuscript.
Funding
This research received no external funding.
Data Availability Statement
All DAS and information are made openly accessible by the Frontier Observatory for Research in Geothermal Energy (FORGE) project. The data and well logs are available at the Utah FORGE project website (https://utahforge.com/project-data-dashboard/ (accessed on 15 February 2024)) and the Geothermal Data Repository website (https://gdr.openei.org/submissions/all (accessed on 15 February 2024)).
Acknowledgments
We would like to thank the Utah FORGE project for the walkaway DAS VSP dataset and Schlumberger for the VISTA 2021 software license.
Conflicts of Interest
The authors declare no conflicts of interest.
References
- Li, Q.; Hornby, B.; Konkler, J. A permanent borehole fiber-optic distributed acoustic sensing experiment. In SEG Technical Program Expanded Abstracts 2013; Society of Exploration Geophysicists: Tulsa, OK, USA, 2020; pp. 5057–5061. [Google Scholar]
- Karrenbach, M.; Cole, S.; Ridge, A.; Boone, K.; Kahn, D.; Rich, J.; Silver, K.; Langton, D. DAS microseismic, strain and temperature monitoring during hydraulic fracturing. Geophysics 2019, 84, D11–D23. [Google Scholar] [CrossRef]
- Karrenbach, M.; Kahn, D.; Cole, S.; Ridge, A.; Boone, K.; Rich, J.; Silver, K.; Langton, D. Hydraulic-fracturing-induced strain and microseismic using in situ distributed fiber-optic sensing. Leading Edge 2017, 36, 837–844. [Google Scholar] [CrossRef]
- Hull, R.; Meek, R.; Bello, H.; Woller, K.; Wagner, J. Monitoring horizontal well hydraulic stimulations and geomechanical deformation processes in the unconventional shales of the Midland Basin using fiber-based time-lapse VSPs, microseismic, and strain data. Leading Edge 2019, 38, 130–137. [Google Scholar] [CrossRef]
- Lellouch, A.; Yuan, S.; Ellsworth, W.L.; Biondi, B. Velocity-based earthquake detection using downhole distributed acoustic sensing—Examples from the San Andreas Fault Observatory at Depth. Bull. Seismol. Soc. Am. 2019, 109, 2491–2500. [Google Scholar] [CrossRef]
- Lellouch, A.; Yuan, S.; Spica, Z.; Biondi, B.; Ellsworth, W.L. Seismic velocity estimation using passive downhole distributed acoustic sensing records: Examples from the San Andreas Fault Observatory at Depth. J. Geophys. Res. Solid Earth 2019, 124, 6931–6948. [Google Scholar] [CrossRef]
- Lellouch, A.; Lindsey, N.J.; Ellsworth, W.L.; Biondi, B.L. Comparison between Distributed Acoustic Sensing and Geophones: Downhole Microseismic Monitoring of the FORGE Geothermal Experiment. Seismol. Res. Lett. 2020, 91, 3256–3268. [Google Scholar] [CrossRef]
- Li, D.; Huang, L.; Zheng, Y.; Li, Y.; Wannamaker, P.; Moore, J. Feasibility of source-free DAS logging for next-generation borehole imaging. Sci. Rep. 2022, 12, 1–13. [Google Scholar] [CrossRef] [PubMed]
- Moore, J.; McLennan, J.; Allis, R.; Pankow, K.; Simmons, S.; Podgorney, R.; Wannamaker, P.; Bartley, J.; Jones, C.; Rickard, W. The Utah Frontier Observatory for Research in Geothermal Energy (FORGE): An international laboratory for Enhanced Geothermal System technology development. In Proceedings of the 44th Workshop on Geothermal Reservoir Engineering Stanford University, Stanford, CA, USA, 11–13 February 2019. 12p. [Google Scholar]
- Moore, J.; McLennan, J.; Allis, R.; Pankow, K.; Simmons, S.; Podgorney, R.; Wannamaker, P.; Jones, C.; Rickard, W.; Xing, P. The Utah Frontier Observatory for Research in Geothermal Energy (FORGE): A Laboratory for Characterizing, Creating and Sustaining Enhanced Geothermal Systems. In Proceedings of the 45th Workshop on Geothermal Reservoir Engineering Stanford University, Stanford, CA, USA, 10–12 February 2020. 10p. [Google Scholar]
- Kirby, S.M.; Simmons, S.; Inkenbrandt, P.C.; Smith, S. Groundwater hydrogeology and geochemistry of the Utah FORGE site and vicinity. In Geothermal Characteristics of the Roosevelt Hot Springs System and Adjacent FORGE EGS Site, Milford, Utah: Utah Geological Survey Miscellaneous Publication; Allis, R., Moore, J.N., Eds.; Utah Geological Survey: Milford, UT, USA, 2019; Volume 169-E, pp. 1–21. [Google Scholar]
- Simmons, S.F.; Kirby, S.; Allis, R.; Wannamaker, P.; Moore, J. A revised geoscientific model for FORGE Utah EGS Laboratory. In Proceedings of the 43th Workshop on Geothermal Reservoir Engineering Stanford University, Stanford, CA, USA, 12–14 February 2018. 8p. [Google Scholar]
- Simmons, S.F.; Kirby, S.; Allis, R.; Wannamaker, P.; Moore, J. Update on the geoscientific understanding of the Utah FORGE site. In Proceedings of the 44th Workshop on Geothermal Reservoir Engineering Stanford University, Stanford, CA, USA, 11–13 February 2019. 10p. [Google Scholar]
- Wang, Y.-K.; Stewart, R.R. 3D VSP Imaging Using DAS Recording of P- and S-Waves in Vertical and Lateral Well Sections in West Texas. Sensors 2024, 24, 3044. [Google Scholar] [CrossRef] [PubMed]
- Sayed, A.; Ali, S.; Stewart, R.R. Distributed acoustic sensing (DAS) to velocity transform and its benefits. In SEG Technical Program Expanded Abstracts 2020; Society of Exploration Geophysicists: Tulsa, OK, USA, 2020; pp. 3788–3792. [Google Scholar] [CrossRef]
- Sayed, A.; Khaitan, M.L.; Ali, S.; Martinez, A. Characterizing anelastic attenuation using distributed acoustic sensing (DAS) data. In Proceedings of the First International Meeting for Applied Geoscience & Energy Technical Program Expanded Abstracts; Society of Exploration Geophysicists, Tulsa, OK, USA, 27 September 2021; pp. 3505–3509. [Google Scholar] [CrossRef]
- Finger, C.; Niemz, P.; Ermert, L.; Lanza, F. Utah FORGE: Composite 3D Seismic Velocity Model. USA. 2024. Available online: https://gdr.openei.org/submissions/1585 (accessed on 28 February 2024).
- Zhang, H.; Pankow, L.K. High-resolution Bayesian spatial autocorrelation (SPAC) quasi-3-D Vs model of Utah FORGE site with a dense geophone array. Geophys. J. Int. 2021, 225, 1605–1615. [Google Scholar] [CrossRef]
- Podgorney, R. Utah FORGE: Earth Model Mesh Data for Selected Surfaces. USA. 2018. Available online: https://gdr.openei.org/submissions/1107 (accessed on 1 March 2024).
- Trainor-Guitton, W.; Guitton, A.; Jreij, S.; Powers, H.; Sullivan, B. 3D Imaging of Geothermal Faults from a Vertical DAS Fiber at Brady Hot Spring, NV USA. Energies 2019, 12, 1401. [Google Scholar] [CrossRef]
- Kasahara, J.; Hasada, Y.; Kuzume, H.; Mikada, H.; Fujise, Y. A DAS-VSP Study Around the Geothermal Field of the Ohnuma Geothermal Power Plant in Northern Honshu, Japan. In Proceedings of the 46th Workshop on Geothermal Reservoir Engineering, Stanford, CA, USA, 16–18 February 2021. 10p. [Google Scholar]
- Martuganova, E.; Stiller, M.; Norden, B.; Henninges, J.; Krawczyk, C.M. 3D deep geothermal reservoir imaging with wireline distributed acoustic sensing in two boreholes. Solid Earth 2022, 13, 1291–1307. [Google Scholar] [CrossRef]
- Miller, J.; Allis, R.; Hardwick, C. Interpretation of Seismic Reflection Surveys Near the FORGE Enhanced Geothermal Systems Site, Utah. In Geothermal Characteristics of the Roosevelt Hot Springs system and adjacent FORGE EGS Site, Milford, Utah: Utah Geological Survey Miscellaneous Publication; Allis, R., Moore, J.N., Eds.; Utah Geological Survey: Milford, UT, USA, 2019; p. 169. [Google Scholar]
- Nakata, N.; Vasco, D.W.; Shi, P.; Bai, T.; Lanza, F.; Dyer, B.; Chen, C.; Park, S.; Qiu, H. Elastic Characterization at Utah FORGE: P-wave Tomography and VSP Subsurface Imaging. In Proceedings of the 48th Workshop on Geothermal Reservoir Engineering Stanford University, Stanford, CA, USA, 6–8 February 2023. 12p. [Google Scholar]
- Moore, J.; McLennan, J.; Pankow, K.; Finnila, A.; Dyer, B.; Karvounis, D.; Bethmann, F.; Podgorney, R.; Rutledge, J.; Meir, P.; et al. Current activities at the Utah frontier observatory for research in geothermal energy (FORGE): A laboratory for characterizing, creating and sustaining enhanced geothermal systems. In Proceedings of the 51st US Rock Mechanics/Geomechanics Symposium, Atlanta, GA, USA, 25–28 June 2023. 11p. [Google Scholar]


Disclaimer/Publisher’s Note: The statements, opinions and data contained in all publications are solely those of the individual author(s) and contributor(s) and not of MDPI and/or the editor(s). MDPI and/or the editor(s) disclaim responsibility for any injury to people or property resulting from any ideas, methods, instructions or products referred to in the content. |
© 2024 by the authors. Licensee MDPI, Basel, Switzerland. This article is an open access article distributed under the terms and conditions of the Creative Commons Attribution (CC BY) license (https://creativecommons.org/licenses/by/4.0/).