Article

Coordinated Charging Scheduling Approach for Plug-In Hybrid Electric Vehicles Considering Multi-Objective Weighting Control in a Large-Scale Future Smart Grid

1
College of Information and Electrical Engineering, Hangzhou City University, Hangzhou 310015, China
2
College of Information Engineering, Zhejiang University of Technology, Hangzhou 310023, China
*
Author to whom correspondence should be addressed.
Energies 2024, 17(13), 3148; https://doi.org/10.3390/en17133148
Submission received: 26 May 2024 / Revised: 20 June 2024 / Accepted: 22 June 2024 / Published: 26 June 2024
(This article belongs to the Section A1: Smart Grids and Microgrids)

Abstract

:
The growing popularity of plug-in hybrid electric vehicles (PHEVs) is due to their environmental advantages. But uncoordinated charging of a large number of PHEVs can lead to a significant surge in peak loads and higher charging costs for PHEV owners. To end this, this paper introduces an innovative approach to address the issue by proposing a multi-objective weighting control for coordinated charging of PHEVs in a future smart grid, which aims to find an economically optimal solution while also considering load stabilization with large-scale PHEV penetration. Technical constraints related to the owner’s demand and power limitations are considered. In the proposed approach, the charging behavior of PHEV owners is modeled by a normal distribution. It is observed that owners typically start charging their vehicles when they arrive home and stop charging when they go to their workplace. The charging cost is then calculated based on the tiered electricity price and charging power. By adjusting the cost weighting factor and the load stability weighting factor in the multi-objective function, the grid allows for flexible weight selection between the two objectives. This approach effectively encourages owners to actively participate in coordinated charging scheduling, which sets it apart from existing works. The algorithm offers better robustness and adaptability for large-scale PHEV penetration, making it highly relevant for the future smart grid. Finally, numerical simulations are presented to demonstrate the desirable performance of theory and simulation.

1. Introduction

As a sustainable and environmentally friendly mode of transportation, plug-in hybrid electric vehicles (PHEVs) are highly favored due to their ability to travel long distances using both combustion engines and batteries [1]. This feature helps reduce fuel consumption and makes them more eco-friendly. Consequently, PHEVs offer an alternative for developing cleaner transportation systems and have great potential for sustainable transport development [2]. Additionally, PHEVs seamlessly integrate into intelligent transportation systems, elevating the quality of smart transportation services [3].
The increasing prevalence of PHEVs presents formidable challenges for the operation of smart grids [4]. Specifically, uncoordinated charging of PHEVs can lead to a surge in electrical load, exacerbating current peak loads or causing new peaks. Furthermore, PHEV charging has the potential to overload distribution network equipment, such as transformers, resulting in shortened service life, significant voltage deviations from their ratings, and exposing the power system to serious safety risks [5]. Additionally, the aging and high maintenance costs of PHEV batteries are often considered major impediments for PHEV applications. To address these issues effectively, it is imperative to optimize the centralized charging of large-scale PHEVs within the smart grid so that electric vehicles can be fully utilized as flexible loads to effectively manage peak demand [6].
With the rapid development of sensor and communication technologies, extensive research has been undertaken by scholars on PHEV charging timing and power. Reference [7] employed a demand-side management (DSM) scheduling scheme for plug-in hybrid charging, which took into consideration user consumption patterns to align with the current or predicted power supply capacity of the system. The authors of reference [8] proposed a demand response strategy to mitigate peak loads on transformers in residential distribution networks. References [9,10] presented a decentralized charging control scheme aimed at optimizing load valley filling and shifting the controllable load of PHEVs to periods with lower congestion, thereby enhancing overall power valley value. Reference [11] pointed out that DSM is an integral component of the distribution network, leveraging existing infrastructure to bolster grid stability and reduce total costs for vehicle owners within the grid. However, it predominantly focuses on peak–valley load disparities on the power supply side while often neglecting the user’s charging requirements such as end-of-charge battery levels and corresponding charging costs [12]. The references [13,14] are relevant to battery energy management strategies (EMSs). Specifically, reference [13] discusses the necessity of adopting a health-oriented energy management strategy, as well as the essential tools required for this strategy, such as health monitoring techniques. To ensure the continuous optimal performance of vehicles, Jia Chunchun et al. [14] proposed an innovative health-conscious electric vehicle management system framework based on a dual-delay deep deterministic policy gradient (TD3) algorithm for fuel cell hybrid buses. The results indicated that the proposed EMS demonstrates a 28.02% enhancement in battery life compared to the leading EMS based on TD3 and an overall improvement of 8.92% in vehicle economy. In contrast to the aforementioned literature, this study considers the end-charging battery level of PHEV users and integrates their emergency charging requirements as constraint conditions to promote active engagement in collaborative charging scheduling instead of the autonomous battery energy management of individual EVs.
In practice, the charging needs of PHEV owners exhibit variability, particularly in cases where certain PHEVs have specific requirements for minimizing operational costs. To bridge this gap, a load-shifting service for the coordinated charging of PHEVs is introduced in [15], taking into account economic issues for vehicle owners’ operations. It is suggested that in a future smart grid, integrating energy providers (e.g., wind and solar) and residential flexible loads (e.g., PHEVs) together, a multi-objective optimization problem should be considered. This problem would involve providing load-shifting services for the energy source and minimizing total costs for vehicle owners in the network [16]. As a result, various objective functions are employed for PHEV charging scheduling, encompassing the minimization of power losses [17,18], maximizing operation profits [19] and minimizing peak load [20]. Various algorithms have been employed to address these optimization problems, including interior-point methods [21], particle swarm optimization (PSO) algorithms [22], and enhanced PSO algorithm [23,24]. However, it is important to note that these approaches can lead to significantly increased computational complexities and may fail to find a global optimal solution. Moreover, the existing literature on this topic lacks a unified modeling approach for the access and departure of large-scale electric vehicles, making it difficult to directly apply the methods to future smart grids with a high penetration of electric vehicles. Compared with the above literature, this study modeled the charging behavior of PHEV users through statistical data and characterized it as a normal distribution, which exhibits strong scalability for large-scale PHEV integration in the future smart grid.
In relation to this paper, reference [25] is more highly relevant. The author of Ref. [25] proposes a sophisticated coordinated charging scheduling method for electric vehicles in a microgrid, aimed at shifting the load demand from peak to valley periods. This innovative model involves selecting the charging mode of electric vehicles based on the charging emergency index reflecting different levels of charging demand and establishing a meticulously designed coordinated charging scheduling optimization model to minimize the overall difference between peak and valley loads. However, it is noteworthy that the state-of-art work [25] solely focuses on load balancing and overlooks the impact of charging period prices on user charges. Therefore, while flattening the load curve remains crucial for energy distribution systems, structuring energy billing processes from a consumer’s perspective is paramount in minimizing their total payout at the end of each day, thereby providing an incentive for consumers to actively participate in the charging phase. In contrast to [25], this study integrates the issue of load balancing with the objective of minimizing users’ electricity costs through weighted factors in the objective function. This approach not only provides guidance for load optimization on the power supply side of the grid but also actively promotes user participation in cooperative charging scheduling.
Due to the absence of an effective and practical scheme for multi-objective weighting control of large-scale PHEV coordinated charging, this research aims to address the challenge of load stabilization and develop an economically feasible solution based on tiered electricity pricing considering weighting factors. The key contributions of this paper are summarized as follows:
(1)
A model of multi-objective optimization is established, incorporating the constraint of the owner’s emergence charging demand. By adjusting the cost weighting factor and the load stability weighting factor in the multi-objective function, the grid allows for flexible weight selection between owners to actively participate in coordinated charging scheduling, setting it apart from existing works.
(2)
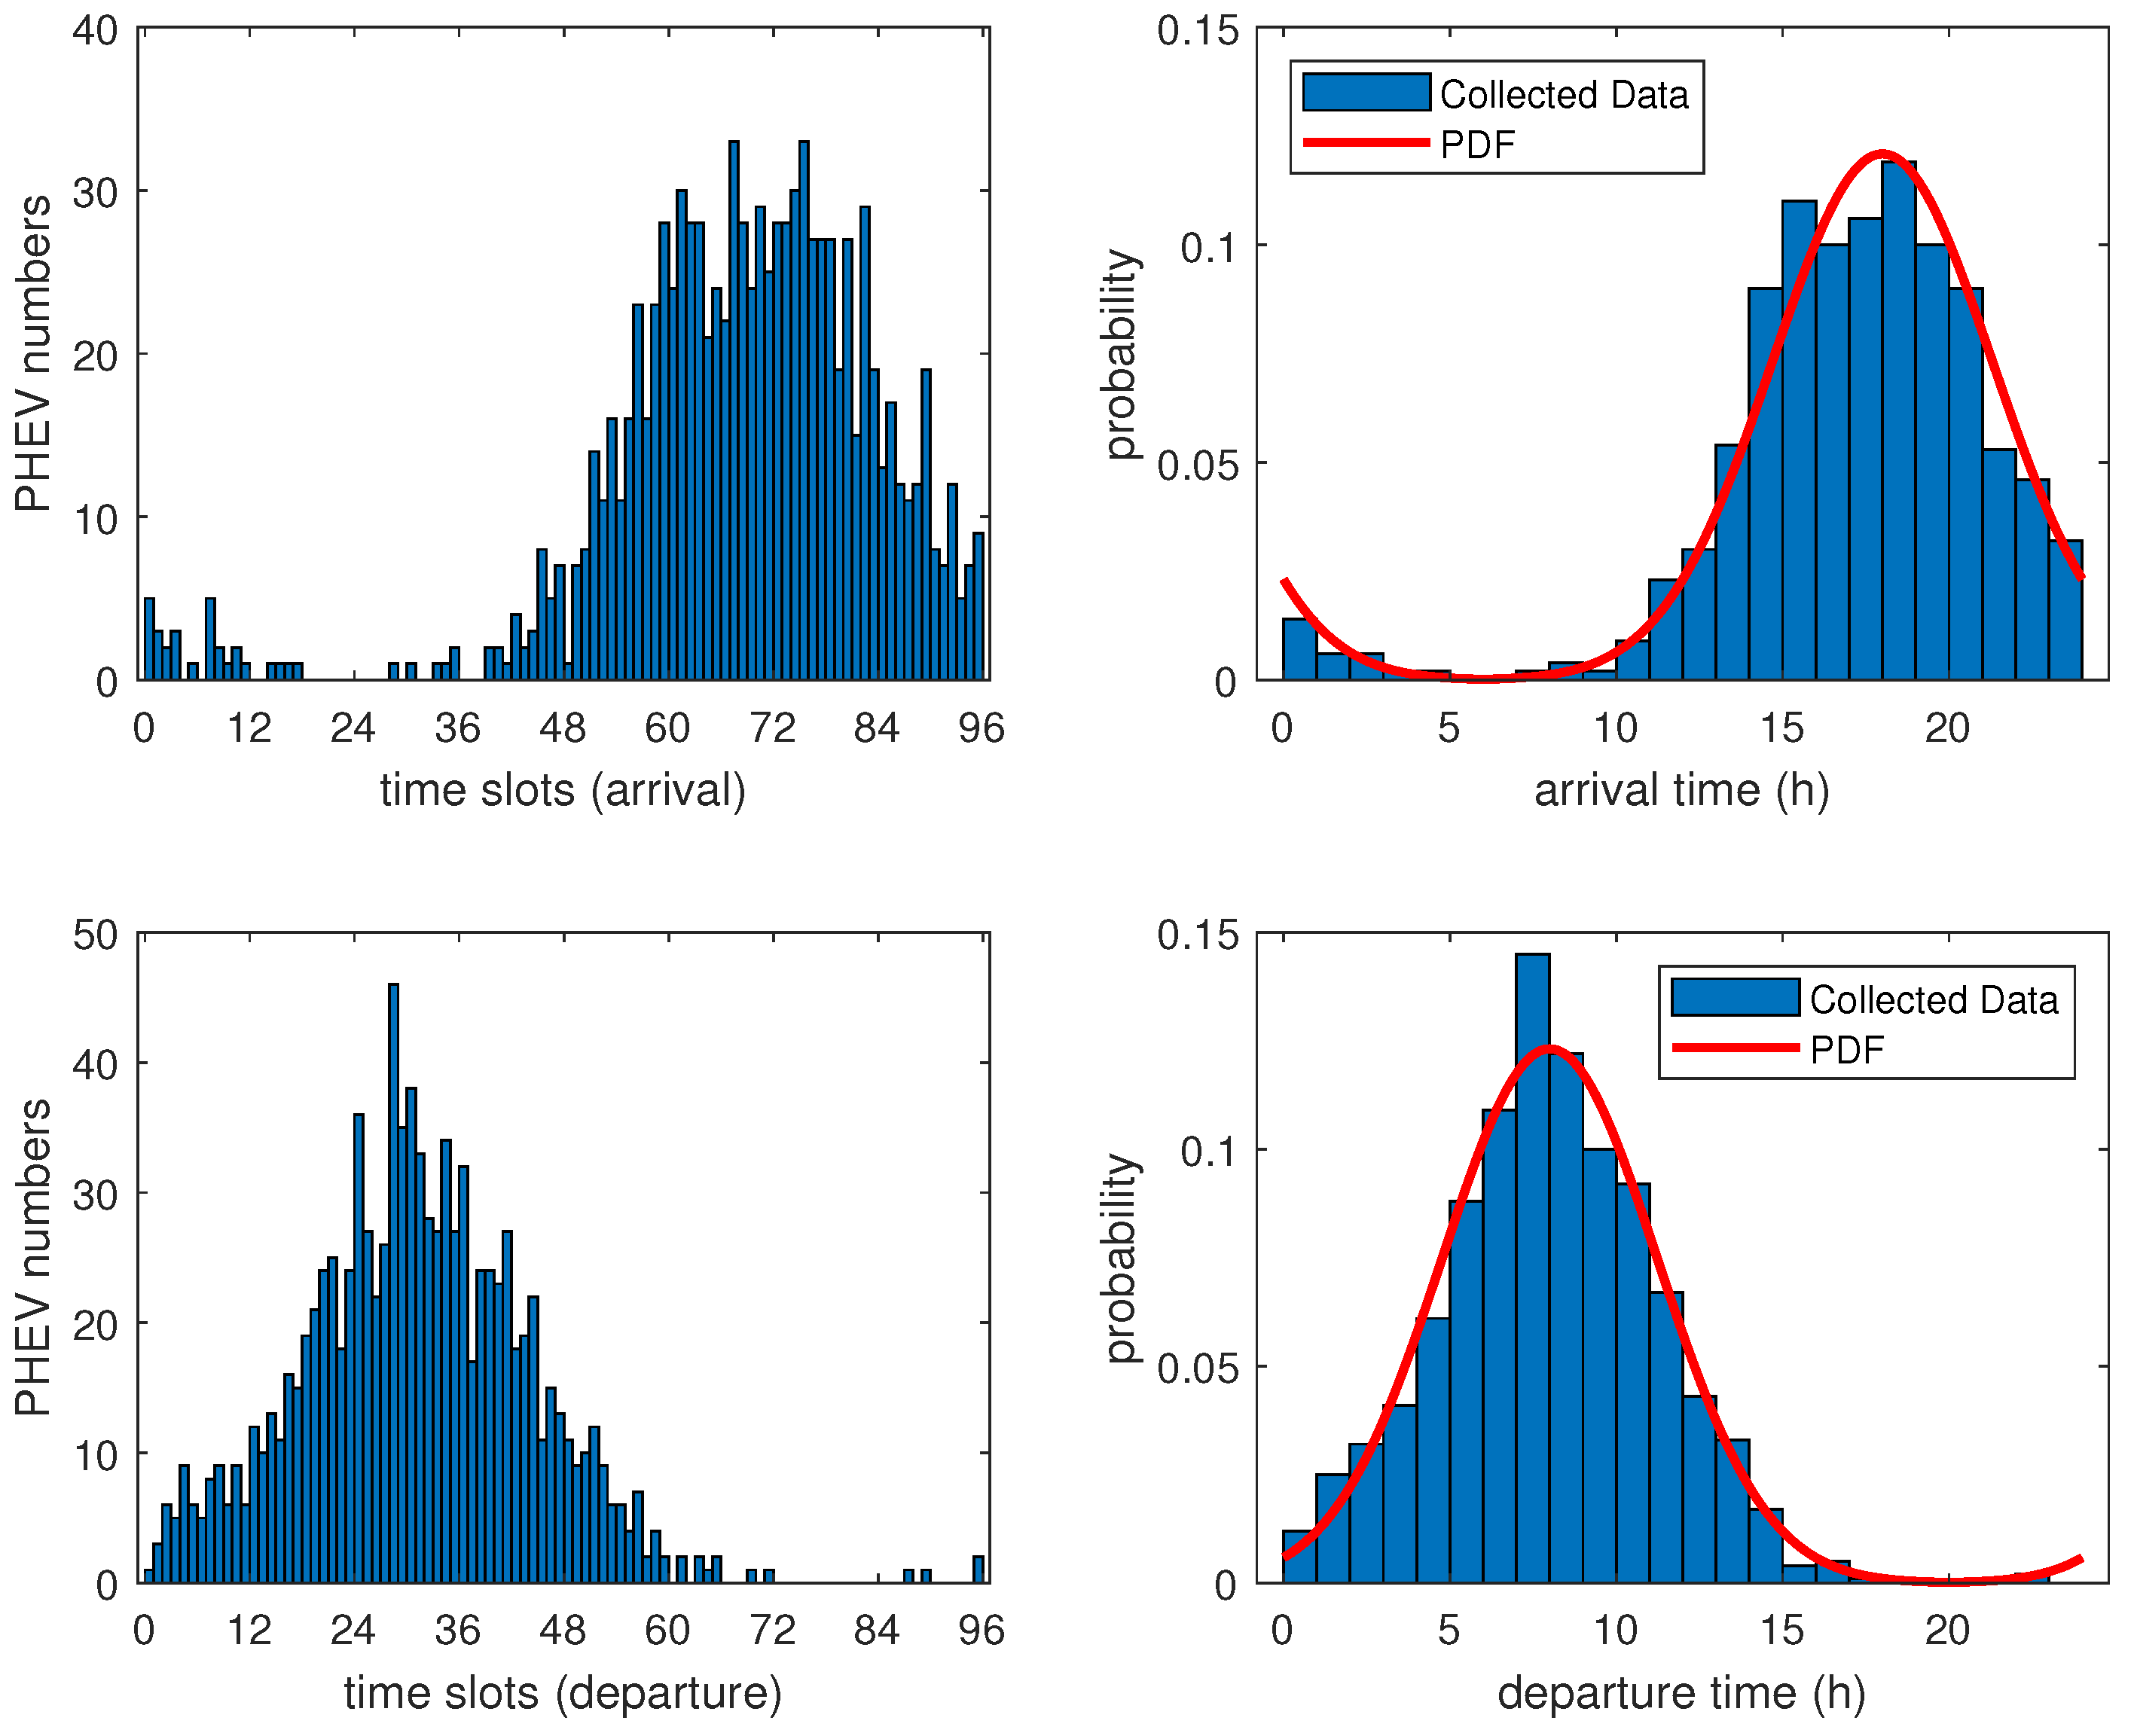
The charging behavior of PHEV owners in this paper is characterized by a normal distribution, which represents a more comprehensive approach compared to the existing literature. It is evident that owners typically initiate the charging process upon arriving home and conclude it when departing for their workplace. Moreover, the end-charging battery level of PHEV users and their emergency charging requirements are integrated as constraint conditions to encourage and promote active engagement in collaborative charging scheduling.
(3)
The proposed algorithm is suitable for future smart grids with a large number of electric vehicles, demonstrating excellent scalability and adaptability to various charging scenarios compared to existing state-of-the-art solutions. This makes it more convenient and provides better performance for grid implementation.
The rest of this paper is structured as follows: Section 2 introduces the system model of the PHEV charging scheduling, and Section 3 outlines the problem formulation. The main results and discussions of numerical simulations are included in Section 4 to demonstrate the effectiveness of the proposed model. Finally, we conclude this paper and discuss future work in Section 5.

2. System Model

2.1. Future Smart Grid Modeling

With the advancement of internet of things (IoT) technology [26] in the future smart grid, the monitoring of electrical energy information transmission within the grid can be achieved not only through energy flow but also through information flow. The focus of our research involves the development of a multi-layer framework, as depicted in Figure 1, to facilitate the coordination of PHEV charging within the future smart grid. The power grid acts as an energy provider, and the control centre sends control messages based on the electricity demands. In the energy-consumption level, there are several energy consumption areas composed of a population of PHEVs and a functional district such as a commercial building, power plant, or housing district. Inside an area, moreover, if the PHEVs are charging their batteries, the electricity load of this area will increase accordingly. All the electricity demands in the area constitute an aggregated load to the entire grid, and different areas are independent of each other. The objective of load balance optimization is a crucial aspect of the power grid, leading to enhanced overall load balance. However, PHEV consumers focus on minimizing electricity costs for their charging process.
In addition, the power dispatch center strategically plans the generation of electric vehicle power by considering the overall electricity demand in the energy-provision level. Its primary goal is to stabilize load fluctuation and minimize peak–valley differences through energy trading and price declaration. On the other hand, the lower layer focuses on fulfilling the energy charging requirements of electric vehicles, taking into account their access and exit time constraints and other technical constraints. This is achieved by actively interacting with energy and price information. The hierarchical scheduling framework offers several advantages. It allows for the integration of multiple optimization objectives and constraints into a unified model, which serves as a solid foundation for the development of cooperative optimal scheduling algorithms for electric vehicle clusters based on the energy flow and information flow in the future smart grid.

2.2. Typical Basic Load Profile

In this investigation, the load curve has been shifted forward by 12 h, resulting in a scheduling cycle from midday to midday on the subsequent day. Figure 2 shows the typical load curve of the local microgrid under the daily cycle scenario, in which the peak periods occur at around 18:00 h, 06:00 h, and 10:00 h. The maximum power demand is 710 kW, while the minimum power demand is 445 kW.
The base load curve shows that the peaks in electricity consumption are during the day, while the valleys in electricity consumption are at night. In particular, the electricity load is lowest between 12:00 pm and 02:00 am. Therefore, based on the base load curve in Figure 2, the price of electricity consumption during peak and valley periods can be further defined. That is, the high price of electricity consumption during the peak period leads to the high cost of users charging their PHEVs, and users may be reluctant to charge during the peak period, which can slow down the load pressure during the peak period. The low price of electricity during the trough period encourages users to charge their PHEVs, thus increasing the overall load level.

2.3. PHEV Charging Behavior Modeling

In this study, the scheduling period is partitioned into multiple intervals, with each day being divided into 96 time slots, each lasting for 15 min. Furthermore, we designate the arrival and departure times of the i-th PHEV as t i c and t i d i s . The time slot for the arrival and departure of the i-th PHEV can then be expressed as
J i c = t i c Δ T , i = 1 , 2 , , N .
and
J i d i s = t i d i s Δ T , i = 1 , 2 , , N .
where N denotes the quantity of PHEVs, while J i c , J i d i s { 1 , 2 , , 96 } indicate the time slot indices within a day. Δ T represents the duration of each time slot (15 min), and · signifies the ceiling function, whereas · denotes the floor function.
In this study, we assume that PHEV owners will immediately begin charging their vehicles upon returning home and complete the charging process before going to work. Considering that the charging time of EV users is basically obtained through large-scale data statistics, this paper concludes that the arrival and departure time of a PHEV follow the standard normal distribution as
f ( t c ) = 1 2 π σ t c exp ( t c + 24 μ t c ) 2 2 σ t c 2 ( 0 < t c μ t c 12 ) 1 2 π σ t c exp ( t c μ t c ) 2 2 σ t c 2 ( μ t c 12 < t c 24 )
and
f ( t d i s ) = 1 2 π σ t d i s exp ( t d i s μ t d i s ) 2 2 σ t d i s 2 ( 0 < t d i s μ t d i s + 12 ) 1 2 π σ t d i s exp ( t d i s 24 μ t d i s ) 2 2 σ t d i s 2 ( μ t d i s + 12 < t d i s 24 )
The probability density distributions of EV charging behaviors are obtained by fitting to the collected charging data for those EVs adopting home-charging. In this paper, we adopt Pearson’s Chi-squared test [27] to verify that a probability distribution exists that can properly fit the data. Firstly, according to the shape of the distribution, we construct a null hypothesis that the connection time of EVs follows a normal distribution with its probability density function. Then, the Chi-squared statistic by calculating as the formula mode in [27]. After that, the Chi-square distribution table gives a critical value at 95% significance level. Therefore, it is reasonable to assume that the connection time of EVs follows a normal distribution; moreover, the mean and standard deviation of this distribution is μ t c = 18 and σ t c = 3.3 , respectively. For the disconnection scenario, the mean and standard deviation of this distribution is μ t d i s = 8 and σ t d i s = 3.24 , respectively, where the mean determines the central tendency of the distribution, while standard deviation determines the dispersion or spread of the distribution.
Remark 1.
A normal distribution of PHEV charging behaviors can be derived from a random sample of 200 private EVs out of over 40,000 in Shenzhen for the investigation [28]. Following [28], the daily travel and charging information of EVs were obtained through an online questionnaire survey, and the collected charging data were used to determine the probability density distribution of their connection/disconnection time and state of charge (SoC) of batteries. Consequently, it is possible scientifically to simulate charging behaviors based on these data.
Based on Formulas (3) and (4), it is evident that the owner typically initiates charging upon returning home and ceases charging when leaving for work. This statistical significance and universality render it applicable to a range of scenarios, encompassing all-day charging modes that highlight the time frame for initiating and terminating charging. According to the aforementioned definition, the probability distribution of arrival and departure times for varying numbers of plug-in hybrid electric vehicles in plug-in hybrid charging mode can be obtained, as depicted in Figure 3.
In Figure 3, the red curve depicts the probability distribution functions (PDF) for the arrival and departure times of PHEVs, while the histogram illustrates the data generated based on the PDF using the Monte Carlo Simulation (MCS) method. As depicted in Figure 3, it is evident that PHEV owners typically arrive home at around 18:00 and depart for work at approximately 8:00. Thus, the generated data align with the behavioral patterns of individuals in PHEV charging.

3. Problem Formulation

3.1. Preliminaries

The total charging time for a PHEV is given by the following equations based on the definitions of the time slot for the arrival and departure as
T i c h = J i d i s J i c .
where T i c h denotes the number of charging time intervals during which the i-th PHEV can remain connected to the microgrid, and the formulation of charging behavior and scheduling strategy should be devised for these remaining time periods. Subsequently, the Charging Urgency Indicator (CUI) can be defined as
C U I i = ( T i c h · Δ T ) P s l o w η ( S O C i min S O C i c o n ) C a p b a t t e r y , i = 1 , 2 , , N , j = 1 , 2 , , 96 .
where the slow charging power of PHEV is denoted as P s l o w , η represents the charge efficiency, S O C i min represents the lower bound of SOC when the i-th PHEV ends its charging process, and S O C i c o n represents the SOC of the i-th PHEV when it is connected to the microgrid. Additionally, C a p b a t t e r y denotes the PHEV battery capacity (kWh). If C U I i < 0 , it indicates that the charging demand of the i-th PHEV owner is urgent; conversely, if C U I i 0 , it indicates that their charging demand is not urgent. As a result, there are two charging modes determined by CUI which can be defined as
P i = P s l o w , C U I i 0 . P f a s t , C U I i < 0 .
where P f a s t represents the power for fast charging, and P s l o w represents the power for slow charging.
In the context of optimizing PHEV coordinated charging, let x i j be used to denote the state of charge variable. If x i j = 0 , it indicates that the i-th PHEV is not in a charging state. Otherwise, if x i j = 1 , it indicates that the i-th PHEV is in a charging state. Therefore, one can draw the inference that
x i j = 1 , in charging . 0 , not in charging .

3.2. Optimization Objective Description

The aim of this study is to ascertain an economically optimal solution while also considering load stabilization to alleviate the peak load pressure of the smart grid. Owing to the substantial variability of electricity prices for users at different times of day, this paper investigates peak and off-peak tariffs on a daily cycle (from 12:00 noon ( k = 12 ) to 12:00 noon the following day ( k = 36 )) [29].
p r i c e _ h o u r ( k ) = 1.6 , 1.4 , 1.2 , 0.95 , 0.9 , 1.0 , 1.2 , 1.6 , 1.4 , 1.0 , 0.8 , 0.7 . ( k = 12 , 13 , , 23 ) 0.6 , 0.6 , 0.7 , 0.8 , 0.9 , 1.0 , 1.1 , 1.2 , 1.4 , 1.6 , 1.7 , 1.8 . ( k = 24 , 25 , , 36 )
Therefore, the electricity price for each time slot during the charging process can be expressed as follows:
p r i c e ( j ) = p r i c e _ h o u r j 4 , j = 1 , 2 , , 96 .
Then, the charging cost minimization for the i-th PHEV is presented as
f ( x ) = min j = 1 96 P i x i j · p r i c e ( j )
The total load of the microgrid at the time slot j in the coordinated charging scheduling model comprises both the baseline load and the PHEV charging load, encompassing fast charging mode and slow charging mode. Consequently, the total load for the j-th time slot within the coordinated charging scheduling model can be articulated in the following manner:
P t o t a l j = P c o n j + i = 1 N P i · x i j
where P c o n j denotes the fundamental load at time slot j, and i = 1 N P i · x i j represents the aggregate power supplied by all PHEVs during that period. If a specific PHEV requires immediate charging, then P i = P f a s t ; otherwise, set P i = P s l o w . The aim of load-stabilizing charging scheduling is to minimize the difference between peak and off-peak loads in the microgrid. This can be expressed mathematically as
g ( x ) = min P t o t a l max P t o t a l min
where P t o t a l max and P t o t a l min are used to denote the highest and lowest load demand.

3.3. Optimization Constraints
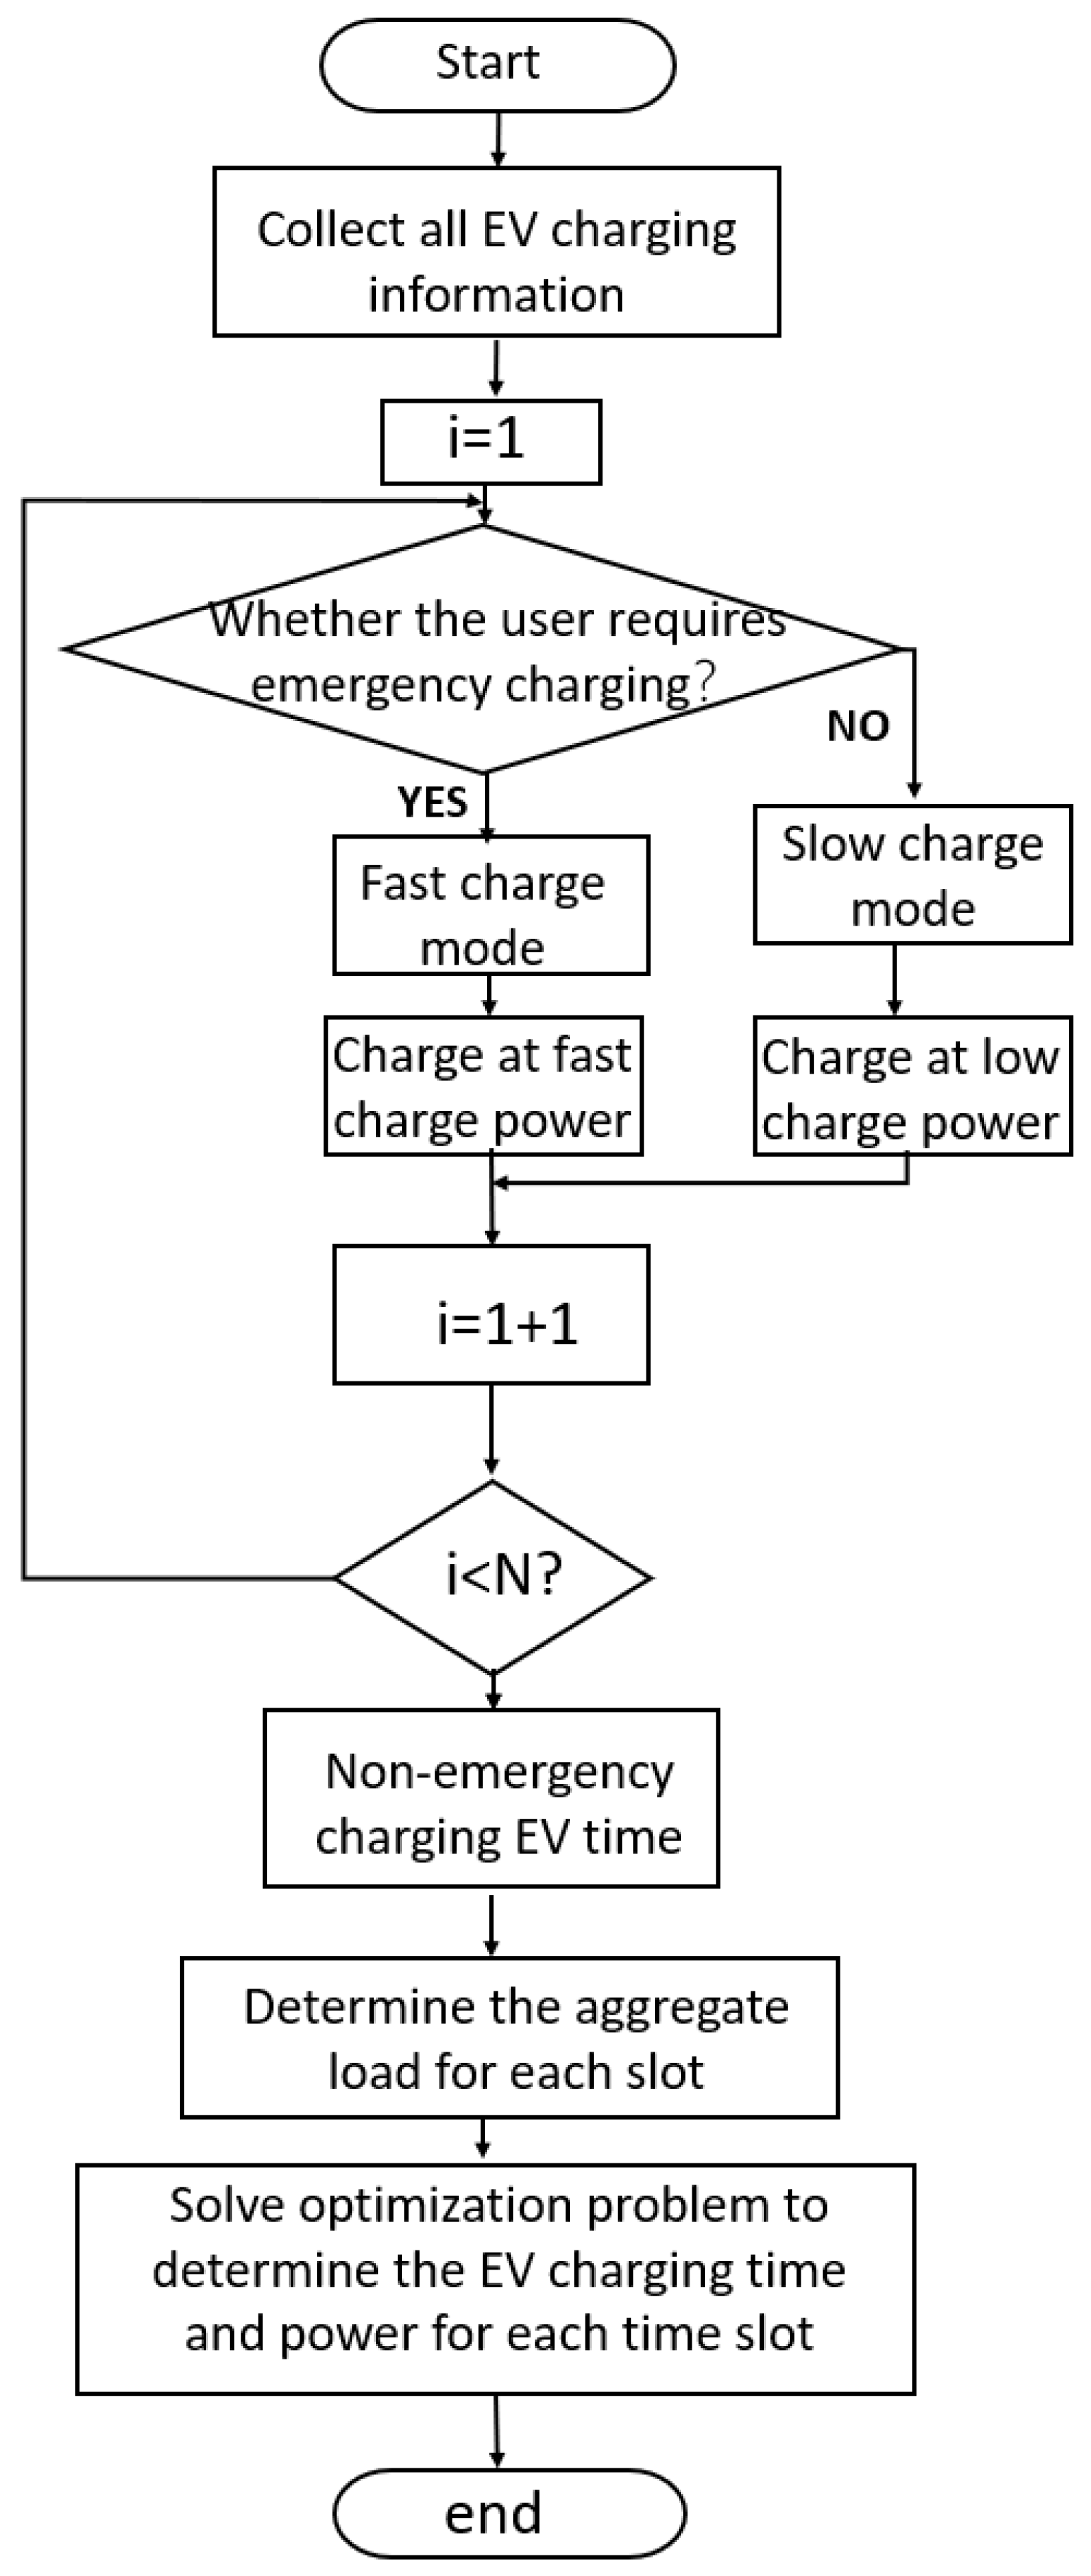
There are technical constraints related to the owner’s demand and power limitations which can be divided into the following three categories:
(i)
Constraints for PHEVs in fast charging mode
The establishment of a constraint to limit charging demand and ensure it remains within the maximum state of charge (SOC) is crucial in preventing overcharging in fast-charging EVs. The specific time slot when fast-charging PHEVs cease charging can be represented as follows:
J i e n d = min J i d i s , ( S O C i max S O C i c o n ) · C a p b a t t e r y P f a s t · η · Δ T + J i c
The maximum state of charge (SOC) demand, denoted as S O C i max , represents the peak level of SOC required for a given scenario. The expression ( S O C i max S O C i c o n ) · C a p b a t t e r y P f a s t · η · Δ T is utilized to compute the total number of time slots necessary for PHEVs to attain the maximum SOC demand. The mathematical operation · is employed to ensure prevention of overcharging during the subsequent charging time slot for a PHEV.
(ii)
Enhanced requirements for PHEVs in slow charging mode
The diverse charging needs of PHEV owners necessitate specific minimum and maximum SOC requirements for each PHEV to mitigate the risk of overcharging. In the context of slow-charging patterns, meeting the minimum SOC requirement upon disconnection from the microgrid is crucial, which can be articulated as follows:
S O C i min S O C i d i s S O C i max
when the i-th PHEV disconnects from the smart grid, S O C i d i s represents its battery’s state of charge and can be determined as follows:
S O C i d i s = S O C i c o n + j = J i c J i d i s Δ T · P s l o w · x i j · η C a p b a t t e r y
where the variable x i j represents the total number of slow-charging PHEVs, which is crucial for studying the operational mode and charging strategy of PHEVs in the smart grid. The parameter S O C i c o n indicates the battery status of PHEV i when connected to the smart grid, and monitoring and analyzing the battery status is essential for optimizing the charging control strategy of PHEVs and extending battery life.
(iii)
Enhanced constraints for the smart grid
The primary objective of this study is to minimize the peak–valley disparity in the total load, which is essential for the efficient operation of the smart grid. However, it is crucial to note that there is no guarantee that the coordinated result will yield a lower peak value compared to the uncoordinated charging method that satisfies the maximum SOC demand of PHEVs. This is primarily because the coordinated charging method is influenced by various factors such as the charging patterns, PHEV arrival and departure patterns, and the available capacity of the smart grid.
P t o t a l max P t o t a l ( m a x S O C ) max
where P t o t a l max represents the upper and lower bounds of the load demand, while P t o t a l ( m a x S O C ) max denotes the maximum total load in the uncoordinated charging method that fulfills the maximum SOC requirement for PHEVs across all charging time slots. Subsequently, a feasible charging configuration is defined for each PHEV as follows:
χ = { x i j | c o n s t r a i n t s ( 14 ) , ( 15 ) , ( 17 ) }
Additionally, the preferred design objective for the energy source of the distribution system is to achieve a more consistent load curve. However, it is essential for owners to strategically schedule their energy charging process to minimize their daily total payment, thereby providing them with incentives to actively participate in the charging stage. Consequently, the optimization problem for each PHEV can be formulated as follows:
min i , x i j χ w 1 g ( x ) + w 2 f ( x ) = min i , x i j χ w 1 ( P t o t a l max P t o t a l min ) + w 2 j = 1 96 P i x i j · p r i c e ( j )
where w 1 and w 2 denote the weighting factor for load stabilization and cost minimization.
As the weighting factors sum up to 1, different weight factors will be given priority in the objective function. A higher load balance weight factor leads to improved overall load balance of the power grid but also results in increased overall cost of electricity consumption. Therefore, it is essential to establish a reasonable weight factor based on actual conditions within the power grid in order to achieve a balanced approach that benefits both sides of power supply and demand, ultimately leading to a win–win situation in future smart grids ensuring users are incentivized to participate.
Remark 2.
The feasible constraints for each PHEV consist solely of linear constraints, resulting in both convexity and compactness. The objective function in Equation (19) is strictly convex, leading to a problem with a unique optimal solution. By adjusting the cost weighting factor and the load stability weighting factor within the multi-objective function (19), the microgrid allows for flexible weight selection among owners to actively participate in coordinated charging scheduling, setting it apart from previous state-of-art research [25].
Remark 3.
For the robustness of the algorithm, a main concern is whether it can maintain continuous operation in the presence of random entry and exit of electric vehicles and how this may impact its performance. As shown in Figure 4, the operational efficiency of the proposed algorithm has a direct impact on the real-time scheduling of EVs. Upon accessing the system, EV owners are provided with a reserved period of time to charge their EVs, which is enough time for the system to implement the scheduling strategy and assign it to each EV for execution. But in practice, we can update it when another EV arrives or the forecast of non-EV loads changes to save calculation and communication. Therefore, as long as the number of EVs in the system does not change, the computational efficiency of the algorithm can fully meet the real-time scheduling requirements in practice.

4. Main Results and Discussions

In this section, we showcase the principal results of the model proposed and developed utilizing MATLAB/YALMIP 2020a tools. The optimization problem (19) can be solved by the well-established optimization solver GUROBI 11.0.1 which is known for its efficiency in solving mixed integer programming problems. Additional details about the GUROBI solver can be found in [30].

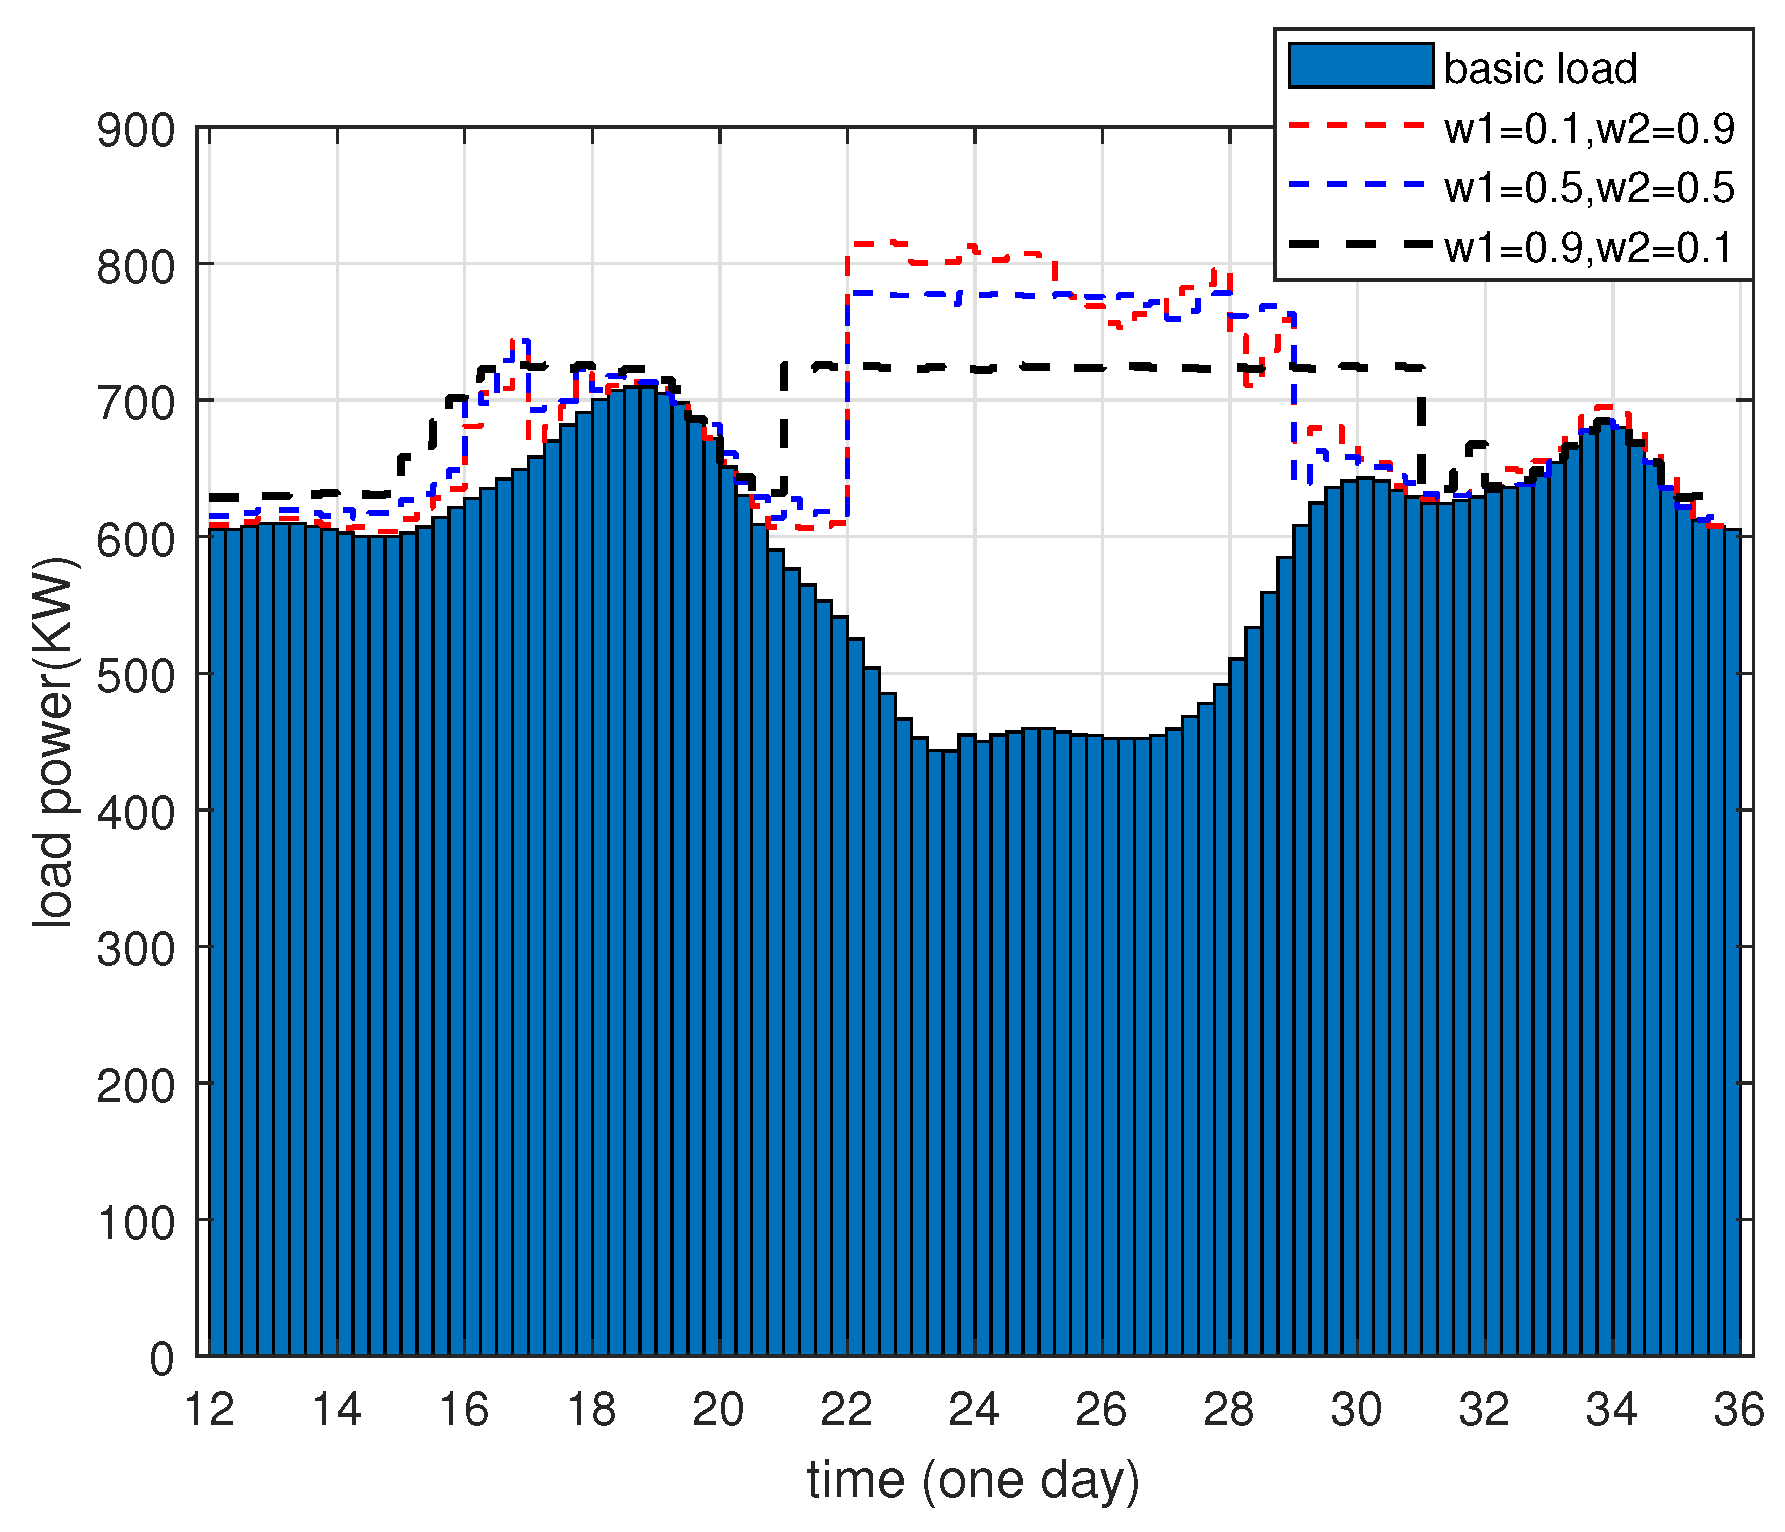
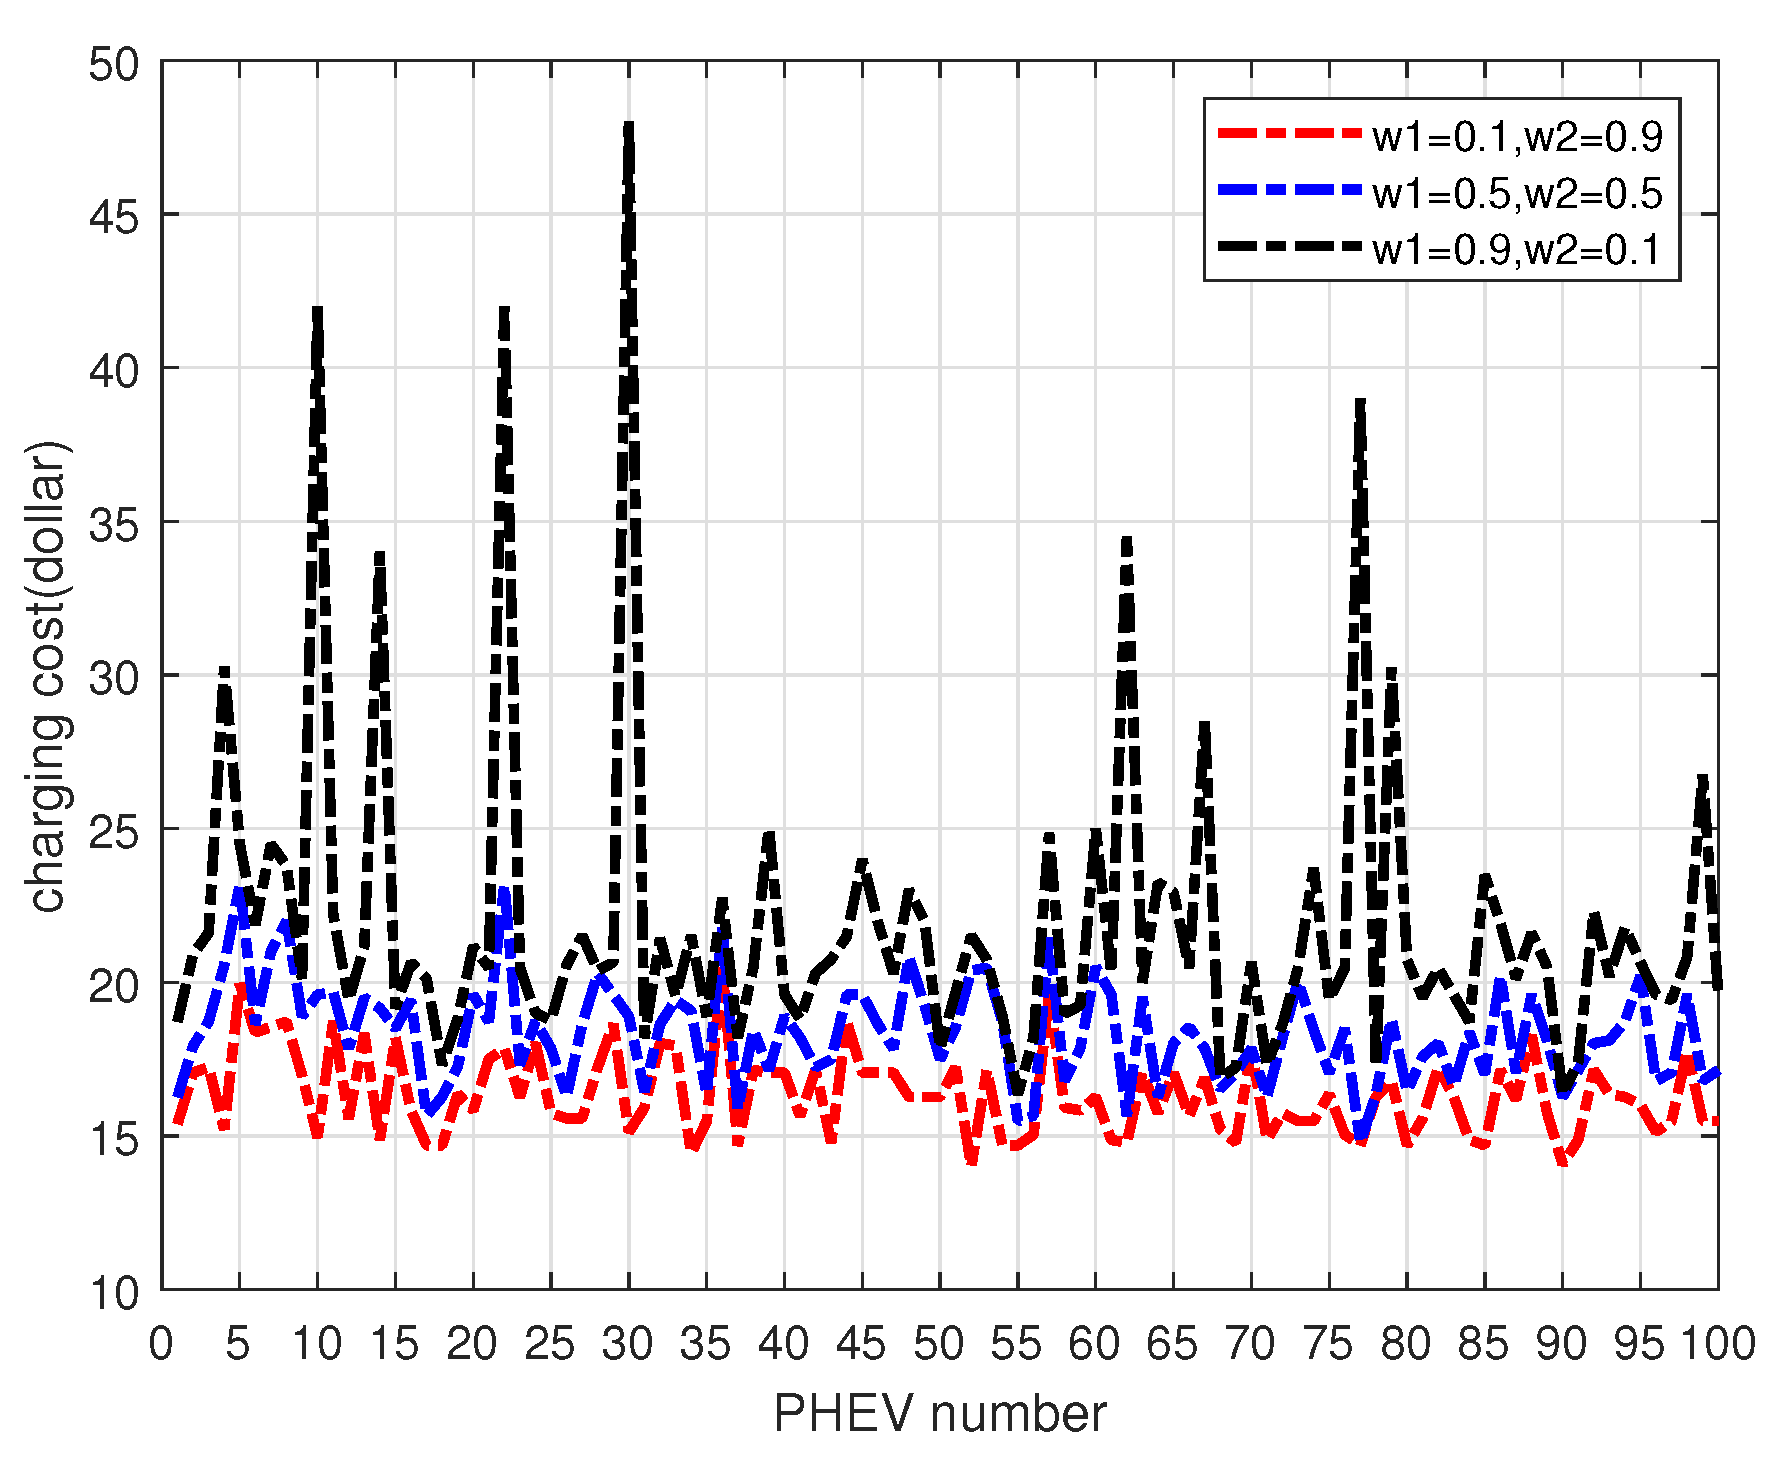
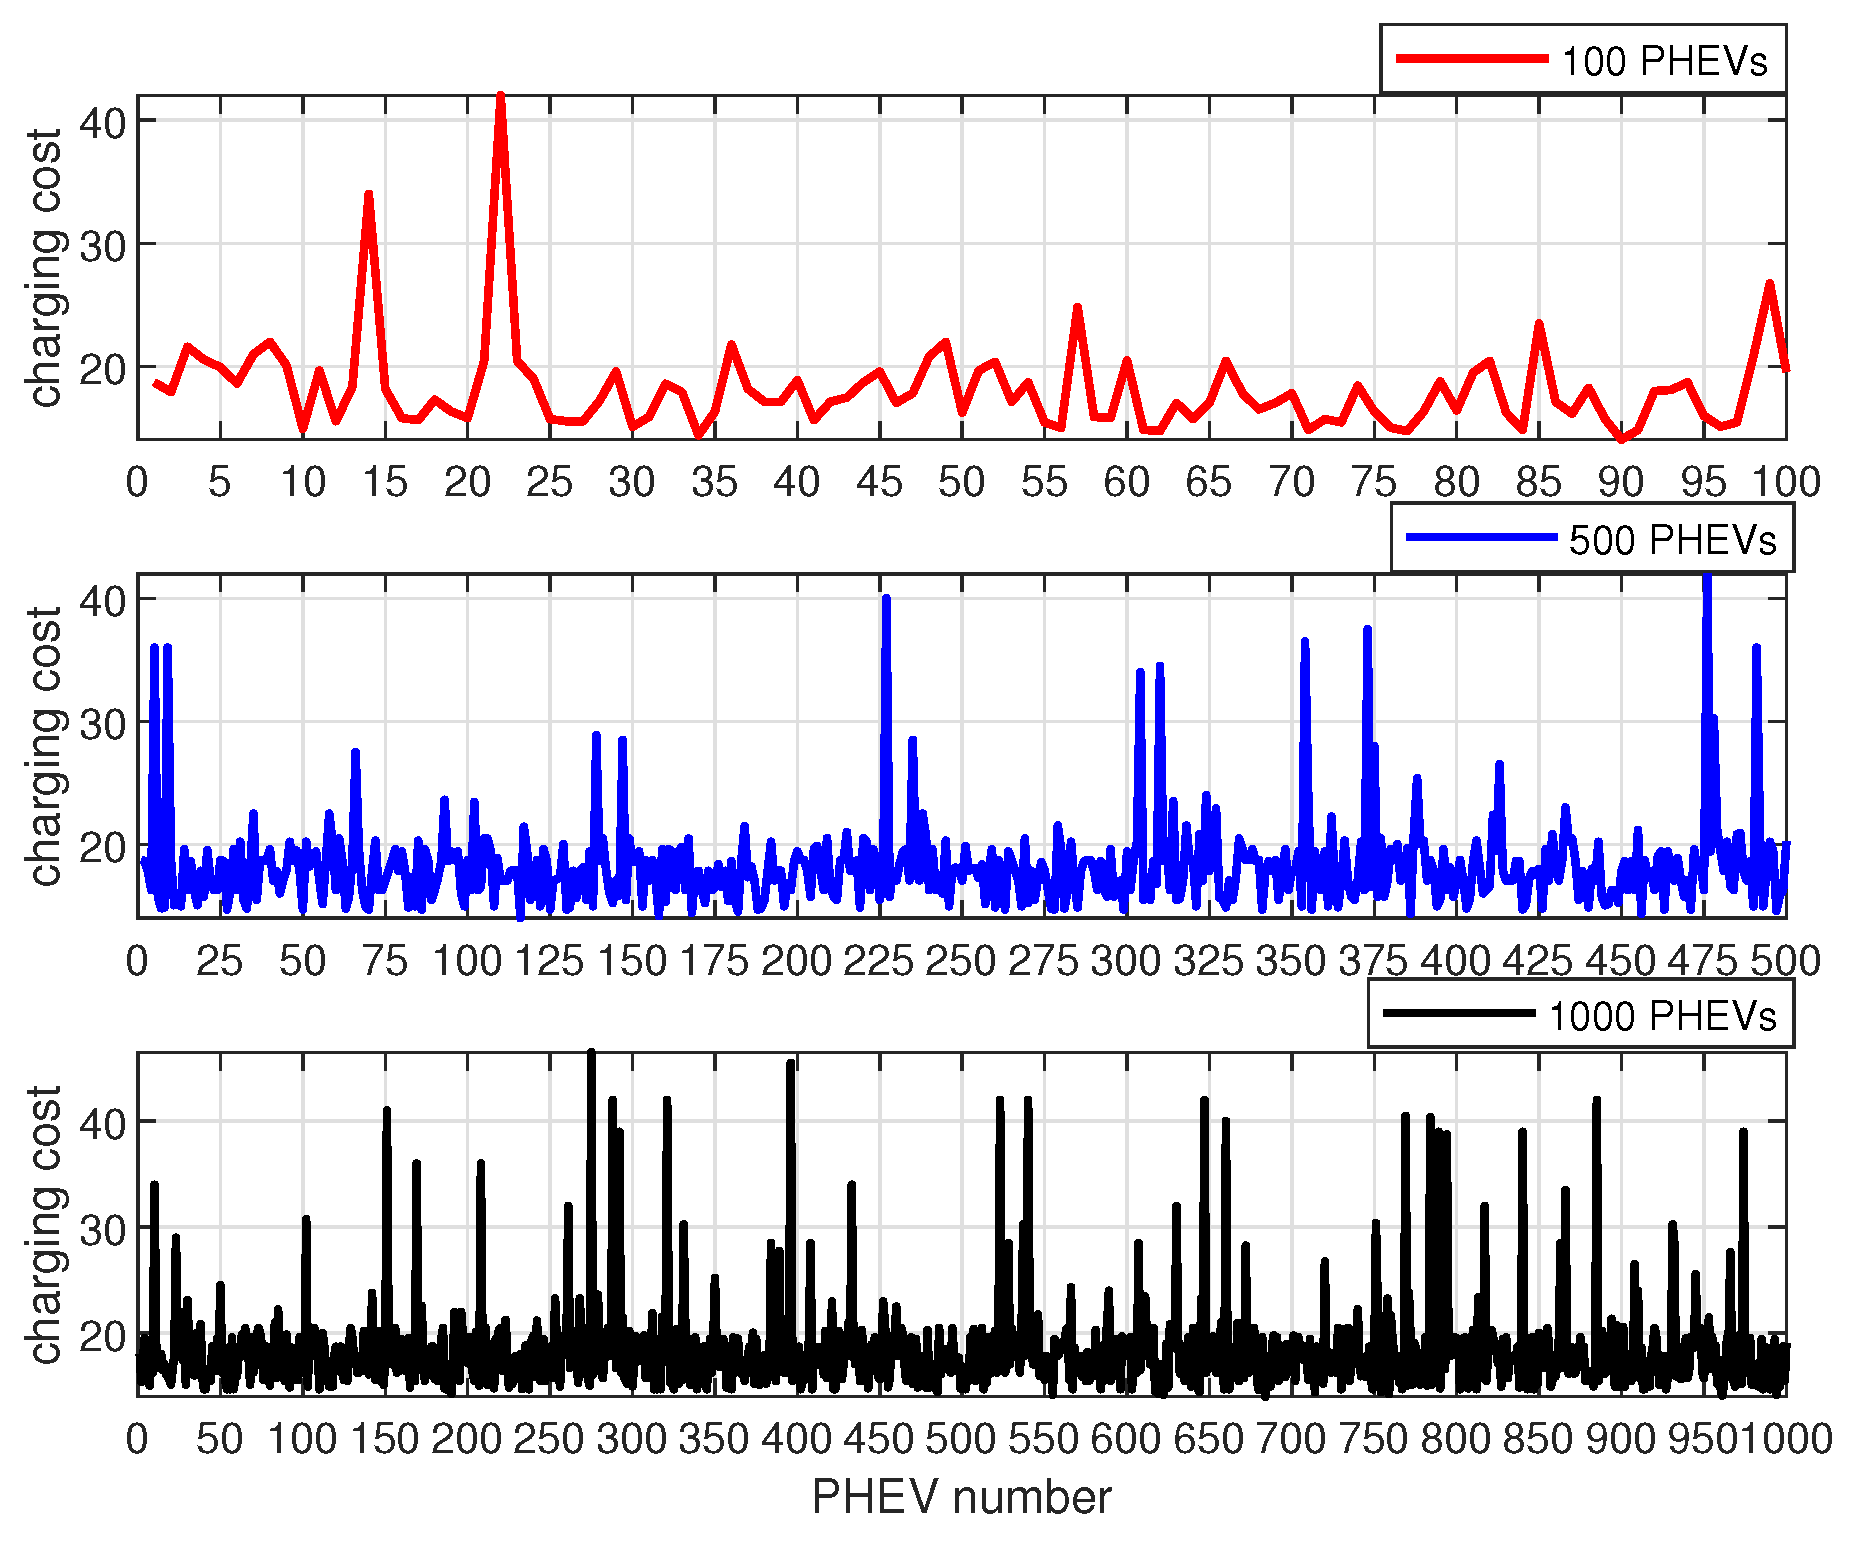
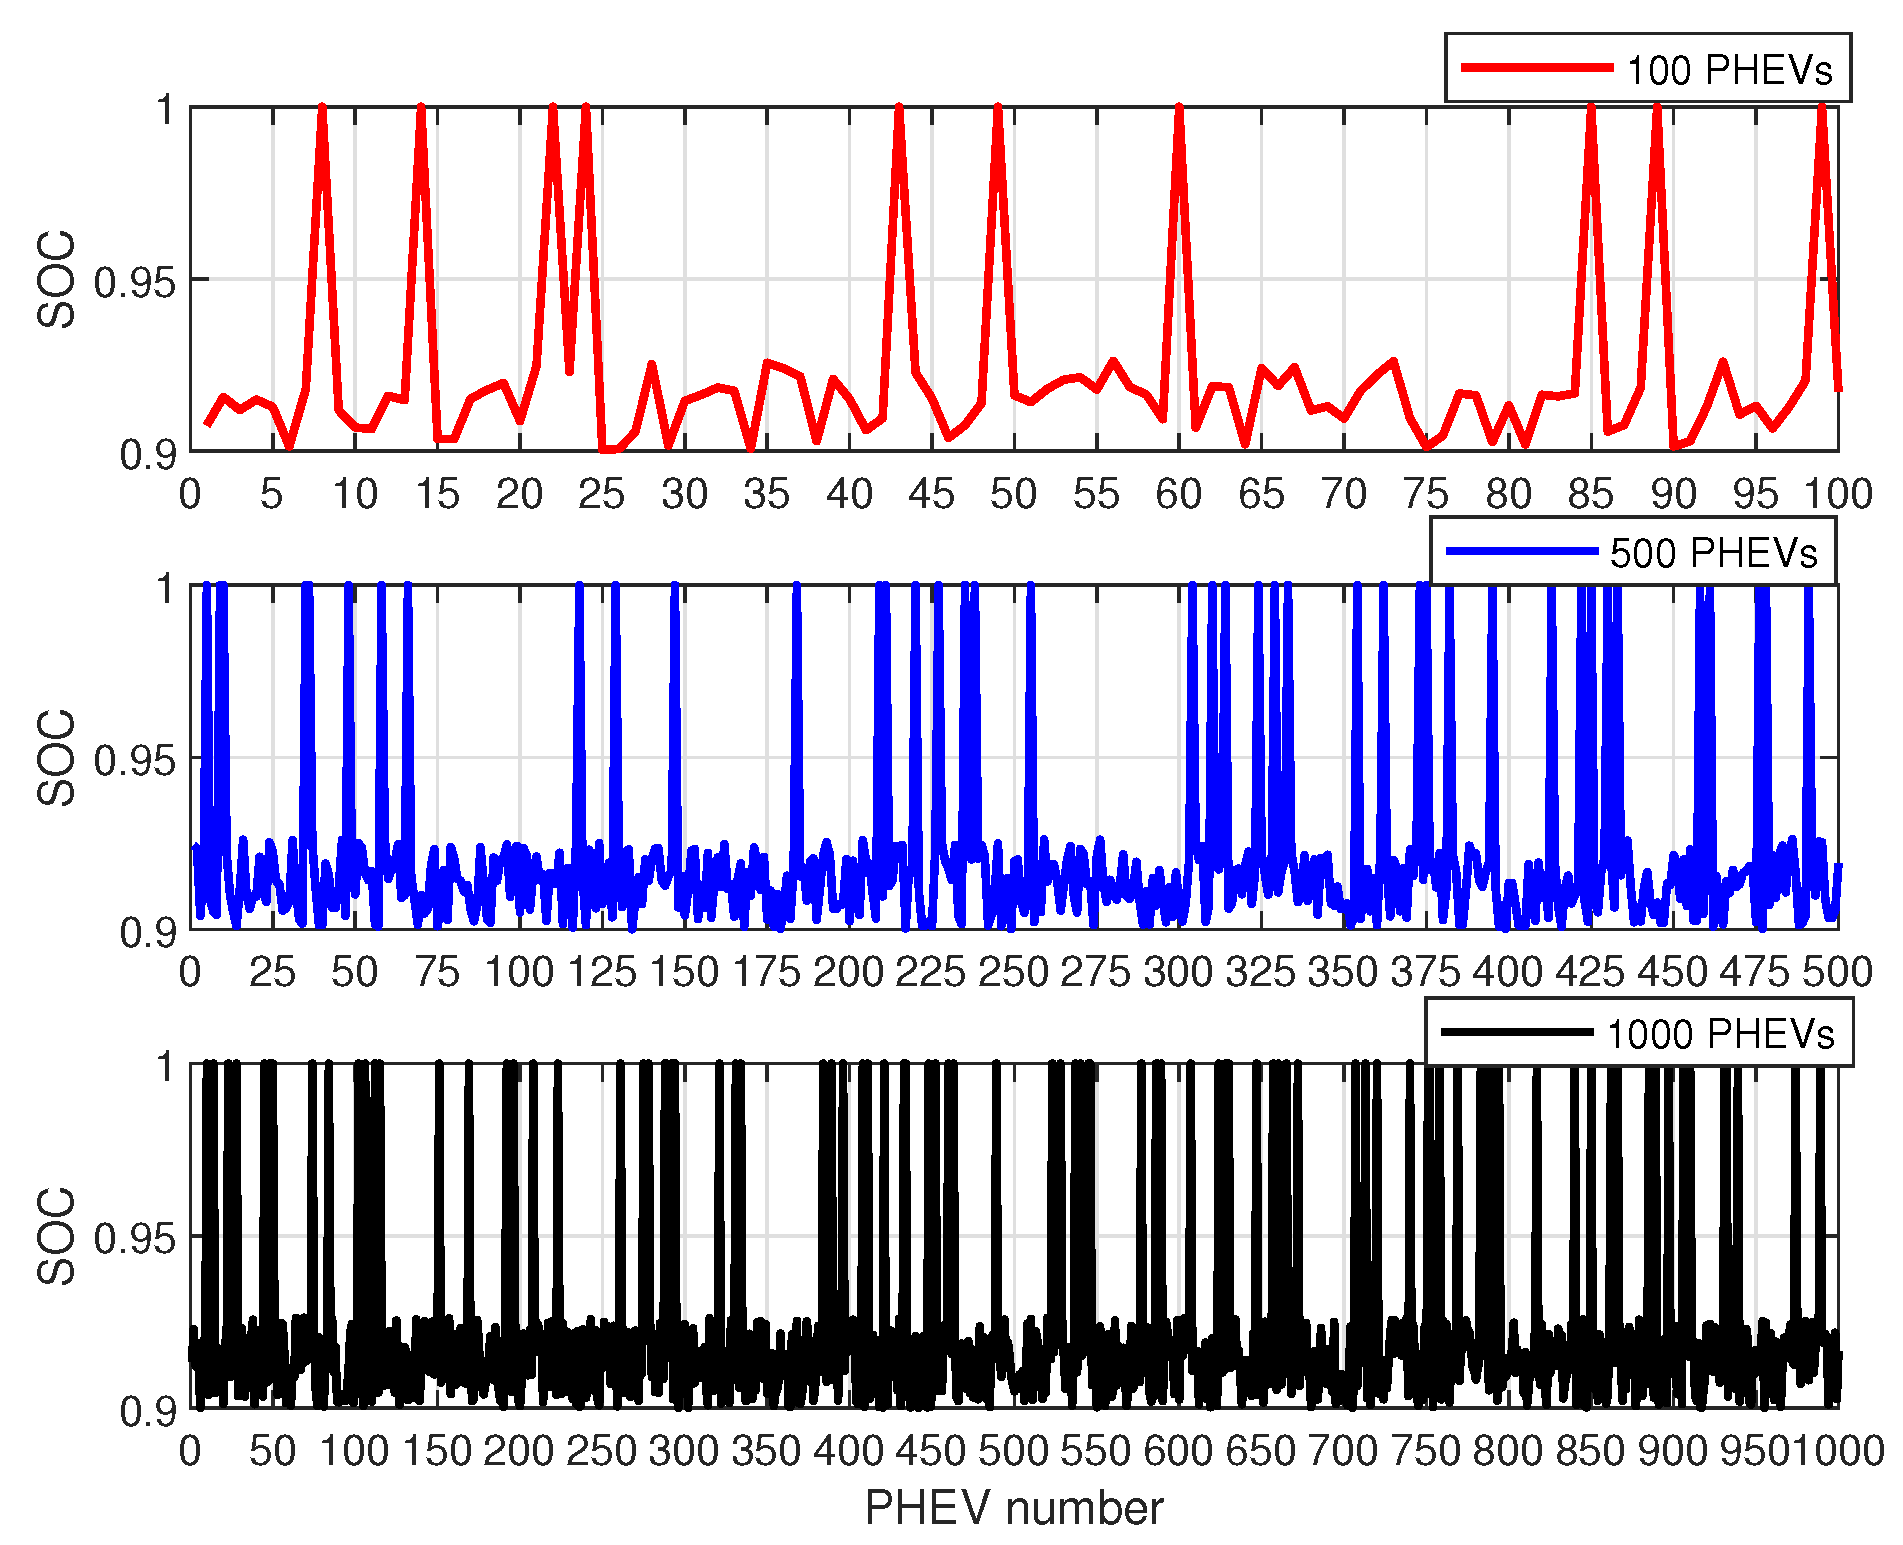
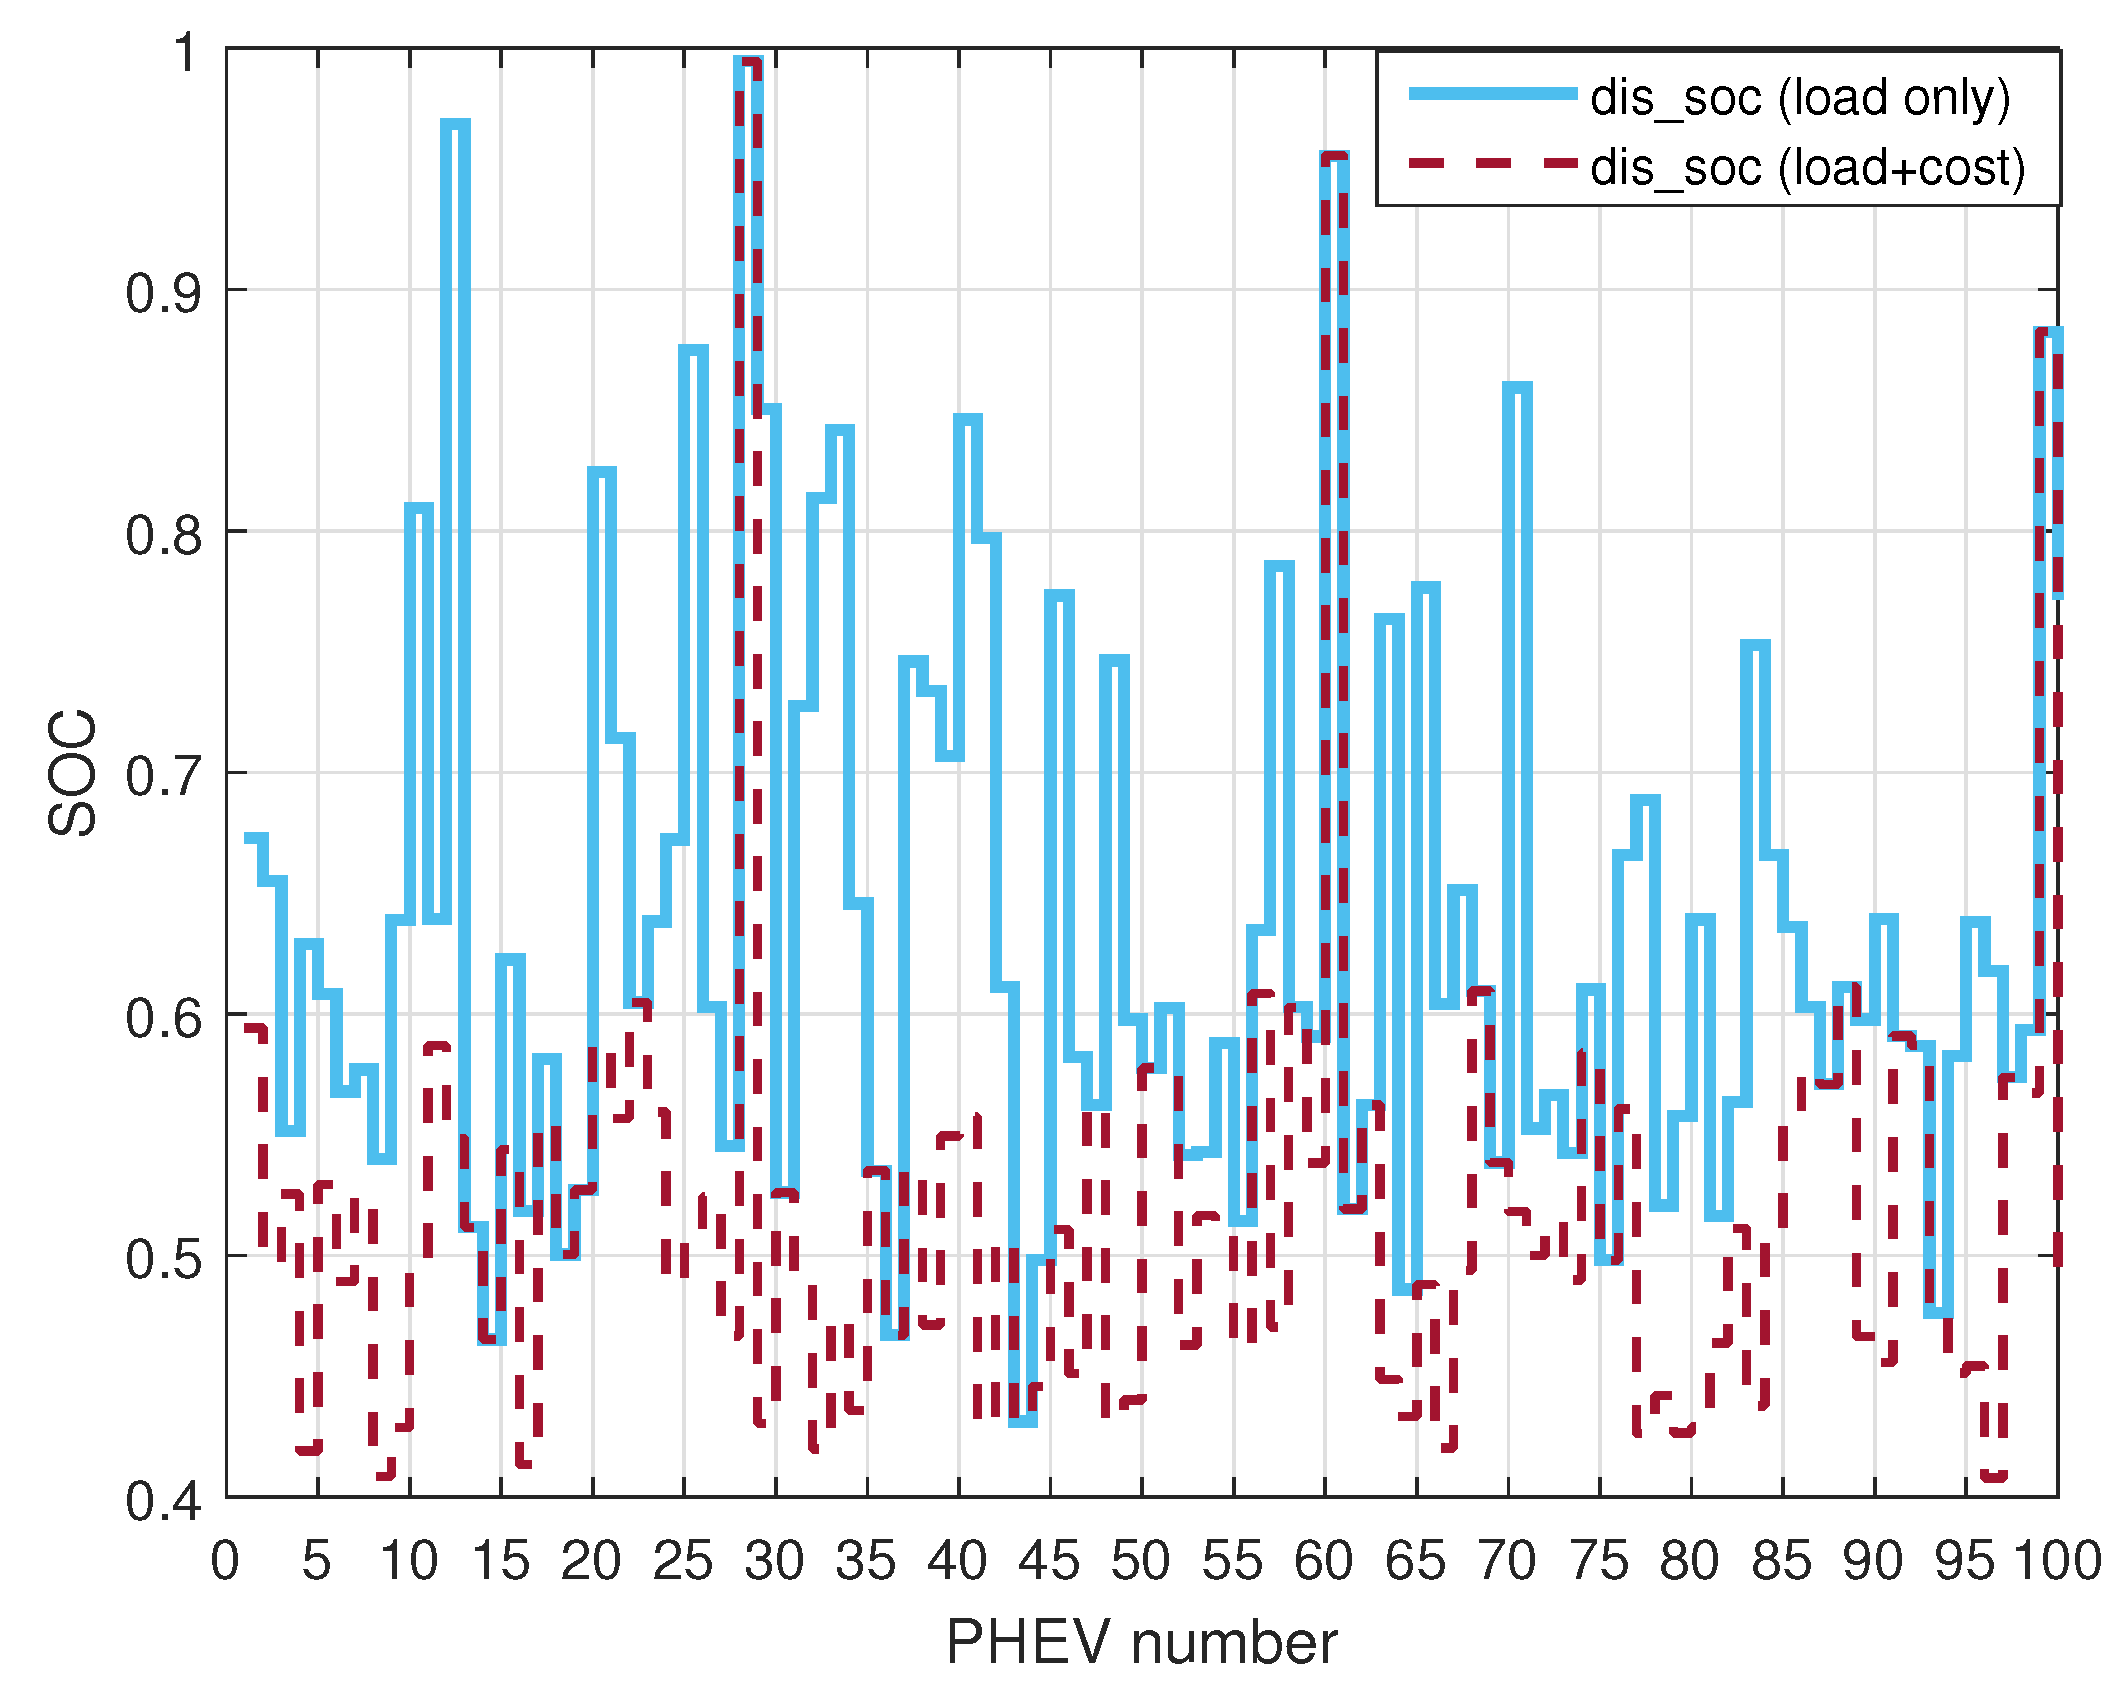
4.1. Low-Level Penetration with 100 PHEVs

In this example, we consider a low-level penetration with 100 PHEVs in the microgrid. For simplification, the PHEVs are plugged in at 12:00 and unplugged at 12:00 the next day. The 12:00 to 12:00 (another day) period covers the peak period (approximately 17:00–19:00, with a total base load of more than 600 kW) and the valley period (22:00–04:00, with a total base load of less than 460 kW). Therefore, this period can completely describe the scenario where the total base load varies. The starting time slot of all PHEVs charging is 1, and the ending time slot is 96, corresponding to 12:00 to 12:00 (next day) in the simulation. The sampling frequency is 4/h, which means the sampling interval Δ T is 15 min. Other main parameters are listed in Table 1 as follows.
As illustrated in Figure 5, the application of the distinct cost weighting factor and load stabilization weighting factor gives rise to disparate load balance curves. In particular, as the cost weighting factor increases, PHEV owners are more inclined to charge during hours characterized by lower electricity prices (i.e., between 22:00 and 04:00 another day), which can further reduce charging costs. However, the load profile will exhibit greater fluctuations, particularly during the hours of centralized charging, and the overall peak-to-valley difference in the load profile will be greater.
Figure 6 illustrates how the application of different cost weighting factors and load stabilization weighting factors can lead to differing charging costs. Overall, the smaller the cost weighting factor, the higher the charging cost spent (black dotted line). Conversely, the larger the cost weighting factor, the lower the charging cost spent (red dotted line). As can be observed in Figure 7, the SOC of all EVs at exit is above 90%, and the SOC of some EVs reaches 100%, which fulfills the charging demand of the owners.
For this example of low-level penetration with 100 PHEVs, different load balance curves and charging cost curves are obtained by selecting different weight coefficients of objective functions. Specifically, since the cost function factors add up to 1, different weight factors will be emphasized in the objective function. The larger the load balance weight factor, the better the overall load balance of the power grid, but the higher the overall cost of electricity consumption. On the contrary, the larger the weight factor of electricity cost, the lower the overall cost of electricity consumption, but the greater the fluctuation of the overall load of the grid. Therefore, it is necessary to set a reasonable weight factor according to the actual situation in the power grid, so as to balance the interests of both sides of the power supply and the power side achieving a win–win situation in the future smart grid.

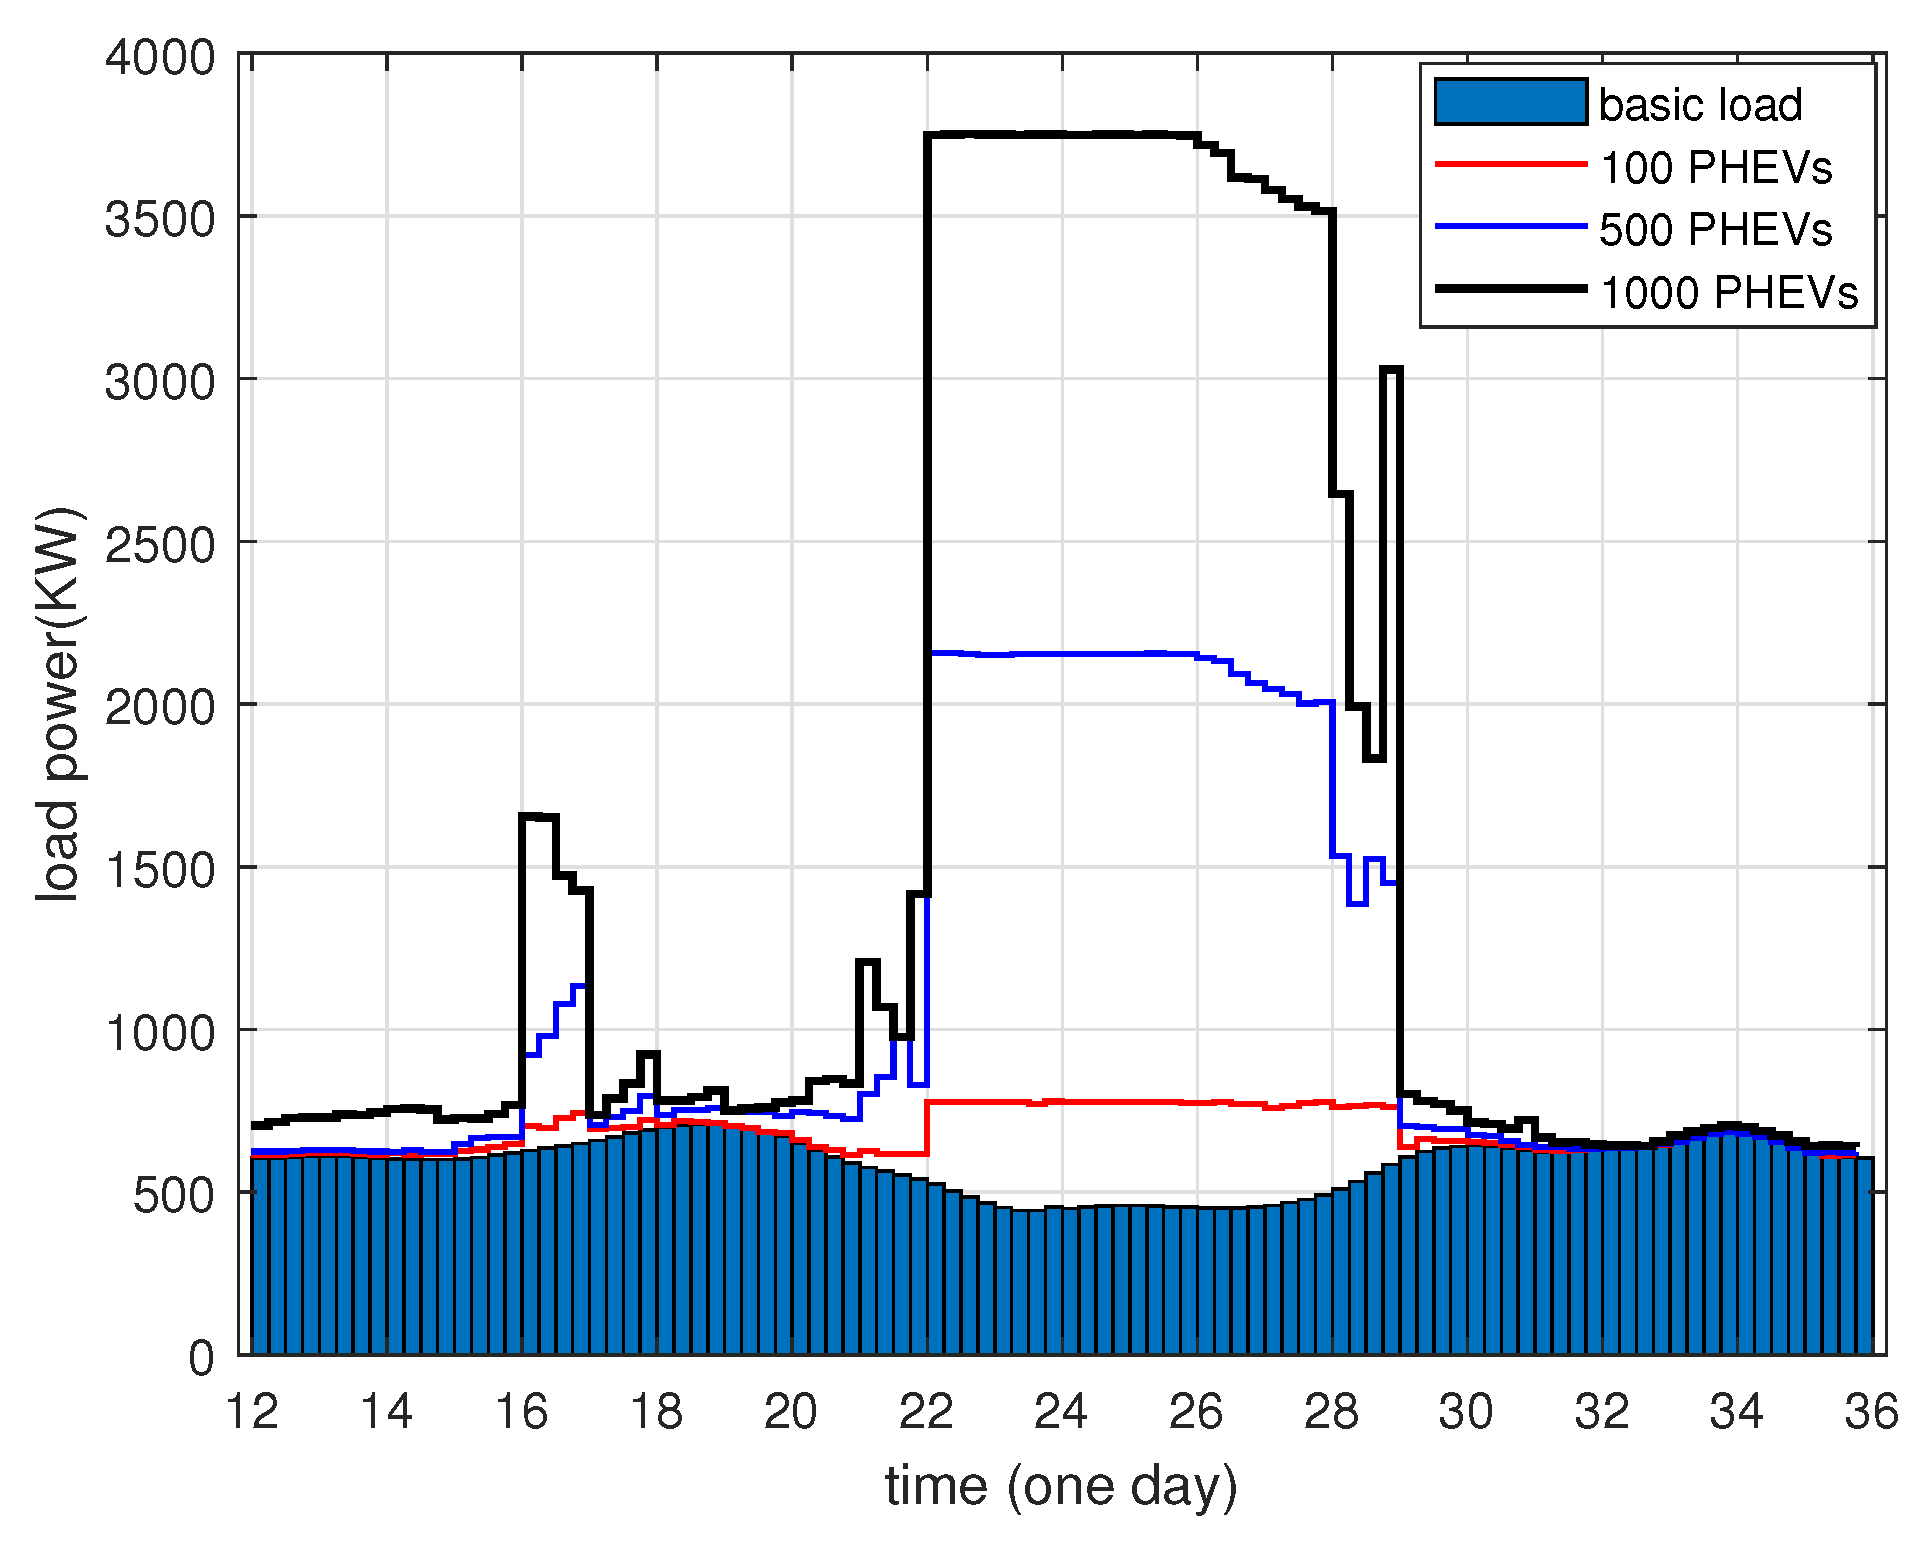
4.2. High-Level Penetration with 1000 PHEVs

As the number of electric vehicles continues to increase, it is becoming increasingly apparent that the future smart grid must be equipped with the capability to accommodate large-scale electric vehicles. Furthermore, for PHEVs to be of significant value in the context of a flexible and mobile grid, it is necessary for them to be involved in large-scale clustering for load balancing and cost minimization. Moreover, large-scale clustering of PHEVs can further validate the robustness and effectiveness of the model proposed in this paper. Consequently, to verify the effectiveness of the proposed model based on the optimal optimization, a case of high-level penetration with 100 PHEVs, 500 PHEVs, and 1000 PHEVs is studied in this subsection. The simulation parameters are set in accordance with the specifications outlined in Table 1. And the weighting factors for load stabilization and cost minimization are set as w 1 = w 2 = 0.5 . The simulation results are shown in Figure 8, Figure 9 and Figure 10.
In Figure 8, it is evident that as the number of PHEVs connected to the microgrid increases, the overall load profile becomes more variable. This means that the total energy demand of the microgrid will need to increase significantly, along with the corresponding non-PHEV loads.
In Figure 9, the cost curve for charging per EV user for different numbers of EVs accessed is depicted. It is noticeable that as the number of EVs increases dramatically, the number of charging costs above 30$ increases accordingly. This is due to the fact that the demand for electricity by users increases significantly as the number of EVs increases in the stochastic data generated based on a normal distribution.
Figure 10 illustrates the state of charge (SOC) of each EV at the end of charging. It can be observed that each EV is guaranteed to have more than 90% of its power, with some EV users reaching 100% of their power to meet their charging needs.
As a result, the load balance curve and charging cost curve shown in Figure 8, Figure 9 and Figure 10 demonstrate that the algorithm model proposed in this paper remains applicable for addressing the access challenges of large-scale EV clusters. For extremely large scales, such as 5000 or even 10,000 EVs, the primary time is allocated to gathering the charging demand of each vehicle and establishing more suitable iteration termination conditions during solving in order to meet the scalability requirements of the algorithm.

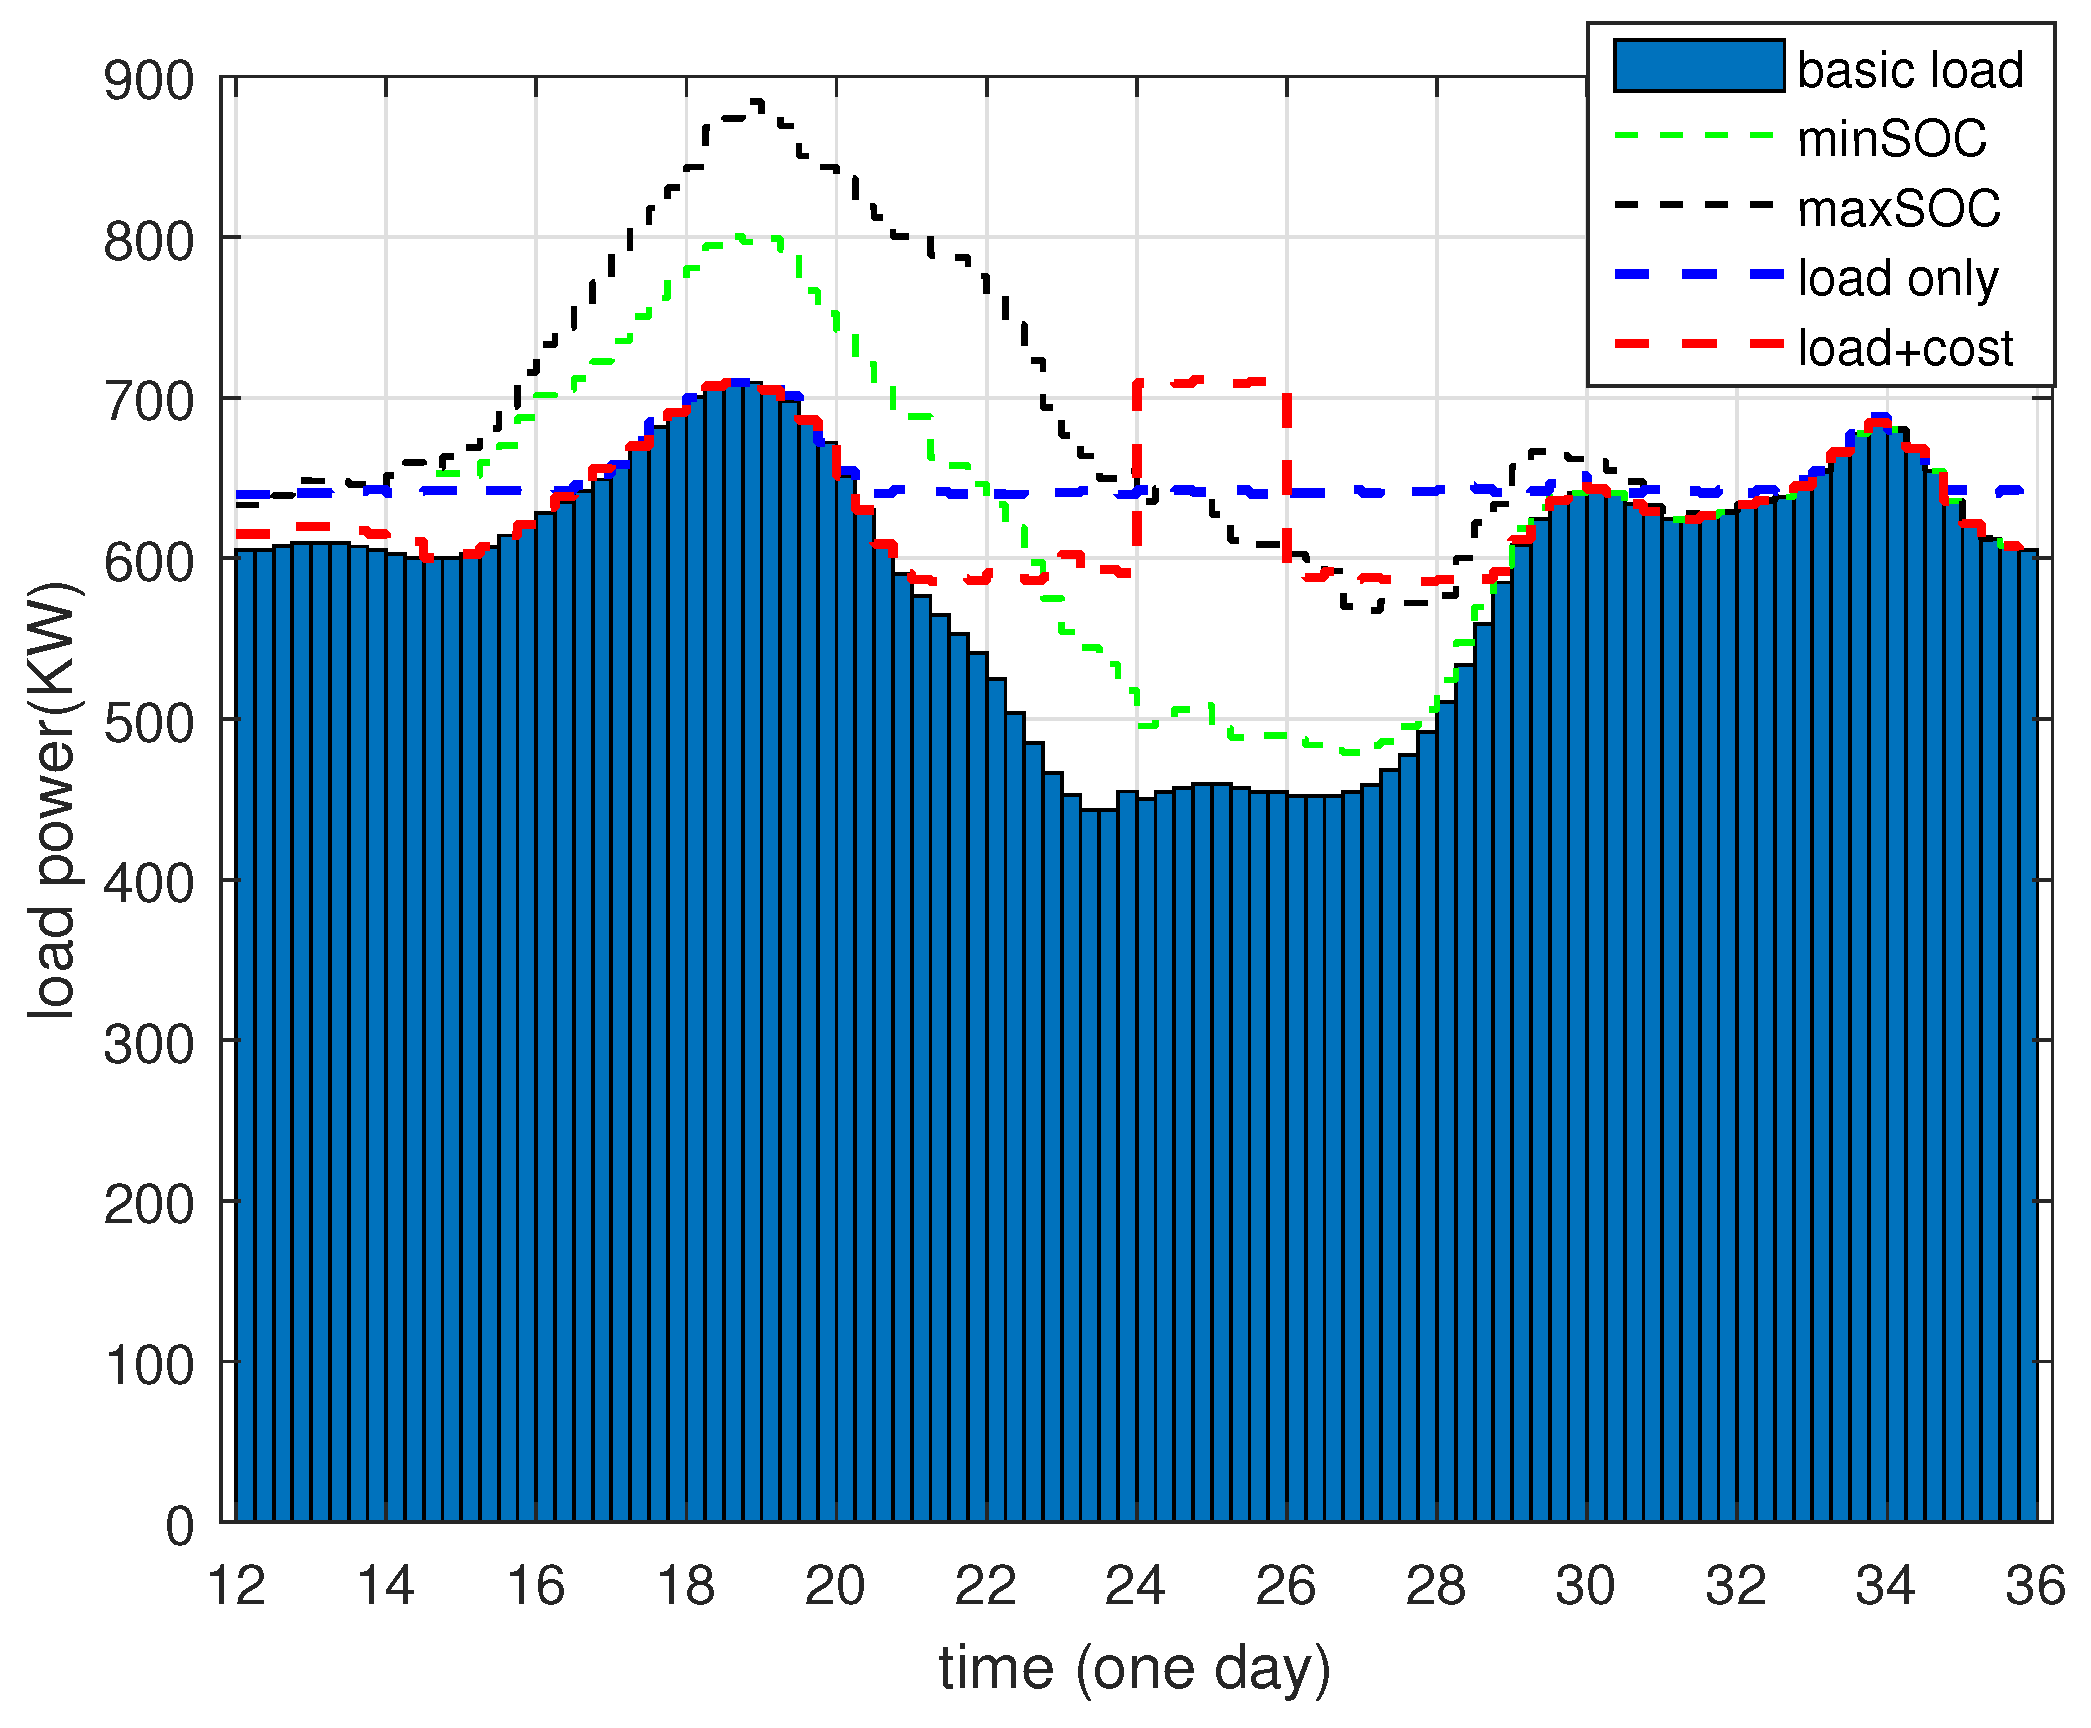
4.3. Comparisons between Proposed Algorithm and the Literature [25]

In this example, the proposed model is compared to the well-established model literature [25] solved by the CPLEX 12.9 which is also an efficient solver for mixed integer programming problem. Other details about the CPLEX solver can be found in [31]. The proposed algorithm and optimization solver are rigorously tested with a range of homogeneous 100 PEEVs from 12:00 to 12:00 (another day). To eliminate any uncertainty, both algorithms are tested in the MATLAB environment on the author’s laptop with a 13th Gen Intel Core i9-13900HX processor and 16 GB DDR3 memory. It is worth noting that both algorithms successfully converged to optimal solutions, but their cost and power load curve differed significantly. Other parameter settings are the same as in Section 4.2. The simulation results are shown in Figure 11, Figure 12 and Figure 13.
Figure 11 illustrates the overall load profile obtained using a single-objective function, as referred in the literature [25]. The red dashed line represents the load profile obtained using the multi-objective function proposed in this paper, which considers both the minimization of load peak-to-valley difference and charging cost with the use of weighting factors. The red curve in the graph shows greater fluctuations, reaching its peak between 24:00 and 02:00 (on another day). This is because the electricity price is lowest during this time (i.e., 0.6 kWh/dollar). The model proposed in this paper focuses on charging during this period to meet the charging demand of PHEV owners.
In Figure 12, it can be seen that the charging cost is significantly reduced by at least 50% when using the model proposed in this paper. This demonstrates the effectiveness of the model in reducing charging expenses for PHEV owners compared with [25]. Figure 13 shows that the overall state of charge (SOC) level at the end of charging is relatively low when utilizing the proposed model. However, this is not a significant concern for users, as the model effectively addresses the varying charging requirements of different users.
Overall, while flattening the load curve is a preferred design objective for the energy source of the grid, from the consumers’ perspective, scheduling their energy charging process to minimize their total payment at the end of each day is crucial. This provides incentives for them to participate in the charging stage. The results in this simulation highlight the benefits of the multi-objective function proposed in this paper, which not only minimizes load peak-to-valley difference but also reduces charging costs. The model in this paper successfully manages the increased variability in the overall load profile and enables reducing the charging cost as a large number of PHEVs are connected to the microgrid. The approach employed in this study not only offers guidance for optimizing the load on the grid power supply side but also actively fosters user engagement in collaborative charging scheduling.

5. Conclusions

The increasing adoption of PHEVs brings about significant environmental benefits. This paper focuses on the challenge of devising an economically optimal strategy to flatten the system’s load demand while addressing load stabilization and technical constraints related to owners’ demand and power limitations. The end-charging battery level of PHEV users and their emergency charging requirements are integrated as constraint conditions to promote active engagement in collaborative charging scheduling. By adjusting the cost weighting factor and the load stability weighting factor in the multi-objective function, the grid allows for flexible weight selection between owners to actively participate in coordinated charging scheduling, setting it apart from existing works. It is evident that using the model proposed in this paper significantly reduces charging costs by at least 50%.
However, it is important to note that the algorithm proposed in this paper, despite its potential, has certain limitations in practical applications. The fundamental nature of the algorithm necessitates the acquisition of global information. If the central node fails to perform calculations, it will significantly impact the overall power distribution effect of the entire grid. Therefore, future research should prioritize exploring more practical algorithms, such as distributed methods to enhance the ease of information interaction and achieve the fast convergence of algorithms. This would also allow PHEVs to access and depart from the grid in a random manner, benefiting both PHEV owners and the smart grid further.

Author Contributions

W.L. conducted theoretical analysis, system implementation, and simulations, and wrote the first and last versions of the draft paper. H.Z. contributed to the literature review and reviewed the last version of the draft paper. The proposed approach was discussed with J.S., who verified the first draft paper. All authors have read and agreed to the published version of the manuscript.

Funding

This work was supported by the National Natural Science Foundation of China (No. 62301489) and the Zhejiang Engineering Research Center for Edge Intelligence Technology and Equipment.

Data Availability Statement

The original contributions presented in the study are included in the article, further inquiries can be directed to the corresponding authors.

Acknowledgments

This work presents an extended version of a selected paper in the ICCSSE conference.

Conflicts of Interest

The authors declare no conflicts of interest.

References

  1. Wang, Y.; Wu, Y.K.; Tang, Y.J. Cooperative energy management and eco-driving of plug-in hybrid electric vehicle via multi-agent reinforcement learning. Appl. Energ. 2023, 332, 120563. [Google Scholar] [CrossRef]
  2. Sun, X.L.; Fu, J.Q.; Yang, H.Y. An energy management strategy for plug-in hybrid electric vehicles based on deep learning and improved model predictive control. Energy 2023, 269, 126772. [Google Scholar] [CrossRef]
  3. Robert, C. Green and Lingfeng Wang and Mansoor Alam. The impact of plug-in hybrid electric vehicles on distribution networks: A review and outlook. Renew. Sust. Energ. Rev. 2011, 15, 544–553. [Google Scholar]
  4. Hoffmann, F.; Person, J.; Andresen, M. A Multiport Partial Power Processing Converter with Energy Storage Integration for EV Stationary Charging. IEEE J. Emerg. Sel. Top. Power Electron. 2022, 10, 7950–7962. [Google Scholar] [CrossRef]
  5. Bai, Y.; Qian, Q. Optimal placement of parking of electric vehicles in smart grids, considering their active capacity. Electr. Power Syst. Res. 2023, 220, 109238. [Google Scholar] [CrossRef]
  6. Qays, M.O.; Ahmad, I.; Abu-Siada, A. Key communication technologies, applications, protocols and future guides for IoT-assisted smart grid systems: A review. Energy Rep. 2023, 9, 2440–2452. [Google Scholar] [CrossRef]
  7. Mobtahej, M.; Barzegaran, M.; Esapour, K. A novel three-stage demand side management framework for stochastic energy scheduling of renewable microgrids. Sol. Energy 2023, 256, 32–43. [Google Scholar] [CrossRef]
  8. Shao, S.; Pipattanasomporn, M.; Rahman, S. Demand response as a load shaping tool in an intelligent grid with electric vehicles. IEEE Trans. Smart Grid 2011, 2, 624–631. [Google Scholar] [CrossRef]
  9. Ma, Z.; Callaway, D.S.; Hiskens, I.A. Decentralized charging control of large populations of plug-in electric vehicles. IEEE Trans. Control Syst. Technol. 2013, 21, 67–78. [Google Scholar] [CrossRef]
  10. Gan, L.; Topcu, U.; Low, S.H. Optimal decentralized protocol for electric vehicle charging. IEEE Trans. Power Syst. 2013, 28, 940–951. [Google Scholar] [CrossRef]
  11. Zaini, F.A.; Sulaima, M.F.; Razak, I.A.W.A. A Review on the Applications of PSO-Based Algorithm in Demand Side Management: Challenges and Opportunities. IEEE Access 2023, 11, 53373–53400. [Google Scholar] [CrossRef]
  12. Muhandiram, I.; Peter, K. Uncertainties in model predictive control for decentralized autonomous demand side management of electric vehicles. J. Energ. Storage 2024, 83, 110194. [Google Scholar]
  13. Kandidayeni, M.; Trovao, J.P.F.; Boulon, L.; Kelouwani, S. Health-Wise Energy Management Strategies in Fuel Cell Hybrid Electric Vehicles: Tools to optimize performance and reduce operational costs. IEEE Electrif. Mag. 2024, 12, 80–88. [Google Scholar] [CrossRef]
  14. Jia, C.C.; Zhou, J.M.; He, H.W.; Li, J.W.; Wei, Z.B.; Li, K. Health-conscious deep reinforcement learning energy management for fuel cell buses integrating environmental and look-ahead road information. Energy 2024, 290, 130146. [Google Scholar] [CrossRef]
  15. Kang, Q.; Feng, S.W.; Zhou, M.C. Optimal Load Scheduling of Plug-In Hybrid Electric Vehicles via Weight-Aggregation Multi-Objective Evolutionary Algorithms. IEEE Trans. Intell. Transp. Syst. 2017, 18, 2557–2568. [Google Scholar] [CrossRef]
  16. Yu, R.; Ding, J.; Zhong, W.; Liu, Y.; Xie, S. PHEV charging and discharging cooperation in V2G networks: A coalition game approach. IEEE Internet Things J. 2014, 1, 578–589. [Google Scholar] [CrossRef]
  17. Giorgio, A.D.; Liberati, F. Near real time load shifting control for residential electricity prosumers under designed and market indexed pricing models. Appl. Energ. 2014, 128, 119–132. [Google Scholar] [CrossRef]
  18. Oliveira, D.Q.; Zambroni, S.; Delboni, L. Optimal plug-in hybrid electric vehicles recharge in distribution power systems. Elec. Power Syst. Res. 2012, 98, 77–85. [Google Scholar] [CrossRef]
  19. Sousa, T.; Morais, H.; Soares, J.; Vale, Z. Day-ahead resource scheduling in smart grids considering Vehicle-to-Grid and network constraints. Appl. Energ. 2012, 96, 183–193. [Google Scholar] [CrossRef]
  20. White, C.D.; Zhang, K.M. Using vehicle-to-grid technology for frequency regulation and peak-load reduction. J. Power Sources 2011, 196, 397280. [Google Scholar] [CrossRef]
  21. Bai, X.; Qiao, W.; Wei, H.; Huang, F.; Chen, Y. Bidirectional coordinating dispatch of large-scale V2G in a future smart grid using complementarity optimization. Int. J. Electr. Power Energy Syst. 2015, 68, 26977. [Google Scholar] [CrossRef]
  22. Saber, A.Y.; Venayagamoorthy, G.K. Plug-in vehicles and renewable energy sources for cost and emission reductions. IEEE Trans. Ind. Electron. 2011, 58, 1229–1238. [Google Scholar] [CrossRef]
  23. Yang, J.; He, L.; Fu, S. An improved PSO-based charging strategy of electric ve hicles in electrical distribution grid. Appl. Energy 2014, 128, 82–92. [Google Scholar] [CrossRef]
  24. Mohsen, Z.; Mohammad-Amin, A.; Rasoul, A.; Mostafa, M. A modified Particle Swarm Optimization algorithm with enhanced search quality and population using Hummingbird Flight patterns. Decis. Anal. J. 2023, 7, 100251. [Google Scholar]
  25. Zhou, K.; Cheng, L.; Wen, L.; Lu, X.; Ding, T. A coordinated charging scheduling method for electric vehicles considering different charging demands. Energy 2020, 213, 118882. [Google Scholar] [CrossRef]
  26. Rind, Y.M.; Raza, M.H.; Zubair, M.; Mehmood, M.Q.; Massoud, Y. Smart Energy Meters for Smart Grids, an Internet of Things Perspective. Energies 2023, 160, 1974. [Google Scholar] [CrossRef]
  27. Pugachev, V.S. Probability Theory and Mathematical Statistics for Engineers; Pergamon Press: Oxford, UK, 1984. [Google Scholar]
  28. Zheng, Y.C.; Shang, Y.T.; Shao, Z.Y.; Jian, L.N. A novel real-time scheduling strategy with near-linear complexity for integrating large-scale electric vehicles into smart grid. Appl. Energy 2018, 217, 1–13. [Google Scholar] [CrossRef]
  29. Li, J.; Wang, G.; Wang, X.; Du, Y. Smart charging strategy for electric vehicles based on marginal carbon emission factors and time-of-use price. Sustain. Cities Soc. 2023, 96, 104708. [Google Scholar] [CrossRef]
  30. Gurobi Optimization LLC 2020 Gurobi Optimizer Reference Manual. Available online: https://www.gurobi.com/documentation/current/refman/index.html (accessed on 25 June 2024).
  31. Meindl, B.; Templ, M. Analysis of Commercial and Free and Open-Source Solvers for Linear Optimization Problems. Eurostat and Statistics Netherlands within the Project ESSnet on Common Tools and Harmonized Methodology for SDC in the ESS. 2012. Available online: https://www.researchgate.net/profile/Matthias-Templ/publication/265117825_Analysis_of_commercial_and_free_and_open_source_solvers_for_linear_optimization_problems/links/54817d2d0cf22525dcb61883/Analysis-of-commercial-and-free-and-open-source-solvers-for-linear-optimization-problems.pdf (accessed on 25 June 2024).
Figure 1. Framework of future smart grid integrating with energy provision level and energy consumption level.
Energies 17 03148 g001
Figure 2. Typical basic load profile from 12:00 noon to 12:00 noon (another day).
Energies 17 03148 g002
Figure 3. PHEV charging behavior based on a normal distribution.
Energies 17 03148 g003
Figure 4. Flowchart for coordinated charging of PHEVs with large penetration.
Energies 17 03148 g004
Figure 5. Power curve according to different weighting factors for 100 PHEV penetration.
Energies 17 03148 g005
Figure 6. Charging cost according to different weighting factors for 100 PHEVs penetration.
Energies 17 03148 g006
Figure 7. SOC according to different weighting factors for 100 PHEVs penetration.
Energies 17 03148 g007
Figure 8. Power curve according to different number PHEV penetration.
Energies 17 03148 g008
Figure 9. Charging cost according to different number PHEV penetration.
Energies 17 03148 g009
Figure 10. SOC according to different weighting factors for different number PHEV penetration.
Energies 17 03148 g010
Figure 11. Power curve according to this paper and [25] for 100 PHEV penetration.
Energies 17 03148 g011
Figure 12. Charging cost according to this paper and [25] for 100 PHEV penetration.
Energies 17 03148 g012
Figure 13. SOC according to this paper and [25] for 100 PHEV penetration.
Energies 17 03148 g013
Table 1. Parameters of low-level penetration with 100 PHEVs.
P slow (kW) P fast (kW) Cap battery (kWh) η (%) SOC i con (%) SOC i min (%) SOC i max (%)
3.510309010–3090%100%
Disclaimer/Publisher’s Note: The statements, opinions and data contained in all publications are solely those of the individual author(s) and contributor(s) and not of MDPI and/or the editor(s). MDPI and/or the editor(s) disclaim responsibility for any injury to people or property resulting from any ideas, methods, instructions or products referred to in the content.

