Article

Operation Optimization of Regional Integrated Energy Systems with Hydrogen by Considering Demand Response and Green Certificate–Carbon Emission Trading Mechanisms

1
Engineering Research Center of Renewable Energy Power Generation and Grid-Connected Control, Ministry of Education, Xinjiang University, Urumqi 830017, China
2
Electric Power Research Institute of State Grid Xinjiang Electric Power Co., Ltd., Urumqi 830011, China
*
Author to whom correspondence should be addressed.
Energies 2024, 17(13), 3190; https://doi.org/10.3390/en17133190
Submission received: 3 June 2024 / Revised: 23 June 2024 / Accepted: 24 June 2024 / Published: 28 June 2024
(This article belongs to the Section A5: Hydrogen Energy)

Abstract

:
Amidst the growing imperative to address carbon emissions, aiming to improve energy utilization efficiency, optimize equipment operation flexibility, and further reduce costs and carbon emissions of regional integrated energy systems (RIESs), this paper proposes a low-carbon economic operation strategy for RIESs. Firstly, on the energy supply side, energy conversion devices are utilized to enhance multi-energy complementary capabilities. Then, an integrated demand response model is established on the demand side to smooth the load curve. Finally, consideration is given to the RIES’s participation in the green certificate–carbon trading market to reduce system carbon emissions. With the objective of minimizing the sum of system operating costs and green certificate–carbon trading costs, an integrated energy system optimization model that considers electricity, gas, heat, and cold coupling is established, and the CPLEX solver toolbox is used for model solving. The results show that the coordinated optimization of supply and demand sides of regional integrated energy systems while considering multi-energy coupling and complementarity effectively reduces carbon emissions while further enhancing the economic efficiency of system operations.

1. Introduction

Efficient, safe, low-carbon, and clean energy utilization technology is the mainstream of energy development and an objective requirement of sustainable development in the world [1]. In regional integrated energy systems (RIESs), the coupling and complementarity of various forms of energy, such as electricity, heating, cooling, and gas, satisfies diversified load demands and provides an important foundation for the cascade utilization of energy and energy conservation and emission reductions [2]. In order to gain insight into the potential of low-carbon economic development in the energy sector, research has increasingly focused on a number of key areas. These include the planning and operation of integrated energy systems (IESs) [3], the construction of carbon trading markets [4], the application of low-carbon technologies [5], and the measurement of carbon emissions [6]. A multitude of research outcomes have identified prospective avenues for the low-carbon advancement of RIESs. The deployment of low-carbon technological solutions and institutional measures, including carbon capture technology [7], diversified energy storage technology [8], energy interconnection and interaction [9,10], integrated demand response mechanisms [11], and carbon trading mechanisms [12], can directly or indirectly facilitate the reduction of carbon emissions and associated costs.
Hydrogen is a kind of clean and low-carbon second energy, which has the advantages of low pollution, a high heat value, and high flexibility [13]. Currently, numerous governments and organizations, including the European Union, are recognizing hydrogen as a pivotal contributor to the provision of power system flexibility [14]. This is achieved through a combination of adjustments to supply and demand, including electricity-to-gas conversion, hydrogen storage, and fuel cell-related technologies. In [15], the authors propose a comprehensive electricity–heat–hydrogen energy storage system and establishes an optimization operation model for microgrids considering hybrid energy storage. In [16], introducing a wind-to-hydrogen device into the electricity–heat–hydrogen RIES optimization model, the authors harness the advantages of hydrogen production from electricity, thereby enhancing the capability for renewable energy integration. In [17], the authors consider the synergistic relationship between hydrogen energy and renewable energy sources, such as photovoltaics and wind power, establishing a day-ahead optimization model for hydrogen-containing island autonomous RIESs. In [18], the authors integrated thermal and hydrogen storage technologies into an IES and proposed a real-time optimal scheduling method based on a soft actor–critic algorithm. This resulted in a notable enhancement in the renewable energy consumption rate and the economic viability of the system. However, references [15,16,17,18] only aim for economic efficiency and do not take into account the low-carbon characteristics of RIESs.
To bridge the gap in renewable energy subsidies and promote the marketization of renewable energy, China has established a Renewable Portfolio Standard (RPS). The Green Certificate Trading (GCT) mechanism is a product of this standard [19]. The existing literature has studied both the Carbon Emission Trading (CET) mechanism and the GCT mechanism accordingly. In [20], the current research status of CET and its influencing factors on the power system are summarized. In [21], the authors show that there is a mutually reinforcing relationship between the green certificate market and the electricity market, and their synergistic development has a positive impact on the restructuring of China’s power supply, in which the renewable energy quota target is the key influencing factor. In [22], combined with the responsibility of renewable energy consumption, the GCT mechanism, carbon emission rights trading, and the China Certified Emission Reduction (CCER), a RIES operation optimization model was proposed. In [23], a multi-district IES scheduling model considering the Carbon Emission Trading (CET) mechanism and the GCT mechanism is proposed and the different impacts of CET, GCT, and changes in natural gas prices on system operating costs are analyzed. In [24], the overlapping benefits of renewable energy generation from carbon and GC markets are studied, and the concept of a green index is proposed. Case studies demonstrate that the proposed strategy model and the evaluation indicators can not only contribute to the economical and eco-friendly operation of the multi-district league, but also stimulate the coupling and complementarity of multiple energies. Although the aforementioned literature considers the introduction of GCT, RPS, and CET mechanisms on the supply side, it overlooks the impact of demand response on the system from the demand side.
Integrated Demand Response (IDR), as an extension and expansion of traditional demand response (DR) in RIESs, can not only adjust energy consumption through price and incentive response mechanisms to effectively reduce load fluctuations but also reduce system operating costs, achieving multi-energy coupling and complementarity [25]. In [26,27], taking into account the coupling characteristics of electricity, heat, and gas loads, a RIES model incorporating IDR for electricity, heat, and gas is proposed. The case study results demonstrate that the application of DR can enhance the low-carbon economy of RIESs. In [28,29], the joint operation of CET mechanisms and DR and their impact on the system are considered. The case study results demonstrate that carbon trading mechanisms and DR enhance the low-carbon economy of the system. In [30], an optimized model for electric-thermal interconnection in RIESs with incentive-based IDR is established, guiding users to actively adjust energy loads through economic incentive signals. However, it does not consider the substitution relationship between multiple energy sources.
Based on the above research, this paper constructs an optimized scheduling model for RIESs considering green certificate–carbon trading mechanisms, integrated demand response for diverse loads, and coupled equipment. Firstly, a framework for the operationalization of RIESs is proposed, which encompasses the complex coupling between various energy sources, and an optimization model considering the complementary optimization of electricity, gas, heat, and cooling is established. Then, the flexible characteristics and scheduling potential of electricity, heat, and cooling loads are considered, and an IDR model for electricity, heat, and cooling is constructed. Next, CET and GCT mechanisms are introduced into the RIES planning model to calculate the model, limiting system carbon emissions while improving system economics. Additionally, an optimized scheduling model for electric–heat–cooling RIESs with the objective of minimizing operational costs under CET and GCT mechanisms is established. Finally, the proposed models are solved using the CPLEX solver. The results indicate that the optimized scheduling model for RIESs considering IDR and green certificate–carbon trading mechanisms can effectively reduce carbon emissions and operating costs, improve energy utilization efficiency, and ensure the environmental and economic operation of RIESs.

2. Modeling of RIESs

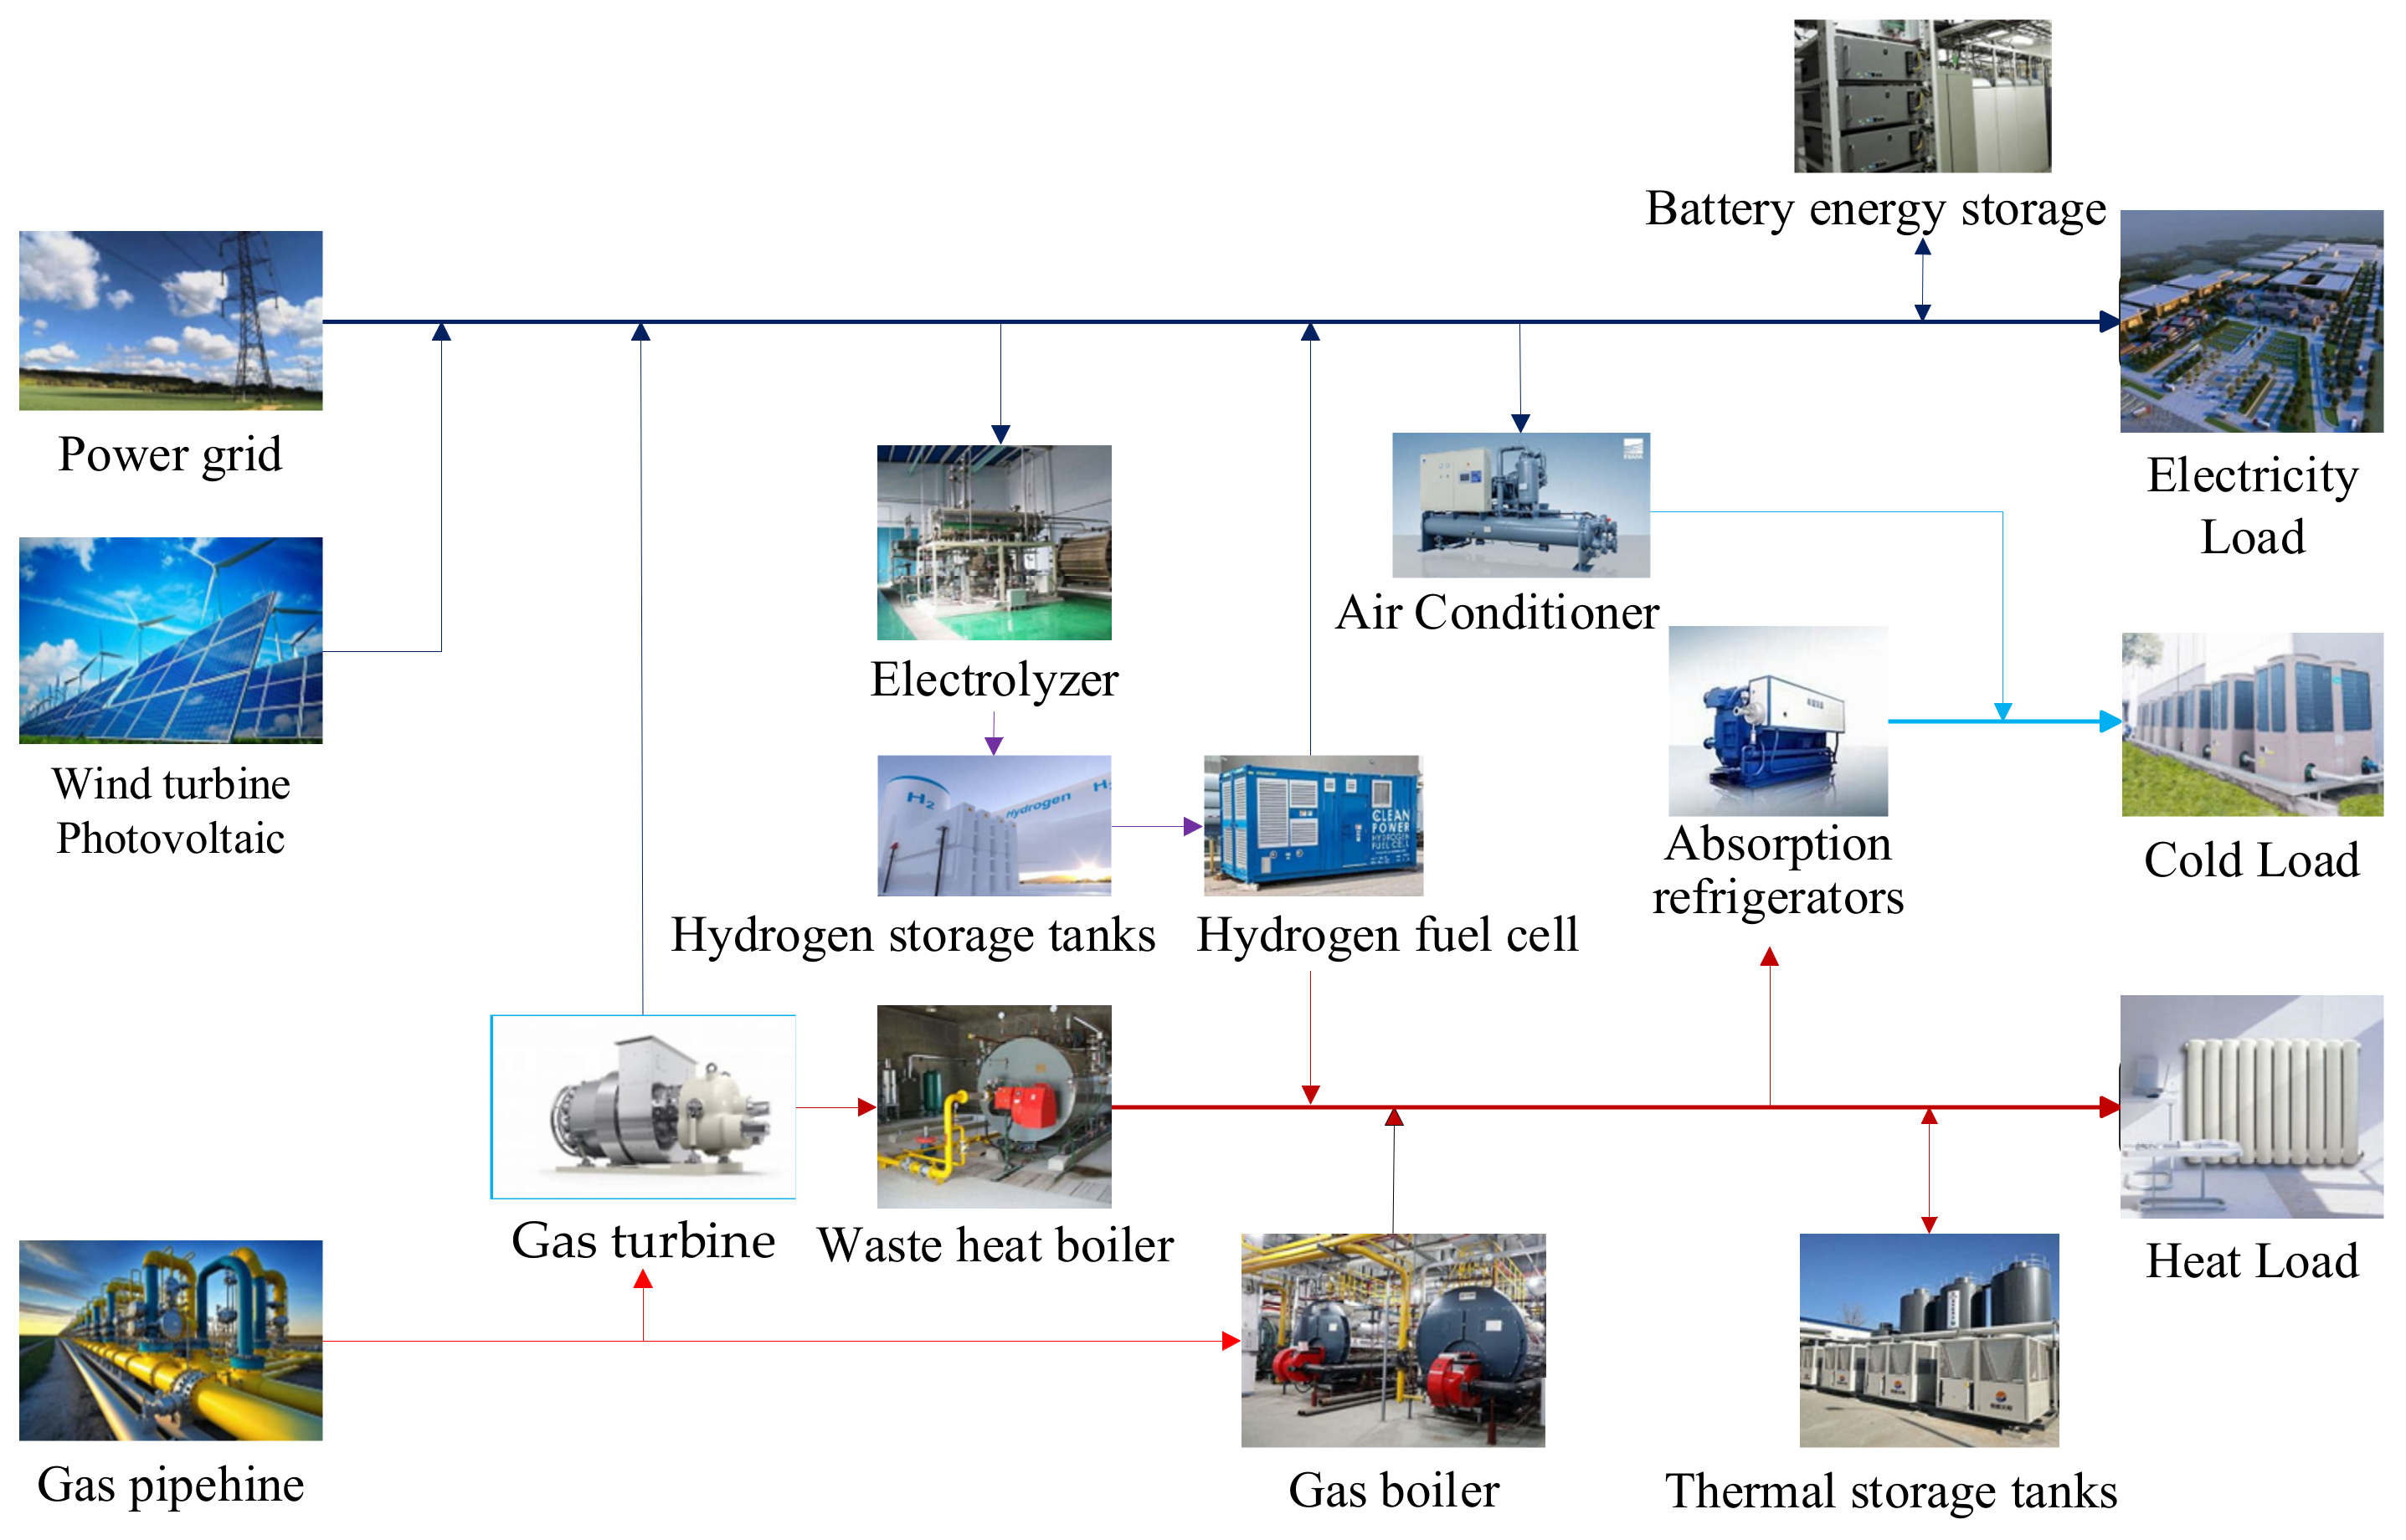
2.1. Basic Structure of RIESs

In recent years, China has faced prominent challenges regarding the integration of renewable energy and carbon emissions. The RIES, as a multi-energy coupling structure, can break down barriers between energy sources, enhance the integration level of renewable energy into the system, and reduce system carbon emissions [31]. This paper considers five forms of energy in RIESs: cold, heat, electricity, gas, and hydrogen. The basic structure of RIESs is shown in Figure 1. Within RIESs, there are various energy devices such as photovoltaic (PVs) panels, wind turbines (WTs), gas turbines (GTs), and gas boilers (GBs). Additionally, there are energy storage devices like battery energy storage (BES), thermal storage tanks (TSTs), and hydrogen storage tanks (HSTs). Energy conversion devices include waste heat boilers (WHBs), electrolyzers (ELs), hydrogen fuel cells (HFCs), absorption refrigerators (ARs), and air conditioners (ACs).

2.2. Equipment Mathematical Model

2.2.1. Gas Turbine

The relationship between the natural gas power consumed by the gas turbine, the electrical power output, and the heat recovery power can be expressed as
G GT t = V GT t H gas
P GT t = η GT G GT t
Q WHB t = P GT t η GT ( 1 η GT ) η WHB
where G GT t , P GT t , and Q WHB t , respectively, represent the input power of natural gas consumed by the gas turbine, the electrical power output of the gas turbine, and the heat recovery power of the waste heat boiler; V GT t represents the natural gas consumption of the gas turbine; H gas stands for the lower heating value of natural gas; and η GT and η WHB , respectively, denote the electrical efficiency of the gas turbine and the heat recovery efficiency of the waste heat boiler.
During GT operation, considerations must be given to both power output constraints and ramping rate constraints, namely
U GT t P GT min P GT t U GT t P GT max
P GT down P GT t P GT t 1 P GT up
where U GT t represents the start–stop status indicator of the GT at time t, where it is 1 when operational and 0 when shut down; P GT max and P GT min are the maximum and minimum output powers of the gas turbine; and P GT up and P GT down denote the upper and lower ramping rate limits of the GT.

2.2.2. Gas Boiler

The GB generates heat by burning natural gas, thereby compensating for any shortfall in heat from the WHB. The relationship between its output power and the input natural gas power is
H GB t = η GB G GB t 0 H GB t H GB max
where η GB represents the heat generation efficiency of the GB; G GB t denotes the gas consumption of the GB during time period t; and H GB max stands for the upper limit of the GB’s output thermal power.

2.2.3. Electrolytic Hydrogen Generation System

Hydrogen energy is a high-efficiency, pollution-free energy source that is widely advocated and used in today’s society. Hydrogen can be produced by electrolyzing water and has applications in various fields, such as methane reactors, hydrogen fuel cells, and hydrogen storage tanks. The electrolytic hydrogen generation system considered in this paper is illustrated in Figure 2.
EL converts electrical energy into hydrogen energy, which is then stored in hydrogen storage tanks. During operation, the hydrogen energy in the storage tanks is converted by the HFC into electrical and thermal energy. Directly converting hydrogen energy into electrical and thermal energy via the HFC, as opposed to first converting it into natural gas and then supplying it through a GB or GT, reduces one energy conversion step, thereby reducing cascading energy losses. Additionally, hydrogen energy has a higher efficiency than natural gas and does not produce CO2. It is evident that supplying hydrogen energy directly to the HFC offers multiple benefits. The energy conversion model described above can be depicted as follows:
  • EL
The EL is modeled with its power constraints and slope constraints as follows:
P EL , H 2 t = η EL P e , EL t P e , EL min P e , EL t P e , EL max Δ P e , EL min P e , EL t + 1 P e , EL t Δ P e , EL max
where P e , EL t represents the electrical energy input to EL during time period t; P EL , H 2 t represents the hydrogen energy output of EL during time period t; η EL represents the energy conversion efficiency of EL; P e , EL max and P e , EL min are the upper and lower limits of the electrical energy input to EL; and Δ P e , EL max and Δ P e , EL min are the upper and lower limits of the ramping of EL.
2.
HFC
Reference [32] indicates that the sum of the thermal and electrical energy conversion efficiencies of the HFC can be regarded as a constant, and the electrical and thermal conversion efficiencies are adjustable. Therefore, the model of a hydrogen fuel cell and its constraints can be represented by the following equations and inequalities:
P HFC , e t = η HFC , e P H 2 , HFC t P HFC , h t = η HFC , h P H 2 , HFC t P H 2 , HFC min P H 2 , HFC t P H 2 , HFC max Δ P H 2 , HFC min P H 2 , HFC t + 1 P H 2 , HFC t Δ P H 2 , HFC max κ HFC min P HFC , h t P HFC , e t κ HFC max
where P H 2 , HFC t represents the hydrogen energy input to the HFC during time period t; P HFC , e t and P HFC , h t represent the electrical and thermal energy output of the HFC during time period t; η HFC , e and η HFC , h represent the efficiencies of the HFC in converting to electrical and thermal energy; P H 2 , HFC max and P H 2 , HFC min are the upper and lower limits of the hydrogen energy input to the HFC; Δ P H 2 , HFC max and Δ P H 2 , HFC max are the upper and lower limits of the ramping of the HFC; and κ HFC max and κ HFC min are the upper and lower limits of the heat-to-power ratio of the HFC.
The mathematical model of the hydrogen storage tank refers to the battery energy storage model described later in the text and will not be elaborated here.

2.2.4. Refrigeration Equipment

  • Absorption Refrigerator
The AR utilizes liquid refrigerant to produce cooling through vaporization under low pressure and low temperature conditions. The cooling output Q AR t and the heat output power H AR t during time period t must satisfy the following constraints:
Q AR t = η AR H AR t 0 H AR t H AR max
where H AR max and η AR , respectively, represent the heat output power and the coefficient of performance (COP) of the AR.
2.
Air Conditioner
The AC cools by consuming electrical energy. The relationship between the electrical power input P AC t and the cooling output Q AC t during time period t, along with the corresponding constraints, can be expressed as follows:
Q AC t = η AC P AC t 0 P AC t P AC max
where η AC represents the coefficient of performance (COP) of the AC and P AC max is the upper limit of the AC’s electrical power output.

2.2.5. Energy Storage Devices

  • Battery energy storage
Taking into account the battery’s lifespan, the remaining charge level should be kept within a safe constraint range, thus satisfying constraints on charging and discharging power, state of charge, mutually exclusive constraints, and ramping power constraints [33], namely
U bt . chr t P bt . chr min P bt . chr t U bt . chr t P bt . chr max U bt . dis t P bt . dis min P bt . dis t U bt . dis t P bt . dis max
S O C bt t = S O C bt t 1 + ( η bt . chr P bt . chr t P bt . dis t η bt . dis ) S O C bt min S O C bt t S O C bt max
U bt . dis t + U bt . chr t 1 t = 1 24 ( U bt . dis t + U bt . chr t ) t
P bt . chr down P bt . chr t P bt . chr t 1 P bt . chr up P bt . dis down P bt . dis t P bt . dis t 1 P bt . dis up
where P bt . chr t and P bt . dis t represent the charging and discharging power during time period t; P bt . chr max , P bt . chr min , P bt . dis max , and P bt . dis min represent the upper and lower limits of the battery’s charging and discharging power; U bt . chr t and U bt . dis t are indicators of the battery’s charging and discharging states during time period t, taking values of 0 or 1 as binary variables; S O C bt t denotes the remaining state of charge of the battery during time period t; S O C bt max and S O C bt min are the upper and lower limits of the battery’s remaining state of charge; η bt . chr and η bt . dis represent the charging and discharging efficiencies of the battery; and P bt . chr down , P bt . chr up , P bt . dis down , and P bt . dis up represent the minimum and maximum ramping rates of the battery’s charging and discharging states, respectively.
2.
Thermal storage tanks
The operation of the HST is similar to that of the battery, storing heat when there is a surplus of thermal energy and releasing heat when there is high demand for heating. It needs to satisfy capacity constraints, thermal storage/discharge power constraints, and ramping rate constraints [33], namely
W tst t = W tst t 1 ( 1 γ h ) + ( η tst . chr H tst . chr t H tst . dis t η tst . dis ) W tst min W tst t W tst max
U tst . chr t H tst . chr min H tst . chr t H tst . chr max U tst . chr t U tst . dis t H tst . dis min H tst . dis t H tst . dis max U tst . dis t
U tst . d i s t + U tst . c h r t 1
H tst . chr down H tst . chr t H tst . chr t 1 H tst . chr up H tst . dis down H tst . dis t H tst . dis t 1 H tst . dis up
where W tst t represents the thermal storage/discharging amount of the TST during time period t; H tst . chr t and H tst . dis t represent the thermal storage/discharging power of the TST during time period t; γ h is the self-discharge coefficient of energy for the TST; η tst . chr and η tst . dis represent the thermal storage/discharging efficiencies; W tst max and W tst min are the upper and lower limits of the TST thermal storage/discharging; U tst . chr t and U tst . dis t are binary variables indicating the thermal storage/discharging states of the TST during time period t, satisfying mutually exclusive constraints; H tst . chr max , H tst . chr min , H tst . dis max , and H tst . dis min are the upper and lower limits of the TST thermal storage/discharging power, respectively; and H tst . chr up , H tst . chr down , H tst . dis up , and H tst . dis down are the upper and lower limits of the TST thermal storage/discharging ramping rates, respectively.

2.3. External Power Distribution Network Model

The RIES can maintain internal load balance by purchasing or selling electricity to the external power distribution network. To ensure the safe operation of the distribution network, the RIES cannot simultaneously buy and sell electricity to the grid. Additionally, the interaction power limit with the distribution network is specified within a certain range, satisfying the following constraints:
U bGrid t + U sGrid t 1
0 P bGrid t P bGrid max 0 P sGrid t P sGrid max
where U bGrid t and U sGrid t are binary variables representing the buying and selling electricity status of the RIES during period t; P bGrid t and P sGrid t represent the buying and selling power respectively; and P bGrid max and P sGrid max are the upper limits of the buying and selling power.

3. Integrated Demand Response Modeling

Traditional DR models only adjust the electricity load curve, usually by stimulating users to change their electricity usage habits by adjusting price signals. In the RIES, loads can take various forms, such as electricity, cooling, and heating, with heating and cooling having temperature-dependent characteristics and system inertia. Cooling loads and heating loads can also participate in DR optimization adjustments. Additionally, in the RIES, electricity, cooling, and heating loads can be optimized and adjusted in their respective forms while achieving coupling substitution through energy conversion devices. This paper’s DR model first targets transferable loads of users, optimizing adjustments based on the adjustability of the three types of loads. Subsequently, by utilizing energy conversion devices in RIESs, coupling and complementarity between electricity, heating, and cooling loads are realized.

3.1. Demand Esponse for Electric Load

This paper adopts price-based DR to achieve electric load transfer, guiding user-side electricity consumption through time-of-use pricing to smooth the electricity load curve, achieve peak shaving and valley filling, and enhance the reliability of RIES operation. The quantity-price elasticity matrix method is the most widely used modeling method for price-based IDR. The changes in load and electricity price are expressed through the quantity-price elasticity index, as follows:
m = Δ L L ( Δ c p c p ) 1
where m is the elasticity coefficient index of electricity quantity and price; L and c p represent the electricity consumption and price before demand response, respectively; ΔL is the relative increment of electricity consumption L; and Δ c p is the relative increment of price c p .
Based on the ratio of time-of-use pricing to fixed pricing, we construct the quantity-price elasticity matrix η e :
η e = η 11 η 12 η 1 m η 21 η 22 η 2 m η n 1 η n 2 η nm
η i i = Δ L i L i ( Δ c p i c p i ) 1
η i j = Δ L i L i ( Δ c p j c p j ) 1
where η i i and η i j represent the own elasticity coefficient and cross elasticity coefficient, respectively; L i and Δ L i represent the response quantity and its relative increment in period i; and c p i , Δ c p i , c p j and Δ c p j represent the electricity price and its relative increment in periods i and j, respectively.
Flexible electric load refers to the transferable electric load, indicating the portion of electric load that can be shifted based on user-side electricity demand within a specified time period. User-side electric load comprises fixed electric load and transferable electric load, which can be expressed as
P t = P f e l t + P s e l t = L i + L i η e Δ c p i c p i
where P f e l t is the fixed load at time t, which has high reliability requirements and cannot be shifted; and P s e l t is the shiftable electric load at time t, which users can autonomously adjust based on electricity price information, subject to the following constraints:
0 P s e l t P s e l m a x
t = 1 T P s e l t Δ t = W s e l
where P s e l m a x is the upper limit of shiftable electric load at time t and W s e l is the total amount of shiftable electric load over T periods of response time, which means the total shiftable load remains equal before and after demand response. Due to significant fluctuations in electric load, the shiftable load in this paper is set to be 20% of the total load.

3.2. Demand Response for Heating/Cooling Load

Heating load exhibits perceptual fuzziness and time delay characteristics, with demand response primarily focusing on hot water demand. Temperature serves as the primary regulation scale for heating load, with users having relatively low sensitivity to it. Changes in temperature values during comfortable periods do not significantly affect users, and the acceptable range of water temperature can be represented as [ T h , min , T h , max ]. Therefore, DR for controlling heating load should be maintained within a specific range:
H min t H t H max t H min t = γ ρ w V c t ( T h , min T h , in ) Δ t H max t = γ ρ w V c t ( T h , max T h , in ) Δ t
where H t is the thermal load power during time period t; H max t and H min t are the upper and lower limits of thermal load power during time period t; γ represents the specific heat capacity of water and ρ w denotes the density of water, and considering the negligible influence from water temperature changes, their values are set as constants, with parameters set, respectively, as 1.1667 × 10⁻³ (kW·h/kg·°C) and 1000 (kg/m3); V c t is the volume of cold water injected during time period t; T h , in is the initial water temperature, set to 15 °C; and Δ t is the time step, taken as 1 h.
The DR principle for cooling load is roughly similar to that of heating load. Taking into account user sensitivity to cooling load, the acceptable range for controlling room temperature is represented as [ T c , min , T c , max ]. Therefore, DR for controlling cooling load should also be maintained within a specific range:
Q min t Q t Q max t Q min t = ( T out t T c , min ) Δ t R d Q max t = ( T out t T c , max ) Δ t R d
where Q t represents the cooling load power during time period t; Q max t and Q min t are the upper and lower limits of cooling load power during time period t; T out t denotes the outdoor temperature during time period t; and R d is the thermal resistance, taken as 18 (°C/kW).
The flexible heating/cooling load in this paper refers to transferable loads. User heating/cooling load comprises fixed heating/cooling load and transferable heating/cooling load, represented as
H t = H fhl t + H shl t Q t = Q fhl t + Q shl t
where H fhl t and Q fhl t represent fixed heating/cooling load during time period t, and H shl t and Q shl t denote transferable heating/cooling load during time period t, subject to the following constraints:
0 H shl t H shl max 0 Q shl t Q shl max
t = 1 T H shl t Δ t = W h , shl t = 1 T Q shl t Δ t = W q , shl
where H shl max and Q shl max represent the upper limits of transferable heating/cooling load during time period t, and W h , shl and W q , shl denote the total amount of transferable heating/cooling load over T time periods, meaning the total amount of transferable load remains unchanged before and after demand response. Due to high reliability requirements for heating/cooling load, the transferable load in this paper is set at 10% of the total load.

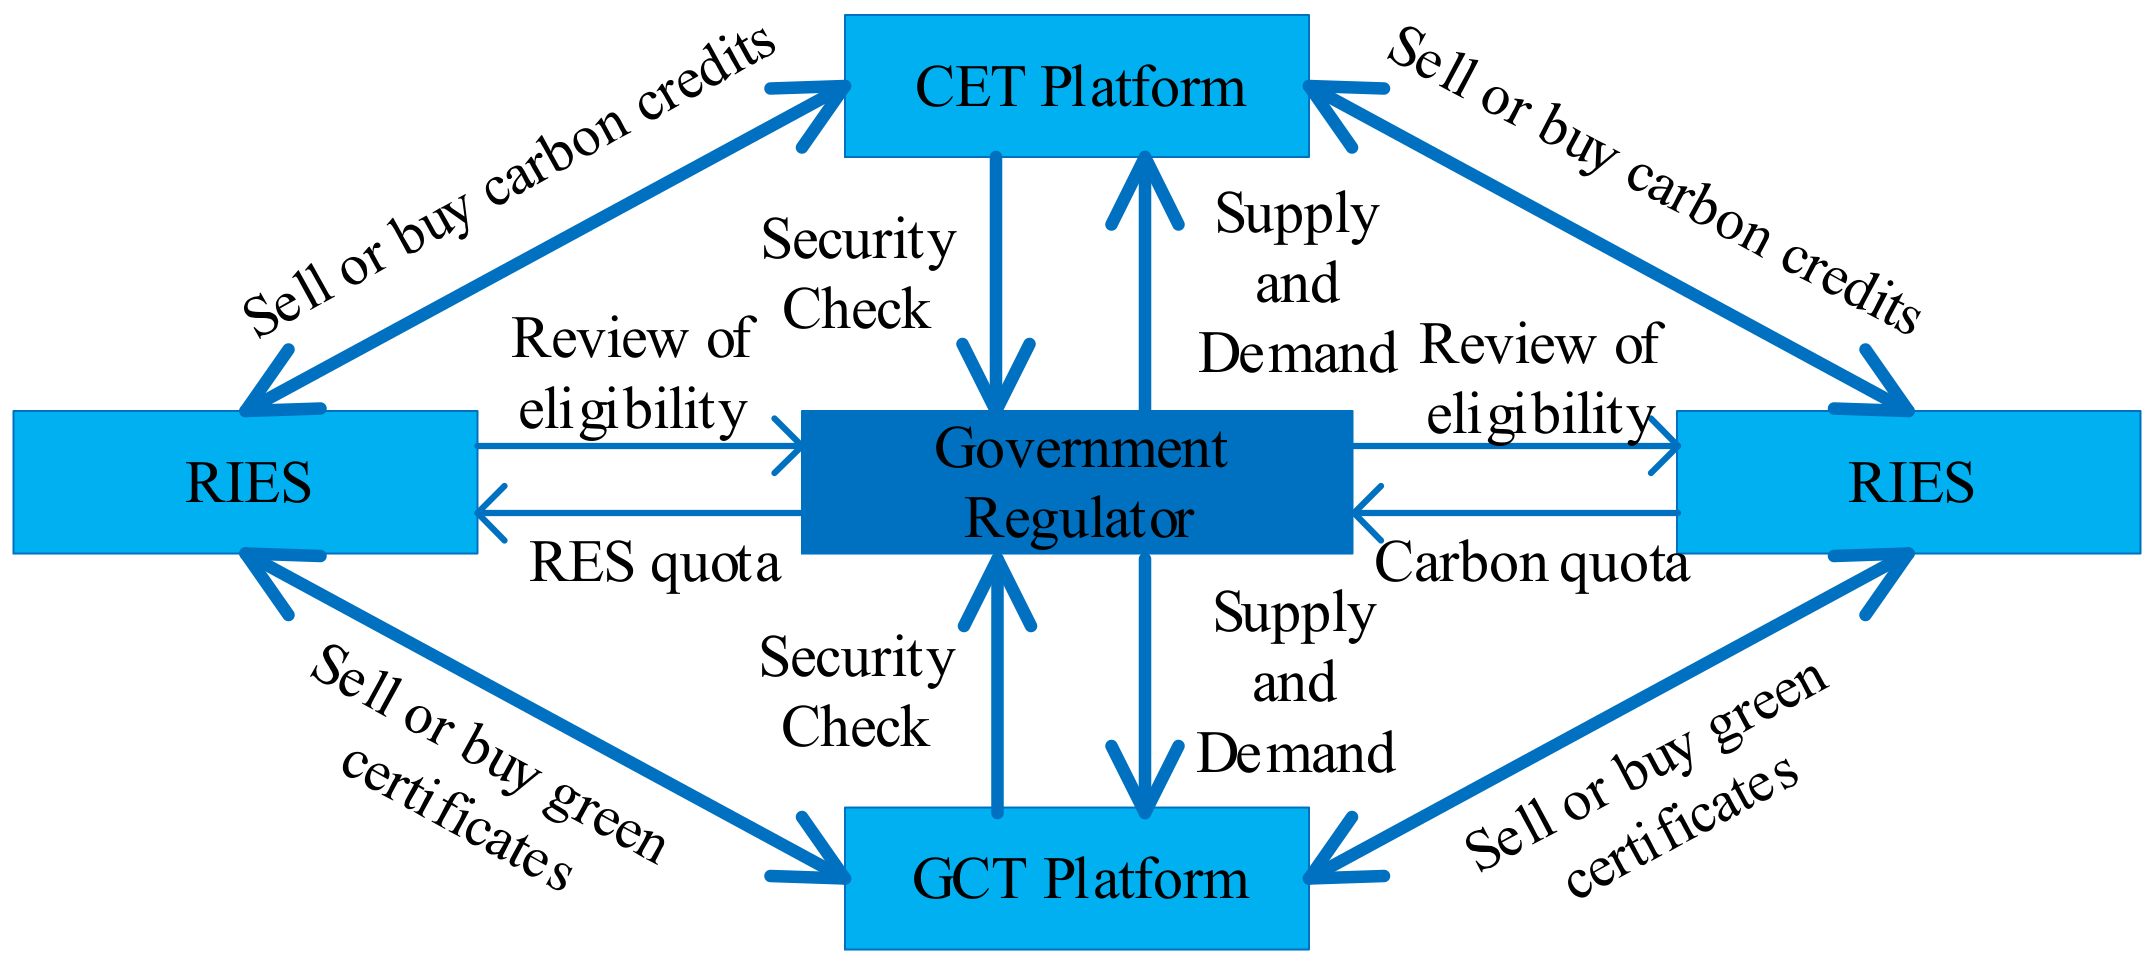
4. Green Certificate—Carbon Emission Trading Modeling

Currently, China primarily employs GCT and CET mechanisms to regulate carbon emissions from energy enterprises. This section presents the framework of the IES green certificate–carbon emission joint trading mechanism, which is constructed on the foundation of both CET and GCT mechanisms, as illustrated in Figure 3. The following section introduces and models the CET mechanism and GCT mechanism.

4.1. Green Certificate Trading Modeling

RPS is a measure implemented by a country or region through legal means to regulate the amount of electricity generated by different types of renewable energy sources or their proportion in the overall energy supply. This quota system is an important means to promote the development of renewable energy and serves as an economic management tool by legally obligating entities to participate in and fulfill the consumption of renewable energy.
The GCT mechanism is a trading policy adopted to facilitate the effective implementation of RPS. Its principle is based on quotas for renewable energy generation. If the renewable energy generation in the system is less than the quota, green certificates need to be purchased; if the renewable energy generation exceeds the quota, green certificates are sold for profit. The GCT model can be represented as
P res = κ gc P Load t
C gc = P res P N 1000 c gc b + β p ( P res P N ) , P N < P res P res P N 1000 c gc s , P N P res
where P res represents the daily quota of renewable energy; κ gc stands for the renewable energy quota coefficient; P Load t is the total electricity demand of the system during the scheduling period; P N is the actual consumption amount; C gc represents the cost or revenue of green certificates, where C gc 0 indicates green certificate costs, and C gc < 0 indicates green certificate revenue; c gc b and c gc s are the buying and selling prices of green certificates, respectively; and β p is the penalty coefficient.

4.2. Carbon Emission Trading Modeling

The essence of the CET mechanism lies in treating carbon emissions as tradable commodities, with regulatory authorities setting emission rules and allocating corresponding emission quotas. This can stimulate energy-supplying enterprises to respond to energy conservation and emission reduction, thereby reducing total carbon emissions.
The free carbon emission quotas of RIESs are determined through the baseline method, which considers that the allocation of carbon emission rights in RIESs mainly includes CCHPs, GBs, and conventional generating units.
E p = E h + E GB + E CCHP
E h = n = 1 N δ p P buy
E GB = n = 1 N δ h H GB t
E CCHP = n = 1 N δ h ( φ P GT t + H WHB t + Q AR t )
where E h , E GB , and E CCHP represent the free carbon emission quotas for external grid purchase, GBs, and CCHPs, respectively; E p is the total carbon emission allocation for RIESs; N is the total number of carbon emission devices; δ p and δ h represent the carbon emission quotas per unit of electricity purchased from the grid and per unit of heat from GBs, respectively, with values of 0.728 t/(MW·h) and 0.102 t/(GJ); P buy is the electricity purchased from the external grid; and φ is the conversion factor for converting electricity generation into heat generation.
The cost of CET can be expressed as
C CO 2 = c c ( E c E p )
where c c represents the CET price, and E c denotes the actual carbon emissions of RIESs. The carbon emissions of GBs and CCHPs are 0.065 t/(GJ), and for coal-fired power plants, the carbon emissions are 1.08 t/(MW·h).

5. Optimization Model for RIESs Based on Multi-Energy Complementarity

5.1. Objective Function

In this paper, an optimization operation model for an integrated cooling, heating, and power cogeneration-type multi-energy system considering IDR is proposed. By considering various forms of energy storage, energy conversion devices, and multi-energy complementary characteristics, the optimal output plan for each unit is jointly formulated from both the supply and demand sides. The operation of the RIES in this paper is formulated as a mixed-integer linear programming problem, with the optimization objective of minimizing the total operating cost, namely
min F = C grid + C ng + C e + C b + C d + C CO 2 + C gc
where C grid , C ng , C e , C b , and C d represent the RIES purchasing electricity cost, GT generation cost, battery charge-discharge loss cost, boiler operation cost, and equipment operation maintenance cost, respectively, expressed as
C grid = t = 1 24 P grid t c rb t
C ng = t = 1 24 c gas t P GT t LHV gas
C e = t = 1 24 c ees t ( U bt . chr t + U bt . dis t )
C b = t = 1 24 c gas t H GB t η GB
C d = i K i P i t
where P grid t and c rb t represent the purchased electricity power and unit electricity price of the RIES during time period t, respectively; c gas t is the unit gas price of natural gas during time period t; c ees t is the unit loss cost of the battery; LHV gas is the lower heating value of natural gas, usually taken as 9.78 (kW·h/m3); K i represents the unit operation maintenance cost of equipment i in the RIES (including WHBs, ARs, ACs, ESs, TSTs, PVs, WTs, GTs, GBs, etc.); and P i t is the input power of equipment i operating during time period t.

5.2. Constraints

In addition to considering the operational constraints of each device in the RIES, it is also necessary to consider the power balance of electricity, heat, and cooling.
  • Electric Power Balance Constraints:
P WT t + P GT t + P bt . dis t + P PV t P AC t + P bGrid t P sGrid t + P HFC , e t = P fel t + P sel t + P bt . chr t + P e , EL t
2.
Thermal Power Balance Constraints:
H WHB t + H GB t H AR t + H tst . dis t + P HFC , h t = H fhl t + H shl t + H tst . chr t
3.
Cooling Power Balance Constraints:
Q AR t + Q AC t = Q fhl t + Q shl t

6. Case Study Analysis

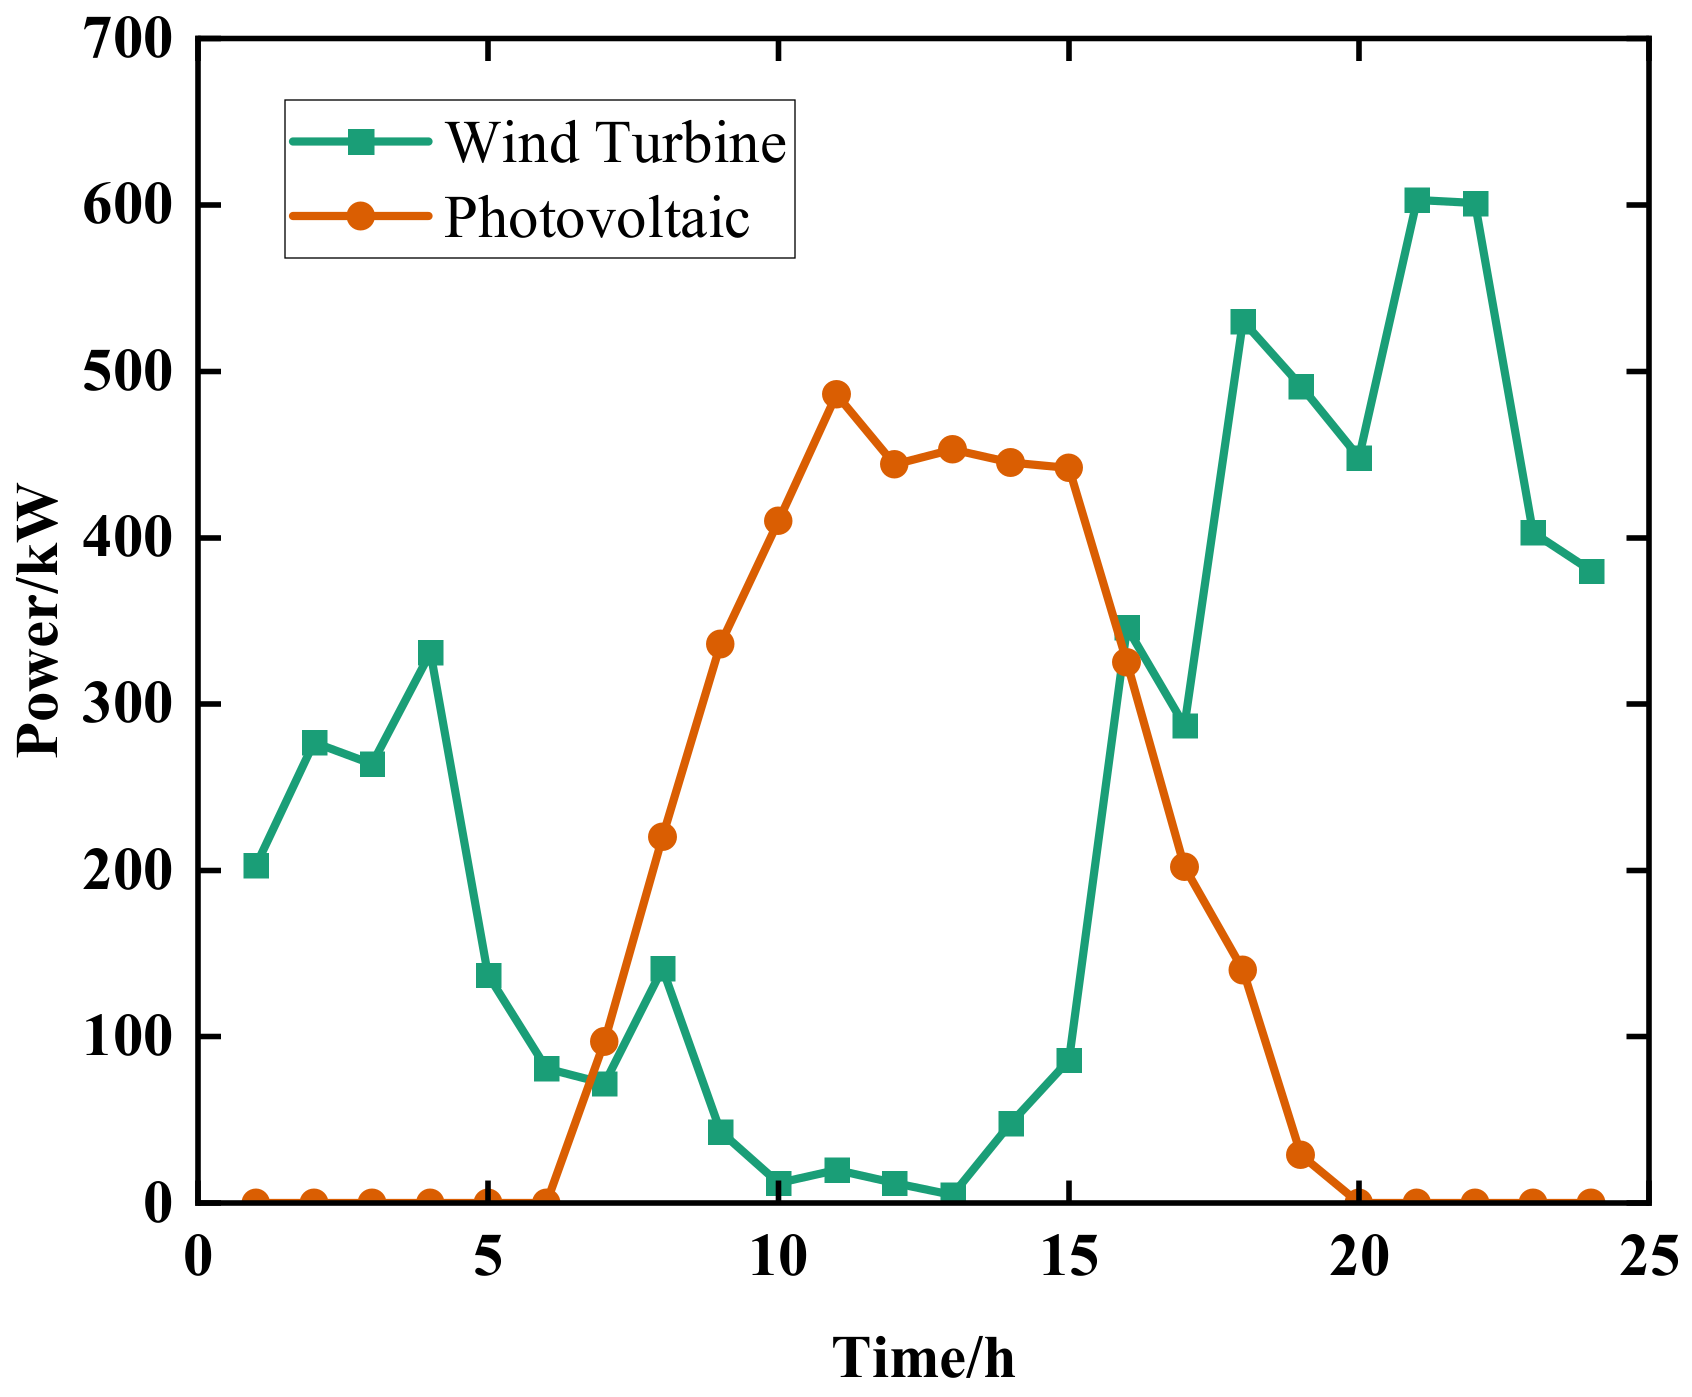
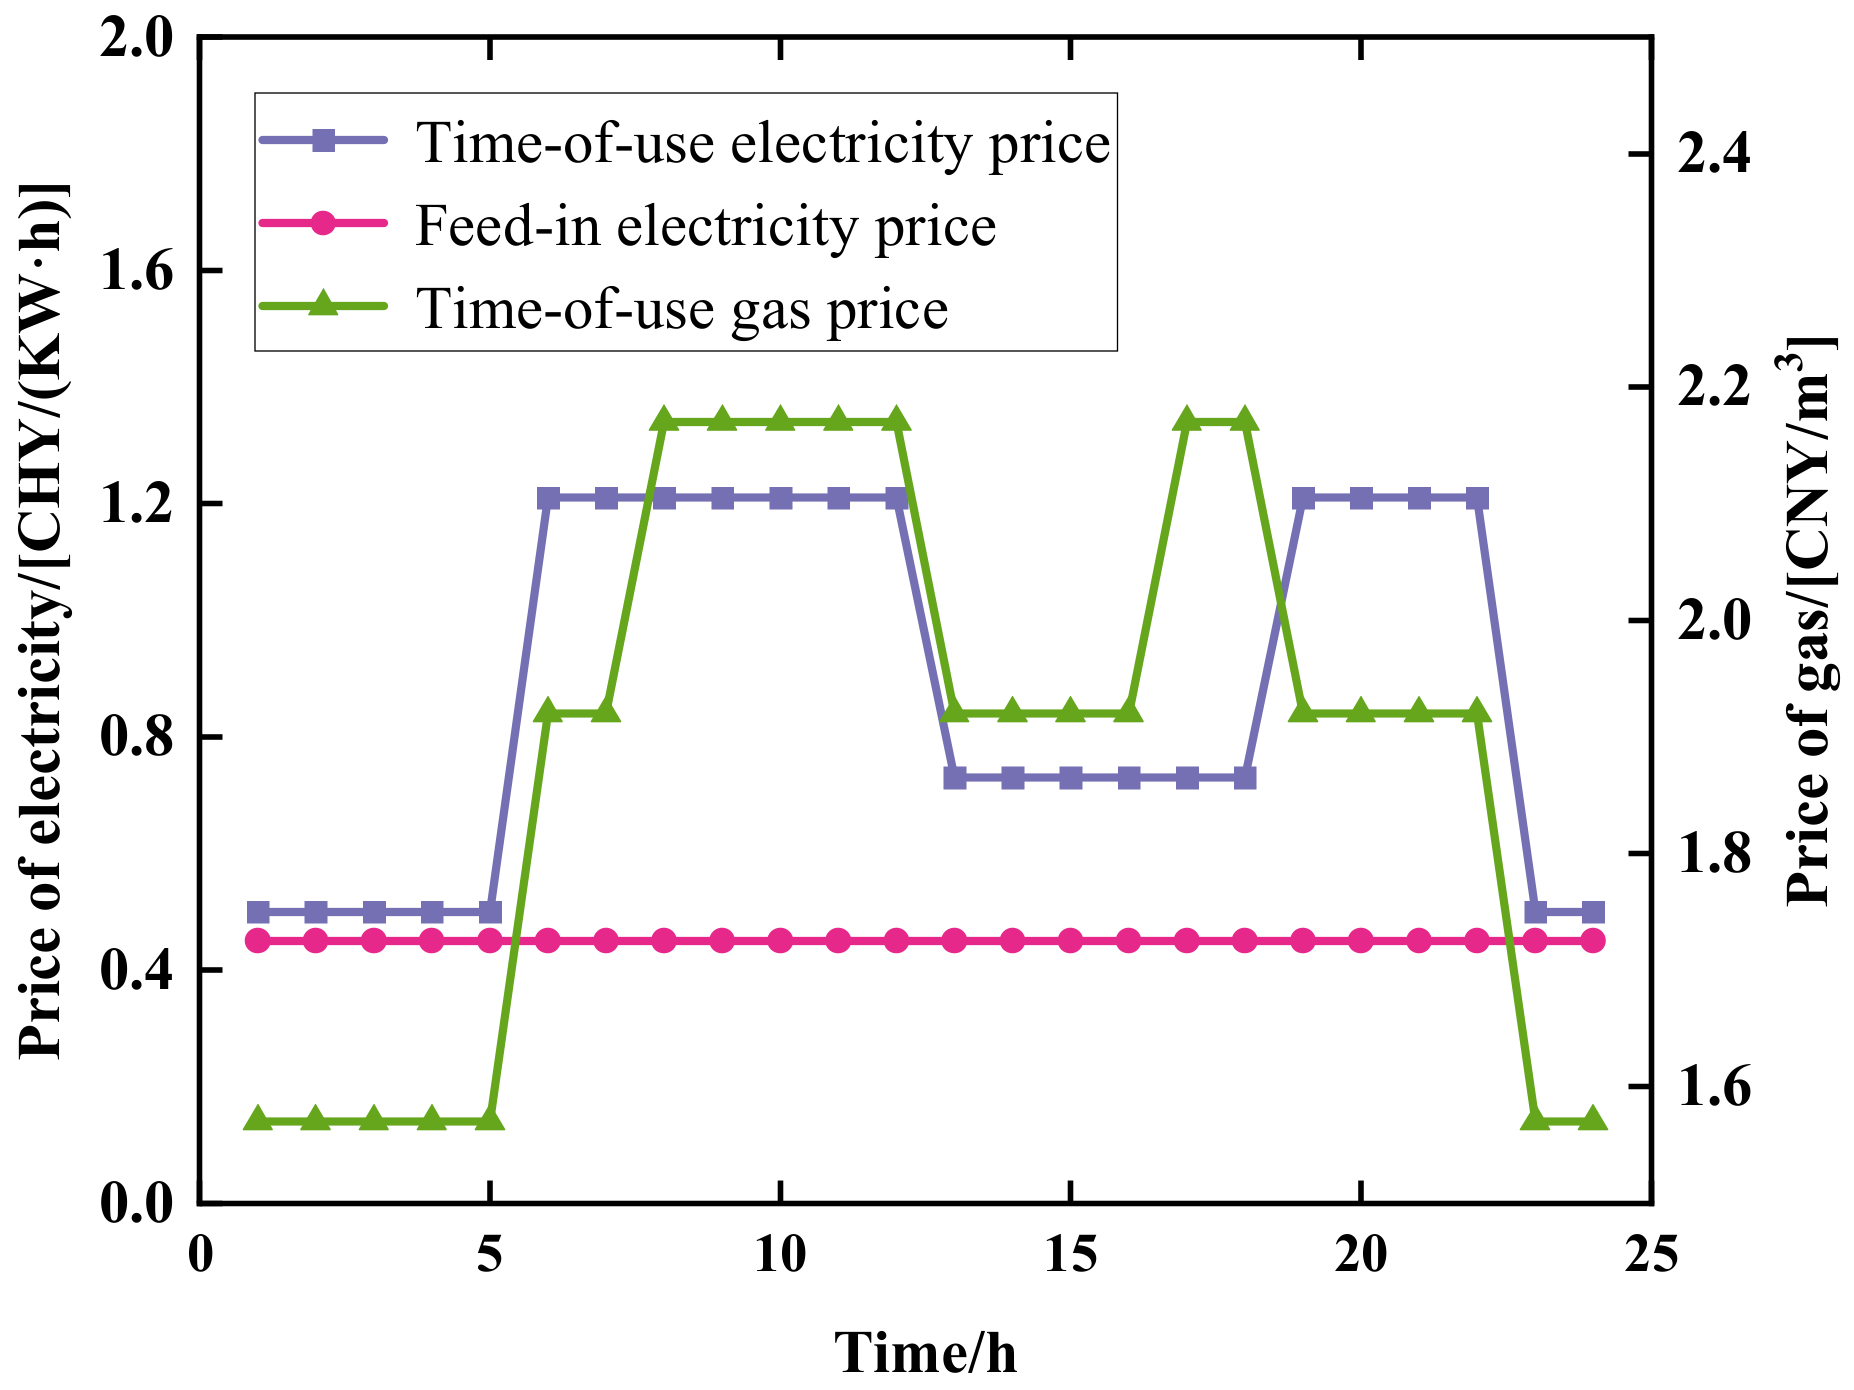
6.1. Introduction to Basic Case Data

To validate the advantages of the RIES optimization scheduling model proposed in this paper, which considers integrated demand response and a green certificate–carbon trading mechanism, in terms of economic operation, enhancing the utilization of renewable energy, and smoothing load curves, this chapter conducts a case simulation based on the energy supply and demand data, unit equipment parameters, and load data from a certain region in Xinjiang, China. Corresponding typical user cold and heat load forecast curves, as well as wind turbine and photovoltaic forecast power curves, are shown in Figure 4 and Figure 5. The internal equipment parameters of RIESs are listed in Table 1. Figure 6 illustrates the peak–valley time-of-use electricity prices and time-of-use gas prices. Based on historical trading data from the green certificate subscription trading platform, and considering the purchase and sale of wind power green certificates, the renewable energy quota coefficient ( κ gc ) is set at 12.5%, and the green certificate price is 0.1286 CNY/kW·h (equivalent to CNY 128.6 per certificate).

6.2. The Impact of Different Scheduling Models on Simulation Results

To verify the advantages of the multi-energy complementary RIES model considering IDR and green certificate–carbon trading, this paper designs the following three optimization scheme simulations for comparison:
  • Scheme 1: Only considering the coupling and optimization of electricity, heat, and cooling, without considering the green certificate–carbon trading mechanism and IDR.
  • Scheme 2: Considering the optimization of electricity, heat, and cooling multi-energy coupling along with IDR, but not taking into account the green certificate–carbon trading mechanism.
  • Scheme 3: Considering the optimization of electricity, heat, and cooling multi-energy coupling with the inclusion of the green certificate–carbon trading mechanism and IDR.
The scheduling results of the three optimization scheduling models are shown in Table 2; the scheduling balance for Schemes 1 and 2 is shown in Figure 7 and Figure 8; and the scheduling balance for Scheme 3 is shown in Figure 9.
Compared to Scheme 1, Scheme 2 considers IDR from the user side, enabling users to adjust their energy usage strategies reasonably by responding to electricity and natural gas prices. Users actively shift their electricity loads from peak to off-peak hours under the incentive of time-of-use electricity pricing, thereby reducing the interaction cost between the RIES and the grid. Consequently, Scheme 2 reduces total costs by 4.5% and carbon emissions by 3.7% compared to Scheme 1.
Scheme 3 builds upon Scheme 2 by incorporating the green certificate–carbon trading mechanism. Due to the relatively lower carbon emissions from GTs and GBs, additional carbon trading revenue can be obtained, incentivizing the equipment units to increase output and reduce the purchase of electricity from the external grid, thereby lowering the total carbon emissions. As shown in Table 2, although the operational cost of Scheme 3 is higher than Scheme 2, the total cost is lower due to the additional carbon trading revenue. Consequently, compared to Scheme 2, Scheme 3 further reduces the system’s total cost by 7.8% and decreases carbon emissions by 6.5%. Ultimately, compared to Scheme 1, Scheme 3 achieves reductions of 11.9% and 10.0% in total system costs and carbon emissions, respectively.
In conclusion, considering that the green certificate–carbon trading cost calculation model can effectively reduce the total operating cost of the system, incorporating IDR to achieve rational scheduling arrangements has specific advantages in reducing the total carbon emissions of RIESs. Therefore, the strategies proposed in this paper can achieve a win–win situation for both the economy and the environment of the system. Next, a specific supply–demand balance analysis will be conducted based on the scheduling results of Scheme 3.

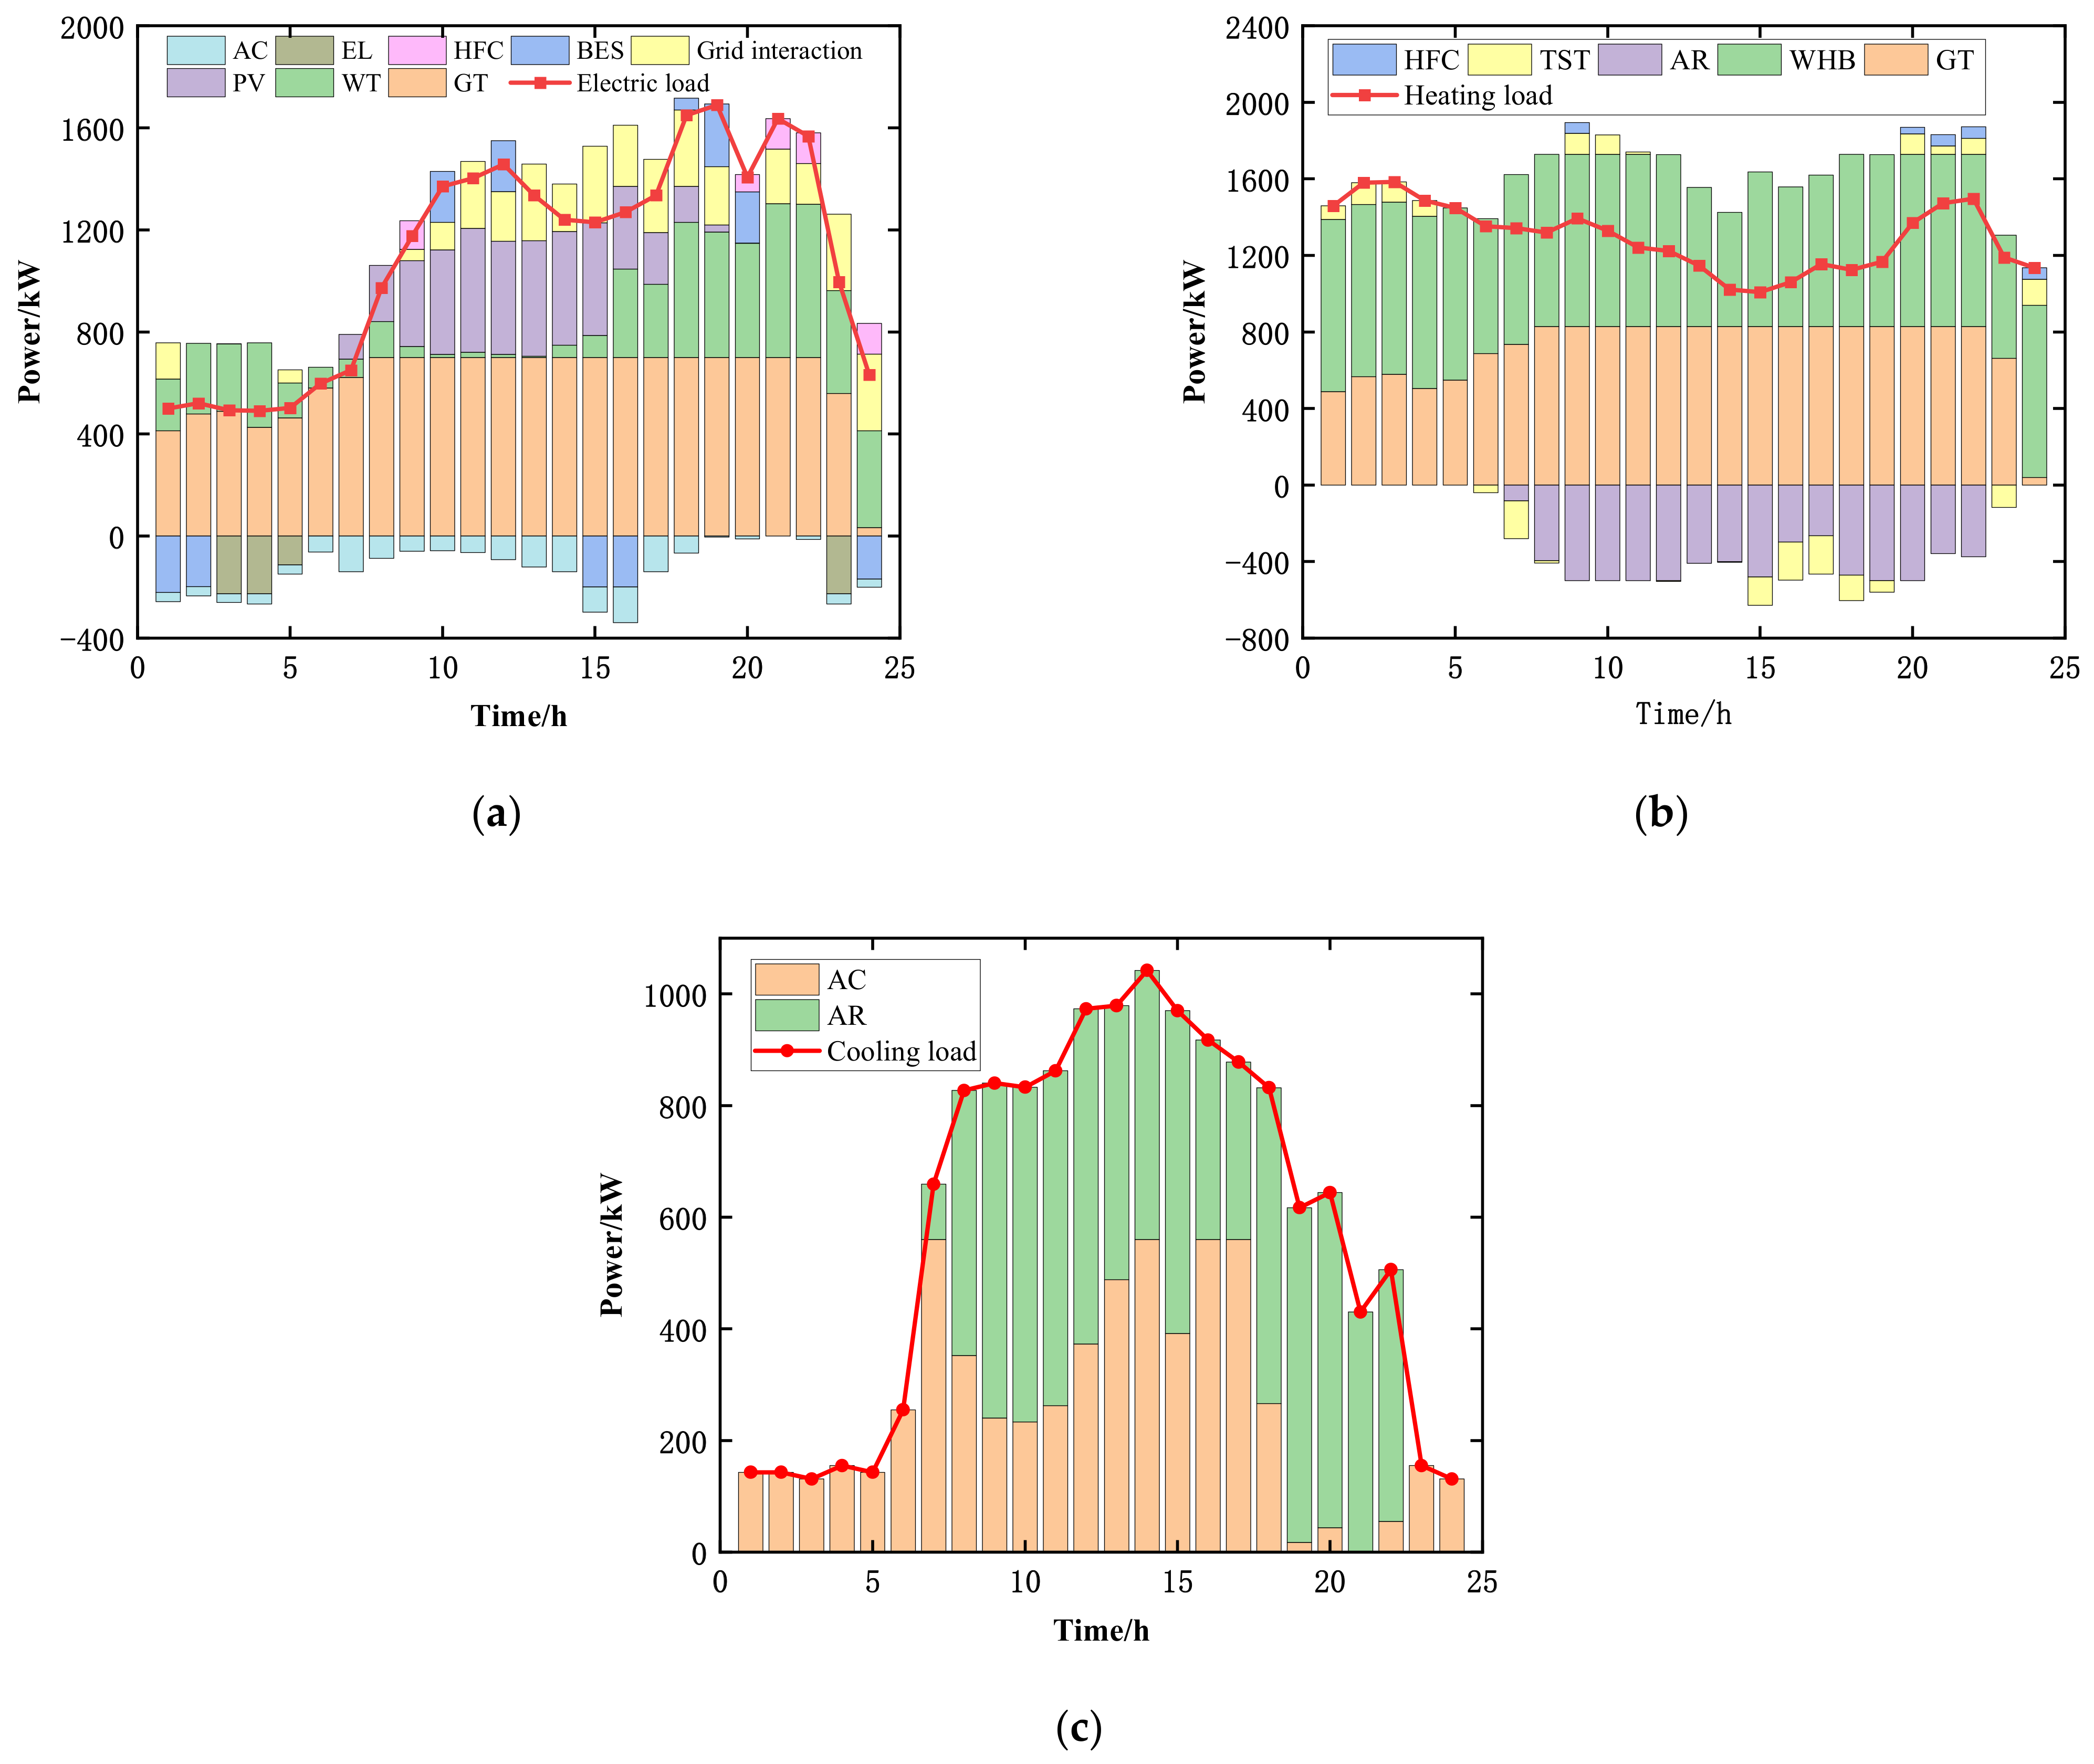
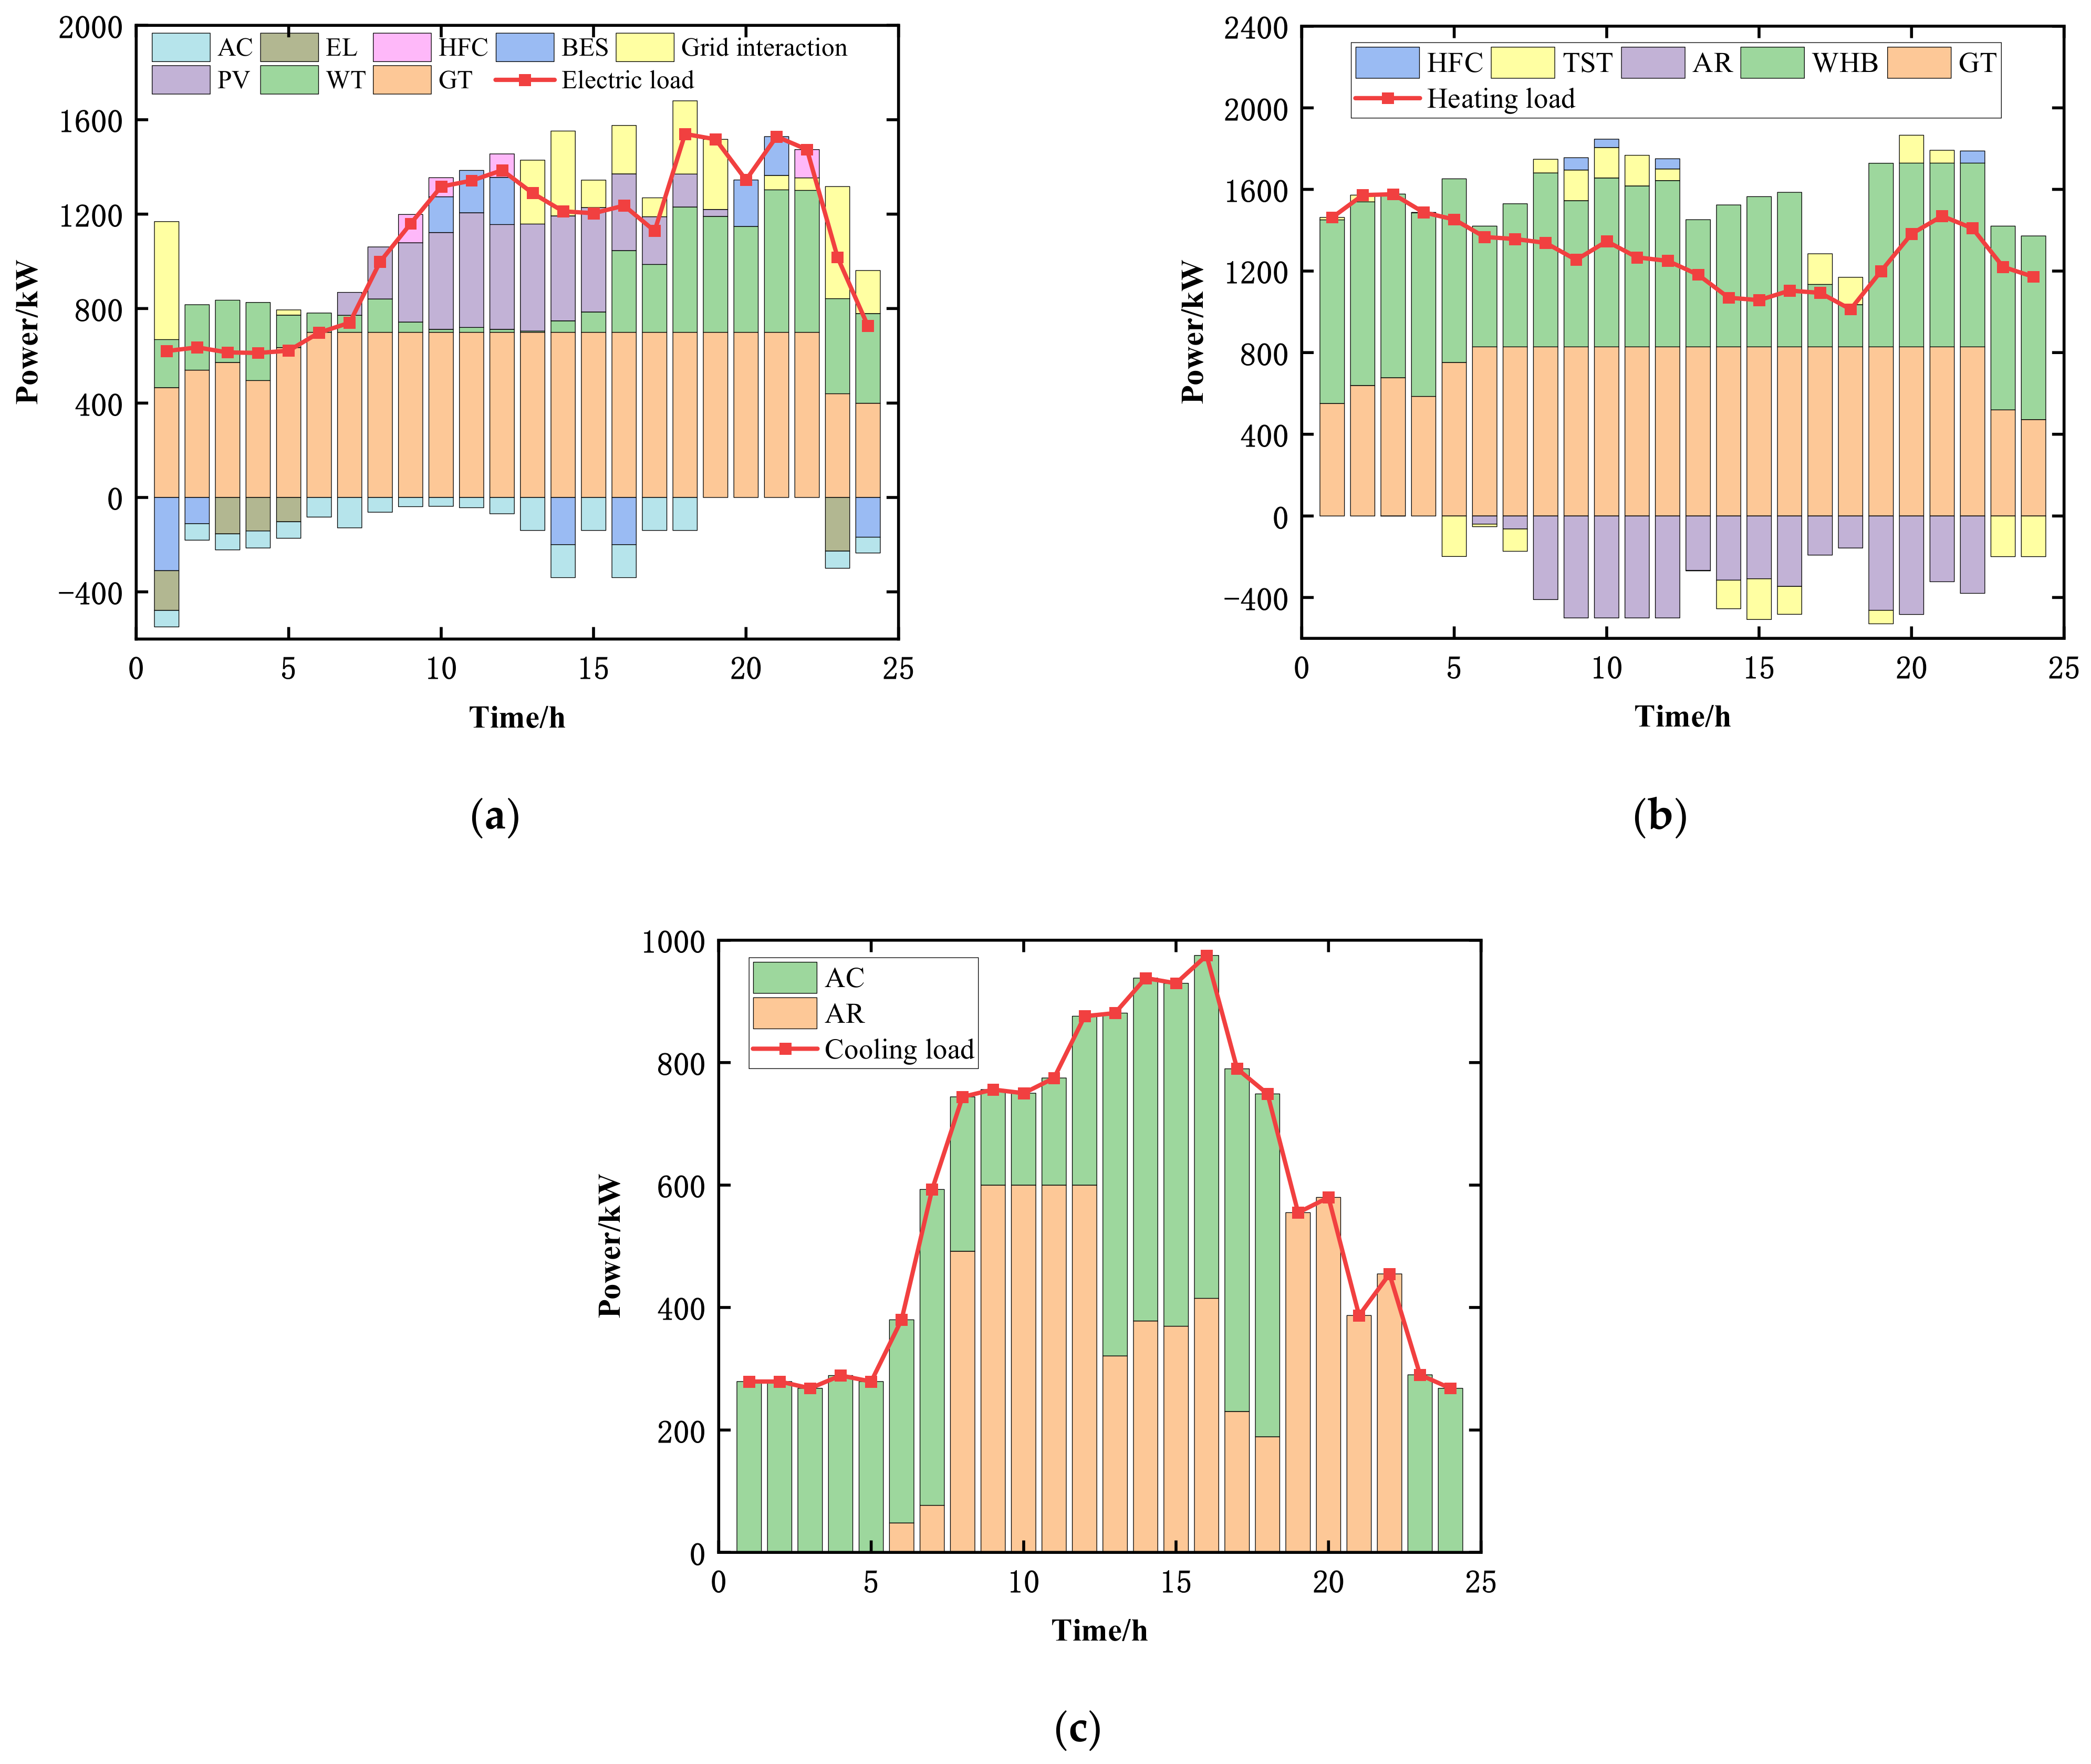
6.3. Analysis of Supply–Demand Balance

The optimized scheduling results of electricity, heat, and cooling considering the green certificate–carbon trading mechanism and integrated demand response (Scheme 3) are shown in Figure 9. Firstly, during the period from 23:00 to 6:00, when the user’s electricity demand is low, electricity load is mainly provided by GT and WT output. Since there is relatively little pressure on GT supply during this period, it operates at a higher output level, with surplus electricity either sold to the external grid for revenue or stored by battery storage systems and electrolysis hydrogen systems. During the periods from 7:00 to 10:00 and 15:00 to 17:00, when the user’s electricity load is at its average level, it is primarily supplied by GTs, PVs, and WTs, with any shortfall being supplemented by purchasing electricity from the external grid. However, during the periods from 11:00 to 14:00 and 18:00 to 22:00, when the user’s electricity load is at its peak, the demand is higher. In addition to GT, PV, and WT output, the electricity load also needs to be supplemented by discharging from battery storage systems and fuel cells, with any shortfall being compensated by purchasing from the external grid.
The analysis approach for the user’s heat and cooling loads is similar to that of the electricity load. The user’s heat load is mainly provided by GT, GB, and TST output, while the user’s cooling load is primarily supplied by AC and AR output.
The output of the electrolysis hydrogen system is shown in Figure 10. Hydrogen gas is generated during the operation of the electrolyzer from 3:00 to 5:00 and at 23:00. The hydrogen fuel cell operates from 11:00 to 12:00 and from 21:00 to 22:00, utilizing the hydrogen gas for combined heat and power generation.

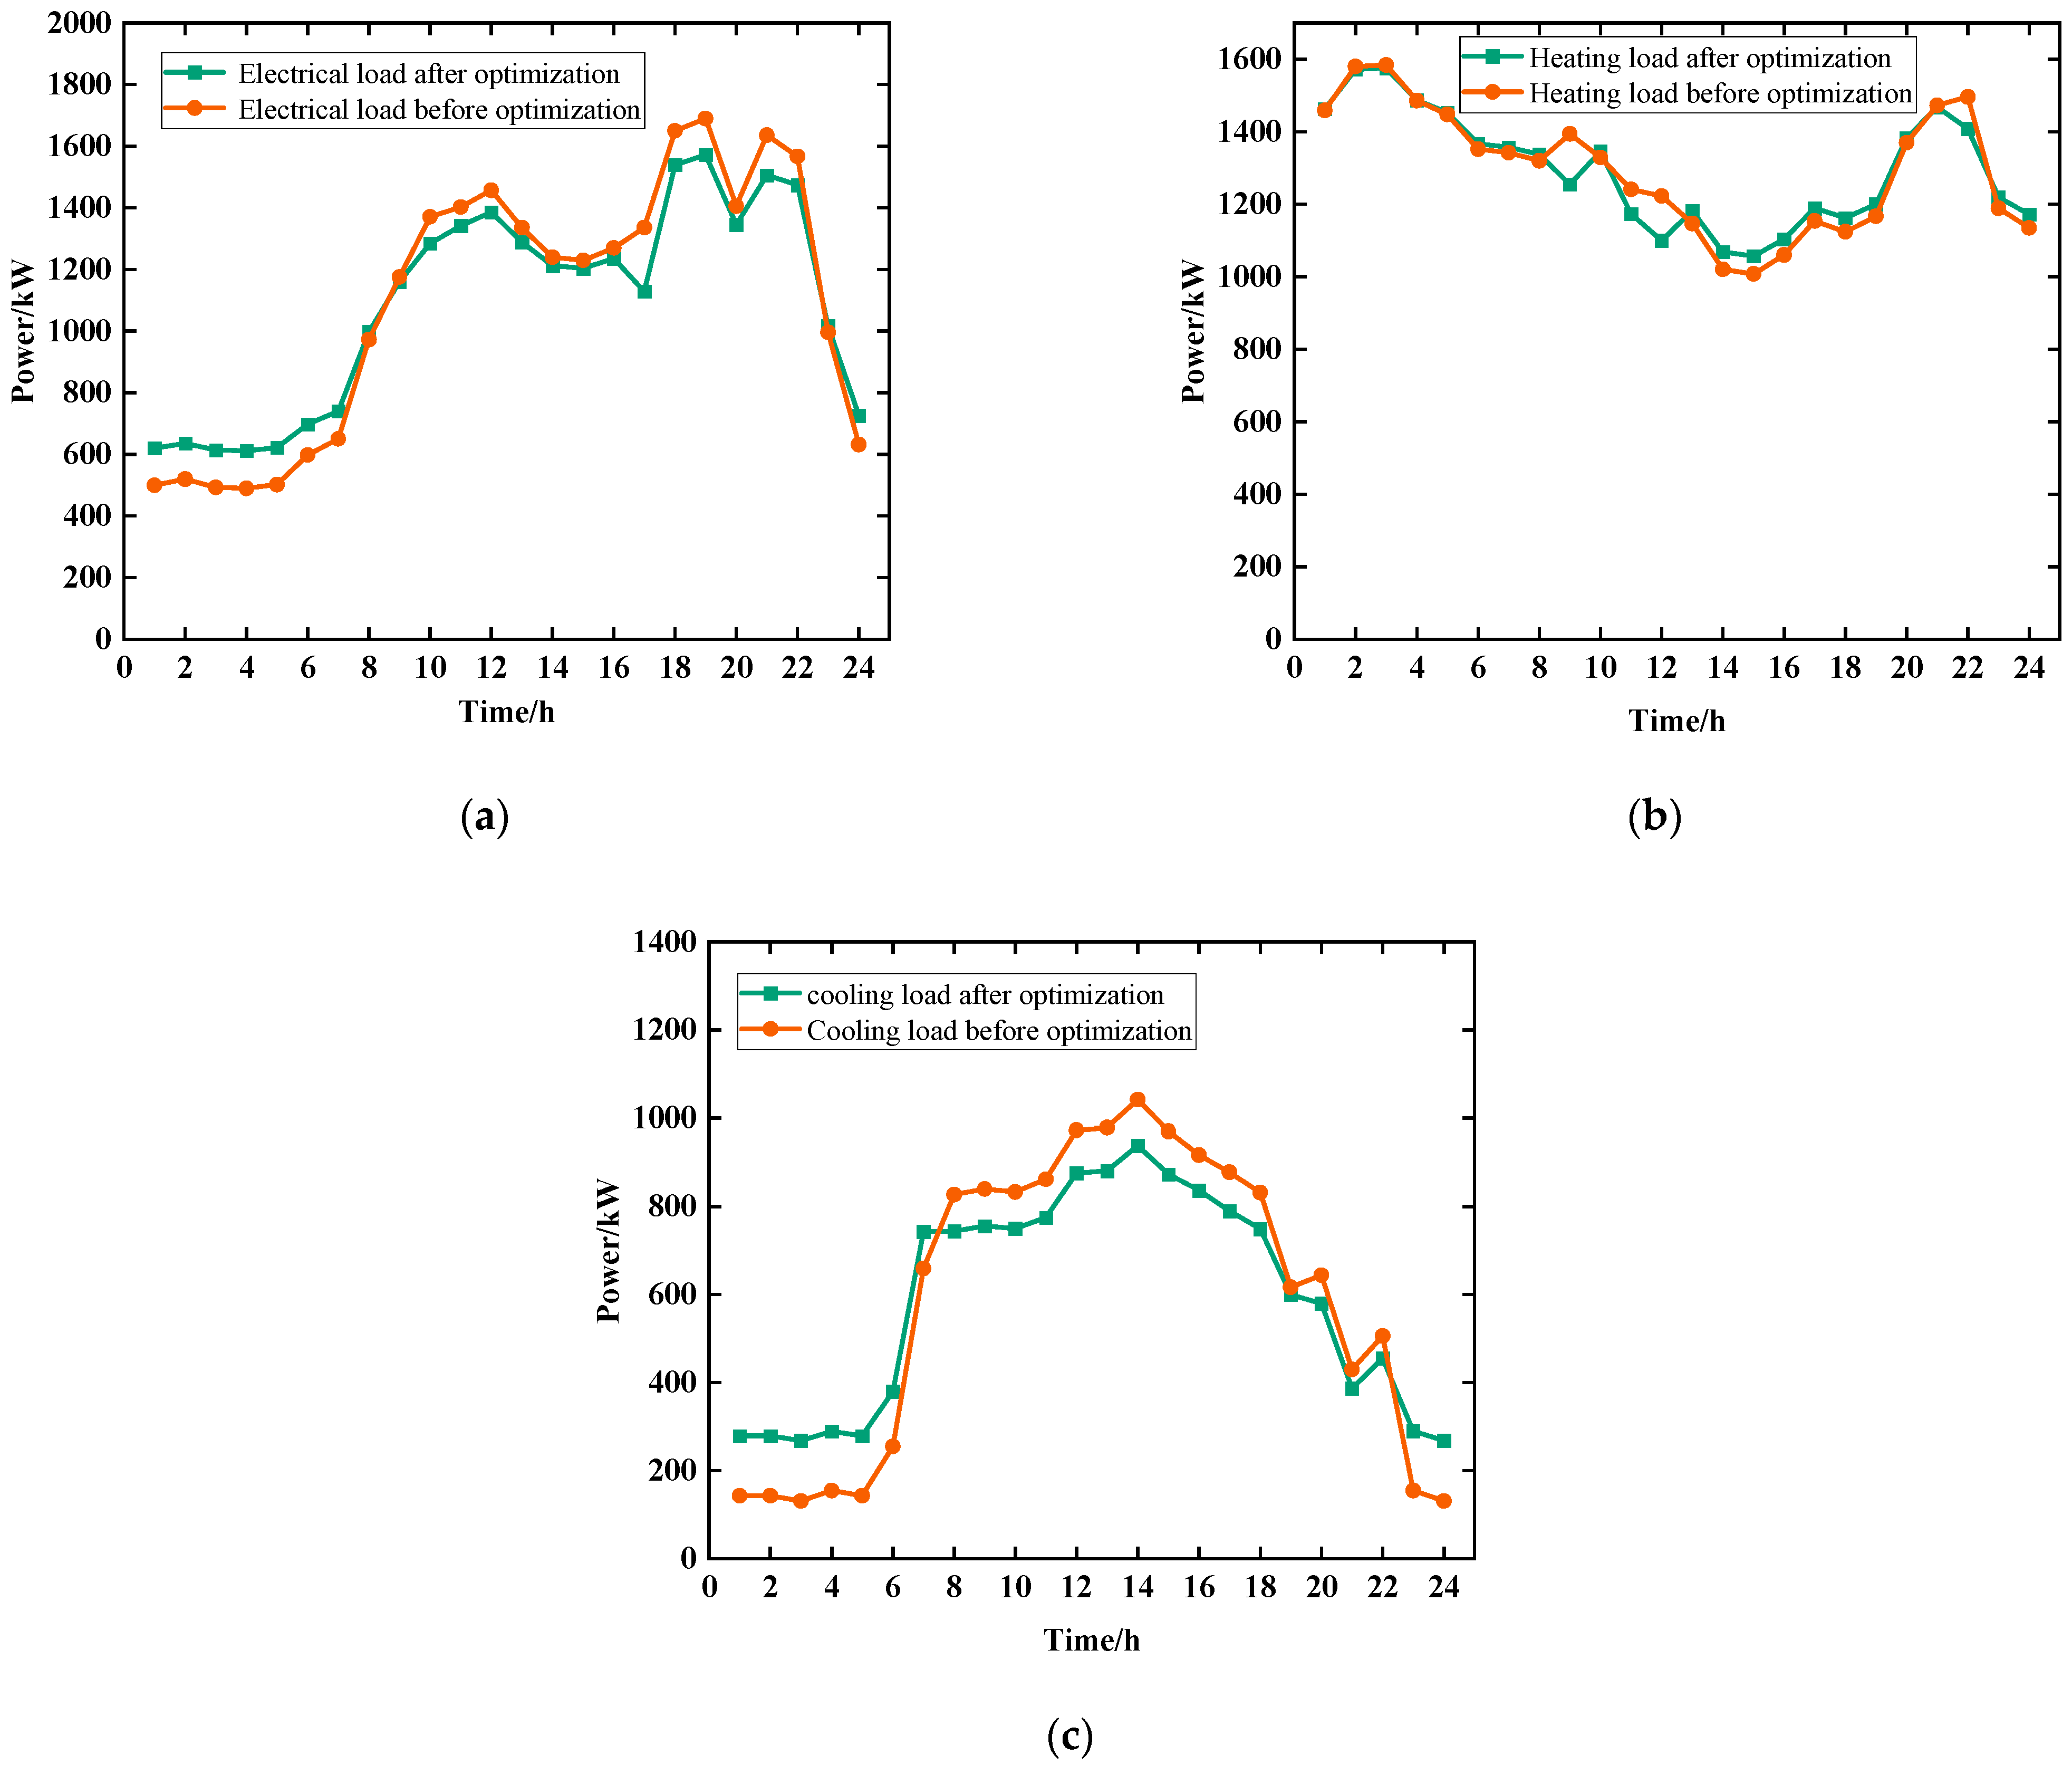
6.4. Before and after Integrated Demand Response Load Curves

The cold, heat, and electricity load curves before and after integrated demand response are shown in Figure 11. Considering integrated demand response, the peak-to-valley differences in electricity, heat, and cold loads for users decreased by 9.82%, 4.35%, and 6.78%, respectively, compared to before demand response, effectively smoothing the user energy consumption curve. Firstly, analyzing the electricity load curve in Figure 11a, incentivized by electricity prices, users exhibit a “peak-shaving and valley-filling” trend in their electricity load curves before and after price-based integrated demand response, aiming to alleviate equipment supply pressure. This behavior is characterized by users shifting high peak electricity loads to periods of lower electricity prices. For instance, during the periods of 10:00–14:00 and 17:00–22:00 when electricity prices are high, user electricity loads visibly decrease and are shifted to periods of low electricity prices, such as from 23:00 to 06:00, after adjustment.
From Figure 11b,c, it can be observed that due to the higher reliability requirements for heat and cold loads, in order to ensure user comfort, this paper sets the proportion of transferable load to be 10% of the total. After optimization through price-based integrated demand response, users’ heat and cold loads also exhibit a trend of peak-shaving and valley-filling, respectively.

6.5. Analysis of Green Certificate–Carbon Trading Mechanism Results

To further explore the impact of different factors on the operation of RIESs, this section conducts sensitivity analysis on factors such as green certificate trading prices and carbon emission trading prices. The original scenario assumes a green certificate trading price of 0.1286 CNY/kW·h and a carbon trading price of 0.168 CNY/kg.

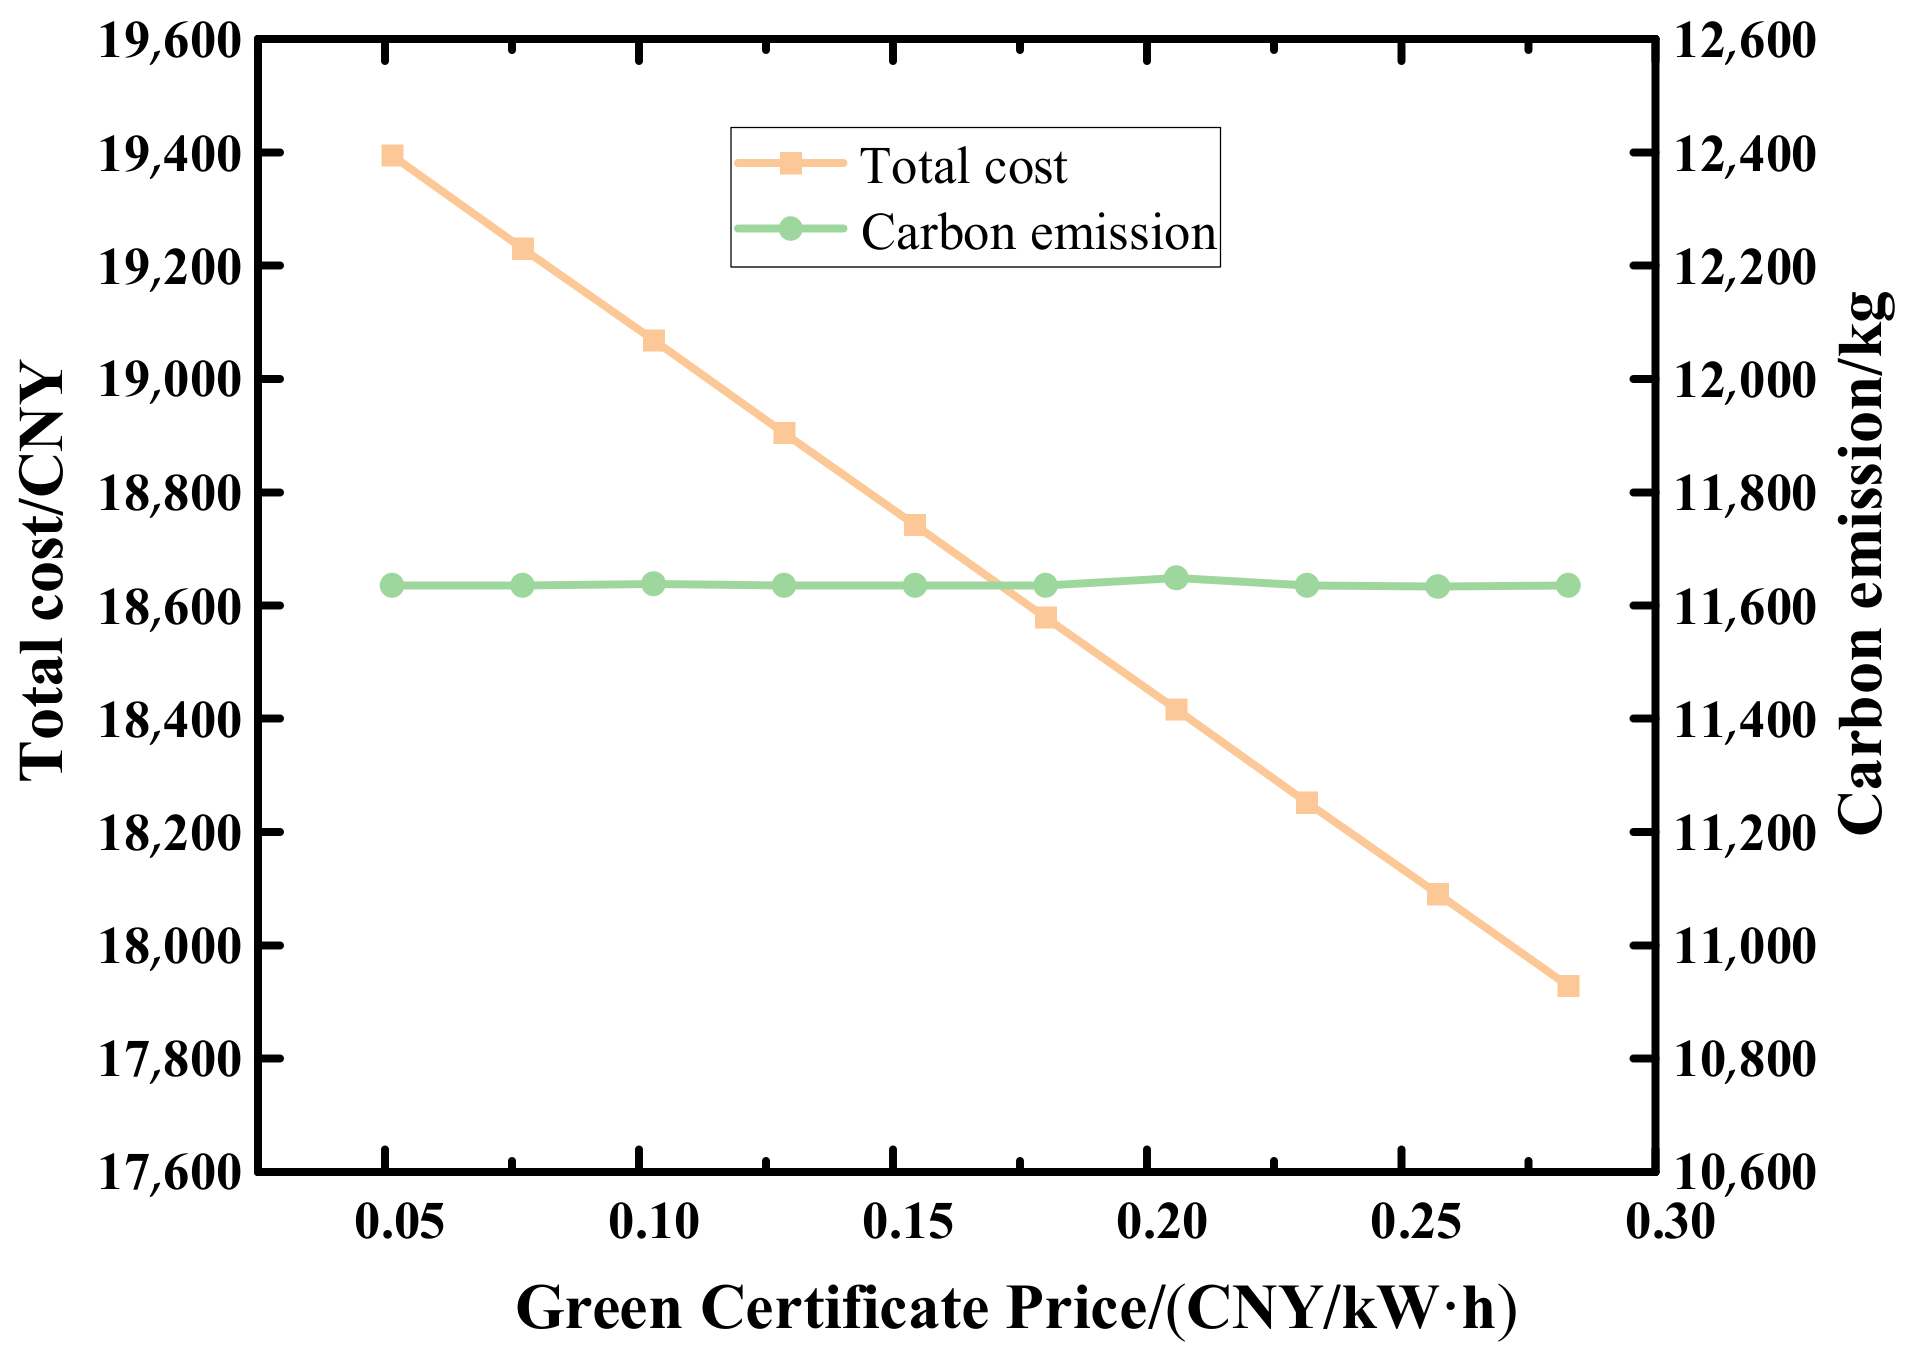
6.5.1. Sensitivity Analysis of Different Green Certificate Prices

Green certificates, as an important means for the system to meet renewable energy quota requirements, have a significant impact on the overall revenue situation of the system. Figure 12 illustrates the system’s total costs and carbon emissions under different green certificate trading prices.
The range of variation in green certificate trading prices is 0.4 to 2.2 times the original scenario, with a variation rate of 20%. As shown in Figure 12, as the green certificate trading price increases, the total system costs of the RIES show a decreasing trend. Furthermore, from Figure 12, it can be observed that the variation in green certificate prices has no significant impact on carbon emissions. This is because GCT increases the proportion of new energy in the system’s electricity consumption, thereby achieving carbon reduction goals. Moreover, the model in this paper achieves full absorption of wind and solar energy through energy storage devices such as batteries and electrolysis systems. Therefore, the variation in green certificate prices does not cause changes in wind and solar energy absorption, and there is no significant change in carbon emissions.

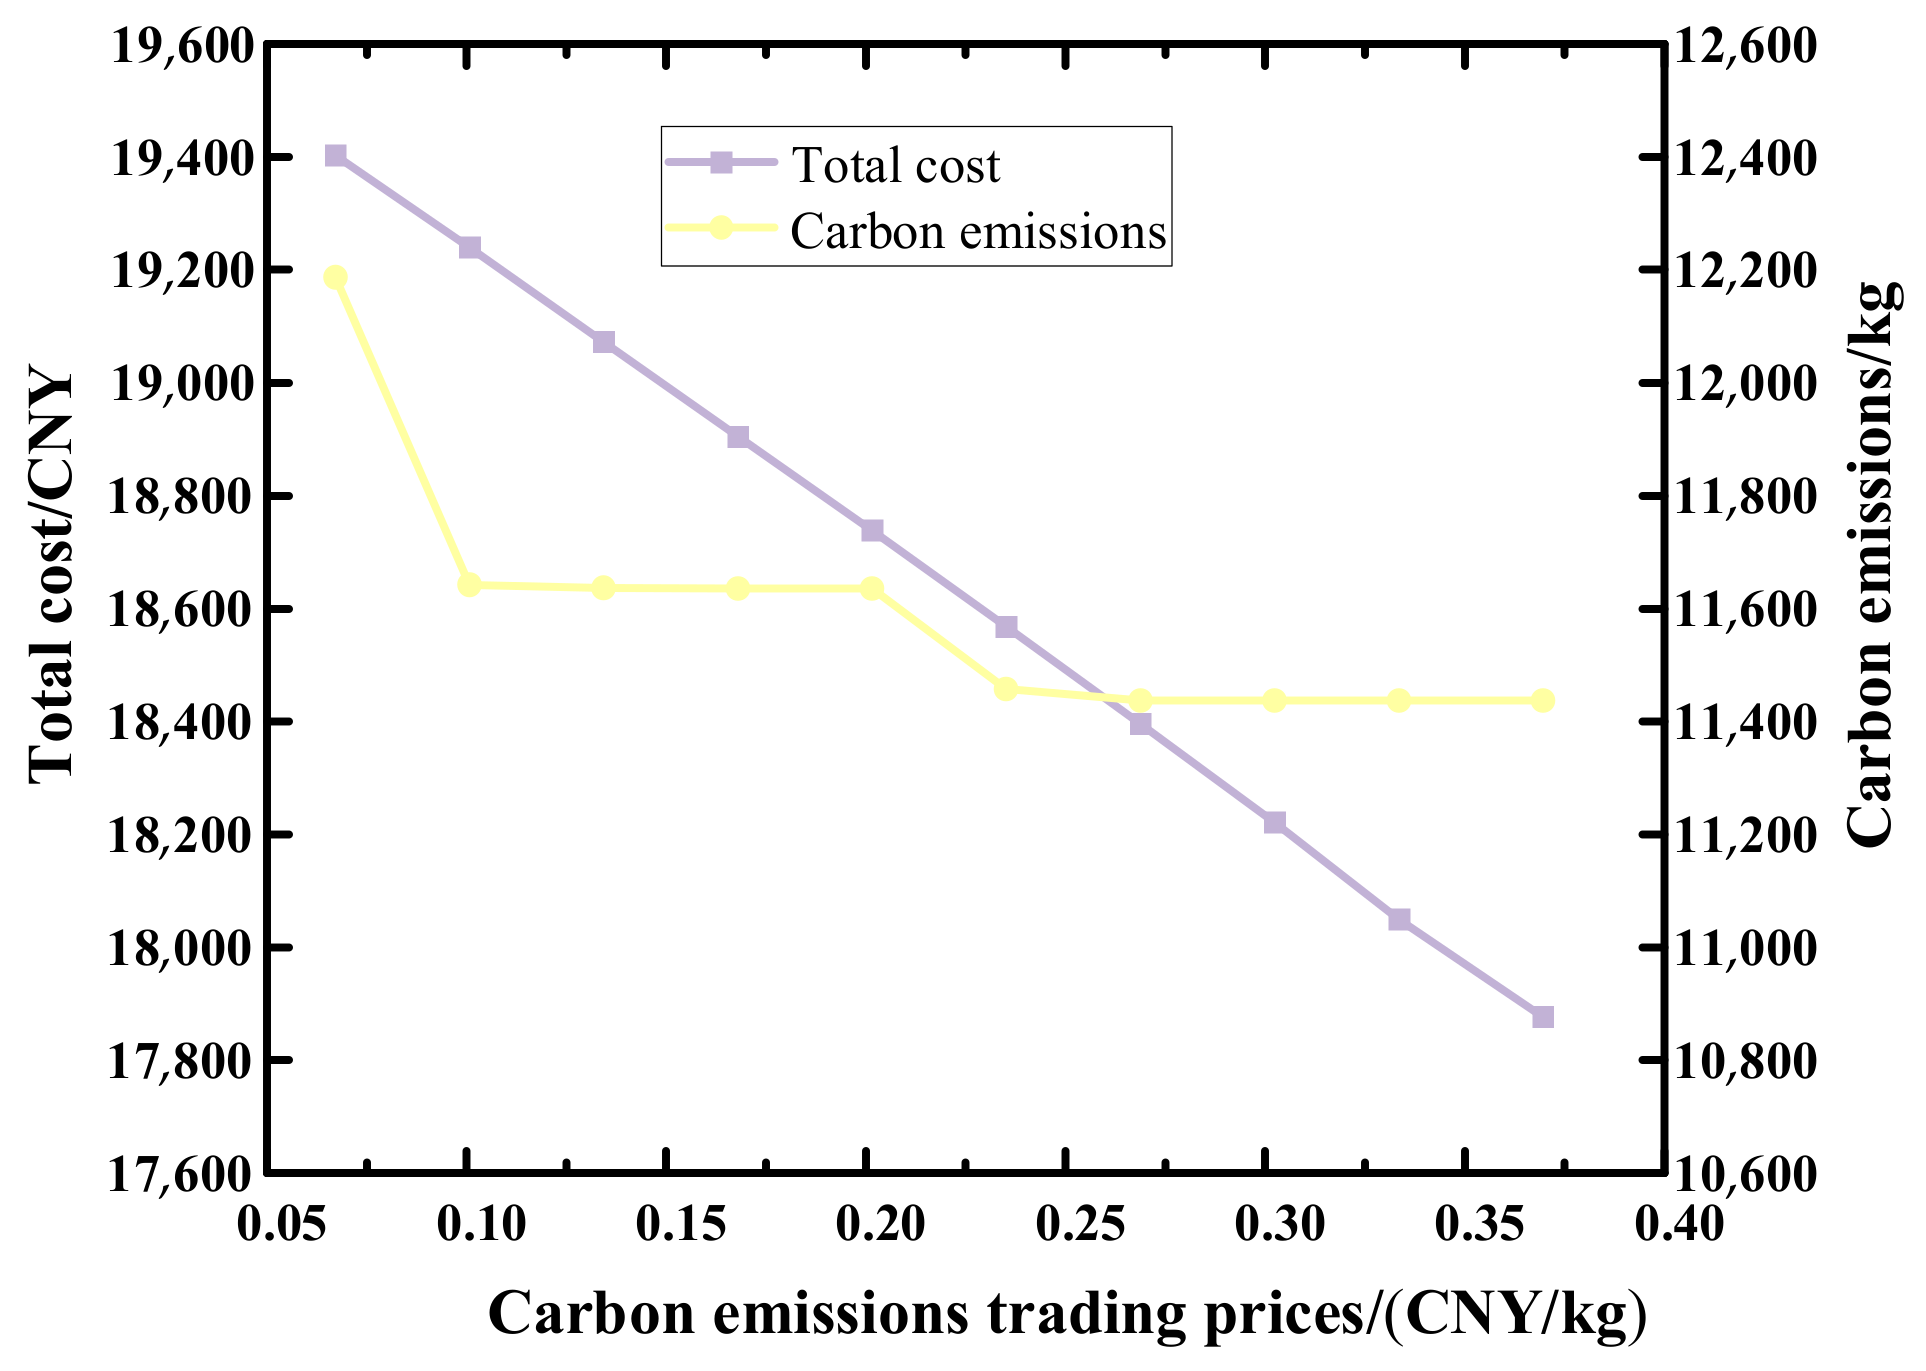
6.5.2. Sensitivity Analysis of Different Carbon Emission Trading Prices

Different carbon emission trading prices directly influence the internal operation of the RIES. Figure 13 illustrates the system’s total costs and carbon emissions under different carbon trading prices.
From Figure 13, it can be observed that when the carbon trading price is less than 0.25 CNY/kg, as the carbon trading price increases, indicating a greater weight of carbon emission target costs, the role of carbon trading costs becomes stronger. The system reduces carbon emissions by decreasing electricity purchased from the grid to obtain higher carbon trading revenue. Consequently, carbon emissions gradually decrease. However, when the carbon trading price exceeds 0.25 CNY/kg, as the carbon trading price increases, the output distribution of system equipment tends to stabilize, and carbon emission levels also stabilize. Therefore, the impact of carbon trading price changes on carbon emissions is relatively small. Due to the increase in carbon trading revenue, the total system costs decrease accordingly.

7. Discussion

China enters the national carbon trading market phase in 2021. Compared with European countries, China’s low-carbon policy mechanism started late. This paper constructs a power–heat–cooling RIES model under the joint green certificate–carbon trading mechanism, analyzes the impact of demand response and the joint carbon–green certificate trading mechanism on the power–heat–cooling RIES scheduling, respectively, and the results show that the addition of these mechanisms can improve the low-carbon economy of the RIES, which lays the theoretical foundation for the decision-making of low-carbon operation of power systems. The effects of carbon trading base price and green certificate trading price on system optimization scheduling are also specifically analyzed, which can provide a reference for the development of carbon trading mechanisms and GCT mechanisms in the future.
It should be noted that the IEEE node test system was not used in this paper for validation, so the cybersecurity constraints of electric heat were not considered, and are qualitatively analyzed here. The electric energy transmission rate is very fast generally, considering the line power transmission limits and the line transmission power constraints need to be greater than the load power demand; so the electric network constraints have less impact on the economic operation of the system. The heat and cold energy transmission rate is slower and can generally reach an hourly level; the heat network needs to consider the network transmission delay characteristics (i.e., pipe storage characteristics) and transmission loss, while the heat network transmission loss is smaller. The pipe storage characteristics of the heat network widen the heat storage channel of the system. Therefore, the storage characteristics of the heat network can improve the operational flexibility of the system, and the power constraints have little impact on the system.
While this paper has made significant contributions to the understanding of low-carbon and economically viable operations within the IES context, there are still a number of areas that require further investigation and exploration.
  • The cold–heat–electricity IES optimization scheduling model constructed in this paper does not consider the uncertainty of renewable energy output and the uncertainty of users’ energy use in IES optimization scheduling. The next step will be to investigate the impact of the uncertainty of the “source and load” on the optimal scheduling of IES.
  • Demand response mechanisms are classified into two categories: price-based and incentive-based. The integrated demand response model constructed in this paper is based on price-based mechanisms, which leaves a gap in the study of incentive-based demand response. The price-based integrated demand response model constructed in this paper does not consider the uncertainty of load participation in demand response and other issues, which necessitates further investigation.
  • This paper solely examines the optimal scheduling of a RIES. However, further investigation is required to ascertain the optimal scheduling and coordinated control among multiple RIESs.
  • Our research also found that an optimized configuration of energy storage systems can achieve flexible regulation of RIESs. The next step of our work will consider the quantitative relationship between the configuration of energy storage systems and parameters of comprehensive demand response, as well as their coordinated impact on system objectives. This will further refine optimization strategies and mathematical models.

8. Conclusions

This paper utilizes the flexible characteristics of electricity, heat, and cooling loads to establish a multi-energy complementary optimization scheduling model considering comprehensive demand response and green certificate–carbon trading mechanisms. Three scenarios are set for comparative analysis, leading to the following conclusions:
  • After introducing the green certificate–carbon emission trading mechanism, the total costs and carbon emissions of RIESs decreased by 11.9% and 10.0%, respectively. This indicates that as the integration of electricity, heat, and cooling becomes tighter, introducing the green certificate–carbon trading mechanism can effectively guide the output of various energy supply equipment and generate revenue from it. This effectively improves the economic efficiency of the system and reduces total carbon emissions, achieving a win–win situation for both environmental protection and economic efficiency.
  • Considering integrated demand response, the peak–valley differences of users’ electricity, heat, and cooling loads decreased by 9.82%, 4.35%, and 6.78%, respectively, compared to before demand response. This effectively smoothens the energy usage curves of users. This suggests that involving electricity, heat, and cooling loads as flexible loads in demand response can effectively reduce peak–valley differences in loads, alleviate equipment supply pressure, optimize system operation, and improve the economic efficiency, environmental performance, and energy efficiency utilization of the system.

Author Contributions

Methodology, L.X. and L.W.; Formal Analysis, Y.K.; Investigation, Y.H.; Data Curation, J.L.; Writing—original draft, J.L.; Writing—review and editing, W.L., L.W. and L.X.; Supervision, L.W. and L.X.; Project Administration, L.X. All authors have read and agreed to the published version of the manuscript.

Funding

This research received no external funding.

Data Availability Statement

The original contributions presented in the study are included in the article; further inquiries can be directed to the corresponding authors.

Conflicts of Interest

Authors Lei Xu and Lihua Wang were employed by the company Electric Power Research Institute of State Grid Xinjiang Electric Power Co., Ltd. The authors declare that this study received funding from Electric Power Research Institute of State Grid Xinjiang Electric Power Co., Ltd. The funder was involved in the following aspects of this study: methodology, formal analysis, and investigation.

References

  1. Song, J.; Zhang, Z.; Mu, Y. Enhancing envrionmental sustainability via interval optimization for low-carbon economic dispatch in renewable energy power systems: Leveraging the flexible cooperation of wind energy and carbon capture power plants. J. Clean. Prod. 2024, 442, 140937. [Google Scholar] [CrossRef]
  2. Yue, M.; Lambert, H.; Pahon, E. Hydrogen energy systems: A critical review of technologies, applications, trends and challenges. Renew. Sustain. Energy Rev. 2021, 146, 111180. [Google Scholar] [CrossRef]
  3. Li, Z.; Wu, L.; Xu, Y. Risk-Averse Coordinated Operation of a Multi-Energy Microgrid Considering Voltage/Var Control and Thermal Flow: An Adaptive Stochastic Approach. IEEE Trans. Smart Grid 2021, 12, 3914–3927. [Google Scholar] [CrossRef]
  4. Su, Q.; Zhou, P.; Ding, H.; Xydis, G. Transition towards a hybrid energy system: Combined effects of renewable portfolio standards and carbon emission trading. Energy Econ. 2024, 135, 107638. [Google Scholar] [CrossRef]
  5. Qin, B.; Li, H.; Wang, Z.; Jiang, Y.; Lu, D.; Du, X.; Qian, Q. New framework of low-carbon city development of China: Underground space based integrated energy systems. Undergr. Space 2024, 14, 300–318. [Google Scholar] [CrossRef]
  6. Jiang, Y.; Ren, Z.; Li, W. Committed Carbon Emission Operation Region for Integrated Energy Systems: Concepts and Analyses. IEEE Trans. Sustain. Energy 2024, 15, 1194–1209. [Google Scholar] [CrossRef]
  7. Liang, T.; Chai, L.; Tan, J.; Jing, Y.; Lv, L. Dynamic optimization of an integrated energy system with carbon capture and power-to-gas interconnection: A deep reinforcement learning-based scheduling strategy. Appl. Energy 2024, 367, 123390. [Google Scholar] [CrossRef]
  8. Jia, B.; Li, F.; Sun, B. Knowledge-network-embedded deep reinforcement learning: An innovative way to high-efficiently develop an energy management strategy for the integrated energy system with renewable energy sources and multiple energy storage systems. Energy 2024, 301, 131604. [Google Scholar] [CrossRef]
  9. Li, Z.; Wu, L.; Xu, Y.; Wang, L.; Yang, N. Distributed tri-layer risk-averse stochastic game approach for energy trading among multi-energy microgrids. Appl. Energy 2023, 331, 120282. [Google Scholar] [CrossRef]
  10. Tang, B.; Cao, X.; Li, R.; Xiang, Z.; Zhang, S. Economic and low-carbon planning for interconnected integrated energy systems considering emerging technologies and future development trends. Energy 2024, 302, 131850. [Google Scholar] [CrossRef]
  11. Wu, X.; Yang, L.; Zheng, B. Joint capacity configuration and demand response optimization of integrated energy system considering economic and dynamic control performance. Energy 2024, 301, 131723. [Google Scholar] [CrossRef]
  12. Li, K.; Ran, J.; Moon, K.K.; Tian, Z.; Liu, J. Optimizing long-term park-level integrated energy system through multi-stage planning: A study incorporating the ladder-type carbon trading mechanism. Results Eng. 2024, 22, 102107. [Google Scholar] [CrossRef]
  13. Ye, Y.; Ding, J.; Wang, W. The storage performance of metal hydride hydrogen storage tanks with reaction heat recovery by phase change materials. Appl. Energy 2021, 299, 117255. [Google Scholar] [CrossRef]
  14. Pham, V.P.; Truong, H.B.H.; Seongkeun, P.; Daehee, K. An IGDT approach for the multi-objective framework of integrated energy hub with renewable energy sources, hybrid energy storage systems, and biomass-to-hydrogen technology. J. Energy Storage 2024, 89, 111488. [Google Scholar]
  15. Shi, M.; Wang, H.; Lyu, C. A hybrid model of energy scheduling for integrated multi-energy microgrid with hydrogen and heat storage system. Energy Rep. 2021, 7, 357–368. [Google Scholar] [CrossRef]
  16. Meng, Z.; Wang, K.; Di, J. Energy analysis and exergy analysis study of a novel high-efficiency wind-hydrogen storage and power generation polygeneration system. Int. J. Hydrogen Energy 2024, 57, 338–355. [Google Scholar] [CrossRef]
  17. Li, L.; Wang, J.; Zhong, X. Combined multi-objective optimization and agent-based modeling for a 100% renewable island energy system considering power-to-gas technology and extreme weather conditions. Appl. Energy 2022, 308, 118376. [Google Scholar] [CrossRef]
  18. Liang, T.; Zhang, X.; Tan, J.; Jing, Y.; Lv, L. Deep reinforcement learning-based optimal scheduling of integrated energy systems for electricity, heat, and hydrogen storage. Electr. Power Syst. Res. 2024, 233, 110480. [Google Scholar] [CrossRef]
  19. Zeng, L.; Wang, J.; Zhao, L. An inter-provincial tradable green certificate futures trading model under renewable portfolio standard policy. Energy 2022, 257, 124772. [Google Scholar] [CrossRef]
  20. Teng, M.; Lv, K.; Han, C. Trading behavior strategy of power plants and the grid under renewable portfolio standards in China: A tripartite evolutionary game analysis. Energy 2023, 284, 128398. [Google Scholar] [CrossRef]
  21. Xue, G.; Wu, Y.; Niu, W. Green certificate trading and electricity market synergy modelling with renewable energy quotas. In Proceedings of the Fourth International Conference on Artificial Intelligence and Electromechanical Automation (AIEA 2023), Nanjing, China, 10–12 March 2023; Volume 12709, pp. 1028–1035. [Google Scholar]
  22. Li, F.; Lu, S.; Cao, C. Operation optimization of regional integrated energy system considering the responsibility of renewable energy consumption and carbon emission trading. Electronics 2021, 10, 2677. [Google Scholar] [CrossRef]
  23. Liu, D.; Luo, Z.; Qin, J. Low-carbon dispatch of multi-district integrated energy systems considering carbon emission trading and green certificate trading. Renew. Energy 2023, 218, 119312. [Google Scholar] [CrossRef]
  24. Tan, J.; Pan, W.; Li, Y. Energy-sharing operation strategy of multi-district integrated energy systems considering carbon and renewable energy certificate trading. Appl. Energy 2023, 339, 120835. [Google Scholar] [CrossRef]
  25. Li, W.; He, M.; Cai, T. Low-carbon economic dispatch of hydrogen-containing integrated energy system considering stepped demand response. Energy Rep. 2024, 11, 4222–4232. [Google Scholar] [CrossRef]
  26. Wang, S.; Yin, S.; Bai, H. Introduction and efficiency evaluation of multi-storage regional integrated energy system considering optimal operation integrated demand side response. IOP Conf. Ser. Earth Environ. Sci. IOP Publ. 2021, 631, 012109. [Google Scholar] [CrossRef]
  27. Yang, H.; Li, M.; Jiang, Z. Multi-time scale optimal scheduling of regional integrated energy systems considering integrated demand response. IEEE Access 2020, 8, 5080–5090. [Google Scholar] [CrossRef]
  28. Zhang, Y.; Liu, Z.; Wu, Y. Research on Optimal Operation of Regional Integrated Energy Systems in View of Demand Response and Improved Carbon Trading. Appl. Sci. 2023, 13, 6561. [Google Scholar] [CrossRef]
  29. Yan, N.; Li, X.; Wu, Z. Low-Carbon economic scheduling with Demand-Side response uncertainty in regional integrated energy system. Int. J. Electr. Power Energy Syst. 2024, 156, 109691. [Google Scholar] [CrossRef]
  30. Wang, Y.; Li, Y.; Zhang, Y. Optimized operation of integrated energy systems accounting for synergistic electricity and heat demand response under heat load flexibility. Appl. Therm. Eng. 2024, 243, 122640. [Google Scholar] [CrossRef]
  31. Liang, Z.; Mu, L. Multi-agent low-carbon optimal dispatch of regional integrated energy system based on mixed game theory. Energy 2024, 295, 130953. [Google Scholar] [CrossRef]
  32. Chen, H.; Wu, H.; Kan, T. Low-carbon economic dispatch of integrated energy system containing electric hydrogen production based on VMD-GRU short-term wind power prediction. Int. J. Electr. Power Energy Syst. 2023, 154, 109420. [Google Scholar] [CrossRef]
  33. Huang, Z.F.; Chen, W.D.; Wan, Y.D. Techno-economic comparison of different energy storage configurations for renewable energy combined cooling heating and power system. Appl. Energy 2024, 356, 122340. [Google Scholar] [CrossRef]
Figure 1. The basic structure of RIESs.
Energies 17 03190 g001
Figure 2. Schematic diagram of the electric hydrogen production system.
Energies 17 03190 g002
Figure 3. Green certificates—carbon emissions trading mechanism framework.
Energies 17 03190 g003
Figure 4. Load forecasting curves of typical users.
Energies 17 03190 g004
Figure 5. PV and wind power forecast curves.
Energies 17 03190 g005
Figure 6. Time-of-use electricity price and time of use gas price.
Energies 17 03190 g006
Figure 7. Results of electricity, heat, and cold balance scheduling in Scheme 1: (a) electricity balance scheduling results; (b) heating balance scheduling results; and (c) cooling balance scheduling results.
Energies 17 03190 g007
Figure 8. Results of electricity, heat, and cold balance scheduling in Scheme 2: (a) electricity balance scheduling results; (b) heating balance scheduling results; and (c) cooling balance scheduling results.
Energies 17 03190 g008
Figure 9. Results of electricity, heat, and cold balance scheduling in Scheme 3: (a) electricity balance scheduling results; (b) heating balance scheduling results; (c) cooling balance scheduling result.
Energies 17 03190 g009
Figure 10. Results of hydrogen balance scheduling in Scheme 3.
Energies 17 03190 g010
Figure 11. User energy consumption curve before and after demand response: (a) electric load curves before and after demand response; (b) heating load curves before and after demand response; and (c) cooling load curves before and after demand response.
Energies 17 03190 g011
Figure 12. Total system cost and carbon emissions under different green certificate prices.
Energies 17 03190 g012
Figure 13. Total system cost and carbon emissions under different carbon trading prices.
Energies 17 03190 g013
Table 1. Value of the parameters.
ParameterValueParameterValue
η GB 0.9 P GT max 800 kW
λ GT 0.85 λ re 0.35
γ h 0.02 H GB max 1000 kW
η AC 4 P bGrid max 500 kW
η AR 1.2 P sGrid max 500 kW
η bt . chr , η bt . dis 0.95 P bt . chr min , P bt . chr max 0.350 kW
η tst . chr , η tst . dis 0.98 P bt . dis min , P bt . dis max 0.350 kW
P sel max 220 kW P e , EL min , P e , EL max 0.220 kW
H shl max 160 kW P H 2 , HFC min , P H 2 , HFC max 0.220 W
Q shl max 150 kW
Table 2. Operation cost composition of different schemes.
SchemeScheme 1Scheme 2Scheme 3
Total cost (CNY)21,465.5720,506.7218,904.75
Operation and maintenance cost (CNY)18,427.9118,455.3519,171.96
Grid interaction cost (CNY)3037.652051.371384.80
Carbon trading cost (CNY)//−837.15
Green certificate cost (CNY)//−814.86
Carbon emission (kg)12,930.1212,448.5811,635.31
Disclaimer/Publisher’s Note: The statements, opinions and data contained in all publications are solely those of the individual author(s) and contributor(s) and not of MDPI and/or the editor(s). MDPI and/or the editor(s) disclaim responsibility for any injury to people or property resulting from any ideas, methods, instructions or products referred to in the content.

