Abstract
This work aims at enhancing the photo-thermal performance of a parabolic trough collector (PTC) system by implementing multiple coatings arrayed along the receiver tube. For this purpose, a lumped-parameter model was developed in the radial direction of the receiver tube to compute absorber tube wall temperature and heat losses at various heat transfer fluid (HTF) temperatures. The HTF is a mixture of molten salt (60%wt. NaNO3 + 40%wt. KNO3). The lamped-parameter model was exploited by a 1D model developed in the axial direction to determine the HTF temperature profile along the tube. The 1D model was employed to calculate photo-thermal efficiency at different HTF temperatures considering six selective coating formulations. Consequently, the most photo-thermally efficient configuration of the PTC system was determined, encompassing three HTF temperature ranges characterized by three different selective coating formulations. These temperature ranges were 290–436 °C (low temperature), 436–517 °C (medium temperature) and 517–550 °C (high temperature). The respective tube lengths were computed to be 792 m, 566 m and 293 m, considering the reference operational conditions. The optimal configuration enhanced the overall photo-thermal efficiency by 0.5–1.9% compared to the single-coated configurations. Furthermore, receiver cost could be reduced because of the employment of the more expensive coating only at the final segment.
1. Introduction
The utilization of renewable energy sources, especially solar energy, is a viable solution to address major global issues in terms of increasing energy demand, the depletion of fossil fuels, global warming and air pollution [1,2]. Among solar-based technologies, the concentrated solar power (CSP) system has captured considerable attention over the last few decades due to the possibility of storing thermal energy, making power production dispatchable [3]. The parabolic trough collector (PTC) is the most commercially established CSP technology [4], which can be used for power production [5,6], seawater desalination [7], industrial heating [8] and residential heating/cooling [9].
PTC is a line-focusing system consisting of a receiver tube, parabolic mirrors and a single-axis tracking system. The mirror concentrates the incident solar radiation on the receiver tube, where the energy of the concentrated sunlight is transferred to a heat transfer fluid (HTF). The receiver tube consists of an absorber tube, through which the HTF flows, which is encapsulated in a glass envelope to minimize heat losses to the environment. A spectrally selective coating is typically applied to the outer surface of the absorber tube to enhance the photo-thermal performance of the collector by increasing absorptance and minimizing emissivity [10,11].
Photo-thermal efficiency is a measure of a collector’s effectiveness in converting sunlight into useful thermal energy. Numerous studies have been conducted to optimize the photo-thermal performance of PTCs through specific strategies implemented on selective coatings. Olson et al. [12] represented optimal designs of a direct steam generation parabolic trough system by investigating the spectral, environmental and material properties of selective coatings. In this respect, several parameters including absorptance, emissivity, transition length, transition wavelength, operating temperature and concentration factor were investigated. The optimum transition wavelengths were found to be 1.4 μm and 3.4 μm for ideal and realistic non-ideal conditions, respectively. In the ENEA laboratories, where different selective coatings have been developed in the last 15 years [13,14,15,16], specific optimization procedures have been developed to design effective cermet-based solar coatings for PTCs operating at high temperatures. In this respect, six optimized selective coatings were designed by employing a semi-empirical procedure and a layer-on-layer ellipsometric characterization [13]. Improved performances were reported compared to similar selective coatings, with a photo-thermal efficiency of 85% at 550 °C. Furthermore, Yang et al. [17] carried out a spectral optimization of solar selective coatings for PTCs, investigating the impact of absorber temperature and solar irradiation flux on the overall efficiency and coating spectrum distribution. According to simulation results, the uniform distribution of temperature and solar irradiation flux must be considered in the optimization procedure of selective coatings. Spectral absorptance analysis indicated a nearly equal positive effect of coating absorptance on the receiver performance at different temperatures, while emissivity analysis demonstrated a varied adverse impact with respect to temperature. Therefore, it was concluded that spectral emissivity would be of great importance to optimize selective coatings at high temperatures. However, all these works enhanced the performance of the PTC system through the improvement of selective coating specifications, which could lead to an increase in the receiver cost. In the present work, a different strategy has been adopted for the performance enhancement of the PTC system, which relies on the arrangement of multiple selective coatings along the receiver tube based on their photo-thermal performance. Implementing this approach results in a reduction in the receiver cost since the more expensive coating is employed only on a small portion of the collector.
Nagaraj [18] experimentally studied the optical and thermal performance of a PTC by using epoxy-based graphite coating. The performance of the proposed collector was compared with two similar collectors, comprising uncoated and acrylic covered tubes. It was concluded that employing epoxy-based graphite coating would effectively improve the thermal performance of the system, indicating an average increase of 96% and 28% in the HTF temperature at the outlet section. Moreover, Al-Rabeeah et al. [19] conducted an experimental investigation on a PTC by using various absorber tube coatings. The study employed two identical collectors to compare two different coatings, encompassing matte coating and nanocoating. Experimental tests were performed for various mass flow rates to evaluate the optical and thermal performance of the collectors. It was found that nanocoating could be more effective in terms of thermal efficiency due to reduced heat losses. In addition, integrating graphene nanoparticles and iron oxide with the matte coating resulted in an increase in the absorptance. However, the enhancements observed in these experiments were achieved by applying one single coating to the entire collector line, while this paper suggests a configuration with multiple selective coatings. Therefore, instead of improving coating specifications that might lead to an additional cost, an optimized arrangement is considered that reduces the receiver cost.
Additionally, Yang et al. [20] proposed a novel PTC with two different selective coatings, namely a double-selective-coated receiver, and compared it with two traditional single-coated receivers. For this purpose, the double-selective-coated receiver was split into two regions designated for two selective coatings. Based on the optimized results of the cut-off wavelength, it was concluded that the optimal optical properties of the two regions would be different. Moreover, the double-selective-coated receiver could reduce heat losses from the absorber tube to the environment and improve photo-thermal efficiency, compared to the two traditional single-coated receivers. Then, Yang et al. [21] conducted a spectral–spatial analysis of a PTC, employing a receiver tube with two selective coatings distributed based on the circumferential solar flux distribution on the absorber tube. It was reported that the proposed design could reduce heat losses and increase the photo-thermal efficiency of the PTC system. However, in these studies, the two selective coatings in the double-selective-coated receiver were distributed in the circumferential direction of the tube, which means that the impact of the varied performance of the coatings with respect to the HTF temperature is not considered. The present study introduces a different approach in which the selective coatings are arrayed based on their photo-thermal performance at various HTF temperature ranges along the axial direction. Such a strategy ensures the optimization of the photo-thermal performance of the system for the whole collector line.
Zhao et al. [22] presented a strategy based on applying multiple selective coatings in different sections of a PTC system. For this purpose, a conventional system with single-selective coating was compared with two different configurations: an ideal system consisting of multiple selective coatings with optimal cut-off wavelengths at different temperatures, and a multi-section system comprising multiple practical selective coatings. Based on the results, the ideal and the multi-section configurations demonstrated improved thermal performance compared to the conventional system in terms of heat losses and thermal efficiency. Singh et al. [23] introduced a performance enhancement strategy for a PTC by employing a MXene-based coating. In this regard, two retrofitted coated absorber tubes were compared with an absorber tube with a conventional selective coating. According to the results, the proposed coating strategy could enhance the thermal efficiency of the system, compared to the conventional selective coating. This could also lead to a decrease in the collector size by using the retrofitted coated absorber tubes. In addition, Stanek et al. [24] introduced an approach to reduce the investment cost of a PTC-based solar industrial process heat system by employing a non-selective coating at the initial sections of the collector line. Four case studies were considered in the analysis, with different temperature ranges intended for various industrial applications. The results confirmed the potential of using a non-selective coating at low and medium temperatures in industrial process heat systems. However, the proposed strategy could not be implemented on high-temperature systems due to high heat losses and the lack of optimization potential. Nevertheless, none of these studies conducted an optimization on the basis of the photo-thermal efficiency. Moreover, the optimized configuration of the receiver tube consisting of spatial positions of selective coatings along the collector line was not provided.
The present paper introduces a specific optimization strategy for the photo-thermal enhancement of PTC systems. In this respect, six different selective coatings are investigated to determine an optimal collector configuration in which multiple selective coatings are arranged along the collector line based on their photo-thermal performance at various HTF temperature ranges. The paper is organized as follows: Section 2 describes the materials and methods implemented in this work, representing the reference system, the methodology adopted, a lumped-parameter model developed along the radial direction and a 1D model developed along the axial direction of the receiver tube. The results of the study are presented and discussed in Section 3, providing the validation and results of the lumped-parameter model, as well as photo-thermal optimization of the PTC system. Finally, the conclusions of the work are provided in Section 4.
2. Materials and Methods
In the present work, a reference PTC system with six different selective coatings has been considered for the purpose of photo-thermal optimization. The methodology implemented for this optimization includes two models: a lumped-parameter model developed in the radial direction of the receiver tube, and a 1D model developed along the receiver axis.
2.1. Reference System
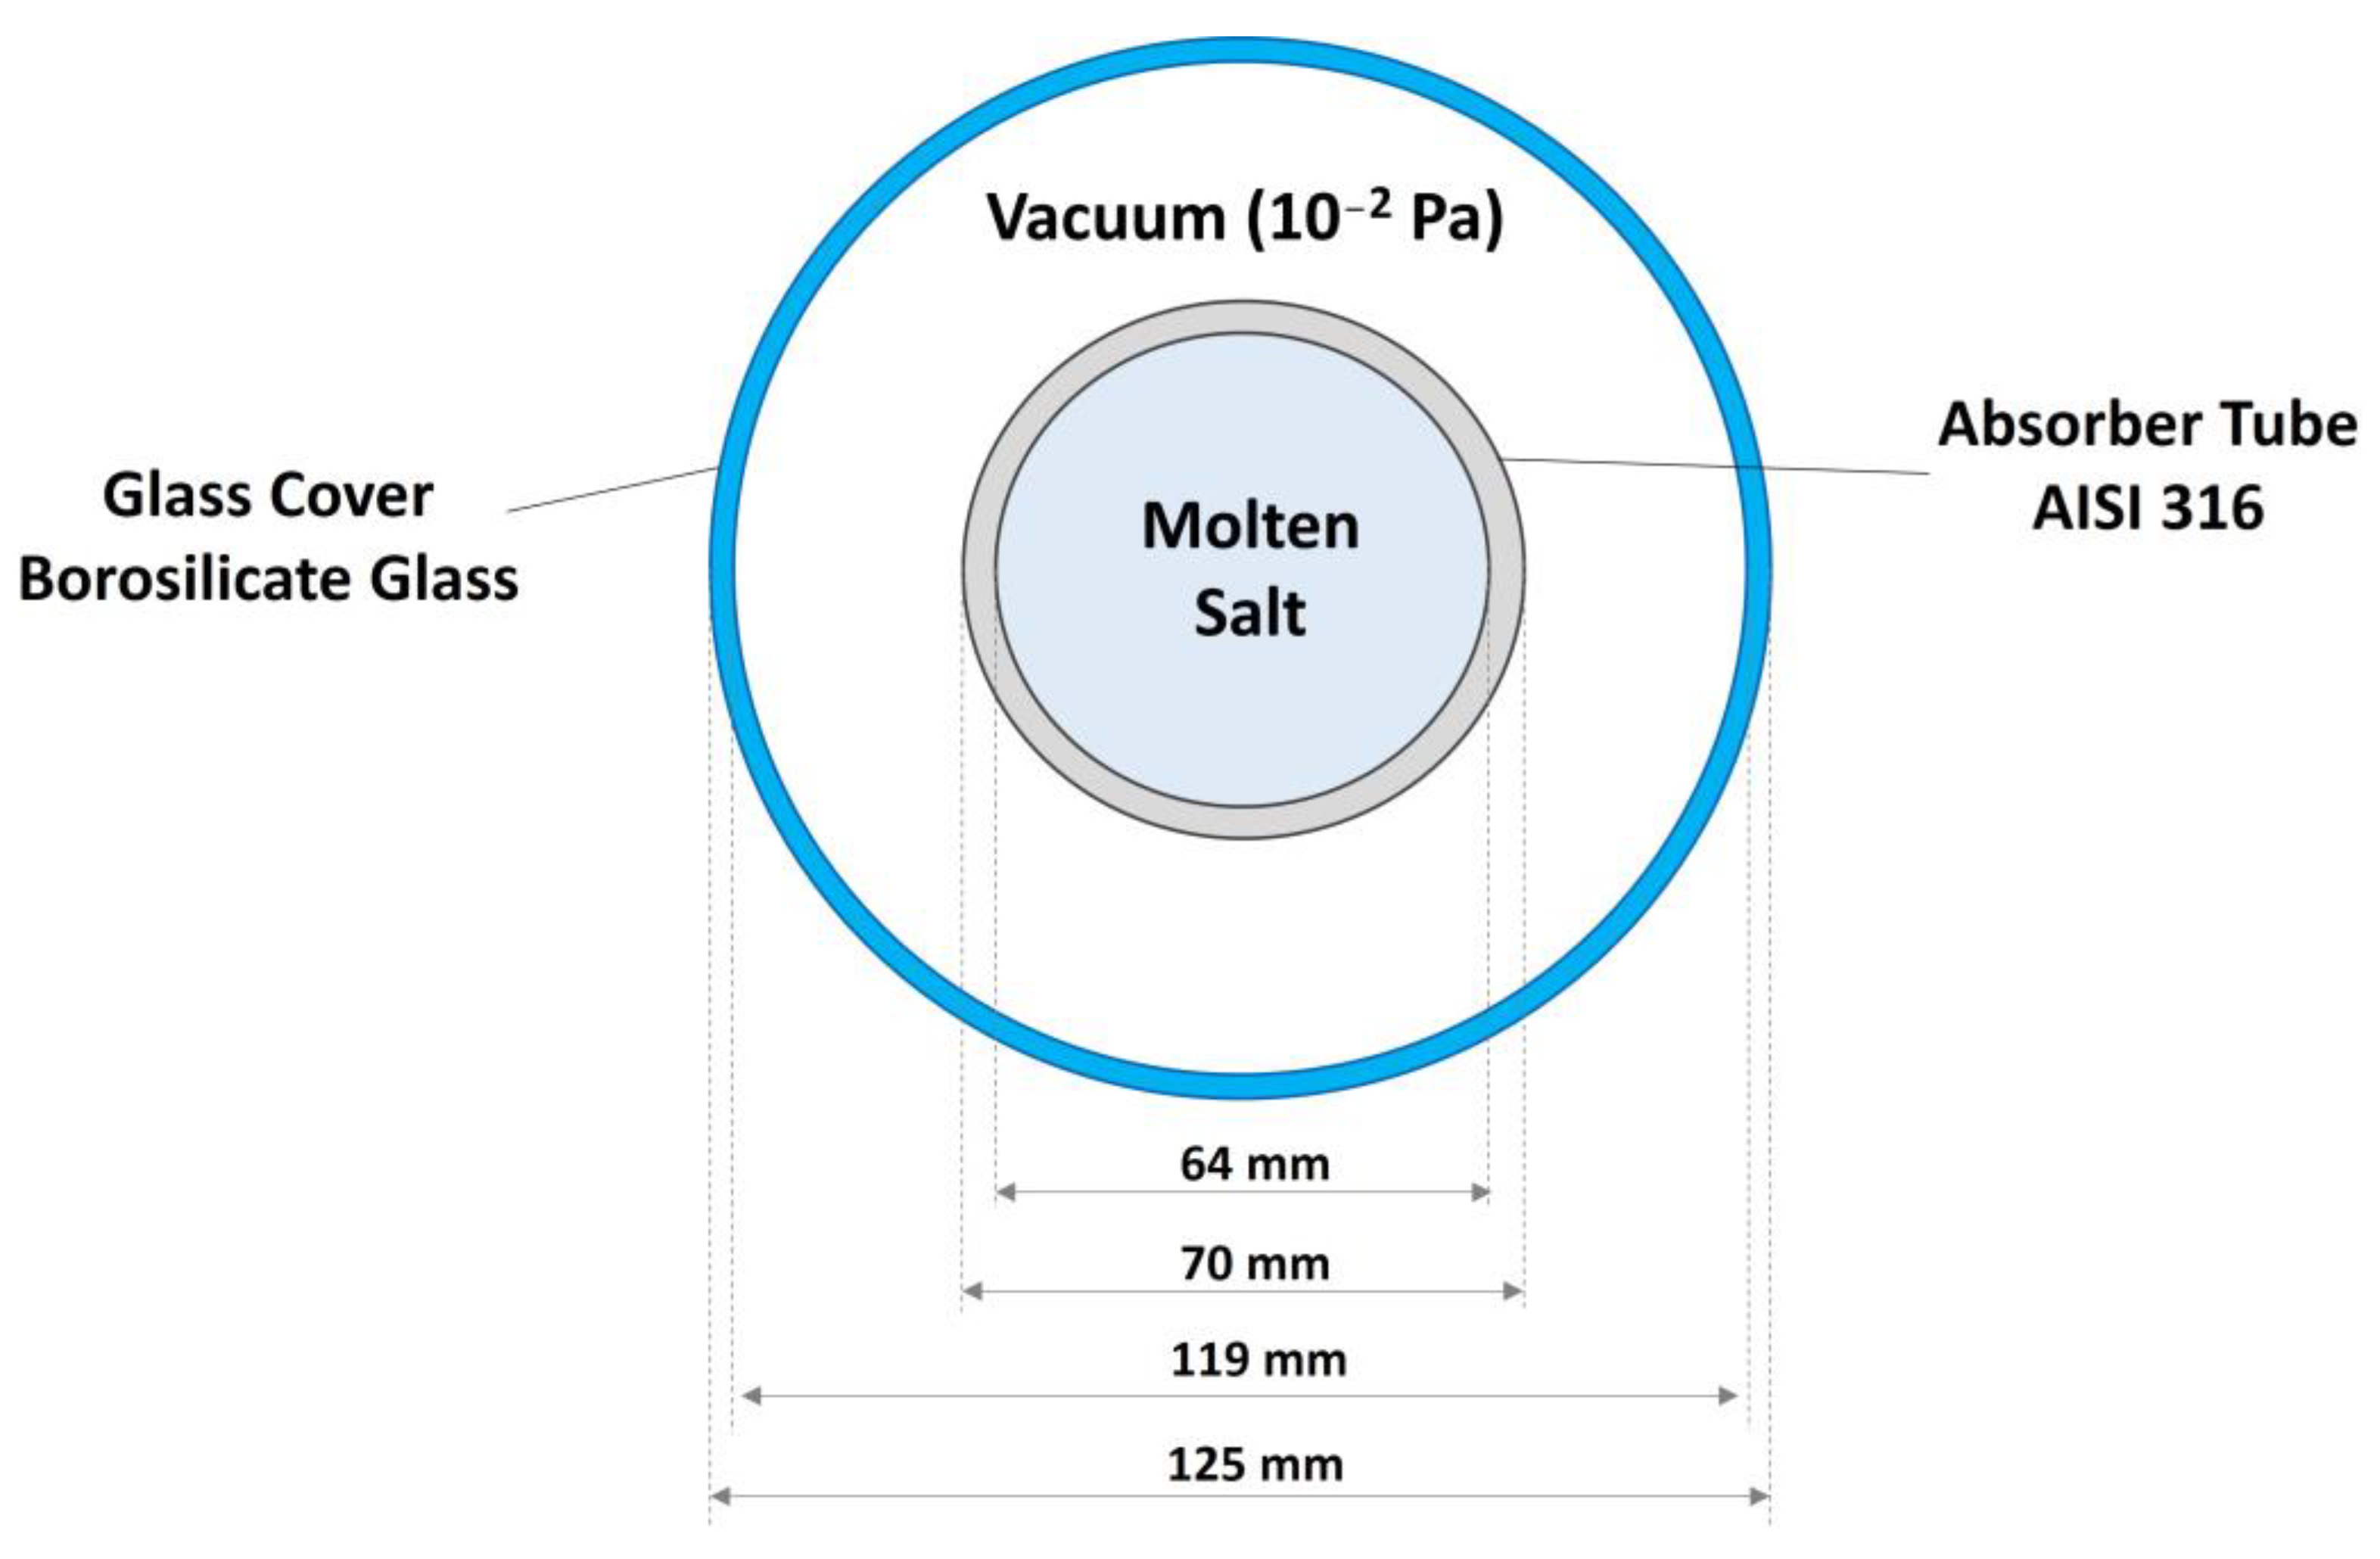
The reference PTC considered for photo-thermal optimization is shown in Figure 1. As shown, the receiver tube is composed of a stainless-steel absorber tube, enclosed in a borosilicate glass cover. The absorber tube has the function of absorbing incident solar radiation and transferring it to the HTF, which is a mixture of molten salt (60%wt. NaNO3 + 40%wt. KNO3) [25], with an operational temperature range of 290–550 °C. The gap region between the glass cover and the absorber tube is an evacuated space with a very low pressure (10−2 Pa), which ensures high thermal insulation within the receiver tube. Figure 1 also outlines the geometrical specifications of the receiver tube.
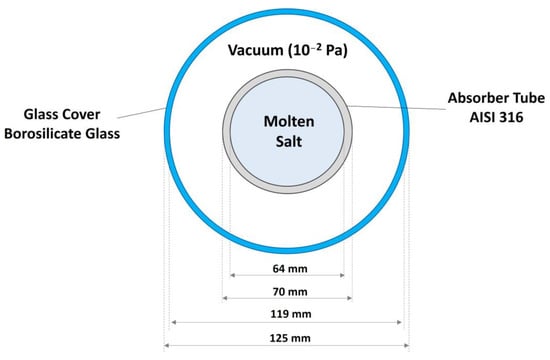
Figure 1.
Cross-sectional view of the reference PTC.
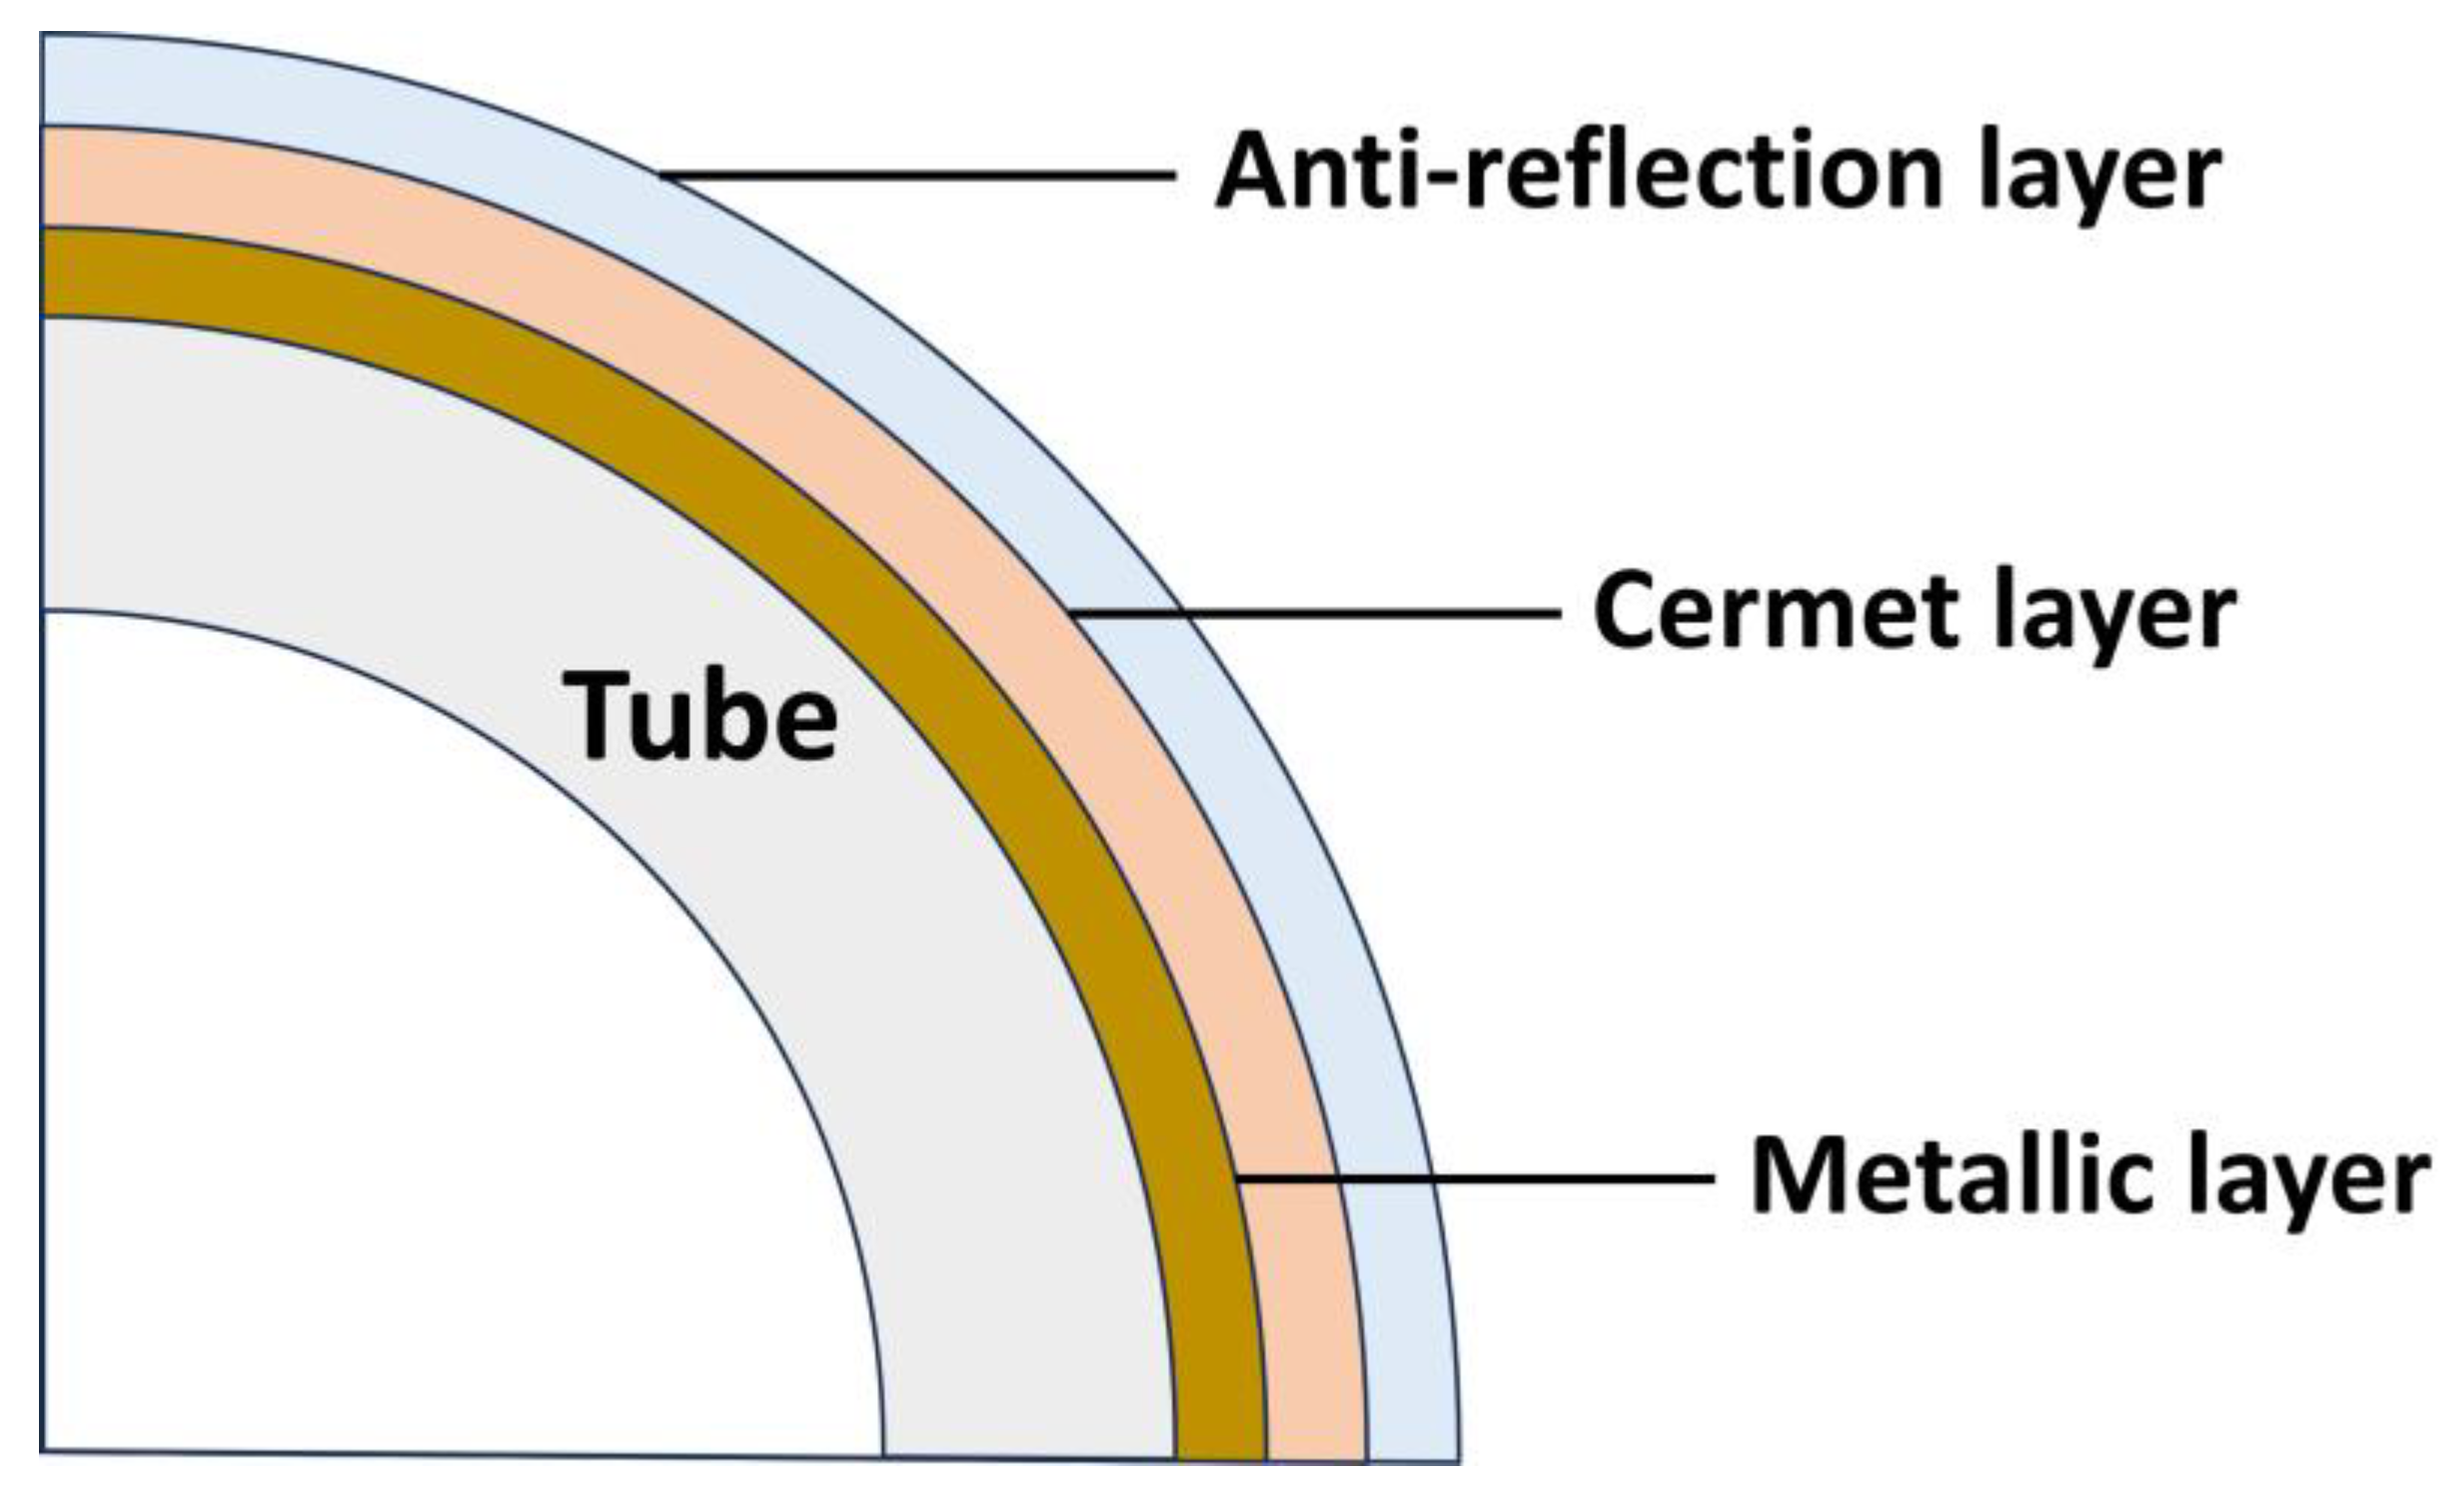
To improve the photo-thermal performance of the receiver tube, a spectrally selective coating is typically applied to the outer surface of the absorber tube. The selective coating must be characterized by a low emissivity in the infrared range and a high absorptance in the solar spectral range to attain the most enhanced photo-thermal performance. Figure 2 depicts a schematic of a multi-layer coating developed by ENEA for high-temperature CSP applications [13,26]. As shown in Figure 2, a metallic layer is initially coated on the outer surface of the tube, characterized by low emissivity and high reflectivity in the infrared range. The second layer includes a cermet layer composed of ceramic and metallic materials to ensure a high absorptance in the solar spectral range. The third layer is an anti-reflective layer, applied to the external side of the tube.
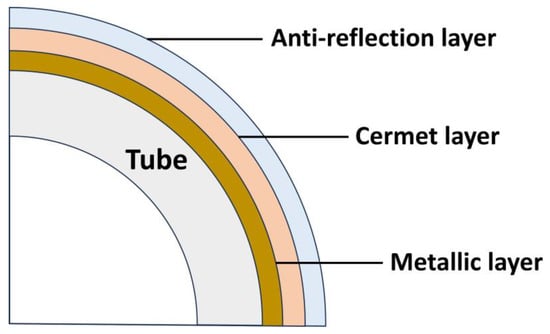
Figure 2.
Schematic of a multi-layer coating for the absorber tube.
As mentioned in Section 1, the strategy adopted in this work for the photo-thermal optimization of the PTC system is to implement multiple coatings along the collector line based on their photo-thermal performance at various HTF temperature ranges. In this regard, six selective coatings have been designed and fabricated with various ranges of absorptance and emissivity. These coatings have an infrared reflector of silver, covered by a graded multilayer cermet of tungsten nitride and aluminum nitride and, lastly, by an antireflection filter of aluminum nitride and silica [13,27].
Photo-thermal parameters of absorptance αs(θ) and emissivity εth(θ, T) were calculated in the wavelength ranges 0.25–2.5 μm and 0.25–16 μm by using the following formulas:
where θ is the incidence angle of radiation, αs(θ) is the absorptance, εth(θ, T) is the emissivity at temperature T, S(λ) is the circumsolar solar spectrum ASTM G173-03, R(λ, θ) is the hemispherical spectral reflectance and E(T, λ) is the spectrum of the black body at temperature T.
Equations (1) and (2) show that the photo-thermal parameters can be calculated only after measuring the hemispherical spectral reflectance R(λ,θ) of the different coatings. In this case, the measurement of R(λ,θ) was carried out in the wavelength range 0.25–2.5 µm by using a a PerkinElmer (U.S.A.) UV-VIS-NIR spectro-photometer mod. 1050+ equipped with an integration sphere. Measurements were not conducted directly on the tube but on flat samples and this allowed us to make very accurate evaluations of αs(θ). Tests to determine the accuracy of the measurement showed a standard error deviation of 0.035%. NIR-IR hemispherical spectral reflectance was measured by aBRUKER (U.S.A.) Fourier Transform spectro-photometer mod. INVENIO X equipped with a 7.5 cm diameter integrating sphere in the wavelength range 1.5–16 μm. Again, the adoption of flat samples allows very accurate spectral reflectance assessments in the 1.5–16 µm wavelength range. Tests to determine the accuracy of the measurement showed a standard error deviation of 0.14%.
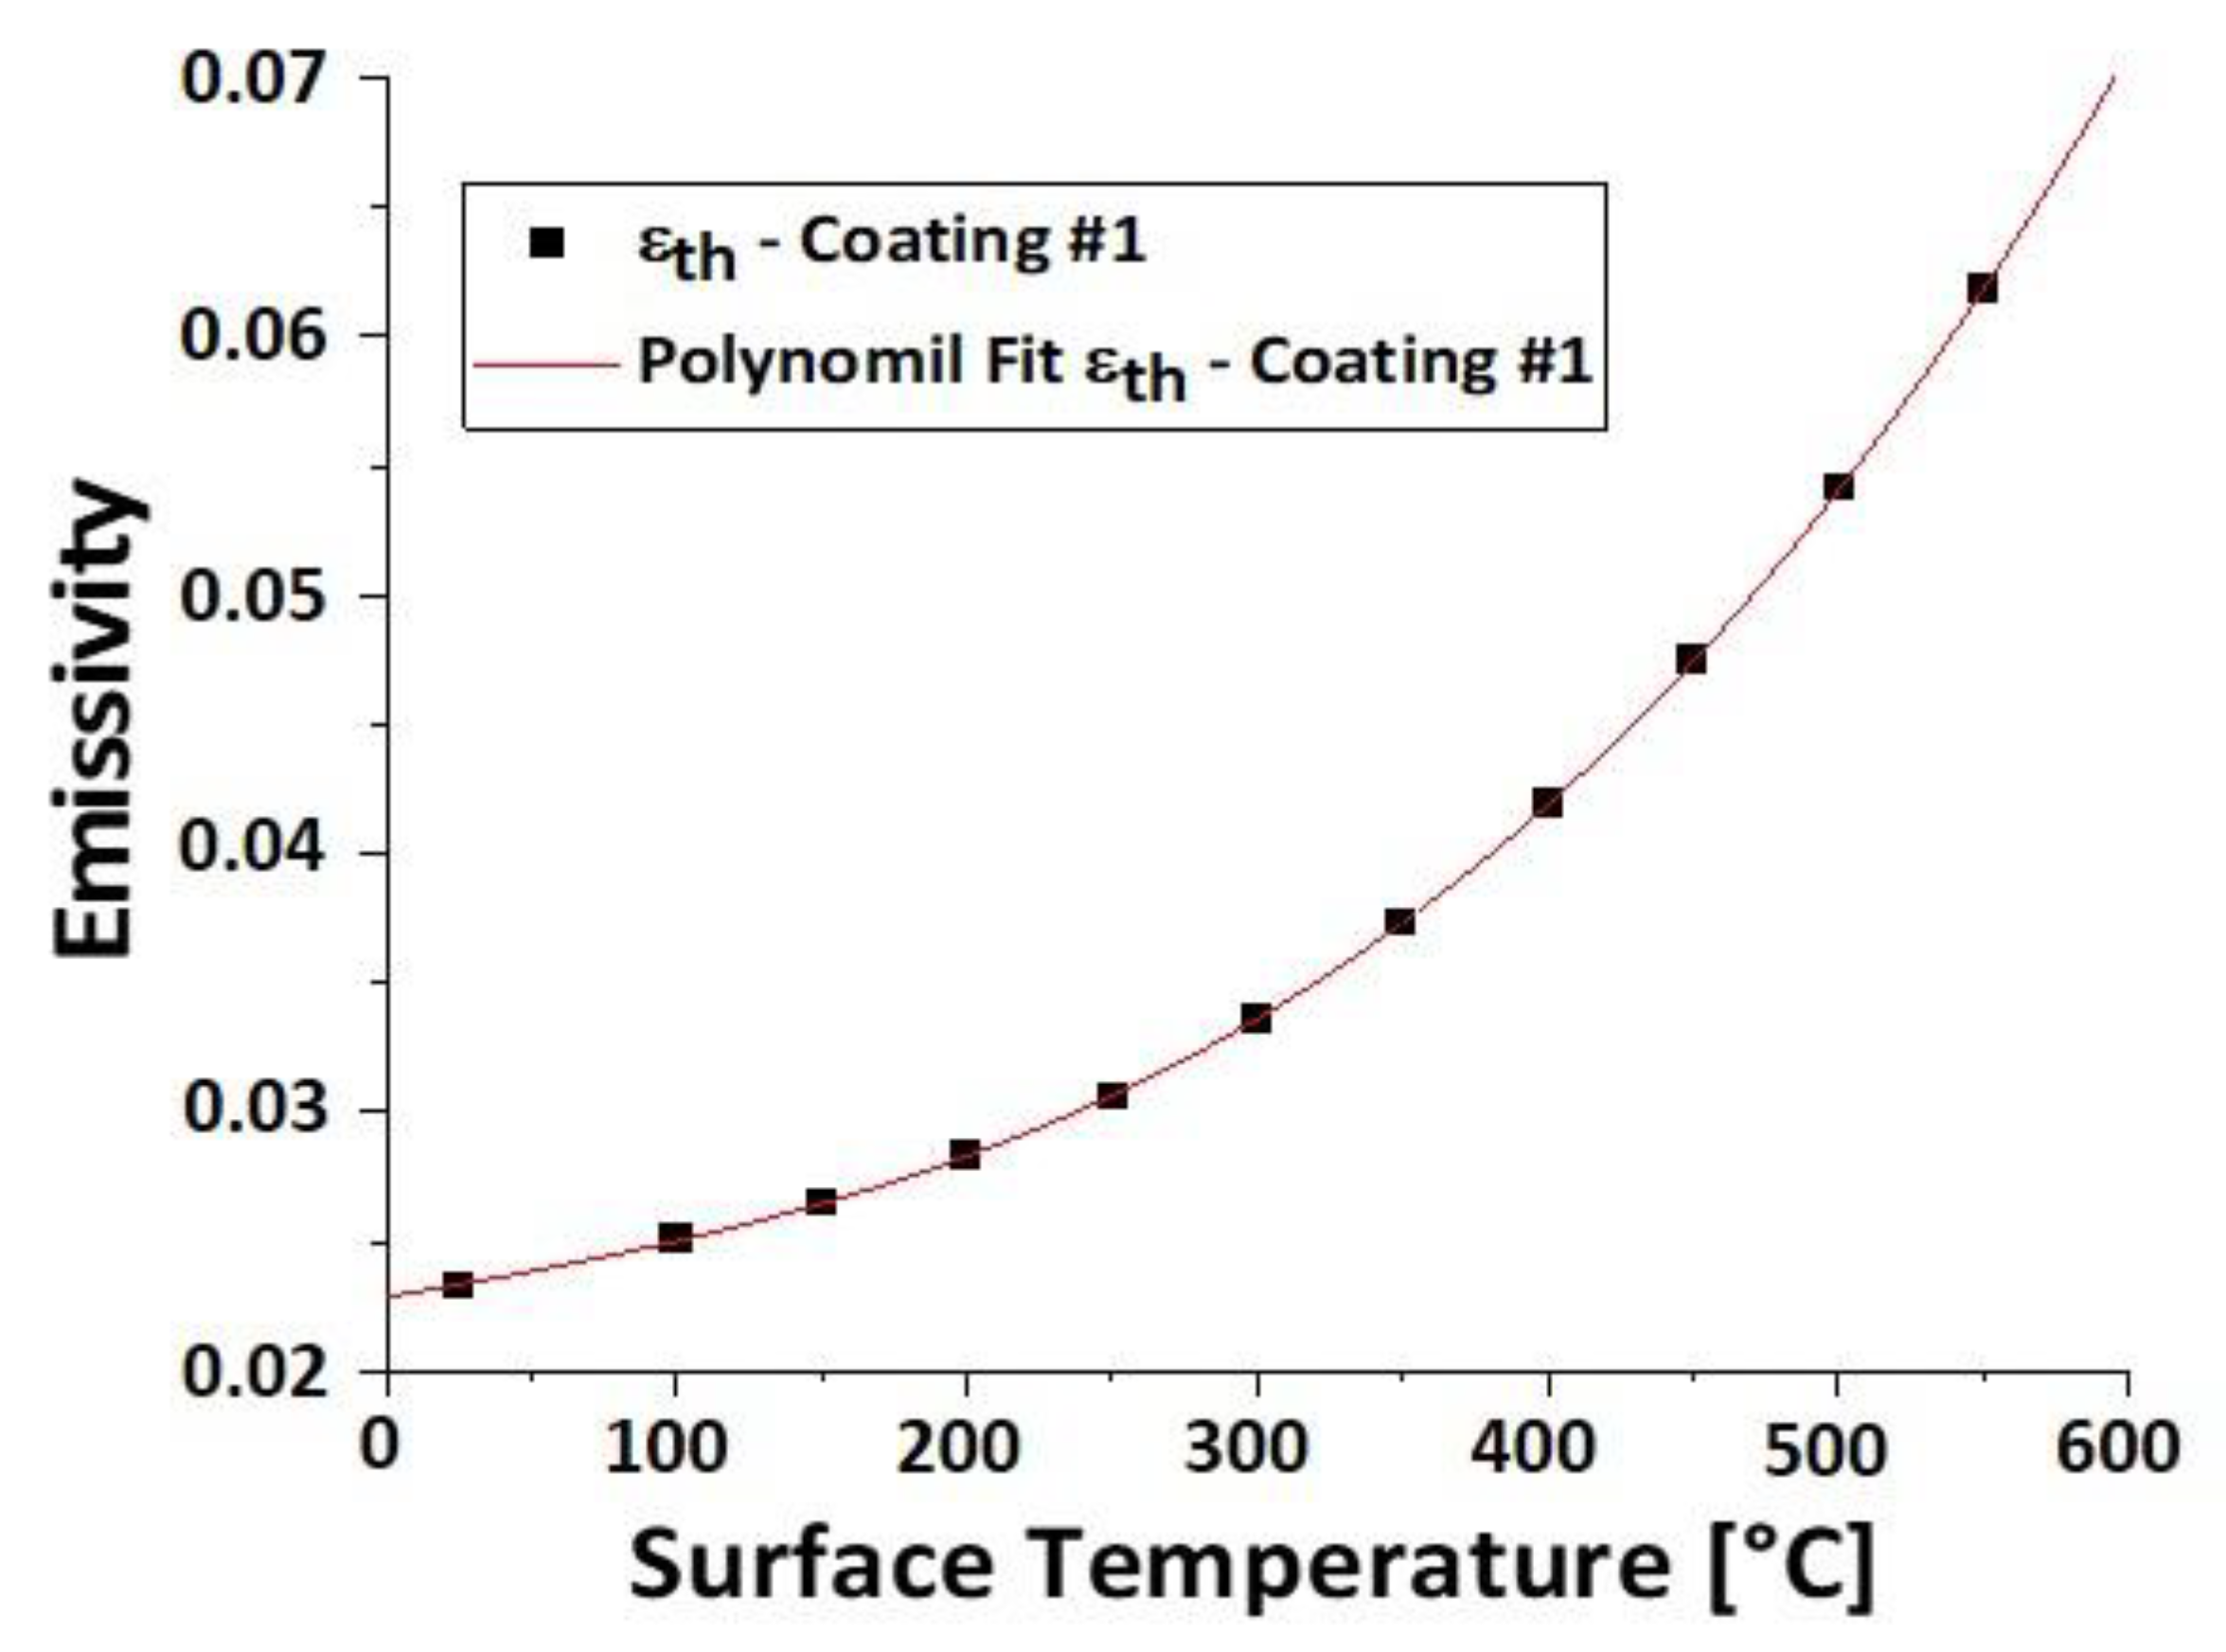
After measuring the spectral reflectance in the different wavelength ranges, it was possible to calculate both the absorptance in the wavelength range 0.25–2.5 µm and the emissivity by connecting the spectral reflectance in the wavelength range 0.25–2.5 µm with the spectral reflectance in the wavelength range 1.5–16 µm. The emissivity of each coating was calculated at different operating temperatures; the values identified as a function of temperature were subjected to a polynomial fitting in order to identify the mathematical correlation between the two parameters. This correlation is written as follows ( in [°C]):
The emissivity values and the fitting curve of the emissivity as a function of the operating temperature of coating #1 are reported in Figure 3, while the equation and the fit parameters are reported in Table 1.
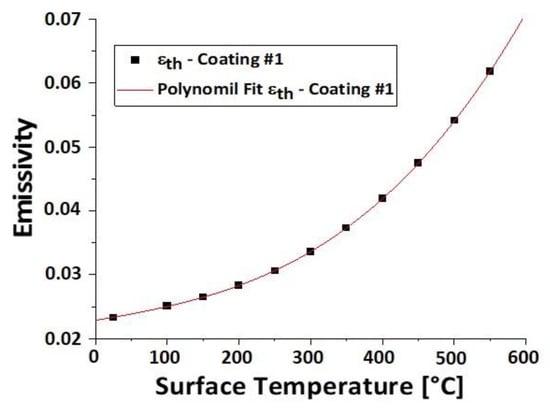
Figure 3.
Emissivity of coating #1 with respect to the surface temperature.

Table 1.
Equation and fit parameters of the emissivity as a function of the surface temperature of coating #1, referring to Equation (3).
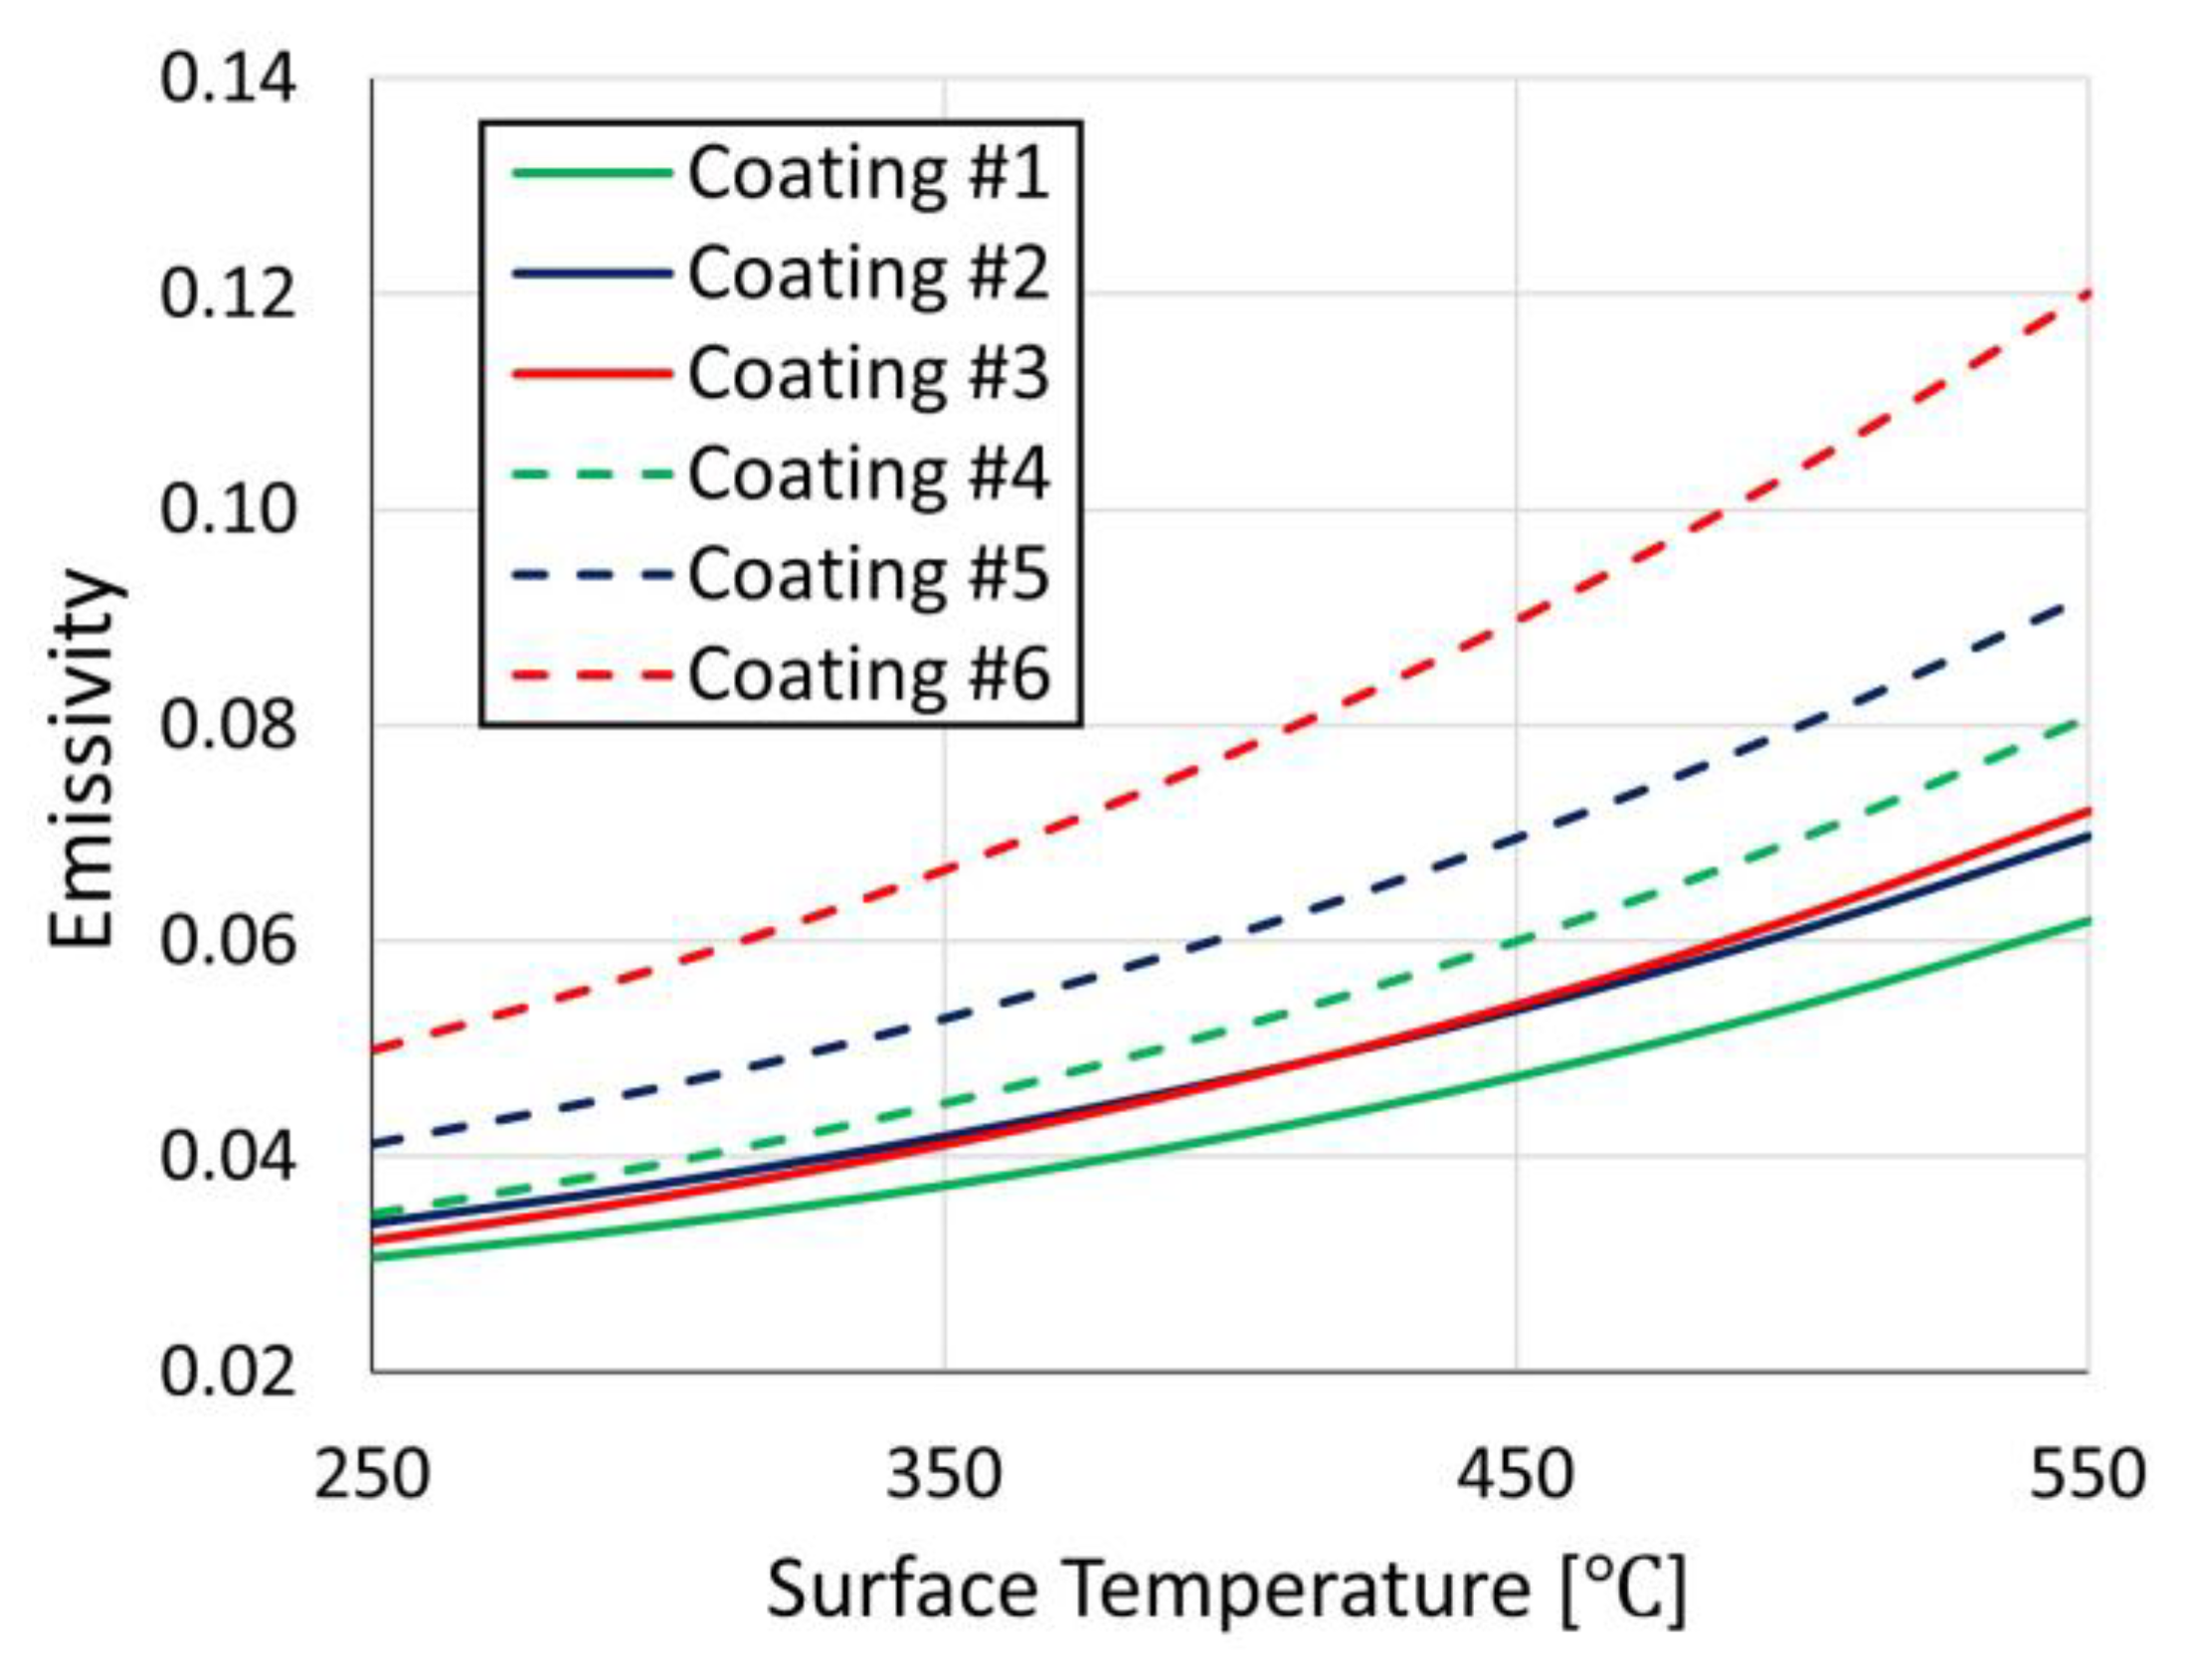
The same procedure was repeated for the remaining five coatings. Table 2 outlines absorptance data and emissivity correlations for the six coatings considered, and Figure 4 illustrates the emissivity of the coatings with respect to temperature. As can be seen in Table 2 and Figure 4, while coating #1 has the lowest absorptance among the six coatings, it provides the lowest emissivity in the entire temperature range. Conversely, coating #6, with the highest absorptance, has the highest emissivity in the whole temperature range as well. However, differences in the emissivity values among various coatings are greater at higher temperatures. As a result, it could be expected that a selective coating with a desirable photo-thermal performance at lower temperatures is not the best option for higher temperatures. For this reason, an optimal receiver configuration must be determined, employing multiple coatings arrayed along the collector line based on their photo-thermal performance at various temperature ranges.
Table 2.
Absorptance and emissivity data for the six selective coatings considered in this study.

Figure 4.
Emissivity of the six selective coatings with respect to surface temperature.
2.2. Methodology
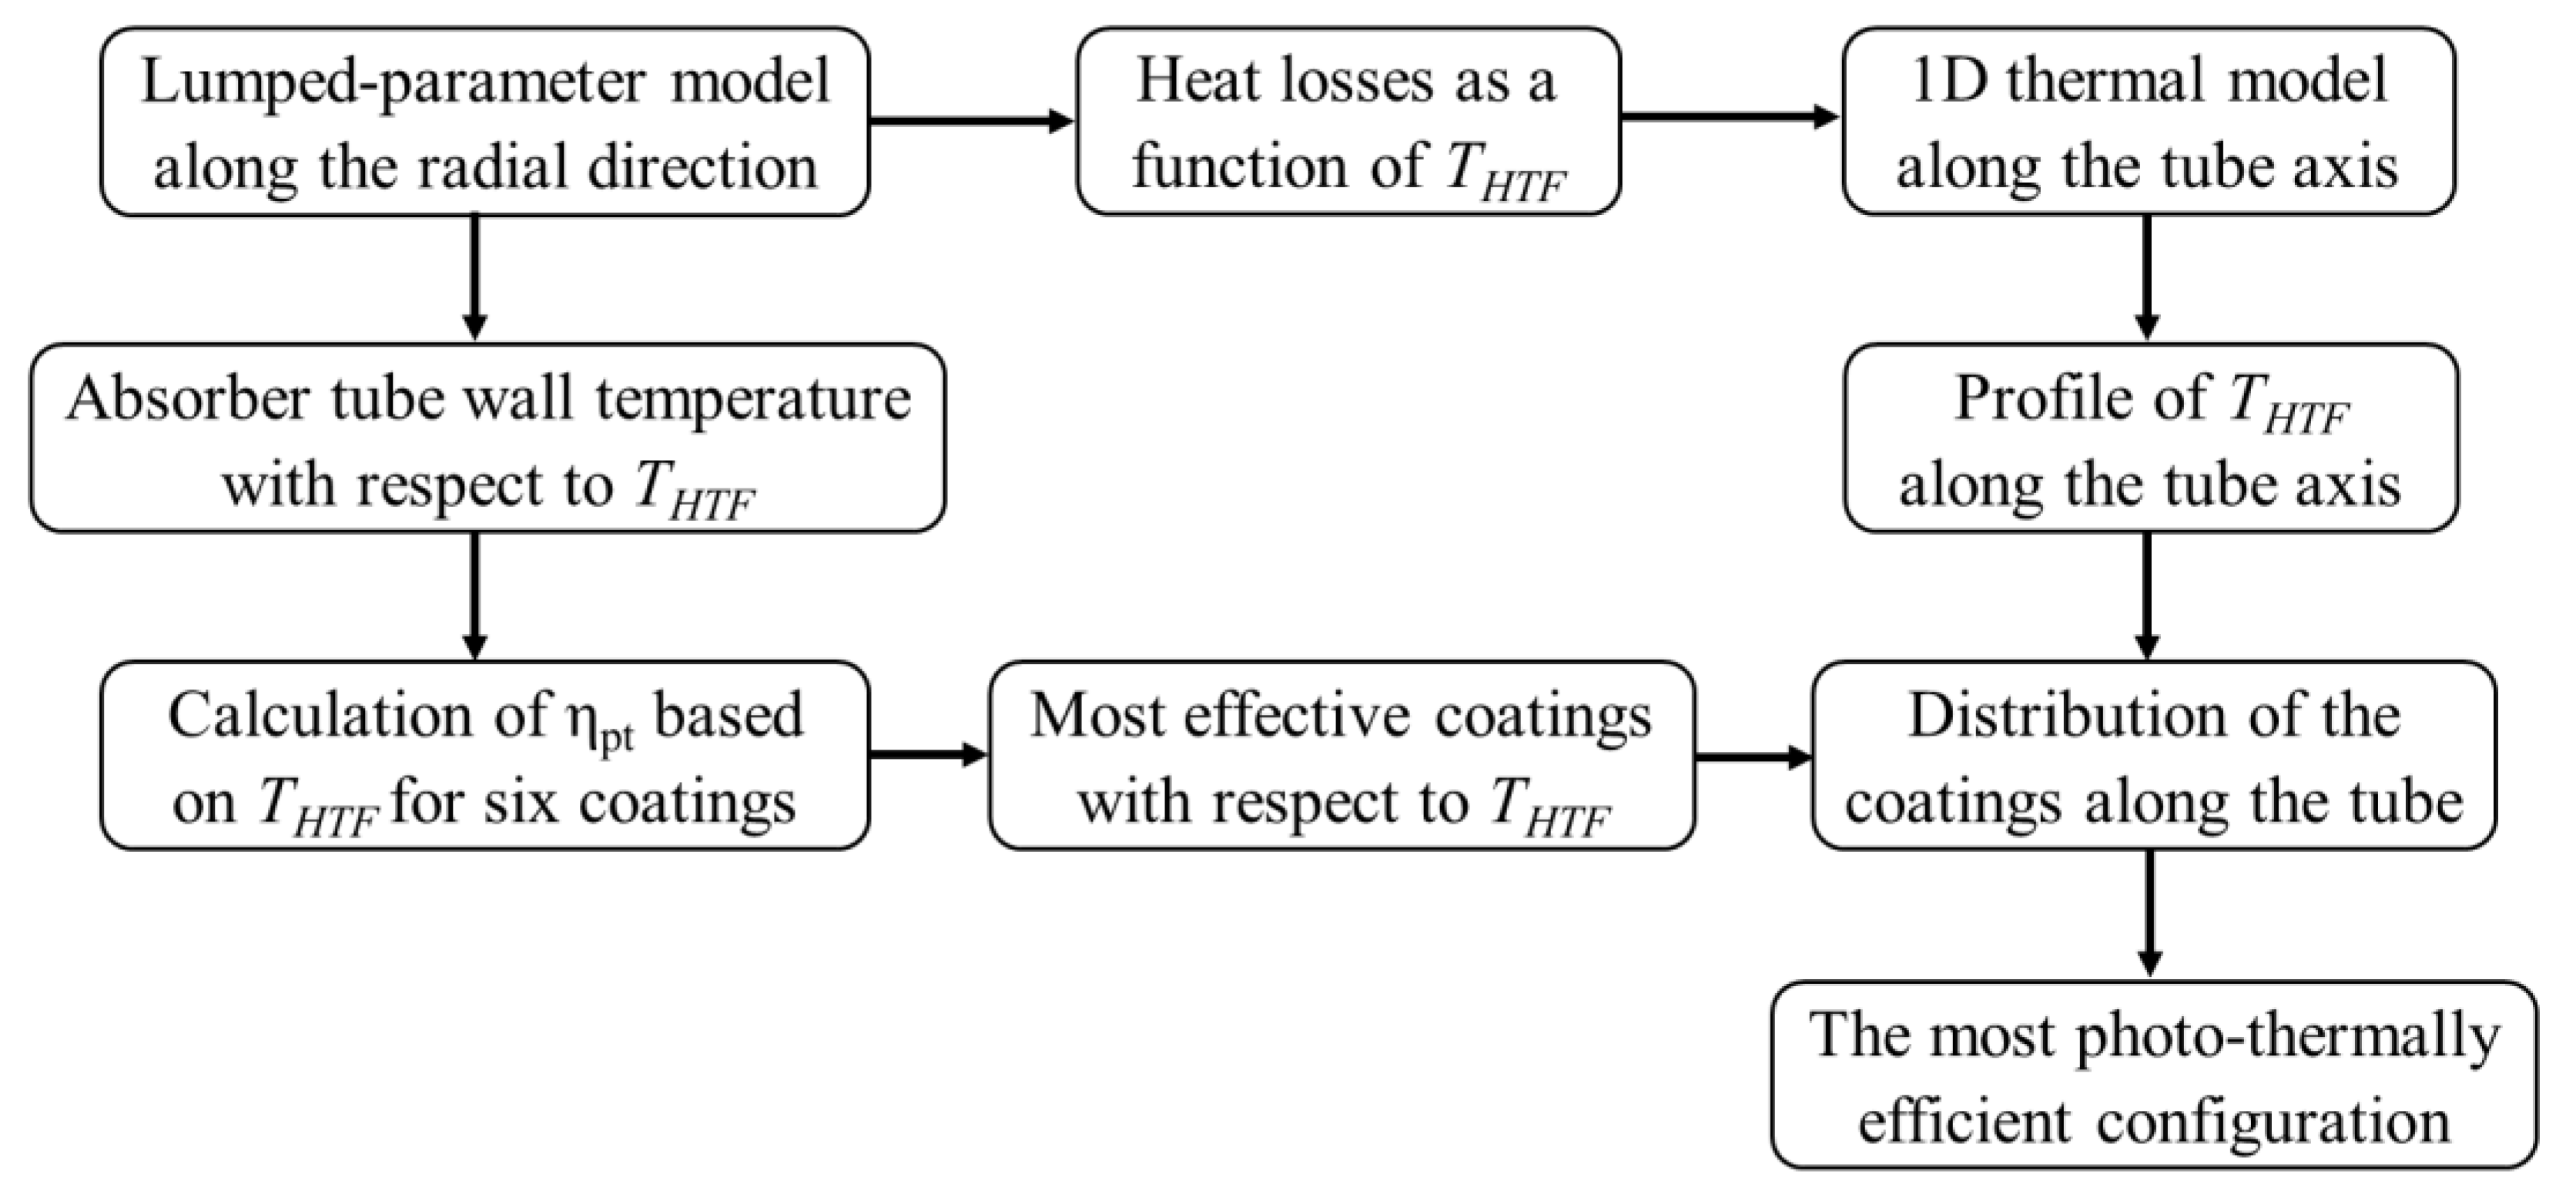
The computational procedure adopted in this paper is outlined in Figure 5. As shown, the final goal of this study is to achieve the most photo-thermally efficient PTC configuration. To determine this configuration, a lumped-parameter model was initially developed along the radial direction of the receiver tube. The boundary conditions applied to the lumped-parameter model include incident solar heat flux, mass flow rate, HTF temperature, ambient temperature and (transversal) wind speed [28]. This model calculates the absorber tube wall temperature at various HTF temperatures as well as heat losses as a function of HTF temperature. The latter is then exploited by the 1D model developed along the tube axis to solve the energy balance [24]. Using this 1D model, the HTF temperature profile can be obtained in the axial direction, which is then employed to determine the distribution of the most efficient selective coatings along the collector line. These efficient coatings are recognized through the calculation of the photo-thermal efficiency [13] by using the absorber tube wall temperature already provided by the lumped-parameter model. Finally, the most photo-thermally efficient PTC configuration is determined, indicating a specific distribution of selective coatings along the collector line that ensures the highest possible photo-thermal efficiency.
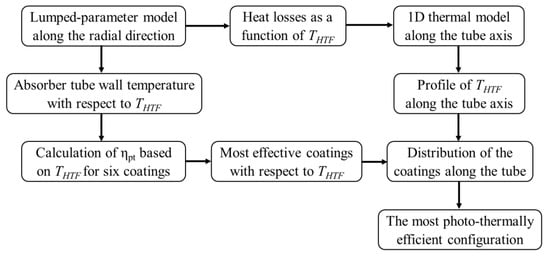
Figure 5.
Global view of the methodology implemented for the photo-thermal optimization of the PTC system.
2.3. Lumped-Parameter Model
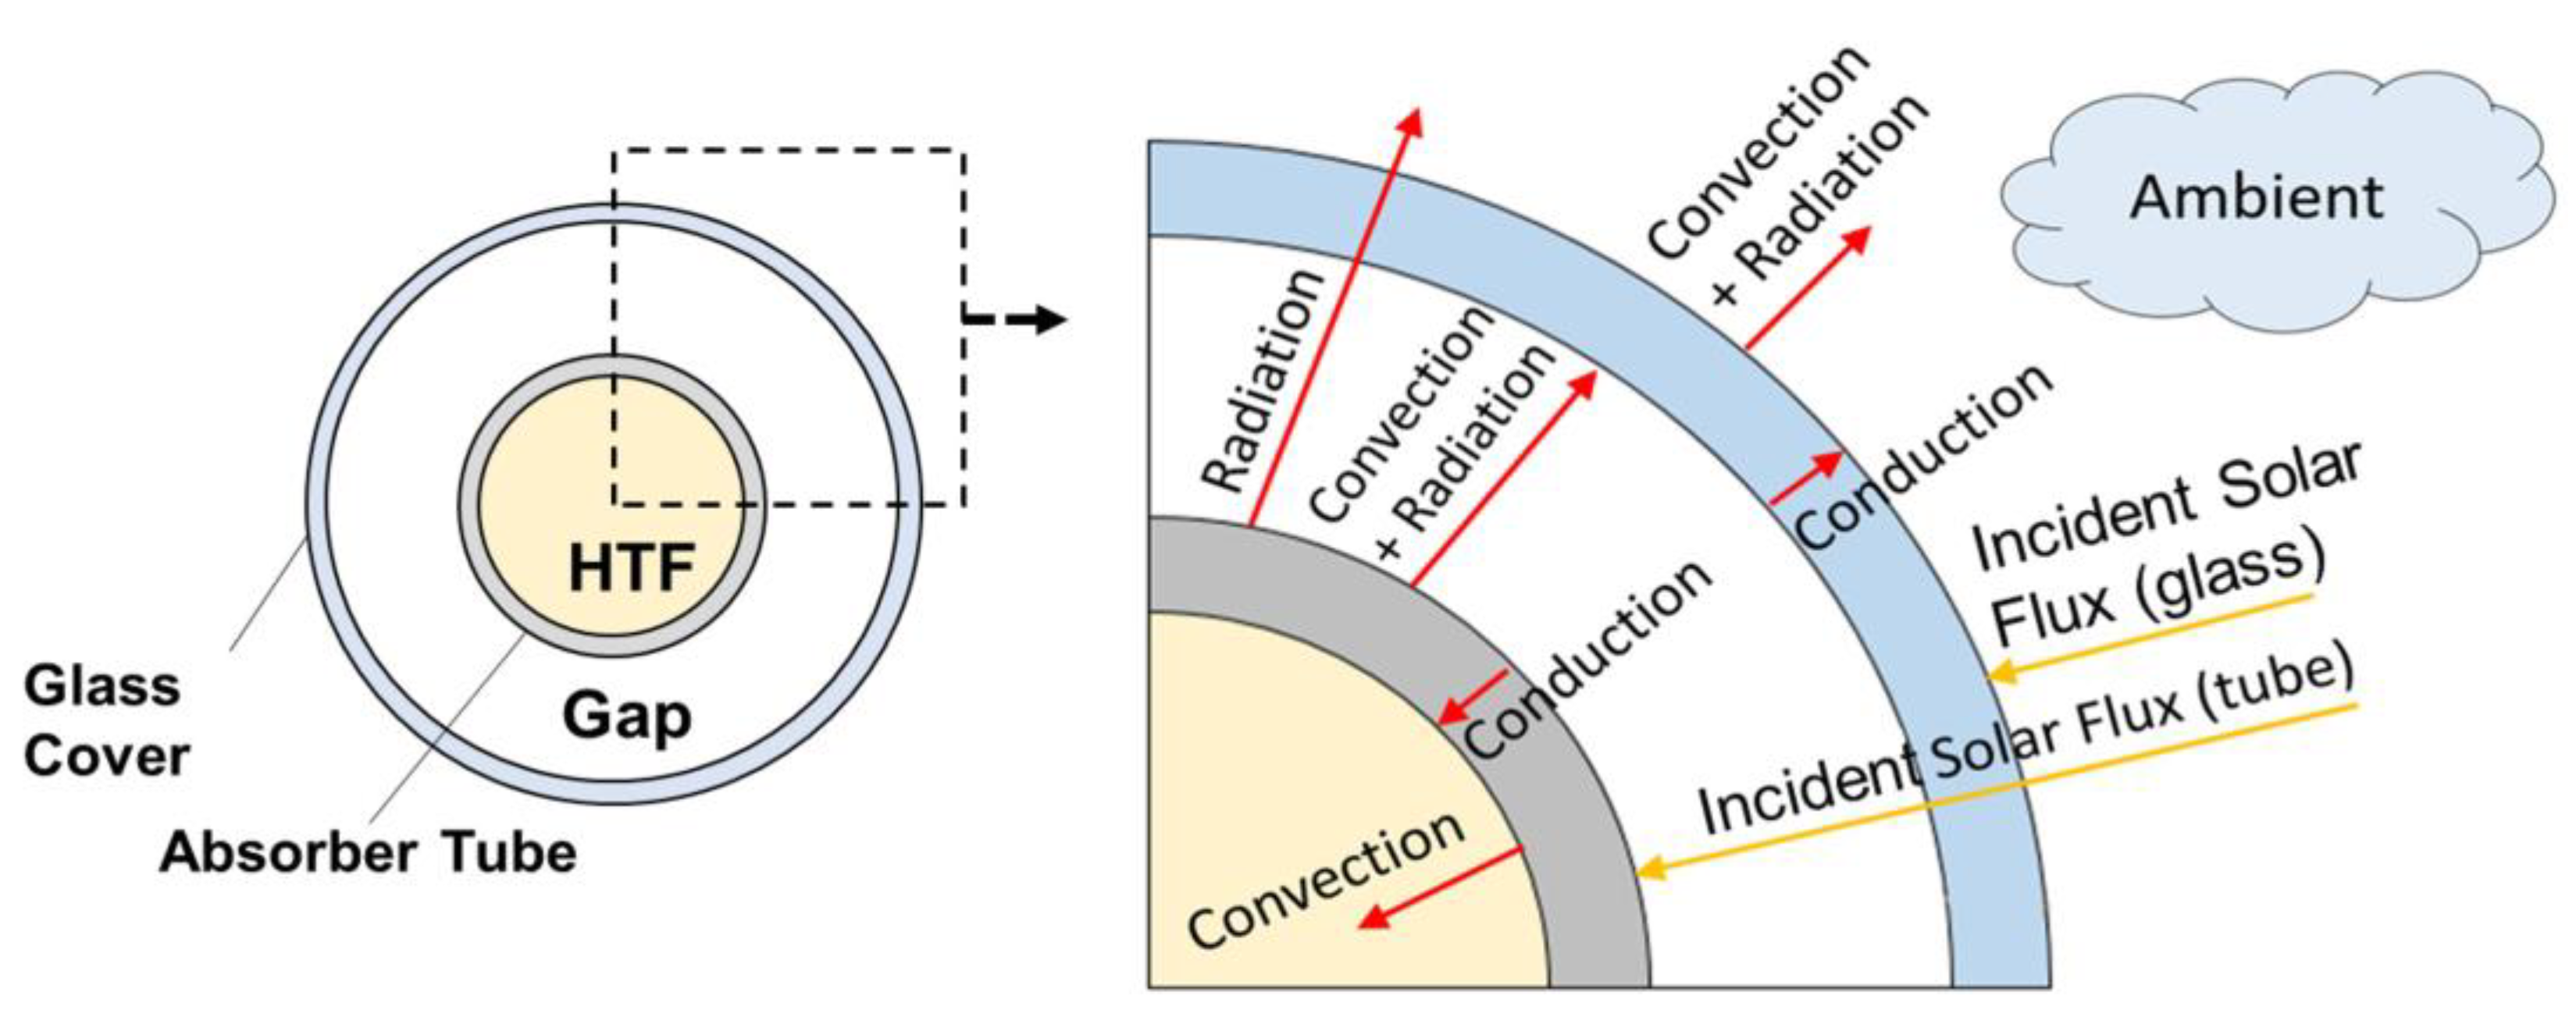
In this study, a steady-state lumped-parameter model has been developed along the radial direction of the receiver tube using the Modelica language. This model aims at computing the absorber tube wall temperature and heat losses at various HTF temperatures. A cross-section of the receiver tube is considered in this model to compute heat fluxes from the HTF to the external ambient environment for a given HTF temperature. Figure 6 represents heat fluxes along the radial direction considered in the model. Relevant correlations for the calculation of the heat fluxes shown in Figure 6 are presented in [29]. It should be noted that the cold sink temperature required for computing the radiative heat loss from the glass outer surface to the ambient environment has been assumed to be 8 °C below the ambient temperature (sky temperature). Furthermore, the convective heat transfer coefficient between the absorber tube and the glass cover has been approximated to be 1.115 × 10⁻⁴ W/m2K to simulate vacuum conditions [29].

Figure 6.
Lumped-parameter model: heat fluxes in the radial direction [29].
The following assumptions have been made in the lumped-parameter model developed in this work:
- The azimuthal heat conductions within the glass and absorber tube walls have been ignored, in accordance with [30].
- The conductive heat loss through the support structures has been neglected, in accordance with [31].
- Despite the assumption of complete opacity for the glass envelope in the infrared range made in [29], a transmissivity of 0.11 has been implemented according to Kirchhoff′s law, given an emissivity of 0.89 and a reflectivity of 0 [28].
Regarding the HTF mass flow rate, a reference value of 2.2 kg/s has been initially considered for the plant, based on a reference pilot plant [32]. This value corresponds to a reference day and time (March 21st at 12:00 GMT) with a DNI of 900 W/m2, an ambient temperature of 30 °C and a wind speed of 3.7 m/s. These operational conditions have been considered as the reference values for the present work. The linear solar collector implemented in [32] had the same materials and geometric specifications as the PTC considered in this study (see Figure 1). The only difference between the two collectors is attributed to the secondary reflector, which is absent in the configuration considered in the present work. Furthermore, to evaluate the impact of the HTF mass flow rate on the final result of the photo-thermal optimization, a sensitivity analysis has been conducted in this work. For this purpose, various mass flow rates of 1, 1.5, 3 and 4 kg/s have also been investigated.
Furthermore, a Robin boundary condition has been applied to the inner surface of the absorber tube wall. This requires imposing the HTF temperature and the convective heat transfer coefficient. As already mentioned, the former is known as input data, while the latter can be computed by means of the Gnielinski correlation for the given mass flow rate [29].
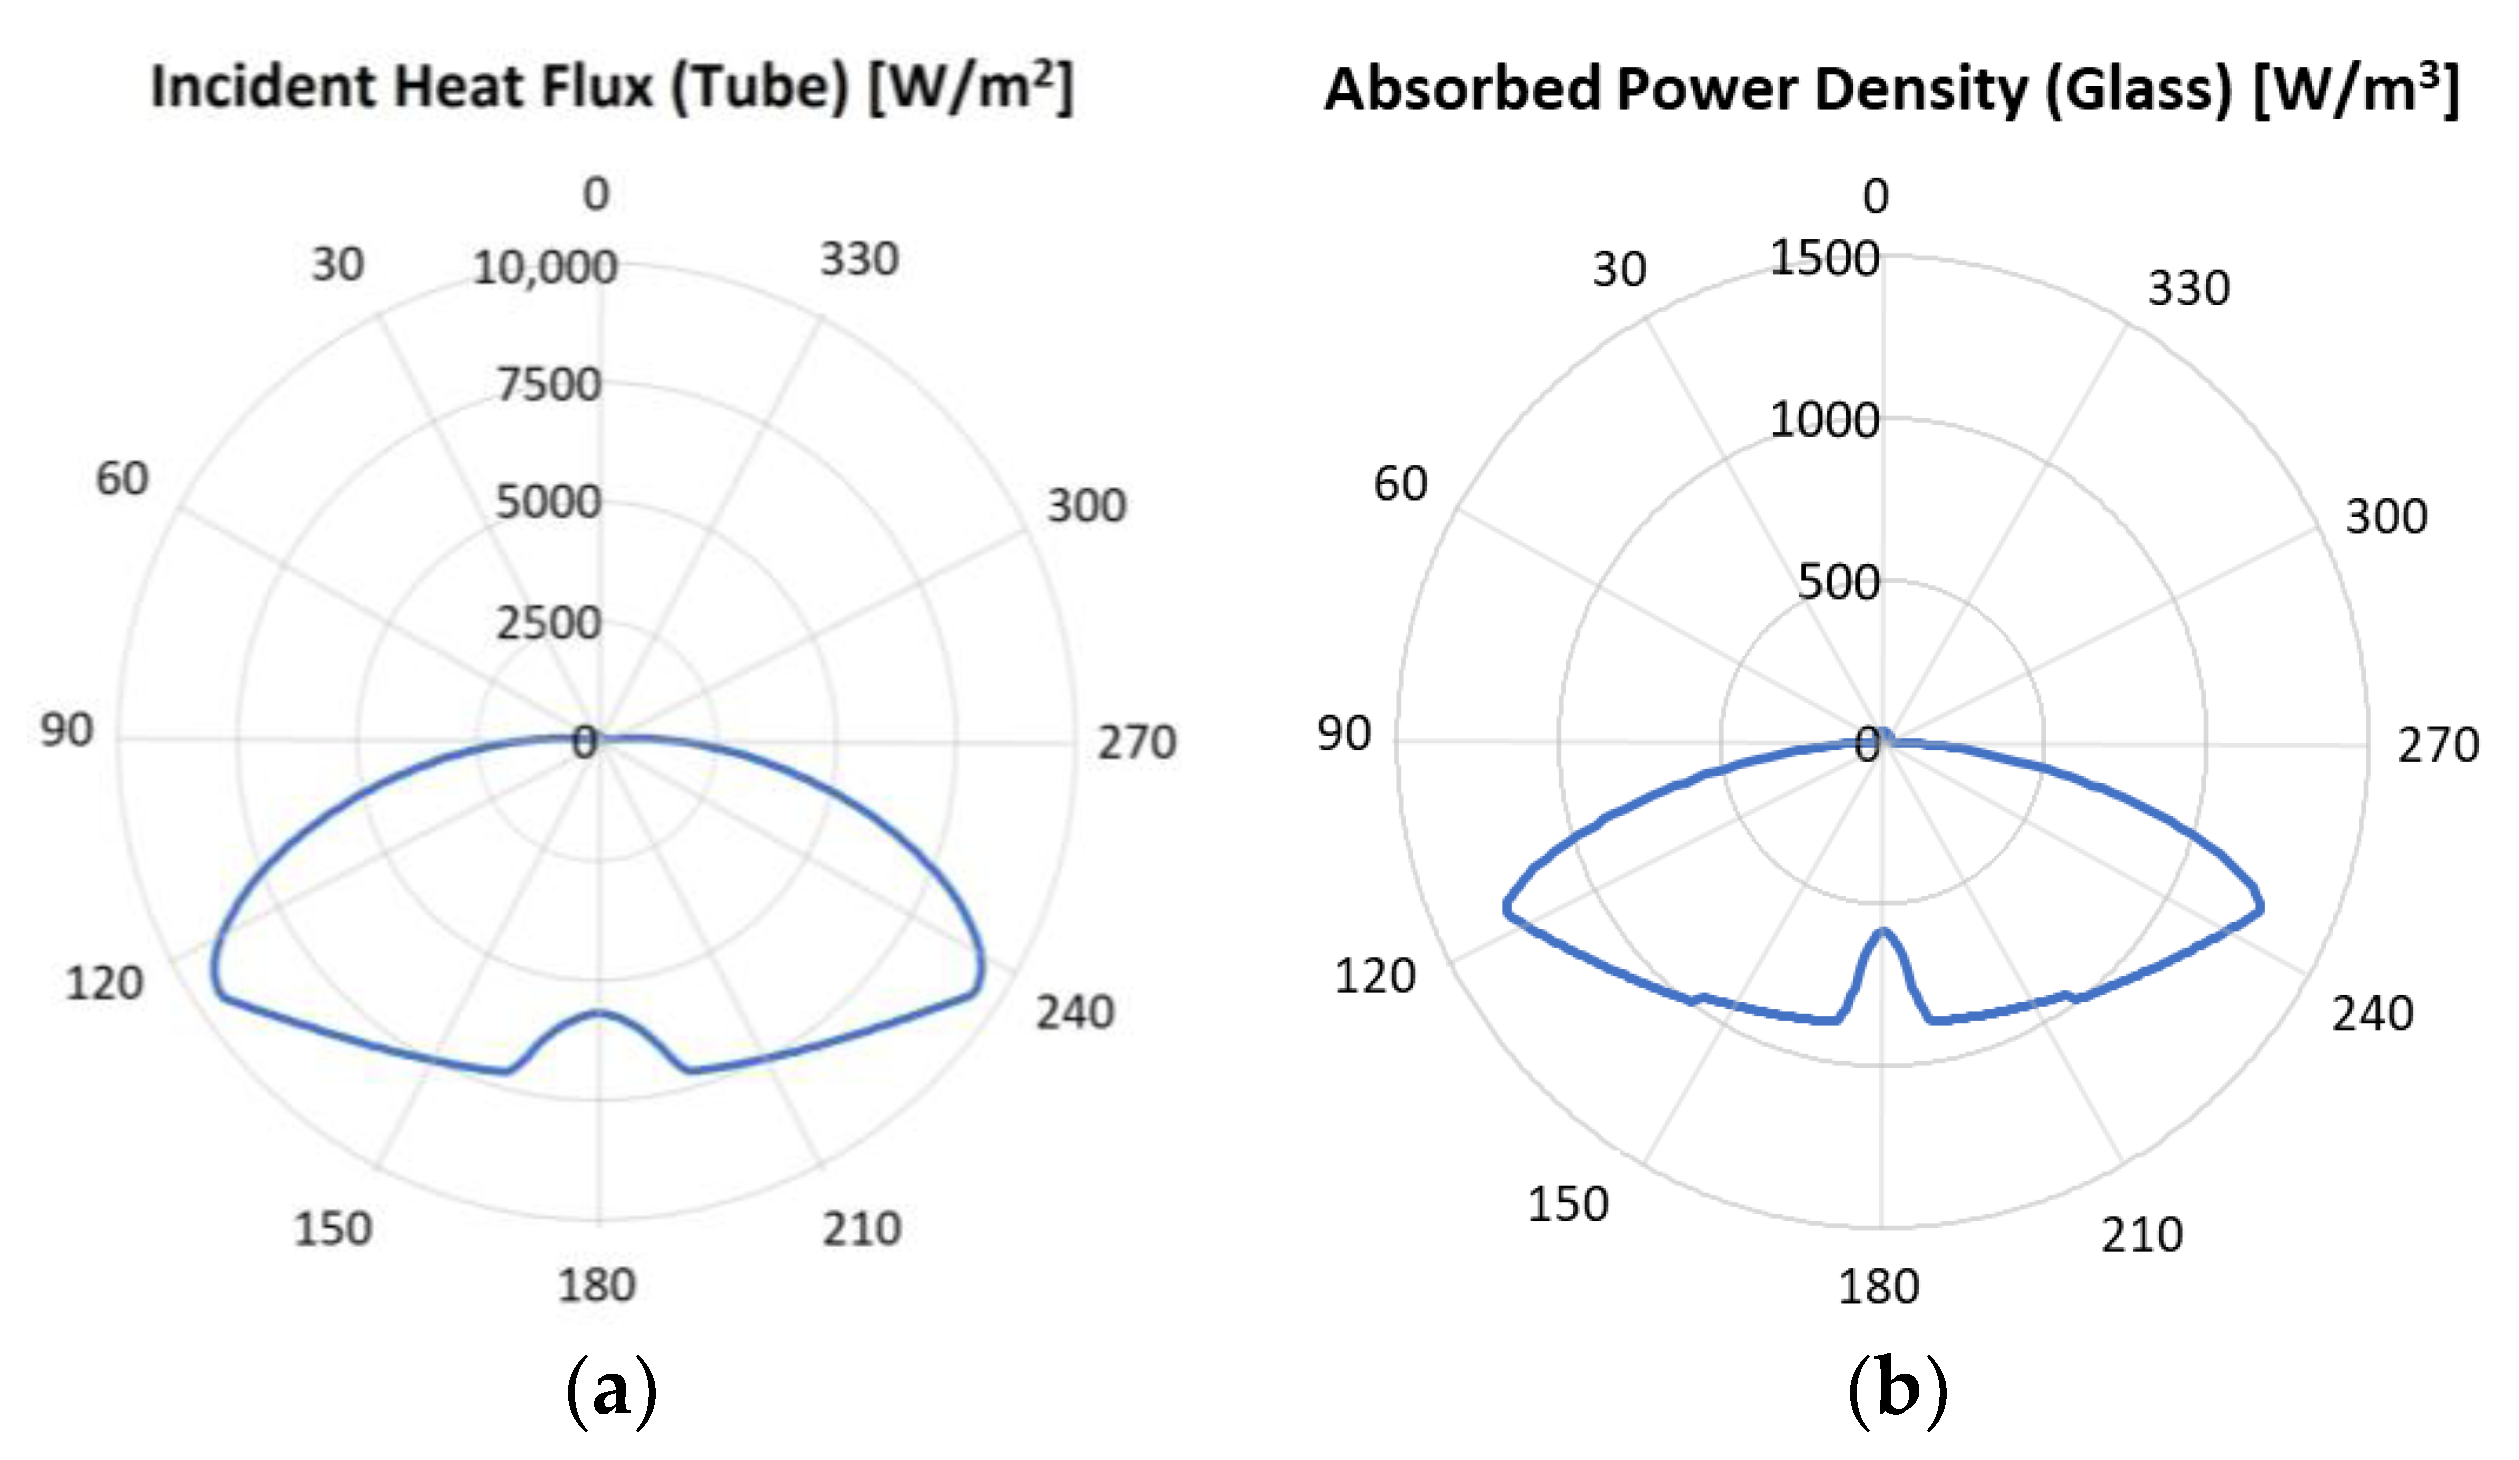
In the lumped-parameter model, the walls of the glass envelope and the absorber tube were discretized into 20 elements in the azimuthal direction to ensure a solution independent of the discretization. The applied boundary conditions encompass mass flow rate, HTF temperature, ambient temperature, (transversal) wind speed and the azimuthal distribution of the solar flux incident on the glass envelope and on the absorber tube. Figure 7 depicts the azimuthal distribution of the incident heat flux on the absorber tube (in W/m2) and of the absorbed power density by the glass tube (in W/m3), computed by means of a Monte Carlo-based ray-tracing code in Tonatiuh software (version 2.2.4) [33]. In this respect, multiple reflections, absorptions and scatterings occurring within the PTC system were simulated. Tonatiuh deals with elastic collisions, which means that the energy could be transferred to a specific surface only when a photon is absorbed. Consequently, the heat flux on a given surface can be directly computed from the number of photons absorbed. By implementing such an approach, heat flux distributions have been determined for the glass and absorber tubes. This approach has been widely employed in the literature to compute the heat flux distribution on solar collectors, providing reliable results [34]. The data provided in Figure 7 correspond to a DNI of 900 W/m2, tracking and inclination errors of 0° and an incidence angle of 0°.
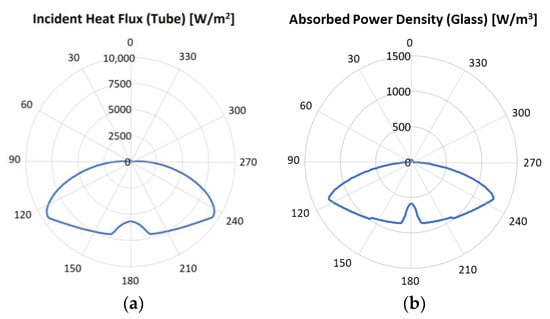
Figure 7.
Azimuthal distribution of: (a) incident heat flux on the absorber tube, and (b) absorbed power density by the glass cover.
The lumped-parameter model provides heat losses as a function of the HTF temperature for use by the 1D model (see Section 2.4) and the absorber tube wall temperature is required to calculate the photo-thermal efficiency (see Section 3.3).
2.4. 1D Model
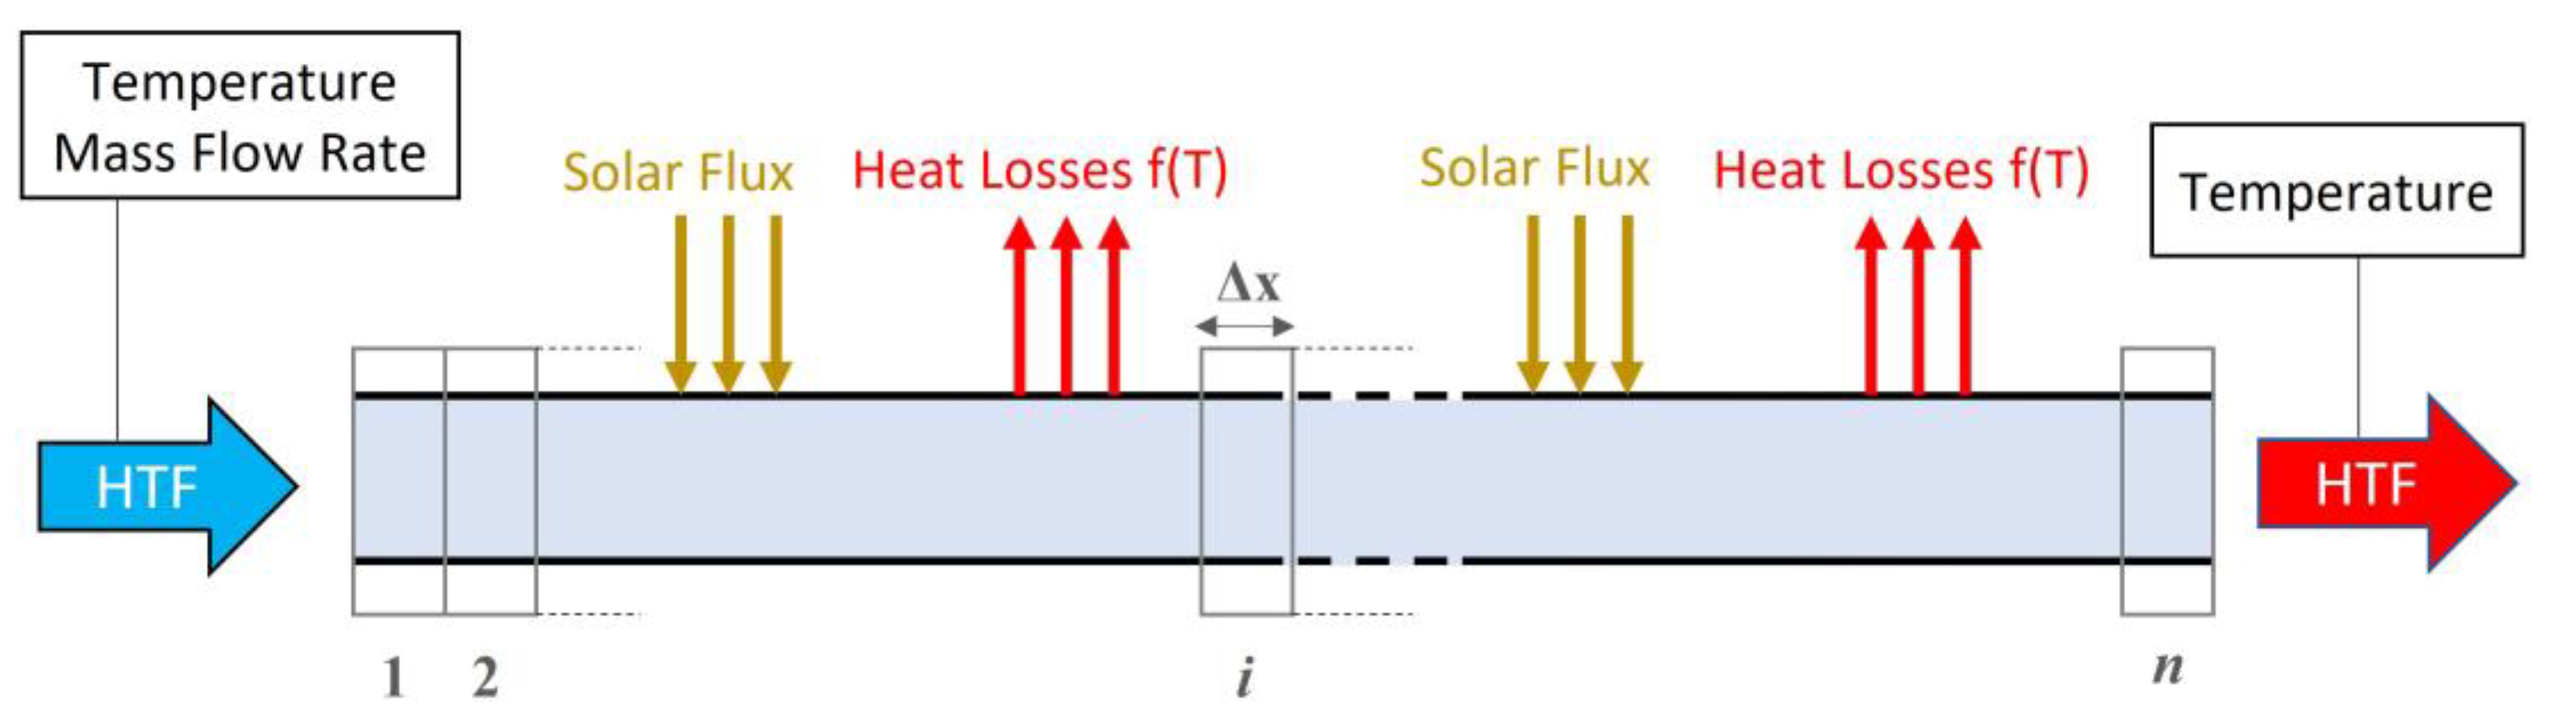
In order to determine the HTF temperature profile along the tube, a simple 1D model has been developed along the collector axis. Once the temperature profile is obtained, the tube length required to reach the desired HTF temperature at the outlet section of the receiver tube (550 °C) can be determined as well. The 1D model exploits the results of the lumped-parameter model in terms of heat losses correlations with respect to HTF temperature. Figure 8 illustrates a schematic of the 1D model, incorporating the required boundary conditions. This model solves the steady-state energy balance equation for the molten salt along the receiver axis. As shown in Figure 8, the applied boundary conditions include the HTF temperature at the inlet and outlet sections of the receiver tube, mass flow rate and the solar flux transferred to the HTF. The latter corresponds to the difference between the absorbed solar flux and heat losses to the environment. Regarding the spatial discretization, the receiver axis was divided into n control volumes with equal lengths of 1 m to ensure the grid independence of the results. It should be noted that the actual number n of control volumes would depend on the computed total length of the receiver tube. Therefore, the final length of the tube would be an integer multiple of Δx, representing an acceptable approximation since Δx is significantly lower than the total tube length (always < 1%).
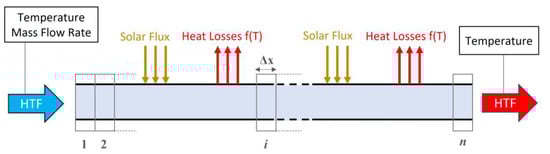
Figure 8.
Schematic of the 1D model discretized along the receiver axis with applied boundary conditions.
The steady-state energy balance equation implemented in the 1D model can be written as follows:
where is the length of the i-th control volume, represents mass flow rate, is the specific heat provided as a function of HTF temperature, and and are HTF temperatures entering and leaving the i-th control volume, respectively. and represent the absorbed solar power and heat losses per unit length, respectively.
This simple model presents reliable results since it employs the results of a validated (see Section 3.1) lumped-parameter model. In particular, the lumped-parameter model provides in Equation (4) as a function of HTF temperature (see Section 3.2).
The 1D model is exploited to obtain the HTF temperature profile along the receiver tube and, consequently, to determine the most photo-thermally efficient collector configuration, as presented in Section 3.3.
3. Results and Discussion
To conduct a photo-thermal optimization analysis, the lumped-parameter model has initially been validated against experimental data. Then, the results of the lumped-parameter model have been obtained in terms of absorber tube temperature and heat losses to the environment. Finally, the results of the photo-thermal optimization of the PTC system have been achieved, representing the most photo-thermally efficient configuration of the receiver tube.
3.1. Validation
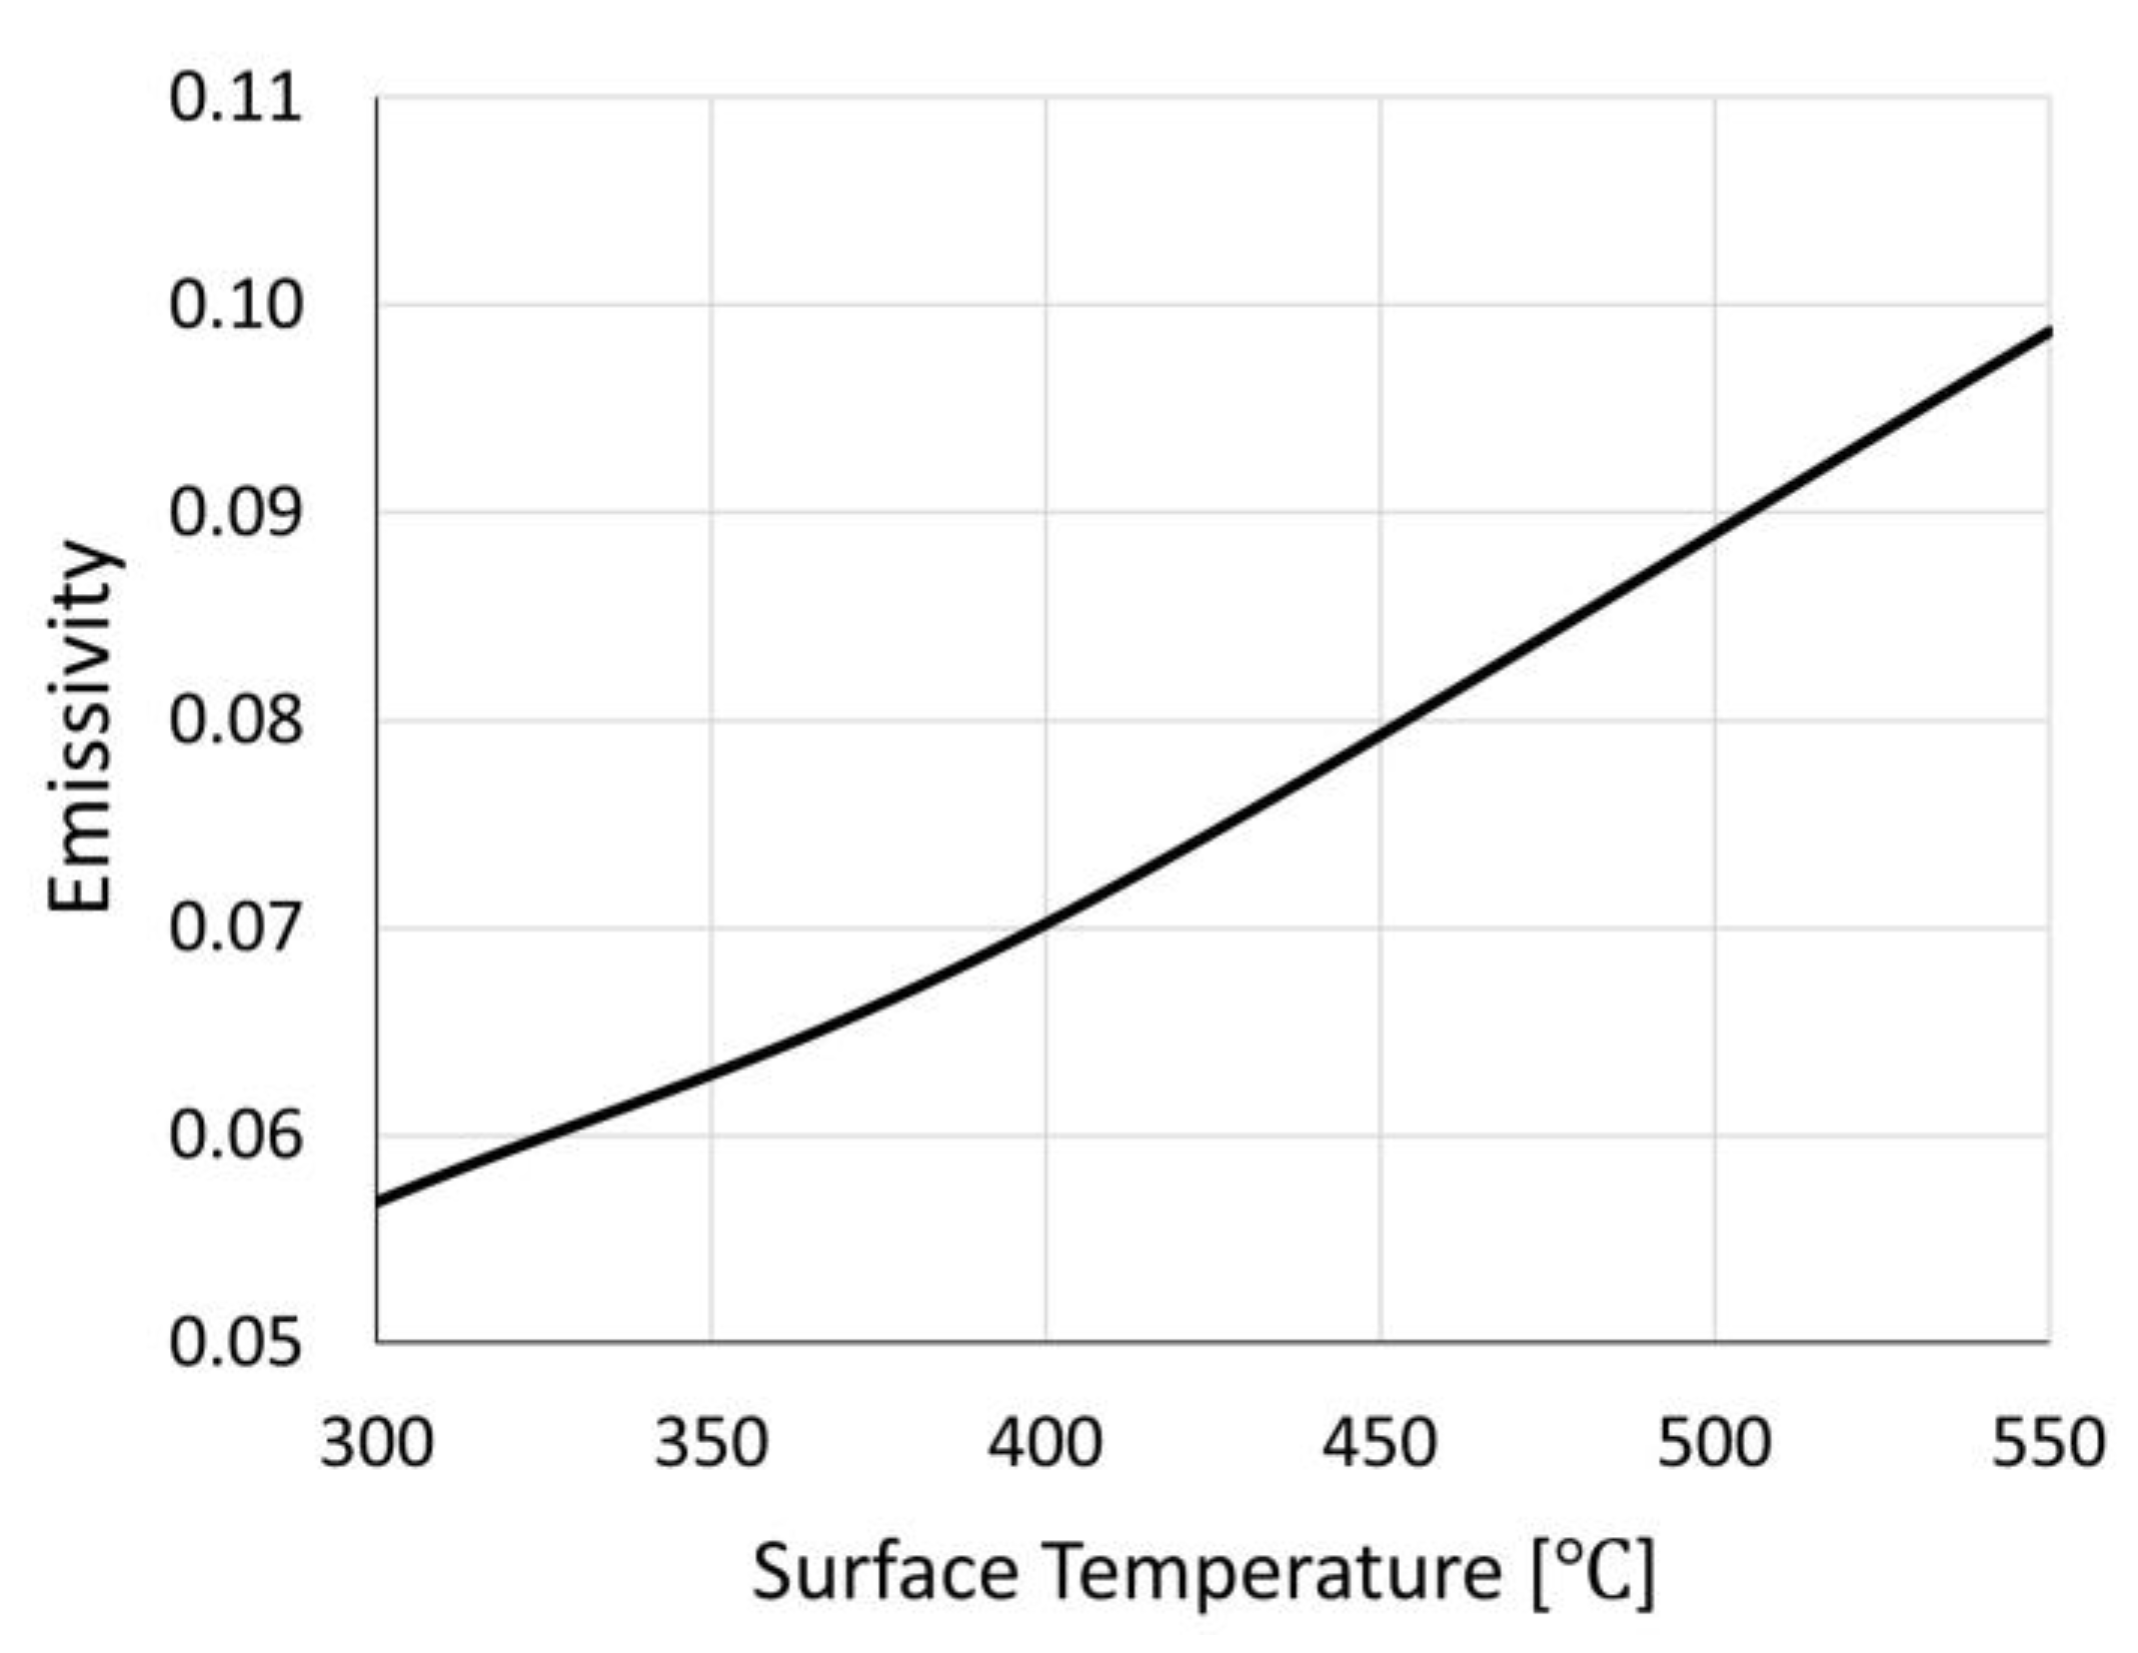
The lumped-parameter model has been validated against experimental data provided by ENEA in terms of heat losses from the absorber tube for the ASE HCEMS-11 receiver tube. The experimental test was conducted by Archimede Solar Energy (ASE). The materials and geometrical specifications of the receiver tube employed in the experiment are the same as in the configuration depicted in Figure 1. A selective coating was applied to the outer wall of the absorber tube in the experiment with an absorptance of 0.9487. The emissivity of the coating is depicted in Figure 9 as a function of temperature.

Figure 9.
Emissivity of the selective coating implemented in the experiment.
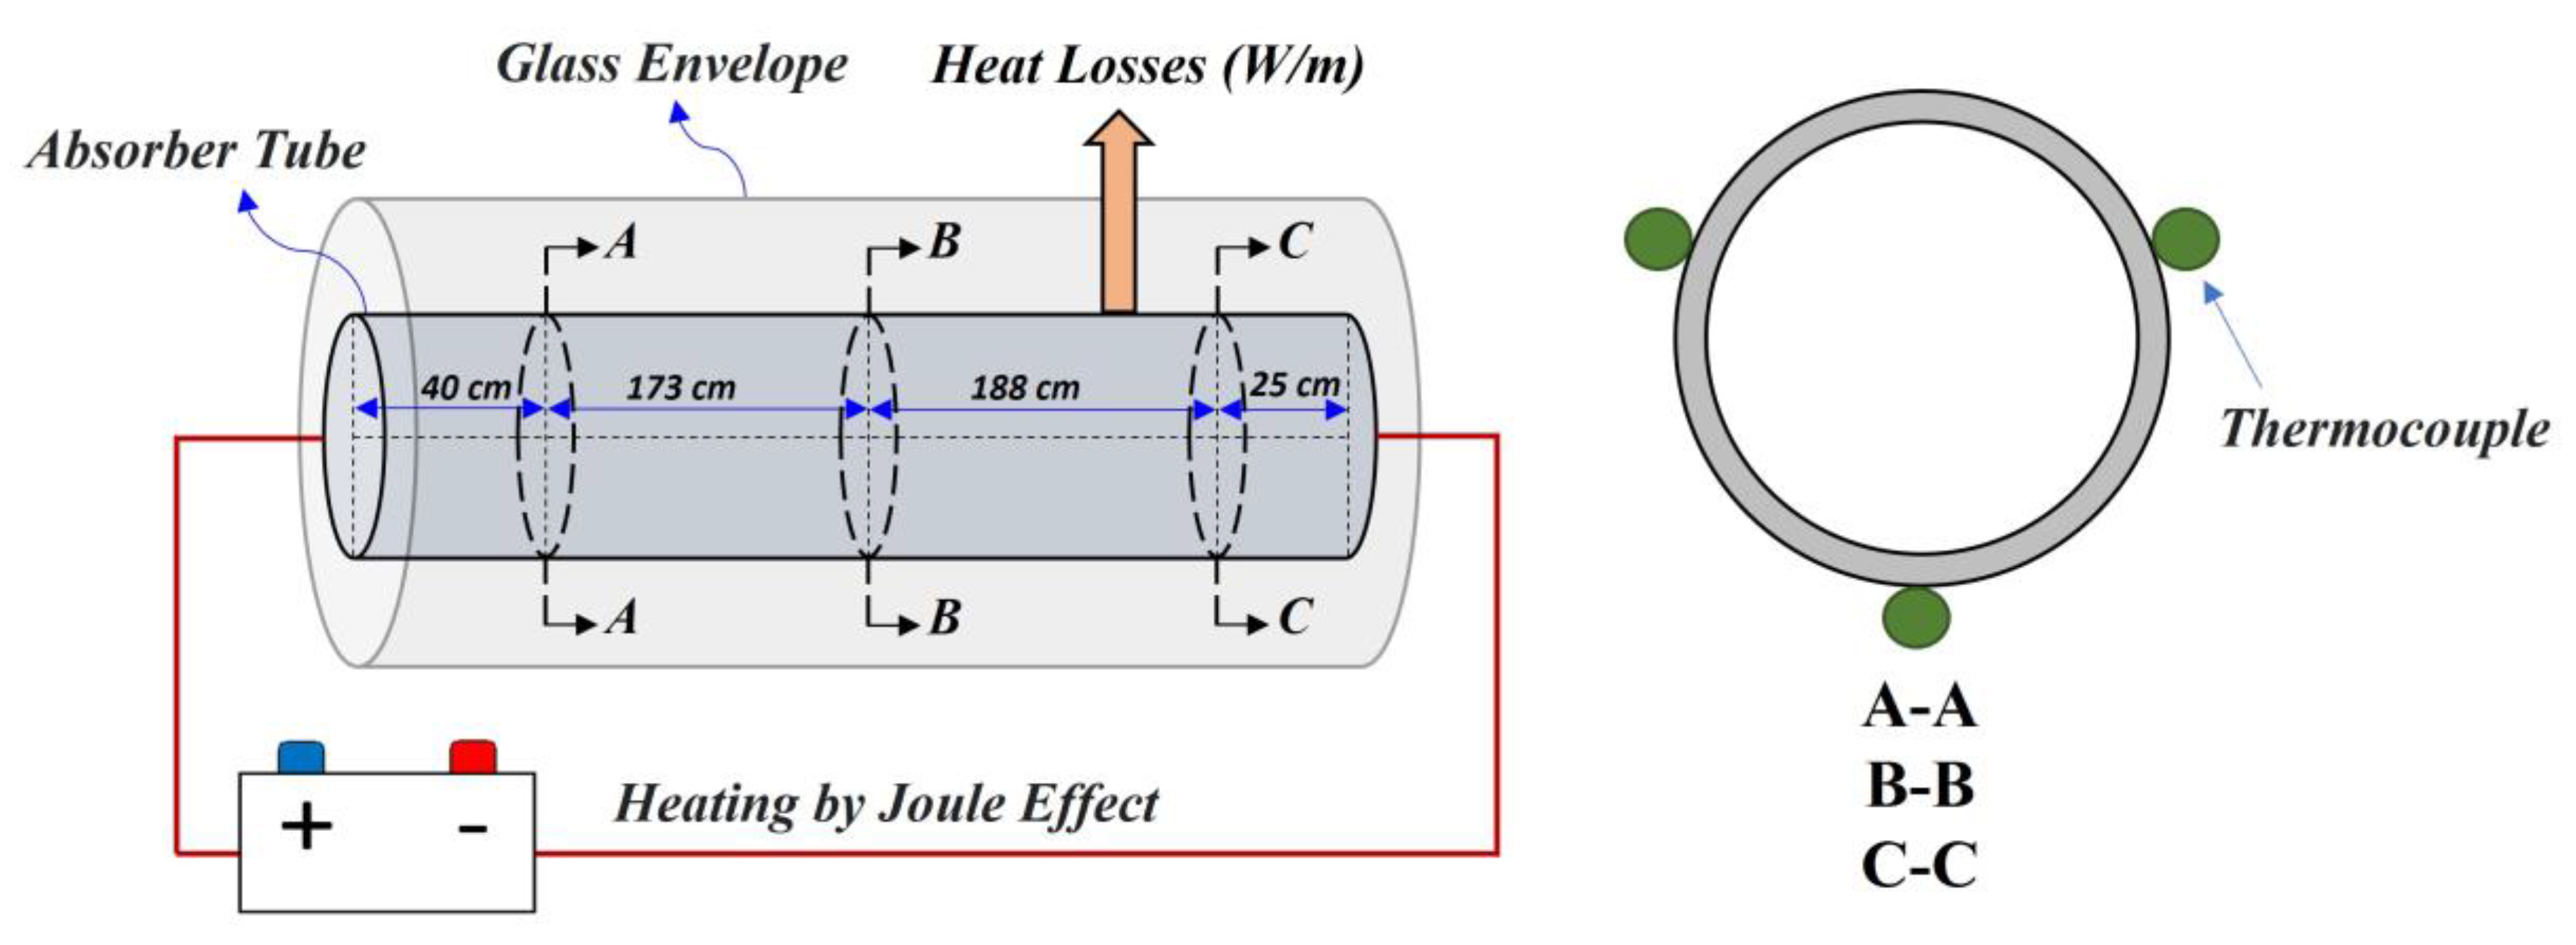
A schematic of the experimental setup is outlined in Figure 10. As shown, the experiment was performed by heating the absorber steel tube at low voltage through the joule effect, keeping it at a fixed and constant temperature for a time period of 120 min with an accuracy of ±1 °C (stationary state). Once a uniform tube temperature was reached, the supplied electrical power to maintain the tube’s constant temperature can be considered coincident with the average tube thermal losses in the external environment by radiation and natural convection. The internal steel tube and external glass tube temperature was measured, respectively, by nine thermocouples (type K) positioned in three sections along the tube, with angular intervals of 120°. The electrical power was supplied (1000 A and 40 Volts) to the tube through nickel-plated electrical terminals positioned at the two ends of the steel tube tightened on the external diameter. The electrical terminals’ design was optimized to guarantee an optimal electrical coupling with the external surface, therefore minimizing the electrical resistance in the area of contact.

Figure 10.
Experimental setup established to measure heat losses from the absorber tube to the environment.
Since the above-mentioned test has been conducted at only three different tube wall temperatures (300, 400 and 550 °C), the availability of validation data is limited to these three temperature points for this receiver tube. In addition, a single experiment has been performed for each temperature point.
Several modifications were incorporated into the lumped-parameter model to reproduce the experimental conditions. In particular, the thermal driver of the solar heat flux was replaced with a constant temperature imposed on the internal surface of the absorber tube. Furthermore, absorptance and emissivity data of the selective coating utilized in the experiment (Figure 9) were implemented in the model. Since the test was performed in a closed environment, wind speed was set to zero (free convection), and the cold sink temperature used to compute the radiative heat loss was assumed to be equal to the ambient temperature (tube could not see the sky). Finally, ambient temperatures measured during the experiment were applied to the model.
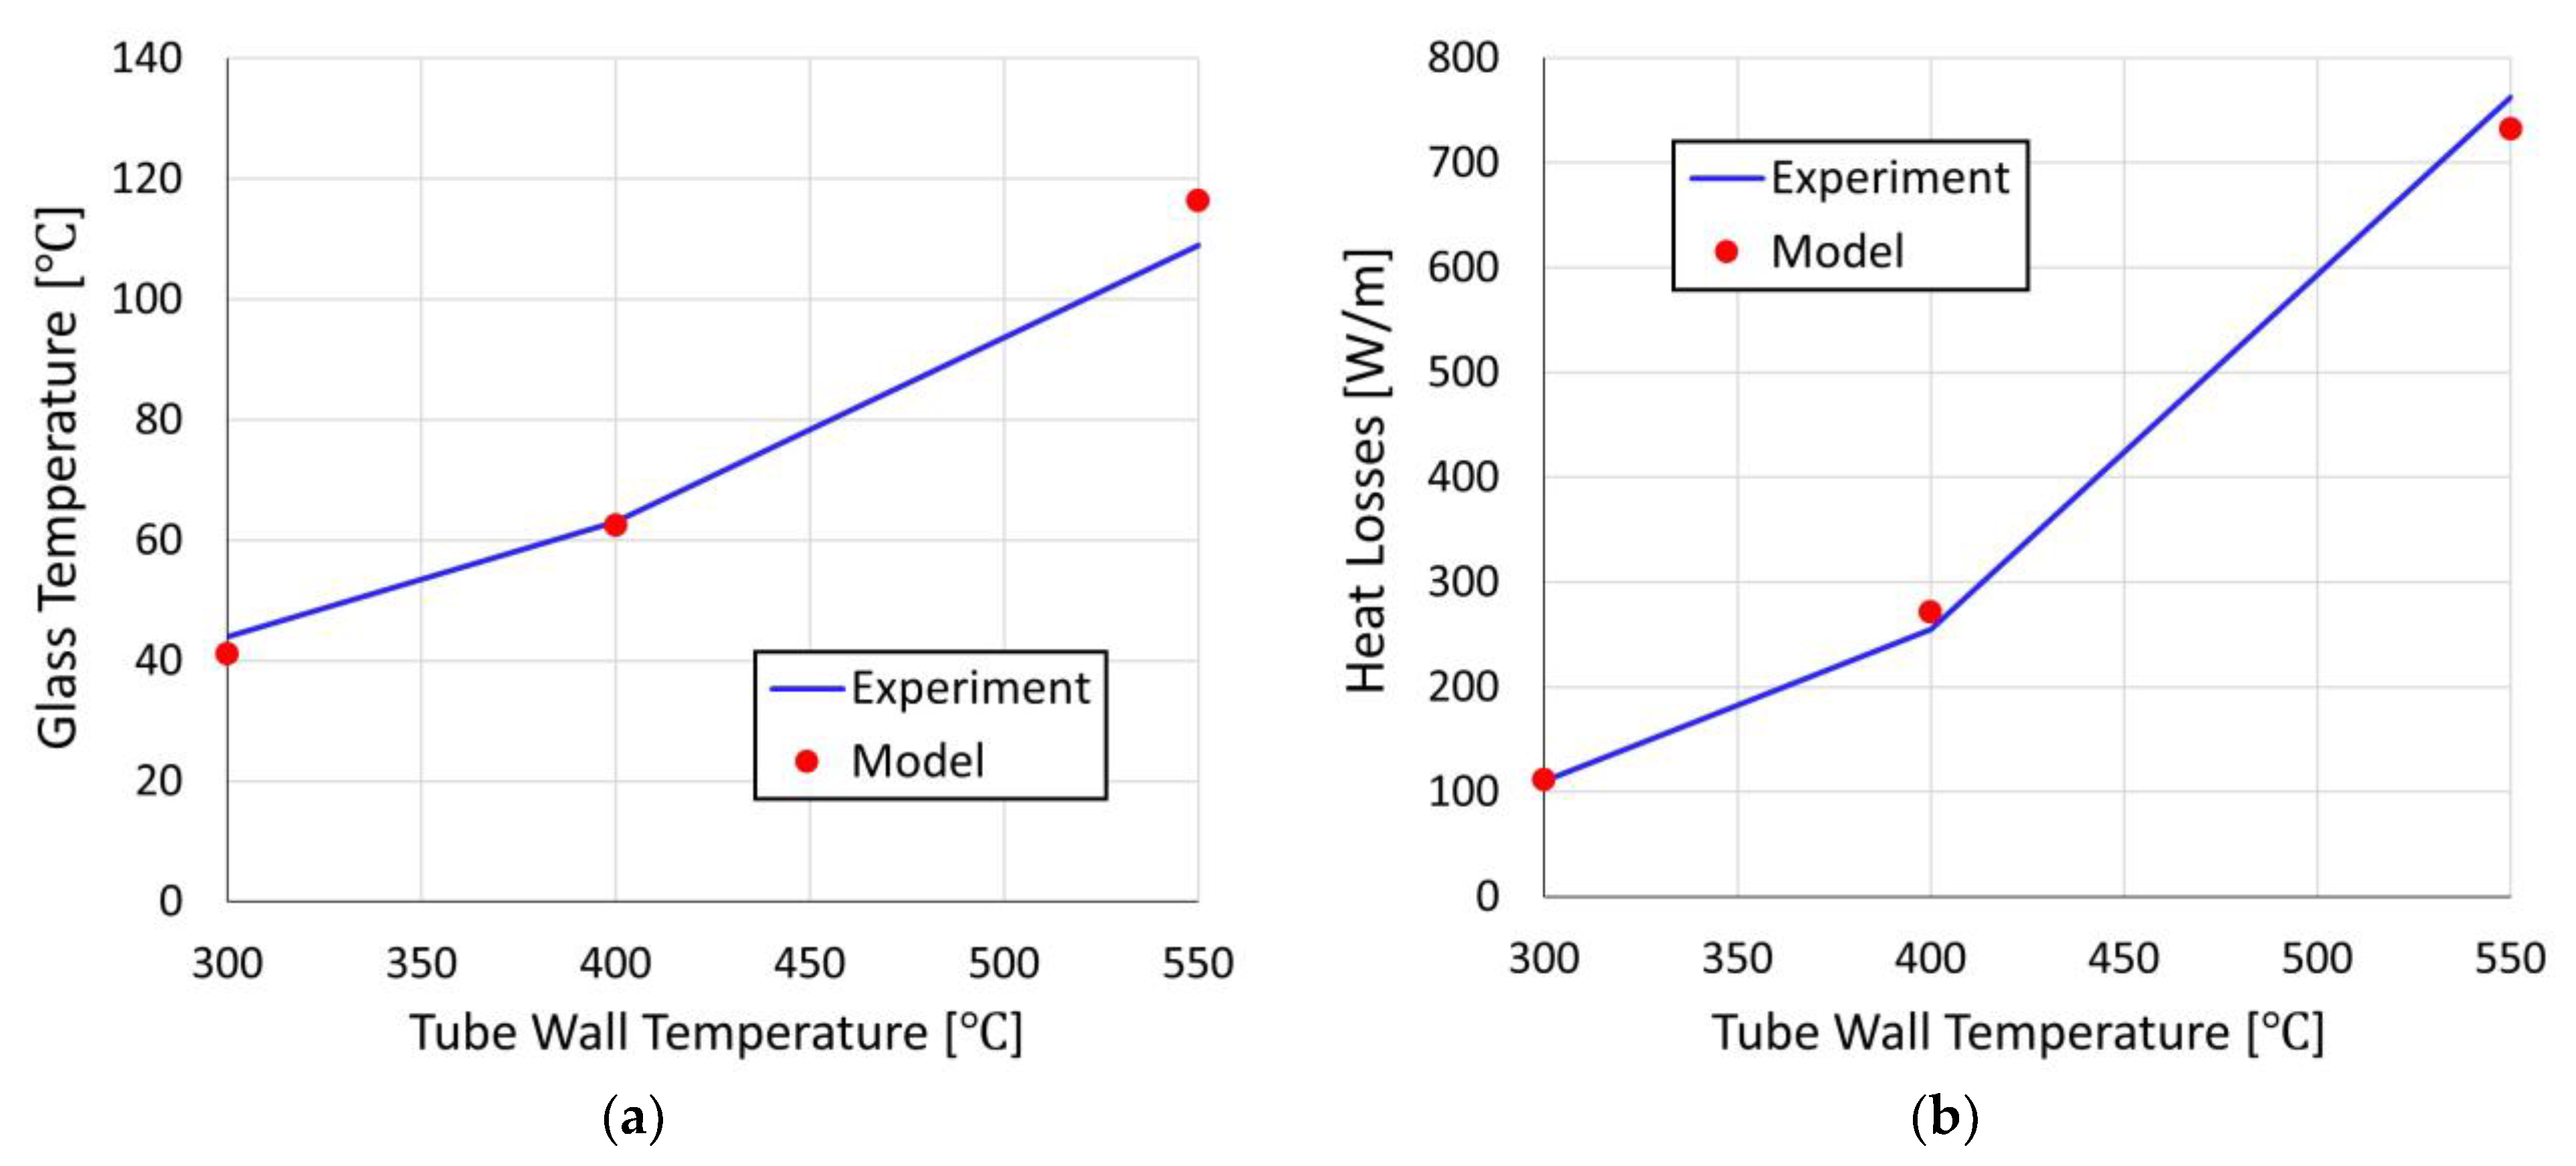
Figure 11 compares the results obtained in the present model with the experimental data. This comparison is provided in terms of glass temperature and heat losses from the absorber tube. As shown in Figure 11a, the model well reproduces glass temperatures obtained by the experiment, indicating a maximum deviation of approximately 6.7%. Furthermore, a comparison between heat losses computed by the lumped-parameter model and those observed during the experiment reveals a compelling agreement, as depicted in Figure 11b, indicating a maximum deviation of about 6.5%.
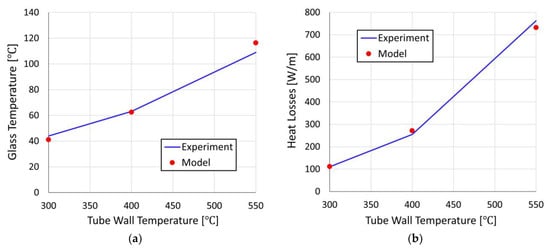
Figure 11.
Comparison between the present model and experimental data in terms of: (a) glass temperature and (b) heat losses.
3.2. Results of the Lumped-Parameter Model
Once the lumped-parameter model was validated, it was employed to obtain the required data for the 1D model and for the calculation of the photo-thermal efficiency, as discussed in Section 2.2.
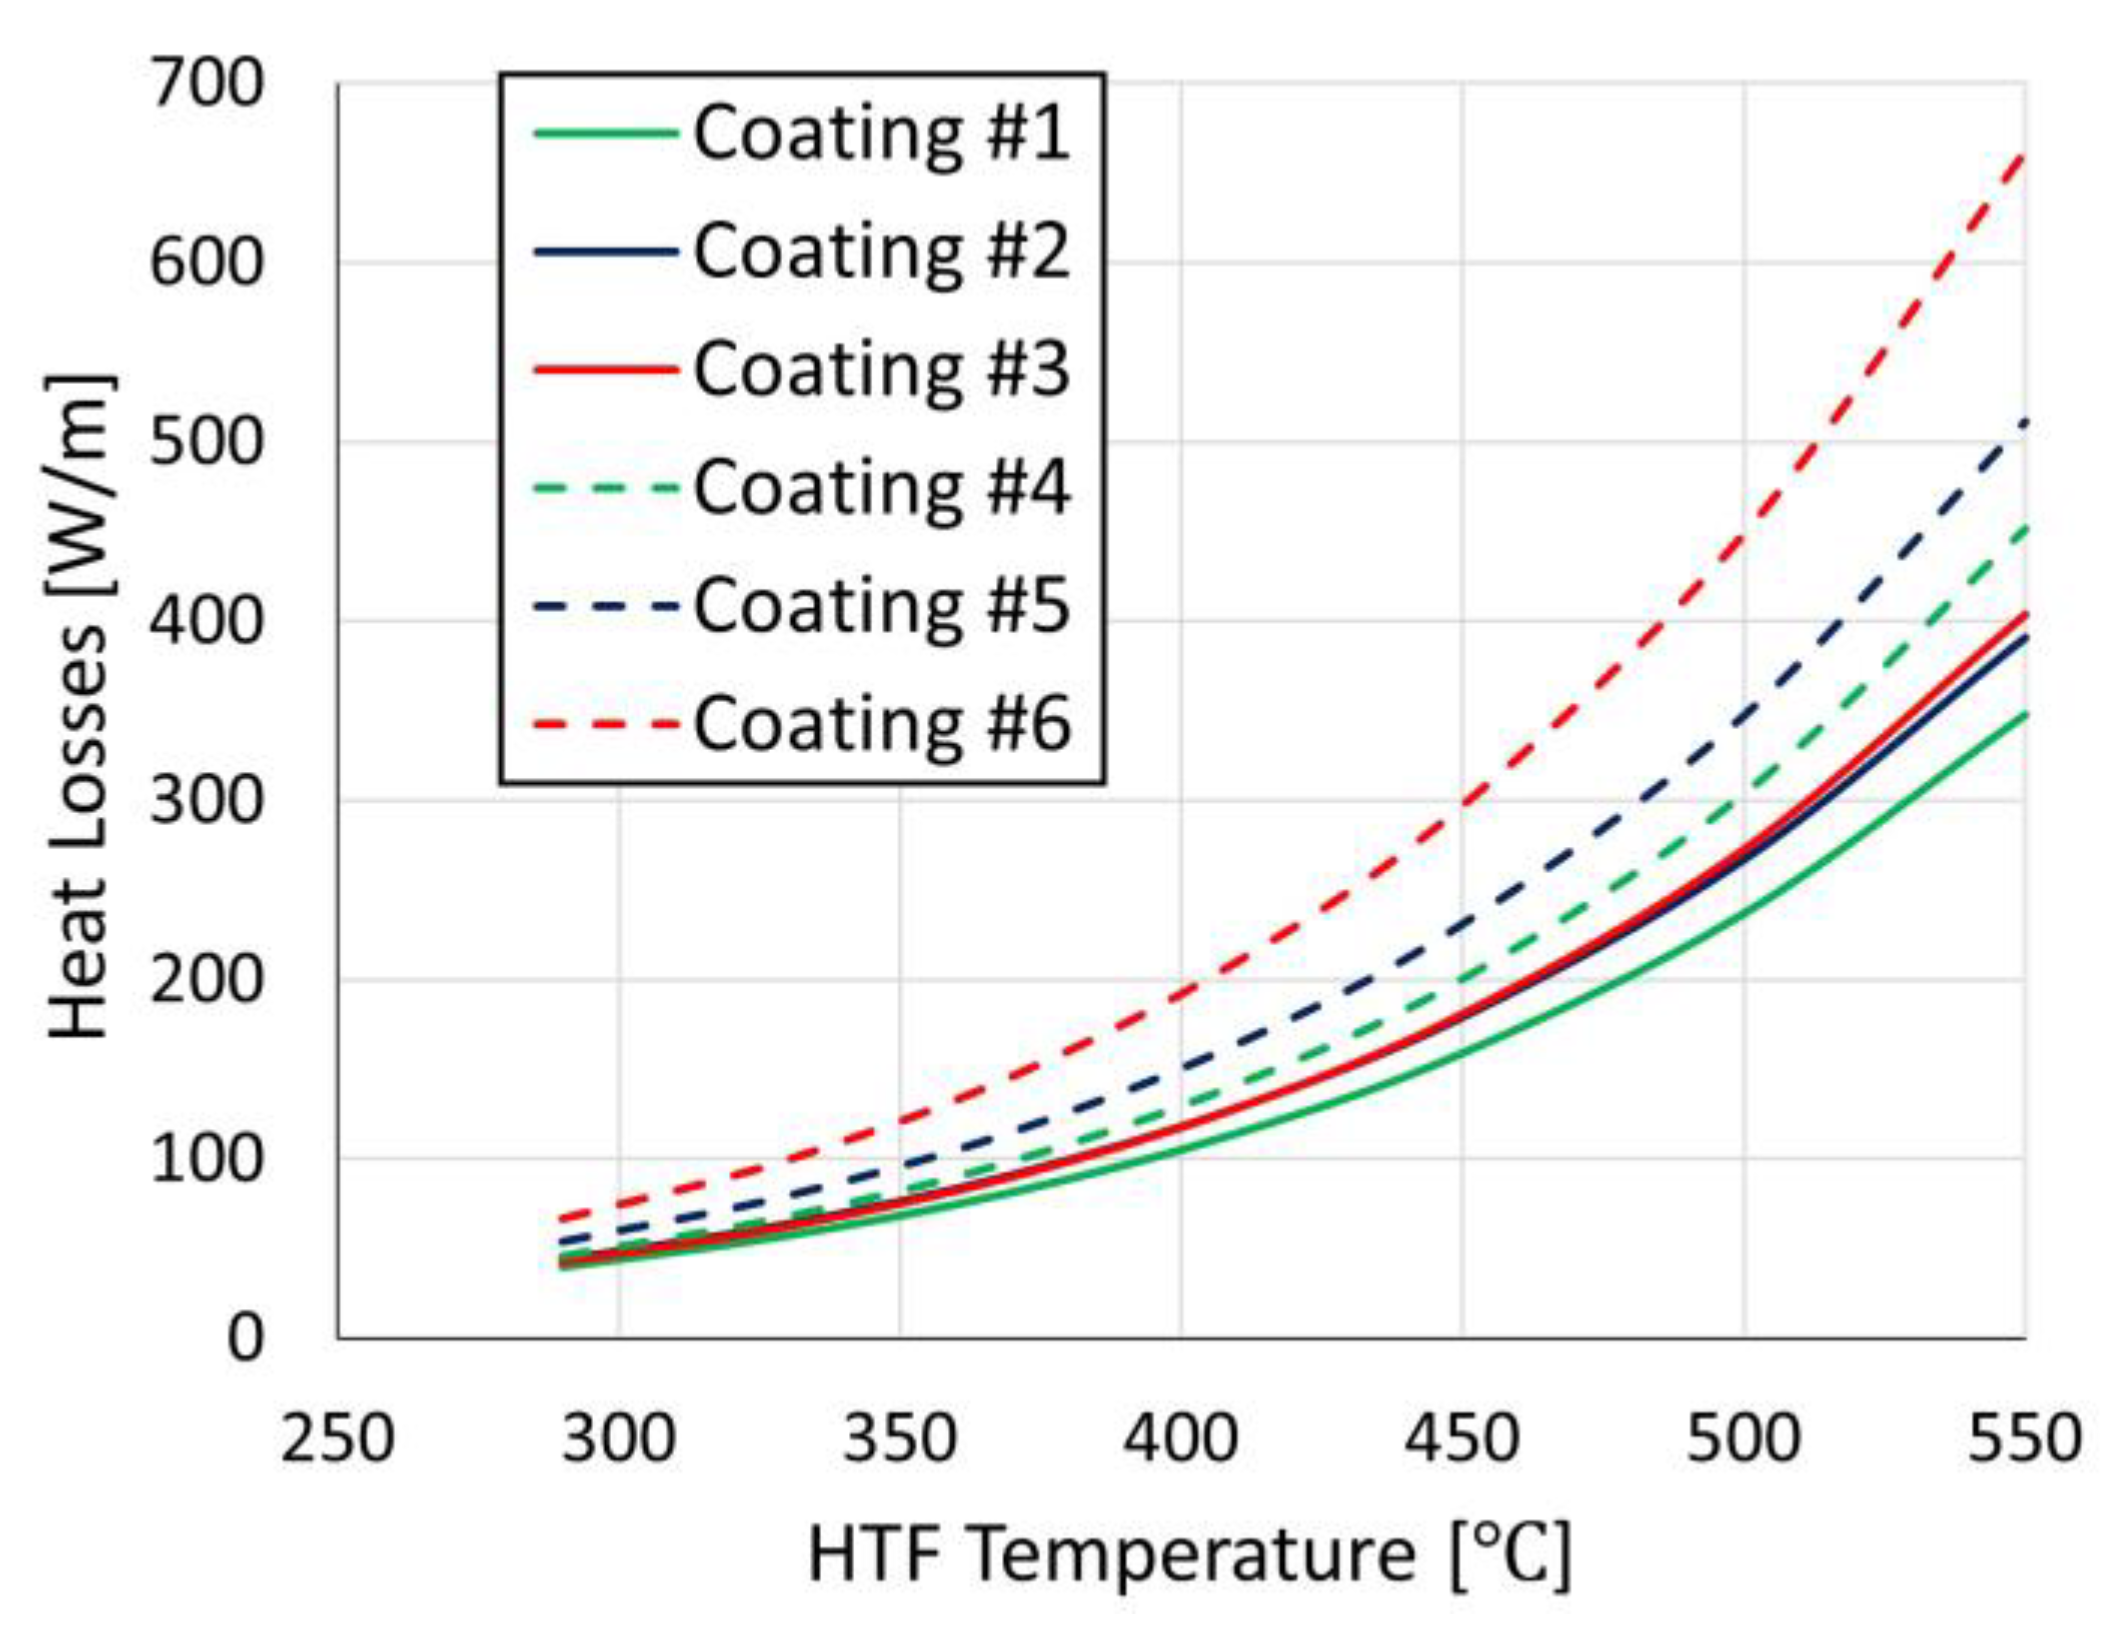
Firstly, the lumped-parameter model must provide correlations of heat losses based on the HTF temperature in order to be utilized by the 1D model. Figure 12 illustrates heat losses with respect to the HTF temperature, employing the six selective coatings considered in this study. Comparing various coatings reveals that coating #1 and coating #6 dissipate the lowest and the highest amount of heat from the absorber tube towards the environment, respectively, at the entire range of the HTF temperature. This result is in correspondence with the emissivity data shown in Figure 4, where coating #1 and coating #6 indicate the lowest and the highest emissivity at the entire range of the HTF temperature. The results shown in Figure 12 correspond to the mass flow rate of 2.2 kg/s; however, the HTF mass flow rate has a minor impact on heat losses. The differences in heat losses across various flow rates are always below 7% at various HTF temperatures.

Figure 12.
Heat losses with respect to the HTF temperature using six different coatings.
Based on the plots shown in Figure 12, correlations of heat losses can be derived with respect to the HTF temperature. These correlations can be written as follows ( in [°C]):
The values of coefficients , and along with their respective uncertainties are provided in Table 3. These correlations were employed by the 1D model to compute the HTF temperature profile along the receiver axis.
Table 3.
Coefficients of the correlations of heat losses obtained by the least squares method with their respective uncertainties.
In this study, the least squares (LS) method was employed for curve fitting. This approach could provide the best fit for the heat loss data with respect to the HTF temperature through minimizing the sum of the squares of residuals. The uncertainties provided in Table 3 were computed with regard to the standard errors of the coefficients achieved by the least squares fit. In addition, error propagations were calculated to assess the impact of these uncertainties in the predictions of heat losses. It was found that the propagated uncertainty in the heat losses always remains below 5.5% at various HTF temperatures for different selective coatings. Furthermore, calculating the coefficient of determination (R2) revealed the robustness of the curve-fitting approach, consistently remaining well above 0.99 for all cases.
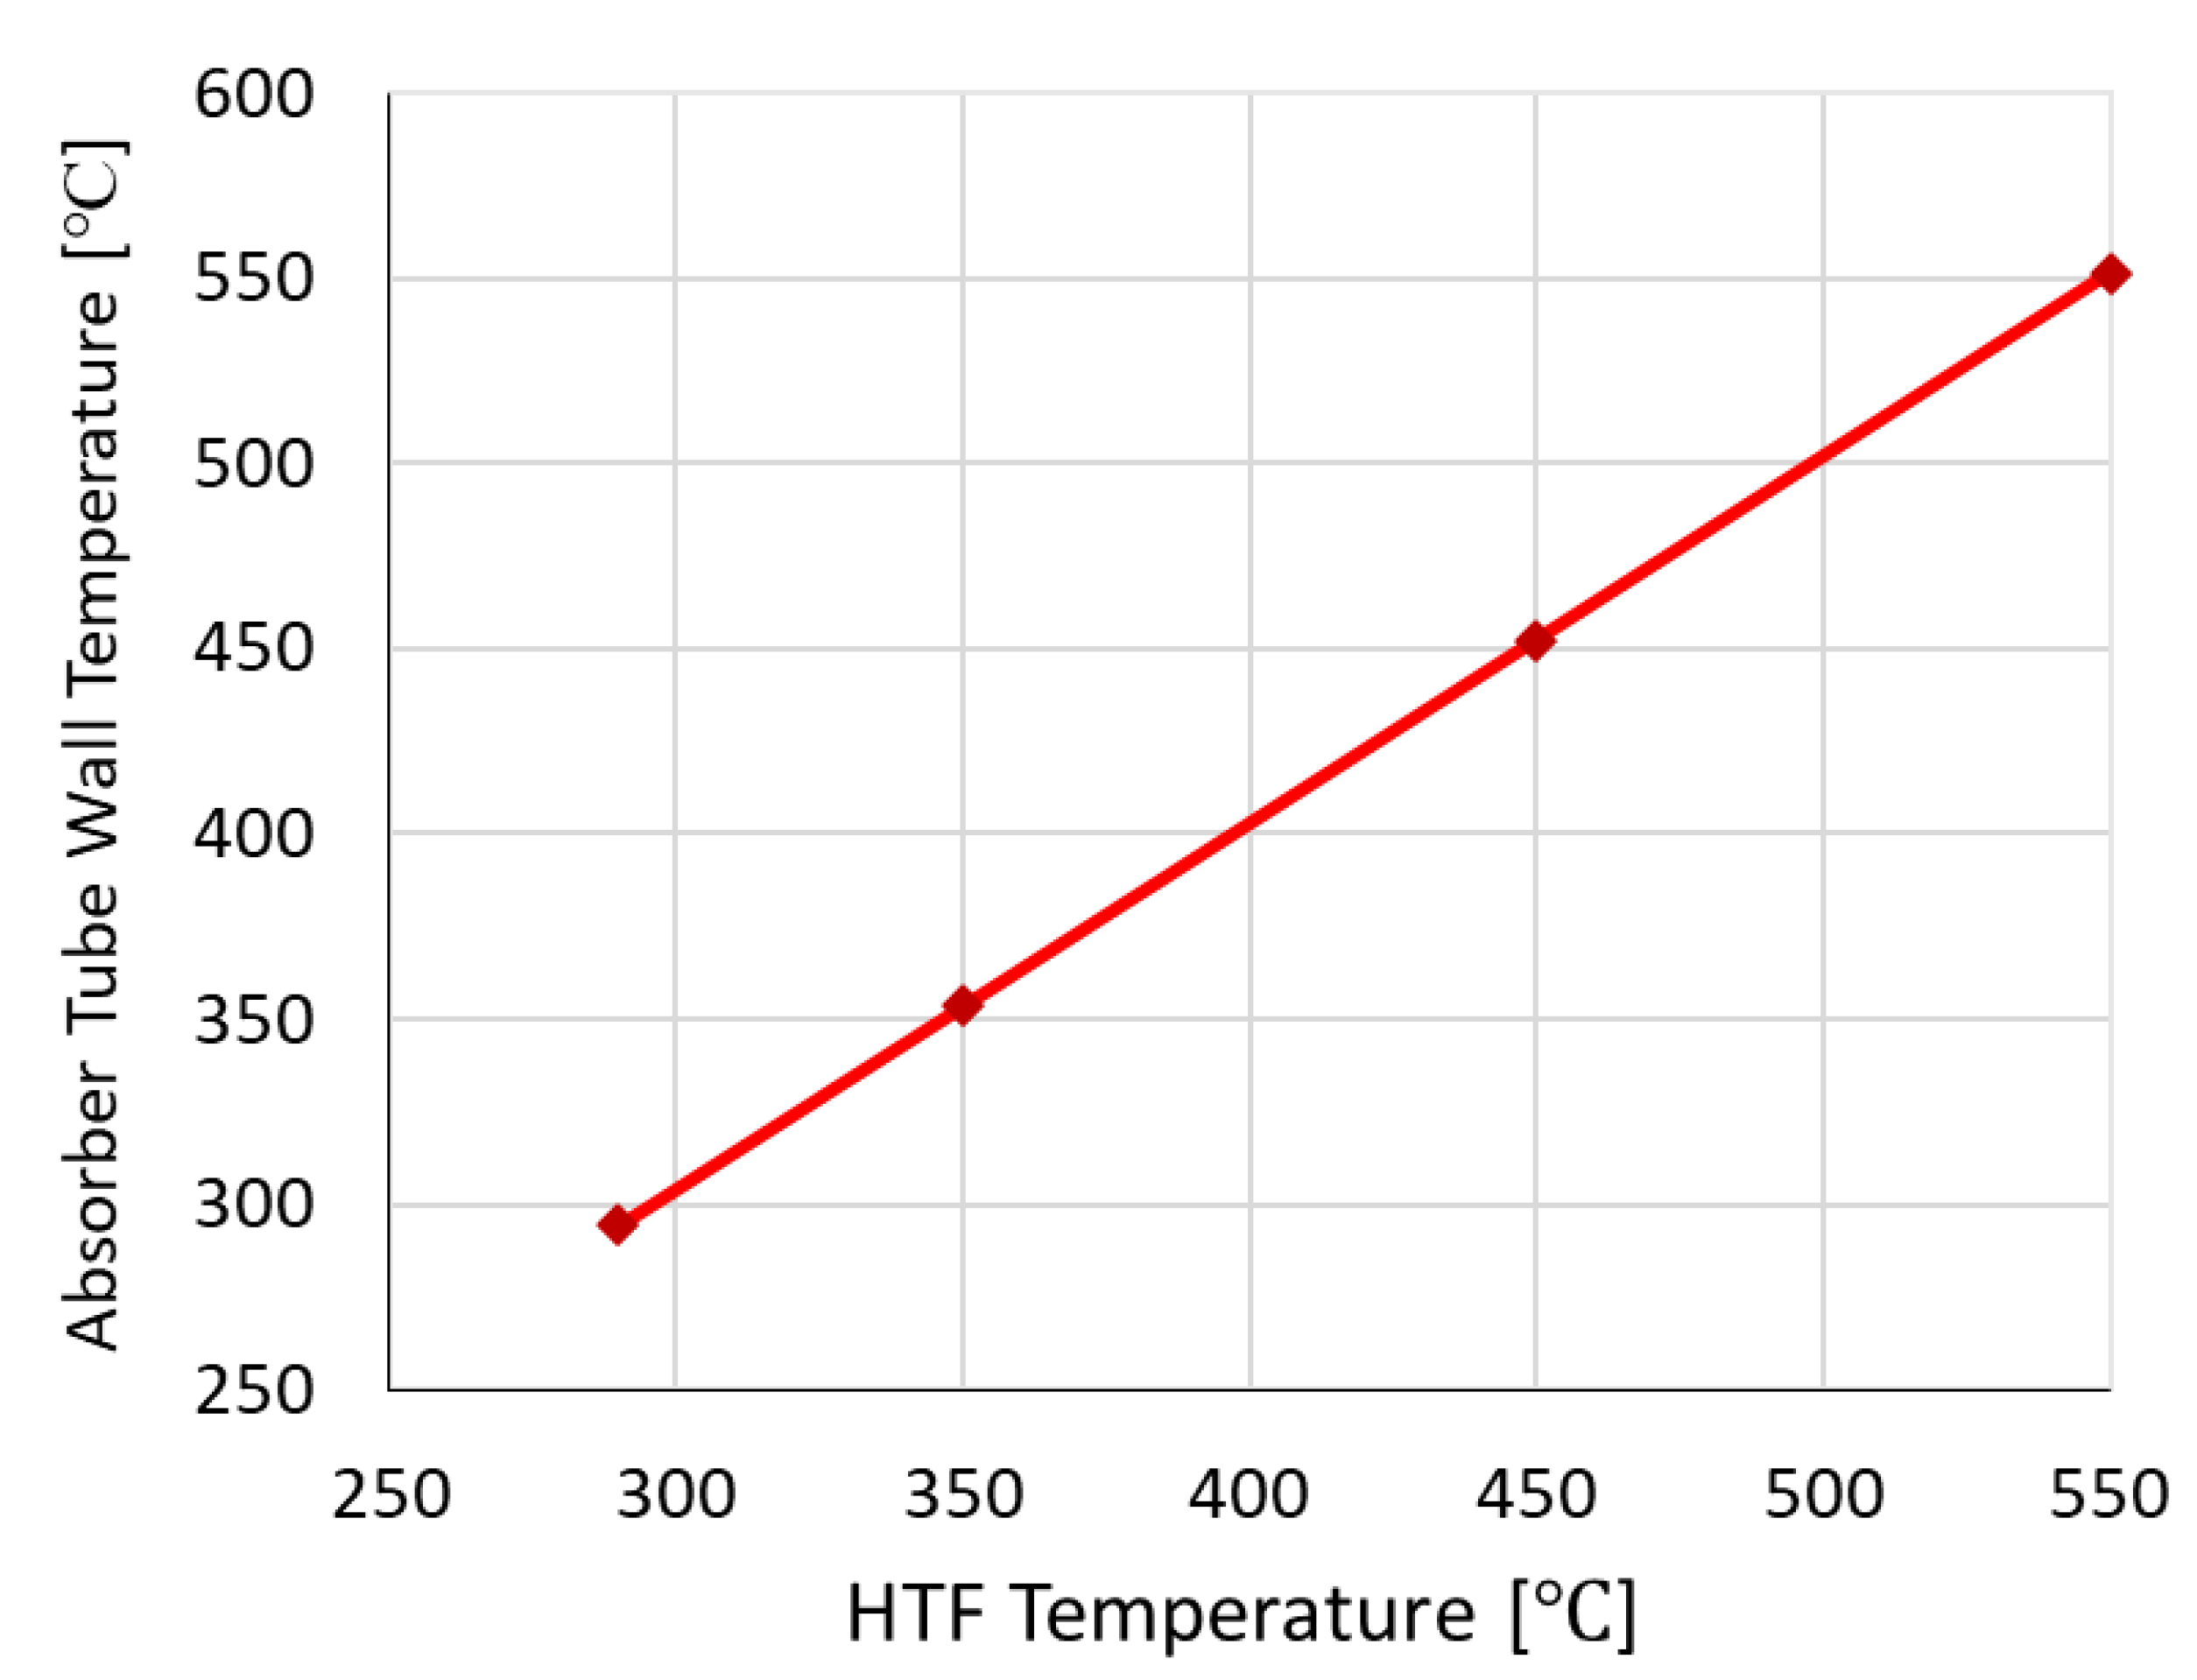
In addition, the lumped-parameter model calculates the temperature of the external surface of the absorber tube at different HTF temperatures, which is required for computing the photo-thermal efficiency. Figure 13 shows the temperature of the absorber tube wall surface with respect to the HTF temperature, ranging from 290 °C to 550 °C. The trend depicted in Figure 13 remains consistent for all scenarios, applying any selective coatings with various mass flow rates. The maximum difference across the cases consistently remains less than 4 °C with respect to the wall temperature at various HTF temperatures. This is due to the fact that the absorber tube temperature is mainly determined by the imposed HTF temperature since the heat transfer coefficient between the HTF and the tube is substantially greater than that between the tube and the gap region. This also results in relatively minor differences between the absorber tube wall temperature and the HTF temperature across the entire tube length, always remaining less than 7.3 °C.
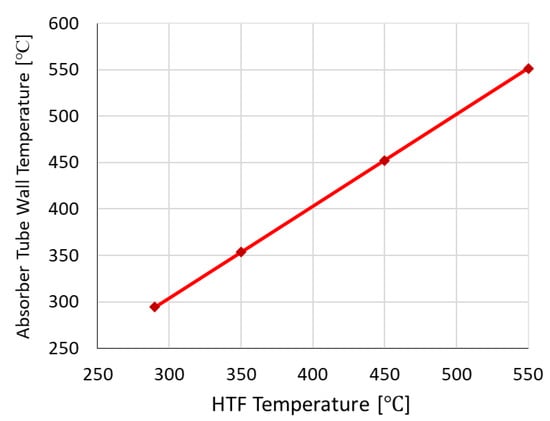
Figure 13.
Absorber tube wall temperature with respect to HTF temperature.
3.3. Photo-Thermal Optimization of the PTC System
The results obtained by the lumped-parameter and 1D models have been employed to determine an optimal configuration of the PTC system from a photo-thermal viewpoint. In this respect, the photo-thermal efficiency is defined as follows:
where and represent the absorptance and emissivity of the selective coating applied to the absorber tube; represents the Stefan–Boltzmann constant; is the absorber tube wall temperature, provided by the lumped-parameter model (Figure 13); and represents the solar irradiance, assumed to be equal to 900 W/m2 based on the reference ASTM G173-03 solar spectrum [35].
As can be seen in Figure 4, a coating with the lowest absorptance indicates the lowest emissivity. Conversely, a coating with the highest absorptance demonstrates the highest emissivity as well. However, the emissivity of the coatings depends on temperature, exhibiting substantial variations from the inlet section to the outlet section of the receiver tube (corresponding to HTF temperatures from 290 °C to 550 °C). Consequently, to attain the highest photo-thermal efficiency, an approach must be taken in which multiple selective coatings are positioned along the receiver tube based on their photo-thermal performance at different HTF temperature ranges.
In this regard, first, photo-thermal efficiencies were computed by using the lumped-parameter model at different HTF temperatures, employing the six selective coatings presented in Table 2 and Figure 4. Then, the selective coatings with the highest photo-thermal efficiency at specific ranges of the HTF temperature were determined. Subsequently, this result was integrated with the result of the 1D model provided in terms of the HTF temperature profile along the collector line. This integration provided the most photo-thermally efficient PTC configuration in line with the main goal of this study.
Figure 14 shows the photo-thermal efficiency with respect to the HTF temperature for the six selective coatings investigated in this study. The results presented in Figure 14 remain consistent among various mass flow rates of 1, 1.5, 2.2, 3 and 4 kg/s. This is due to the fact that, according to Equation (6), among the parameters that affect the photo-thermal efficiency, the only one influenced by the mass flow rate is the absorber tube wall temperature. However, this temperature is slightly affected by the mass flow rate as it is strictly connected to the HTF temperature (see Figure 13). Consequently, variations of the photo-thermal efficiency with respect to the HTF temperature would be equal for different mass flow rates. As observed in Figure 14, to achieve the maximum photo-thermal efficiency, two critical HTF temperatures of 436 °C and 517 °C can be identified. As a result, three temperature ranges are created, characterized by three different selective coatings:
- 290–436 °C → Coating #6
- 436–517 °C → Coating #4
- 517–550 °C → Coating #3
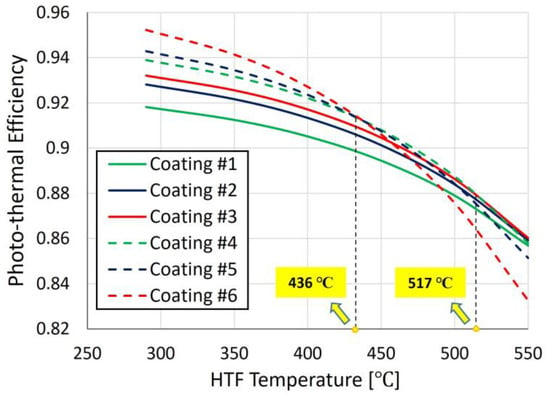
Figure 14.
Photo-thermal efficiency computed for the six selective coatings, highlighting critical temperatures for the purpose of photo-thermal optimization.
Figure 14.
Photo-thermal efficiency computed for the six selective coatings, highlighting critical temperatures for the purpose of photo-thermal optimization.

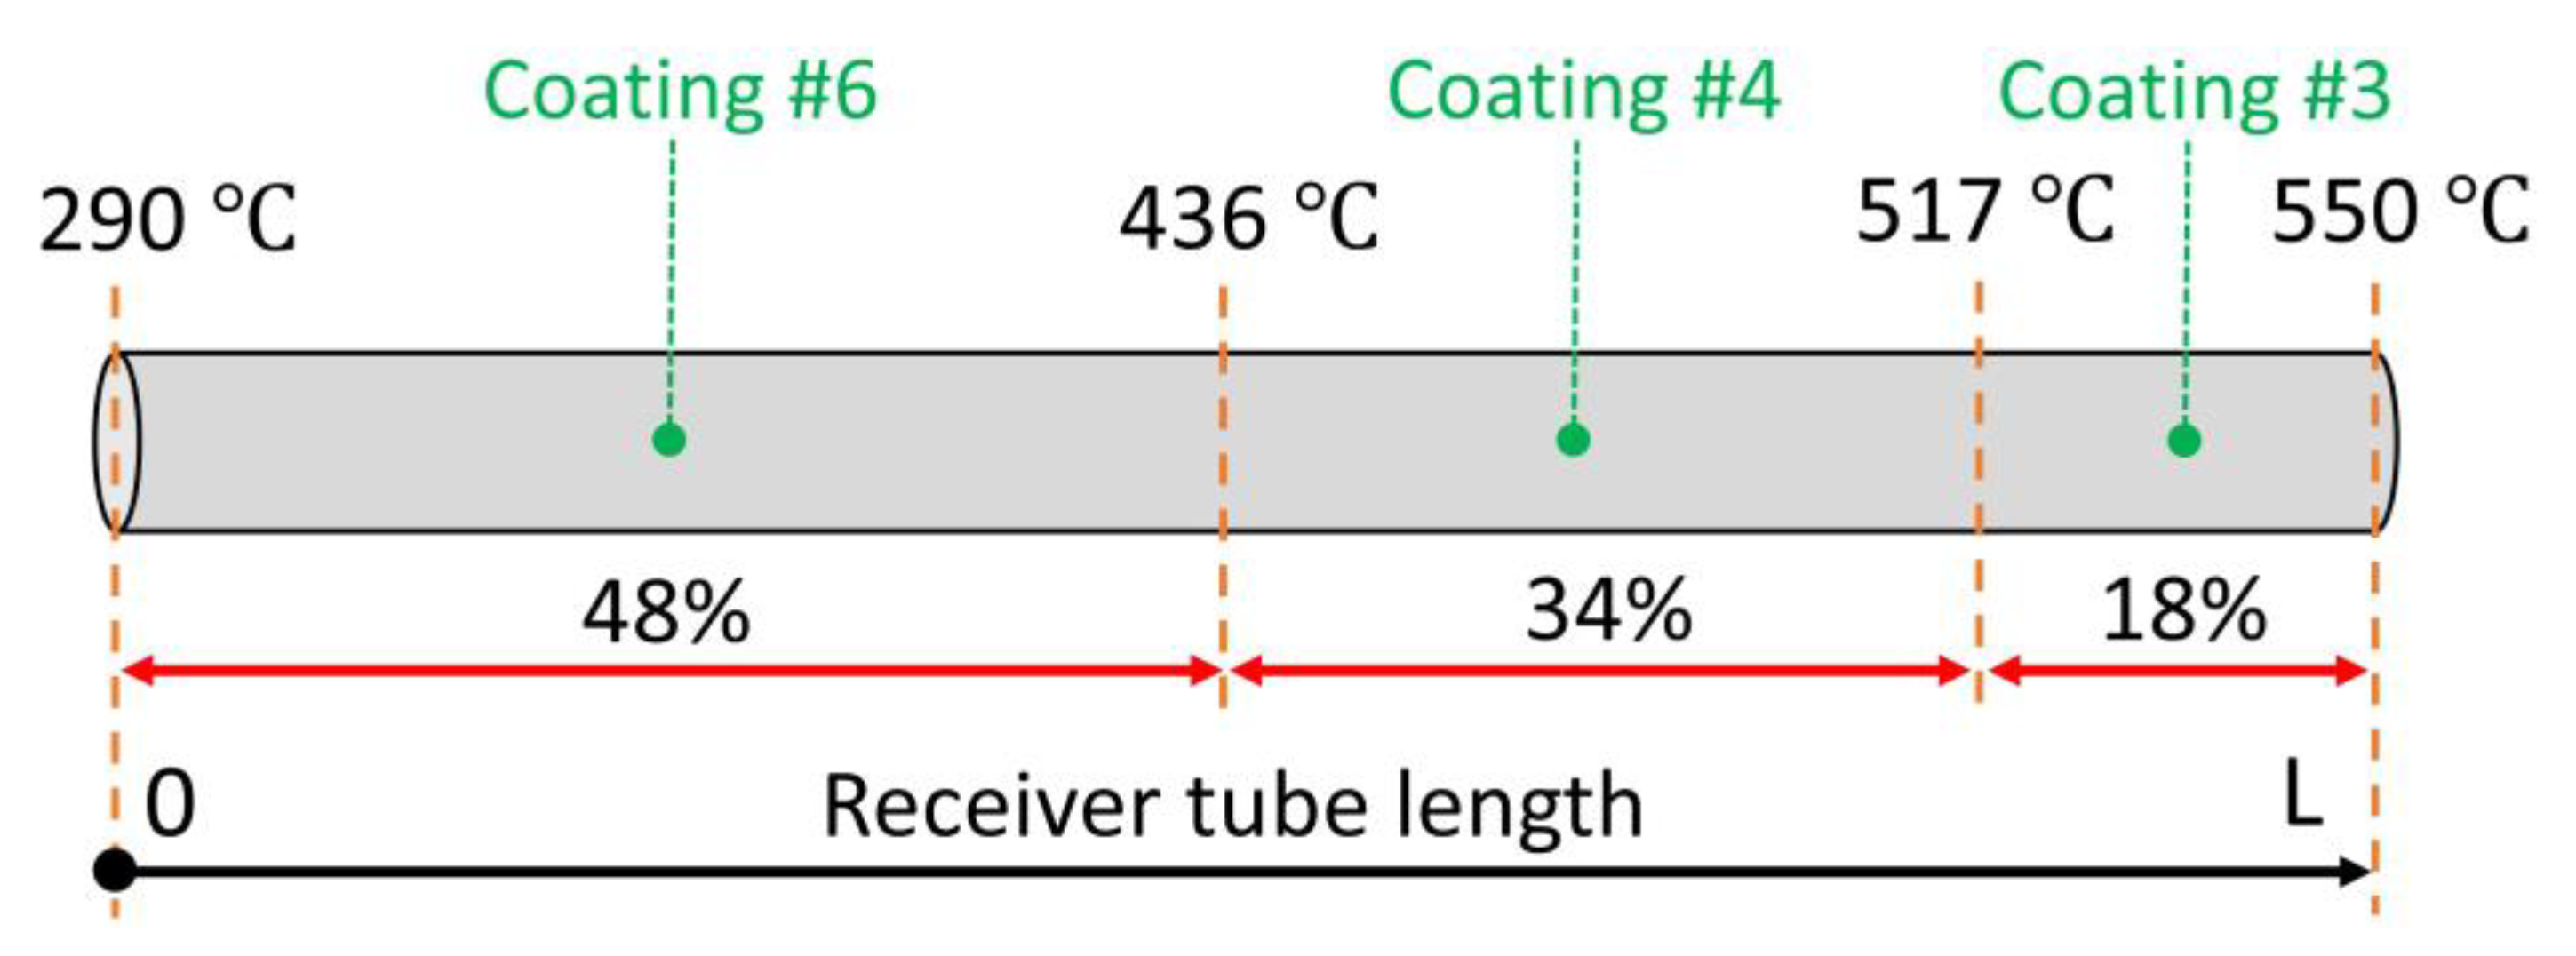
In the subsequent step, spatial positions of the three selective coatings mentioned above must be determined along the receiver tube. For this purpose, the tube lengths required for these three segments were computed by using the 1D model. Table 4 represents respective tube lengths for the three segments, characterized by three selective coatings at specific HTF temperature ranges, considering various mass flow rates. As expected, higher mass flow rates lead to longer receiver tubes. However, the proportion of each segment to the total receiver length remains almost constant at various operational conditions. This implies that the HTF temperature at any given point along the collector axis is a function of its relative position, i.e., the proportional distance from the receiver inlet section. In addition, Figure 15 displays a schematic of the most photo-thermally efficient PTC configuration, outlining the distribution of the three selective coatings along the collector line. This configuration remains consistent across different mass flow rates, as explained above. The overall photo-thermal efficiency of the optimized receiver tube was found to be 91.6%, indicating an improvement ranging from 0.5% to 1.9% compared to the six single-coated collectors. The optimized configuration could also provide economic benefits since a selective coating that exhibits the best performance at high temperatures, which is typically more expensive, is only implemented in the final segment of the collector. In addition, for a given incident flux, mass flow rate and inlet/outlet temperature, the length of the solar collector in a non-optimized configuration will be higher, implying additional costs.
Table 4.
Results of photo-thermal optimization: temperature ranges characterized by corresponding selective coatings and respective tube lengths for various mass flow rates.
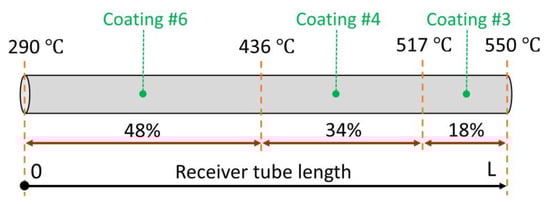
Figure 15.
Distribution of selective coatings along the receiver tube for the most photo-thermally efficient configuration.
To investigate the wind effect on the solution, the numerical procedure described in this section was repeated for wind speeds of 0 and 15 m/s to include the most extensive range of wind speed, conducting a comparative photo-thermal performance assessment between free convection and forced convection with intense wind conditions. The difference between the two scenarios was found to be less than 1% in terms of the receiver tube total length. This is due to the thermal insulation caused by the vacuum in the gap region of the receiver tube. In addition, investigating ambient temperatures of 10 and 40 °C revealed that the impact of the ambient temperature on the receiver thermal performance is negligible. Consequently, the distribution of selective coatings along the receiver tube depicted in Figure 15 is applicable to a range of wind speeds from 0 to 15 m/s and a range of ambient temperatures from 10 to 40 °C.
The photo-thermal optimization strategy proposed in this work could provide valuable insights into the commercial development of more efficient, economically feasible PTC receiver tubes. The configuration shown in Figure 15 might be deployed in future large-scale CSP applications as a photo-thermally enhanced design of the PTC system. According to the relatively wide range of environmental and operational conditions investigated in this study, the proposed configuration could be applicable to various scenarios. Furthermore, by employing the results provided in this study for different mass flow rates, the collector length can be determined based on the expected flow rate within the plant.
4. Conclusions
The present paper aims at optimizing a PTC system from a photo-thermal viewpoint. For this purpose, a specific strategy was adopted, according to which multiple spectrally selective coatings are arrayed along the receiver tube based on their photo-thermal performance at various HTF temperatures (ranging from 290 °C to 550 °C). Six different selective coatings were considered in the optimization study, investigating various ranges of mass flow rate, wind speed and ambient temperature.
A lumped-parameter model was developed in the radial direction of the receiver tube using the Modelica language to obtain the absorber tube wall temperature and heat losses with respect to the HTF temperature. This model was validated against experimental data. The results from the lumped-parameter model allowed for the development of heat loss correlations as a function of the HTF temperature. These correlations were implemented in a steady-state 1D model along the axial direction to obtain the HTF temperature profile along the receiver axis. Furthermore, the absorber tube temperature computed by the lumped-parameter model was employed to calculate photo-thermal efficiencies at various HTF temperatures, considering different selective coatings. According to the results regarding photo-thermal efficiencies, the most effective coatings with respect to the HTF temperature were introduced. The latter finding was then integrated with the results of the 1D model in terms of the HTF temperature profile along the receiver axis. This integration provided the spatial distribution of the chosen selective coatings along the receiver, introducing the most photo-thermally efficient configuration of the PTC system.
According to the computed results, the most efficient configuration consists of three different selective coatings, corresponding to three HTF temperature ranges. The total length of the receiver tube was computed to be 1651 m for the reference operational conditions. A parametric study revealed that the optimized configuration can be applicable to a range of mass flow rates from 1 to 4 kg/s, a range of wind speeds from 0 to 15 m/s and a range of ambient temperatures from 10 to 40 °C. The optimized configuration could provide two main advantages: an increase in the overall photo-thermal efficiency ranging from 0.5% to 1.9% compared to the six single-coated collectors, and economic benefits due to the employment of more expensive coating only at the final receiver segment. Consequently, considering any given solar flux, mass flow rate and HTF temperature range, a shorter PTC receiver tube would be required for an optimized configuration, incurring lower costs. However, this approach may encounter specific challenges and limitations in practical applications. In particular, attaining the most optimized photo-thermal performance requires continuous monitoring of the plant during the operation to ensure that all designated collector segments operate within the expected temperature ranges. Furthermore, various selective coatings implemented along the collector line may need different maintenance strategies.
In perspective, the performance enhancement approach proposed in this work could be further explored by a techno-economic analysis of the PTC system aimed at investigating the economic benefits of the photo-thermal optimization.
Author Contributions
Conceptualization, M.L.; methodology, M.S. and M.C.; software, M.S., M.C. and A.D.; validation, M.S., M.C. and R.G.; formal analysis, M.S. and M.C.; investigation, M.S. and M.C.; resources, R.G., A.D. and M.L.; data curation, M.S., R.G. and A.D.; writing—original draft preparation, M.S.; writing—review and editing, M.C., R.G., A.D., M.L. and R.Z.; visualization, M.S.; supervision, M.L. and R.Z.; project administration, M.L. and R.Z.; funding acquisition, M.L. and R.Z. All authors have read and agreed to the published version of the manuscript.
Funding
This research was funded by the Italian Ministry of Environment and Energy Security through the «National Electric System Research» Programme, Project 1.9 “CSP/CST technology” 2022–2024 implementation plan.
Data Availability Statement
The original contributions presented in the study are included in the article. Further inquiries can be directed to the corresponding author
Conflicts of Interest
The authors declare no conflicts of interest.
References
- Saini, P.; Singh, S.; Kajal, P.; Dhar, A.; Khot, N.; Mohamed, M.E.; Powar, S. A Review of the Techno-Economic Potential and Environmental Impact Analysis through Life Cycle Assessment of Parabolic Trough Collector towards the Contribution of Sustainable Energy. Heliyon 2023, 9, e17626. [Google Scholar] [CrossRef]
- Shagdar, E.; Lougou, B.G.; Shuai, Y.; Anees, J.; Damdinsuren, C.; Tan, H. Performance Analysis and Techno-Economic Evaluation of 300 MW Solar-Assisted Power Generation System in the Whole Operation Conditions. Appl. Energy 2020, 264, 114744. [Google Scholar] [CrossRef]
- Zhao, B.; Cheng, M.; Liu, C.; Dai, Z. Cyclic Thermal Characterization of a Molten-Salt Packed-Bed Thermal Energy Storage for Concentrating Solar Power. Appl. Energy 2017, 195, 761–773. [Google Scholar] [CrossRef]
- Wang, Q.; Yao, Y.; Shen, Y.; Shen, Z.; Yang, H. A Mutually Beneficial System Incorporating Parabolic Trough Concentrating Solar Power System with Photovoltaics: A Comprehensive Techno-Economic Analysis. Appl. Energy 2024, 360, 122834. [Google Scholar] [CrossRef]
- Guillén-Lambea, S.; Carvalho, M. A Critical Review of the Greenhouse Gas Emissions Associated with Parabolic Trough Concentrating Solar Power Plants. J. Clean. Prod. 2021, 289, 125774. [Google Scholar] [CrossRef]
- Al-Maliki WA, K.; Hadi, A.S.; Al-Khafaji HM, H.; Alobaid, F.; Epple, B. Novel Feedwater Preheating System for Parabolic Trough Solar Power Plant. Energy Rep. 2022, 8, 10665–10687. [Google Scholar] [CrossRef]
- Li, C.; Goswami, Y.; Stefanakos, E. Solar Assisted Sea Water Desalination: A Review. Renew. Sustain. Energy Rev. 2013, 19, 136–163. [Google Scholar] [CrossRef]
- Mohammadi, K.; Khanmohammadi, S.; Immonen, J.; Powell, K. Techno-Economic Analysis and Environmental Benefits of Solar Industrial Process Heating Based on Parabolic Trough Collectors. Sustain. Energy Technol. Assess. 2021, 47, 101412. [Google Scholar] [CrossRef]
- Xia, J.; Li, Y.; Li, C.; Wang, Y.; Xie, L.; Miao, Y.; Zhang, Q.; Hao, C.; Sun, G. Performance Evaluation of Different Solar Collectors in Building Cooling, Heating, and Hot Water Supply. J. Renew. Sustain. Energy 2020, 12, 043701. [Google Scholar] [CrossRef]
- Hamada, M.A.; Ehab, A.; Khalil, H.; Al-Sood MM, A.; Sharshir, S.W. Thermal Performance Augmentation of Parabolic Trough Solar Collector Using Nanomaterials, Fins and Thermal Storage Material. J. Energy Storage 2023, 67, 107591. [Google Scholar] [CrossRef]
- Manikandan, G.K.; Iniyan, S.; Goic, R. Enhancing the Optical and Thermal Efficiency of a Parabolic Trough Collector—A Review. Appl. Energy 2019, 235, 1524–1540. [Google Scholar] [CrossRef]
- Olson, K.D.; Talghader, J.J. Solar Selective Coating Optimization for Direct Steam Generation Parabolic Trough Designs. Sol. Energy 2016, 124, 82–88. [Google Scholar] [CrossRef]
- Esposito, S.; D’Angelo, A.; Antonaia, A.; Castaldo, A.; Ferrara, M.; Addonizio, M.L.; Guglielmo, A. Optimization Procedure and Fabrication of Highly Efficient and Thermally Stable Solar Coating for Receiver Operating at High Temperature. Sol. Energy Mater. Sol. Cells 2016, 157, 429–437. [Google Scholar] [CrossRef]
- Esposito, S.; D’Angelo, A.; Diletto, C.; Guglielmo, A.; Lanchi, M.; Rossi, G. Solar Coatings Based on Ag Infrared Reflector with High Stability at Medium and High Temperature. Energies 2021, 14, 5910. [Google Scholar] [CrossRef]
- Diletto, C.; D’Angelo, A.; Esposito, S.; Guglielmo, A.; Mirabile Gattia, D.; Lanchi, M. Materials Based on Amorphous Al2O3 and Composite W-Al2O3 for Solar Coatings Deposited by High-Rate Sputter Processes. Solar 2023, 3, 113–131. [Google Scholar] [CrossRef]
- D’Angelo, A.; Diletto, C.; Esposito, S.; Graditi, G.; Guglielmo, A.; Lanchi, M.; Rossi, G. Spectrally Selective Solar Coating Based on W-AlN Cermet Fabricated by Reactive Sputtering Processes at High Deposition Rate. AIP Conf. Proc. 2022, 2445, 020002. [Google Scholar]
- Yang, H.; Wang, Q.; Huang, Y.; Feng, J.; Ao, X.; Hu, M.; Pei, G. Spectral Optimization of Solar Selective Absorbing Coating for Parabolic Trough Receiver. Energy 2019, 183, 639–650. [Google Scholar] [CrossRef]
- Nagaraj, A. Experimental Study of Epoxy Based Graphite Coating on Parabolic Trough Solar Collector. J. Phys. Conf. Ser. 2022, 2180, 012001. [Google Scholar] [CrossRef]
- Al-Rabeeah, A.Y.; Seres, I.; Farkas, I. Experimental Investigation of Parabolic Trough Solar Collector Thermal Efficiency Enhanced with Different Absorber Coatings. Int. J. Thermofluids 2023, 19, 100386. [Google Scholar] [CrossRef]
- Yang, H.; Wang, Q.; Huang, X.; Li, J.; Pei, G. Performance Study and Comparative Analysis of Traditional and Double-Selective-Coated Parabolic Trough Receivers. Energy 2018, 145, 206–216. [Google Scholar] [CrossRef]
- Yang, H.; Wang, Q.; Zhong, S.; Kwan, T.H.; Feng, J.; Cao, J.; Pei, G. Spectral-Spatial Design and Coupling Analysis of the Parabolic Trough Receiver. Appl. Energy 2020, 264, 114692. [Google Scholar] [CrossRef]
- Zhao, K.; Jin, H.; Gai, Z.; Hong, H. A Thermal Efficiency-Enhancing Strategy of Parabolic Trough Collector Systems by Cascadingly Applying Multiple Solar Selective-Absorbing Coatings. Appl. Energy 2022, 309, 118508. [Google Scholar] [CrossRef]
- Singh, S.K.; Tiwari, A.K.; Paliwal, H.K. Performance Augmentation Strategy of Parabolic Trough Collector by Employing MXene-Based Solar Absorbing Coating. Process Saf. Environ. Prot. 2023, 174, 971–982. [Google Scholar] [CrossRef]
- Stanek, B.; Wang, W.; Bartela, Ł. A Potential Solution in Reducing the Parabolic Trough Based Solar Industrial Process Heat System Cost by Partially Replacing Absorbers Coatings with Non-Selective Ones in Initial Loop Sections. Appl. Energy 2023, 331, 120472. [Google Scholar] [CrossRef]
- Ferri, R.; Cammi, A.; Mazzei, D. Molten Salt Mixture Properties in RELAP5 Code for Thermodynamic Solar Applications. Int. J. Therm. Sci. 2008, 47, 1676–1687. [Google Scholar] [CrossRef]
- Esposito, S.; Antonaia, A.; Addonizio, M.L.; Aprea, S. Fabrication and Optimisation of Highly Efficient Cermet-Based Spectrally Selective Coatings for High Operating Temperature. Thin Solid Film 2009, 517, 6000–6006. [Google Scholar] [CrossRef]
- Antonaia, A.; Esposito, S.; Addonizio, M.L.; Guglielmo, A. Solar Selective Adsorber Based on Double Nitride Composite Materials and Process for Its. Preparation. Patent IPN WO/2012/172505, 20 December 2012. [Google Scholar]
- Cagnoli, M.; Mazzei, D.; Procopio, M.; Russo, V.; Savoldi, L.; Zanino, R. Analysis of the Performance of Linear Fresnel Collectors: Encapsulated vs. Evacuated Tubes. Sol. Energy 2018, 164, 119–138. [Google Scholar] [CrossRef]
- Forristall, R. Heat Transfer Analysis and Modeling of a Parabolic Trough Solar Receiver Implemented in Engineering Equation Solver; Technical Report; National Renewable Energy Lab. (NREL): Golden, CO, USA, 2003; NREL/TP-550-34169. [Google Scholar]
- Rodriguez-Sanchez, M.R.; Soria, A.; Almendros-Ibáñez, J.A.; Acosta-Iborra, A.; Santana, D. Thermal Design Guidelines of Solar Power Towers. Appl. Therm. Eng. 2014, 63, 428–438. [Google Scholar] [CrossRef]
- Österholm, R.; Pålsson, J. Dynamic Modelling of a Parabolic Trough Solar Power Plant. In Proceedings of the 10th International Modelica Conference, Lund, Sweden, 10–12 March 2014. [Google Scholar]
- Soltigua. 1MWe CSP-ORC Pilot Plant, Solar Field Process Description; Report No.: S-F14ET001-M-B-A-2602-C; Soltigua SRL: Gambettola, Italy, 2015. [Google Scholar]
- Les, I.; Mutuberria, A.; Schöttl, P.; Nitz, P. New Functionalities for the Tonatiuh Ray-Tracing Software. In Proceedings of the 23rd SolarPACES Conference, Santiago, Chile, 26–29 September 2017. [Google Scholar]
- Qiu, Y.; He, Y.-L.; Cheng, Z.-D.; Wang, K. Study on Optical and Thermal Performance of a Linear Fresnel Solar Reflector Using Molten Salt as HTF with MCRT and FVM Methods. Appl. Energy 2015, 146, 162–173. [Google Scholar] [CrossRef]
- ASTM International. Standard G173-03: Standard Tables for Reference Solar Spectral Irradiances: Direct Normal and Hemispherical on 37° Tilted Surface. Derived from SMARTS v. 2.9.2. 2003. Available online: https://www.astm.org/standards/g173.htm (accessed on 15 May 2021).
Disclaimer/Publisher’s Note: The statements, opinions and data contained in all publications are solely those of the individual author(s) and contributor(s) and not of MDPI and/or the editor(s). MDPI and/or the editor(s) disclaim responsibility for any injury to people or property resulting from any ideas, methods, instructions or products referred to in the content. |
© 2024 by the authors. Licensee MDPI, Basel, Switzerland. This article is an open access article distributed under the terms and conditions of the Creative Commons Attribution (CC BY) license (https://creativecommons.org/licenses/by/4.0/).