Article

Thermodynamic Analysis of Chloride Corrosion in Steel for Energy System Applications in Fe-O-Cl-Na Environments

by
Robert Kaczmarczyk
* and
Sebastian Gurgul
Faculty of Energy and Fuels, Department of Fundamental Research in Energy Engineering, AGH University of Krakow, Al. Mickiewicza 30, 30-059 Krakow, Poland
*
Author to whom correspondence should be addressed.
Energies 2024, 17(13), 3223; https://doi.org/10.3390/en17133223
Submission received: 25 May 2024 / Revised: 23 June 2024 / Accepted: 28 June 2024 / Published: 30 June 2024
(This article belongs to the Section B: Energy and Environment)

Abstract

:
The assumptions of contemporary energy policies are increasing the share of renewable energy sources. Biomass combustion is developing as an alternative to fossil fuels. However, it faces challenges such as limited corrosion resistance of steel boiler components due to chloride compounds in flue gases and fly ash. This paper provides a comprehensive thermodynamic analysis of chloride-induced corrosion in steel in the Fe-O-Cl-Na environment, focusing on the influence of steam concentration in the gas phase. The study was performed by using the general thermodynamic rules, the thermodynamic properties of the pure components involved in the reaction, and the properties of the solutions formed in the liquid and gas phases. The study also examined the impact of alkali metal chlorides, particularly NaCl, on the formation of NaFeO2 in the passive oxide scale layer Fe3O4/Fe2O3. Furthermore, it investigated the condensation of NaCl vapour formation of low-melting eutectic mixtures in deposits and the resulting consequences on the corrosion process. The role of HCl in the chlorination and oxidation process of steel in melted ash deposits was also discussed. The presented thermodynamic analysis was compared with assumptions of an “active oxidation” model. This study can be a valuable resource for experimental research planning and a guide for preventing corrosion in industrial settings.

1. Corrosion of Iron in the Gas Phase Containing Chlorine Compounds

The assumptions of contemporary energy policies created by fossil fuel burning facilities [1,2] with restrictive CO2 emission limits are intensifying the share of renewable energy sources (RESs). Within RES technology, biomass combustion is particularly developing as an alternative to the combustion of conventional fossil fuels. A significant problem associated with biomass combustion is the limited corrosion resistance of steel boiler components (e.g., steam superheaters) when operating at high temperatures. To prevent these negative effects in biomass boilers, the steam temperature is reduced to 450–550 °C. However, such measures reduce the efficiency of the unit increasing the cost of energy production. Corrosion phenomena are particularly dangerous when burning fuels (high-chlorine coals, biomass, waste) with a chlorine content Cl > 0.2%. Biomass includes fuels with different chemical composition and combustion characteristics. Straw and grasses, compared to coal, are characterised by high concentrations of alkali metals, 0.033–1.9 wt.% and chlorine, 0.025–2 wt.%, and relatively low concentrations of sulphur, 0.1–0.2 wt.% (dry fuel) [3,4]. It is assumed that for every 0.1 wt.% of chlorine of dry biomass, there is approximately 100 ppm of chlorine in the gas phase. The composition of biomass combustion flue gas differs significantly from that of coal processes [5,6]. In contrast, the flue gas of thermal waste treatment processes has an HCl content of 800–4000 mg/m3 [7]. An example of the composition of the gas phase of flue gases depending on the type of fuel burned in the boiler is presented in Table 1.
Chlorine and its compounds, which are components of the gas phase of flue gases, fly ash sludge and eutectic mixtures of chloride compounds of heavy metals and alkali metals, constitute a significant technological problem related to chloride corrosion of boiler system components [10].
The composition of flue gases and fly ash sludge due to the content of chlorine compounds, the manner of conducting the combustion process in the boiler, the temperature of the process and the concentration of the corrosive agent in the adjacent area determine the kinetic conditions of the complex process of chloride corrosion. Corrosion results [11,12,13,14,15,16,17,18,19,20,21,22] indicate that Cl2 is very active and reacts with most metals at elevated temperatures. Metal chlorides are characterised by a low melting point and high vapour pressure [23,24]. A strong acceleration of corrosion of metallic materials is observed when the metal is in a gaseous environment (HCl, Cl2) or when chloride salts are deposited on the metal surface. As a consequence, the oxide layer becomes porous with numerous cracks with poor adhesion to the metallic substrate. Metal chlorides can also be detected at the metal–oxide interface, forming so-called active corrosion spots. An analysis of the effect of chlorine compounds on the degradation of materials showed that chlorine (Cl2) is significantly more corrosive than hydrogen chloride (HCl). The chlorine present in biomass and waste is readily released during combustion, mainly in the form of HCl [25]. Changes in the morphology of the protective Fe3O4–Fe2O3 oxide layer subjected to the destructive effect of gaseous HCl were discussed in [15]. It was found that with increasing HCl concentration in the gas phase of the reaction space, the oxide layer becomes porous and discontinuous, causing the degradation of haematite and magnetite sequentially. The effects of the diffusion of gaseous FeCl2 from the metal surface through the porous Fe3O4–Fe2O3 oxide layer are presented in [22], while the kinetic aspects of the chloride corrosion phenomenon under oxidising, reducing and oxidising–sulphidising conditions were considered in the studies [17,20,26,27,28,29]. The corrosion rates of iron and steel in the He-O2–HCl gas phase were studied in the papers [25,28,30,31,32,33,34]. The stages of chloride corrosion at different partial pressures of O2 were analysed in the paper [35].
Alloy composition as a factor influencing the corrosion behaviour of steel in an atmosphere of chlorine compounds was considered in papers [36,37,38].
Solid- and liquid-phase corrosion processes associated with eutectic mixtures containing chlorine compounds were considered in papers [39,40,41,42,43,44,45], while thermodynamic aspects of the influence of metal alkali in straw combustion processes were characterised in studies [46,47]. The authors of [48,49,50,51,52,53,54,55] found that in the NaCl gas phase, the metal oxidation rate increases significantly compared to the pure air gas phase, and the metal oxide phase degrades significantly. These observations also confirm the studies of other authors [22,23,56] suggesting the formation of sodium ferrate 2NaFeO2 and gaseous Cl2 as a result of NaCl vapour deposition on the haematite (Fe2O3) layer causing destruction of the oxide phase and acceleration of the metal corrosion phenomenon. The presence of chlorides in the sediments can influence the corrosion of the metal through the formation of low-melting eutectics that dissolve the passive oxide layer, or the course of the chemical reaction of chlorides with the oxide phase of the metal with the generation of chlorine intensifying corrosion in the gas phase.
An analysis of the results of the experimental work leads to some general conclusions. During the operation of power boilers, a scale of passive iron oxides forms on steel components relative to the metallic substrate. The kinetic effects of oxide film growth in the Fe–O system are characterised by a relatively low rate dependent on the steel used, but not dependent on the oxygen concentration in the reaction space [30,57]. A direct reaction between Fe and HCl can only occur in sediments under reducing atmosphere conditions with high HCl concentrations at elevated temperatures [43].
A different view is represented by the authors of [28,30,31,32,33,34], whose results indicate the course of chloride corrosion in a gaseous atmosphere (5% O2, 500–3000 ppm HCl) with the formation of FeCl2 according to the mechanism of the active oxidation model. The source of active Cl2 is seen in the exothermic Deacon 4In addition; alkali metals, which are fuel components during the combustion process in the form of gaseous chlorides (e.g., NaCl), can react with oxides of the scale layers, causing its further destruction through the formation of sodium ferrite Na2Fe2O4 with the simultaneous generation of the corrosive agent Cl2. The basic assumptions of the active oxidation model [22,25,30,31,32,33,34] are based on the following:
  • The phenomenon of diffusion of gaseous Cl2/HCl through the pores or cracks present in the oxide phase of metals, up to the metal–scale interface, where the formation of ferrous chloride FeCl2(s) takes place.
  • The volatilisation properties of FeCl2(s) → FeCl2(g) from the metal surface, and the diffusion of gaseous ferrous chloride through the porous and loose oxide scale layer back into the flue gas, where the chloride vapours are then oxidised to FexOy.
The cyclic nature of the phenomenon of gaseous Cl2 circulation into the Fe phase and FeCl2(g) into the flue gas through the oxide layer (Fe3O4/Fe2O3) causes its destruction and the loss of the protective properties of iron against chloride corrosion. The model of chloride-induced corrosion in the gas phase called active oxidation, i.e., oxidation of steel accelerated by the presence of chlorine in the flue gas, is widespread in the literature as a certain consensus of researchers adopted in the interpretation of the chloride-induced corrosion phenomenon. However, it limits the analysis of chloride-induced corrosion to the phenomenon of diffusion of Cl2 and FeCl2 through the scale layer. This raises some controversy among researchers regarding the ‘selective’ action of the Fe3O4/Fe2O3 oxide layer in the diffusion of the gaseous components of the flue gas to and from the metal surface, as well as the influence of other relevant gas-phase reactants (e.g., H2O) on the chloride-induced corrosion process. Furthermore, the active oxidation theory also has limitations in explaining how chlorine rapidly diffuses from the surface of the oxide layer to the Fe–(Fe3O4/Fe2O3) interface, and how volatile chlorides diffuse outwards. The permeation of chlorine compounds through the oxide phase is still not fully understood and explained. This is because the activation of oxidation takes place immediately after the introduction of HCl into the reaction space or the deposition of chloride on the oxide layer without the so-called incubation period. No model treatment of Cl2 diffusion unambiguously comprehensively explains the obtained results of a sudden change in the oxidation rate. The predominant view is that macroscopic defects occurring in the oxide layer provide a rapid Cl2 diffusion pathway also allowing O2 diffusion into the metal phase, resulting in the reconstitution of the oxide layer.
Current trends in explaining corrosion mechanisms in chloride environments are moving towards the so-called ‘static’ models and ‘dynamic’ quasi-applicability diagrams. Based on the conventional thermodynamic interpretation, the range of persistence of the Fe-O-Cl system concerns only the solid and liquid phases. The ‘static’ quasi-applicability diagram approach takes into account the evaporation of the gaseous corrosion product metal chloride. The saturated state of the gas phase, defined by a vapour pressure at P ¯ M e C l 2 = 10−4 atm., is the criterion that distinguishes between critical and non-critical corrosion conditions. Above the critical value (> P ¯ M e C l 2 ), there is significant evaporation of the metal in the chloride form which leads to metal wear and intensification of chloride-induced corrosion. Experimental studies have identified gas flow effects identified with gas velocity as a factor influencing the degree of metal corrosion. The new approach of the ‘dynamic’ quasi-applicability diagram takes into account gas flow rates, viscosity, temperature, component concentrations, corrosive agent content (O2 Cl2), kinetic and diffusion effects in the gas phase wall layer in contact with the solid-phase surface of the material exposed to corrosion attack. In this approach, the corrosion resistance criterion is given in terms of the recession rate, i.e., material thickness loss [mm/year] for dynamic conditions. A compendium of the treatment of ‘static and dynamic’ models for the interpretation of corrosion phenomena in atmospheres containing chlorine compounds is presented in [35].
Taking into account the above literature rationale, the characterisation of the phenomenon of chloride-induced corrosion of Fe with a gas phase containing chlorine compounds was performed in the present study using the general thermodynamic rules, the thermodynamic properties of the pure components involved in the reaction, and the properties of the solutions formed in the liquid and gas phases.
Considering the basic postulate of the active oxidation model, there is an interpretation of the following:
  • Boundary conditions at the metal–oxide interface considering all components of the gas phase, which is of cognitive interest and necessary to determine the concentration gradient of the components that limit diffusion phenomena through the oxide layer in the metal–metal oxide–gas phase system.
  • The influence of H C l ( g ) acting synergistically on the metal surface to form a solid iron chloride with a high tendency towards volatility ( F e C l 2 s F e C l 2 g ) as well as a source of H 2 ( g ) generated at the interface of ( F e s F e 3 O 4 ( s ) ).
  • The influence of ( H C l g / H 2 O g / H 2 g ) on oxidation and reduction processes occurring at the metal–oxide interface.
  • Corrosion effects related to alloy composition with respect to the carbon content in iron based on thermodynamic analysis based on a Fe-C equilibrium system with the determination of the cementite activity coefficient in iron l n γ F e 3 C = f ( T , x F e ) .
  • Conditions of carbon supersaturation on the surface of the iron alloy promoting potentially catastrophic pitting corrosion known in the literature as metal dusting.
  • The role of water vapour in altering the oxide corrosion mechanism. In addition to chloride corrosion in this area, P H 2 O may be a criterion for steam-enhanced oxide corrosion, and an indicator of the susceptibility of steel to pitting corrosion associated with the decarburisation of steel.
  • The action of sodium as a fuel component in the reaction space of the gas phase occurring in the form of gaseous chlorides (NaCl(g)). The technological conditions of the formation on the haematite surface of the sodium ferrate 2 N a F e O 2 ( s ) compound suggested in the literature as one of the postulates of the active oxidation model were discussed in thermodynamic terms. The effect of the formation of the liquid solution ( F e C l 2 N a C l ) ( l ) on the process of gaseous hydrogen evolution at the metal–oxide interface was determined, thus determining the composition of the gas phase in the reducing or oxidising range, regulating the corrosion phenomena associated with the direction and mechanism of the carburisation of steel. To estimate the magnitude of these phenomena, based on the thermodynamic analysis of the liquid system ( F e C l 2 N a C l ) ( l ) , the activity of a F e C l 2 c = f ( T ,   x F e C l 2 ) was determined.
  • The equilibrium composition of the gaseous phase resulting from the oxidation of hydrogen chloride, depending on the initial oxygen conditions prevailing in the system, using the author’s formalism of vector equations, thus specifying the boundary conditions at the metal oxide–gas interface.
  • Trajectories of changes in partial pressures P i of the gaseous reactants from quasi-equilibrium to equilibrium states for the reducing and oxidising regions at the metal–metal oxide interface determining the course of corrosion.
  • Iron chloride oxidation and oxide phase expansion phenomena F e C l 2 g O 2 F e 3 O 4 s verifying the parameters of the active oxidation postulate.

2. Fundamentals of Thermodynamic Process Analysis

In the thermodynamic analysis of the phenomena taking place, the chemical potentials ( μ i ) of the components ( i ) play an important role, which can be expressed by the relation
μ i = μ i o + R T l n a i
where μ i o  is the standard chemical potential of pure component i , J/mol; R is the gas constant, 8.314 J/(mol K); T is the temperature, K; a i is the activity of component i in the solution, -.
The R T l n a i part represents the energy effect associated with the introduction of a pure component into the solution. In the case where components in the solid or liquid phase do not form solutions and are present in the pure state, their activity defined as a i = 1 ( a i = x i γ i , x i = 1 , γ i 1 ), where x i is the mole fraction and γ i is the activity coefficient of component i in the solution. However, for a chemical reaction in the gas phase, the activities of the components can be expressed by the partial pressures P i identified with the molar fraction P i = x i P c (where P c is the total pressure in the system). Under thermodynamic equilibrium conditions in a multi-component ( 1 ,   2 s ) multi-phase ( 1 ,   2 Φ ), system, for isothermal–isobaric conditions ( T , P = c o n s t . ), the potentials of the same component in different phases are equal to each other:
μ 1 1 = μ 1 2 = μ 1 Φ μ 2 1 = μ 2 2 = μ 2 Φ . μ s 1 = μ s 2 = μ s Φ
For any chemical reaction expressed by the relation
i = 1 s ν A i A i = i = 1 s ν B i B i
the thermodynamic equilibrium condition can be represented by the equation
i = 1 s ν A i μ A i = i = 1 s ν B i μ B i
where A i is the substrates; B i is the products; ν A i , ν B i are the stoichiometric ratios of substrates and products, respectively, -; μ A i , μ B i are the chemical potentials of substrates ( A i ) and products ( B i ), respectively, J/mol.
Considering the definition of the chemical potential, and the equilibrium condition for any chemical reaction, one can derive the relation for the change in the free enthalpy of the reaction ( Δ G T o ) defined as follows:
Δ G T o = i = 1 s ν B i μ B i o i = 1 s ν A i μ A i o
presenting the standard chemical potentials of the pure components ( μ i o ) of the products and substrates of the reactions taking place. The relationship between the free enthalpy change function of the reaction ( Δ G T o ) and the equilibrium constant ( K ) representing the limit to which the process is moving is described by the equation
Δ G T o = R T l n K
where ( K ) is defined as
K = i = 1 s a B i ν B i i = 1 s a A i ν A i
For isothermal–isobaric conditions, the gas-phase composition of the reaction changes along a straight line, and the transition of the reactants from the initial to the final (equilibrium) state can be marked by a vector parallel to it [58,59,60,61]:
x i = x i o + τ ν i x i o i = 1 s ν i i = 1 s ν i x i o i = 1 s ν i 2 ,   i = 1 s
where x i , x i o are the equilibrium and initial mole fraction of component i , -; τ   R is the straight line parameter; ν i is the stoichiometric coefficient of reactant i , -.
Positive values of the stoichiometric coefficients ( ν i ) are assumed for products, negative for substrates and a value of zero for reactants not involved in the chemical reaction. The direction cosines of the vector do not depend on time; they are only functions of the initial composition and the stoichiometric coefficients of the reaction. For the reaction ( i = 1 s ν i 0 ), the change in phase composition occurs along straight lines intersecting at the so-called “characteristic point” ( x ¯ i ). For the reaction ( i = 1 s ν i = 0 ), the direction cosine does not depend on the initial composition, only on the stoichiometric coefficients, and the change in the concentrations of the reactants takes place along parallel lines. The calculations in the analysed process were performed on the basis of thermodynamic data [62,63] using an in-house script written in MATLAB (The MathWorks, Inc., Natick, MA, USA).

3. Thermodynamic Analysis of Chloride Ions’ Role in Corrosion of Iron

3.1. Stability of Iron Compounds in the [Fe-O-Cl] System

The stability of oxide phases (Fe3O4(s), Fe2O3(s)), chloride phases (FeCl2(s)) and pure Fe(s) at a given temperature depends on the partial pressures ( P O 2 ( g ) , P C l 2 ( g ) )  in the gas phase. The stability ranges of iron compounds in the (Fe-O-Cl) system were determined for a temperature of T = 800 K, and a thermodynamic view of this issue is given in the supplement (Tables S3–S7) omitting the FeO(s) phase as not stable at this temperature. Protection of iron against both chloride-induced and oxide-induced corrosion at 800 K is possible at lower concentrations for chlorine P C l 2 ( g ) = 10 16 atm. and oxygen P O 2 ( g ) = 10 27 atm. The generation of a chloride phase in contact with pure haematite (FeCl2(s)/Fe2O3(s)) is possible at oxygen pressures of P O 2 ( g ) = 10 8 atm. However, this requires a chlorine pressure in the reaction space of P C l 2 ( g ) = 10 3 atm. Under the technological conditions of biomass combustion in power boilers and laboratory experiments [28,30,31,32,33,34], the oxygen concentration in the gas phase fluctuates around 5%, while HCl(g) ranges from 500 to 3000 ppm. These are values indicating that the stable phase under these conditions is the Fe2O3(s) phase, and oxide corrosion is the dominant phenomenon in this gas-phase concentration region. The equilibrium gas-phase composition of the reaction space (HCl(g), O2(g), Cl2(g), H2O(g)) determines the course of the Deacon reaction of hydrogen chloride oxidation, generating chlorine and water vapour, intensified by the catalytic action of iron oxides (Table S2):
2 H C l ( g ) + 1 2 O 2 ( g ) C l 2 ( g ) + H 2 O ( g )
The activation of oxide corrosion by gaseous Cl2(g) assumes the diffusion of this component to the interface (Fe(s)–Fe3O4(s)) with the formation of highly volatile solid iron chloride (FeCl2(s) → FeCl2(g)) presenting sufficient vapour pressure P F e C l 2 g to diffuse in the opposite direction to chlorine through the (Fe3O4(s)/Fe2O3(s)) layer to the gas phase, where the oxidation of chloride to metal oxide (Fe2O3(s)) takes place with the simultaneous release of chlorine gas. Maintaining this basic postulate of the active oxidation model, the determination of the boundary conditions at the metal–oxide interface (Fe(s)–Fe3O4(s)) taking into account all gas-phase components resulting from the reaction (Equation (9)) seems cognitively interesting and necessary to determine the concentration gradient of the components limiting the diffusion phenomena through the oxide layer within (Fe(s)/Fe3O4(s)–Fe2O3(s)/(HCl(g), O2(g), Cl2(g), H2O(g))). The equilibrium state at T = 800 K between magnetite and pure iron at the interface (Fe(s)–Fe3O4(s)) is determined by an equilibrium oxygen pressure of l g P O 2 ( g ) = 27.8069 .

3.2. Influence of ( H C l g / H 2 O g ) on the Processes Occurring at the Metal–Metal Oxide Interface

Diffusing through the oxide phase from the gas phase, HCl(g) reacts with the surface Fe(s) as described by the equation
F e ( s ) + 2 H C l ( g ) = F e C l 2 s + H 2 ( g )
It follows that HCl(g) acts synergistically on the metal surface to form solid iron chloride with a high tendency towards volatility (FeCl2(s) → FeCl2(g)) as well as being a source of H2(g) formed at the interface of (Fe(s)–Fe3O4(s)). Calculations in the supplement (Tables S8 and S9) show that the pressures of the generated hydrogen increase proportionally with the partial pressure of HCl(g) and in the technological concentration range P H C l ( g ) = 500–3000 ppm are at the level of P H 2 ( g ) = 132–4745 ppm. Gaseous hydrogen with water vapour diffusing to the metal surface defines, through the equilibrium concentration ratio ( P H 2 ( g ) / P H 2 O ( g ) ) , the reducing and oxidising region of the gas phase for the reaction
3 F e ( s ) + 4 H 2 O ( g ) = F e 3 O 4 ( s ) + 4 H 2 ( g )
as graphically presented in Figure 1. This approach is identical to the analysis of the Fe-O system through the water vapour dissociation reaction (Tables S10–S12):
H 2 O ( g ) = H 2 ( g ) + 1 2 O 2 ( g )
The combination of reactions (Equations (10) and (11)) allows the analysis of the interaction of (HCl(g)/H2O(g)) on the processes occurring at the metal–oxide interface. It follows that as the concentration of HCl(g) increases at the interface of (Fe(s)–Fe3O4(s)), at a fixed concentration of H2O(g), there is an increase in the role of magnetite reduction to pure iron, or an increase in the partial pressure P H 2 O ( g ) , for P H C l ( g ) = c o n s t . ,  which contributes to iron oxidation effects. This also affects the corrosion effects associated with the composition of the alloy with respect to the carbon content in the iron (Table S13).

3.3. Influence of the Carbon Content in Iron on the Corrosion Effects of Boiler Steel

The most commonly used boiler steel 16M03(16) in power generation technologies contains carbon in the range of C = 0.16–0.22%. With the assumption that carbon in the Fe-C solid solution occurs mainly in the form of cementite (Fe3C(s)), and based on a thermodynamic analysis being the basis for the Fe-C equilibrium system [64,65,66], the activity coefficient of cementite in iron l n γ F e 3 C ( s ) = f ( T , x F e ( s ) ) was determined. Considering the disproportionation reaction F e 3 C ( s ) = 3 F e ( s ) + C ( s ) , the low carbon content corresponds to its corresponding high activity of a a C = 0.8773 at 800 K (Table S14).
Oxidation of carbon with activity a C = 0.8773 by oxygen with equilibrium pressure l g P O 2 = −27.8069 at the interface (Fe(s)–Fe3O4(s)) generates CO2(g) of partial pressure at P C O 2 ( g ) = 9.172 × 10⁻³ atm., which implies the Boudouard reaction with the generation of carbon monoxide with a partial pressure P C O ( g ) = 9.032 × 10⁻³ atm. (Tables S15 and S16). The gas-phase components H2(g), CO(g), H2O(g) in contact with the C(s) of the Fe(s)–Fe3C(s) solid solution provide the rationale for the course of the reaction (Tables S17 and S18)
H 2 ( g ) + C O ( g ) = H 2 O ( g ) + C ( s )
for which the change in carbon activity in steel can be represented as follows:
l g a [ C ] = l g K + l g P H 2 ( g ) + l g P C O ( g ) l g P H 2 O ( g )
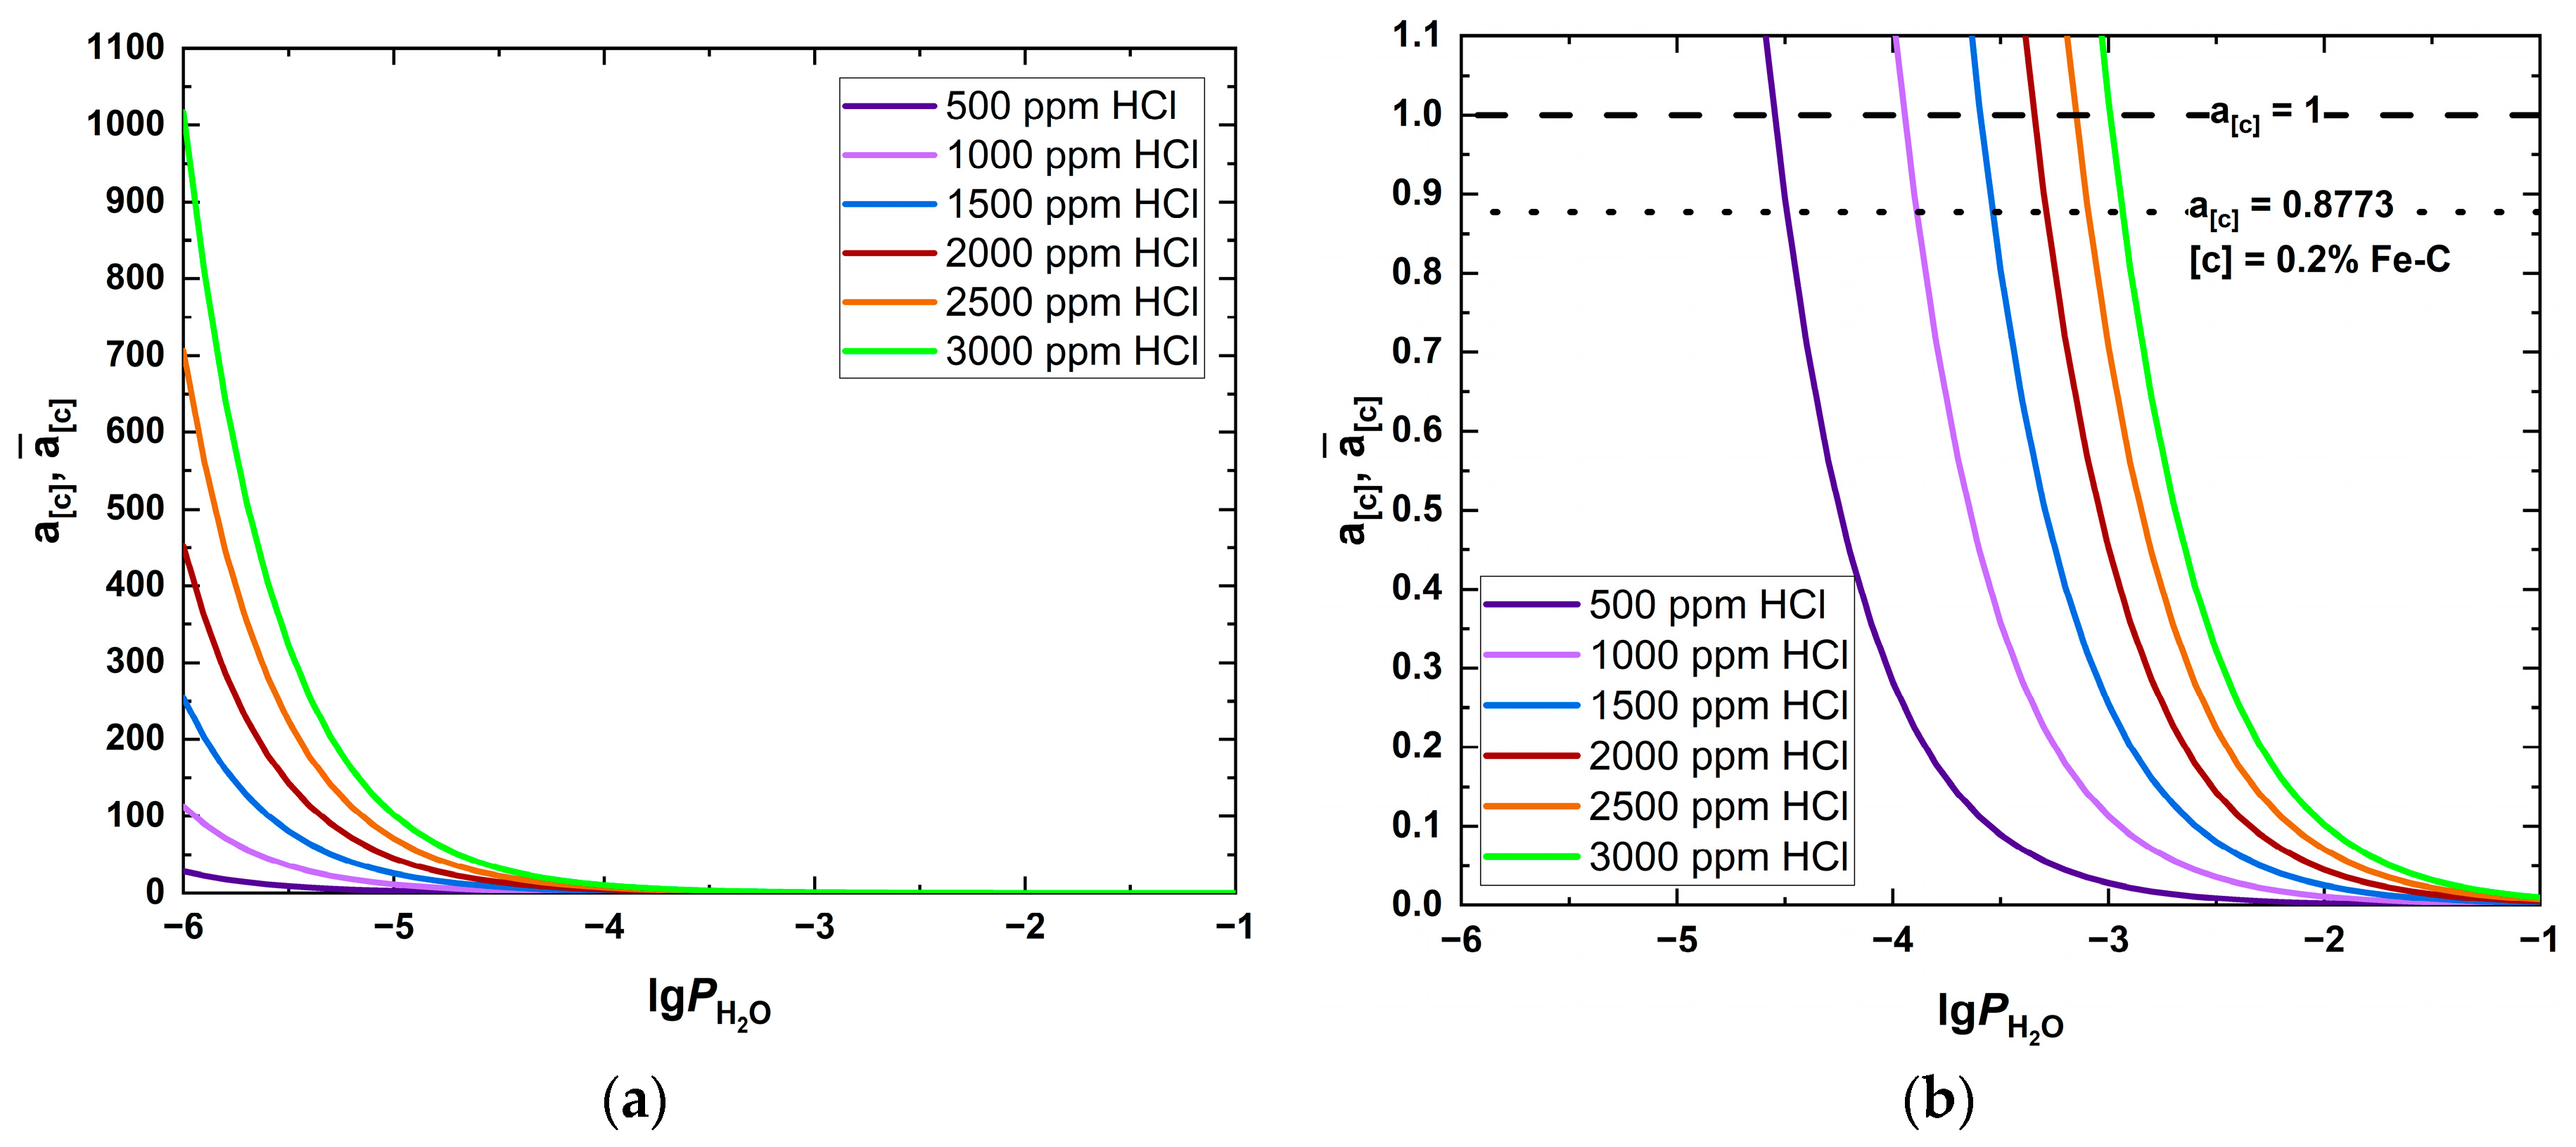
The results of the calculations a [ C ] = f P H 2 O ( g ) , P H C l ( g ) are given in Table 2 and illustrated in Figure 2.
The physical sense of the carbon activity values relates to the interval 0 a [ C ] 1 , and for this reason, for values higher than unity, the factor a ¯ [ C ] 1 was conventionally introduced as a criterion for the supersaturation of the Fe(s)–Fe3C(s) alloy surface with carbon. It can be observed that in the reducing region of the H2(g)/H2O(g) concentrations, the carbon activities are higher than the equilibrium, a C > 0.8773, while for oxidising conditions, they are lower, a C < 0.8773. The supersaturation coefficient a ¯ [ C ] 1 is directly proportional to the concentration HCl(g) and inversely proportional to the partial pressure H2O(g) on the Fe(s)–Fe3C(s) surface.

3.3.1. The Metal Dusting Phenomenon under Carbon Supersaturation of Fe-Fe3C Alloy Surface

The conditions of carbon supersaturation of the iron alloy surface a ¯ [ C ] 1 contribute to catastrophic pitting corrosion known in the literature as metal dusting [67,68,69,70,71,72,73,74,75,76,77,78,79,80,81,82]. The mechanism of this form of corrosion occurring in the temperature range of 400–800 °C is complex and varies from material to material. A simplified model of the metal dusting phenomenon involves the initial formation of a metastable Fe3C(s) carbide layer on the iron surface in carbon-saturated environments. This carbide then dissociates into carbon and metal particles when it is destabilised by carbon deposition, leading to the formation of ‘dust’. The metastable Fe3C(s) often does not dissociate, but instead forms dust as a result of the fracture of the surface Fe3C(s) layer. All these transformations create strong mechanical stresses on the material, leading to the destruction of its surface layer and the formation of a nanocrystalline mixture of metal particles with carbon fibres. The main mass transfer process is the inward transport of carbon, either as a gas through the porous coke or as a solute in the catalytic material, metal or cementite. Different mechanisms apply to ferritic and austenitic alloys [83]. In the case of iron and low-alloy steels exposed to carbon-saturated gas, external Fe3C(s) cementite scales are formed, and the rate of their formation is controlled by the internal diffusion of C(s) through the scale phase. At the same time, the mass of coke deposited on top of the cementite scale and the amount of iron consumed increase. The coke deposit is highly porous and consists mainly of nanotubes and graphite fibres with cementite nanoparticles. Thus, iron is consumed to produce cementite scale and a large number of Fe3C(s) particles (‘dust’). The cementite dust is formed by the decomposition of the outer surface of the scale. The disintegration is attributed to the nucleation of graphite in the cementite phase and the resulting increase in volume. Graphite precipitation is possible because the carbon activity in Fe3C(s) is greater than unity. Graphite growth is promoted by the continuous diffusion of carbon through the Fe3C(s) network. Coke fibre growth occurs through the same mechanism. The exposed surfaces of the Fe3C(s) nanoparticles catalyse the release of carbon from the gas phase. This carbon diffuses along the grain boundaries of the alloy under thermodynamically favourable conditions for graphite deposition. At these orientations, the carbon attaches to the graphite fibre, elongating it and pushing the cementite particles outwards. As the structure of the resulting coke is highly porous, gas can penetrate through it, reaching the surface of the cementite scale, where further catalysis of carbon release is possible. For carbon activity in the carburising atmosphere a [ C ] = 1 , structures conforming to the Fe-C equilibrium system are formed.

3.3.2. H2O(g) in Steel Decarburisation Processes

The carburisation process at a [ C ] < 1 can be interpreted by the diffusion of dissolved solid Fe(s)-C(s) carbon, the rate of which is described by Wagner diffusion theory [84,85,86,87], assuming that no oxide phase is formed. In carburising atmospheres where the carbon activity is a [ C ] < 1 , chemically active carbon atoms diffuse into the solid solution (ferrite) to form equilibrium structures [88]. Corrosion processes during carburisation occur when carbides form in the steel, destabilising the equilibrium system under given conditions, increasing the steel resistance, initiating cracks and lowering the oxidation resistance of the steel [89,90]. Water vapour in the oxidising region fundamentally affects the carburisation of steel according to the relation
l g x F e 3 C ( s ) = l g a F e 3 C ( s ) l g γ ¯ F e 3 C ( s ) ( x F e ( s ) 1 )
where l g γ ¯ F e 3 C ( s ) ( x F e ( s ) 1 ) = 1.836 is the limiting activity coefficient of cementite in Fe(s)-Fe3C(s) at T = 800 K (at x F e ( s ) 1 ) . This phenomenon is favoured by an increase in the pressure of HCl(g) on the surface of Fe(s)–Fe3C(s). Most steels oxidise faster in atmospheres containing water vapour than in dry air [81,86,87,88,89,90,91,92]. Water vapour alters the oxide corrosion mechanism and accelerates the rate of corrosion, destabilises the morphology of the oxide phase (Fe3O4(s)/Fe2O3(s)) and influences the adhesion phenomena at the interface (Fe(s)–Fe3O4(s)), causing the desquamation of oxides and their falling off from the metallic substrate; it is characterised by the oxidation selectivity of the alloying additives.

3.4. The Role of Gaseous Chlorides NaCl(g) in Steel Corrosion Processes

3.4.1. Thermodynamics of Sodium Ferrate N a 2 F e 2 O 4 Formation

In the reaction space of the gas phase, the sodium component of the fuel during combustion may be present in the form of gaseous chlorides (NaCl(g)). There is a complementary view to the active oxidation model of the destructive role of gaseous sodium chloride (NaCl(g)) destroying the oxide scale layer (Fe2O3(s)) through the formation of sodium ferrate Na2Fe2O4(s) with the simultaneous generation of the corrosive agent Cl2(g). The equilibrium condition between the solid and gas phases of sodium chloride μ N a C l ( s ) = μ N a C l ( g ) indicates that the saturation state of the gas phase with NaCl(g) vapours is reached at P N a C l ( g ) o = 0.0857 ppm, for T = 800 K (Table S19). This means that for process concentrations higher than P N a C l ( g ) o , condensation of NaCl(g) → NaCl(s) vapours occurs on the surface of the oxide scale (Fe2O3(s)). The generation of sodium ferrate on the haematite surface according to the reaction
N a 2 O ( s ) + F e 2 O 3 ( s ) = 2 N a F e O 2 ( s )
requires the activity of sodium oxide Na2O(s) of l g a N a 2 O ( s ) = −10.359. The determined phase equilibrium system of iron and its oxides with sodium ferrate (Fe(s)/Fe3O4(s)/Fe2O3(s))–2NaFeO2(s), consistent with the interpretation of [93], is given in Table S20. The composition of the gas phase, by the reaction occurring in it,
2 N a C l ( g ) + H 2 O ( g ) = N a 2 O ( s ) + 2 H C l ( g )
limits the level of a N a 2 O ( s ) on the haematite surface. Assuming a content of 100 ppm. NaCl(g) in the gas to reach an equilibrium concentration of a N a 2 O ( s )   x N a 2 O ( s ) necessary to form 2NaFeO2(s), at a concentration of 1000 ppm. HCl(g) in the gas phase, the vapour pressure of P H 2 O ( g ) = 48 atm. is required, while for 3000 ppm. HCl(g), the vapour pressure value increases to 432 atm. Similarly, it can be shown that a 10% water vapour content requires a gas-phase saturation of 2192 ppm. NaCl(g). In contrast, for a ‘dry’ gas in the gas phase, a pressure of P N a C l ( g ) = 0.693 atm. would be required. The equilibrium state of x N a 2 O ( s ) can only be reached below 46 ppm of HCl(g) in the gas-phase reaction space with 10% of H2O(g), or for a ‘dry’ gas at P H C l ( g ) < 0.14 ppm (Tables S21–S23). The results obtained indicate that there is no thermodynamic justification for the suggestion of the formation of the 2NaFeO2(s) phase on the haematite surface under the conditions of the laboratory experiments and industrial pragmatism cited in the literature.

3.4.2. Thermodynamics of Liquid Solutions ( F e C l 2 N a C l ) ( l ) Formation

In the case of diffusion through the oxide layer of NaCl(g) vapours and their condensation on the metal surface, in contact with the solid FeCl(s) reaction product (Equation (10)), potentially favourable conditions for the formation of a liquid ( F e C l 2 N a C l ) ( l ) solution are created. This situation has the effect of enhancing chloride-induced corrosion (Equation (10)) by dissolution and thus lowering the activity a F e C l 2 s  →  a F e C l 2 l of the corrosion product, i.e., FeCl2(s). However, on the other hand, the saturated vapour pressure P F e C l 2 ( g ) over the solution decreases, which has an inhibitory effect on the diffusion of FeCl2(g) through the (Fe3O4(s)/Fe2O3(s)) layer with the simultaneous restoration of the oxide phase due to the oxidation of ferric chloride as postulated by the active oxidation model. The formation of a liquid solution of ( F e C l 2 N a C l ) ( l ) also promotes the release of hydrogen gas at the metal–oxide interface (Equation (10)), thus determining the composition of the gas phase in either the reducing or oxidising range, regulating the corrosion phenomena associated with the direction and mechanism of carburisation of steel. To estimate the scale of these phenomena based on the thermodynamic analysis of the whole system of ( F e C l 2 N a C l ) ( l ) , the activity of a F e C l 2 l = f ( T ,   x F e C l 2 ( l ) ) was determined. The phase diagram of FeCl2–NaCl indicates a eutectic-type system without boundary solutions, with a eutectic with a melting point of T E = 648 K at a concentration of x F e C l 2 ( E ) = 0.4376. To describe the activity coefficients of the components of the binary liquid solution (FeCl2(l), NaCl(l)) the proposal of Krupkowski [66] satisfying the Gibbs–Duhem equation was used:
i = 1 n x i d l n γ i = 0 i = 1 , 2 l n γ 1 = ω T x 2 m l n γ 2 = ω T x 2 m m m 1 x 2 m 1 + 1 m 1
where ω T represents a function depending only on temperature, while m is the asymmetry factor of the solution.
The shape of the function ω T and the parameter m were determined based on the coordinates of the liquidus curve T , x F e C l 2 l i q . of the phase diagram [94] for the hypoeuteutic composition, the interfacial equilibrium condition μ i s = μ i l and the temperature dependence of the standard chemical potential μ i ( s , l ) o = f T of the components: i s , l = F e C l 2 , N a C l . The calculation procedure is presented in the supplement (Tables S24–S28). The relation ω T = / T proposed in the study allows us to classify the solution ( F e C l 2 N a C l ) ( l ) into the group of regular solutions in terms of Krupkowski’s description, and the determined parameters and m take the values = −3121 and m = 2.1314. The concentration range and corresponding activity of ferric chloride for T = 800 K in liquid solution ( F e C l 2 N a C l ) ( l ) are, respectively (Table S29),
  • x F e C l 2 = 0.6147 a F e C l 2 = 0.3687   s u p e r s c r i p t   ( )   h y p o e u t e u t i c   c o m p o s i t i o n
  • x F e C l 2 = 0.3858 a F e C l 2 = 0.0970   s u p e r s c r i p t   ( )   h y p e r e u t e u t i c   c o m p o s i t i o n
A decrease in activity a F e C l 2 l < 1 associated with the introduction of the pure component into the solution ( F e C l 2 N a C l ) ( l ) implies (Table S30) an increase in the partial pressure of hydrogen at the metal–oxide interface according to the relation
l g P H 2 ( g ) = 2.289 + 2 l g P H C l ( g ) l g a F e C l 2 ( l )
In the concentration range of the liquid solution, the pressure of the hydrogen produced by the reaction increases by almost 4 times:
F e ( s ) + 2 H C l ( g ) = F e C l 2 l [ F e C l 2 N a C l ] ( l ) + H 2 ( g )
as presented in Table 3. On the other hand, according to the interfacial equilibrium condition (Table S32), the saturated vapour pressure of iron chloride P F e C l 2 ( g ) decreases adequately with the decrease in a F e C l 2 l which is a consequence of the formation of (FeCl2(l)–NaCl(l)). The magnitude of this phenomenon is shown in Table 4.

3.5. Gas-Phase Composition Parameters as Boundary Conditions at the Metal Oxide–Gas Interface in Terms of the Parametric Equation Formalism

Based on the literature information, the industrial pragmatism of the combustion technology of fuels containing chlorine compounds and the thermodynamic rationale presented above, a thermodynamic analysis of the chloride corrosion of iron was carried out. The initial composition of the reaction space gas phase, for the individual calculation series, is summarised in Table 5.
A gas-phase HCl(g) concentration of 3000 ppm. was assumed in all calculation series, varying the initial oxygen concentrations from 1 ppm. up to 5%. In series (Ia), in addition to HCl(g), 5% O2(g), the gas additionally contained 35% H2O(g). The composition was supplemented with N2(g) in an amount satisfying the condition i = 1 5 x i o = 1 . The range of component concentrations was selected with a view to similar laboratory test conditions described in the literature and the conditions of the real technological process of fuel combustion. For the given initial compositions, the actual equilibrium composition of the gas phase with the Deacon reaction occurring in it (Equation (9)) was determined using the formalism of parametric equations described in detail in Table S34. The set of vector equations of the compositional change from the initial concentration conditions   x i o to the equilibrium x i of all gas-phase components is provided in Table 6.
The reaction equilibrium constant (Equation (9)) defined by the relation
K = x H 2 O ( g ) · x C l 2 ( g ) x o 2 ( g ) 0.5 · x H C l ( g ) 2
after taking into account the vector equations (Equation (8)) of the phase components is as follows:
K = x H 2 O ( g ) o + 2 x H 2 O ( g ) o τ     x C l 2 ( g ) o + 2 x C l 2 ( g ) o τ x o 2 ( g ) o + 1 x o 2 ( g ) o τ 0.5   x H C l ( g ) o + 4 x H C l ( g ) o τ 2
For example, for the first gas mixture composition at K = 2.0239, Equation (22) reduces to the following form:
0.2048085 + 3.8913615 τ 0.003 + 3.997 τ 4 16 τ 4 = 0
a fifth-degree function with one unknown τ belonging to the set τ R . In the set of solutions of this function, only one value of τ makes physical sense for which the condition is satisfied:
τ 1 , , τ 5 τ 0 x i 1 i = 1 s x i
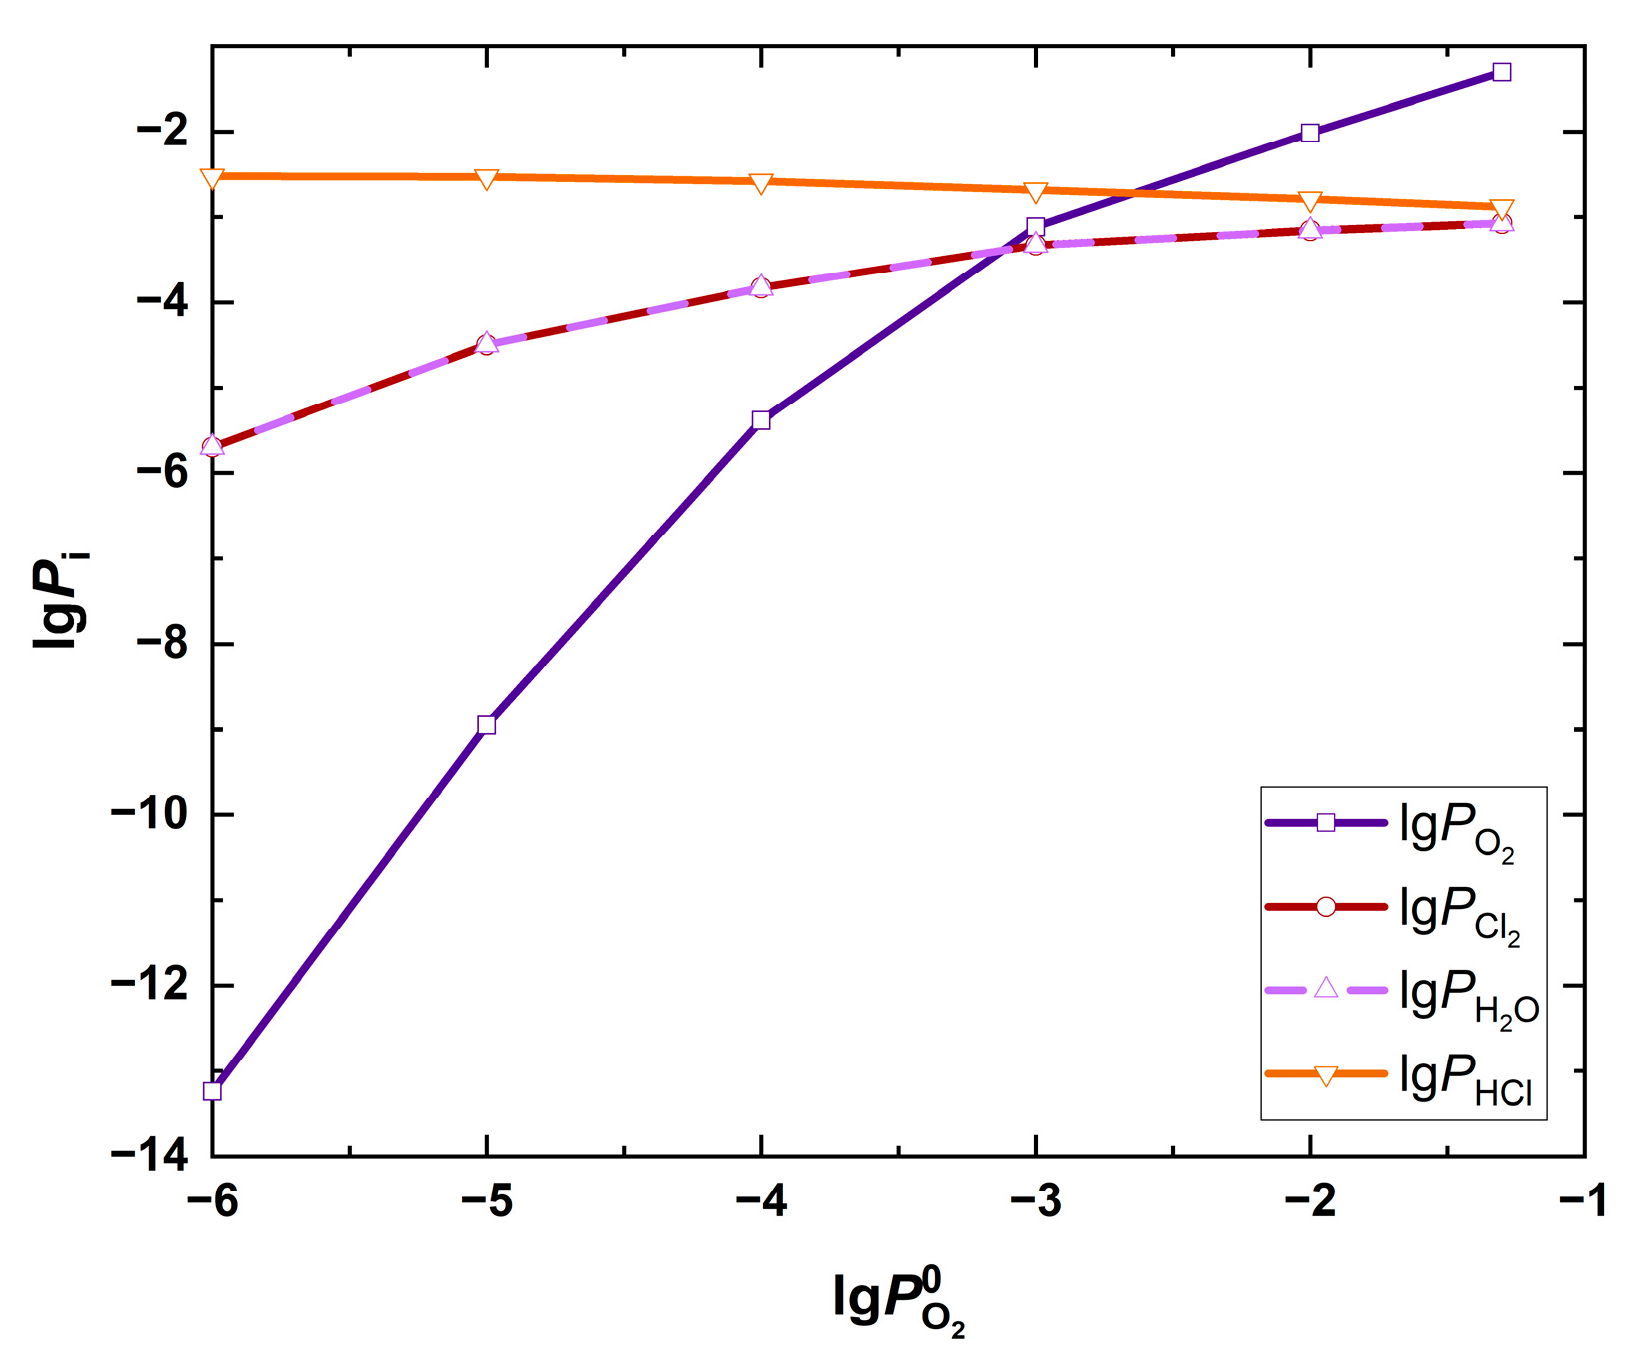
The determined parameter τ introduced into the vector equations (Equation (8)) allows the equilibrium composition of all gas-phase components to be determined. Calculations were performed for a temperature T = 800 K and a total system pressure of P = 1 atm. The equilibrium composition of the gas phase resulting from the oxidation of hydrogen chloride, depending on the initial oxygen conditions prevailing in the system, is given in Table 7 and graphically illustrated in Figure 3.
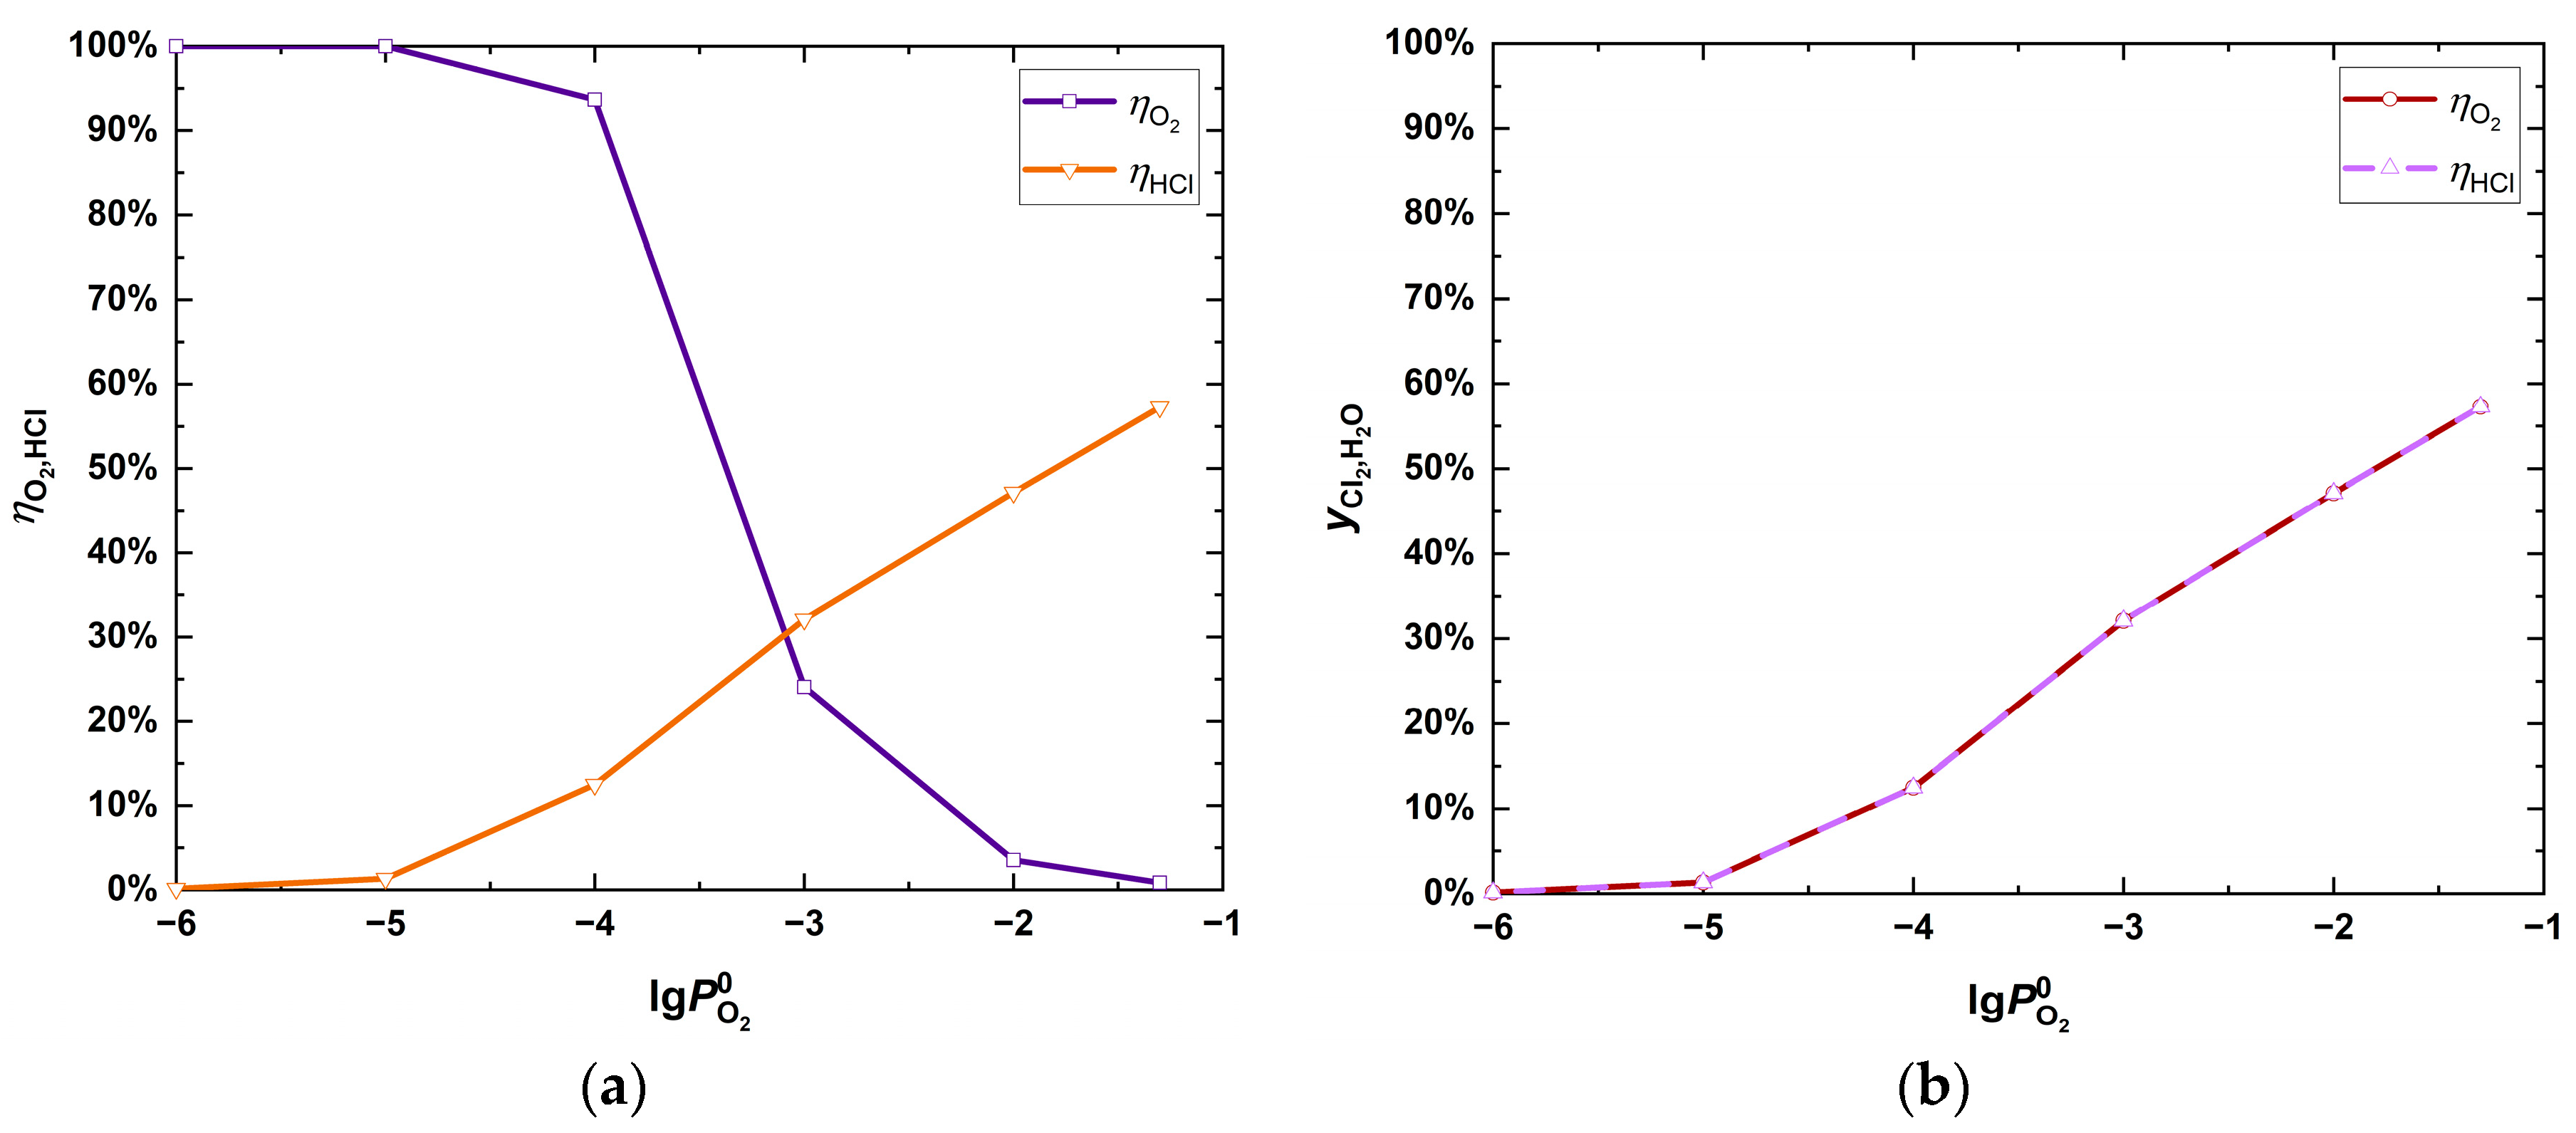
In this way, the composition parameters of the gas phase in contact with (Fe3O4(s)/Fe2O3(s)), representing the boundary conditions at the metal oxide–gas interface, were specified. As the initial concentration of oxygen in the system decreases, a slight increase in the equilibrium concentrations of HCl(g) is observed, while a decrease in H2O(g), Cl2(g), O2(g) is observed, the effect being most pronounced for oxygen. This observation can be complemented by the results of the conversion rate η i for i = ( O 2 ( g ) , H C l ( g ) ) and the yield y i for i = ( C l 2 ( g ) , H 2 O ( g ) ) in the Deacon reaction summarised in Table 8 and shown graphically in Figure 4.

3.6. Thermodynamic Determinants of the Course of Corrosion at the Metal–Metal Oxide Interface

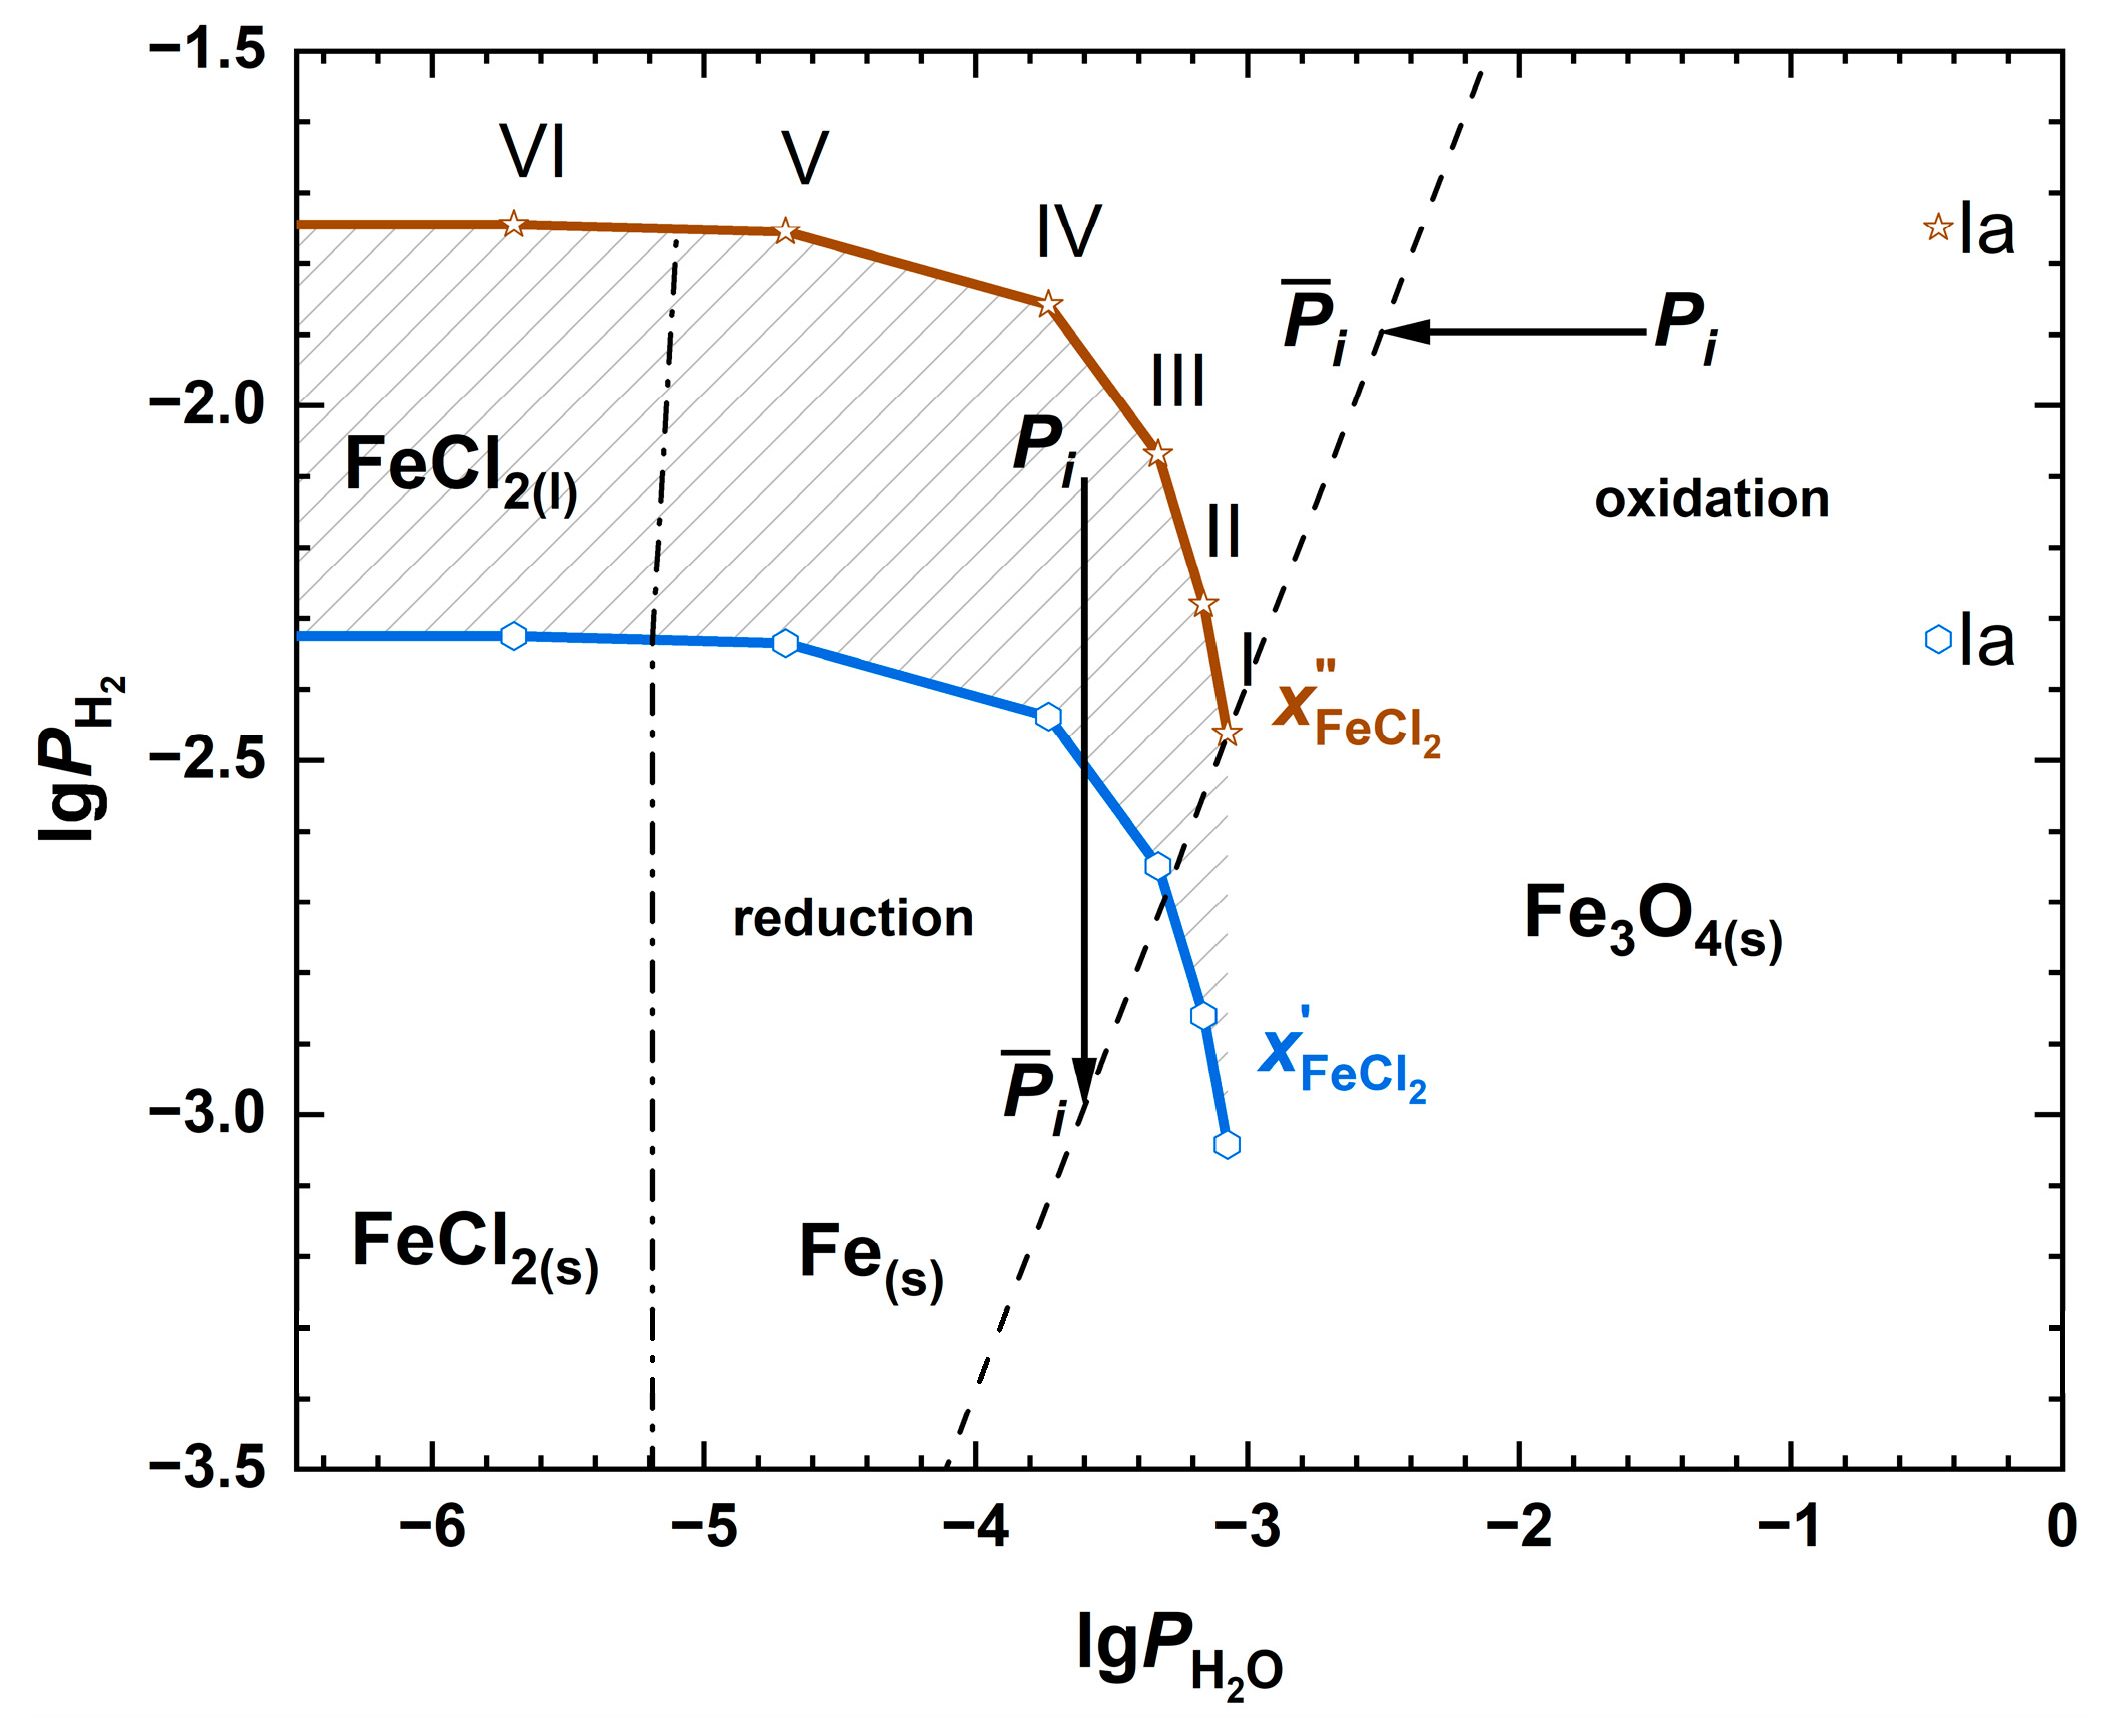
The determination of the boundary conditions at the metal–oxide interface was realised by assuming diffusion through the oxide layer of all gas-phase reactants to the metal surface. The release of hydrogen on the metal surface is captured by reaction (Equation (10)), and after taking into account the presence of NaCl(g) → NaCl(s) in the gas phase condensing on the metal surface at vapour pressures higher than the saturated state P N a C l ( g ) > P N a C l 0 = 0.0857 ppm, the hydrogen generation phenomenon as a consequence of the formation of a liquid solution of ( F e C l 2 N a C l ) ( l )  is consistent with the reaction (Equation (20)). The resulting hydrogen with water vapour is defined by the Deakon reaction of the diffusing gas-phase limits, via reaction (Equation (11)), and the reducing or oxidising conditions at the metal–oxide interface, thus fixing the oxygen parameters resulting from reaction (Equation (12)). The combination of reactions (Equations (10)–(12) and (20)) also makes it possible to analyse the effect of (H2(g)/HCl(g)/H2O(g)) on the corrosion effects associated with the steel carburisation phenomenon. The interpretation uses, according to relations (Equations (13) and (14)), the values of the activity a [ C ] or the coefficient a ¯ [ C ] as a criterion for the supersaturation of the Fe(s)–Fe3C(s) alloy surface with carbon. The complete information regarding the calculated parameters P H 2 , P O 2 , a [ c ] , a ¯ [ C ] is given in Table 9 and Table 10, with the first one corresponding to the concentration x F e C l 2 of the solid-phase limit of the corrosion product FeCl2(s) and the second one corresponding to the liquid-phase range of FeCl2(l) with the limit x F e C l 2 . The results of l g P H 2 ( g ) = f l g P H 2 O ( g ) are also presented graphically in Figure 5.
The relationship between the initial oxygen pressure P O 2 ( g ) o in the gas phase and the parameters P H 2 ( g ) , P O 2 ( g ) , a [ c ] , a ¯ [ C ] at the interface Fe(s)-Fe3O4(s) can be observed. An increase in hydrogen concentration is recorded, P H 2 ( g ) , with a decrease in the initial pressure P O 2 ( g ) o of oxygen in the gas phase with both solid and liquid corrosion product FeCl2(s,l), with the formation of a liquid solution ( F e C l 2 N a C l ) ( l )  that intensifies the process. A similar relationship applies to the shift of the coordinates ( P H 2 ( g ) , P H 2 O ( g ) ) from oxidative to reductive conditions which occurs for values of P O 2 ( g ) o < 0.01 atm., and the liquid phase FeCl2(l) activates this phenomenon, as can be seen in series (II) representing the mixed oxidation–reduction region with an a F e C l 2 ( l )  decrease. In the oxidising region, higher oxygen partial pressures P O 2 ( g ) o reduce the carbon activity a [ c ] on the surface of the metal alloy, contributing to the decarburisation process of the steel and potentially activating a type of pitting corrosion associated with x F e 3 C ( s ) concentrations of carbon in the alloy structure. The water vapour enhances this process, causing, in the Ia series for x F e C l 2 , an almost complete carbon burnout to a limit concentration (Equation (15)) x F e 3 C = 2.9 × 10⁻⁵. In contrast, a [ c ] in the liquid chloride limit ( x F e C l 2 ) increases and, at an initial 5% oxygen content (series I), approaches the stable equilibrium value of a [ c ] = 0.8773 resulting from the alloy composition. In the reduction region, represented by the calculation series (III–VI), for P O 2 o < 0.001 atm., as the initial pressure P O 2 o decreases, the factor a ¯ [ C ] increases from a value of 1 to 507 with the stable corrosion product FeCl2(s). For the liquid phase of FeCl2(l), the a ¯ [ C ] values are 4 times higher.
This degree of alloy surface supersaturation of F e F e 3 C carbon causes coke deposition at the metal–oxide interface contributing to metal dusting type of pitting corrosion. The determined concentration coordinates ( P H 2 ( g ) , P H 2 O ( g ) ) as a result of diffusion of all gaseous components of the Deacon reaction through the oxide layer and their interaction with the metallic phase of the alloy will determine the quasi-equilibrium state. Indeed, the equilibrium state at the Fe(s)-Fe3O4(s) interface is defined by reaction (Equation (11)), or, assuming an equilibrium oxygen concentration of l g P ¯ O 2 ( g ) (Table S3), by reaction (Equation (12)). The iron chloride phase FeCl2(s,l) in the solid or liquid state on the metal surface specifies the equilibrium chlorine concentrations l g P ¯ C l 2 ( g ) (Tables S5 and S37). Hydrogen chloride reaches equilibrium values that are a compilation of reactions (Equations (12) and (20)) expressed by the relation
l g P ¯ H C l ( g ) = 0.5 · l g P ¯ H 2 O ( g ) + l g a F e C l 2 l 0.8385
In contrast, l g P ¯ H 2 O ( g ) , l g P ¯ H 2 ( g ) resulting from reaction (Equation (12)) of the dissociation of water vapour is described by the equation
l g P ¯ H 2 ( g ) = l g P ¯ H 2 O ( g ) + 0.61205
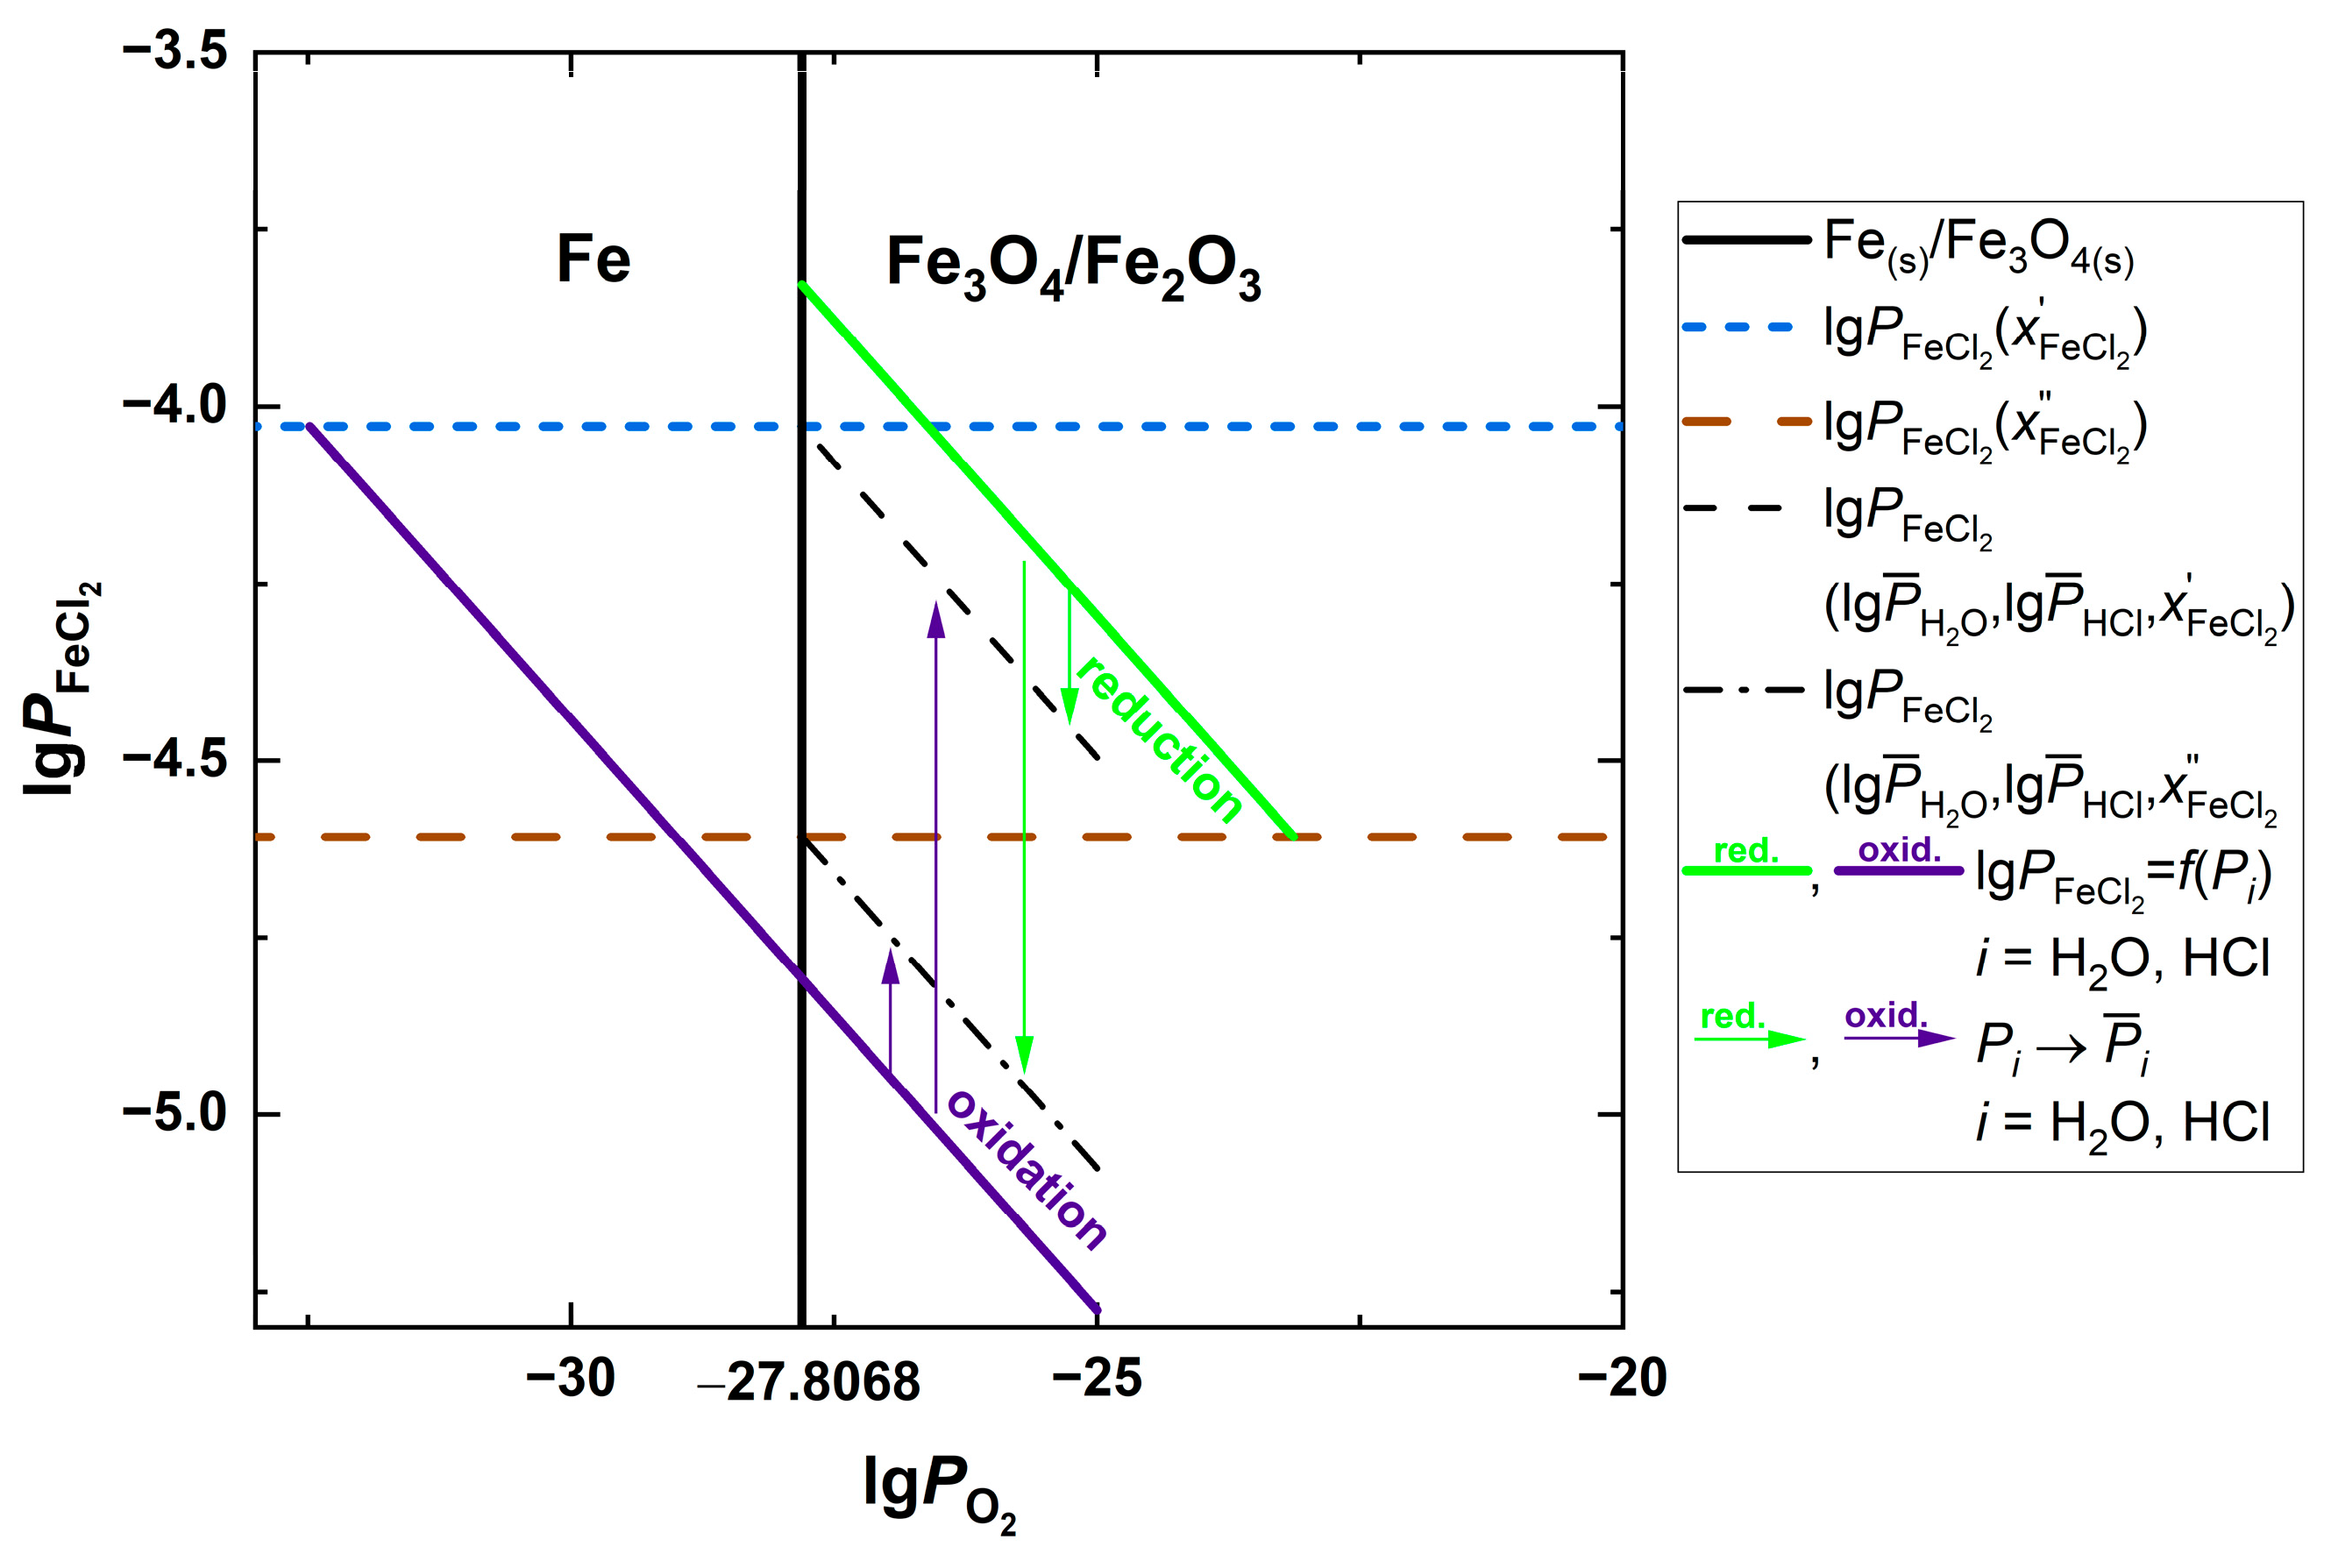
What matters is how the equilibrium conditions are reached from quasi-equilibrium states, i.e., the trajectory of these changes. For the reducing and oxidising regions, compositional changes from quasi-equilibrium partial pressures P i ( x F e C l 2 , x F e C l 2 ) to equilibrium P ¯ i occur in the following directions, respectively:
P i x F e C l 2 , x F e C l 2 P ¯ i F e 3 O 4 ( s ) r e d u c t i o n F e s ;     P H 2 O = P ¯ H 2 O = c o n s t ,   P H 2   P ¯ H 2               F e ( s )         o x i d a c i o n F e 3 O 4 ( s ) ; P H 2 = P ¯ H 2 = c o n s t ,   P H 2 O       P ¯ H 2 O
A limitation of this approach is the analysis of a fragment of the FeCl2(s,l)–Fe2O3(s) phase diagram (Tables S35 and S36) shown in Figure 6. Below P O 2 ( g ) o = 5 ppm, the stable phase is the chloride phase FeCl2(s,l) in equilibrium with the alloy Fe(s). The leading reaction appears to be the iron chloride formation reaction FeCl2(s,l) with an equilibrium constant K = 1015 between the metal phase and the gaseous chlorine. Relation (Equation (20)) as the sum of the FeCl2(s,l) formation reaction and the dissociation of gaseous HCl(g) of K = 10−13 (Tables S37 and S38) provides an equilibrium state between HCl(g)/H2(g), assuming the dissociation of H2O(g) with K = 10−14 being the source of hydrogen also specifying the oxygen conditions in the system. This is also indicated by the zero degree of conversion of η ¯ ( H C l ( g ) , H 2 ( g ) ) from a quasi-equilibrium state to an equilibrium state. It follows that, in the VI series, the P i parameters reflect the equilibrium state of the system P i = P ¯ i , and the predominant form of corrosion is chloride-induced corrosion with vapour pressures for the solid and liquid corrosion product P F e C l 2 ( s ) = 93.7 ppm and P F e C l 2 ( l ) = 24.7 ppm., respectively. In addition, due to the high degree of carbon supersaturation of the alloy surface a ¯ [ C ] = 507–1928, the final corrosion effects will be the result of chloride-induced corrosion and catastrophic metal dusting pitting corrosion compounded by the tendency of the creation of liquid sodium and iron chloride solution phases. In terms of the stability of the phases Fe(s)/Fe3O4(s) for the calculation series (III–V) of the reduction area, changes in the composition of the reactants occur along the line of constant concentration P H 2 O ( g ) = const. The equilibrium limit concentration ( P ¯ H C l ( g ) , P ¯ H 2 ( g ) ) was determined from relations (Equations (12) and (20)), for which the identity P H 2 ( g ) ( 20 ) = P ¯ H 2 ( g ) ( 12 ) is satisfied assuming l g P O 2 ( g ) = −27.8069. In this area, Cl2(g) is involved in the formation of chloride phases in addition to HCl(g) (Equation (20)), and the vapour synthesis of generated hydrogen and oxygen limited by the equilibrium Fe(s)/Fe3O4(s) contributes to this phenomenon.
The conversion rate η ¯ ( H C l ( g ) , H 2 ( g ) ) between the quasi-equilibrium ( n i ) , and equilibrium state ( n ¯ i ) is inversely proportional to the concentration of P H 2 O ( g ) . This means that highly reducing conditions in the gas phase activate the contribution of HCl(g) to chloride-induced corrosion. This phenomenon intensifies the transition of chloride phases to the liquid state. Reaching equilibrium states P ¯ i eliminates the threat of metal dusting corrosion by maintaining a stable equilibrium carbon activity value a [ c ] = 0.8773 in the metal surface zone. A similar mechanism of compositional change occurs for the series (II) reduction zone in the liquid chloride solution range limited by the activity a F e C l 2 ( l ) = 0.1796–0.097. The situation is different in the oxidation zone (series I, Ia, II) in which the equilibrium of the system is determined by the water vapour dissociation P H 2 O ( g ) P ¯ H 2 O ( g ) at a constant hydrogen concentration in the system P H 2 ( g ) = const. In this direction, the degree of conversion η ¯ H C l ( g ) = 0%, which indicates that chlorine gas Cl2(g) diffusing through the metal oxide layer to the alloy surface is the reactant determining chloride corrosion in the system. Hydrogen chloride affects P H 2 O ( g ) by stabilising P H 2 ( g ) in the direction of these changes. In addition to chloride-induced corrosion in this area, P H 2 O ( g ) can be a criterion for steam-enhanced oxide corrosion and an indicator of the susceptibility of the steel to pitting corrosion associated with decarburisation of the steel. The solubility of FeCl2(s) in the eutectic chloride solution favours the achievement of an equilibrium state in the system which, for example, occurs already for a F e C l 2 ( l ) = 0.1796 in series (II).

3.7. Verification of Iron Chloride Oxidation and Oxide Phase Expansion

According to the postulate of the active oxidation model, FeCl2(g) evaporating from the metal surface is oxidised while diffusing through the oxide layer into the gas phase accompanied by the release of Cl2(g). The cyclic nature of the phenomenon leaves active chlorine in circulation, promoting chloride-induced corrosion of iron. The morphology of the oxide phase formed during the oxidation of FeCl2(g) manifests different diffusion properties than the original passive layer resulting from oxygen corrosion deteriorating the corrosion resistance of the metal. The expansion of the oxide phase interpreted in the supplement (Tables S39 and S40) occurs under the oxygen conditions of the system for which the vapour pressure values of ferric chloride are lower than or equal to P F e C l 2 ( g ) P F e C l 2 ( g ) o from the saturated state resulting from the interfacial equilibrium μ F e C l 2 ( s , l ) = μ F e C l 2 ( g ) (Table 4). In the reduction region of quasi-equilibrium concentrations, the expansion of magnetite (Fe3O4(s)) occurs well above l g P ¯ O 2 , and in the case of the evaporation of FeCl2(l) at low H2O(g) , the haematite (Fe2O3(s)) will be the oxide to which iron chloride vapours are oxidised. For the oxidation region of both the solid and liquid states of FeCl2(s,l), the mass increase of magnetite occurs already from the equilibrium value l g P ¯ O 2 ( g ) characterising the equilibrium state of the phases Fe(s)/Fe3O4(s). Similarly, in equilibrium states, the oxidation of F e C l 2 g O 2 F e 3 O 4 s starts at the partial pressure P ¯ O 2 ( g ) of oxygen. Information characterising the oxidation of ferric chloride is provided in Table 11, and the schematic diagram is represented graphically (Figure 7).

4. Conclusions

The thermodynamic analysis presented showed the impact of all gas-phase components of the hydrogen chloride oxidation reaction on the corrosion phenomena of steel in the combustion of fuels containing chlorine compounds. Under the reducing conditions of the combustion process in power reactors, the chloride-induced corrosion form caused by gaseous Cl2(g) dominates at low oxygen concentrations. In this respect, the dissociation of water vapour and gaseous HCl(g) in contact with FeCl2(s,l) determines the hydrogen level, the oxygen conditions in the system and the degree of supersaturation of the metal surface with carbon; in addition, these processes are stimulated by the presence of NaCl(g) and its condensation on the metal surface resulting in the formation of a liquid chloride solution limiting the evaporation of ferric chloride. Higher oxygen concentrations in the gas phase of the fuel combustion reaction space favour oxide corrosion that determines the metal–oxide interface equilibrium. The concentrations of the reactants diffusing out of the gas phase at the metal–oxide interface determine the reducing or oxidising regions of the oxide corrosion process and, consequently, the various oxide corrosion activation mechanisms presented in this paper. In the reduction region, in addition to chlorine, the contribution of hydrogen chloride to the formation of iron chlorides increases. In the oxidising region, the role of steam in the corrosion process is activated. Also, the mechanism of oxide phase growth, as postulated by the active oxidation model, proceeds differently for the reducing and oxidising regions stimulated by the formation of liquid chloride solutions. In addition, the composition of the gaseous phase influences the morphology of the oxide phase, especially its passivation properties, adhesion phenomena at the metal–oxide interface stimulated by the formation of liquid chloride solutions and carburisation phenomena on the steel surface. The results of the thermodynamic analysis and the observations made may be helpful in modelling and interpreting the phenomenon of steel corrosion in fuel combustion processes and the thermal utilisation of waste containing chlorine compounds in power boilers. The determination of boundary conditions for the phenomena occurring at the metal–oxide interface and metal–oxide–gas phase interface is the basis for verifying the description of gaseous reactant diffusion processes through the scale oxide layer. The results can also be used in the interpretation of kinetic and diffusion effects in the gas-phase boundary layer in contact with the surface of a solid phase of the material exposed to corrosion attack. This is a novel research direction of the so-called dynamic approach to the problem of corrosion. The presented analysis is cognitively interesting for the subject matter widely discussed in the literature, as well as utilitarian for the technological pragmatism of the strategic issues of contemporary fuel combustion energy technology.

Supplementary Materials

The following supporting information can be downloaded at https://www.mdpi.com/article/10.3390/en17133223/s1, Table S1. Standard chemical potentials of pure components, for T = 800 K [62,63]. Table S2. The Deacon reaction (HCl–O2–H2O–Cl2)(g). Table S3. The range of persistence of the Fe(s)–Fe3O4(s) system. Table S4. The range of persistence of the Fe3O4(s)–Fe2O3(s) system. Table S5. The range of persistence of the Fe(s)–FeCl2(s) system. Table S6. The range of persistence of the FeCl2(s)–Fe3O4(s) system. Table S7. The range of persistence of the FeCl2(s)–Fe2O3(s) system. Table S8. Hydrogen production at Fe(s)/Fe3O4(s) interface, in Fe(s)–HCl(g) reaction, l g P H 2 = f ( l g P H C l ) . Table S9. Hydrogen partial pressure at Fe(s)/Fe3O4(s) interface, in Fe(s)–HCl(g) reaction, l g P H 2 = f ( l g P H C l ) . Table S10. Hydrogen pressure in iron oxidation, l g P H 2 = f l g P H 2 O . Table S11. Hydrogen pressure in magnetite oxidation, l g P H 2 = f l g P H 2 O . Table S12. The dissociation of water vapour. Table S13. The carbon content in the boiler steel. Table S14. Thermodynamic properties of the Fe–C system, l n γ F e 3 C = f T ,   x F e , a C = f ( T ,   x F e 3 C ) , T = 800 K [66]. Table S15. Oxidation of carbon in steel, at Fe(s)/Fe3O4(s) phase interface, P C O 2 = f ( P O 2 , a C ) . Table S16. Boudouard reaction at Fe(s)/Fe3O4(s) phase interface. Table S17. Influence of H2(g), CO(g), H2O(g) gas phase on the activity of carbon in steel at Fe(s)/Fe3O4(s) interface, l g a [ C ] = f l g P H 2 O , l g P H C l . Table S18. Carbon activity and carbon surface saturation coefficient of Fe(s)-Fe3C(s) alloy as a function of steam pressure and various HCl(g) partial pressures, a [ C ] = f l g P H 2 O , for P H C l = 500 – 3000 ppm. Table S19. Pressure of saturated chloride sodium vapour above solid NaCl. Table S20. Phase equilibrium of a Fe–O–Na2O system, l g a N a 2 O = f l g P O 2 , T = 800 K. Table S21. l g P N a C l = f l g a N a 2 O , l g P H 2 O , l g P H C l in thermodynamic interpretation of 2NaFeO2(s) production. Table S22. l g a N a 2 O = f P H 2 O , P N a C l , P H C l in thermodynamic interpretation of 2NaFeO2(s) production, for P N a C l = 100 ppm ( l g P N a C l = 4 ). Table S23. l g P N a C l = f P H 2 O in thermodynamic interpretation of 2NaFeO2(s) production, for P H C l = 1000 ppm and l g a N a 2 O = 10.359. Table S24. Standard chemical potential μ i ( s , l ) o = f T temperature function of i s , l = F e C l 2 , N a C l [63]. Table S25. The coordinates of the liquidus curve FeCl2–NaCl (pseudo-eutectic range) [94]. Table S26. Gibbs-Duhem equation of two components liquid solution l n γ i = f ( T , x i ) , i = 1, 2 [66]. Table S27. Calculation procedure of l n γ F e C l 2 = f ( T , x F e C l 2 ) , activity a F e C l 2 and x F e C l 2 , for hypoeutectic composition. Table S28. Calculation procedure of l n γ F e C l 2 = f ( T , x F e C l 2 ) , activity a F e C l 2 and x F e C l 2 , for hypereutectic composition. Table S29. Iron chloride activity for various concentration ( x F e C l 2 x F e C l 2 ) of FeCl2–NaCl liquid solution, for T = 800 K. Table S30. Hydrogen partial pressure above FeCl2–NaCl liquid solution, at metal–oxide interface, l g P H 2 = f ( l g P H C l , l g a F e C l 2 ( l ) ) . Table S31. Hydrogen partial pressure above FeCl2–NaCl liquid solution, at metal–oxide interface, l g P H 2 = f ( l g P H C l , l g a F e C l 2 ( l ) ) , for various concentration of HCl(g). Table S32. Pressure of iron chloride saturated vapour P F e C l 2 above FeCl2–NaCl liquid solution, l g P F e C l 2 = f a F e C l 2 l , for T = 800 K. Table S33. Pressure of iron chloride saturated vapour P F e C l 2 above FeCl2–NaCl liquid solution, l g P F e C l 2 = f a F e C l 2 l , for T = 800 K. Table S34. Parametric Equation Formalism [58,59,60,61]. Table S35. Fe–O phase diagram fragment, in a range of FeCl2(l)–Fe2O3(s) equilibrium. Table S36. Phase system of Fe–O in the range of FeCl2(l)–Fe2O3(s) equilibrium, l g P C l 2 = f ( l g P O 2 , l g a F e C l 2 c ) . Table S37. The range of persistence of the Fe(s)–FeCl2(l) system. Table S38. Equilibrium of HCl–Cl–H system. Table S39. Oxidation of iron chloride in the "active oxidation" model. Table S40. Oxidation of iron chloride in the "active oxidation" model, l g P F e C l 2 = f ( l g P O 2 ) . References [58,59,60,61,62,63,66,94] are cited in the Supplementary Materials.

Author Contributions

Conceptualisation, R.K.; data curation, R.K.; formal analysis, R.K.; funding acquisition, R.K.; investigation, R.K. and S.G.; methodology, R.K. and S.G.; project administration, R.K.; resources, R.K.; software, S.G.; supervision, R.K.; validation, R.K. and S.G.; visualisation, S.G.; writing—original draft, R.K.; writing—review and editing, R.K. and S.G. All authors have read and agreed to the published version of the manuscript.

Funding

The conducted research was financially supported by AGH University of Krakow (Grant AGH No. 16.16.210.476). This article was published with the support of the “Excellence Initiative—Research University” program for the AGH University of Krakow, Poland.

Data Availability Statement

The data presented in this study are presented in the Supplementary Materials.

Conflicts of Interest

The authors declare no conflicts of interest. The founding sponsors had no role in the design of the study; in the collection, analyses, or interpretation of data; in the writing of the manuscript; or in the decision to publish the results.

References

  1. European Commission. Renewable Energy Progress Report, Brussels. 2015. Available online: http://europa.eu/rapid/press-release_IP-15-5180_en.htm (accessed on 9 May 2024).
  2. European Commission; Joint Research Centre; Neuwahl, F.; Brinkmann, T.; Lecomte, T.; Pinasseau, A.; Delgado Sancho, L.; Canova, M.; Jankov, I.; Roudier, S.; et al. Best Available Techniques (BAT) Reference Document for Large Combustion Plants: Industrial Emissions Directive 2010/75/EU (Integrated Pollution Prevention and Control); Publications Office: Luxembourg, Luxembourg, 2017; Available online: https://data.europa.eu/doi/10.2760/949 (accessed on 9 May 2024).
  3. Baxter, L.L.; Miles, T.R.; Miles, T.R., Jr.; Jenkins, B.M.; Dayton, D.C.; Milne, T.A.; Bryers, R.W.; Oden, L.L. Alkali Deposits Found in Biomass Boilers: The Behavior of Inorganic Material in Biomass-Fired Power Boilers—Field and Laboratory Experiences; Office of Scientific and Technical Information: Oak Ridge, TN, USA, 1996; Volume 2. [Google Scholar] [CrossRef]
  4. Sander, B. Properties of Danish Biofuels and the Requirements for Power Production. Biomass Bioenergy 1997, 12, 177–183. [Google Scholar] [CrossRef]
  5. Kassman, H. Strategies to Reduce Gaseous KCl and Chlorine in Deposits during Combustion of Biomass in Fluidised Bed Boilers. Ph.D. Thesis, Chalmers University of Technology, Göteborg, Sweden, 2012. Available online: http://publications.lib.chalmers.se/records/fulltext/156235.pdf (accessed on 9 May 2024).
  6. Ruth, L.A. Energy from Municipal Solid Waste: A Comparison with Coal Combustion Technology. Prog. Energy Combust. Sci. 1998, 24, 545–564. [Google Scholar] [CrossRef]
  7. Zahs, A.; Spiegel, M.; Grabke, H.J. Chloridation and Oxidation of Iron, Chromium, Nickel and Their Alloys in Chloridizing and Oxidizing Atmospheres at 400–700 °C. Corros. Sci. 2000, 42, 1093–1122. [Google Scholar] [CrossRef]
  8. Karlsson, S.; Pettersson, J.; Johansson, L.-G.; Svensson, J.-E. Alkali Induced High Temperature Corrosion of Stainless Steel: The Influence of NaCl, KCl and CaCl2. Oxid. Met. 2012, 78, 83–102. [Google Scholar] [CrossRef]
  9. Folkeson, N.; Johansson, L.-G.; Svensson, J.-E. Initial Stages of the HCl-Induced High-Temperature Corrosion of Alloy 310. J. Electrochem. Soc. 2007, 154, C515. [Google Scholar] [CrossRef]
  10. Viklund, P. Superheater Corrosion in Biomass and Waste Fired Boilers. Characterisation, Causes and Prevention of Chlorine-Induced Corrosion. Ph.D. Thesis, KTH Royal Institute of Technology, Stockholm, Sweden, 2013. Available online: https://kth.diva-portal.org/smash/get/diva2:614735/INSIDE01.pdf (accessed on 9 May 2024).
  11. James, P.J.; Pinder, L.W. The Impact of Coal Chlorine on The Fireside Corrosion Behaviour of Boiler Tubing: A UK Perspective. In Proceedings of the Corrosion97, New Orleans, LA, USA, 9–14 March 1997; NACE-97133. Available online: https://onepetro.org/NACECORR/proceedings-abstract/CORR97/All-CORR97/113319 (accessed on 9 May 2024).
  12. Nakagawa, K.; Isozaki, T. Fireside corrosion in reducing waste incineration environments. In Proceedings of the Corrosion94, Baltimore, MD, USA, 28 February–4 March 1994; NACE-94177. Available online: https://www.osti.gov/biblio/70105 (accessed on 9 May 2024).
  13. Spiegel, M.; Schroer, C.; Grabke, H.J. Corrosion of High Alloy Steels and Fe-Cr-Alloys Beneath Deposits from Waste Incinerator Plants. Mater. Sci. Forum 1997, 251–254, 527–534. [Google Scholar] [CrossRef]
  14. Daniel, P.L.; Rapp, R.A. Halogen corrosion of metals. In Advances in Corrosion Science and Technology, 1st ed.; Fontana, M.G., Staehle, R.W., Eds.; Springer: Boston, MA, USA, 1976; Volume 5, pp. 55–172. ISBN 978-1-4615-9064-4. [Google Scholar] [CrossRef]
  15. Mayer, P.; Manolescu, A.V. Influence of Hydrogen Chloride on Corrosion of Boiler Steels in Synthetic Flue Gas. CORROSION 1980, 36, 369–373. [Google Scholar] [CrossRef]
  16. Strafford, K.N.; Datta, P.K.; Forster, G. High-Temperature Chloridation of Binary FeCr Alloys at 1000 °C. Mater. Sci. Eng. A 1989, 120–121, 61–68. [Google Scholar] [CrossRef]
  17. Hupa, M.; Backman, P.; Backman, R.; Tran, H. Reactions between iron and HCl-bearing gases. In Incinerating Municipal and Industrial Waste, Proceedings of the International Conference on Fireside Problems While Incinerating Municipal and Industrial Waste, Palm Coast, FL, USA, 8–12 October 1989; Bryers, R.W., Ed.; Hemisphere Pub. Corp.: New York, NY, USA, 1991; ISBN 1560321458. [Google Scholar]
  18. Kim, A.S.; McNallan, M.J. Mixed Oxidation of Iron–Chromium Alloys in Gases Containing Oxygen and Chlorine at 900 to 1200° K. CORROSION 1990, 46, 746–755. [Google Scholar] [CrossRef]
  19. Lee, S.Y.; McNallan, M.J. Formation of Condensed Chlorides During Mixed Oxidation-Chlorination of Iron at 1000 K. CORROSION 1991, 47, 868–874. [Google Scholar] [CrossRef]
  20. Haanappel, V.A.C.; Haanappel, N.W.J.; Fransen, T.; van Corbach, H.D.; Gellings, P.J. Corrosion Kinetics of Low- and High-Alloy Steels in Chlorine-Containing Gas Atmospheres. CORROSION 1992, 48, 812–821. [Google Scholar] [CrossRef]
  21. Chu, H.; Datta, P.K.; Gray, J.S.; Strafford, K.N. Corrosion Mechanism of Fe(Ni)25CrAIX Type Alloys in a Bioxidant Environment at Elevated Temperature. Corros. Sci. 1993, 35, 1091–1098. [Google Scholar] [CrossRef]
  22. Grabke, H.J.; Reese, E.; Spiegel, M. The Effects of Chlorides, Hydrogen Chloride, and Sulfur Dioxide in the Oxidation of Steels below Deposits. Corros. Sci. 1995, 37, 1023–1043. [Google Scholar] [CrossRef]
  23. Grabke, H.J. Fundamental mechanisms of the attack of chlorine, HCl on steels and high temperature alloys in the temperature range 400 °C and 900 °C. In Incinerating Municipal and Industrial Waste, Proceedings of the International Conference on Fireside Problems While Incinerating Municipal and Industrial Waste, Palm Coast, FL, USA, 8–12 October 1989; Bryers, R.W., Ed.; Hemisphere Pub. Corp.: New York, NY, USA, 1991; ISBN 1560321458. [Google Scholar]
  24. McNallan, M. High-temperature corrosion in halogen environments. Mater. Perform. 1994, 33, 9. [Google Scholar]
  25. Zahs, A.; Spiegel, M.; Grabke, H. The Influence of Alloying Elements on the Chlorine-Induced High Temperature Corrosion of Fe-Cr Alloys in Oxidizing Atmospheres. Mater. Corros. 1999, 50, 561–578. [Google Scholar] [CrossRef]
  26. Chang, Y.-N.; Wei, F.-I. High-Temperature Chlorine Corrosion of Metals and Alloys. J. Mater. Sci. 1991, 26, 3693–3698. [Google Scholar] [CrossRef]
  27. Wright, I.; Krause, H.H. Assessment of Factors Affecting Boiler Tube Lifetime in Waste Fired Steam Generators: New Opportunities for Research and Technology Development; Final Report; ASME: New York, NY, USA, 1996. Available online: https://www.nrel.gov/docs/legosti/fy96/21480.pdf (accessed on 9 May 2024).
  28. Ihara, Y.; Ohgame, H.; Sakiyama, K.; Hashimoto, K. The Corrosion Behaviour of Iron in Hydrogen Chloride Gas and Gas Mixtures of Hydrogen Chloride and Oxygen at High Temperatures. Corros. Sci. 1981, 21, 805–817. [Google Scholar] [CrossRef]
  29. Harb, J.; Smith, E. Fireside Corrosion in Pc-Fired Boilers. Prog. Energy Combust. Sci. 1990, 16, 169–190. [Google Scholar] [CrossRef]
  30. Spiegel, M. Einfluss der Veränderungen von gasförmigem Chloranteil und Rohrwandtemperaturen auf die Korrosion unter Belägen. In Proceedings of the VDI Wissensforum: Beläge und Korrosion in Großfeuerungsanlagen, Hannover, Germany, 25–26 April 2006. [Google Scholar]
  31. Bramhoff, D.; Grabke, H.J.; Reese, E.; Schmidt, H.P. Einfluß von HCl und Cl2 Auf Die Hochtemperaturkorrosion des 2 1/4 Cr 1 Mo-Stahls in Atmosphären Mit Hohen Sauerstoffdrücken. Mater. Corros. 1990, 41, 303–307. [Google Scholar] [CrossRef]
  32. Spiegel, M. Salt Melt Induced Corrosion of Metallic Materials in Waste Incineration Plants. Mater. Corros. 1999, 50, 373–393. [Google Scholar] [CrossRef]
  33. Uusitalo, M.; Vuoristo, P.M.; Mäntylä, T. High Temperature Corrosion of Coatings and Boiler Steels in Oxidizing Chlorine-Containing Atmosphere. Mater. Sci. Eng. A 2003, 346, 168–177. [Google Scholar] [CrossRef]
  34. Sánchez Pastén, M.; Spiegel, M. High Temperature Corrosion of Metallic Materials in Simulated Waste Incineration Environments at 300–600 °C. Mater. Corros. 2006, 57, 192–195. [Google Scholar] [CrossRef]
  35. Latreche, H.; Doublet, S.; Schütze, M. Development of Corrosion Assessment Diagrams for High Temperature Chlorine Corrosion Part II: Development of “Dynamic” Quasi-Stability Diagrams. Oxid. Met. 2009, 72, 31–65. [Google Scholar] [CrossRef]
  36. Li, Y.; Niu, Y.; Wu, W. Corrosion behavior of pure Cr and two Cr-containing alloys beneath ZnCl2 and KCl-ZnCl2 deposits. J. Chin. Soc. Corr. Pro. 2002, 22, 27–31. [Google Scholar]
  37. Saunders, S.R.J.; Gohil, D.D.; Banks, J.P.; Sheriff, M.U.; Tortorelli, P.F.; De Van, J.H.; Wright, I.G. Behaviour of Fecralloy and Iron Aluminides Alloys in Coal Gasification Atmospheres Containing HCI. Mater. Sci. Forum 1997, 251–254, 583–590. [Google Scholar] [CrossRef]
  38. Zhai, W.; Yang, B.; Zhang, S.; Ni, J.; Li, S.; Li, Y. Study on High Temperature Chlorination Corrosion of Metallic Materials on The Waste Incineration Boilers. IOP Conf. Ser. Earth Environ. Sci. 2020, 450, 012006. [Google Scholar] [CrossRef]
  39. Zhang, K.; Niu, Y.; Zeng, C.; Wu, W. Corrosion of Iron and four commercial steels in a Cl-containing oxidizing atmosphere at 500–600 °C. J. Mater. Sci. Technol. 2004, 20, 213–216. [Google Scholar]
  40. Skrifvars, B.-J.; Westén-Karlsson, M.; Hupa, M.; Salmenoja, K. Corrosion of Super-Heater Steel Materials under Alkali Salt Deposits. Part 2: SEM Analyses of Different Steel Materials. Corros. Sci. 2010, 52, 1011–1019. [Google Scholar] [CrossRef]
  41. Skrifvars, B.-J.; Backman, R.; Hupa, M.; Salmenoja, K.; Vakkilainen, E. Corrosion of Superheater Steel Materials under Alkali Salt Deposits Part 1: The Effect of Salt Deposit Composition and Temperature. Corros. Sci. 2008, 50, 1274–1282. [Google Scholar] [CrossRef]
  42. Li, Y.S.; Niu, Y.; Wu, W.T. Accelerated Corrosion of Pure Fe, Ni, Cr and Several Fe-Based Alloys Induced by ZnCl2–KCl at 450 °C in Oxidizing Environment. Mater. Sci. Eng. A 2003, 345, 64–71. [Google Scholar] [CrossRef]
  43. Salmenoja, K.; Hupa, M.; Backman, R. Laboratory Studies on the Influence of Gaseous HCl on Superheater Corrosion. In Impact of Mineral Impurities in Solid Fuel Combustion, 1st ed.; Gupta, R.P., Wall, T.F., Baxter, L., Eds.; Springer: Boston, MA, USA, 2002; pp. 513–523. ISBN 978-1-4757-8186-1. [Google Scholar] [CrossRef]
  44. Janz, G.J.; Allen, C.B.; Downey, J.R.; Tomkins, R.P.T. EUTECTIC DATA: Safety, Hazards, Corrosion, Melting Points, Compositions, and Bibliography; Technical Report; US Energy Research and Development Administration: Washington, DC, USA, 1976. Available online: https://www.osti.gov/biblio/7224996 (accessed on 9 May 2024).
  45. Pinch, H.L.; Hirshon, J.M. Thermal Analysis of the Ferrous Chloride-Potassium Chloride System 1a. J. Am. Chem. Soc. 1957, 79, 6149–6150. [Google Scholar] [CrossRef]
  46. Baxter, L.L.; Nielsen, H.P. The Effects of Fuel-Bound Chlorine and Alkali on Corrosion Initiation. Fuel Energy Abstr. 1997, 42, 1091–1095. [Google Scholar] [CrossRef]
  47. Michelsen, H.P. Deposition and High-Temperature Corrosion in Biomass-Fired Boilers. Ph.D. Thesis, Technical University of Denmark, Kongens Lyngby, Denmark, 1998. Available online: https://orbit.dtu.dk/en/publications/deposition-and-high-temperature-corrosion-in-biomass-fired-boiler (accessed on 9 May 2024).
  48. Hossain, M.K.; Noke, A.C.; Saunders, S.R.J. Oxidation of a Ni-Cr-Al Alloy at 850 °C in Air Containing HCl Gas. Oxid. Met. 1978, 12, 451–471. [Google Scholar] [CrossRef]
  49. Hancock, P. Vanadic and Chloride Attack of Superalloys. Mater. Sci. Technol. 1987, 3, 536–544. [Google Scholar] [CrossRef]
  50. Alexander, P.A. Laboratory Studies of the Effects of Sulphates and Chlorides on the Oxidation of Superheater Alloys. In The Mechanism of Corrosion by Fuel Impurities, Proceedings of the Marchwood International Conference on the Mechanism of Corrosion by Fuel Impurities, Marchwood, UK, 20–24 May 1963; Johnson, H.R., Littler, D.J., Eds.; Butterworths: London, UK, 1963. [Google Scholar]
  51. Gotthjælp, K.; Brøndsted, P.; Jansen, P.; Markussen, J.; Montgomery, M.; Maahn, E. High Temperature Corrosion in Biomass Incineration Plants; Final Report; Risø National Laboratory: Roskilde, Denmark, 1997. Available online: https://www.osti.gov/etdeweb/servlets/purl/510219 (accessed on 9 May 2024).
  52. Miller, P.D.; Krause, H.H.; Zupan, J.; Boyd, W.K. Corrosive Effects of Various Salt Mixtures Under Combustion Gas Atmospheres. CORROSION 1972, 28, 222–225. [Google Scholar] [CrossRef]
  53. John, R.C. Alloy Corrosion in Reducing plus Sulfidizing Gases at 600–950 °C. In High Temperature Corrosion in Energy Systems; Rothman, M.F., Ed.; Metallurgical Society of AIME: Warrendale, PA, USA, 1985; ISBN 9780895204905. [Google Scholar]
  54. Paul, L.D.; Daniel, P.L. Corrosion Mechanisms in oxidizing, reducing and alternating combustion gases in refuse-fired boiler environments. In Proceedings of the Corrosion93, New Orleans, LA, USA, 8–12 March 1993. NACE 93-216. [Google Scholar]
  55. Shinata, Y.; Takahashi, F.; Hashiura, K. NaCl-Induced Hot Corrosion of Stainless Steels. Mater. Sci. Eng. 1987, 87, 399–405. [Google Scholar] [CrossRef]
  56. Spiegel, M.; Grabke, H.J. High temperature corrosion of low and high alloy Steels in simulated waste incineration atmospheres. In Incinerating Municipal and Industrial Waste, Proceedings of the International Conference on Fireside Problems While Incinerating Municipal and Industrial Waste, Palm Coast, FL, USA, 8–12 October 1989; Bryers, R.W., Ed.; Hemisphere Pub. Corp.: New York, NY, USA, 1991; ISBN 1560321458. [Google Scholar]
  57. Nicholls, J.R.; Newton, R.; Simms, N.J.; Norton, J.F. Modelling the Oxidation of FeCrAl-RE ODS Alloys in Simulated Natural Gas Combustion Environments. Mater. High. Temp. 2003, 20, 93–108. [Google Scholar] [CrossRef]
  58. Ptak, W.; Sukiennik, M. Changes in the composition of the gaseous phase of a system resulting from the process of a chemical reaction. Bull. Acad. Pol. Sci. 1969, 17, 21–25. [Google Scholar]
  59. Ptak, W.; Sukiennik, M.; Olesinski, R.; Kaczmarczyk, R. Deformation of a properties resulting from a chemical reaction stoichiometry. Arch. Metall. 1987, 32, 355–362. [Google Scholar]
  60. Kaczmarczyk, R.; Gurgul, S. Model Approach of Carbon Deposition Phenomenon in Mixed H2O/CO2 Methane Reforming Process. Arch. Metall. Mater. 2014, 59, 1379–1383. [Google Scholar] [CrossRef]
  61. Kaczmarczyk, R.; Gurgul, S. Model Approach of Carbon Deposition Phenomenon in Steam and Dry Methane Reforming Process. Arch. Metall. Mater. 2014, 59, 145–148. [Google Scholar] [CrossRef]
  62. Knacke, O.; Kubaschewski, O.; Hesselmann, K. Thermochemical Properties of Inorganic Substaces, 2nd ed.; Springer: Berlin/Heidelberg, Germany, 1991; ISBN 9783540540144. [Google Scholar]
  63. HSC Chemistry, Version 10.0. Metso Outotec, Espoo, Finland. Available online: http://www.hsc-chemistry.com/ (accessed on 9 May 2024).
  64. Chipman, J. Thermodynamics and Phase Diagram of the Fe-C System. Metall. Trans. 1972, 3, 55–64. [Google Scholar] [CrossRef]
  65. Richardson, F.D. The thermodynamics of metallurgical carbides and of carbon in iron. J. Iron Steel Inst. 1953, 175, 33–51. [Google Scholar]
  66. Krupkowski, A. Podstawowe Zagadnienia Teorii Procesów Metalurgicznych, 1st ed.; PWN: Warsaw, Poland, 1974. [Google Scholar]
  67. Grabke, H.; Schütze, M. Corrosion by Carbon and Nitrogen: Metal Dusting, Carburisation and Nitridation, 1st ed.; Woodhead Publishing: Sawston, UK; Cambridge, UK, 2007; ISBN 9781845692322. [Google Scholar]
  68. Hochman, R.F. Catastrophic deterioration of high temperature alloys in carbonaceous atmospheres. In Proceedings of the Symposium on Properties of High Temperature Alloys, with Emphasis on Environmental Effects, Proceedings of the Electrochemical Society Meeting, Las Vegas, NV, USA, 17 October 1976; Foroulis, Z.A., Pettit, F.S., Eds.; Electrochemical Society: Princeton, NJ, USA, 1977; pp. 715–732. [Google Scholar]
  69. Grabke, H.J.; Krajak, R.; Müller-Lorenz, E.M. Metal Dusting of High Temperature Alloys. Mater. Corros. 1993, 44, 89–97. [Google Scholar] [CrossRef]
  70. Grabke, H.J. Thermodynamics, Mechanisms and Kinetics of Metal Dusting. Mater. Corros. 1998, 49, 303–308. [Google Scholar] [CrossRef]
  71. Grabke, H.J.; Müller-Lorenz, E.M.; Eltester, B.; Lucas, M. Formation of Chromium Rich Oxide Scales for Protection against Metal Dusting. Mater. High. Temp. 2000, 17, 339–345. [Google Scholar] [CrossRef]
  72. Pippel, E.; Woltersdorf, J.; Schneider, R. Micromechanisms of Metal Dusting on Fe-Base and Ni-Base Alloys. Mater. Corros. 1998, 49, 309–316. [Google Scholar] [CrossRef]
  73. Chun, C.M.; Mumford, J.D.; Ramanarayanan, T.A. Mechanisms of Metal Dusting Corrosion of Iron. J. Electrochem. Soc. 2002, 149, B348. [Google Scholar] [CrossRef]
  74. Chun, C.M.; Mumford, J.D.; Ramanarayanan, T.A. Carbon-Induced Corrosion of Nickel Anode. J. Electrochem. Soc. 2000, 147, 3680. [Google Scholar] [CrossRef]
  75. Chun, C.M.; Mumford, J.D.; Ramanarayanan, T.A. Metal Dusting Corrosion of Cobalt. J. Electrochem. Soc. 2003, 150, B76. [Google Scholar] [CrossRef]
  76. Zhang, J.; Schneider, A.; Inden, G. Characterisation of the Coke Formed during Metal Dusting of Iron in CO–H2–H2O Gas Mixtures. Corros. Sci. 2003, 45, 1329–1341. [Google Scholar] [CrossRef]
  77. Zeng, Z.; Natesan, K.; Maroni, V. Investigation of metal-dusting mechanism in Fe-base alloys using raman spectroscopy, X-ray diffraction, and electron microscopy. Oxid. Met. 2002, 58, 147–170. [Google Scholar] [CrossRef]
  78. Zeng, Z.; Natesan, K. Relationship of Carbon Crystallization to the Metal-Dusting Mechanism of Nickel. Chem. Mater. 2003, 15, 872–878. [Google Scholar] [CrossRef]
  79. Toh, C.H.; Munroe, P.R.; Young, D.J. The Role of Cementite in the Metal Dusting of Fe–Cr and Fe–Ni–Cr Alloys. Mater. High. Temp. 2003, 20, 527–534. [Google Scholar] [CrossRef]
  80. Toh, C.; Munroe, P.; Young, D. Metal Dusting of Fe–Cr and Fe–Ni–Cr Alloys Under Cyclic Conditions. Oxid. Met. 2002, 58, 1–21. [Google Scholar] [CrossRef]
  81. Gao, W.; Li, Z. Developments in High Temperature Corrosion and Protection of Materials, 1st ed.; Woodhead Publishing: Sawston, UK; Cambridge, UK, 2008; ISBN 9781845692193. [Google Scholar]
  82. Cottis, R.; Graham, M.; Lindsay, R.; Lyon, S.; Richardson, J.; Scantlebury, J.; Stott, F. Shreir’s Corrosion, 1st ed.; Elsevier: Amsterdam, The Netherlands, 2010; Volume 1, ISBN 978-0-444-52787-5. [Google Scholar]
  83. Szakálos, P. Mechanism of Metal Dusting. Ph.D. Thesis, KTH Royal Institute of Technology, Stockholm, Sweden, 2004. Available online: https://kth.diva-portal.org/smash/get/diva2:9563/FULLTEXT01.pdf (accessed on 9 May 2024).
  84. Wagner, C. Beitrag Zur Theorie Des Anlaufvorganges. II. Z. Für Phys. Chem. 1936, 32B, 447–462. [Google Scholar] [CrossRef]
  85. Norby, T. Wagner-type theory for oxidation of metals with co-transport of hydrogen ions. In High Temperature Corrosion and Materials Chemistry, Proceedings of the Per Kofstad Memorial Symposium on High Temperature Corrosion and Materials Chemistry, 1999 Joint International Meeting, Honolulu, HI, USA, 17–22 October 1999; McNallan, M., Opila, E., Maruyama, T., Narita, T., Eds.; The Electrochemical Society, Inc.: Pennington, NJ, USA, 2000; ISBN 9781566772617. [Google Scholar]
  86. Kofstad, P. High Temperature Corrosion, 2nd ed.; Elsevier Applied Science: London, UK, 1988; ISBN 9781851661541. [Google Scholar]
  87. Khanna, A.S. Introduction to High Temperature Oxidation and Corrosion, 1st ed.; ASM International: Materials Park, OH, USA, 2002; ISBN 9780871707628. [Google Scholar]
  88. Grabke, H.J.; Grassl, D.; Hoffmann, F.; Liedtke, D.; Neumann, F.; Schachinger, H.; Weissohn, K.-H.; Wünning, A.; Wyss, U.; Zoch, H.-W. Die Prozeßregelung beim Gasaufkohlen und Einsatzhärten; Expert: Tübingen, Deutschland, 1997; ISBN 9783816914549. [Google Scholar]
  89. Grabke, H.J. Carburization: A High Temperature Corrosion Phenomenon, 1st ed.; Material Technology Institute of the Chemical Process Industries: St. Louis, MO, USA, 1998; ISBN 9781576980156. [Google Scholar]
  90. Grabke, H.J. Corrosion by Carbonaceous Gases, Carburization and Metal Dusting, and Methods of Prevention. Mater. High. Temp. 2000, 17, 483–487. [Google Scholar] [CrossRef]
  91. Birks, N.; Meier, G.H.; Pettit, F.S. Introduction to the High Temperature Oxidation of Metals, 2nd ed.; Cambridge University Press: Cambridge, UK, 2006; ISBN 9781139163903. [Google Scholar] [CrossRef]
  92. Young, D.J. High Temperature Oxidation and Corrosion of Metals, 2nd ed.; Elsevier Science: Amsterdam, The Netherlands, 2016; ISBN 978-0-08-100101-1. [Google Scholar] [CrossRef]
  93. Masuko, N. Metallurgical Chemistry in My Life. Mater. Trans. 2004, 45, 2489–2495. [Google Scholar] [CrossRef]
  94. Bale, C.W.; Bélisle, E.; Chartrand, P.; Decterov, S.A.; Eriksson, G.; Gheribi, A.E.; Hack, K.; Jung, I.-H.; Kang, Y.-B.; Melançon, J.; et al. FactSage Thermochemical Software and Databases, 2010–2016. Calphad 2016, 54, 35–53. [Google Scholar] [CrossRef]
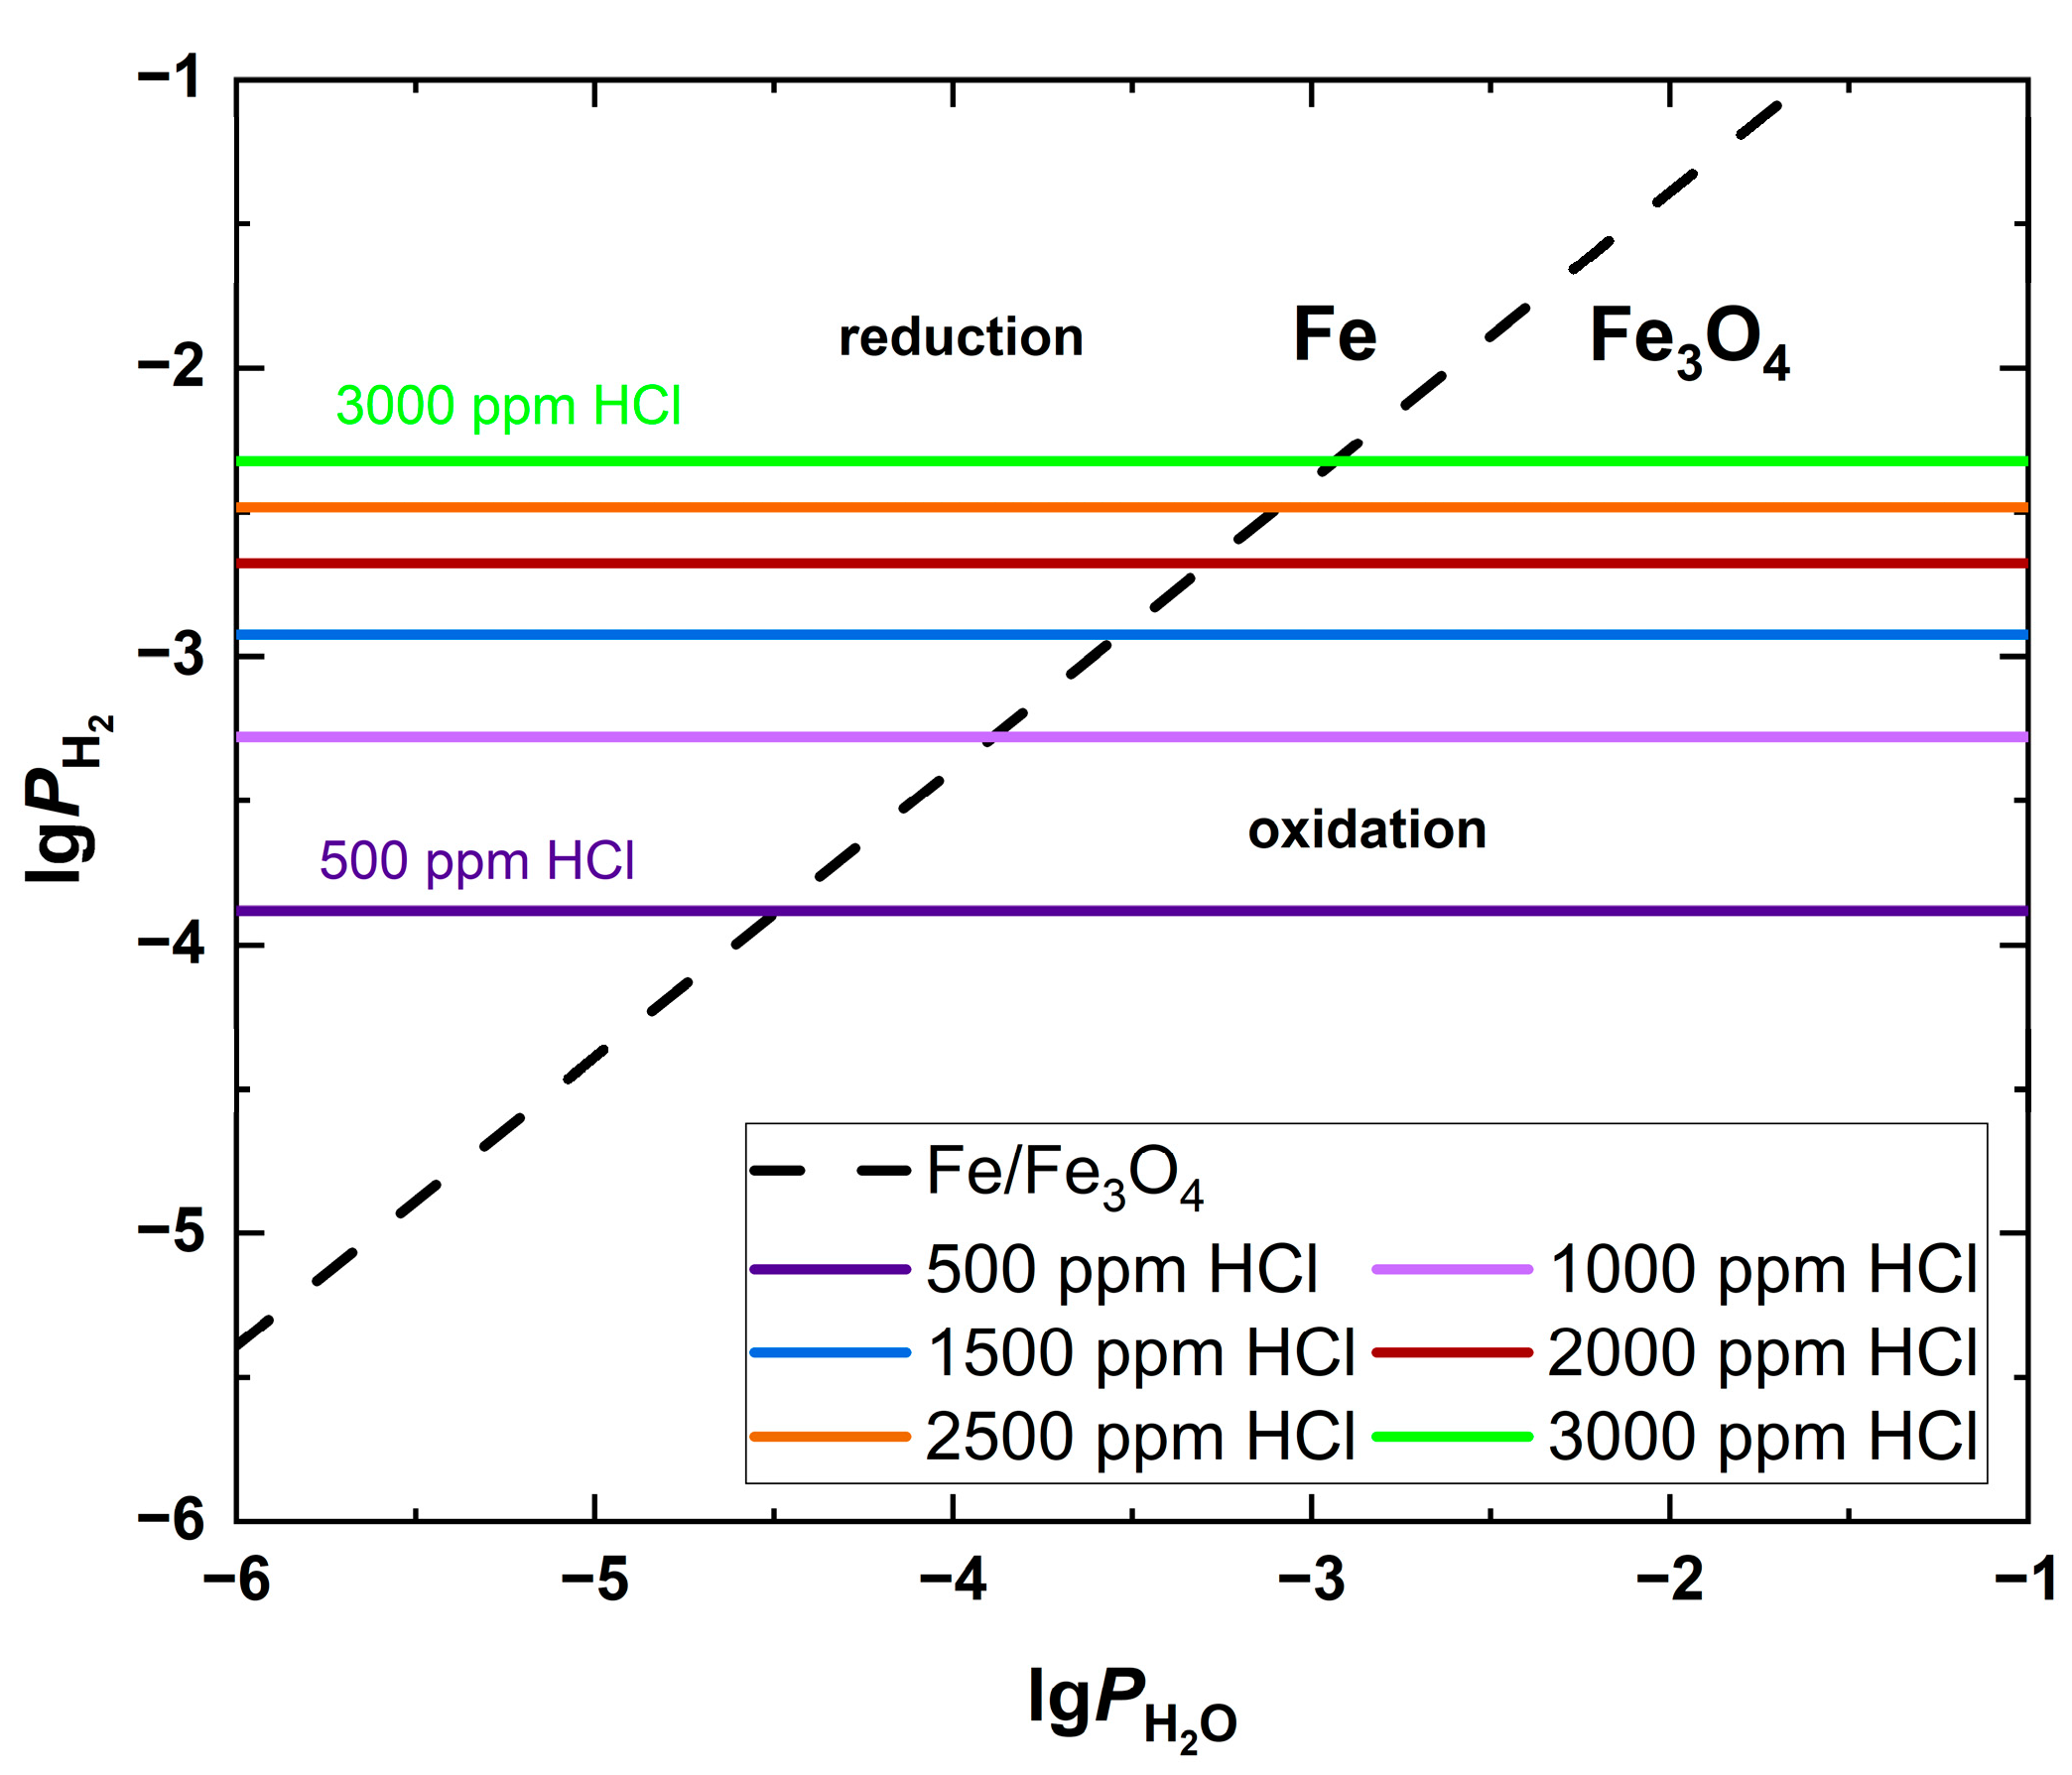
Figure 1. The reducing and oxidising region of the gas phase for the reaction 3 F e ( s ) + 4 H 2 O ( g ) = F e 3 O 4 ( s ) + 4 H 2 ( g ) (Equation (11)) with hydrogen pressure for various partial pressures of HCl(g). l g P H 2 = f ( l g P H 2 O ) .
Energies 17 03223 g001
Figure 2. (a) Carbon activity values calculated for various pressures of H2O(g) and HCl(g); (b) close-up of the carbon activity values. a [ C ] = f l g P H 2 O ( g ) , for P H C l ( g ) = 500–3000 ppm.
Energies 17 03223 g002
Figure 3. The equilibrium composition of the Deacon reaction l g P i = f l g P O 2 ( g ) o , i = (HCl(g), O2(g), H2O(g), Cl2(g)), for P H C l ( g ) o = 3000 ppm, for various calculation series: I–VI.
Energies 17 03223 g003
Figure 4. (a) Conversion rate for HCl(g) and O2(g); (b) yield for H2O(g) and Cl2(g), in the Deacon reaction, for various calculation series: I–VI.
Energies 17 03223 g004
Figure 5. Hydrogen pressure as a function of water vapour l g P H 2 ( g ) = f l g P H 2 O ( g ) , for x F e C l 2 and x F e C l 2 .
Energies 17 03223 g005
Figure 6. Fe-O-Cl phase diagram fragment.
Energies 17 03223 g006
Figure 7. The oxidation of ferric chloride l g P F e C l 2 = f ( l g P O 2 ) .
Energies 17 03223 g007
Table 1. Composition of flue gases in coal, biomass and waste-fired boilers [5,6,7,8,9,10].
FuelO2 [%]CO2 [%]H2O [%]SO2 [ppm]HCl [ppm]KCl+NaCl [ppm]
Coal~4–5~12~4–16~400–1200~10–50-
Biomass~5–10~8–15~10–20~0–70~25–1000~5–50
Waste~5–11~8–14~10–20~0–150~250–1300<120
Table 2. Carbon activity values calculated for various pressures of H2O(g) and HCl(g). a [ C ] = f l g P H 2 O ( g ) , for P H C l ( g ) = 500–3000 ppm.
l g P H 2 O ( g ) a [ C ] ,   a ¯ [ C ] 1
HCl(g) 500 ppmHCl(g) 1000 ppmHCl(g) 1500 ppmHCl(g) 2000 ppmHCl(g) 2500 ppmHCl(g) 3000 ppm
−12.8 × 10−41.13 × 10−30.00250.00450.00710.0102
−22.8 × 10−30.01130.02540.04520.07060.1017
−30.02830.1130.25430.45220.70651.02
−40.28261.132.544.527.0610.17
−52.811.325.445.270.6101.7
−6281132544527061017
Table 3. Hydrogen pressure produced by reaction F e ( s ) + 2 H C l ( g ) = F e C l 2 l [ F e C l 2 N a C l ] ( l ) + H 2 ( g ) (Equation (20)) l g P H 2 ( g ) = f ( l g P H C l ( g ) , l g a F e C l 2 ( l ) ) .
x F e C l 2 l g a F e C l 2 ( l ) l g P H 2 ( g ) / P H 2 ( g ) [ p p m ]
1000 ppm
l g P H C l ( g ) = 3
2000 ppm
l g P H C l ( g ) = 2.699
3000 ppm
l g P H C l ( g ) 2.523
x F e C l 2 = 0.6147 −0.4333−3.278/527−2.676/2109−2.324/4742
x F e C l 2 = 0.3858 −1.0131−2.698/2004−2.096/8017−1.744/18,030
Table 4. Decrease in saturated vapour pressure of iron chloride as a function of FeCl2(l) activity. P F e C l 2 = f a F e C l 2 l , T = 800   K .
x F e C l 2 l g a F e C l 2 ( l ) l g P F e C l 2 ( g ) P F e C l 2 ( g ) [ p p m ]
x F e C l 2 = 0.6147 −0.4333 4.0282 93.7
x F e C l 2 = 0.3858 −1.0131 4.608 24.7
Table 5. The initial composition of the x i o gas phase i = (HCl(g), O2(g), H2O(g), Cl2(g), N2(g)) for various calculation series: I–VI.
i x i o
IIaIIIIIIVVVI
H C l 0.0030.0030.0030.0030.0030.0030.003
O 2 0.050.050.010.0010.00010.000010.000001
H 2 O 00.3500000
C l 2 0000000
N 2 x N 2 ( g ) o = 1 x H C l ( g ) o x O 2 ( g ) o x H 2 O ( g ) o x C l 2 ( g ) o
Table 6. Formalism of the Deacon’s reaction vector equations in the gas phase (HCl(g), O2(g), H2O(g), Cl2(g), N2(g)).
i ν i i = 1 s ν i = 0.5 x ¯ i = ν i i = 1 s ν i x i = x i o + τ x ¯ i x i o
H C l ( g ) −24 x H C l ( g ) = x H C l ( g ) o + 4 x H C l ( g ) o τ
O 2 ( g ) −0.51 x o 2 ( g ) = x o 2 ( g ) o + 1 x o 2 ( g ) o τ
H 2 O ( g ) 1−2 x H 2 O ( g ) = x H 2 O ( g ) o + 2 x H 2 O ( g ) o τ
C l 2 ( g ) 1−2 x C l 2 ( g ) = x C l 2 ( g ) o + 2 x C l 2 ( g ) o τ
N 2 ( g ) 00 x N 2 ( g ) = x N 2 ( g ) o x N 2 ( g ) o τ
Table 7. The equilibrium composition of the Deacon reaction l g P i = f l g P O 2 ( g ) o , i = (HCl(g), O2(g), H2O(g), Cl2(g)), for P H C l ( g ) o = 3000 ppm, for various calculation series: I–VI.
l g P i IIaIIIIIIVVVI
l g P O 2 ( g ) o −1.3010−1.3010−2−3−4−5−6
l g P H 2 O ( g ) o -−0.4559-----
l g P O 2 ( g ) −1.3045−1.3011−2.0151−3.1158−5.1447−9.2218−13.2427
l g P C l 2 ( g ) −3.0732−4.9763−3.1599−3.3292−3.7312−4.6990−5.6990
l g P H 2 O ( g ) −3.0732−0.4559−3.1599−3.3292−3.7312−4.6990−5.6990
l g P H C l ( g ) −2.8822−2.5259−2.7913−2.6854−2.5802−2.5287−2.5235
Table 8. Conversion rate for HCl(g) and O2(g) and yield for H2O(g) and Cl2(g) in the Deacon reaction, for various calculation series: I–VI.
Gas
Composition
η O 2 = n O 2 ( g ) o n O 2 ( g ) n O 2 ( g ) o η H C l = n H C l ( g ) o n H C l ( g ) n H C l ( g ) o y C l 2 = 2 n C l 2 ( g ) n C l 2 ( g ) o n H C l ( g ) o y H 2 O = 2 n H 2 O ( g ) n H 2 O ( g ) o n H C l ( g ) o
I0.86%57.31%57.31%57.31%
Ia0.01%0.76%0.76%0.76%
II3.53%47.14%47.14%47.14%
III24.06%32.08%32.08%32.08%
IV93.67%12.49%12.49%12.49%
V99.99%1.33%1.33%1.33%
VI100%0.13%0.13%0.13%
Table 9. The change in parameters P i P ¯ i from quasi-equilibrium state for x F e C l 2 , for various calculation series: I–VI.
x F e C l 2
ParametersIIaIIIIIIVVVI
l g P H 2 ( g ) −3.0424−2.3298−2.8606−2.6488−2.4384−2.3354−2.325
l g P O 2 ( g ) −26.6444−22.835−27.1814−27.9436−29.1684−31.3100−33.3308
l g a [ c ] −0.6381−2.5428−0.36960.01150.62391.69472.7051
a [ c ] 0.23010.002860.4270 1 1 1 1
a ¯ [ c ] 1 ---1.034.2149.51507.11
l g P ¯ C l 2 ( g ) 15.7129 15.7129 15.7129 15.7129 15.7129 15.7129 15.7129
l g P ¯ O 2 ( g ) −27.8069−27.8069−27.8069−27.8069−27.8069−27.8069−33.3308
l g P ¯ H C l ( g ) −2.8822−2.5259−2.7913−2.7197−2.9207−3.4046−2.5235
l g P ¯ H 2 O ( g ) −3.6544−2.9418−3.4726−3.3292−3.7312−4.6990−5.6990
l g P ¯ H 2 ( g ) −3.0424−2.3298−2.8606−2.7171−3.1192−4.0869−2.325
η ¯ H C l ( g ) 0%0%0%7.6%54.3%86.7%0%
η ¯ H 2 ( g ) 0%0%0%14.5%79.1%98%0%
Table 10. The change in parameters P i P ¯ i from quasi-equilibrium state for x F e C l 2 , for various calculation series: I–VI.
x F e C l 2
ParametersIIaIIIIIIVVVI
l g P H 2 ( g ) −2.4623−1.7497−2.2805−2.0687−1.8583−1.7553−1.7449
l g P O 2 ( g ) −27.8046−23.9952−28.3256−29.1038−30.3286−32.4702−34.491
l g a [ c ] −0.058−1.96270.21050.59161.2042.27483.2852
a [ c ] 0.875 0.0109 1 1 1 1 1
a ¯ [ c ] 1 --1.623.9015.99188.281928.41
l g P ¯ C l 2 ( g ) −16.2927−16.2927−16.2927−16.2927−16.2927−16.2927−16.2927
l g P ¯ O 2 ( g ) −27.8069−27.8069−27.8069−27.8069−27.8069−27.8069−34.491
l g P ¯ H C l ( g ) −2.8822−2.5259−2.925−3.0096−3.2106−3.6945−2.5235
l g P ¯ H 2 O ( g ) −3.0743−2.3617−3.1599−3.3292−3.7312−4.6990−5.6990
l g P ¯ H 2 ( g ) −2.4623−1.7497−2.5478−2.7171−3.1191−4.0869−1.7449
η ¯ H C l g 0%0%26.5%52.6%76.6%93.2%0%
η ¯ H 2 ( g ) 0%0%45.9%77.5%94.5%99.5%0%
Table 11. The oxidation of ferric chloride, for various calculation series: I–VI.
F e C l 2 ( s , l ) l g P O 2 ( g )
F e C l 2 g O 2 ( g ) ( F e 3 O 4 s / F e 2 O 3 s ) C l 2 ( g ) x F e C l 2 , l g P C l 2 ( g ) = 4.028 x F e C l 2 l g P C l 2 ( g ) = 4.608
IIaIIIIIIVV
x F e C l 2 −31.278−42.706−29.667−27.380−23.706−17.281
x F e C l 2 −27.807−39.227−26.188−23.902−20.227−13.802
Disclaimer/Publisher’s Note: The statements, opinions and data contained in all publications are solely those of the individual author(s) and contributor(s) and not of MDPI and/or the editor(s). MDPI and/or the editor(s) disclaim responsibility for any injury to people or property resulting from any ideas, methods, instructions or products referred to in the content.