Article

Convection Heat-Transfer Characteristics of Supercritical Pressure RP-3 in Horizontal Microchannels

1
State Key Laboratory of Eco-Hydraulics in Northwest Arid Region of China, Xi’an University of Technology, Xi’an 710048, China
2
Qingdao Warbus Intelligent Experiment Technology Co., Ltd., Qingdao 266100, China
*
Author to whom correspondence should be addressed.
Energies 2024, 17(13), 3247; https://doi.org/10.3390/en17133247
Submission received: 30 April 2024 / Revised: 28 June 2024 / Accepted: 29 June 2024 / Published: 2 July 2024
(This article belongs to the Special Issue Thermal Management and Heat Transfer Study in Aero-Devices)

Abstract

:
To enhance the heat-transfer performance of scramjet engines, a numerical simulation was conducted on the heat-transfer process of RP-3 aviation kerosene under supercritical pressure within a horizontal micro-fine circular tube. The intrinsic mechanism of the heat-transfer process was analyzed, summarizing the impacts of mass flux, inlet temperature, and gravitational acceleration. Furthermore, four commonly used buoyancy criterion numbers were compared and evaluated. The results indicate that the heat-transfer process can be divided into five phases: heating inlet phase, normal heat-transfer phase, heat-transfer deterioration phase, heat-transfer enhancement phase, and high-temperature normal heat-transfer phase. The heating inlet phase is significantly influenced by the inlet temperature, while the heat-transfer deterioration is affected both by the thermal property variations of the aviation kerosene and the buoyancy effects. Lower mass flux and hypergravity conditions all exacerbate heat-transfer deterioration. Inlet temperature, however, does not affect the heat-transfer pattern. Among the criteria, Grq/Grth provides the best prediction of buoyancy effects in horizontal circular tubes.

1. Introduction

Hypersonic vehicles are currently a focal point in the development of near-space vehicles, as the high velocity airstreams associated with their operation introduce substantial aerothermal loads. Specifically, at a Mach number of 12, the outer temperature of a scramjet engine can reach up to 4950 K, which places extremely high demands on the engine’s cooling capabilities [1,2]. Regenerative cooling systems, proposed as an effective thermal management solution, operate by using heat-absorbing hydrocarbon fuels as coolants. Before reaching the combustion chamber, these coolants flow through channels in the walls, removing some heat through convective heat transfer [3,4]. During flight, the high-temperature and high-pressure environment often causes hydrocarbon fuels to be in a supercritical state. The physical properties of these fuels exhibit anomalous changes near the pseudo-critical temperature (TPC), and the high-velocity flow within microchannels makes the heat-transfer process even more complex [5,6,7,8]. Therefore, experimental and simulation studies on the convective heat transfer of supercritical hydrocarbon fuels hold significant importance.
In recent years, research on supercritical fluids has primarily focused on vertical tubes. Zhang et al. [9] found that, during the heat-transfer deterioration phase, although changes in density, heat capacity, and thermal conductivity are conducive to heat transfer, buoyancy and chemical reactions lead to the deterioration of heat transfer. Ren et al. [10] performed a simulation on the heat-transfer processes of supercritical RP-3 aviation kerosene in a vertical tube and discovered that the significant reductions in density and viscosity, along with a substantial increase in heat capacity when the mainstream reaches the pseudo-critical temperature, are the primary reasons for enhanced heat transfer. Following experimental studies on RP-3, Wang et al. [11] noted that increasing the mass flow rate could suppress thermoacoustic instability, stabilizing the system. Huang et al. [12] conducted experiments with supercritical RP-3 flowing upward in a vertical tube and observed that the inner wall temperature initially increases, then decreases along the length of the tube, and finally increases again near the outlet. This pattern indicates that the heat-transfer coefficient is adversely affected by the buoyancy near the outlet. These studies collectively highlight the complex nature of heat transfer in supercritical fluids and underscore the imperative to optimize parameters, such as flow orientation, mass flow rates, and tube configuration, to mitigate deterioration and enhance the stability of thermal systems under extreme conditions.
The heat-transfer characteristics of supercritical fluids in horizontal tubes differ significantly from those in vertical tubes, primarily due to the orientation of buoyancy forces relative to the flow direction. In horizontal tubes, buoyancy acts perpendicular to the flow direction, causing secondary flow effects across the tube’s cross-section [13,14]. Chen et al. [15] numerically simulated the flow of supercritical n-decane in a horizontal tube and found that higher mass flow rates produce higher flow velocities that disrupt the flow boundary layer. This disruption helps to suppress anomalous heat transfer, which could otherwise degrade heat-transfer efficiency. Sun et al. [16] modeled heat transfer in supercritical RP-3 aviation kerosene and noted that higher wall heat fluxes enhance the impact of buoyancy, increasing the temperature differential between the upper and lower walls. However, buoyancy effects also help eliminate heat-transfer deterioration near the inlet. Pidaparti et al. [17] observed flow stratification in experiments with supercritical CO2 flowing horizontally. This stratification resulted in significantly higher temperatures at the upper wall compared to the lower wall, highlighting the non-negligible impact of buoyancy. When the overall temperature exceeded the pseudo-critical temperature, the influence of buoyancy was drastically reduced. Tanimizu and Sadr [18] also reported similar findings. Their experiments indicated that the dramatic changes in fluid properties led to uneven wall temperature distributions, where buoyancy played a crucial role. Lastly, Sun et al. [19] pointed out that the significant density gradients caused by buoyancy have profound impacts on flow structure and temperature distribution. These gradients accelerate the formation of secondary flows. Essentially, buoyancy arises due to a substantial temperature difference between the mainstream and the wall boundaries, and the ensuing laminar flow can be seen as a cause for heat-transfer deterioration. These findings underline the complexity of managing heat transfer in supercritical fluids flowing in horizontal configurations and the critical role of understanding buoyancy forces’ effects to optimize thermal performance.
In order to quantify the effects of buoyancy, various buoyancy criterion numbers have been proposed. However, scholars differ in their opinions on the threshold values for these criteria. The most widely applied criterion in vertical tubes is Bo* < 5.7 × 10⁻⁶ [20]. Fu et al. [21] suggest that, in tubes with a diameter of 1.09 mm, a Bo* = 1.0 × 10⁻⁸ serves as the critical point for assessing the impact of buoyancy. The criterion of Grb/Reb2 = 10−3 is also extensively utilized in the heat transfer of supercritical fluids in cylindrical tubes [22]. Following an investigation of the heat-transfer process of n-decane in vertical tubes, Li et al. [23] concluded that Grb/Reb2 = 10−2 is a more appropriate criterion. Building on the Grb/Reb2 basis, Jackson et al. [24] took into account the density ratio and characteristic length to propose BuJ as a criterion suitable for horizontal tubes. Pu et al. [25] explored the applicability of different buoyancy criteria based on experimental data from laminar and transitional convective heat transfer in hydrocarbon fuels within horizontal rectangular channels, ultimately determining that a BuJ < 10 provides the best performance. Petukhov et al. [26] introduced another form of dimensionless buoyancy number, Grq/Grth, suitable for horizontal flows, and indicated that, when Grq/Grth < 1, the effects of buoyancy can be considered negligible. These diverse views and findings on the buoyancy criteria underline the complexity and situational dependency of thermal management in systems involving supercritical fluids, highlighting the need for careful consideration and application of these criteria in engineering designs and analyses.
Overall, research into supercritical hydrocarbon fuels in horizontal tubes is relatively scarce. The buoyancy forces experienced by fluids in horizontal tubes differ significantly from those in vertical tubes. Additionally, the phenomena of hypergravity and weightlessness experienced by hypersonic aircraft during flight could likely exert profound influences on buoyancy forces, complicating the understanding of heat-transfer mechanisms. This necessitates further investigation into multiple factors affecting such processes. Consequently, this paper has enhanced the solver and validated the accuracy of the simulator through experimental trials. Subsequent numerical simulations analyzed the heat-transfer characteristics of supercritical hydrocarbon fuels within horizontal tubes. The study examined the effects of mass flux, inlet temperature, and gravitational acceleration on the heat-transfer processes. It also compared and summarized the advantages and disadvantages of various buoyancy criterion numbers, providing valuable insights for the design of supersonic combustion ramjet engines.

2. Experiment Section

2.1. Experiment System

Figure 1 presents a schematic diagram of the experimental setup, which primarily consists of a power-supply system, heating-test system, condensation-recovery system, and data-acquisition system. During the experiment, a high-pressure constant flow pump (SP6015) transfers hydrocarbon fuel from Fuel Tank 1 into the heating-test system, providing a stable flow for subsequent heating experiments. Within the heating-test system, the hydrocarbon fuel first passes through a mass flow meter, then undergoes water-bath heating in the preheating section, followed by electrical heating in the test segment. Finally, the high-temperature fluid is cooled in the condensation tower and collected in Fuel Tank 2.
In the entire system, a Coriolis flow meter (DMF-1-1, 0.15%) was used to measure the mass flow rate of the fuel in the tube. The static pressure at the heating entrance section was measured by a pressure transmitter (3051C, Rosemount, Shakopee, MN, USA) with a range of 0–16 MPa and an accuracy of 0.3%. The pressure was controlled by a back-pressure valve (0–15 MPa) in the system. Ten pairs of K-type thermocouples, with an accuracy of 0.5 K, were welded to the upper and lower surfaces of the entire heating-test section, and the data were recorded to a computer via the IMP 3595-4C system.
Figure 2 shows a schematic of the experimental section. The section consists of a horizontally oriented 316L stainless steel tube (00Cr17Ni14Mo2), with an inner diameter of 2 mm, an outer diameter of 3 mm, and a length of 1000 mm. To minimize the influence of the inlet effects on the experiments and to ensure fully developed flow within the tube, the first 100 mm of the experimental section are designed as an adiabatic segment, while the following 900 mm serve as the heating segment. It should be noted that the term “fully developed flow” in this article refers to fully developed flow in fluid dynamics. Temperature-measurement sections are established every 100 mm along the heating segment, where K-type thermocouples are spot-welded to the external surface for temperature monitoring.

2.2. Data Reduction

The experimental parameters are categorized into directly measured quantities and indirectly measured quantities. The uncertainty of directly measured quantities is derived from the range and precision of the measuring instruments, while the uncertainty of indirectly measured quantities is calculated using the error propagation formula.
The uncertainty formula for directly measured quantities is as follows:
ξ M = M R × ε M
where M represents the measured value, and MR and ε , respectively, represent the range and precision of the measuring instrument.
For indirectly measured quantities, the uncertainty formula is as follows:
ξ R = i = 1 n R x i ξ i 2
For electrical heating efficiency, the calculation method for the electrical heating efficiency of the experimental section involves measuring the inlet and outlet fluid temperatures of the heated fluid. This allows for the determination of the energy gained by the fluid, which is used to calculate the efficiency of electrical heating.
η = m H b , in H b , out U I
where m represents the mass flow rate, Hb,in represents the enthalpy of the fluid at the inlet, Hb,out represents the enthalpy of the fluid at the outlet, U represents the voltage, and I represents the current.
The formula for calculating the heat flux (q) is as follows:
q = U I η 4 d in L
The inner wall temperature, Tw,in, is determined from the outer wall temperature of the cylindrical tube; Tw,out measured by a thermocouple and calculated using the heat flux, as described in reference [27]:
T w , in = T w , out + q v 4 λ ( d o 2 4 d in 2 4 ) q v 2 λ d o 2 4 ln ( d o d in )
where qv represents the volumetric heat generation rate, do stands for the outer diameter, and din indicates the inner diameter.
The heat-transfer coefficient is as follows:
h = q T w , in T b
In this paper, the bulk temperature of the fluid is defined as the average temperature across different cross-sections, which is expressed as:
T b = 1 n i = 1 n T b , i
where Tb denotes the bulk temperature of the flow.
For the mass flux (G), the uncertainty formula is as follows:
δ G G = δ M M 2 + 2 δ d in d in 2 = 0.2 % 2 + 2 × 0.19 % 2 = 0.43 %
For the heat flux (q), the formula for its uncertainty is as follows:
δ q q = ( δ η η ) 2 + ( δ Q Q ) 2 + ( δ A A ) 2 = 3.03 %
For the heat-transfer coefficient (h), the formula for its uncertainty is as follows:
δ ( h ) h = ( δ q q ) 2 + ( δ Δ T Δ T ) 2 = 7.64 %
The uncertainty of the main parameters in this experiment is shown in Table 1.

3. Numerical Methods
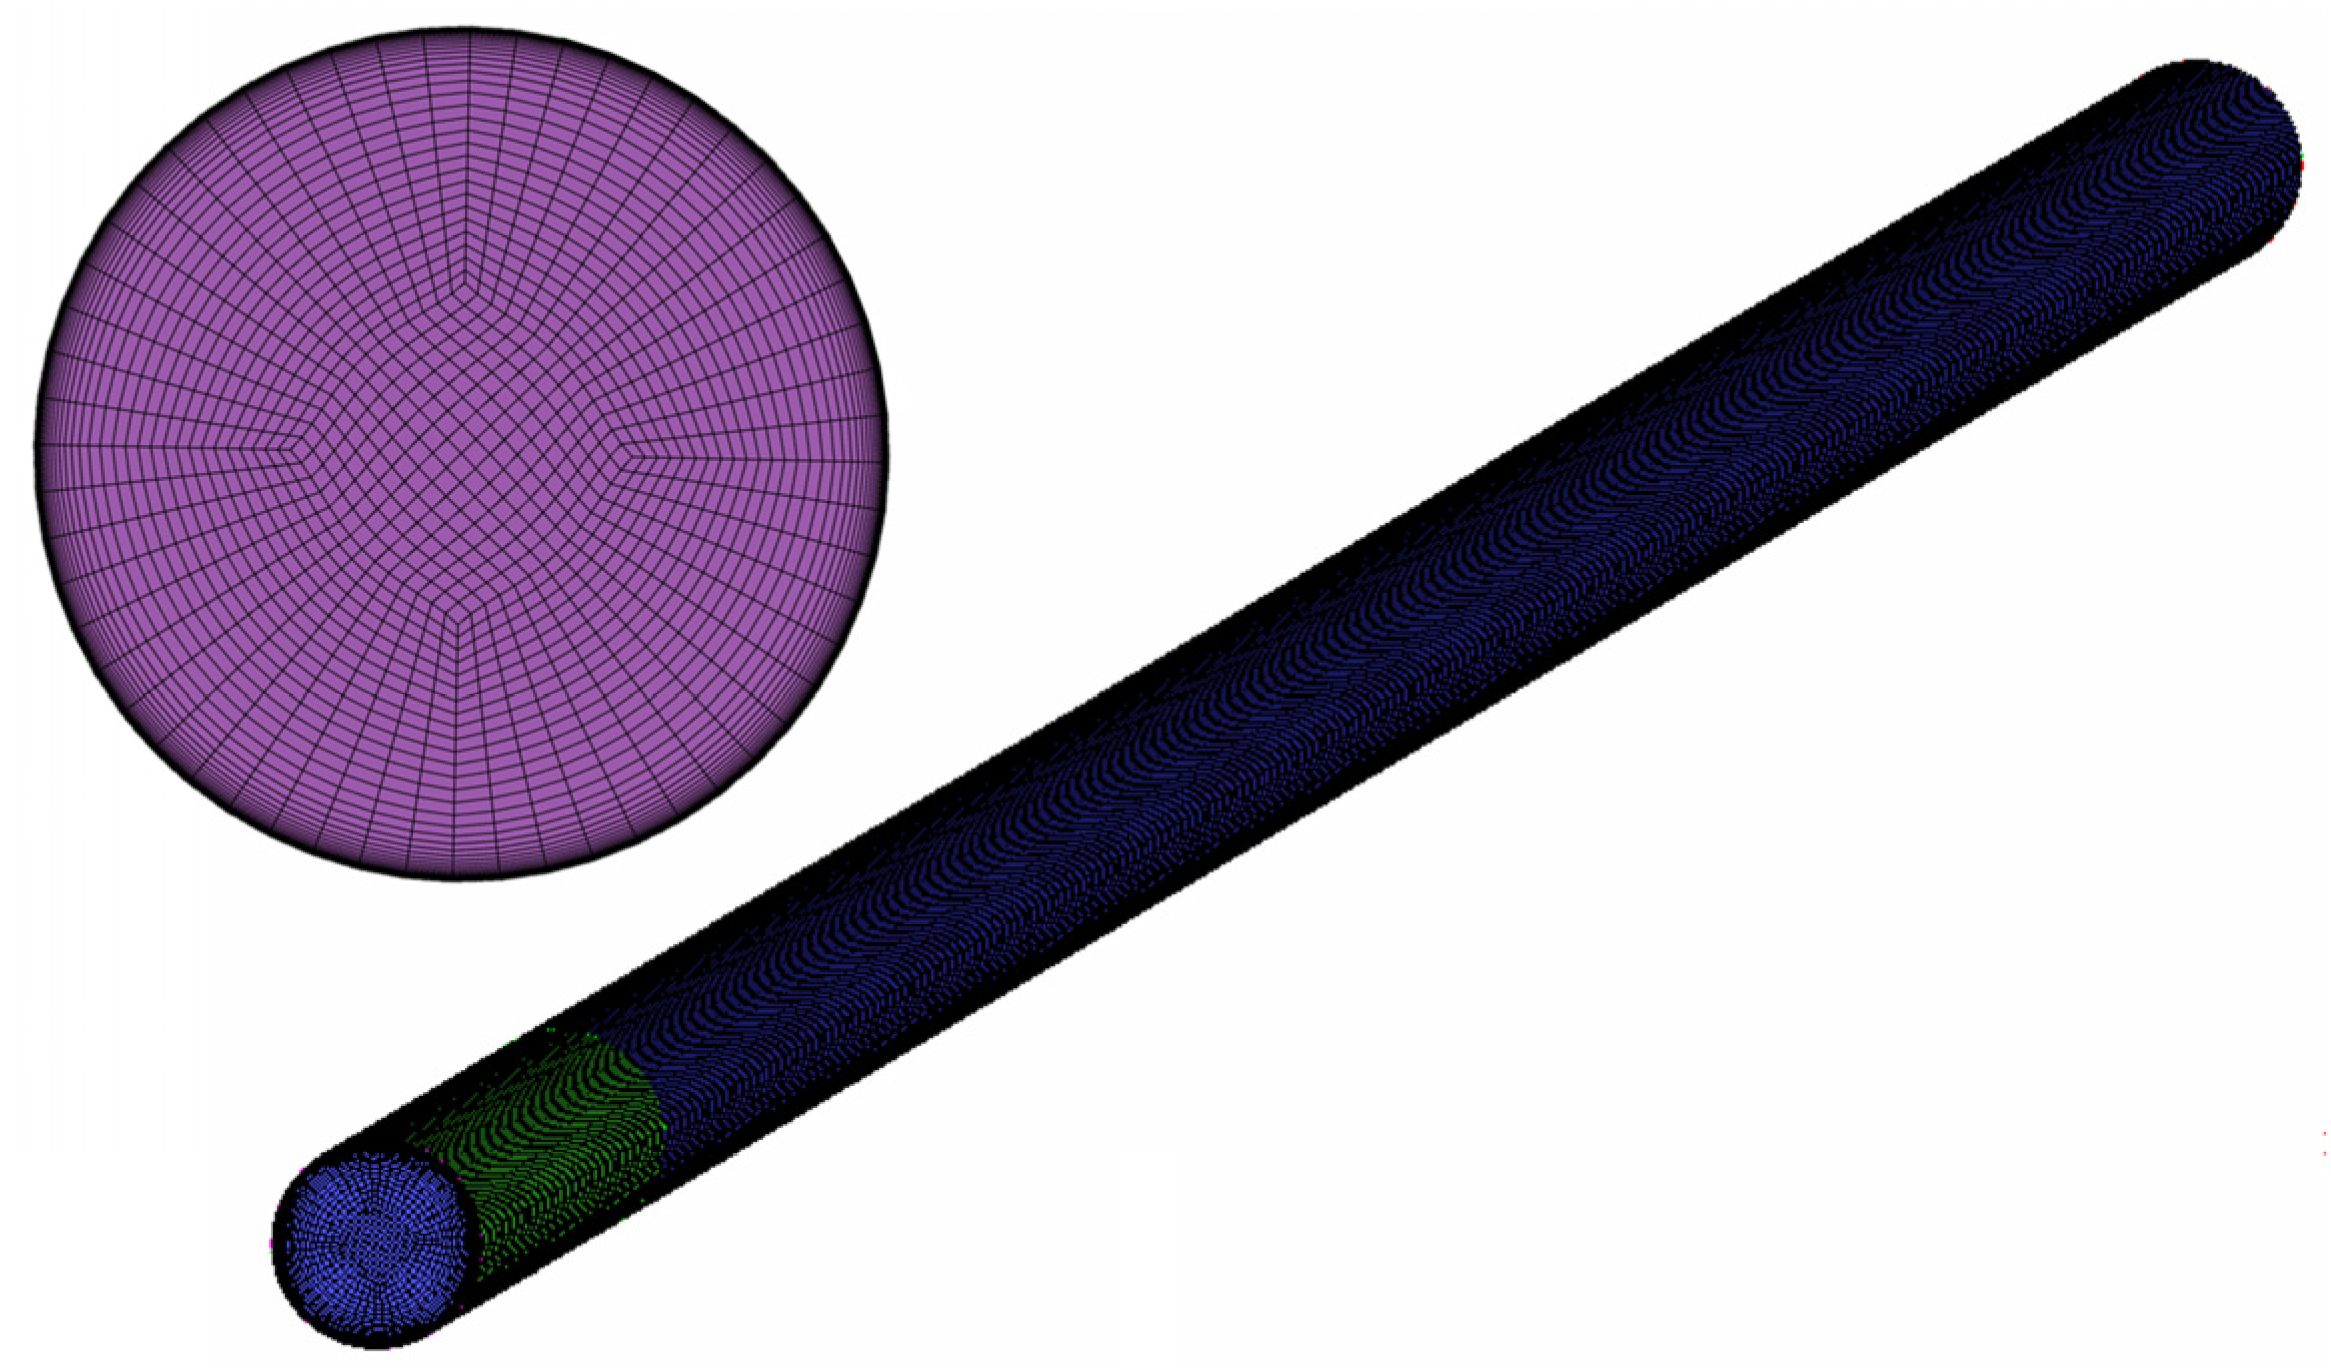
3.1. Physical Model

Due to numerous limitations of the experiments, analyzing the heat-transfer mechanisms of supercritical hydrocarbon fuels solely based on partial wall temperature data and similar metrics remains insufficiently clear. Computational fluid dynamics (CFD) offers a more detailed and convenient method for obtaining numerical values throughout the convective heat-transfer process. Therefore, this study will employ the open-source software package OpenFOAM-v9, integrated with a custom-compiled thermophysical properties library, to simulate the convective heat-transfer process of supercritical RP-3 in a horizontal tube. The physical model and the experiment are kept consistent. The physical model is depicted in Figure 3. The tube has an inner diameter of 2 mm and a length of 1000 mm, with the first 100 mm being an adiabatic section and the remaining 900 mm a heated section. The purpose of the adiabatic section is to change the flow of fuel entering the heating section into a fully developed flow. The direction of gravity is downward along the y-axis.

3.2. Thermophysical Property

This study focuses on RP-3 aviation kerosene, the most widely used fuel in domestic aircraft engines. RP-3 has a critical temperature of 645.04 K and a critical pressure of 2.33 MPa [28]. Given the highly complex composition of aviation kerosene, researchers have traditionally used component-substitution models to handle its thermophysical properties. This approach involves representing the complex aviation kerosene with a few main components and calculating its thermophysical properties based on their mass or molar fractions. Although this method simplifies the handling of the thermophysical properties of aviation kerosene, different substitution models have varying applicabilities and still contain some errors. Considering that researchers, such as Deng et al. [29,30,31,32], have measured refined thermophysical properties of RP-3 within a certain temperature range, this study constructs a new thermophysical properties library by tabulating the measured data, including density, specific heat at constant pressure, dynamic viscosity, and thermal conductivity against temperature. This new library is developed and integrated into OpenFOAM to create a new solver that is invoked during the simulation of heated RP-3. Figure 4 illustrates the thermophysical properties of RP-3 at 3 MPa.

3.3. Computational Model

The control equations for this process are as follows:
ρ t + x i ( ρ u i ) = 0
where ρ is the fluid density, t is time, and ui represents the velocity components in the x, y, and z coordinates
( ρ u i ) t + x j ( ρ u i u j ) = p x i + x i [ ( μ + μ t ) u i x j ] + ρ g i
where uj represents the velocity component along the x, y, and z coordinates, μ represents the dynamic viscosity, μt represents the turbulent viscosity, and gi represents the components of gravitational acceleration in the x, y, and z coordinates.
( ρ H ) t + x i ( ρ u i H ) = x i λ c p H x i ρ c p u i T ¯
where H represents the enthalpy, λ denotes the thermal conductivity, cp is the specific heat at constant pressure, and u i T ¯ represents the turbulent heat flux.
Numerous studies have demonstrated that the SST k ω model exhibits relatively good performance in predicting heat-transfer deterioration and buoyancy effects [33,34]. Therefore, this paper employs the SST k ω model, and the specific equations are referenced in [35].
In the solution approach, the PIMPLE algorithm in OpenFOAM is utilized to handle the coupling between pressure and velocity. The transient terms are addressed using an Euler implicit format, while the convection terms are handled with a first-order upwind scheme. The diffusion terms are approached using central differencing. To solve the sparse matrix iteratively, a multi-grid algorithm is employed. The residual norms for equation computations are set to 10−4.

3.4. Data Analysis

In this paper, the mainstream temperature is defined as follows:
T b = A c ρ u c p t d A c A c ρ u c p d A c
where Ac represents the flow cross-sectional area of the control volume.
The Reynolds number, Prandtl number, Grashof number, and thermal expansion coefficient are as follows:
R e = ρ u d μ
P r = μ c p λ
G r * = g β q d 4 λ ν 2
β = 1 ρ ρ w ρ b T w T b
In this study, we also compared four common buoyancy criterion numbers [21,23,24,26]. When these exceed certain thresholds, the buoyancy effect cannot be ignored. The definitions and thresholds are as follows:
B o * = G r * R e 3.425 P r 0.8 ,   B o * > 1 × 10 8
G r q = g ρ b ρ w q d 4 ρ f T w T b ν b 2 λ b G r th = 3 × 10 5 R e b 2.75 P r ¯ 0.5 1 + 2.4 P r ¯ 2 / 3 1 R e b 0.125 P r ¯ = H w H b T w T b μ b λ b ,   G r q / G r th > 1
G r b = g ρ b ρ w d 3 ρ b ν b 2 ,   G r b / R e b 2 > 10 3
B u J = G r b R e b 2 ρ b ρ w x d 2 ,   B u J > 10

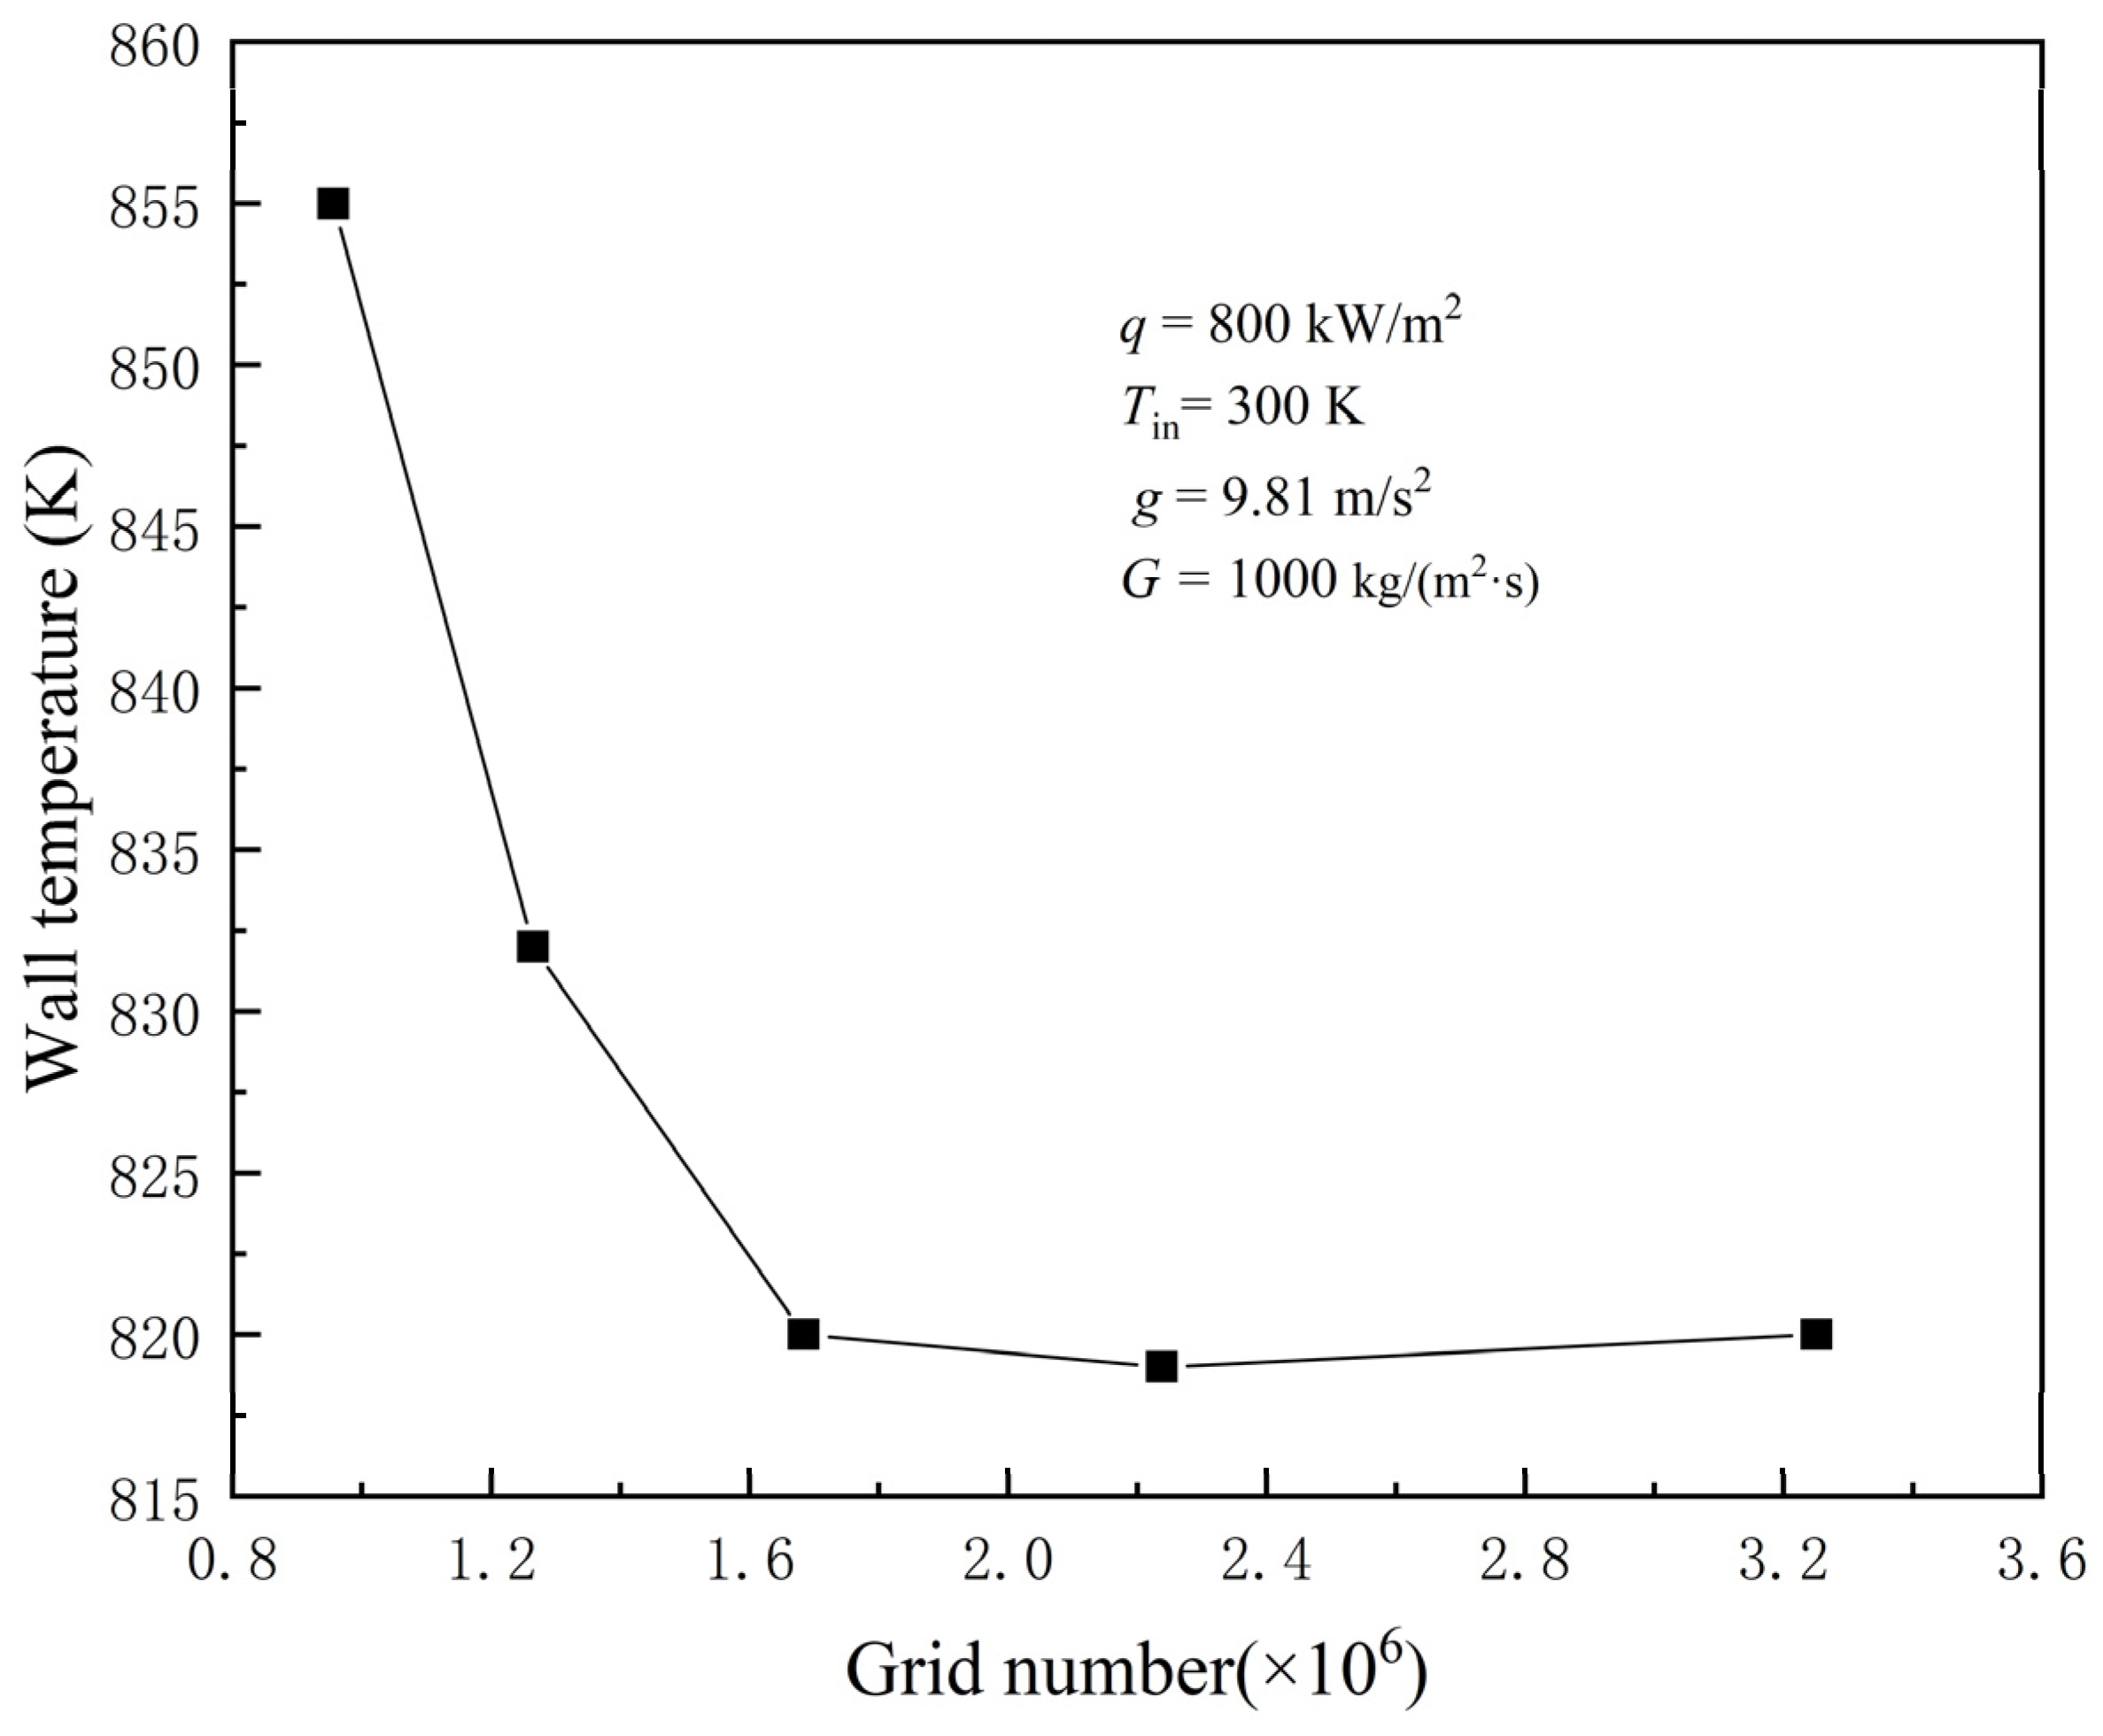
3.5. Grid Independence and Model Validation

The quality of the mesh directly determines the accuracy of the numerical simulation results. A low-quality mesh can lead to larger simulation errors, while a mesh with excessively high quality can increase the simulation time and waste computational resources. Therefore, mesh independence verification is necessary to determine the appropriate mesh generation method. Figure 5 shows a schematic diagram of the mesh. It is important to note that the turbulent equations are highly sensitive to the near-wall region of the mesh. It is necessary to ensure a dimensionless distance of y+ ≤ 1 To achieve this, the first layer’s mesh thickness is fixed at 0.008 mm with a growth rate of 1.1. The number of axial and radial grid lines is varied to create four different meshes with 0.95 M, 1.26 M, 1.68 M, 2.24 M, and 3.25 M elements. The wall temperature at the outlet is used as a key parameter for comparison, as shown in Figure 6. It can be seen that the results of the 0.95 M and 1.26 M meshes have larger errors compared to the 1.68 M mesh. The difference in the outlet wall temperatures between the 1.68 M, 2.24 M, and 3.25 M meshes is less than 2 K. Therefore, the mesh with 1.68 M elements is deemed appropriate. After determining the mesh size, it is necessary to compare the simulation with experimental results to verify the accuracy of the simulation settings and methods. Figure 7 shows a comparison of the simulated and experimental wall temperatures under the condition of a mass flux of 1000 kg/(m2∙s), an inlet pressure of 3 MPa, an inlet temperature of 300 K, a gravitational acceleration of 9.81 m/s2, and a heat flux of 800 kW/m2. The maximum error is 2.90%, indicating that the mesh and methods used in this study are relatively accurate. Since RP-3 aviation kerosene undergoes significant thermal cracking reactions at around 860 K [36], in order to make the simulation as close to reality as possible, the temperature throughout the pipe is limited to below 860 K when setting different simulation conditions in the future.

4. Result and Discussion

This paper investigates the heat-transfer performance of RP-3 in a 2 mm horizontal circular tube under an inlet pressure of 3 MPa. Initially, the heat-transfer mechanisms were thoroughly examined through a series of typical operating conditions. Subsequently, the paper presents the longitudinal variations in wall temperature, the temperature difference across the wall, and the heat-transfer coefficients under different mass flux, inlet temperatures, and gravitational accelerations. Lastly, the paper compares the pros and cons of several commonly used buoyancy criterion numbers.

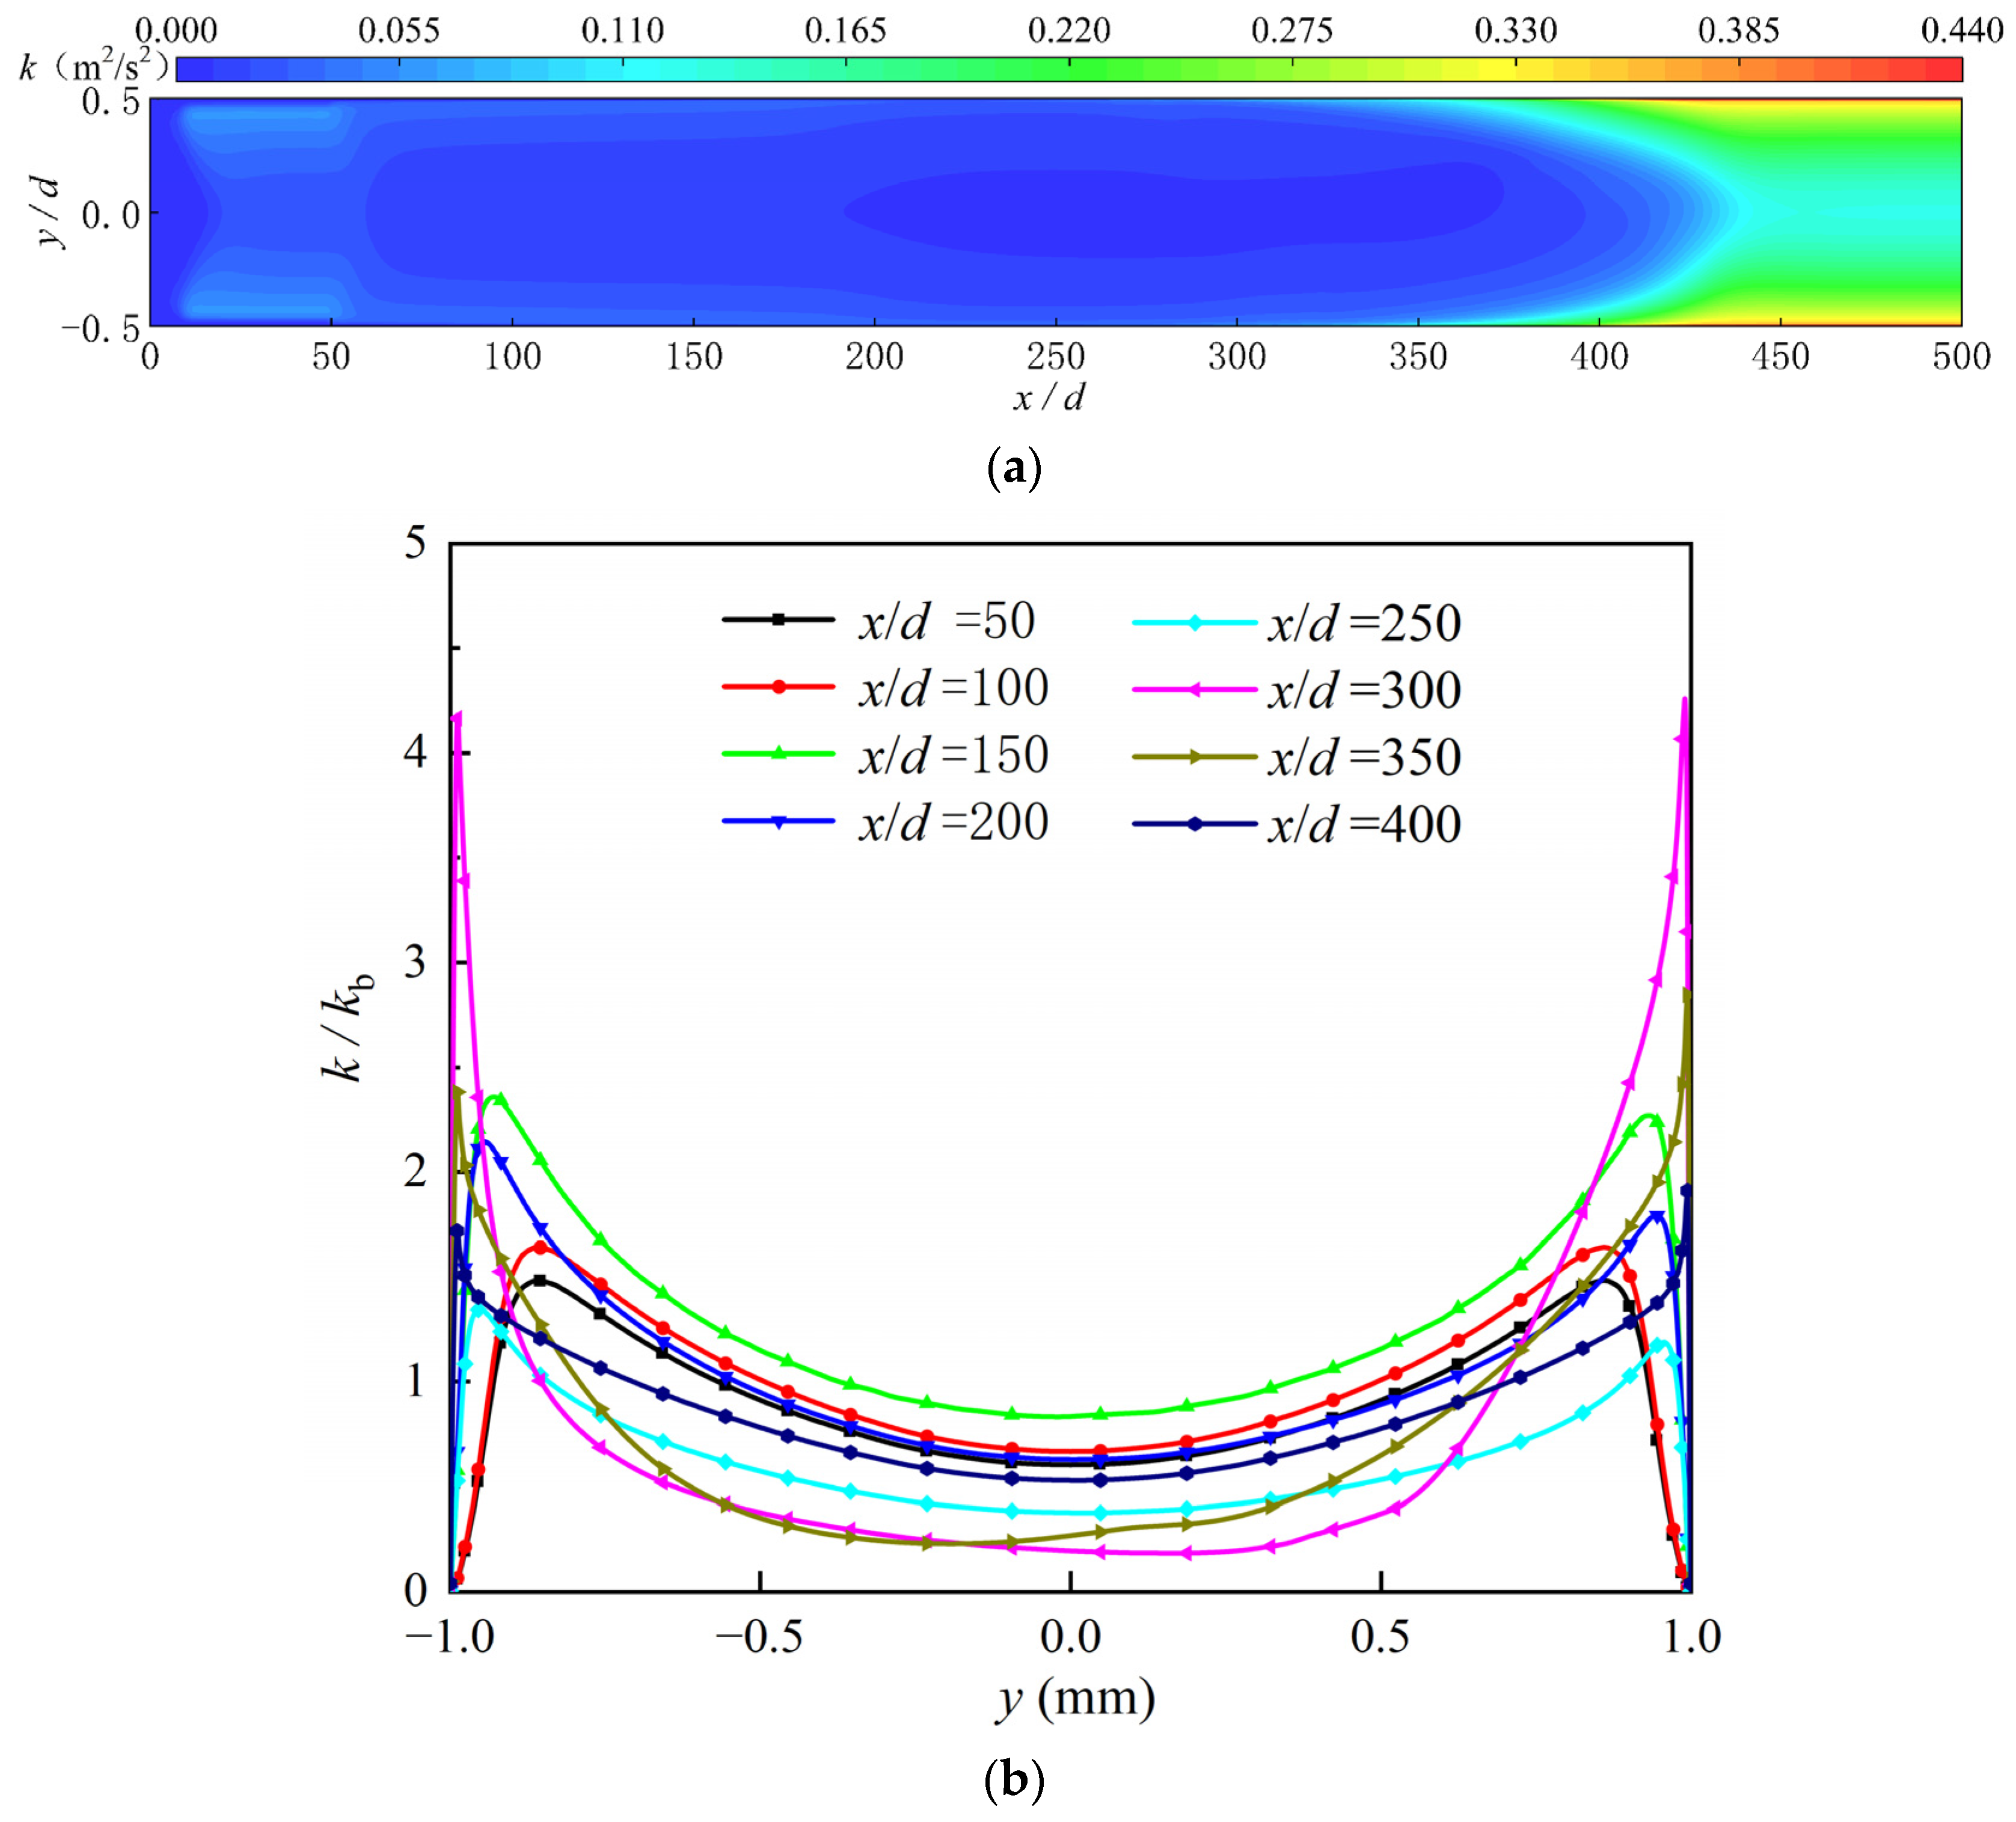
4.1. Analysis of Heat-Transfer Mechanism

This section conducts a detailed analysis under typical conditions, with a heat flux of 800 kW/m2, mass flow rate of 1000 kg/(m2·s), inlet pressure of 3 MPa, inlet temperature of 300 K, and gravitational acceleration of 9.81 m/s2. It also elaborates on the heat-transfer mechanisms involved in these settings.
Figure 8a,b show the temperature contour maps at the z = 0 cross-section and various other cross-sections. Initially, as heating commences, the temperature distribution within the tube transitions uniformly from the wall to the center, with minimal difference between the upper and lower wall temperatures. As the flow progresses, the upper wall temperature reaches the pseudo-critical temperature first, and the temperature difference between the upper and lower walls gradually increases. The cooler central region begins to shift downwards until it nears the outlet, where the temperature distribution across the cross-section becomes uniform again.
Figure 8c illustrates the longitudinal changes in wall temperature, fluid temperature, and heat-transfer coefficient, providing a clear visualization of the heat-transfer process within the pipe. Based on changes in the heat-transfer coefficient and temperatures, the entire heat-transfer process can be divided into five stages: I: heating at the inlet section, II: normal heat-transfer section, III: heat-transfer deterioration section, IV: heat-transfer enhancement section, and V: high-temperature normal heat-transfer section. In the heating inlet section (Stage I), the bulk temperature changes little while the wall temperature rises sharply and the heat-transfer coefficient drops significantly, though this stage is brief. The process quickly moves into Stage II, normal heat transfer, where both the fluid and wall temperatures increase almost linearly. As the wall temperature approaches the pseudo-critical temperature, the process enters Stage III. During this stage, the rate of temperature increase on the upper wall surface accelerates, while the heat-transfer coefficient ceases to rise and begins to decline, indicating significant heat-transfer deterioration. And, this deterioration occurs in two distinct phases. Meanwhile, the lower wall surface experiences enhanced heat transfer during the second phase of deterioration on the upper wall surface. When the bulk temperature approaches the pseudo-critical temperature, the heat-transfer enhancement stage (Stage IV) begins, accompanied by a sudden increase in the wall heat-transfer coefficient and a notable decrease in wall temperature. Finally, as the fluid temperature moves away from the pseudo-critical range, the process reaches Stage V, characterized by normal heat transfer under high-temperature conditions.
The principle of the heating inlet section is fairly evident. At the beginning of the heating process, the thermal boundary layer is very thin and not yet fully developed, resulting in a substantial temperature gradient near the wall. At this stage, the fluid within the thermal boundary layer exhibits laminar flow characteristics, and the wall temperature increases sharply. As the flow continues, the thermal boundary layer thickens and transitions from laminar to turbulent flow, gradually restoring the heat-transfer capability. The mechanisms in Stage III, however, are more complex. Below, we will explore the reasons for the formation of this stage by synthesizing considerations of fluid dynamics and thermal properties changes.
Figure 9a,b presents the velocity contour maps at the z = 0 cross-section and across different interfaces. It can be observed that, as the fluid enters the heating section, the fuel velocity increases and the flow boundary layer becomes increasingly thinner. During the heat-transfer deterioration phase, the velocity gradient at the upper wall is significantly higher than that at the lower wall. As the flow evolves into the high-temperature normal heat-transfer phase, the velocity profile returns to the classic flattened parabolic curve. As shown in Figure 8, after the wall temperature reaches the pseudo-critical temperature, where Tb << Tpc < Tw, the viscous sublayer—still in a laminar state—first reaches the pseudo-critical temperature. The heat transfer within this layer is primarily influenced by thermal conductivity. Therefore, the sharp decrease in thermal conductivity at the pseudo-critical temperature leads to the first instance of heat-transfer deterioration. However, since the viscous sublayer is very thin, this phase of heat-transfer deterioration does not last long. Soon, the fluid within the buffer layer reaches the pseudo-critical temperature, causing a sharp increase in the specific heat at constant pressure, enhancing the heat storage capacity. Simultaneously, as the fluid temperature in the viscous sublayer exceeds the pseudo-critical temperature, the thermal conductivity gradually increases with the temperature, restoring the heat-transfer capability. Subsequently, as the high specific heat zone gradually shifts from the buffer layer to the main core of the flow, the specific heat within the buffer layer drastically drops, initiating the second phase of heat-transfer deterioration.
Figure 9c displays the transverse uy velocity contours at different cross-sections perpendicular to the flow direction. At x/d = 100, only a very weak vertical flow velocity is present, which is almost negligible. By x/d = 200, the vertical velocity remains subtle, but some regions at the center start showing a downward motion of the liquid. Meanwhile, at the wall boundaries, the liquid flows upward along the walls. As the flow progresses, the vertical velocity becomes increasingly pronounced until it peaks at x/d = 350; then, it gradually decreases, approaching near zero by x/d = 450. The asynchronous heating of the fuel within the pipe, accompanied by a rapid decrease in fuel density near the pseudo-critical temperature under supercritical pressure, triggers the buoyancy effect. This considerable density difference drives the mainstream low-temperature fluid downward, while the high-temperature fluid flows upward along the walls and gathers at the upper wall. This buoyancy effect further exacerbates the heat-transfer deterioration at the upper wall and enhances the heat transfer at the lower wall, thereby increasing the temperature difference between the upper and lower walls. This is also the reason for the enhanced heat transfer observed at the lower wall in Figure 8c. Moreover, the buoyancy effect during the second instance of heat-transfer deterioration is more severe than during the first. It is important to note that, at the end of the first deterioration phase, the temperature difference between the upper and lower walls is about 20 K, while at the end of the second phase, it escalates to 68 K. This significant increase indicates that the primary cause of the second instance of heat-transfer deterioration is indeed the buoyancy effect.
In this study, the formation mechanism during the heat-transfer enhancement phase is analyzed with the aid of turbulent kinetic energy. Figure 10 presents the turbulent kinetic energy contour maps and the nondimensional distribution of turbulent kinetic energy at the z = 0 cross-section. It is observed that turbulent kinetic energy increases gradually during the normal heat-transfer phase. After the wall temperature reaches the pseudo-critical temperature, a sharp decrease in viscosity leads to a rapid increase in flow velocity, consequently causing a swift development in turbulent kinetic energy. Yet, the turbulent kinetic energy in the main core of the flow remains at relatively low levels. As the mainstream temperature approaches the pseudo-critical temperature, the drastic changes in physical properties significantly enhance the heat storage capacity. The acceleration of the flow velocity, coupled with increased turbulence intensity, reduces the temperature gradient in the flow field and mitigates the effects of buoyancy. This marks the onset of the heat-transfer enhancement stage within the pipe.

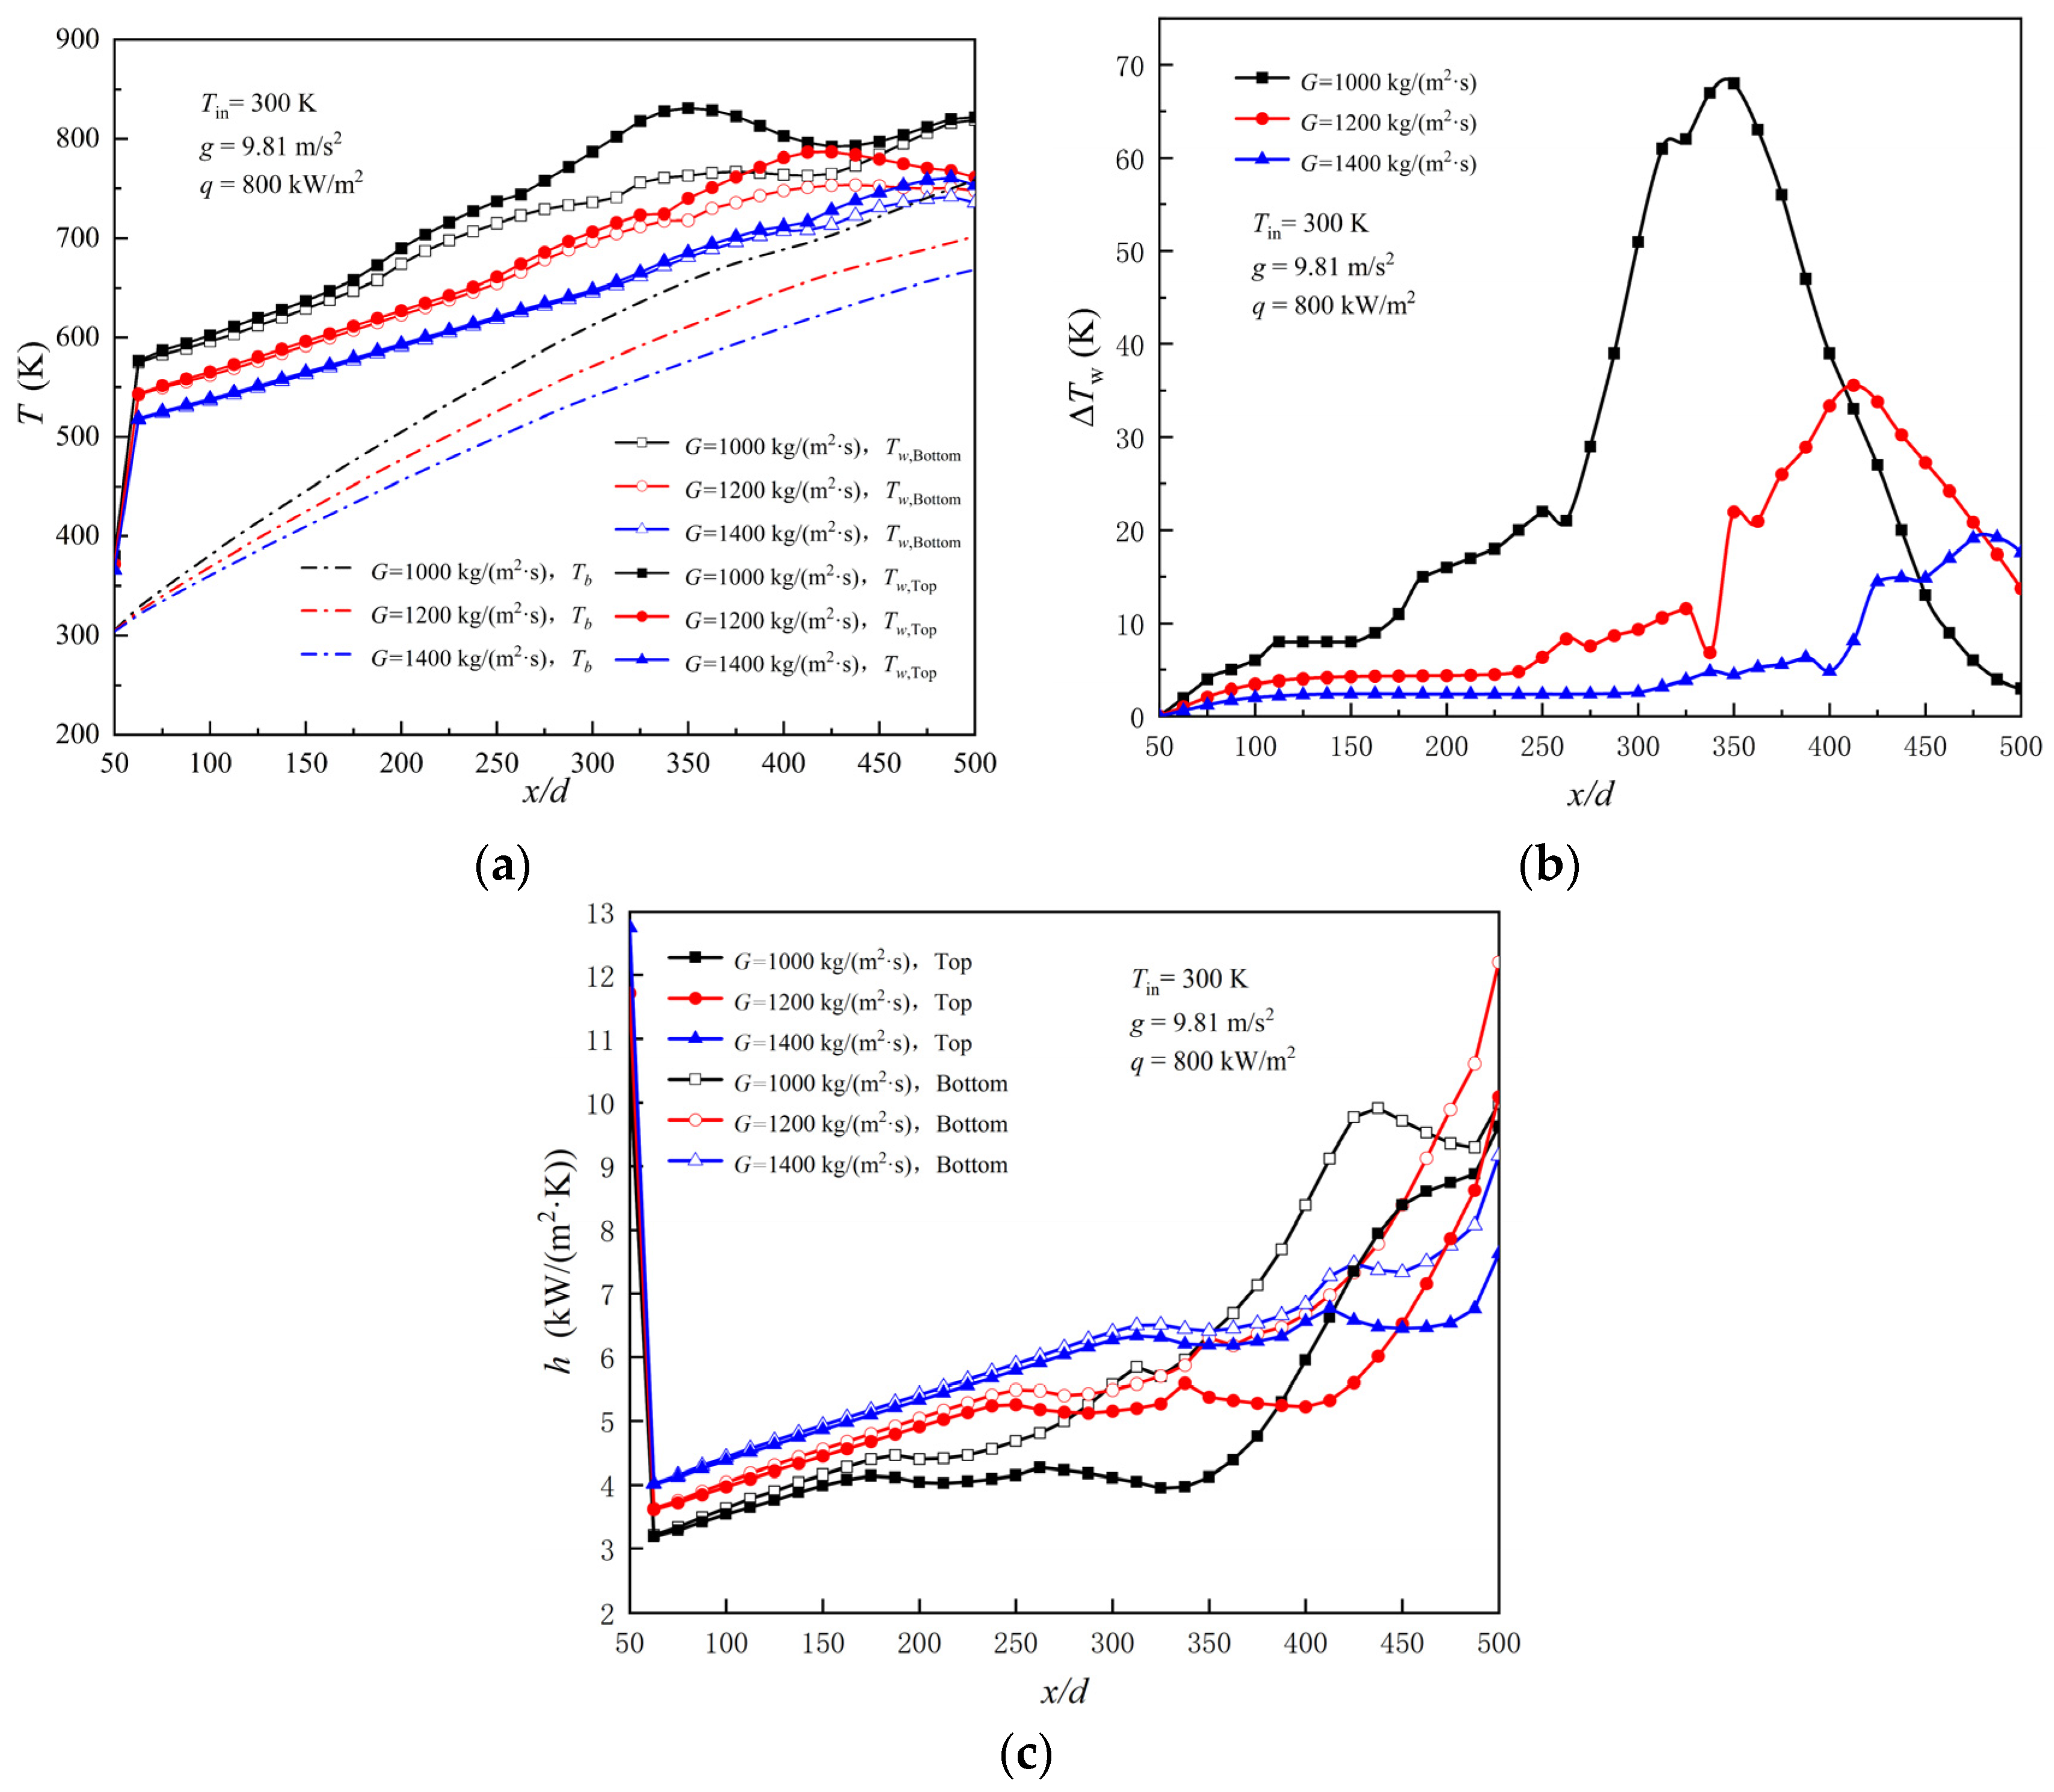
4.2. Effect of Mass Flux

Figure 11a–c displays the effects of varying mass flux on wall temperature, fluid temperature, wall temperature difference, and heat-transfer coefficients, under the operational conditions of a heat flux of 800 kW/m2, an inlet pressure of 3 MPa, an inlet temperature of 300 K, and a gravitational acceleration of 9.81 m/s2.
Different mass fluxes not only alter the heating duration of the fuel inside the tube but also change the Reynolds number at the inlet. As depicted in Figure 11a, a higher mass flux results in lower temperatures at the end of the inlet section, prolonging the normal heat-transfer stage and shortening the heat-transfer deterioration phase. This is because, during the normal heat-transfer stage, a higher mass flux shortens the heating time over the same distance, while in the heat-transfer deterioration phase, a higher mass flux increases the turbulent kinetic energy, reducing the impact of buoyancy. Figure 11b illustrates that higher mass fluxes diminish the wall temperature differences during the two instances of heat-transfer deterioration within the phase, with the maximum wall temperature difference at a mass flux of 1400 kg/(m2·s) being only 20 K. Figure 11c corroborates these findings and additionally reveals that higher mass fluxes lead to higher initial convective heat-transfer coefficients. Also, during the heat-transfer deterioration phase, they slow down the second instance of heat -transfer deterioration on the upper wall. However, at the same time, they weaken the heat-transfer enhancement on the lower wall and may even lead to heat-transfer deterioration there—a manifestation of the weakened buoyancy and a more uniform flow field.

4.3. Effect of Inlet Temperature

Figure 12a–c each depict the impact of varying inlet temperatures on wall temperature, fluid temperature, wall temperature difference, and heat-transfer coefficients under the conditions of a heat flux of 400 kW/m2, a mass flux of 1000 kg/(m2·s), an inlet pressure of 3 MPa, and gravitational acceleration of 9.81 m/s2.
From Figure 12, it is evident that the greatest impact of the inlet temperature on the heat-transfer process occurs at the heating inlet section. The higher the inlet temperature, the lower the temperature rise in the inlet section, and the lower the heat-transfer coefficient. Comparing the parameters across three different inlet temperatures, it is observable that the varying inlet temperatures primarily affect the timing of changes in the fluid thermal properties but do not influence the intensity of the heat transfer within the tube, nor alter the overall trend of the heat-transfer behavior.

4.4. Effect of Gravitational Acceleration

Figure 13a–c illustrates the effects of different gravitational accelerations on wall temperature, fluid temperature, wall temperature difference, and heat-transfer coefficients under conditions of a heat flux of 600 kW/m2, a mass flux of 1000 kg/(m2·s), an inlet pressure of 3 MPa, and an inlet temperature of 300 K.
Gravity is an aspect that can easily be overlooked, yet the phenomena of hypergravity and weightlessness are ubiquitous in hypersonic flight. Hypergravity intensifies the secondary flow caused by buoyant forces. As shown in Figure 13a, gravity has no effect on the mainstream temperature and the temperature rise at the inlet section, but it significantly affects the heat-transfer process in the remaining three stages. Higher gravitational accelerations lead to earlier and higher peak temperatures on the upper wall. Figure 13b reveals that, under hypergravity conditions, the temperature difference in the normal heat-transfer section is greater, and the peak temperature difference in the deteriorated heat-transfer section is also higher. For instance, under 1 g conditions, the temperature difference in the normal heat-transfer section is around 4.5 K, with a peak of only 36 K, whereas under 5 g conditions, this difference rises to 21 K, with a peak value surging to 103 K. Figure 13c indicates that, unlike the impact of mass flux, hypergravity conditions widen the disparity in convective heat-transfer coefficients between the upper and lower walls, and exacerbate the secondary deterioration of heat transfer on the upper wall. Specifically, in a 1 g condition, the convective heat-transfer coefficient drops from 4768 W/(m2·K) to 4624 W/(m2·K), while in a 5 g condition, it drastically falls from 4266 W/(m2·K) to 3203 W/(m2·K). However, for the lower wall, higher gravitational acceleration actually enhances the heat transfer. These results all indicate that high gravitational acceleration promotes the effects of buoyancy.

4.5. Evaluation of Buoyancy Criterion Number

In the analysis of mechanisms and the discussion of results regarding mass flux, inlet temperature, and gravitational acceleration, the impact of buoyancy forces on the heat-transfer process is highly significant, necessitating a qualitative analysis of buoyancy. Over recent years, scholars have proposed numerous buoyancy criterion numbers and their corresponding threshold values while studying heat-transfer processes in supercritical fluids. This study selects four commonly used buoyancy criterion numbers, Bo*, Grq/Grth, Grb/Re2, and BuJ, and explores their applicability to the convective heat transfer of supercritical aviation kerosene.
Figure 14 illustrates the variations of different buoyancy criterion numbers under various conditions along the flow path. Columns 1 to 4 correspond to different conditions of heat flux, mass flux, inlet temperature, and gravitational acceleration, while rows 2 to 5, respectively, correspond to four different buoyancy criterion numbers. To facilitate the observation of the performance of various dimensionless buoyancy criteria, the first row of Figure 14 shows the variation of the heat-transfer coefficient along the length for each operating condition. From Figure 14, it can be observed that Bo* is almost ineffective for predicting the buoyancy in horizontal tubes; its only advantage lies in its relatively precise prediction of the peak position of buoyancy. This indicates that, due to the differing impacts of buoyancy on heat transfer in vertical and horizontal tubes, the criterion numbers cannot be interchangeably used. For Grb/Re2 and BuJ, although their overall trends and previous analyses are similar, both display unreasonable aspects. BuJ, when predicting buoyancy under varying heat-flux densities and inlet temperatures, shows a decrease in peak values with increasing heat flux and an increase with decreasing inlet temperature, which is inconsistent with heat-transfer processes and might be related to its expression containing (x/d)2. Moreover, its threshold values are overly conservative. Grb/Re2 tends to overestimate the effect of buoyancy at the inlet and also introduces the buoyancy peak too early, again demonstrating issues with conservative threshold values. In comparison, Grq/Grth quite perfectly aligns with the trends in buoyancy changes throughout the different stages of the heat-transfer process, distinctly presenting two deteriorations in heat transfer. It neither overestimates the influence of buoyancy at the inlet section nor exhibits any numerical inconsistencies during the heat-transfer process. However, there are some deviations in the positioning of the buoyancy peak.

5. Conclusions

A new solver was developed to perform numerical simulations of the convective heat-transfer process within a 2 mm horizontal circular tube under supercritical pressure conditions for RP-3. A detailed analysis of the mechanisms involved was conducted, leading to the following conclusions:
  • The convective heat-transfer process of supercritical RP-3 within a horizontal circular tube can be divided into five stages: the heating entrance segment, the normal heat-transfer segment, the heat-transfer deterioration segment, the heat-transfer enhancement segment, and the high-temperature normal heat-transfer segment. The sharp rise in temperature in the heating entrance segment is primarily associated with the development of the thermal boundary layer. Within the heat-transfer deterioration segment, two instances of heat-transfer deterioration occur, primarily due to the dual effects of thermal properties and buoyancy. As the bulk temperature approaches the pseudo-critical temperature, the tube enters the heat-transfer enhancement stage;
  • The action of buoyancy induces secondary flow phenomena, which in turn, leads to a deterioration of heat transfer on the upper wall and enhancement on the lower wall. Higher mass flux alleviates the effects of buoyancy, whereas supercritical states intensify these effects. Meanwhile, the inlet temperature does not influence the heat-transfer process;
  • Buoyancy impacts the heat-transfer processes differently in vertical and horizontal tubes, and their respective dimensionless numbers should not be used interchangeably. Among the four types of buoyancy criterion numbers, Grq/Grth provides the most accurate prediction of buoyancy effects within horizontal circular tubes and is capable of distinguishing the subtle differences between the two instances of heat-transfer deterioration.

Author Contributions

Conceptualization, Q.Z., K.W., Z.Y., H.M. and B.H.; Data curation, H.M.; Formal analysis, K.W.; Investigation, K.W.; Methodology, Q.Z., K.W., H.M. and B.H.; Project administration, Q.Z.; Software, K.W. and B.H.; Supervision, Q.Z. and Z.Y.; Validation, K.W.; Writing—original draft, K.W.; Writing—review and editing, Q.Z. All authors have read and agreed to the published version of the manuscript.

Funding

This work is financially supported by the General Program of the National Natural Science Foundation of China (No. 52376149) and the Key Scientific Research Program Funded by the Shaanxi Provincial Education Department (No. 20JY044).

Data Availability Statement

The original contributions presented in the study are included in the article, further inquiries can be directed to the corresponding author.

Conflicts of Interest

Author Ziyuan Yu was employed by the company Qingdao Warbus Intelligent Experiment Technology Co., Ltd. The remaining authors declare that the research was conducted in the absence of any commercial or financial relationships that could be construed as a potential conflict of interest.

Nomenclature

Bo*buoyancy number
BuJbuoyancy number
cpspecific heat, kJ/(kg·K)
ddiameter, m
ggravitational acceleration, m/s2
Gmass flux, kg/(m2·s)
Gr, Grq, GrthGrashof number
Henthalpy, kJ/kg
Ielectrical current, A
hHTC, kW/(m2·K)
kturbulent kinetic energy, m2/s2
Llength, mm
Mmeasured value
mmass flow rate, g/s
PrPrandtl number
qheat flux, W/m2
ReReynolds number
Ttemperature, °C
Uvoltage, V
uvelocity, m/s
x, y, zx, y, z directions, mm
y+radial dimensionless distance
Greek symbols
βthermal expansion coefficient, 1/K
δWall thickness, m
ηthermal efficiency, %
μviscosity, Pa·s
λthermal conductivity, W/(m·K)
ρdensity, kg/m3
νkinetic viscosity, m2/s
ωspecific dissipation rate, s−1
Subscripts
bbulk fluid
Bottombottom wall
calcalculated
expexperimental
ininlet, inner
outoutlet, outer
PCpseudo critical
tturbulent
Toptop wall
wwall
yy direction
Abbreviation
CFDcomputational fluid dynamics
SSTshear-stress transport

References

  1. Bao, W.; Li, X.L.; Qin, J.; Zhou, W.X.; Yu, D.R. Efficient utilization of heat sink of hydrocarbon fuel for regeneratively cooled scramjet. Appl. Therm. Eng. 2012, 33–34, 208–218. [Google Scholar] [CrossRef]
  2. Qin, J.; Zhang, S.L.; Bao, W.; Zhou, W.X.; Yu, D.R. Thermal management method of fuel in advanced aeroengines. Energy 2013, 49, 459–468. [Google Scholar] [CrossRef]
  3. Huang, D.; Wu, Z.; Sunden, B.; Li, W. A brief review on convection heat transfer of fluids at supercritical pressures in tubes and the recent progress. Appl. Energy 2016, 162, 494–505. [Google Scholar] [CrossRef]
  4. Han, H.B.; Wang, R.T.; Bao, Z.W. Effect of secondary flow and secondary reactions on pyrolysis and heat transfer of supercritical hydrocarbon aviation fuel in a u-bend tube. Energy 2024, 292, 130518. [Google Scholar] [CrossRef]
  5. Zhu, J.Q.; Tao, K.H.; Tao, Z.; Qiu, L. Heat transfer degradation of buoyancy involved convective rp-3 hydrocarbon fuel in vertical tubes with various diameters under supercritical pressure. Appl. Therm. Eng. 2019, 163, 114392. [Google Scholar] [CrossRef]
  6. Li, S.F.; Wang, Y.N.; Dong, M.; Pu, H.; Jiao, S.; Shang, Y. Experimental investigation on flow and heat transfer instabilities of rp-3 aviation kerosene in a vertical miniature tube under supercritical pressures. Appl. Therm. Eng. 2019, 149, 73–84. [Google Scholar] [CrossRef]
  7. Raisee, M.; Vahedi, N.; Rostamzadeh, A. Prediction of Gas Flow Through Short and Long 2-D Micro and Nano-Channels Using a Generalized Slip Model. In Proceedings of the Sixth International ASME Conference on Nanochannels, Microchannels, and Minichannels, Darmstadt, Germany, 23–25 June 2008; pp. 103–109. [Google Scholar]
  8. Rahbarshahlan, S.; Esmaeilzadeh; Khosroshahi, R.; Bakhshayesh, G.A. Numerical simulation of fluid flow and heat transfer in microchannels with patterns of hydrophobic/hydrophilic walls. Eur. Phys. J. Plus 2020, 135, 157. [Google Scholar] [CrossRef]
  9. Zhang, C.B.; Xu, G.Q.; Gao, L.; Tao, Z.; Deng, H.W.; Zhu, K. Experimental investigation on heat transfer of a specific fuel (rp-3) flows through downward tubes at supercritical pressure. J. Supercrit. Fluids 2012, 72, 90–99. [Google Scholar] [CrossRef]
  10. Ren, Y.Z.; Zhu, J.Q.; Deng, H.W. Numerical study of heat transfer of rp-3 at supercritical pressure. Adv. Mater. Res. 2013, 663, 470–476. [Google Scholar] [CrossRef]
  11. Wang, H.; Zhou, J.; Pan, Y.; Wang, N. Experimental investigation on the onset of thermo-acoustic instability of supercritical hydrocarbon fuel flowing in a small-scale channel. Acta Astronaut. 2015, 117, 296–304. [Google Scholar] [CrossRef]
  12. Huang, D.; Ruan, B.; Wu, X.Y.; Zhang, W.; Xu, G.Q.; Tao, Z.; Jiang, P.X.; Ma, L.X.; Li, W. Experimental study on heat transfer of aviation kerosene in a vertical upward tube at supercritical pressures. Chin. J. Chem. Eng. 2015, 23, 425–434. [Google Scholar] [CrossRef]
  13. Yoo, J.Y. The turbulent flows of supercritical fluids with heat transfer. Annu. Rev. Fluid Mech. 2013, 45, 495–525. [Google Scholar] [CrossRef]
  14. Wang, H.; Leung, L.K.H.; Wang, W.S.; Bi, Q.C. A review on recent heat transfer studies to supercritical pressure water in channels. Appl. Therm. Eng. 2018, 142, 573–596. [Google Scholar] [CrossRef]
  15. Chen, Y.Q.; Li, Y.; Sunden, B.; Xie, G.N. The abnormal heat transfer behavior of supercritical n-decane flowing in a horizontal tube under regenerative cooling for scramjet engines. Appl. Therm. Eng. 2020, 167, 114637. [Google Scholar] [CrossRef]
  16. Sun, X.; Xu, K.; Meng, H.; Zheng, Y. Buoyancy effects on supercritical-pressure conjugate heat transfer of aviation kerosene in horizontal tubes. J. Supercrit. Fluids 2018, 139, 105–113. [Google Scholar] [CrossRef]
  17. Pidaparti, S.R.; Mcfarland, J.A.; Mikhaeil, M.M.; Anderson, M.H.; Ranjan, D. Investigation of buoyancy effects on heat transfer characteristics of supercritical carbon dioxide in heating mode. J. Nucl. Eng. Radiat. Sci. 2015, 1, 031001. [Google Scholar] [CrossRef]
  18. Tanimizu, K.; Sadr, R. Experimental investigation of buoyancy effects on convection heat transfer of supercritical co2 flow in a horizontal tube. Heat Mass Transf. 2016, 52, 713–726. [Google Scholar] [CrossRef]
  19. Sun, F.; Li, Y.; Manca, O.; Xie, G.N. An evaluation on the laminar effect of buoyancy-driven supercritical hydrocarbon fuel flow and heat transfer characteristics. Int. J. Heat Mass Transf. 2019, 142, 118414. [Google Scholar] [CrossRef]
  20. Hou, J.R.; Zhou, Y.; Yuan, Y.; Huang, S.F. Numerical study on flow structure and heat transfer of supercritical co2 in tubes with different inclination angles. Prog. Nucl. Energy 2024, 168, 105028. [Google Scholar] [CrossRef]
  21. Fu, Y.C.; Huang, H.R.; Wen, J.; Xu, G.Q.; Zhao, W. Experimental investigation on convective heat transfer of supercritical rp-3 in vertical miniature tubes with various diameters. Int. J. Heat Mass Transf. 2017, 112, 814–824. [Google Scholar] [CrossRef]
  22. Cheng, L.Y.; Xu, J.L.; Cao, W.X.; Zhou, K.P.; Liu, G.L. Supercritical carbon dioxide heat transfer in horizontal tube based on the froude number analysis. Energy 2024, 294, 130980. [Google Scholar] [CrossRef]
  23. Li, Y.; Sun, F.; Sunden, B.; Xie, G.N. Turbulent heat transfer characteristics of supercritical n-decane in a vertical tube under various operating pressures. Int. J. Energy Res. 2019, 43, 4652–4669. [Google Scholar] [CrossRef]
  24. Adebiyi, G.A.; Hall, W.B. Experimental investigation of heat transfer to supercritical pressure carbon dioxide in a horizontal pipe. Int. J. Heat Mass Transf. 1976, 19, 715–720. [Google Scholar] [CrossRef]
  25. Pu, H.; Li, S.F.; Dong, M.; Jiao, S.; Wang, Y.; Shang, Y. Convective heat transfer and flow resistance characteristics of supercritical pressure hydrocarbon fuel in a horizontal rectangular mini-channel. Exp. Therm. Fluid Sci. 2019, 108, 39–53. [Google Scholar] [CrossRef]
  26. Petukhov, B.S.; Polyakov, A.F.; Kuleshov, V.A.; Sheckter, Y.L. Turbulent flow and heat transfer in horizontal tubes with substantial influence of thermogravitational forces. In International Heat Transfer Conference Digital Library; Begel House Inc.: Danbury, CT, USA, 1974. [Google Scholar]
  27. Tian, R.; Wang, D.B.; Zhang, Y.; Ma, Y.Z.; Li, H.; Shi, L. Experimental study of the heat transfer characteristics of supercritical pressure r134a in a horizontal tube. Exp. Therm. Fluid Sci. 2019, 100, 49–61. [Google Scholar] [CrossRef]
  28. Deng, H.W.; Zhang, C.B.; Xu, G.Q.; Tao, Z.; Zhu, K.; Wang, Y.J. Visualization experiments of a specific fuel flow through quartz-glass tubes under both sub- and supercritical conditions. Chin. J. Aeronaut. 2012, 25, 372–380. [Google Scholar] [CrossRef]
  29. Zhang, C.B.; Deng, H.W.; Xu, G.Q.; Huang, W.; Zhu, K. Enthalpy measurement and heat transfer investigation of rp-3 kerosene at supercritical pressure. J. Aerosp. Power 2010, 25, 331–335. [Google Scholar]
  30. Deng, H.W.; Zhu, K.; Xu, G.Q.; Tao, Z.; Zhang, C.B.; Liu, G.Z. Isobaric specific heat capacity measurement for kerosene rp-3 in the near-critical and supercritical regions. J. Chem. Eng. Data 2012, 57, 263–268. [Google Scholar] [CrossRef]
  31. Deng, H.W.; Zhang, C.B.; Xu, G.Q.; Tao, Z.; Zhang, B.; Liu, G.Z. Density measurements of endothermic hydrocarbon fuel at sub- and supercritical conditions. J. Chem. Eng. Data 2011, 56, 2980–2986. [Google Scholar] [CrossRef]
  32. Deng, H.W.; Zhang, C.B.; Xu, G.Q.; Zhang, B.; Tao, Z.; Zhu, K. Viscosity measurements of endothermic hydrocarbon fuel from (298 to 788) k under supercritical pressure conditions. J. Chem. Eng. Data 2012, 57, 358–365. [Google Scholar] [CrossRef]
  33. Wu, K.; Feng, Y.; Li, D.S.; Xu, S.; Qin, J.; Huang, H.Y. Experimental investigations on transient flow and heat transfer characteristics of rp-3 at supercritical pressure. Appl. Therm. Eng. 2022, 213, 118678. [Google Scholar] [CrossRef]
  34. Yu, S.Q.; Li, H.X.; Lei, X.L.; Feng, Y.C.; Zhang, Y.F.; He, H.; Wang, T. Influence of buoyancy on heat transfer to water flowing in horizontal tubes under supercritical pressure. Appl. Therm. Eng. 2013, 59, 380–388. [Google Scholar] [CrossRef]
  35. Wang, K.Z.; Xu, X.X.; Wu, Y.Y.; Liu, C.; Dang, C.B. Numerical investigation on heat transfer of supercritical co2 in heated helically coiled tubes. J. Supercrit. Fluids 2015, 99, 112–120. [Google Scholar] [CrossRef]
  36. Fan, X.J.; Yu, G.; Li, J.G.; Yue, L.J.; Zhang, X.Y.; Sung, C. Effects of entry conditions on cracked kerosene-fueled supersonic combustor performance. Combust. Sci. Technol. 2007, 179, 2199–2217. [Google Scholar] [CrossRef]
Figure 1. Diagram of the experimental system.
Energies 17 03247 g001
Figure 2. Schematic diagram of the experimental section.
Energies 17 03247 g002
Figure 3. The physical model of the micro-channel.
Energies 17 03247 g003
Figure 4. Thermal properties of RP-3 at 3 MPa [29,30,31,32].
Energies 17 03247 g004
Figure 5. Schematic diagram of the mesh.
Energies 17 03247 g005
Figure 6. Results of wall temperatures for different mesh counts.
Energies 17 03247 g006
Figure 7. Comparison of simulation and experimental results.
Energies 17 03247 g007
Figure 8. Temperature distribution diagram. (a) z = 0 cross-sectional temperature contour maps. (b) Temperature contour maps for different cross sections. (c) Wall temperature, fluid temperature, and heat-transfer coefficient.
Energies 17 03247 g008
Figure 9. Velocity distribution map. (a) z = 0 cross-sectional velocity contour maps. (b) Dimensionless velocity. (c) contour maps of the uy component across different cross-sections.
Energies 17 03247 g009
Figure 10. Distribution of turbulent kinetic energy. (a) z = 0 cross-sectional turbulent kinetic energy contour map. (b) Dimensionless turbulent kinetic energy.
Energies 17 03247 g010
Figure 11. The impact of mass flux. (a) Wall temperature and fluid temperature. (b) Wall temperature difference. (c) Heat-transfer coefficient along the path.
Energies 17 03247 g011
Figure 12. The impact of inlet temperature. (a) Wall temperature and fluid temperature. (b) Wall temperature difference. (c) Heat-transfer coefficient along the path.
Energies 17 03247 g012
Figure 13. The impact of gravitational acceleration. (a) Wall temperature and fluid temperature. (b) Wall temperature difference. (c) heat-transfer coefficient along the path.
Energies 17 03247 g013
Figure 14. Longitudinal variation of the buoyancy criterion number.
Energies 17 03247 g014
Table 1. Parameter uncertainty.
Experimental ParametersUncertainties
Mass flux/kg·m−2·s−10.43%
Heat flux/W·m−23.03%
Heat-transfer coefficient/kW·m−2·K−17.64%
Wall temperature/K±0.5 K
Fluid temperature/K±0.5 K
Disclaimer/Publisher’s Note: The statements, opinions and data contained in all publications are solely those of the individual author(s) and contributor(s) and not of MDPI and/or the editor(s). MDPI and/or the editor(s) disclaim responsibility for any injury to people or property resulting from any ideas, methods, instructions or products referred to in the content.

