Abstract
In this paper, the limestone reservoir of the Upper Permian Taiyuan Formation in the Ordos Basin is taken as the research object. Through various analysis and testing methods, the characterization and classification evaluation of pore structure were carried out. The core porosity and pore structure characteristics were analyzed using nuclear magnetic resonance, gas measurement, and CT scanning. Based on the characteristics of the limestone reservoir, the optimal parameters of NMR testing were calibrated, the NMR testing method of limestone reservoir properties was established, and the NMR porosity of limestone was calculated. Using the core gray map obtained using CT scanning imaging technology, the three-dimensional digital core model of limestone was constructed, its pore space was extracted, and the porosity, pore fractal dimension, and tortuosity were calculated. The results show that with the thermodynamic experiment, the porosity of the sample will remain basically unchanged after 180 min, and the pressure in the sample was measured after 4 h and no air leakage was found. The T2 spectrum of saturated marlite is in the form of three peaks, two peaks, and one peak. On the whole, the p1 peak of the T2 spectrum of limestone corresponds to micropores, and most of the p2 and p3 peaks correspond to mesopores–macropores. The pore size of high porosity samples is 150–350 nm, and the micropores are well developed; the pore size of medium porosity samples is 80–150 nm, and some samples are well developed; the pore size of low porosity samples is mostly bimodal, with two peaks >> 300 nm and <<100 nm. With the increase in depth, the porosity decreases gradually, the fractal dimension decreases, and the tortuosity increases. The research results provide data support for the characterization of the pore structure of the limestone reservoir in the Taiyuan Formation of the Ordos Basin.
1. Introduction
With the rapid development of conventional reservoirs around the world, the reserves of conventional high-quality reservoirs have gradually decreased sharply, and the reserves and production of tight oil and gas have increased year by year, becoming the main reservoir of global oil and gas production. The Ordos Basin, as the main onshore oil field in China, is rich in oil and gas resources, one of the important oil-bearing basins, and one of the earliest exploration and development areas [1]. The Taiyuan Formation in the Ordos Basin is the product of the last transgression climax, and its limestone gas is a brand-new field of unconventional gas. Studying the pore structure of Taiyuan Formation limestone in the east of the Ordos Basin lays a solid theoretical foundation for oil and gas exploration and development and increases oil and gas production in this region, provides technical support for oil and gas exploration and deployment, and provides ideas for the gas-bearing prediction of limestone in other regions [2,3,4,5].
Some achievements have been made in the study of reservoir pore structure characterization. Yan et al. (2023) proposed the observation method of scanning electron microscopy to characterize pore structure. By using image quantitative analysis technology, a series of parameters reflecting the pore size, distribution area, and perimeter were obtained, and the influence of these quantitative parameters on reservoir physical properties was studied [6]. Zhang et al. (2023) put forward image quantitative analysis technology to characterize pore structure. Because pore throat characteristics cannot be effectively characterized by a three-dimensional angle, the characteristics of pore distribution and pore size distribution in three-dimensional space can be effectively determined by combining the method of ion beam scanning electron microscopy (FIB-SEM) with image processing software [7]. Zhang et al. (2022) used a high-pressure mercury injection method to measure pore structure, and mercury was injected into the pore throat of rock to form a certain level of capillary resistance to prevent the intrusion of mercury. When the pressure required for mercury injection into the pore throat was the same as the pore throat resistance, the mercury injection volume under the mercury injection pressure was measured, and the pore size and pore volume characteristics under different mercury injection pressures were obtained [8]. Wang (2021) proposed the characterization of the pore and throat characteristics of reservoir rocks using the low-temperature gas adsorption method. Through the adsorption of nitrogen and carbon dioxide on the pore surface, the pore structure and throat morphology of rocks can be directly observed, the size, shape, and distribution of pores can be understood, and the adsorption isotherm and gas adsorption capacity can be analyzed to obtain the pore structure parameters of rocks, such as pore volume and pore diameter distribution, which provide an important basis for reservoir evaluation and development [9]. Dong (2023) and others proposed CT scanning technology to characterize pore structure. Micro-cylinders were made from limestone samples, and X-ray beams penetrated limestone. Based on small-angle and ultra-small-angle scattering, the scattered radiation intensity in a specific scattering angle range was measured, and the pore structure information of limestone and the pore structure characteristics from the sub-nanometer to the sub-millimeter were obtained [10].
The pore structure characteristics of rock are the main factors that affect reservoir fluid (oil, gas, and water) storage capacity and oil and gas resource exploitation. Therefore, clarifying the pore structure characteristics of reservoir rock is the key to giving full play to oil and gas productivity and improving oil and gas recovery. There are two kinds of methods for studying the pore structure of reservoir rock: laboratory experiments (the capillary pressure curve method, the cast thin section method, the scanning electron microscopy method, and the CT scanning method) and evaluation of the pore structure of rock by using logging data (resistivity logging data and nuclear magnetic resonance logging data).
Carbonate rocks are widely developed in the Ordos Basin, and accurate characterization of reservoir pore structure is of great significance for reservoir oil and gas development. In our study, the limestone reservoir of the Taiyuan Formation in Zhoujing District, eastern Ordos Basin was taken as the research object. Based on the characteristics of the limestone reservoir, the optimal parameters of the NMR test were calibrated, and the NMR method of limestone reservoir physical properties was established to determine the NMR porosity of limestone. The core gray map was obtained by using CT scanning imaging technology, the three-dimensional digital core model of limestone was constructed to extract its pore space, and the porosity, pore fractal dimension, and tortuosity were obtained to characterize the pore structure, which provides data support for the characterization of the pore structure of the Taiyuan Formation limestone reservoir in the Ordos Basin.
2. Research Methods
2.1. Geological Characteristics of the Study Area
The Ordos Basin, located in the north of China, has a long geological age, including Paleozoic, Mesozoic, and Cenozoic strata. The basin has complete stratigraphic development and a complex geological structure, forming various types of oil and gas reservoirs. The geological structure of the basin is mainly composed of northern uplift, southern depression, and east–west fault zone, forming a number of oil and gas accumulation areas [11].
The landform of the basin is mainly plain and hilly, with small topographic relief, which is suitable for oil and gas exploration and development. Geologically, the basin is mainly composed of uplift and depression, forming a number of structural zones and fault zones, which provide good geological conditions for oil and gas migration and accumulation [12]. The lithology of strata in the basin is complex and diverse, including sandstone, mudstone, limestone, and coal seam, which provides rich exploration targets for oil and gas exploration and development. The sedimentary environment of the basin is diverse, including continental facies, lacustrine facies, and rivers, which form a rich oil and gas exploration prospect.
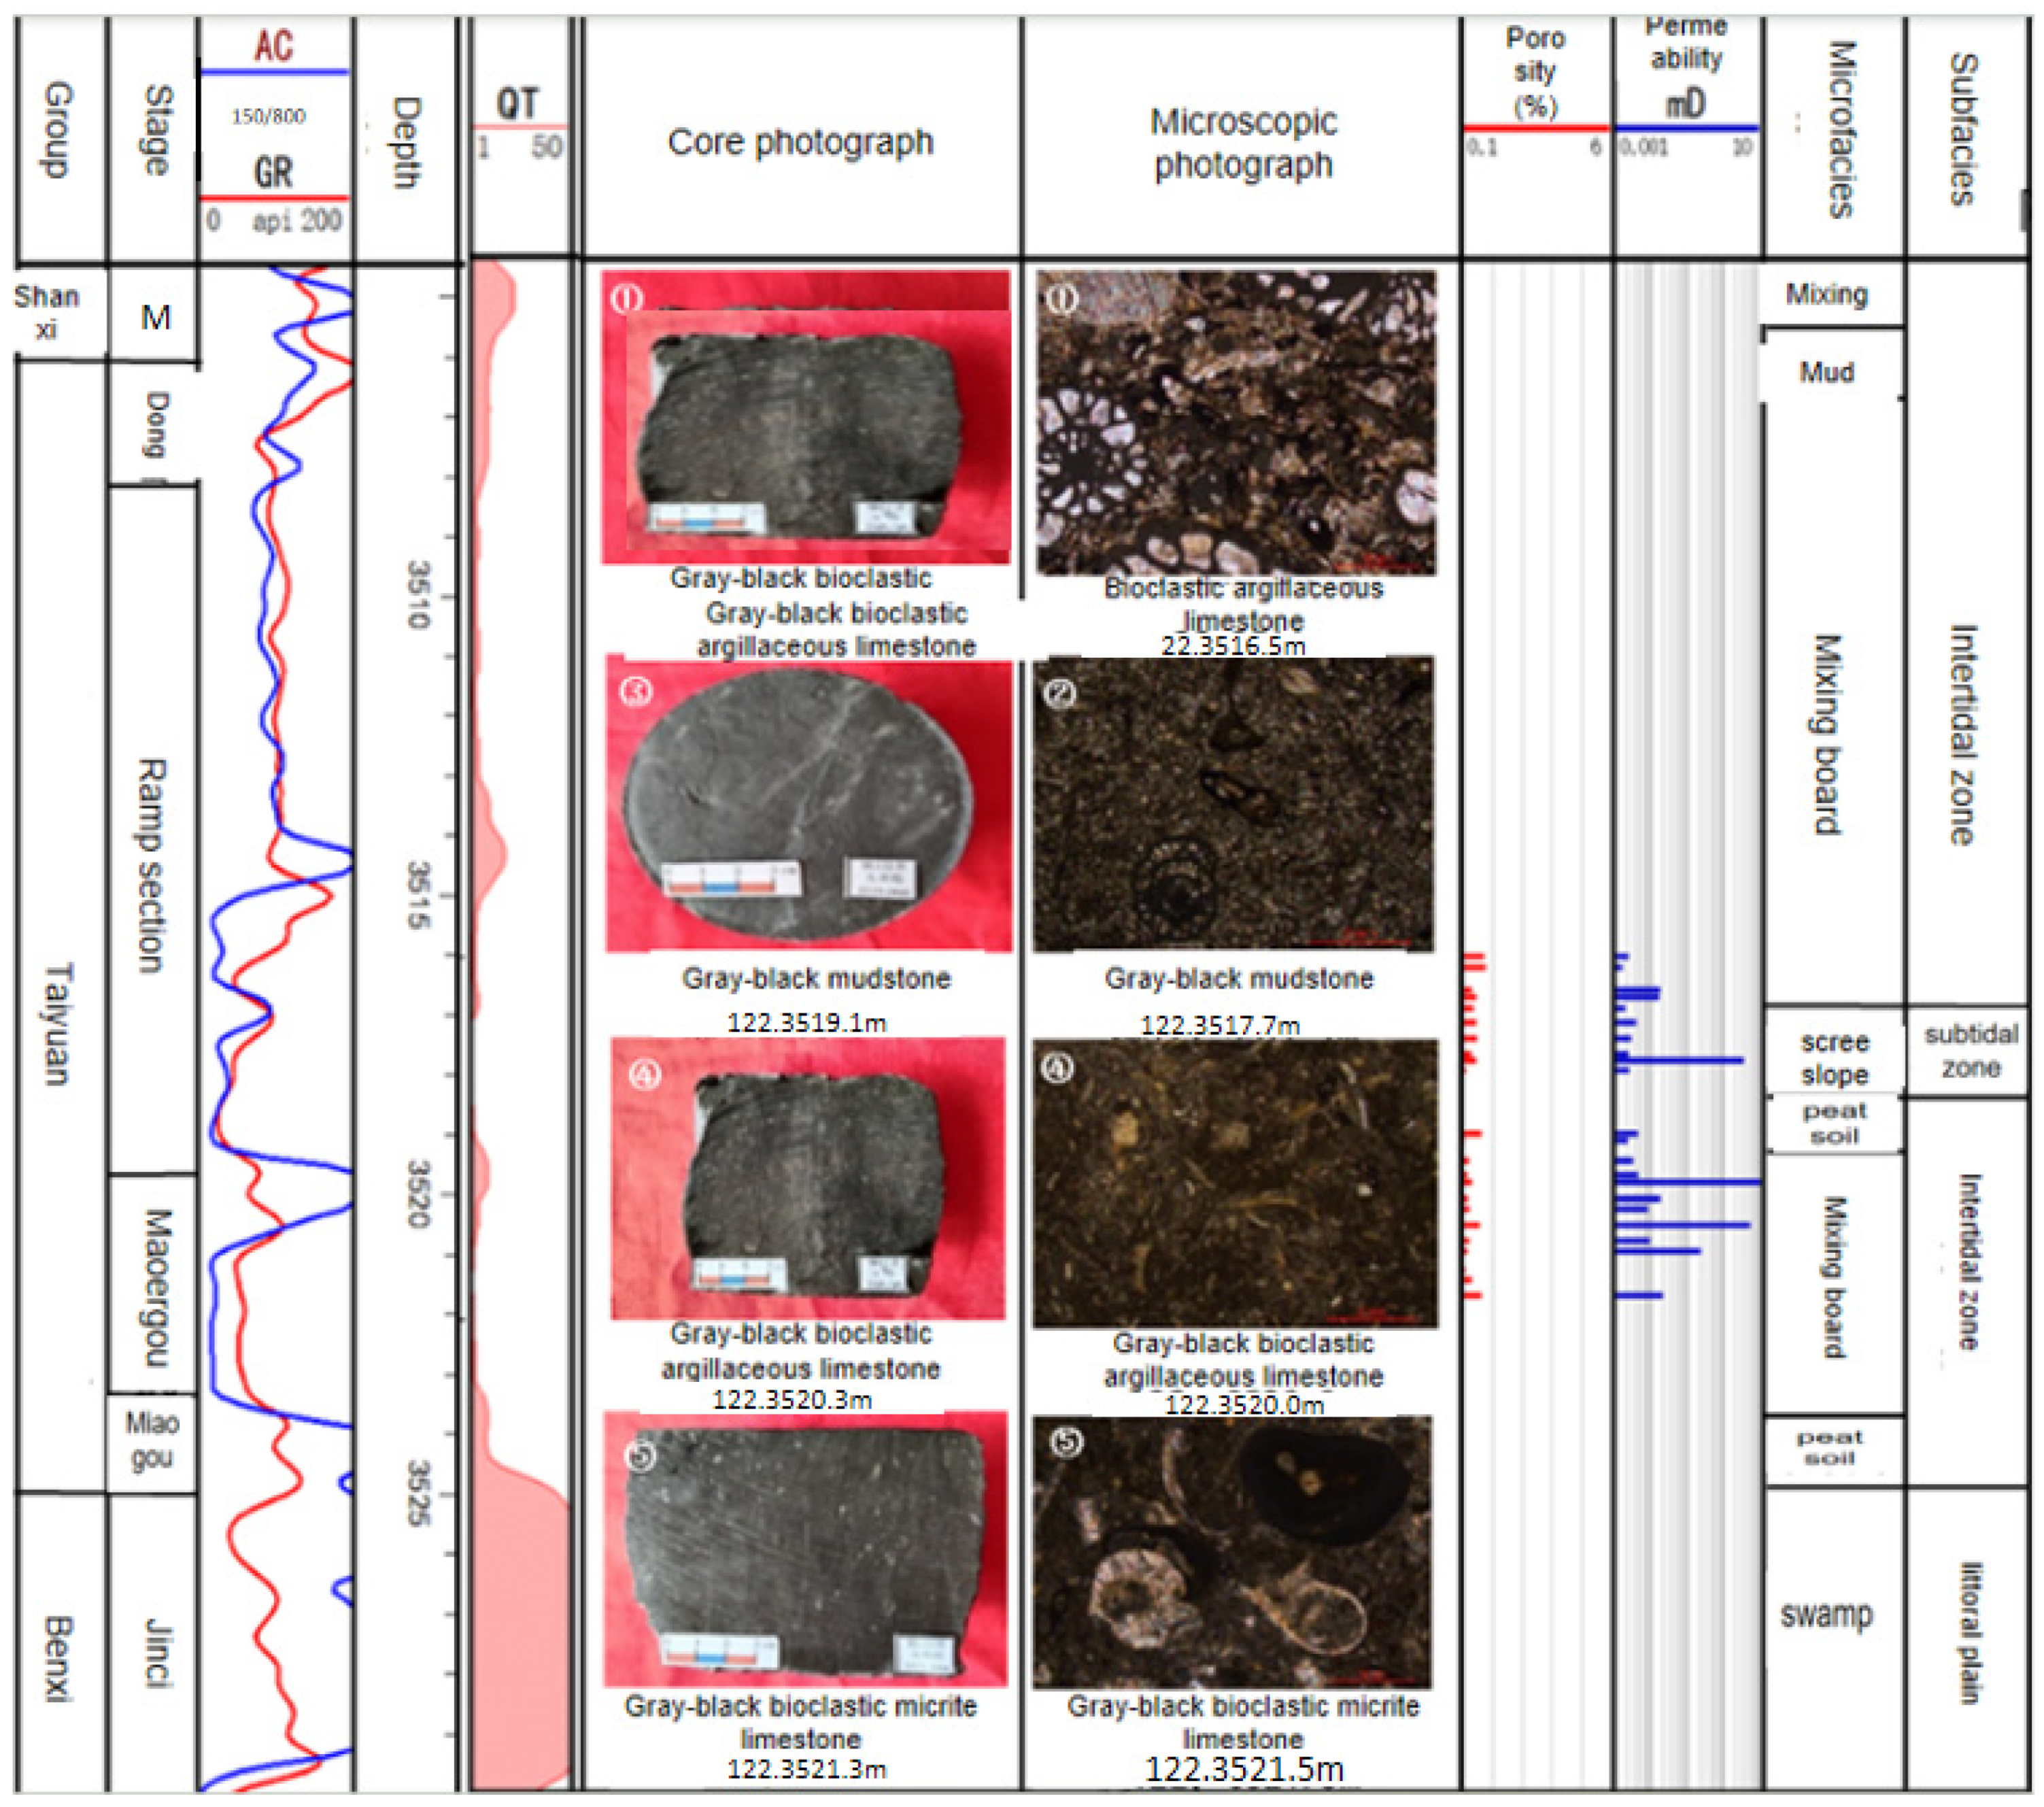
Two sets of limestone are mainly developed in the Ordos Basin, namely, the limestone of the Taiyuan Formation in the Upper Permian and Majiagou Formation in the Lower Ordovician [1]. The limestone of the Taiyuan Formation is mainly composed of matrix pores, with dense lithology, no dissolved pores, and karst caves, and belongs to a good caprock. The limestone of the Taiyuan Formation is widely distributed in the Wushenqi–Dingbian–Yan’an–Wubao area, which is divided into a tidal flat lagoon area, delta front area, and delta plain area from south to north [13]. Figure 1 shows the comprehensive histogram of sedimentary facies of the Taiyuan Formation in the Ordos Basin. The sedimentary facies of the Taiyuan Formation can be divided into Dongdayao, Chute, Maoergou, and Miaogou, in which the sedimentary thickness of Dongdayao limestone at the top and Miaogou limestone at the bottom is relatively thin, while the limestone at Chute and Maoergou is relatively thick. Generally speaking, the limestone is mainly concentrated in the middle of the study area, which is contiguous and thick and can reach 40 m thick. The thickness of limestone in the marginal area is relatively thin, basically between 10 and 20 m.

Figure 1.
Comprehensive histogram of sedimentary facies of the Taiyuan Formation in the Ordos Basin.
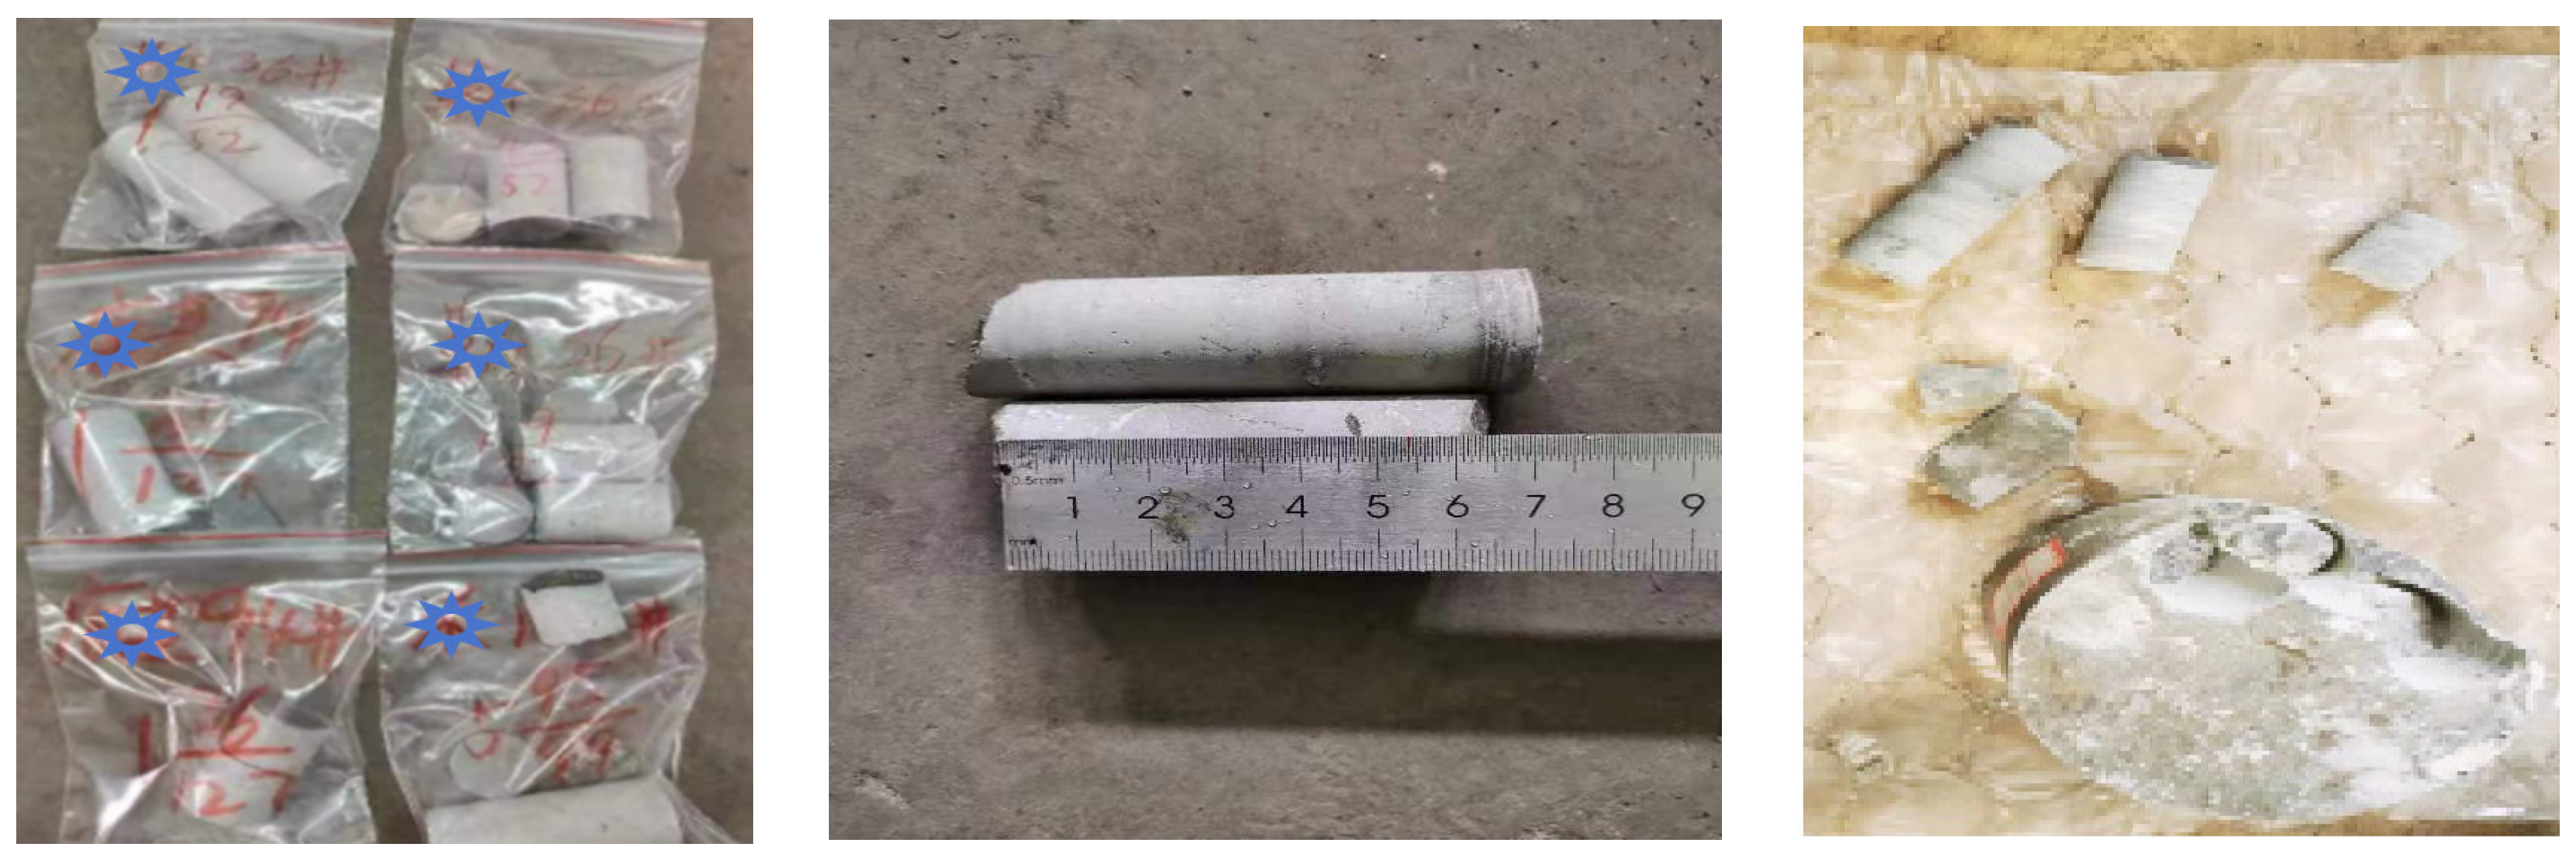
2.2. Sample Preparation
Preparation of limestone samples: A diamond cutter with a diameter of 25 mm was used to drill, and water was not added during the drilling process so as to prevent the hydration reaction between water and limestone from destroying the original pore structure. At 100 °C and 0.3 MPa, the limestone samples were washed with the mixed solution of 3 mL dichloromethane and 1mL acetone for 72 h to remove the residual oil in the pores. By analyzing the pyrolysis parameters S1 of limestone before and after oil washing, it is concluded that the residual oil in limestone pores is basically removed by the above method [14].
After oil washing, the limestone was placed in a vacuum drying oven, vacuumized at 110 °C, and dried for 24 h, and the residual fluid in the pores was fully removed and then placed in a dryer to cool to room temperature [15]. Then, a vacuum pressurizing and saturating device was used to continue vacuumizing for 24 h. The saturated n-dodecane of 5 MPa was pressurized, the limestone was weighed every other day, the saturation time of the sample was analyzed, and finally, the pores of completely saturated limestone were obtained, thus obtaining the limestone sample (Figure 2).

Figure 2.
Limestone samples.
2.3. Experimental Methods
Sample porosity equilibrium state test:
Whether the gas inside and outside the pore reaches thermodynamic equilibrium or not determines the porosity accuracy of gas logging. In this study, PoroPDP-200 from the Key Laboratory of Unconventional Oil and Gas of China Petroleum Exploration and Development Research Institute was used to measure the porosity of the samples. Firstly, the instrument was calibrated 20 min after preheating, the dried sample was put in, the length and diameter were input, and the detection pressure error was less than 0.01 to start the experiment. After calculating the skeleton volume according to Boyle’s law, the instrument automatically calculates the porosity. During each measurement, the porosity of a core can only be measured for a certain period of time, and after each point, the sample should be put into a drying dish for 10 min before making the next point. If the balance pressure error is greater than 0.04 at the end of the experiment, the experiment will be restarted. The sealing ring needs to be replaced for each sample test, and leak detection is guaranteed for 4 h [16].
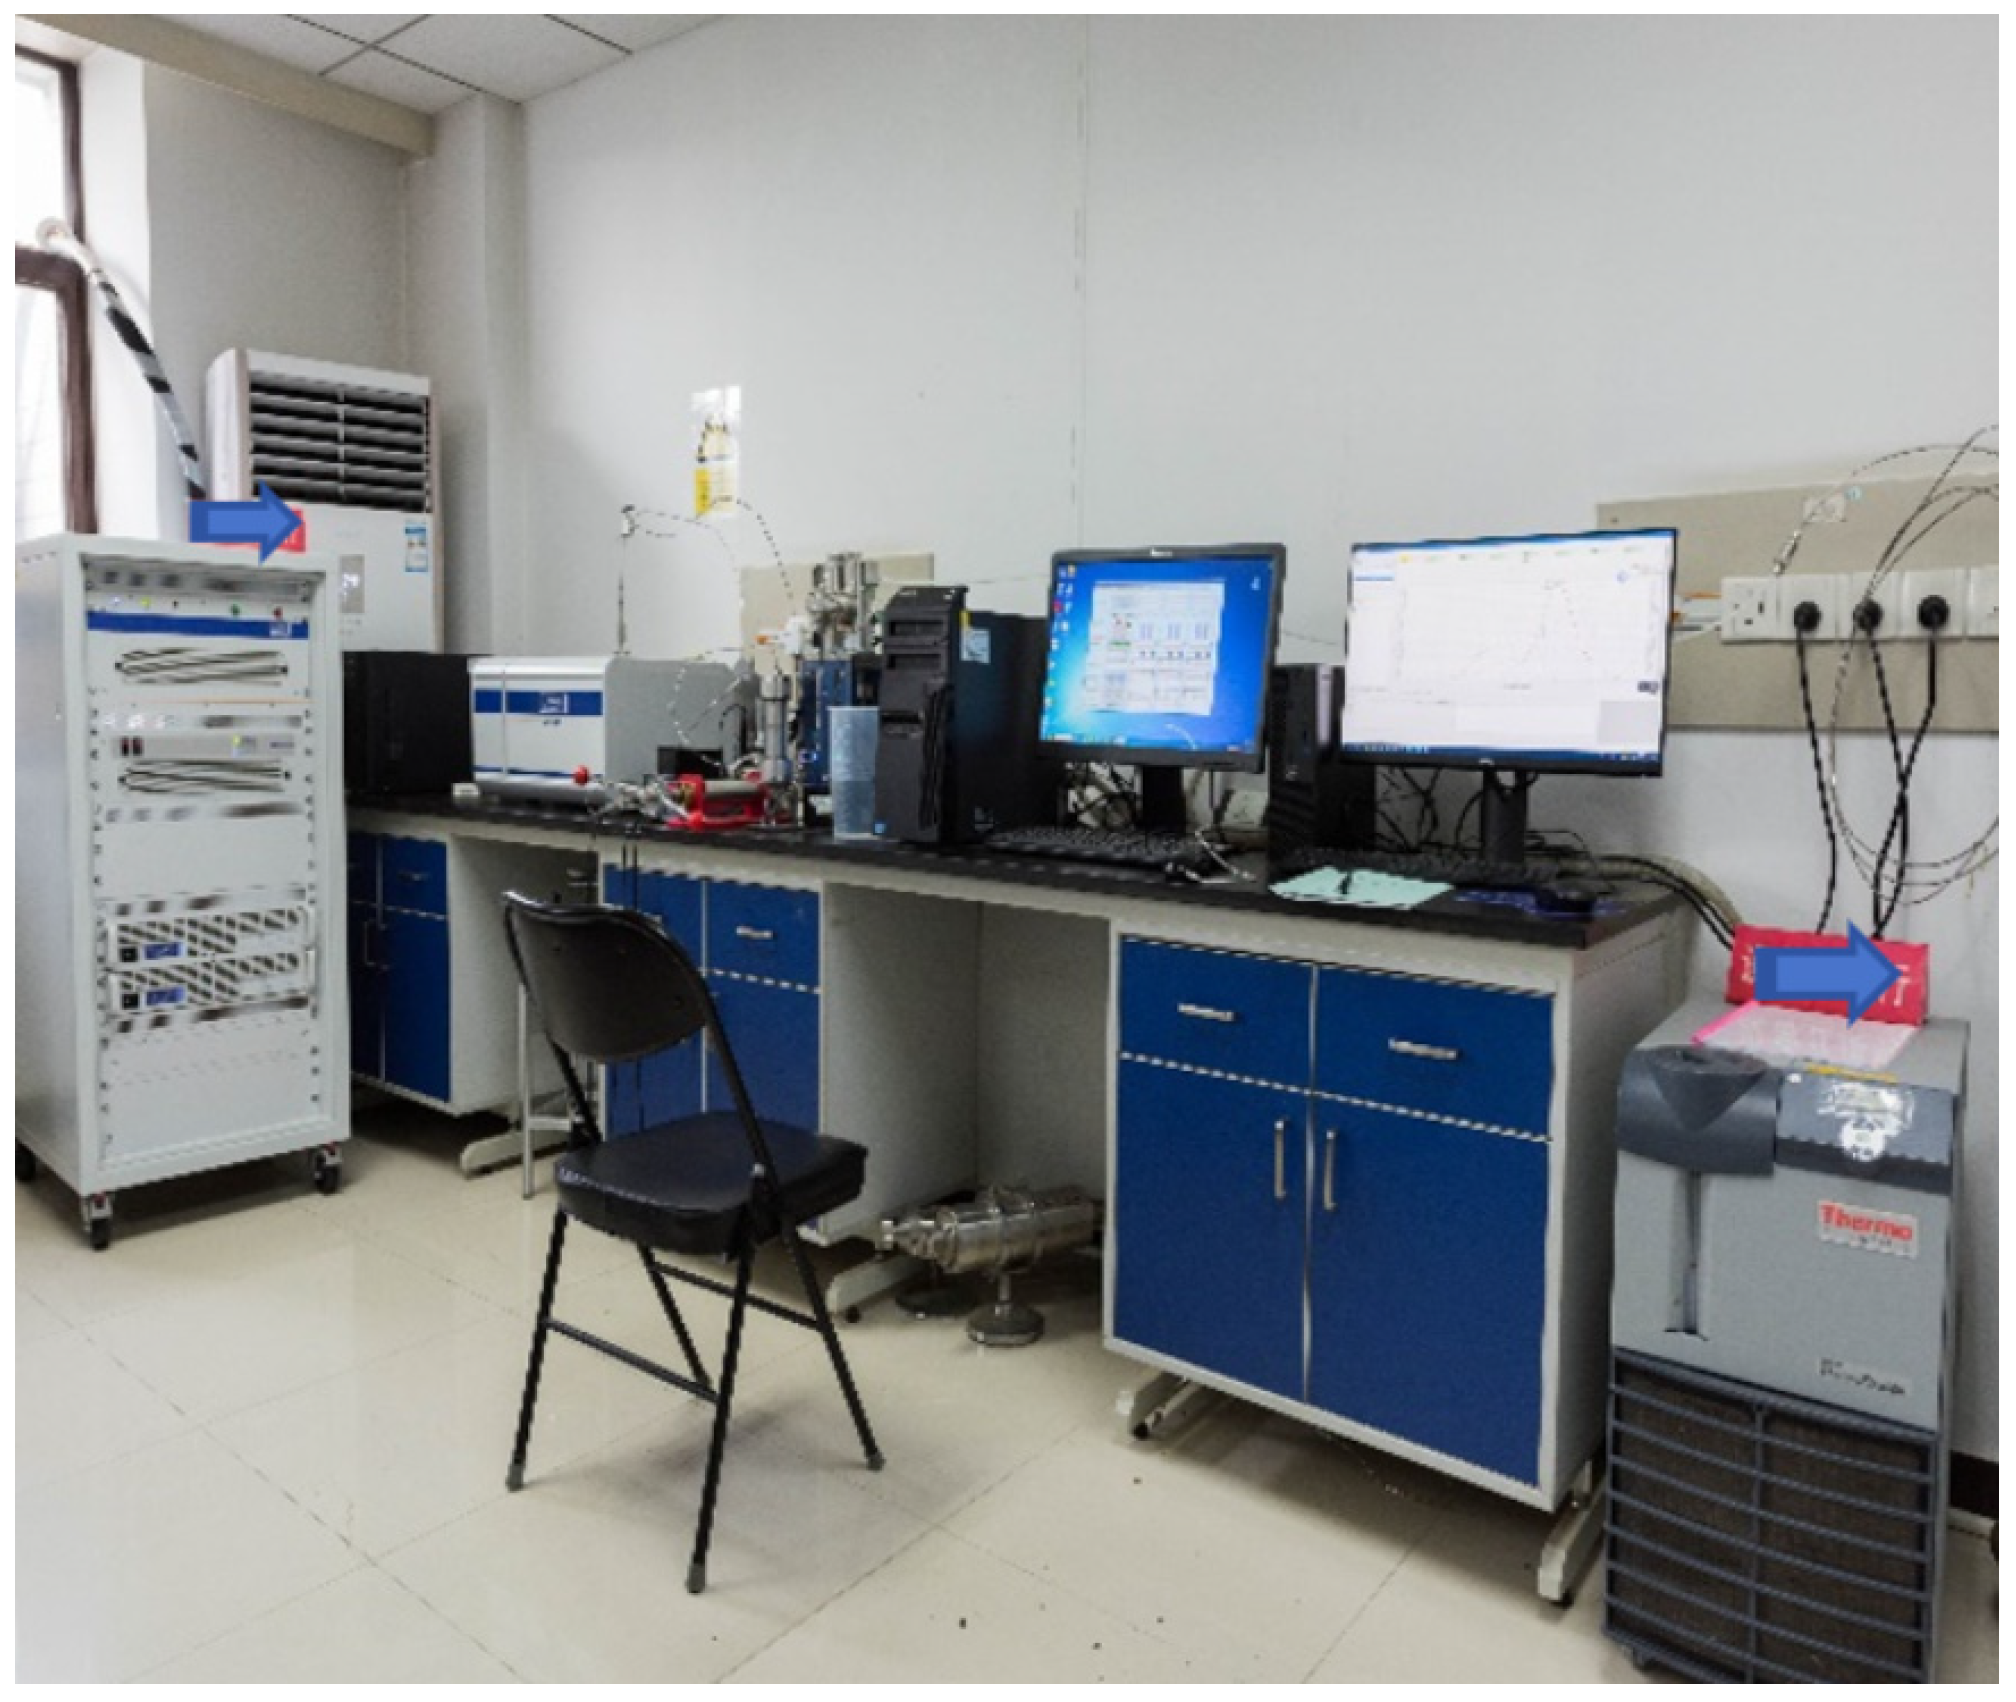
Process of the NMR experiment (Figure 3):
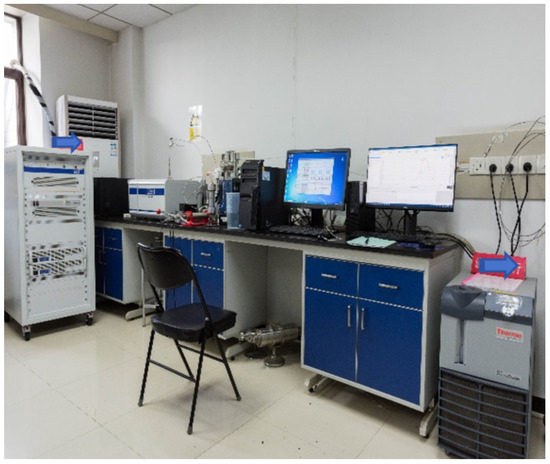
Figure 3.
NMR T2 spectrum measured using the NMR experiment.
- Thirty core samples with a smooth surface and no obvious defects were seletced, dried, and then vacuumed and pressurized to saturate the simulated formation water.
- The representative standard cores were tested using a Niumag Micro MR23-060H-1 nuclear magnetic resonance instrument (Niumag, Tianjin, China). The instrument frequency was set to 21 MHz, the magnetic field intensity was set to 0.5 T, the working temperature was kept at 30 °C, and the T2 spectrum was measured. During the test, the echo time was set to 0.07 ms, the number of scans was set to 32, and the echo number was 6000.
- The limestone sample was placed into a nuclear magnetic resonance instrument for testing and the nuclear magnetic resonance signal of the sample was obtained [17].
- After testing the nuclear magnetic resonance signal, signal enhancement, denoising, inversion, and other processes were carried out to extract the internal pore size distribution information of the sample.
- By analyzing the pore size distribution results, the pore size distribution characteristics of the limestone samples were evaluated.
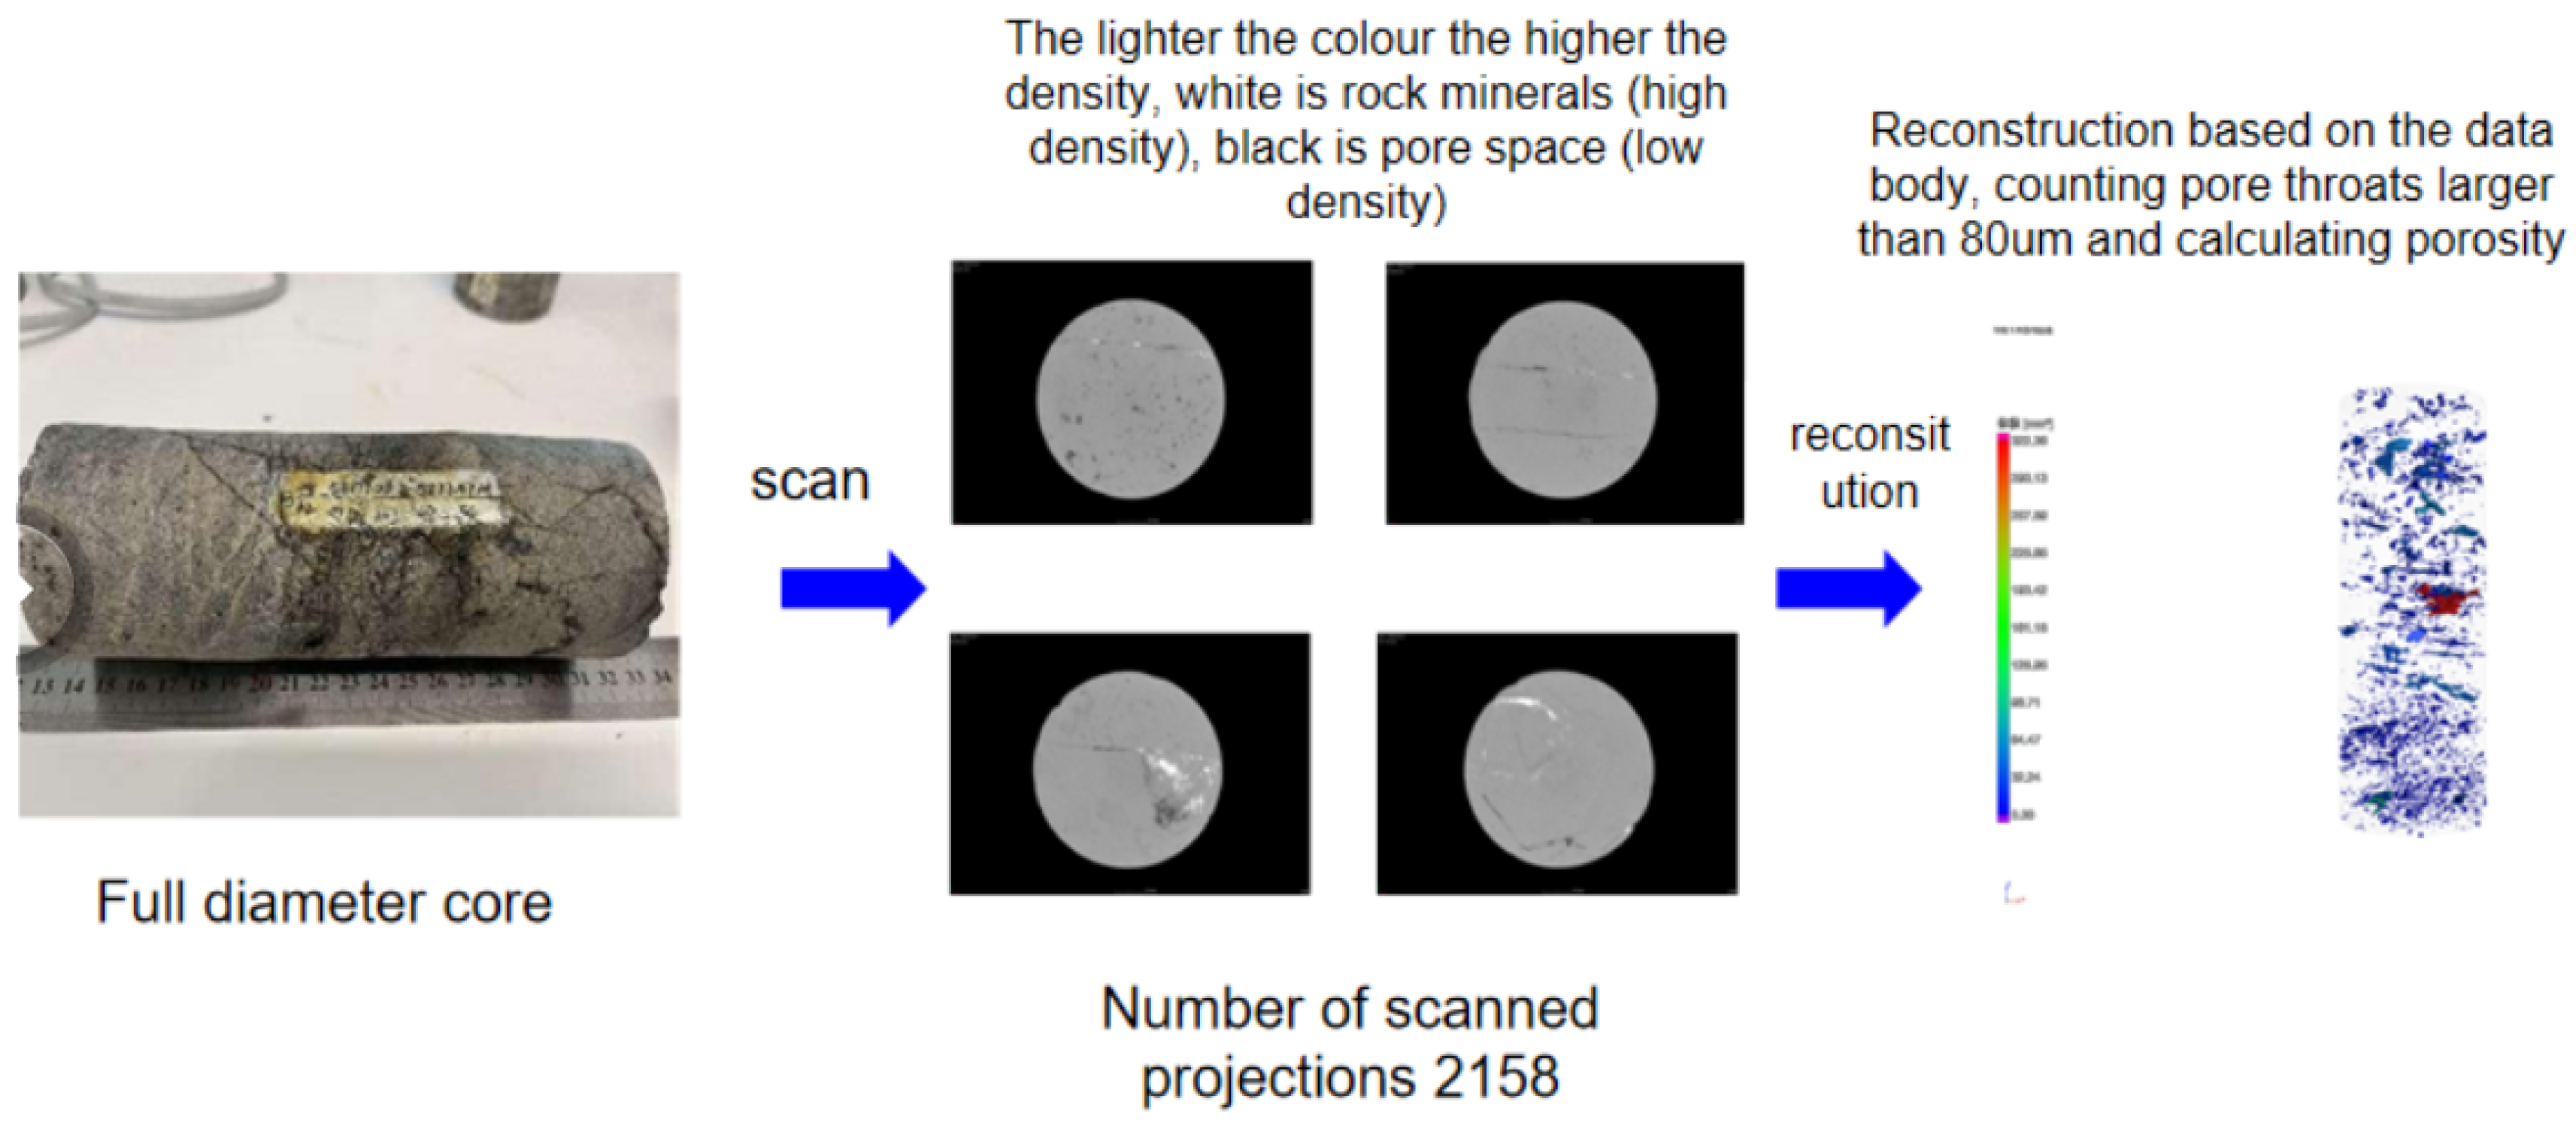
Experimental flow of CT scanning (Figure 4):
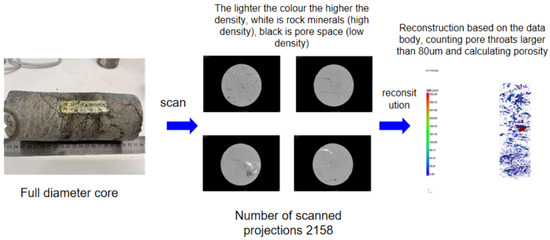
Figure 4.
Experimental flow of CT scanning.
- Select representative limestone samples with smooth surfaces and no obvious defects, cut them into 5 cm long samples, and place them in the sample cavity of the CT scanner.
- Adjust the position of the sample on the stage; turn on the X-ray source to detect and receive X-rays after absorption and attenuation; and rotate, transmit, and save the scanned two-dimensional image information. A two-dimensional slice of the test sample is obtained by each scan. By precisely rotating the stage, the sample is rotated at a small angle, and the previous scanning experiment is repeated many times until the 360 rotation and scanning are completed and the three-dimensional information of the entire sample is obtained.
- Using the GOM Volume Inspect software of a GOM Volume Inspect (ZEISS INSPECT X-ray, ZEISS, Oberkochen, Germany), the 3D image is generated by reconstructing the scanned original data. Select the appropriate reconstruction algorithm and filter to improve the image resolution. In this paper, in the process of image filtering and binarization, a sliding window was constructed, which was set to 5 pixels. When the window is in a certain position in the image, the pixel gray values are 50, 80, 100, 150, and 200, and the gray value of the window center is 100. After median filtering, the errors caused by system noise are eliminated. After filtering, the two-dimensional image is binarized, and the image only retains the skeleton and the hole [18].
- Use image analysis software to analyze the reconstructed 3D image, choose manual or automatic methods to identify and quantify the pores in limestone, determine the boundaries of the pores according to the gray value of the image, and calculate the porosity.
In this study, the 3D reconstruction of core CT images was studied. Based on the analysis of Gaussian filter theory, the image threshold was determined. The image was processed in terms of morphology. The entire process of image preprocessing was completed via layering and clipping. Following the basic idea of the volume rendering algorithm, a series of slice images were segmented and drawn. Light is emitted from each pixel of the front-end image, the light passes through the entire series of images, introduces false color values, the color information in all images is obtained, and then the unique Phong lighting model is used for image accumulation until all of the light passes through the image layer and finally generates the rendered graphics.
3. Experimental Results
3.1. Limestone Porosity Saturation State
When analyzing the pore size of limestone, the gas inside and outside the pore is in thermodynamic balance to achieve the porosity accuracy of gas measurement. Table 1 shows the porosity of samples at different times. It can be seen from Table 1 that the porosity of the sample will remain basically unchanged after 180 min with the passage of thermodynamic experiment time; at the same time, the pressure in the sample was measured for 4 h, and it was found that the pressure did not decrease, which proved that the sample was leaking and reached the porosity saturation state [19].

Table 1.
Porosity measurement results of samples at different times.
3.2. NMR Aperture Distribution Characteristics
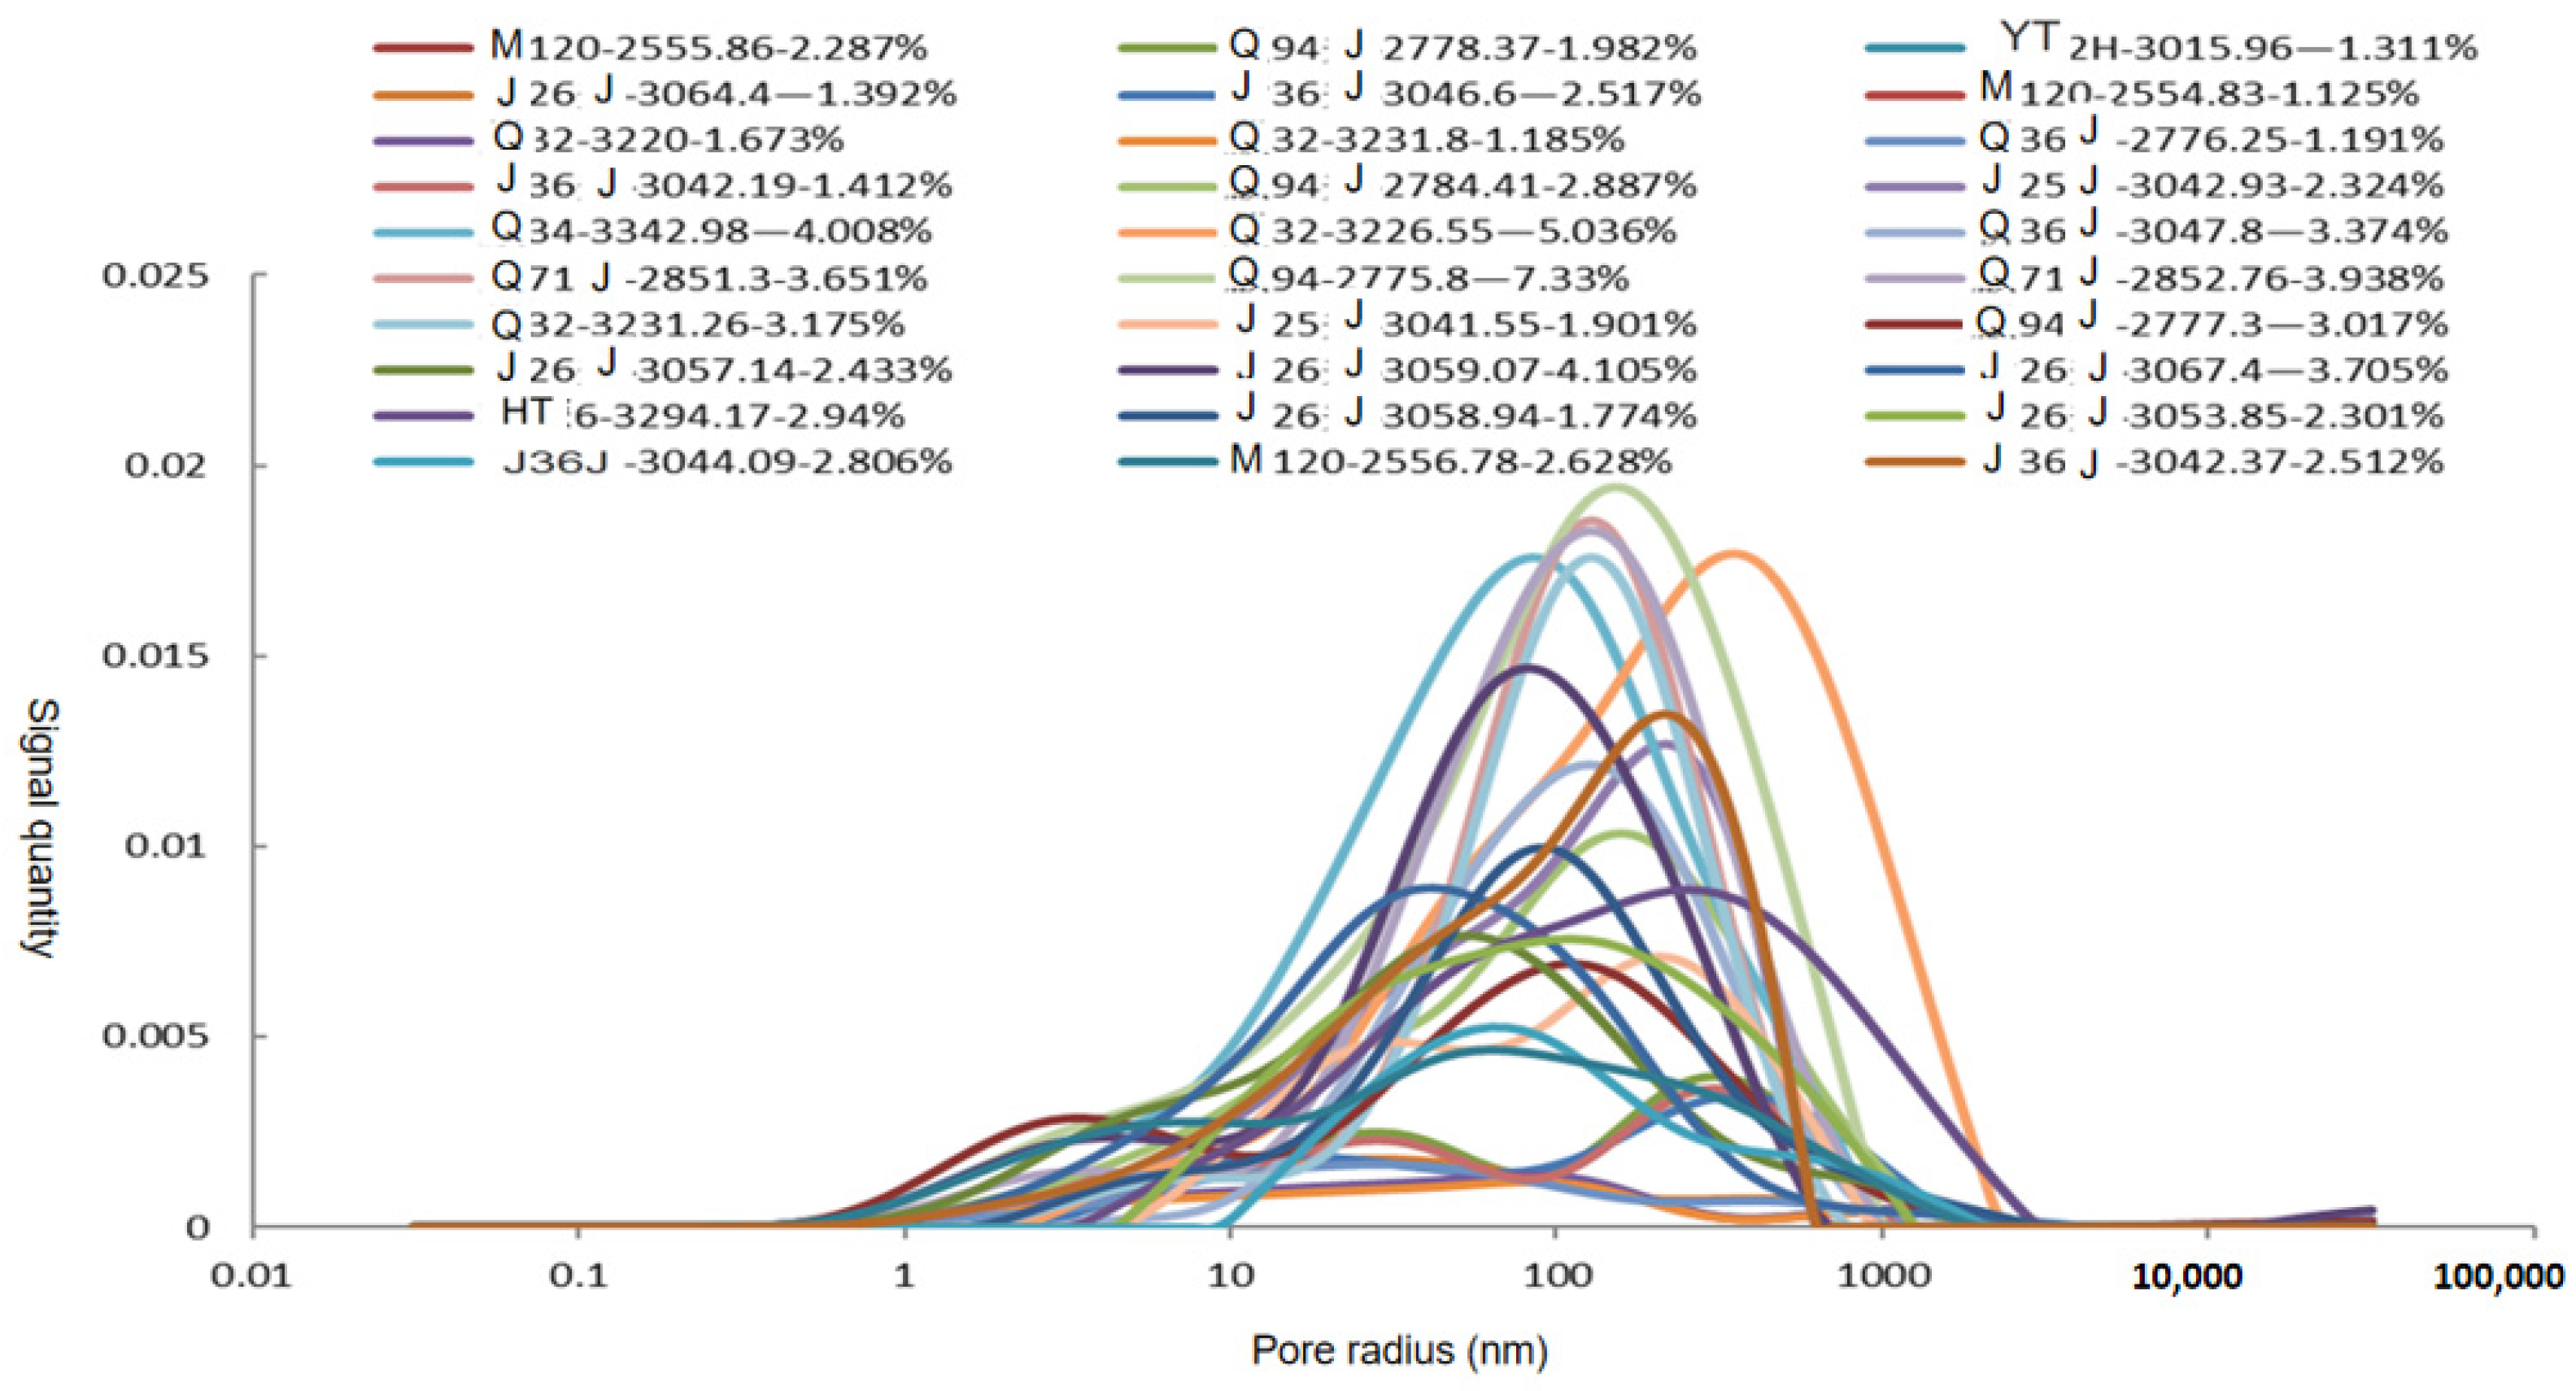
Through the NMR experiment, it was concluded that the T2 spectrum of saturated marlite is in the form of a single peak and double peak: p2 peak (10 ms < T2 < 100 ms), p1 peak (10 ms < T2), and p3 peak (100 ms < T2), bimodal distribution: p2 peak (10 ms < T2 < 100 ms) and p1 peak (10 ms < T2); single-peak distribution: p1 peak (10 ms < T2). On the whole, the P1 peak of the limestone T2 spectrum corresponds to micropores, and most of the p2 and p3 peaks correspond to mesopores–macropores. Figure 5 shows the pore radius distribution characteristics of limestone in different wells. As can be seen from Figure 5, the average pore size of limestone ranges from 50 nm to 200 nm, with an average of 120.86 nm, with the highest content of 85.91% at 10–300 nm, 11.11% below 10 nm, and 3% above 300 nm [20].
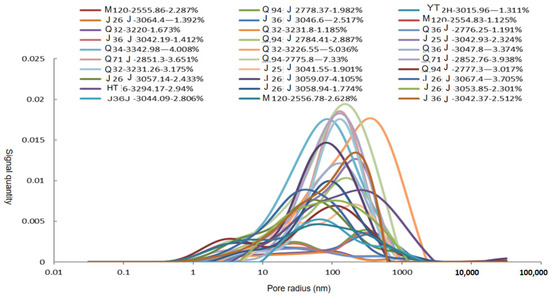
Figure 5.
Pore radius distribution characteristics of limestone in different wells.
By analyzing the characteristics of NMR T2 spectra of samples with different porosity, it was concluded that the pore size distribution of high-porosity samples is mainly between 150 and 350 nm, and the micropores are relatively developed; the pore size distribution of medium porosity samples is between 80 and 150 nm, and some samples have well-developed micropores. The main pore size of low-porosity samples is a bimodal distribution, with two peaks >> 300 nm and <<100 nm, but the signal amount is generally biased [21].
3.3. X-ray CT Scanning Aperture Distribution Characteristics
Through X-ray CT scanning, the reconstructed three-dimensional images were analyzed using image analysis software InVesalius (3.1.1). It can be seen from the three-dimensional image that Sample 3 has few pores and obvious cracks, and the pores are mainly developed between 200 and 300 nm, and pores between 500 and 600 nm are few; Sample 4 is very dense, mainly developing pores between 200 and 400 nm, with few pores larger than 200–400 nm; the number of pores in Sample 7 is moderate, mainly developing pores between 200 and 300 nm, with few between 500 and 600 nm; Sample 22 is dense, with few pores, mainly developing pores between 200 and 300 nm, with few pores between 500 and 600 nm. Sample 2 is dense and has few pores, mainly developing pores between 200 and 300 nm, with few pores between 500 and 600 nm. Sample 101 is dense, with few pores, mainly developing pores between 200 and 300 nm, with few pores between 500 and 600 nm. Sample 104 is very dense, with few pores, mainly between 100 and 200 nm, and few pores between 400 and 500 nm.
Table 2 shows the characteristics of porosity, fractal dimension, and tortuosity of the samples. As can be seen from Table 2, with the increase in depth, the porosity decreases gradually as a whole because the rocks below the groundwater level are subjected to greater pressure, which leads to a more compact structure and reduced pore space, and at the same time, dissolved substances in the groundwater may fill part of the pore space and reduce porosity; With the increase in depth, the fractal dimension shows a decreasing trend, which is mainly due to the gradual stabilization of pore dimension after the depth reaches a certain level. With the increase in depth, the tortuosity also increases because the oil gas flow in the pores is subject to more resistance and friction, which leads to more twists and turns.
Table 2.
Characteristics of porosity, fractal dimension, and tortuosity of the CT scanning samples.
The carbonate reservoir types of the Permian Taiyuan Formation are mainly micrite clastic limestone, algal bonded limestone, clastic micrite limestone, and pelletic limestone, among which clastic micrite and algal-bonded limestone are favorable reservoir lithologies. Biocoelomic pores, intercrystalline pores, solution pores, and micro-fractures are widely developed, and the reservoir is generally porous, accompanied by a fissure–pore reservoir. Reservoir performance is good, the distribution of carbonate reservoirs is stable, and it is a favorable place for gas accumulation. The Taiyuan Formation in the central and eastern parts of the Ordos Basin are divided into three categories: marine carbonate rock, mixed stone, and terrigenous clastic rock.
They are micrite, (containing) clastic micrite, clastic limestone, tut limestone, (containing sand) sandy limestone, algal bonded limestone, clastic micrite limestone, pelletic limestone, etc.
4. Conclusions
In this study, the limestone reservoir of the Upper Permian Taiyuan Formation in the Ordos Basin was taken as the research object, and the characterization and classification evaluation of pore structure were carried out using various analysis and testing methods. Based on the characteristics of the limestone reservoir, the optimal parameters of the NMR test were calibrated, the NMR test method of limestone reservoir properties was established, the NMR porosity of limestone was calculated, and the three-dimensional digital core model of limestone was constructed by using the core gray map obtained using CT scanning imaging technology. The pore space was extracted, and the porosity, pore fractal dimension, and tortuosity were calculated to characterize the pore structure. The main research conclusions are as follows:
- (1)
- The accuracy of gas porosity measurement is based on the thermodynamic equilibrium of gas inside and outside the pore. During the thermodynamic experiment, the porosity of the sample will remain basically unchanged after 180 min. After 4 h of the experiment, the pressure in the sample was measured, and no gas leakage was found, indicating that the sample had reached the porosity saturation state.
- (2)
- The T2 spectrum of saturated marlite is in the form of three peaks, two peaks, and one peak. On the whole, the p1 peak of the T2 spectrum of limestone corresponds to micropores, and most of the p2 and p3 peaks correspond to mesopores–macropores. The average pore size of limestone is 120.86 nm, and the pore size of 10–300 nm is the highest, reaching 85.91%. The pore size of high-porosity samples is 150–350 nm, and the micropores are well developed. The pore size of medium porosity samples is 80–150 nm, and some samples are well developed. The pore size of low-porosity samples is mostly bimodal, with two peaks >> 300 nm and <<100 nm.
- (3)
- Through X-ray CT scanning, the reconstructed three-dimensional images were analyzed using image analysis software, and the pore distribution, pore characteristics, fractal dimension, and tortuosity characteristics of the different samples were obtained. With the increase in depth, the overall porosity decreases gradually, the fractal dimension decreases, and the tortuosity increases continuously.
Author Contributions
Conceptualization, D.Z.; Methodology, D.Z.; Software, Y.L.; Validation, Y.L.; Formal analysis, G.D.; Investigation, G.D. and C.L.; Resources, B.L. and X.Z.; Data curation, B.L. and X.Z.; Writing—original draft, X.Z.; Writing—review & editing, X.Z.; Visualization, X.Z.; Supervision, X.Z.; Project administration, C.L. All authors have read and agreed to the published version of the manuscript.
Funding
This research received no external funding.
Data Availability Statement
The figures and tables used to support the findings of this study are included in the article.
Acknowledgments
The authors would like to express their sincere thanks to the developers of the techniques that contributed to this research.
Conflicts of Interest
Authors Daofeng Zhang, Yan Liu, Guodong Dong, Baoxian Liu and Cheng Li were employed by the Research Institute of Petroleum Exploration& Development, Changqing Oil Field Company. The remaining authors declare that the research was conducted in the absence of any commercial or financial relationships that could be construed as a potential conflict of interest.
References
- Kong, L.; Yin, Z.; Chen, Y.; Dong, Z.; Xu, J. Pore Structure Evolution and Failure Mechanism of Limestone in the Taiyuan Formation of the Ordos Basin under High Temperature. ACS Omega 2024, 9, 10177–10189. [Google Scholar] [CrossRef] [PubMed]
- Guo, Y.; Gui, H.; Wei, J.; Pang, Y.; Hu, M.; Zhang, Z.; Nie, F.; Hong, H.; Cui, Y.; Zhao, J. Hydrogeochemical evolution of Taiyuan Formation limestone water under the disturbance of water inrush from karst collapse column in Taoyuan Coal Mine, China. Water Supply 2022, 22, 8196–8210. [Google Scholar] [CrossRef]
- Lv, D.; Fan, W.; Ejembi, J.I.; Wu, D.; Wang, D.; Li, Z.; Li, J.; Li, P. Depositional environments of limestones from the Taiyuan Formation in the North China Block interpreted from REE proxies. Carbonates Evaporites 2020, 35, 363–372. [Google Scholar] [CrossRef]
- Wang, M.; Gui, H.; Hu, R.; Zhao, H.; Li, J.; Yu, H.; Fang, H. Hydrogeochemical Characteristics and Water Quality Evaluation of Carboniferous Taiyuan Formation Limestone Water in Sulin Mining Area in Northern Anhui, China. Int. J. Environ. Res. Public Health 2019, 16, 2512. [Google Scholar] [CrossRef] [PubMed]
- Chen, S.; Gui, H. The geochemical (alkaline earth) characteristics of groundwater in the Taiyuan Formation limestone aquifer in Huaibei coalfield. Water Pract. Technol. 2019, 14, 217–228. [Google Scholar] [CrossRef]
- Yan, Z.; Liu, G.; Sun, R.; Tang, Q.; Wu, D.; Wu, B.; Zhou, C. Geochemistry of rare earth elements in groundwater from the Taiyuan Formation limestone aquifer in the Wolonghu Coal Mine, Anhui province, China. J. Geochem. Explor. 2023, 135, 54–62. [Google Scholar] [CrossRef]
- Zhang, Z.; Lv, D.; Hower, J.C.; Wang, L.; Shen, Y.; Zhang, A.; Xu, J.; Gao, J. Geochronology, mineralogy, and geochemistry of tonsteins from the Pennsylvanian Taiyuan Formation of the Jungar Coalfield, Ordos Basin, North China. Int. J. Coal Geol. 2023, 267, 104183. [Google Scholar] [CrossRef]
- Zhang, L.; Zhao, Q.; Wu, C.; Qiu, Z.; Zhang, Q.; Wang, Y.; Liu, D.; Dong, D.; Zhou, S. Pore structures of the lower Permian Taiyuan shale and limestone in the Ordos Basin and the significance to unconventional natural gas generation and storage. Geofluids 2022, 2022, 3156547. [Google Scholar] [CrossRef]
- Wang, H.; Zhang, L.; Zhao, Q.; Qiu, Z.; Liu, D.; Zhang, Q.; Wang, Y.; Dong, D. Reservoir characteristics of the lower permian marine-continental transitional shales: Example from the Shanxi Formation and Taiyuan Formation in the Ordos Basin. Geofluids 2021, 2021, 9373948. [Google Scholar] [CrossRef]
- Dong, G.; Liu, X.; Yin, L.; Fu, X.; Song, J.; Zhao, X.; Pei, W. Development characteristics and genetic analysis of dense limestone reservoirs in the Taiyuan Formation of the Ordos Basin, China. J. Nat. Gas Geosci. 2023, 8, 307–317. [Google Scholar] [CrossRef]
- Yin, J.; Hu, P.; Guo, Y.; Li, Y.; Luo, S. Petrological Characteristics and Hydrocarbon Generation of Carbonate Source Rocks of the Permian Taiyuan Formation in Central and Eastern Ordos Basin, China. Minerals 2023, 13, 1058. [Google Scholar] [CrossRef]
- Meng, M.; Ge, H.; Shen, Y.; Ji, W.; Wang, Q. Rock fabric of tight sandstone and its influence on irreducible water saturation in Eastern Ordos Basin. Energy Fuels 2023, 37, 3685–3696. [Google Scholar] [CrossRef]
- Zhang, L.; Dong, D.; Qiu, Z.; Wu, C.; Zhang, Q.; Wang, Y.; Liu, D.; Deng, Z.; Zhou, S.; Pan, S. Sedimentology and geochemistry of Carboniferous-Permian marine-continental transitional shales in the eastern Ordos Basin, North China. Palaeogeogr. Palaeoclimatol. Palaeoecol. 2021, 571, 110389. [Google Scholar] [CrossRef]
- Liu, H.; Li, X.; Ma, Y.; Bai, Y.; Huang, J. The unconformity caused by the Huaiyuan movement and the deep natural gas exploration field in the Ordos Basin, China. Nat. Gas Ind. B 2021, 8, 539–551. [Google Scholar] [CrossRef]
- Shi, L.; Liu, T.; Zhang, X.; Huang, J.; Zhang, W.; Zhao, S. Origin type and generating mechanism of coal measure limestone gas: A case study of L1 limestone gas in the Taiyuan formation of the Shenzhou coal mine, Eastern edge of the ordos basin, China. Energy Fuels 2020, 34, 10904–10914. [Google Scholar] [CrossRef]
- Li, Y.; Wang, Z.; Wu, P.; Meng, S. Paleoenvironment reconstruction of the upper Paleozoic in the Linxing area, northeastern Ordos Basin, China. AAPG Bull. 2021, 105, 2545–2574. [Google Scholar] [CrossRef]
- Li, G.; Qin, Y.; Shen, J. Geochemical characteristics of the Upper Paleozoic coal series shale in the Linxing area, Ordos Basin, China: Implications for paleoenvironment, provenance, and tectonic setting. Arab. J. Geosci. 2021, 14, 197. [Google Scholar] [CrossRef]
- Zhu, P.; Meng, X.; Wang, X.; Dong, Y.; Li, X.; Zhang, C.; Li, Z.; Ma, T.; Wei, W.; Guo, J. Geochemical characteristics of diagenetic fluid and densification model of tight gas sandstone reservoirs in Linxing area, eastern margin of Ordos Basin, China. Mar. Pet. Geol. 2022, 138, 105496. [Google Scholar] [CrossRef]
- Wei, Z.; Wang, Y.; Wang, G.; Zhang, T.; He, W.; Ma, X.; Yu, X. Enrichment mechanism of the Upper Carboniferous-Lower Permian transitional shale in the east margin of the Ordos Basin, China: Evidence from geochemical proxies. Geofluids 2020, 2020, 8867140. [Google Scholar] [CrossRef]
- Deng, J.; Zeng, H.; Wu, P.; Du, J.; Gao, J.; Zhao, F.; Jiang, Z. Pore structure differentiation between deltaic and epicontinental tight sandstones of the upper Paleozoic in the eastern linxing area, ordos basin, China. Geofluids 2021, 2021, 9015041. [Google Scholar] [CrossRef]
- Yin, S.; Tian, T.; Wu, Z. Developmental characteristics and distribution law of fractures in a tight sandstone reservoir in a low-amplitude tectonic zone, eastern Ordos Basin, China. Geol. J. 2020, 55, 1546–1562. [Google Scholar] [CrossRef]
Disclaimer/Publisher’s Note: The statements, opinions and data contained in all publications are solely those of the individual author(s) and contributor(s) and not of MDPI and/or the editor(s). MDPI and/or the editor(s) disclaim responsibility for any injury to people or property resulting from any ideas, methods, instructions or products referred to in the content. |
© 2024 by the authors. Licensee MDPI, Basel, Switzerland. This article is an open access article distributed under the terms and conditions of the Creative Commons Attribution (CC BY) license (https://creativecommons.org/licenses/by/4.0/).