Article

Response of Carbon Energy Storage to Land Use/Cover Changes in Shanxi Province, China

1
Department of Civil Engineering, Tongling University, Tongling 244061, China
2
Spatial Information Acquisition and Application Joint Laboratory of Anhui Province, Tongling 244000, China
3
Wuhan Geomatics Institute, Wuhan 430022, China
4
Tongling Seismic Station, Tongling 244061, China
5
Department of Civil Engineering, Manitoba University, Winnipeg, MB R3T 2N2, Canada
*
Authors to whom correspondence should be addressed.
Energies 2024, 17(13), 3284; https://doi.org/10.3390/en17133284
Submission received: 13 June 2024 / Revised: 29 June 2024 / Accepted: 2 July 2024 / Published: 4 July 2024
(This article belongs to the Section B3: Carbon Emission and Utilization)

Abstract

:
Carbon storage services play an important role in maintaining ecosystem stability. Land use/cover change (LUCC) is the main factor leading to changes in ecosystem carbon storage. Understanding the impact of LUCC on regional carbon storage changes is crucial for protecting regional ecosystems and promoting sustainable socio-economic development. This paper selects Shanxi province as the study area and explores the spatial and temporal evolution characteristics of carbon storage in Shanxi province based on the InVEST model and univariate spatial autocorrelation. The results show that the total carbon storage in Shanxi Province in 2000, 2010, and 2020 is 513.51 × 10⁴ t C, 513.46 × 10⁴ t C, and 509.29 × 10⁴ t C, respectively. High carbon storage areas are distributed in forest and grassland land types, while low carbon storage areas are widely distributed in building land in urban metropolitan areas. Shanxi Province is mainly dominated by farmland, which has decreased by 3448.60 km2 in the past 20 years. Grassland has decreased by 1588.31 km2 and the area of building land has increased by 4205.73 km2. Due to the influence of carbon conversion among different land use types, the total carbon storage loss of Shanxi Province in the past 20 years was 4.21 × 10⁴ t C. The transfer of farmland resulted in an increase in carbon stock of 14.46 × 10⁴ t C. The transfer of grassland resulted in an increase of 17.15 × 10⁴ t C, while the transfer of forest resulted in a decrease of 41.44 × 10⁴ t C. The increase in land use types with low carbon density and the decrease in land use types with high carbon density led to the decrease in carbon storage in Shanxi Province. Furthermore, social factors were more likely to influence the carbon storage than natural factors, and the influence of social factors was often negative. On this basis, regional development countermeasures were proposed for the current situation of carbon storage in Shanxi Province and provide a scientific basis for Shanxi Province to achieve the carbon neutrality target.

1. Introduction

As the basis of human survival and development, ecosystems not only provide human beings with living space and various resources needed for development, but also have the functions of regulating climate and conserving water [1]. The level of carbon sequestration in an ecosystem is an important indicator of its ability to regulate climate [2]. Carbon sequestration in terrestrial ecosystems is mainly derived from four carbon pools—above-ground biomass, subsurface biomass, soil, and dead organic matter [3,4,5]. The Millennium Ecosystem Assessment Report released in the early 20th century clearly pointed out that carbon storage services are an important component of ecosystem services, and with the development of urbanization, the imbalance between the supply and demand of carbon storage services is one of the important reasons for global warming [6,7]. The carbon storage in terrestrial ecosystems is much greater than that in atmospheric and marine ecosystems. Therefore, the study of carbon sequestration in terrestrial ecosystems is of great significance to global climate change driven by carbon dioxide. Human beings can strengthen the regulation and intervention of terrestrial ecosystems to improve their carbon sequestration capacity.
Land use/land cover (LULC) is the core field of global environmental change research and is an important factor driving the carbon cycle of terrestrial ecosystems [8,9]. The land use structure is oriented towards increasing carbon sinks and achieving low-carbon goals. It not only regulates regional climate and guides low-carbon economic development, but also plays an important role in regional and global carbon cycling [10]. Human social and economic activities directly affect the change in land use structure. Land use/cover change (LUCC) is the most important factor of natural ecosystem change, which further affects the carbon cycle process of ecosystems by changing the structure and function of the ecosystems [11,12,13]. There are differences in carbon sequestration capacity among different land use types, and the transformation between land use types directly affects vegetation and soil distribution [14]. Vegetation and soil have strong carbon sequestration capabilities and are the main components of carbon storage in terrestrial ecosystems. Therefore, LUCC leads to changes in vegetation growth and soil types, which, in turn, can alter carbon storage in ecosystems [15,16]. Particularly when high-density carbon land use types are transformed into others, it will lead to a reduction in carbon storage. Similarly, the conversion of low-density carbon land use types to others will lead to an increase in carbon storage. Therefore, the accurate estimation of LUCC has become increasingly important for assessing the terrestrial carbon cycle [17].
At present, the methods of calculating carbon storage mainly include semi-quantitative assessment, field investigation, and the model method, which combine land use data with expert scoring methods [18,19,20,21,22]. The subjectivity of the semi-quantitative evaluation method is too strong, the field investigation method requires a lot of manpower and material resources, and the time cost is high, while the model method only needs to input data to quickly complete the calculation of carbon storage at different spatiotemporal scales. Brown et al. [23] conducted a survey on data on litter storage, soil organic matter, forest biomass, litter, and primary productivity, and studied the relationship between organic matter storage and production variables in tropical forests. Taking the southeast of the United States as a research area, Zhao et al. [24] used a modeling system to quantify the spatial–temporal model of carbon dynamics and to study the impact of land use change. They found that the regional carbon sequestration rate decreases significantly with the decrease in forest area. Sohl et al. [25] developed an LULC modeling framework. Through modeling LUCC in four IPCC SRES scenarios, it was concluded that land use and land management activities could not only reduce greenhouse gas emissions, but also enhance the carbon sequestration capacity of ecosystems. The InVEST model is a widely used ecosystem services accounting tool that enables rapid and dynamic visualization (refer) of ecosystem services across time and space [26,27,28,29,30]. InVEST’s carbon module can estimate the current carbon stocks in a region by simulating the carbon stocks of four carbon pools (above ground biomass, underground biomass, soil, and dead organic matter) based on land use data. Although the module does not explicitly consider the process of carbon storage and release, it can reliably estimate carbon storage at different scales [31]. The invest model was applied to the monitoring of soil carbon stocks in the Hungarian agroecosystem by Nel et al. [32]. Kohestani et al. [33] used the InVEST model to check the value of carbon sequestration under land use/land cover change in northern Iran. Huang et al. [34] used the InVEST model to analyze the dynamic changes in territorial spatial transformation and carbon storage in Suqian City from 2000 to 2020, as well as their relationship. Furthermore, the LUSD-urban, CLUE-S, SLEUTH-3r, and CA-Markov models were integrated with the InVEST model to simulate the pattern of future land use change under different scenarios in the different study areas. On this basis, the updated InVEST model is used to evaluate the changes in terrestrial ecosystem carbon stocks caused by land use change under different scenarios [35,36,37,38].
Although researchers have evaluated the spatiotemporal variation characteristics of regional ecosystem carbon storage at different scales (including watershed [39], regions of dry and humid climate zones [40], administrative divisions [41,42], conservation zones [43], hill and belt [44], and coastal zones [45]), there are inconsistent views on the impact of LUCC on ecosystem carbon exchange processes [40,46], especially in areas of different scales. Therefore, it is necessary to conduct in-depth research on the impact of LULC on different regions, especially resource-based provinces and cities. Shanxi Province (SXP) belongs to North China and is a typical loess-covered mountain plateau with a poor natural background. SXP is rich in mineral resources and its economic development is based on the exploitation and utilization of mineral resources. The vigorous development of the mining industry not only promotes social and economic development, but also causes obvious changes in land use types, and further causes serious ecological problems such as the fragile ecological environment and climate deterioration in SXP. Based on land use data, the InVEST model, and univariate spatial autocorrelation, this article explores the spatiotemporal changes of carbon storage in SXP from 2000 to 2020, analyzes the changes in LUCC, and quantifies the impact of LUCC on carbon storage. Afterwards, we also discuss other factors that affect changes in carbon storage. It is of great practical and long-term significance to study the effect of LUCC on carbon sequestration of ecosystems, to improve its carbon sequestration capacity, and to promote the sustainable development of SXP.

2. Materials and Methods

2.1. Study Area

SXP is located in North China, between 34°34′ N~40°44′ N and 110°14′ E–114°33′ E (Figure 1). Located in the east of the Loess Plateau in Northern China and the middle reaches of the Yellow River, SXP belongs to the junction of temperate continental climate and the temperate monsoon climate. With mountains and hills as the main terrain, the unique geographical position makes the ecosystem in this region relatively fragile. SXP is regarded as a typical representative of China’s resource-based provinces.

2.2. Data Resources and Pre-Processing

The study period is from 2000 to 2020, and the data from 2000, 2010, and 2020 are selected as representative data (Table 1). In this paper, all spatial data were resampled to a spatial resolution of 1 km × 1 km.

2.3. Methods

2.3.1. Carbon Storage Supply Accounting

The carbon module based on the InVEST model calculates the supply of carbon storage services by calculating the above-ground carbon density, underground carbon density, soil organic matter, and dead organic matter of different land use types. The carbon density data comes from the carbon density value of land use type in China. Existing studies have shown that biomass carbon density and soil carbon density are significantly correlated with annual mean precipitation [47,48,49]. Therefore, the biomass carbon density and soil carbon density in SXP were modified based on annual average precipitation. Soil carbon density data were obtained by modifying factors based on annual mean precipitation. The carbon density values of land use in China were based on the literature collation shown in Table 2, and the correction results are shown in Table 3.
The carbon storage service is calculated as follows [47,48,49]:
C S = 1 i ( C above , i + C below , i + C soil , i + C dead , i ) × A i
where CS is the supply of carbon storage service; Cabove,i, Cbelow,i, Cdead,i, and Csoil,i, respectively, represent the above-ground biomass, underground biomass, dead organic matter, and soil carbon density of type i land use type; and Ai is the area of type i land use type.

2.3.2. Univariate Spatial Autocorrelation Analysis

Single-space autocorrelation analysis is divided into univariate global spatial autocorrelation and univariate local spatial autocorrelation. In this paper, global Moran’s I index was calculated using univariate global spatial autocorrelation to analyze the overall correlation degree of carbon storage in SXP. The value range is −1~1. Positive values indicate a positive spatial correlation and spatial agglomeration. Negative values indicate spatial negative correlation and spatial difference. When it is equal to zero, it means that there is no spatial correlation and it is a random distribution state. In addition, the spatial correlation pattern between the grid scale carbon storage and its surrounding regions in SXP were analyzed through univariate local spatial autocorrelation. In the cluster diagram of LISA with univariate local spatial autocorrelation, H-H is the high-value cluster region, and L-L is the low-value cluster region. L-H is a low-value region surrounded by a high-value region, and H-L is a high-value region surrounded by a low-value region. The analysis is based on a GeoDa implementation.

2.3.3. Pearson Correlation Analysis

If there is covariation between the two groups of variables, there is a correlation between the two variables. Pearson correlation analysis can simply measure the linear correlation between two groups of continuous variables, and Pearson’s correlation coefficient can be used to characterize the positive correlation, negative correlation, and absolute value of the two groups of variables.

2.3.4. Random Forest Model

The random forest model is a supervised machine learning algorithm based on a decision tree, which can be used for regression, classification, discrimination, prediction, and importance evaluation of variables. The enhanced root mean square error (%IncMSE), which represents the importance of the influencing factor, can be calculated using this model. In this paper, the carbon storage is taken as the dependent variable and the driving factors are taken as the independent variable to construct a random forest regression model.

3. Results

3.1. Land Use Change

The spatial distribution of land use in SXP in 2000, 2010, and 2020 was obtained using the ArcGIS 10.8 software platform (Figure 2). Land use types mainly include six categories, as follows: farmland, forest, grassland, water, building land, and unused land. Taking 2020 as an example, the arable land area of the study area is the largest, reaching 58,536.70 km2, which is mainly distributed in the basin between Taihang Mountain and Luliang Mountain. It was followed by woodland and grassland, with areas of 44,798.00 km2 and 44,059.10 km2, respectively. The woodland was mainly distributed in Taihang Mountain in the east, and Luliang Mountain in the west. The area of construction land is 7728.28 km2, the area of water body is 1308.32 km2, and the area of unused land is 91.15 km2.
According to the land use transfer matrix from 2000 to 2010 (Table 4), the area of cultivated land decreased the most, reaching 1285.83 km2, followed by grassland and forest, with area decreasing by 264.24 km2 and 122.29 km2, respectively. Other land use types have minimal changes in area. In 2010, the area of building land increased the most, reaching 630.30 km2, followed by grassland, where the increased area was 463.07 km2, and forest land and cultivated land, which increased to 375.34 km2 and 219.96 km2, respectively. Overall, from 2000 to 2010, the range of land use change was not large; the cultivated land area decreased by 1065.87 km2; and the area of building land, forest land, and grassland increased by 576.65 km2, 253.05 km2, and 198.84 km2, respectively.
Compared with 2000–2010, the land use changes during 2010–2020 are drastic (Table 5). According to the data from 2010, the area of cultivated land decreased the most, reaching 20,303.46 km2, of which 11,728.20 km2 was transformed into grassland. Grassland was the second largest land use type in terms of area change, with a decrease of 20,301.04 km2, of which 11,751.20 km2 was converted into cultivated land. This was followed by forest land, which decreased by 12,025.95 km2 and was mainly converted to grassland and cultivated land. The building land also decreased by 2135.31 km2. According to the data from 2020, the area of cultivated land, grassland, and forest land increased the most, which were 18,920 km2, 18,712.73 km2, and 12,535.69 km2, respectively. Therefore, the land use change in the decade 2010–2020 was mainly caused by the transformation between cultivated land, forest land, and grassland. In general, the area of cultivated land and grassland decreased from 2010 to 2020, and the building area increased the most, reaching 3629.07 km2, mainly derived from the conversion of cultivated land and grassland. The area of forest land increased by 509.74 km2.
Table 6 shows that SXP has the largest farmland reduction of 3448.60 km2 from 2000 to 2020, followed by grassland with a reduction of 1588.31 km2. The area of building land increased the most, which was 4205.73 km2. The area of forest increased by 762.94 km2. This is closely related to the ecological construction of SXP; the return of farmland to forest; the construction of the “three North”; Taihang Mountain, Luliang Mountain, and the middle reaches of the Yellow River shelterbelt system; the afforestation of the retired pasture; the improvement and cultivation of natural pasture; and other policies. The decrease in cultivated land is mainly caused by the occupation of various construction land, disasters, mining, and other damage. According to the Statistical Yearbook of SXP and the bulletin of the Fifth and seventh National population Census of SXP, the total GDP of SXP increased from CNY 164.38 billion in 2000 to CNY 1765.19 billion in 2020, and the permanent population increased from 32,966,600 people in 2000 to 34,915,600 people in 2020. Economic development and population growth have led to increasing demand for construction land, so many other lands use types have been transformed into construction land.

3.2. Spatial and Temporal Distribution of Carbon Storage

The total carbon storage in SXP in 2000, 2010, and 2020 is 513.51 × 10⁴ t C, 513.46 × 10⁴ t C, and 509.29 × 10⁴ t C, respectively. The high-value area of carbon storage in SXP is mainly concentrated in the Taihang Mountains in the east, and the Luliang Mountains in the west. The land use types in this region are forest and grassland. Cultivated land, as the main land type, is also the most important carbon pool for carbon storage, while the low-value area is mainly concentrated in the “Chuan” area of “two mountains sandwich-one river”, namely the Fenhe Valley between the two mountains, with strong human activities (Figure 3).
The change values of carbon stocks were divided into three categories—increase (>4 t/km2), basically stable (−4~4 t/km2), and decrease (>−4 t/km2)—to further analyze the local change characteristics. Figure 4 shows that the carbon stocks of more than 90% of regions were basically stable from 2000 to 2010. The change in carbon storage mainly occurred in the decade from 2010 to 2020, and the change in carbon storage in most regions was concentrated in the range of −4 to 4, and the basic stable area of carbon storage was mainly concentrated in the forest land. The change in carbon storage in 19.67% of regions was significantly reduced, and that in 17.89% of regions was significantly increased. The change trend in carbon storage from 2000 to 2020 is basically the same as that in the last decade.
In general, carbon storage in SXP decreased by 4.21 × 10⁴ t C in the past 20 years, and the decrease in carbon storage from 2000 to 2010 was less (0.04 × 10⁴ t C). The change of carbon storage was mainly concentrated in Datong City and Shuozhou City in the north, and Taiyuan City in the middle of SXP. The decrease in carbon storage from 2010 to 2020 reached 4.17 × 10⁴ t C. The change in carbon storage was mainly concentrated in Datong City and Shuozhou City in the north; Taiyuan City and Luliang City in the middle; and Changzhi City and Jincheng City in the south.

3.3. Analysis of Time Change in Carbon Storage in Different Land Use Types

ArcGIS 10.8 was used to analyze the operation results of the InVEST model to obtain the carbon stocks corresponding to different land use types in the study area from 2000 to 2020. Combined with the carbon sequestration amount of different land types in the two study periods, the temporal variation rules of carbon stocks of different land use types in SXP were comprehensively analyzed. The carbon storage of SXP is shown in Figure 5. The change in carbon storage of various land use types is shown in Figure 6.
From 2000 to 2020, the carbon storage of cultivated land in SXP decreased from 139.48 × 10⁴ t C in 2000 to 131.94 × 10⁴ t C in 2020. The carbon storage of cultivated land showed a continuous downward trend from 2000 to 2020. In addition, the decline from 2010 to 2020 was greater than that of the previous decade, with a decrease of 5.25 × 10⁴ t C. The carbon storage of forest land increased from 252.77 × 10⁴ t C to 256.32 × 10⁴ t C, and the cumulative carbon sequestration increased by 3.56 × 10⁴ t C. As with the result of cultivated land, the increase in the latter decade was greater than that in the previous decade. The carbon storage of forest land has shown a continuous upward trend from 2000 to 2020, which was mainly affected by the gradual increase in forest land area. The carbon storage of grassland increased first and then decreased, from 117.66 × 10⁴ t C in 2000 to 118.04 × 10⁴ t C in 2010, and then decreased to 113.65 × 10⁴ t C in 2020. The carbon storage of building land showed a continuous rising trend, from 3.60 × 10⁴ t C in 2000 to 7.38 × 10⁴ t C in 2020. And the increase in carbon stocks in the last decade was about five times that of the previous decade. In contrast, carbon stocks in water and unused land did not change significantly.

3.4. Effects of LUCC on Carbon Storage during 2000–2020

Due to the difference in transfer area and the carbon density of soil and vegetation between different land use types, the impact of land use change on carbon storage is also different, and the change of carbon storage is shown in Table S1. Overall, there was little change in land use and carbon stocks between 2000 and 2010. During 2010–2020, land use changes dramatically and carbon storage changes greatly.
Table S1 shows that the carbon stock increased by 14.46×10⁴ t C due to the transfer of cultivated land from 2000 to 2020; among them, there was an increase of 0.26 × 10⁴ t C in the first decade. The main reason for this is that large areas of cultivated land were converted to woodland and grassland with higher carbon density, and the vegetation area is gradually expanded, which was conducive to the increase in carbon storage.
Forest has a strong carbon sequestration ability, and its carbon density is the highest among all land use types in this study. Therefore, the transfer of forest land to any land use type is not conducive to carbon storage. The reduction in carbon storage from forest land transfer was 41.44 × 10⁴ t C, while the increase in forest land was mainly from grassland and cultivated land, which were 23.34 × 10⁴ t C and 18.59 × 10⁴ t C, respectively.
The conversion of grasslands resulted in an increase in carbon storage of 17.15 × 10⁴ t C, which is due to the conversion of large areas of grasslands into forests with higher carbon density. At the same time, a large area of grassland has also been converted into cultivated land, but the carbon density of cultivated land is not significantly different from that of grassland, which has little impact on the changes in grassland carbon storage.
Building land was the type of land use with the largest area change, mainly derived from the conversion of cultivated land. During the 20 years, the carbon storage increased by 3.66 × 10⁴ t C. Water and unused land have relatively small changes in area, and the corresponding carbon storage changed little, which increased by 2.45 × 10⁴ t C and 0.25 × 10⁴ t C, respectively. A total decrease of 3.47 × 10⁴ t C was found in carbon stocks due to land use change during 2000–2020.

3.5. Spatial Autocorrelation Analysis

Based on the univariate spatial autocorrelation analysis of the carbon storage in SXP in 2000, 2010, and 2020 in GEODA, global Moran’s I index in 2000, 2010, and 2020 was 0.588, 0.527, and 0.602, respectively. The results show that the carbon storage has a significant positive spatial autocorrelation trend, and the spatial agglomeration during the study period first decreases during 2000–2010, and then increases during 2010–2020. The univariate local spatial autocorrelation results are shown in Figure 7. During 2000–2020, the spatial agglomeration characteristics of the carbon storage in SXP are similar. The H-H region is the main spatial matching type in SXP, accounting for 22.19%, 29.58%, and 22.55% of the total area of SXP in 2000, 2010, and 2020, respectively. Mainly concentrated in the forest and grassland of the Taihang Mountains and the Luliang Mountains, such areas have high vegetation coverage, a relatively high carbon storage value, and are less affected by human activities. The L-L and H-L regions are mainly concentrated in construction land and its surrounding areas, where the carbon storage is low and human activities are intense, resulting in a large amount of carbon emissions. The proportion of the L-H region in the study area is very low and can be ignored.

4. Discussion

4.1. Impact Analysis of Land Use and Carbon Storage Estimation

The land use and land cover system is one of the highly complex social ecosystems. Its development and evolution are regulated by human activities and its comprehensive effects largely have an impact on human society at the same time [50,51]. The land use type in SXP has undergone great changes under the promotion of the project of returning farmland to forest, which has a significant impact on carbon storage [52,53]. The carbon storage of SXP showed a downward trend from 2000 to 2020, and the overall decline rate was small from 2000 to 2010, while the carbon storage declined sharply from 2010 to 2020. A large amount of cultivated land and grassland were transformed into building land, which ensured the production and development of towns and villages, thus promoting SXP in the ten years of rapid economic growth. As carbon storage is mainly affected by vegetation types, the spatial distribution of carbon storage is similar to that of land use, with high-value areas distributed in mountainous areas with high forest coverage, and low-carbon storage areas widely distributed in building land in urban metropolitan areas.
In general, the interconversion of land use and land cover types causes the soil carbon sink and vegetation carbon sink of the ecosystem; this will lead to changes in the total amount of regional carbon storage [54]. The area of cultivated land in SXP decreased the most from 2000 to 2020, from 1285.83 km2 in the first ten years to 20,303.46 km2 in the last ten years. In the past two decades, the conversion of cultivated land to other land use types resulted in an increase in carbon storage of 14.46 × 10⁴ t C. At the same time, the outflow of forests leads to a decrease of 41.44 × 10⁴ t C in carbon storage. Building land is the land use type with the greatest change in SXP, mainly transferred from cultivated land. Although the expansion of construction land is closely related to economic and social development, it has the negative impact of reducing carbon storage. This is consistent with the conclusions of other scholars [54,55]. The increase in land use types with low carbon density and the decrease in land use types with high carbon density led to the decline of carbon storage in the study area [56].

4.2. The Impact of Other Factors on Carbon Storage

LUCC is one of the main factors that affects terrestrial carbon storage; in addition, carbon stocks are limited by other factors [56,57]. With reference to existing studies, this paper takes 2020 as the study period, and specifically analyzes the influencing factors of the difference between carbon storage in SXP from the perspectives of social factors and natural factors. Among them, the social factors include GDP, proportion of urban construction area (PUCA), and population density (PD). Natural factors include the digital elevation model (DEM), annual temperature (AT), and annual precipitation (AP). Except for the proportion of urban construction area, other driving factors are derived from existing data sets. The proportion of urban construction area is obtained by calculating the impervious surface area of each 1 km grid using 30 m land use data.
Figure 8a,b show the analysis results of the correlation and random forest regression models, respectively. The carbon storage showed a significant negative correlation with the three driving factors of social factors, and a significant positive correlation with the driving factors of natural factors, except for the average annual temperature. Hu et al. [53] also concluded that human factors have a significant negative impact on carbon storage changes. Among the social factors, the driving factor with the greatest negative correlation was the proportion of urban construction area, followed by population density and GDP. In the results of the random forest regression model, the contribution to carbon storage ranked from high to low as proportion of urban construction area, GDP, altitude, population density, average annual temperature, and average annual rainfall, respectively.
Among the social factors, the proportion of urban construction areas, GDP, and population density areas with high value are generally areas with a high urbanization level. In this region, construction land is the main land use type, and the supply capacity of carbon storage is weak. In addition, this region is often accompanied by strong human activities, where people’s lives and industrial production will produce a large amount of carbon emissions, resulting in an increased demand for carbon storage services. Among the natural factors, the average annual rainfall and altitude have a positive impact on the carbon storage, and the average annual temperature has a negative impact on the carbon storage, among which the altitude has the most significant impact on the carbon storage. This is mainly because the land use types mainly distributed in the high-altitude areas are woodland and grassland, the soil organic matter content is high, and the supply of carbon storage services is sufficient. In general, social factors have a greater impact on the carbon storage than natural factors, and often have a negative impact, while natural factors have a lower impact on the carbon storage, but mainly have a positive impact.

4.3. Regional Countermeasures and Suggestions

The research in this paper shows that carbon storage in SXP is showing a continuous downward trend. As a pilot of comprehensive reform of energy revolution, SXP will continue to face the environmental problems of the declining supply capacity of carbon storage and the increasing demand in the future development. Therefore, this article proposes the following suggestions for this issue: Land use type is closely related to carbon storage services, and forest land and grassland have a huge potential for carbon storage supply [58,59]. The government can increase the area proportion of forest land and grassland in the region according to local conditions and can strengthen the construction of green infrastructure by means of such measures as returning farmland to forest. In addition, urbanization is also an important factor that weakens the carbon storage supply capacity. The carbon storage supply capacity of construction land is weak, and the increase in construction land will inevitably lead to the decline of carbon storage supply [60,61]. Therefore, the government needs to demarcate the urban development boundary scientifically in territorial space planning, to achieve urban development in a disciplined way.

5. Conclusions

This paper analyzed the relationship between LUCC and carbon storage in SXP from 2000 to 2020 based on the InVEST model. At the same time, a univariate spatial autocorrelation analysis was conducted on the carbon storage of SXP in 2000, 2010, and 2020, based on GEODA; global Moran’s I index in 2000, 2010, and 2020 was 0.588, 0.527, and 0.602, respectively. The results show that there is a significant positive spatial autocorrelation trend in the carbon storage. The conclusions are as follows:
(1)
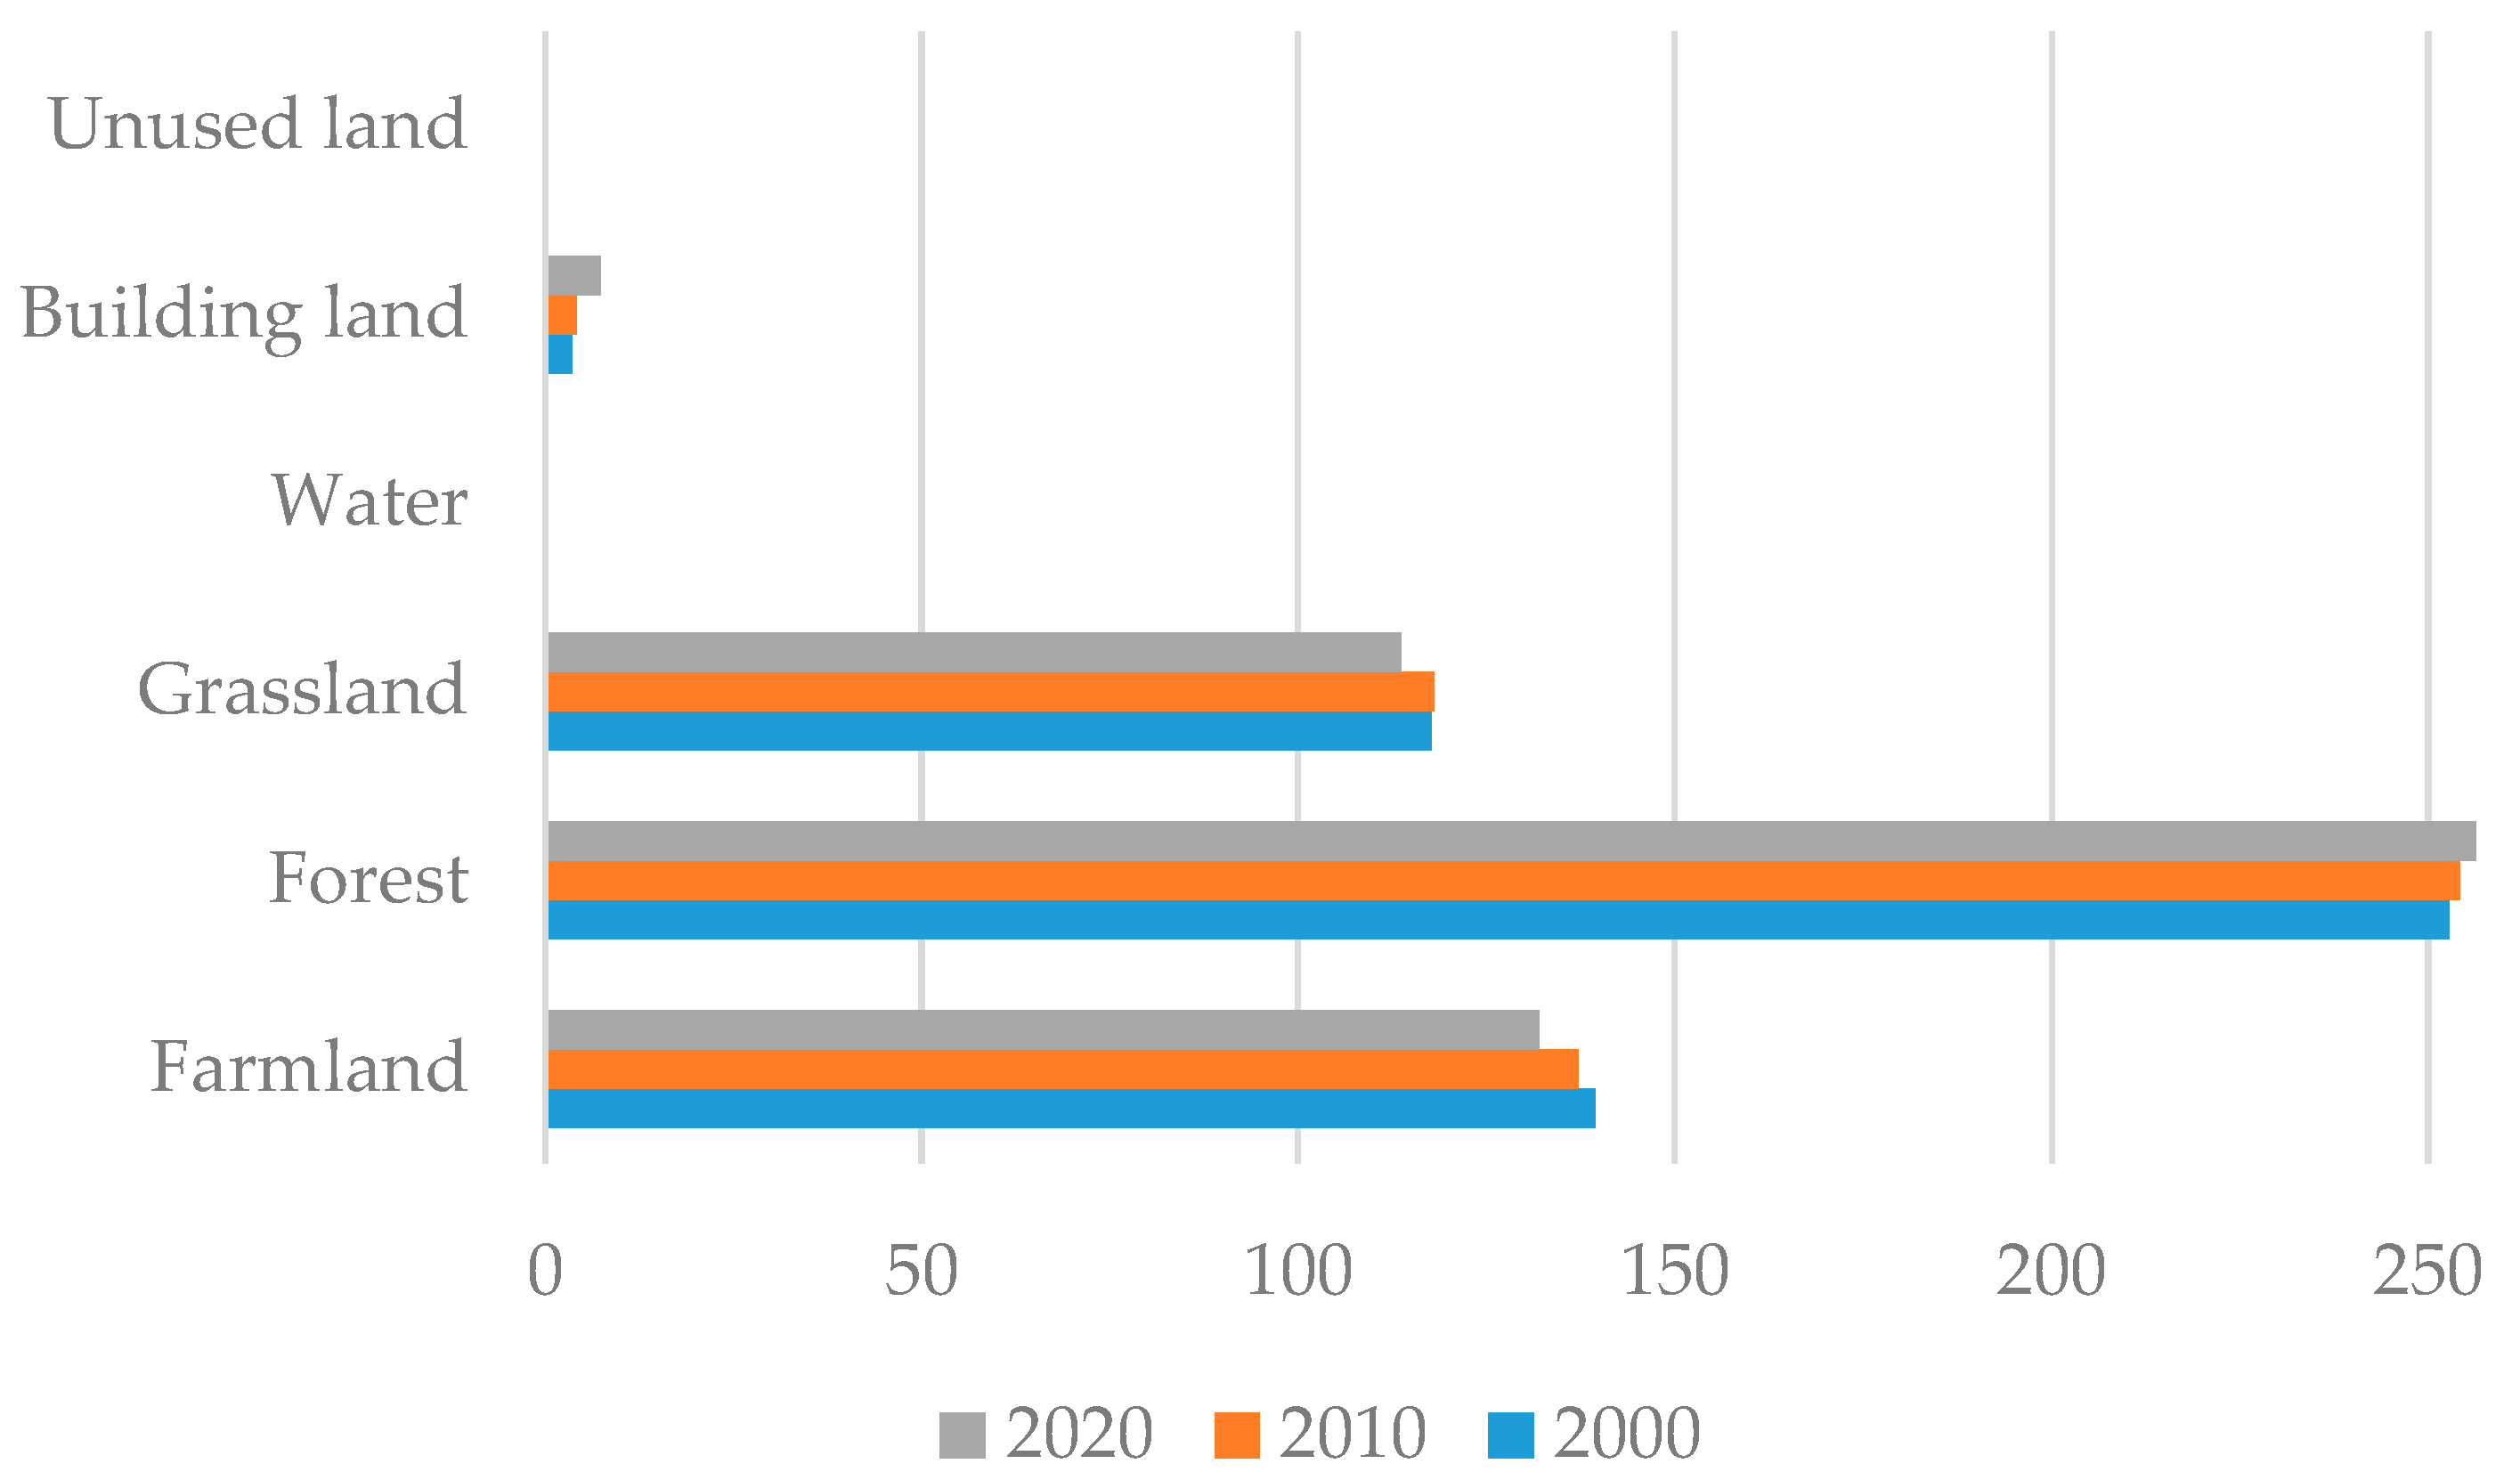
SXP is mainly dominated by farmland, with a decrease of 3448.60 km2 in the past 20 years. Grassland areas rank third in the province, with a decrease of 1588.31 km2 in the past 20 years, and forest areas rank second in the province, with an increase of 762.94 km2 in the past 20 years. The area of building land increased the most, which was 4205.73 km2. The change in other land types is not obvious.
(2)
The total carbon storage in SXP in 2000, 2010, and 2020 is 513.51 × 10⁴ t C, 513.46 × 10⁴ t C, and 509.29 × 10⁴ t C, respectively. There is a significant spatial autocorrelation trend in carbon storage in SXP, which weakens during 2000–2010 and strengthens during 2010–2020.
(3)
Due to the influence of carbon conversion among different land use types, carbon storage in SXP has been lost 4.21 × 10⁴ t C in the past 20 years. This is mainly reflected in the decrease in cultivated land, grassland, and water area, and the significant increase in construction land. From the perspective of the spatial distribution of carbon storage, carbon storage is affected by land use type. High carbon storage is mainly located in mountainous areas with high forest coverage, and low carbon storage areas are widely distributed in building land in urban metropolitan areas. The increase in land use types with a low carbon density and the decrease in land use types with a high carbon density led to the decrease in carbon storage in SXP.
(4)
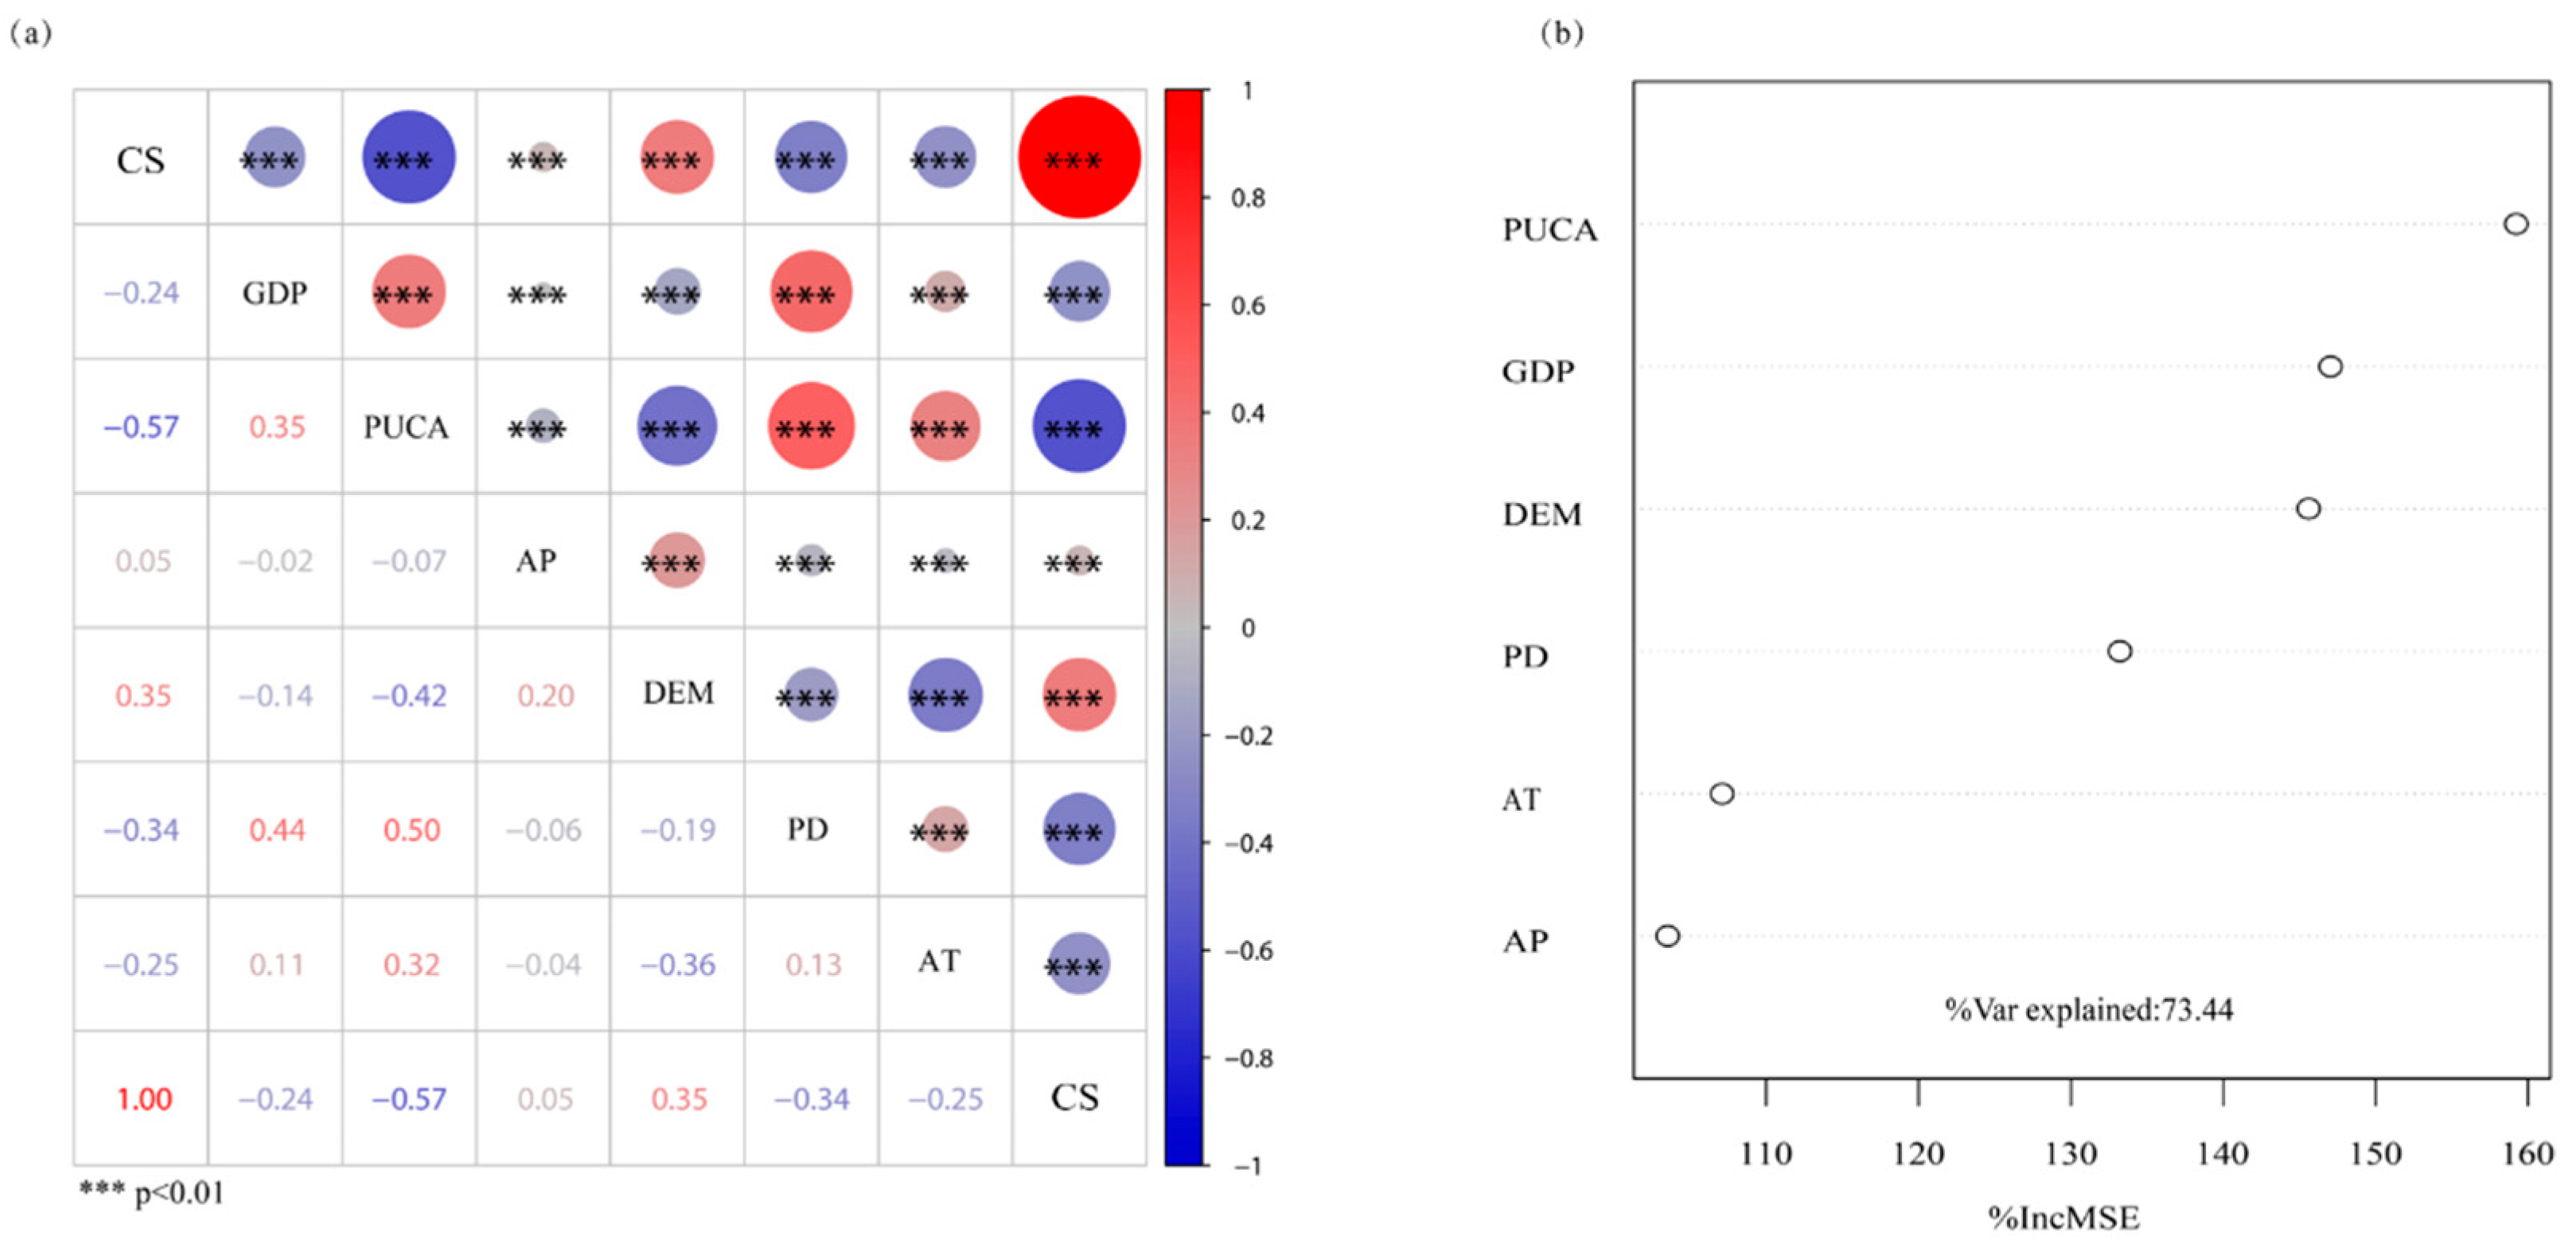
In addition to the impact of land use change, our results showed that social factors were more likely to influence carbon storage than natural factors, and the influence of social factors was often negative.
(5)
There is a close relationship between land use type and carbon storage, and forest land and grassland have a huge potential for carbon storage supply. The government can increase the area proportion of forest land and grassland in the region according to local conditions and can strengthen the construction of green infrastructure by means of such measures as returning farmland to forest. In addition, urbanization is also an important factor that weakens the carbon storage supply capacity. The carbon storage supply capacity of construction land is weak, and the increase in construction land will inevitably lead to the decline in carbon storage supply. Therefore, the government needs to demarcate the urban development boundary scientifically in territorial space planning, to achieve urban development in a disciplined way.

Supplementary Materials

The following supporting information can be downloaded at: https://www.mdpi.com/article/10.3390/en17133284/s1, Table S1: Land use change and its associated carbon stock change in Shanxi Province from 2000 to 2020.

Author Contributions

H.T.: Conceptualization and writing—original draft; J.F.: methodology, software, and visualization; X.L.: data curation and formal analysis; R.X.: validation; Y.L.: investigation; J.Y.: writing—review and editing and supervision. All authors have read and agreed to the published version of the manuscript.

Funding

This study was partially supported by the National Natural Science Foundation of China (42271301), the Anhui University Excellent Research and Innovation Project (No. 2022AH010094), and the Natural Science Research Project of Tongling University (2023tlxyptZD05).

Data Availability Statement

The minimum data set required to replicate our research results is located in the manuscript and can be downloaded for free through the corresponding website.

Acknowledgments

The authors also appreciate the reviewers for their invaluable comments, which have led to significant improvement in the paper.

Conflicts of Interest

The authors declare that they have no known competing financial interests or personal relationships that could have appeared to influence the work reported in this paper.

References

  1. Russo, A.; Escobedo, F.J.; Timilsina, N.; Schmitt, A.O.; Varela, S.; Zerbe, S. Assessing urban tree carbon storage and sequestration in Bolzano, Italy. Int. J. Biodivers. Sci. Ecosyst. Serv. Manag. 2014, 10, 54–70. [Google Scholar] [CrossRef]
  2. Fang, J.; Yu, G.; Liu, L.; Hu, S.; Chapin, F.S., III. Climate change, human impacts, and carbon sequestration in China. Proc. Natl. Acad. Sci. USA 2018, 115, 4015–4020. [Google Scholar] [CrossRef] [PubMed]
  3. Lu, F.; Hu, H.; Sun, W.; Zhu, J.; Liu, G.; Zhou, W.; Zhang, Q.; Shi, P.; Liu, X.; Wu, X.; et al. Effects of national ecological restoration projects on carbon sequestration in China from 2001 to 2010. Proc. Natl. Acad. Sci. USA 2018, 115, 4039–4044. [Google Scholar] [CrossRef] [PubMed]
  4. Tang, X.; Zhao, X.; Bai, Y.; Tang, Z.; Wang, W.; Zhao, Y.; Wan, H.; Xie, Z.; Shi, X.; Wu, B.; et al. Carbon pools in China’s terrestrial ecosystems: New estimates based on an intensive field survey. Proc. Natl. Acad. Sci. USA 2018, 115, 4021–4026. [Google Scholar] [CrossRef] [PubMed]
  5. Tang, Z.; Xu, W.; Zhou, G.; Bai, Y.; Li, J.; Tang, X.; Chen, D.; Liu, Q.; Ma, W.; Xiong, G.; et al. Correction for Tang et al., Patterns of plant carbon, nitrogen, and phosphorus concentration in relation to productivity in China’s terrestrial ecosystems. Proc. Natl. Acad. Sci. 2018, 115, E6095–E6096. [Google Scholar] [CrossRef] [PubMed]
  6. Fang, J.; Zhu, J.; Wang, S.; Yue, C.; Shen, H. Global warming, human-induced carbon emissions, and their uncertainties. Sci. China Earth Sci. 2011, 54, 1458–1468. [Google Scholar] [CrossRef]
  7. Peck, S.C.; Teisberg, T.J. Optimal carbon emissions trajectories when damages depend on the rate or level of global warming. Clim. Chang. 1994, 28, 289–314. [Google Scholar] [CrossRef]
  8. Li, X. A review of the international researches on land use/land cover change. Acta Geogr. Sin. Chin. 1996, 51, 553–558. [Google Scholar] [CrossRef]
  9. Houghton, R.A.; Hackler, J.L.; Lawrence, K.T. The U.S. Carbon Budget: Contributions from Land-Use Change. Science 1999, 285, 574–578. [Google Scholar] [CrossRef]
  10. Zhang, S.; Zhong, Q.; Cheng, D.; Xu, C.; Chang, Y.; Lin, Y.; Li, B. Landscape ecological risk projection based on the PLUS model under the localized shared socioeconomic pathways in the Fujian Delta region. Ecol. Indic. 2022, 136, 108642–108655. [Google Scholar] [CrossRef]
  11. Hwang, J.; Choi, Y.; Sung, H.C.; Yoo, Y.-J.; Lim, N.O.; Kim, Y.; Shin, Y.; Jeong, D.; Sun, Z.; Jeon, S.W. Evaluation of the function of suppressing changes in land use and carbon storage in green belts. Resour. Conserv. Recycl. 2022, 187, 106600–106609. [Google Scholar] [CrossRef]
  12. Zhu, X.; Pan, J.; Wu, X. Impact of agricultural irrigation and resettlement practices on carbon storage in arid inland river basins: A case study of the Shule river basin. Heliyon 2024, 10, e25305. [Google Scholar] [CrossRef] [PubMed]
  13. Song, C.; Woodcock, C.E. A regional forest ecosystem carbon budget model: Impacts of forest age structure and landuse history. Ecol. Model. 2003, 164, 33–47. [Google Scholar] [CrossRef]
  14. Zhang, M.; Huang, X.; Chuai, X.; Yang, H.; Lai, L.; Tan, J. Impact of land use type conversion on carbon storage in terrestrial ecosystems of China: A spatial-temporal perspective. Sci. Rep. 2015, 5, 10233–10245. [Google Scholar] [CrossRef] [PubMed]
  15. Xu, Q.; Yang, R.; Dong, Y.-X.; Liu, Y.-X.; Qiu, L.-R. The influence of rapid urbanization and land use changes on terrestrial carbon sources/sinks in Guangzhou, China. Ecol. Indic. 2016, 70, 304–316. [Google Scholar] [CrossRef]
  16. Liu, J.; Yan, Q.; Zhang, M. Ecosystem carbon storage considering combined environmental and land-use changes in the future and pathways to carbon neutrality in developed regions. Sci. Total. Environ. 2023, 903, 166204. [Google Scholar] [CrossRef] [PubMed]
  17. Gregorich, E.G.; Rochette, P.; McGuire, S.; Liang, B.C.; Lessard, R. Soluble Organic Carbon and Carbon Dioxide Fluxes in Maize Fields Receiving Spring-Applied Manure. J. Environ. Qual. 1998, 27, 209–214. [Google Scholar] [CrossRef]
  18. Zhao, C.; Sander, H.A. Quantifying and Mapping the Supply of and Demand for Carbon Storage and Sequestration Service from Urban Trees. PLoS ONE 2015, 10, e0136392. [Google Scholar] [CrossRef] [PubMed]
  19. Chen, X.; Ye, C.; Li, J.; Chapman, M.A. Quantifying the Carbon Storage in Urban Trees Using Multispectral ALS Data. IEEE J. Sel. Top. Appl. Earth Obs. Remote Sens. 2018, 11, 3358–3365. [Google Scholar] [CrossRef]
  20. Saeed, H.; Youssef, S.; Abdulkhaleq, A.; Younis, A.; Asaad, M. Quantifying carbon sequestration by two urban trees in duhok province. J. Univ. Duhok 2016, 19, 302–310. [Google Scholar]
  21. Bagstad, K.J.; Villa, F.; Batker, D.; Harrison-Cox, J.; Voigt, B.; Johnson, G.W. From theoretical to actual ecosystem services: Mapping beneficiaries and spatial flows in ecosystem service assessments. Ecol. Soc. 2014, 19, 64–79. [Google Scholar] [CrossRef]
  22. Zhang, Z.; Peng, J.; Xu, Z.; Wang, X.; Meersmans, J. Ecosystem services supply and demand response to urbanization: A case study of the Pearl River Delta, China. Ecosyst. Serv. 2021, 49, 101274–101289. [Google Scholar] [CrossRef]
  23. Brown, S.; Lugo, A.E. The Storage and Production of Organic Matter in Tropical Forests and Their Role in the Global Carbon Cycle. Biotropica 1982, 14, 161. [Google Scholar] [CrossRef]
  24. Zhao, S.; Liu, S.; Sohl, T.; Young, C.; Werner, J. Land use and carbon dynamics in the southeastern United States from 1992 to 2050. Environ. Res. Lett. 2013, 8, 044022. [Google Scholar] [CrossRef]
  25. Sohl, T.L.; Sleeter, B.M.; Zhu, Z.; Sayler, K.L.; Bennett, S.; Bouchard, M.; Reker, R.; Hawbaker, T.; Wein, A.; Liu, S.; et al. A land-use and land-cover modeling strategy to support a national assessment of carbon stocks and fluxes. Appl. Geogr. 2012, 34, 111–124. [Google Scholar] [CrossRef]
  26. Song, C.-H. Application of InVEST Water Yield Model for Assessing Forest Water Provisioning Ecosystem Service. J. Korean Assoc. Geogr. Inf. Stud. 2015, 18, 120–134. [Google Scholar] [CrossRef]
  27. Bai, Y.; Zheng, H.; Zhuang, C.; Ouyang, Z. Ecosystem services valuation and its regulation in Baiyangdian baisn: Based on InVEST model. Acta Ecol. Sin. 2013, 33, 711–717. [Google Scholar] [CrossRef]
  28. Butsic, V.; Shapero, M.; Moanga, D.; Larson, S. Using InVEST to assess ecosystem services on conserved properties in Sonoma County, CA. Calif. Agric. 2017, 71, 81–89. [Google Scholar] [CrossRef]
  29. Caro, C.; Marques, J.C.; Cunha, P.P.; Teixeira, Z. Ecosystem services as a resilience descriptor in habitat risk assessment using the InVEST model. Ecol. Indic. 2020, 115, 106426. [Google Scholar] [CrossRef]
  30. Wu, L.; Luo, Y.; Pang, S.; Wang, G.; Ma, X. Factor analysis of hydrologic services in water-controlled grassland ecosystems by InVEST model and geodetector. Environ. Sci. Pollut. Res. 2024, 31, 20409–20433. [Google Scholar] [CrossRef]
  31. Zhao, Z.; Liu, G.; Mou, N.; Xie, Y.; Xu, Z.; Li, Y. Assessment of Carbon Storage and Its Influencing Factors in Qinghai-Tibet Plateau. Sustainability 2018, 10, 1864. [Google Scholar] [CrossRef]
  32. Nel, L.; Boeni, A.F.; Prohászka, V.J.; Szilágyi, A.; Kovács, E.T.; Pásztor, L.; Centeri, C. InVEST Soil Carbon Stock Modelling of Agricultural Landscapes as an Ecosystem Service Indicator. Sustainability 2022, 14, 9808. [Google Scholar] [CrossRef]
  33. Kohestani, N.; Rastgar, S.; Heydari, G.; Jouibary, S.S.; Amirnejad, H. Spatiotemporal modeling of the value of carbon sequestration under changing land use/land cover using InVEST model: A case study of Nour-rud Watershed, Northern Iran. Environ. Dev. Sustain. 2023, 26, 14477–14505. [Google Scholar] [CrossRef]
  34. Huang, W.; Guo, L.; Zhang, T.; Chen, T.; Chen, L.; Li, L.; Zhang, X. The Impact of Territorial Spatial Transformation on Carbon Storage: A Case Study of Suqian, East China. Land 2024, 13, 348. [Google Scholar] [CrossRef]
  35. He, C.; Zhang, D.; Huang, Q.; Zhao, Y. Assessing the potential impacts of urban expansion on regional carbon storage by linking the LUSD-urban and InVEST models. Environ. Model. Softw. 2016, 75, 44–58. [Google Scholar] [CrossRef]
  36. Jiang, W.; Deng, Y.; Tang, Z.; Lei, X.; Chen, Z. Modelling the potential impacts of urban ecosystem changes on carbon storage under different scenarios by linking the CLUE-S and the InVEST models. Ecol. Model. 2017, 345, 30–40. [Google Scholar] [CrossRef]
  37. Lyu, R.; Mi, L.; Zhang, J.; Xu, M.; Li, J. Modeling the effects of urban expansion on regional carbon storage by coupling SLEUTH-3r model and InVEST model. Ecol. Res. 2019, 34, 380–393. [Google Scholar] [CrossRef]
  38. Wang, J.; Zhang, Q.; Gou, T.; Mo, J.; Wang, Z.; Gao, M. Spatial-temporal changes of urban areas and terrestrial carbon storage in the Three Gorges Reservoir in China. Ecol. Indic. 2018, 95, 343–352. [Google Scholar] [CrossRef]
  39. Zhu, W.; Zhang, J.; Cui, Y.; Zhu, L. Ecosystem carbon storage under different scenarios of land use change in Qihe catchment, China. J. Geogr. Sci. 2020, 30, 1507–1522. [Google Scholar] [CrossRef]
  40. Zhou, J.; Zhao, Y.; Huang, P.; Zhao, X.; Feng, W.; Li, Q.; Xue, D.; Dou, J.; Shi, W.; Wei, W.; et al. Impacts of ecological restoration projects on the ecosystem carbon storage of inland river basin in arid area, China. Ecol. Indic. 2020, 118, 106803. [Google Scholar] [CrossRef]
  41. Li, C.; Zhao, J.; Thinh, N.X.; Xi, Y. Assessment of the Effects of Urban Expansion on Terrestrial Carbon Storage: A Case Study in Xuzhou City, China. Sustainability 2018, 10, 647. [Google Scholar] [CrossRef]
  42. Tang, L.; Ke, X.; Zhou, T.; Zheng, W.; Wang, L. Impacts of cropland expansion on carbon storage: A case study in Hubei, China. J. Environ. Manag. 2020, 265, 110515. [Google Scholar] [CrossRef] [PubMed]
  43. Chu, X.; Zhan, J.; Li, Z.; Zhang, F.; Qi, W. Assessment on forest carbon sequestration in the Three-North Shelterbelt Program region, China. J. Clean. Prod. 2019, 215, 382–389. [Google Scholar] [CrossRef]
  44. Ma, S.; Wang, L.-J.; Zhu, D.; Zhang, J. Spatiotemporal changes in ecosystem services in the conservation priorities of the southern hill and mountain belt, China. Ecol. Indic. 2020, 122, 107225. [Google Scholar] [CrossRef]
  45. Zhu, L.; Song, R.; Sun, S.; Li, Y.; Hu, K. Land use/land cover change and its impact on ecosystem carbon storage in coastal areas of China from 1980 to 2050. Ecol. Indic. 2022, 142, 109178–109191. [Google Scholar] [CrossRef]
  46. Calle, L.; Canadell, J.G.; Patra, P.; Ciais, P.; Ichii, K.; Tian, H.; Kondo, M.; Piao, S.; Arneth, A.; Harper, A.B.; et al. Regional carbon fluxes from land use and land cover change in Asia, 1980–2009. Environ. Res. Lett. 2016, 11, 074011–074023. [Google Scholar] [CrossRef]
  47. Lobser, S.E.; Cohen, W.B. MODIS tasselled cap: Land cover characteristics expressed through transformed MODIS data. Int. J. Remote Sens. 2007, 28, 5079–5101. [Google Scholar] [CrossRef]
  48. Shaoqiang, W.; Chenghu, Z.; Kerang, L.; Songli, Z.; Fanghong, H. Analysis on Spatial Distribution Characteristics of Soil Organic Carbon Reservoir in China. Acta Geographica Sinica. 2000, 55, 533–544. [Google Scholar] [CrossRef]
  49. Kerang, L.; Shaoqiang, W.; Mingkui, C. Vegetation and soil carbon storage in China. Sci. China Ser. D 2003, 31, 72–80. [Google Scholar] [CrossRef]
  50. Kalantari, Z.; Ferreira, C.S.S.; Page, J.; Goldenberg, R.; Olsson, J.; Destouni, G. Meeting sustainable development challenges in growing cities: Coupled social-ecological systems modeling of land use and water changes. J. Environ. Manag. 2019, 245, 471–480. [Google Scholar] [CrossRef]
  51. Zheng, H.; Zheng, H. Assessment and prediction of carbon storage based on land use/land cover dynamics in the coastal area of Shandong Province. Ecol. Indic. 2023, 153, 110474–110486. [Google Scholar] [CrossRef]
  52. Luo, Y.; Lü, Y.; Fu, B.; Zhang, Q.; Li, T.; Hu, W.; Comber, A. Half century change of interactions among ecosystem services driven by ecological restoration: Quantification and policy implications at a watershed scale in the Chinese Loess Plateau. Sci. Total. Environ. 2019, 651, 2546–2557. [Google Scholar] [CrossRef] [PubMed]
  53. Hu, B.; Kang, F.; Han, H.; Cheng, X.; Li, Z. Exploring drivers of ecosystem services variation from a geospatial perspective: Insights from China’s Shanxi Province. Ecol. Indic. 2021, 131, 108188–108200. [Google Scholar] [CrossRef]
  54. Xiang, S.; Xiang, S.; Wang, Y.; Wang, Y.; Deng, H.; Deng, H.; Yang, C.; Yang, C.; Wang, Z.; Wang, Z.; et al. Response and multi-scenario prediction of carbon storage to land use/cover change in the main urban area of Chongqing, China. Ecol. Indic. 2022, 142, 109205–109218. [Google Scholar] [CrossRef]
  55. Li, L.; Song, Y.; Wei, X.; Dong, J. Exploring the impacts of urban growth on carbon storage under integrated spatial regulation: A case study of Wuhan, China. Ecol. Indic. 2020, 111, 106064. [Google Scholar] [CrossRef]
  56. Zhu, G.; Qiu, D.; Zhang, Z.; Sang, L.; Liu, Y.; Wang, L.; Zhao, K.; Ma, H.; Xu, Y.; Wan, Q. Land-use changes lead to a decrease in carbon storage in arid region, China. Ecol. Indic. 2021, 127, 107770–107780. [Google Scholar] [CrossRef]
  57. Houghton, R.A.; Hackler, J.L. Emissions of carbon from forestry and land-use change in tropical Asia. Glob. Chang. Biol. 1999, 5, 481–492. [Google Scholar] [CrossRef]
  58. Chang, X.; Xing, Y.; Wang, J.; Yang, H.; Gong, W. Effects of land use and cover change (LUCC) on terrestrial carbon stocks in China between 2000 and 2018. Resour. Conserv. Recycl. 2022, 182, 106333–106356. [Google Scholar] [CrossRef]
  59. Feng, H.; Wang, S.; Zou, B.; Yang, Z.; Wang, S.; Wang, W. Contribution of land use and cover change (LUCC) to the global terrestrial carbon uptake. Sci. Total. Environ. 2023, 901, 165932. [Google Scholar] [CrossRef]
  60. Niu, J.; Xin, B.; Xin, B.; Zhang, Y.; Wang, M. Research on the coordinated development of provincial urbanization and carbon emission efficiency of construction industry in China. Carbon Balance Manag. 2024, 19, 1–26. [Google Scholar] [CrossRef]
  61. Li, Y.; Gao, K. The impact of green urbanization on carbon emissions: The case of new urbanization in China. Front. Environ. Sci. 2022, 10, 1070652–1070665. [Google Scholar] [CrossRef]
Figure 1. Location map of study area.
Energies 17 03284 g001
Figure 2. Annual land use type in SXP.
Energies 17 03284 g002
Figure 3. Spatial distribution of carbon storage.
Energies 17 03284 g003
Figure 4. Distribution of carbon storage changes in SXP during different periods.
Energies 17 03284 g004
Figure 5. Carbon storage of different land use types in SXP from 2000 to 2020.
Energies 17 03284 g005
Figure 6. Carbon sequestration from 2000 to 2020.
Energies 17 03284 g006
Figure 7. Spatial matching diagram of carbon storage.
Energies 17 03284 g007
Figure 8. (a) Correlation coefficient between driving factors and carbon storage and (b) sensitivity of driving factors to carbon storage.
Energies 17 03284 g008
Table 1. Data sources.
DataUnitsSpatial
Resolution
Sources
Land
utilization
1 km ×1 km
30 m × 30 m
(https://www.resdc.cn/Default.aspx (accessed on 16 January 2024))
GlobeLand30: (http://www.globallandcover.com/ (accessed on 16 January 2024))
Population densityPerson/km21 km × 1 kmWorldPop (https://www.worldpop.org/ (accessed on 16 January 2024))
Elevationm90 m × 90 mhttps://www.gscloud.cn/ (accessed on 17 January 2024)
Mean annual temperaturesCentigrade1 km × 1 kmhttps://www.resdc.cn/Default.aspx (accessed on 17 January 2024)
GDP densityRMB1 km × 1 kmhttps://www.resdc.cn/Default.aspx (accessed on 17 January 2024)
Average rainfallmm1 km × 1 kmScienceDataBank (https://www.scidb.cn/en/cstr/31253.11.sciencedb.01607 (accessed on 17 January 2024))
Table 2. Carbon density values of land use in China [47,48,49].
LULC 1Above-Ground BiomassUnderground BiomassSoilDead Organic Matter
Farmland5.780.7108.49.82
Forest142.4115.9129.214.11
Grassland3.42.711499.97.28
Water0.3000
Building land00780
Unused land1.3000
1 Carbon density unit: t/hm2.
Table 3. Revised carbon density values of land use in SXP.
LULC 1Above-Ground
Biomass
Underground
Biomass
SoilDead Organic
Matter
Farmland6.7792.42119.469.82
Forest169.09132.73261.0614.11
Grassland41.9299.06110.097.28
Water0.360.000.000.00
Building land0.000.0085.960.00
Unused land1.540.000.000.00
1 Carbon density unit: t/hm2.
Table 4. Land use transfer matrix from 2000 to 2010.
LUCC 1Building Land 2000Farmland 2000Forest
2000
Grassland 2000Unused Land 2000Water
2000
Building land 20103468.52488.8246.1783.713.038.56
Farmland 201042.6860,699.1026.5587.970.1262.64
Forest 20105.92296.6543,908.1072.740.030.00
Grassland 20102.68412.9043.6445,191.900.003.85
Unused land 20100.030.970.000.00132.321.00
Water 20102.3486.495.9319.810.001302.26
1 Area unit: km2.
Table 5. Land use transfer matrix from 2010 to 2020.
LUCC 1Building Land 2010Farmland 2010Forest
2010
Grassland 2010Unused Land 2010Water
2010
Building land 20201963.374066.26508.111041.5210.79137.71
Farmland 20201680.2539,593.904903.2411,751.2055.55530.05
Forest 2020146.635039.5132,194.807252.4512.8084.30
Grassland 2020280.6911,728.206503.9125,307.3016.50183.43
Unused land 20202.3819.817.7718.9227.7711.01
Water 202025.37449.69102.92236.9610.63460.80
1 Area unit: km2.
Table 6. Land use transfer matrix from 2000 to 2020.
LUCC 1Building Land 2000Farmland 2000Forest
2000
Grassland 2000Unused Land 2000Water
2000
Building land 20201625.254370.39514.781070.5413.28133.12
Farmland 20201513.6239,850.004845.2811,706.2054.58542.94
Forest 2020117.305226.3632,054.007236.8912.8083.28
Grassland 2020240.6112,012.006444.5825,136.8016.53168.99
Unused land 20202.3820.208.0818.6027.3911.01
Water 202022.48482.27100.97240.6310.67430.88
1 Area unit: km2.
Disclaimer/Publisher’s Note: The statements, opinions and data contained in all publications are solely those of the individual author(s) and contributor(s) and not of MDPI and/or the editor(s). MDPI and/or the editor(s) disclaim responsibility for any injury to people or property resulting from any ideas, methods, instructions or products referred to in the content.

