Abstract
Achieving sustainable green building design is essential to reducing our environmental impact and enhancing energy efficiency. Traditional methods often depend heavily on expert knowledge and subjective decisions, posing significant challenges. This research addresses these issues by introducing an innovative framework that integrates building information modeling (BIM), explainable artificial intelligence (AI), and multi-objective optimization. The framework includes three main components: data generation through DesignBuilder simulation, a BO-LGBM (Bayesian optimization–LightGBM) predictive model with LIME (Local Interpretable Model-agnostic Explanations) for energy prediction and interpretation, and the multi-objective optimization technique AGE-MOEA to address uncertainties. A case study demonstrates the framework’s effectiveness, with the BO-LGBM model achieving high prediction accuracy (R-squared > 93.4%, MAPE < 2.13%) and LIME identifying significant HVAC system features. The AGE-MOEA optimization resulted in a 13.43% improvement in energy consumption, CO2 emissions, and thermal comfort, with an additional 4.0% optimization gain when incorporating uncertainties. This study enhances the transparency of machine learning predictions and efficiently identifies optimal passive and active design solutions, contributing significantly to sustainable construction practices. Future research should focus on validating its real-world applicability, assessing its generalizability across various building types, and integrating generative design capabilities for automated optimization.
1. Introduction
The construction sector is essential for meeting growing needs and expanding social and economic activities while minimizing harm to the local environment [1]. The building industry plays a crucial role in global energy consumption and greenhouse gas emissions, driving up energy costs and causing severe environmental damage like pollution and climate change as a major concern [2]. For example, the building process alone in China produced 4.997 billion tons of carbon dioxide (CO2) in 2019, representing 50.6% of the nation’s total carbon emissions, due to the country’s fast urbanization [3]. Furthermore, the construction sector in China was responsible for 2.233 billion tons of standard coal equivalent (SCE), representing 46.5% of the country’s total energy consumption [4]. In the European Union (EU), buildings also account for 36% of greenhouse gas emissions and more than 40% of energy usage [5]. Globally, the building industry is trending toward increased energy usage, which is predicted to rise by 88% between 2003 and 2050 [2,6]. This issue has raised awareness of the need of near-energy-neutral green buildings in accomplishing sustainable development goals [7]. Environmental, social, and human viewpoints all highlight the advantages of adopting green construction over traditional building practices [8,9]. Achieving great energy efficiency, lowering CO2 emissions, saving money, and providing adaptable thermal comfort are among the benefits [10,11]. In recent years, the idea of “green building” has grown significantly. Evaluating and optimizing building energy performance in the preliminary stages of design are essential for developing a green building [12,13].
This early analysis aims to reduce waste and discomfort that result from poor design so that the building can reach its maximum potential for both energy efficiency and occupant comfort [14]. Several energy simulation programs have been developed to gain insights into energy performance through dynamic modeling, including DOE-2, OpenStudio, Ecotect, DesignBuilder, and others [15]. However, because so many parameters are needed, this physics-based modeling approach can be overly complex and occasionally lack computational efficiency [16]. Adhering closely to internationally recognized green building certification systems that integrate sustainable design principles, such as China’s MHURD standards, the EU’s EPBD for near-zero-energy buildings, and LEED (Leadership in Energy and Environmental Design), is a simpler approach [17]. However, comparing results to several criteria can be laborious, experience-based, and biased towards judgment [18,19]. The European Union established the Energy Performance of Buildings Directive (EPBD 2018/844/EU) among other regulations to ensure that every new construction conforms with the requirements for near-zero-energy buildings (nZEBs) [20]. The Ministry of Housing and Urban–Rural Development of China creates the most widely used green building evaluation standard (MHURD) [21]. It does, however, require a significant amount of time and work to assess a range of variables, in addition to experience. Furthermore, it may generate erroneous findings influenced by judgment and cognitive biases [22,23]. Since the building industry is presently becoming more information-intensive, it is beneficial to delve further, for hidden knowledge discovery, into the growing corpus of data on building energy efficiency [24]. This is enabled by the rapidly growing big data sector. Notably, data-driven approaches have become more important in the assessment of green buildings to facilitate automated, effective, and impartial decision-making [25]. Machine learning has emerged as a promising solution to overcome shortcomings of traditional building energy prediction methods during design [26,27]. Numerous algorithms, including multi-layer perceptron, ensemble learning, support vector machines, and others, have the following advantages: they are highly efficient, have a simplified parameter structure that is appropriate for the early stages of design, consistently perform well in predictions, and have an excellent generalization ability to comprehend complex energy systems [28,29]. Machine learning techniques play a significant role in offering insightful information about the intricate relationship between the performance of green buildings and various influential factors, including personnel activities, façade openings, the envelope structure, and facility operational efficiency [30]. This information enables decision-makers to identify potential issues with design early on and take appropriate action [31].
The following three areas still require improvement, even though many studies have produced highly effective machine-learning-based energy prediction models [32]. First, it should be mentioned that fine-tuning hyperparameters is essential to managing a machine learning model’s behavior [33]. A more promising prediction quality will undoubtedly be attained by carefully choosing the ideal hyperparameter setup [34]. Studies that have looked at different machine learning techniques for predicting energy performance have paid less attention to the automated adjustment process [35]. Despite being labor-intensive, manual parameter tuning is still common [36]. This approach enhances the model’s repeatability and reliability by rapidly determining the optimal hyperparameter combination in fewer iterations. However, research suggests that machine learning is most effectively applied during the operational phase rather than the design phase [37].
Since effective design accounts for about 30% of energy savings, it is desirable to fully incorporate machine learning from the design stage to support the decisions made by building designers [38]. Nevertheless, it is challenging to directly interpret most machine learning approaches since they are complex [39]. A lack of confidence may result from an inability to understand the results and predictive models. The solution to this is to use explainable machine learning algorithms that generate understandable explanations of the variable importance and prediction mechanism [40]. This may unlock the mystery, offering believable justifications and boosting the models’ level of trust. The best practices for green building design are currently being discussed [41]. This decision-making technique, a multi-objective optimization (MOO) task, can be seen as an alternative to conventional human judgment [42]. MOO integrates with the well-known machine learning methodology to produce Pareto-compromised solutions without the need for complex equations [43]. This makes the prediction models more useful in actual situations and makes it easier to create data-driven, optimal plans for green buildings [44,45]. Considering sources of uncertainty is a necessary step towards making data-driven strategies more robust [46,47]. The goal of this study is to provide a system that combines multi-objective optimization, explainable machine-learning-based prediction, and simulation based on building information modeling (BIM) to provide data-driven assistance for the design of successful green buildings from the ground up. The novel aspect of this study is the hybrid algorithm that uses computational intelligence methods to extract information about various aspects of building energy usage from massive volumes of BIM-based simulation data. It still has a strong capacity for high generalization, simultaneous optimization, in-depth explanation, and autonomous learning. The usefulness of this research lies in its potential to function as a trustworthy instrument for decision-making, enhancing computational efficiency and objectivity in the process of pinpointing the most important variables and effectively managing features of interest. By adhering to accurate forecasts and practical recommendations derived from the proposed data-driven analysis, green buildings can meet their objectives of minimizing our environmental impact, enhancing indoor thermal comfort, and reducing energy consumption from the early design stage onward. The rest of the manuscript covers the following: Section 2—Overview of relevant research, Section 3—Methodology, Section 4—Case study validating the proposed method’s performance, Section 5—Reliability under uncertainty sources, Section 6—Conclusions and future research recommendations.
2. Literature Review
2.1. Green Building Information Modeling
BIM is the creative process of organizing information to provide value in design projects [48,49]. Due to its advantages in information sharing, digital visualization, project collaboration, and improved decision-making, BIM has been used in previous studies to support green buildings [50,51]. The notion of “green BIM” emerged as a result, with the goal of promoting sustainability in terms of the social, economic, and environmental spheres [52,53]. For example, Cascone [54] created a Revit plug-in connecting BIM with LEED certification to automate sustainability review, while Huang, Lei [55] incorporated a green building rating system into BIM to assure energy efficiency via improved design. Another important area of research is accurately and promptly estimating building energy use to enable early design decisions, to achieve desired sustainability [56]. It takes a lot of time to manually enter many building factors into BIM-based simulation engines, even if the simulation-based approach excels at varying energy usage under various design parameter settings [28,57]. Issues that need to be addressed include inconsistent regulations and standards, the need for BIM technical training, excessive manual operations, high computation costs, and the underutilization of BIM data for performance analysis. For instance, Motalebi, Rashidi [58] created a comprehensive method of energy modeling and lifecycle analysis allowed by BIM to produce practical solutions that might enhance the environmental effects and energy efficiency of buildings. Feng [59] effectively mitigated carbon dioxide emissions in cold climates by combining an optimization technique with discrete-event simulation. However, a questionnaire survey by Abuhussain, Waqar [60] of various stakeholders indicates that there are still obstacles to green BIM practice that must be quickly overcome. These include inconsistent regulations and standards currently in place, the need for BIM technical training, the need for excessive manual operations, the excessive cost of computation, and the underutilization of data [47]. Green building information modeling (BIM) is pivotal in enhancing sustainable construction practices. The utilization of reliable data sources, such as the China Building Energy and Emission Database (CBEED), is essential to ensure accurate assessments. CBEED, developed by the China Building Energy Conservation Association, comprehensively covers energy consumption and emissions data within China’s construction sector. This data is instrumental in quantifying carbon emissions trends in commercial buildings and formulating future predictions. However, existing research reveals challenges in identifying and eliminating redundant influencing factors affecting carbon emissions, which complicates policy implementation and increases control costs. Moreover, scenario analysis based on the KAYA identity often overlooks variations in the significance of different factors influencing emissions pathways. These challenges highlight a current knowledge gap: the full potential of BIM in green building development has not been realized, and there is scope to maximize the use of BIM data for performance analysis and sustainable design. Addressing these gaps can enhance the practical application of BIM in sustainable building design. Future research should focus on developing standardized protocols, training programs, and automated tools to leverage BIM data more effectively.
Despite the advancements in green BIM, several challenges remain, including the need for consistent regulations and standards, technical training, and efficient data utilization. Addressing these gaps can enhance the practical application of BIM in sustainable building design. Future research should focus on developing standardized protocols, training programs, and automated tools to leverage BIM data more effectively for green building performance analysis.
2.2. Predicting Building Energy with Machine Learning
Building project management is undergoing innovative changes due to the emerging field of machine learning, which is a subset of artificial intelligence (AI) and is growing in maturity [61]. Optimal solutions can be obtained through a variety of machine learning algorithms rather than laborious building performance simulations [62]. Machine learning can characterize building energy systems accurately and intelligently, given their intrinsic complexity and nonlinearity, because it is more computationally efficient and has a higher learning capacity than classical energy analysis methodologies [63]. Machine learning techniques can provide valuable insights into the expanding BIM information flows for automated knowledge discovery [64]. Through the process of developing energy models and estimating the input–output connection, some research has used machine learning to provide quick early-stage energy estimates [65]. This approach usually entails data collecting, preprocessing, model training, and testing. Uncuoglu, Citakoglu [66] comprehensively reviewed commonly used techniques like autoregressive approaches, tree-based algorithms, neural networks, support vector machines, linear regression, etc. Ghasemieh, Lloyed [67] highlighted ensemble learning’s importance, noting its ability to balance individual model strengths/weaknesses for improved generalization and prediction performance. Hence, this study explores the Light Gradient Boosting Machine (LGBM) ensemble technique, which is a high-performance, distributed gradient boosting system using decision trees for fast and effective execution, aiming at energy-efficient building design [68]. Its benefits include minimal memory consumption, high prediction accuracy, great computational efficiency, and compatibility with a wide range of datasets [69]. Furthermore, there is further work to be carried out on the automatic tuning of hyperparameters and model description in the current investigations [70]. Regarding the first point, model parameter adjustment is crucial for effectively managing the behavior of machine learning models, as noted by Pinto, Wang [38]. To guarantee extremely accurate machine learning models, the best hyperparameter combinations can be quickly found by efficiently scanning the hyperparameter space with less manual labor [71]. However, there is currently a growing focus on explainable artificial intelligence (XAI) to improve machine learning’s interpretability and transparency [72]. Explainable AI (XAI) extracts critical components from complex machine learning models and determines their importance to prediction outcomes [73]. XAI analysis provides a comprehensive understanding of how the model interacts with inputs and why the optimal model outperforms others in accuracy [74]. As per Roscher, Bohn [75], explainable machine learning is crucial for extracting novel scientific insights from models. Although unexplored for building energy previously, it can enable high interpretability and transparency in machine learning for richer research findings [76]. Using the LGBM, Bayesian hyperparameter optimization, and a new model explanation approach, this work develops an explainable hybrid machine learning model to close this gap. Its goals include deeper “black box” knowledge and better prediction accuracy with fewer iterations [77].
While the current literature extensively explores the application of ML techniques such as LGBM for building energy prediction, there remains a significant gap in understanding the scalability and robustness of these models across diverse building types and geographical locations. Existing studies often focus on specific building types or regions, limiting the generalizability of their findings. Future research should therefore prioritize the development of ML models that can adapt to varying building characteristics and environmental conditions, ensuring reliable predictions across different contexts. This approach will not only enhance the applicability of ML in building energy management but also foster broader acceptance and adoption within the construction industry.
2.3. Multi-Objective Optimization for Green Building Design
The established predictive model can be used to predict building energy; however, it is unclear how best to use it to further the development of green buildings [78]. Green building design recommendations are now mostly based on the rapid evaluation and accumulated knowledge/experience of specialists, which might vary from person to person and be unreliable [61]. Regretfully, under conditions of extreme complexity and unpredictability, this poses a serious obstacle to the data-driven reporting of energy control measures [79]. Another promising research direction involves developing a decision-making tool that balances all objectives in sustainable built environment creation through a multi-objective optimization (MOO) method based on the LGBM metamodel [80]. Formulating an optimal building design requires considering and simultaneously optimizing more than two building energy performance objectives, likely presenting challenges beyond conventional single-objective problems [81]. For instance, Tanhadoust, Madhkhan [82] combined the energy performance model of the air conditioning system and building envelope with the Non-dominated Sorting Genetic Algorithm II (NSGA-II) to find the best configurations for minimizing CO2 emissions and construction costs at the same time. Building envelope design parameters were optimized using the NSGA-II algorithm by Chen, Liu [83] to reduce building energy consumption and increase thermal comfort. These investigations, however, mostly use the most traditional NSGA method, which may have several drawbacks, including a limitation on spread uniformity, the creation of duplicate persons, challenges in locating isolated sites, and an increase in variable dimensions [84]. In contrast, their explanation of the optimization problem is simplistic and considers only one category of variables and two objectives, which is inconsistent with reality [85]. It is also important to highlight that the substantial influence of uncertainty on optimization performance has not been investigated in prior research. Given that uncertainty originating from both the data and the model is inevitable in real-world scenarios, it is crucial to take uncertainty into account when optimizing to ensure the resilience of the suggested approach. These limitations call for a more thorough and theoretical analysis because there is still much to learn about the subject of optimization-based green building design.
Building energy management is entering a new stage with the integration of Internet of Things (IoT) devices and real-time data streams [86]. Subsequent investigations might concentrate on creating machine learning models that can handle and adjust to ongoing data inputs, allowing for more dynamic and responsive energy forecasts [87]. This strategy would enable real-time system optimization for buildings, which might save a lot of energy and increase occupant comfort. The use of transfer learning strategies to overcome the issue of restricted data availability for building types or geographic areas is another exciting field [32]. Transfer learning has the potential to enhance the generalizability of machine learning models across a variety of building types by enabling models developed on data-rich buildings to be modified for usage in situations where data are limited [88]. The integration of occupant behavior modeling into energy prediction algorithms is an essential area of research. Current models tend to view building inhabitants as static entities, even though human behavior has a major impact on energy usage. The creation of machine learning models that take into consideration the random behavior of occupants has the potential to improve prediction accuracy and provide guidance for more efficient energy-saving measures [89].
Life cycle assessment (LCA) techniques and MOO approaches have the potential to be integrated in the field of green building design optimization. This integration could allow for more thorough sustainability assessments, considering not only operational energy use but also embodied energy and environmental implications over the course of a building’s lifetime [90]. A more comprehensive and sustainable building design could result from such an approach. An intriguing area of study is the use of reinforcement learning methods to build energy optimization and management [89]. Over time, reinforcement learning algorithms may be able to determine the best control techniques for building systems, adjusting to shifting circumstances and user preferences while continuously maximizing comfort and energy economy [91]. The area may advance more quickly if cooperative, cloud-based systems for exchanging building energy data and machine learning models are developed. These kinds of platforms might make it easier to compile bigger, more varied datasets and allow academics to compare their models with a variety of building kinds and operating conditions. This cooperative method may provide models that are stronger and more broadly applicable while also encouraging innovation through transparent information exchange. The dynamic character of the subject and the potential for major breakthroughs in building energy prediction and green building design optimization are highlighted by these new research directions. Through investigating these fields, scholars can aid in the advancement of increasingly complex, versatile, and efficient instruments for establishing sustainable constructed environments.
Table 1 provides a comprehensive overview of various factors involved in green building design, spanning different areas such as green BIM, machine learning, multi-objective optimization, and related domains. One crucial factor that stands out is the handling of uncertainty, which is marked as being addressed by multi-objective optimization techniques. Given that uncertainty originating from both the data and the model is inevitable in real-world scenarios, it is crucial to take uncertainty into account when optimizing to ensure the resilience of the suggested approach. However, the literature review also emphasizes that “These limitations call for a more thorough and theoretical analysis because there is still much to learn about the subject of optimization-based green building design.” This suggests that while multi-objective optimization shows promise in addressing uncertainty, there is still a need for further research and theoretical analysis to develop more robust and resilient optimization approaches for green building design.

Table 1.
Comparison of features in green approaches to sustainable architecture and design.
Despite the potential of multi-objective optimization in green building design, current methods often oversimplify the optimization problem and neglect the impact of uncertainties. Addressing these gaps requires developing more sophisticated optimization algorithms that consider multiple categories of variables and objectives, as well as incorporating uncertainty into the optimization process. Future research should focus on creating robust optimization frameworks that can handle the complexities and unpredictability’s of real-world scenarios, ensuring resilient and sustainable green building designs.
3. Methodology
A unique hybrid framework combining explainable machine learning and multi-objective optimization approaches is offered for intelligent prediction and data-driven improvement of green building performance. The framework, outlined in Figure 1, comprises three key components providing robust knowledge support across two optimization scenarios and intelligent forecasting. Initially, an orthogonal testing and BIM-based simulation approach aids in curating a multi-feature dataset. Several crucial features closely linked to green building energy efficiency have been identified to develop a multi-feature assessment system. Subsequently, a prediction model dubbed Bayesian optimization–Light Gradient Boosting Machine (BO-LGBM) is constructed by synergizing ensemble learning with Bayesian optimization. Moreover, to enhance model interpretability, LIME (Local Interpretable Model-agnostic Explanations) values quantify the significance of each input feature towards the target objective [92]. In the third step, the generated metamodel is subjected to the multi-objective optimization (MOO) method of the Adaptive Genetic Ensemble of Multi-Objective Evolutionary Algorithms (AGE-MOEA) to determine the optimal solutions for constructing aesthetically pleasing and long-lasting buildings. Two scenarios are included in the data-driven optimization framework: the deterministic scenario and the uncertain scenario. The main difference between them is how the latter manages uncertainty. In particular, the deterministic scenario does not take into consideration the combination of model and data uncertainty, while the uncertain scenario does. The uncertain scenario may thus improve the robustness and dependability of choices made on the design of green buildings by specifically including these uncertainties into the optimization process. A data-driven analytical framework for green building design aims to proactively construct an assessment index system that includes objectives and contributing elements. It is essential to create a dataset on building energy performance based on the established evaluation methodology by utilizing DesignBuilder (2020) simulation and BIM modeling. First, using Revit software (2020), a geometrically precise 3D BIM model of the suggested building is produced.
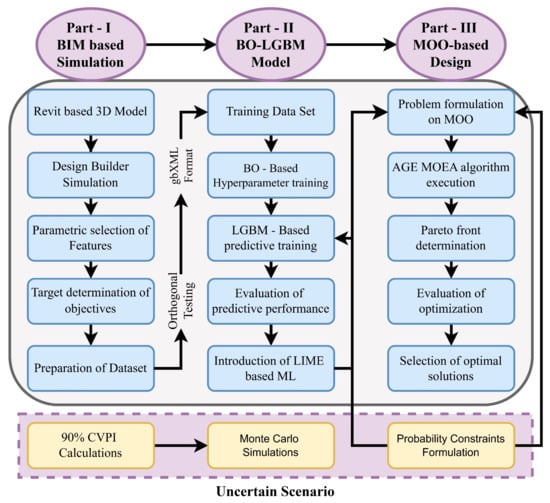
Figure 1.
The optimization procedure’s workflow.
A Common Data Environment (CDE) is built as part of the BIM-based design information management process to enable data integration into the model [93]. Next, a computational simulation program called DesignBuilder is employed for dynamic simulation, considering multiple parameters to provide accurate energy performance estimation [94]. DesignBuilder offers an intuitive graphical user interface for EnergyPlus software (2020), with two key advantages—importing the BIM model in gbXML format eliminates the need for recreating an analysis model, and when supplied with parameters, DesignBuilder as a simulation engine enables highly realistic simulations accounting for thermal mass, glazing, HVAC, and interactions across building systems/components. Orthogonal testing for efficiency and simplicity underpins the DesignBuilder-based dynamic simulations. The core concept is utilizing an orthogonal array to streamline multi-factor studies by significantly reducing experiment numbers while ensuring uniform data distribution across the test range [95]. Data preparation involving noise removal, standardization, and transformations to enhance training usefulness for machine learning models is a prerequisite after data collection. Finally, it is possible to produce a better dataset to support the data-driven study of energy efficiency in green buildings. This methodology detail is explained in Algorithm 1 below:
| Algorithm 1 Pseudocode for Research. |
| Input: Revit model, Target objectives, Design parameters Output: Optimal solutions, Probability constraints |
 |
In this algorithm the comprehensive process involves BIM, Bayesian optimization with LGBM modeling, and MOO to derive optimal and reliable solutions from a Revit model. Initially, a Revit-based 3D model was created and simulated to generate results and parametric features. These features help define objectives and prepare datasets for model training. The next phase employs Bayesian optimization to fine-tune hyperparameters for training a predictive LGBM model, which is then evaluated for performance. To enhance model interpretability, LIME is applied, followed by Monte Carlo simulations to assess prediction robustness. The final phase focuses on formulating a multi-objective optimization problem using the defined objectives and design parameters. The AGE MOEA algorithm is executed to determine the Pareto front, from which optimal solutions are selected. These solutions undergo further evaluation to establish probability constraints, ensuring their reliability. The algorithm systematically combines simulation, machine learning, and optimization techniques to achieve optimal design solutions while considering performance variability and reliability.
3.1. Predicting Building Energy Performance Using Ensemble Learning with Hyperparameter Optimization
A branch of artificial intelligence called “machine learning” is focused on learning from and adapting to large volumes of data. For predictive analytics, the framework makes it possible to simulate the nonlinear correlations accurately and automatically between important parameters and energy performance objectives. When compared to a single model, ensemble learning provides superior prediction accuracy and resilience by combining the predictive outputs of many base learners into a strong learner. The widely used ensemble learning method known as gradient boosting decision tree (GBDT) offers superior interpretability, accuracy, and efficiency. With GBDT, decision trees are built additively rather than independently as in typical random forests. It trains each tree by fitting the residual errors from the prior iteration, resulting in faster and more precise predictions. Introduced in 2017, LightGBM (LGBM) is an effective GBDT implementation designed to handle large-scale data with high feature dimensionality efficiently [96]. Model performance is enhanced in terms of quicker training durations, less memory use, more accuracy, and better scalability by using tree-based learning algorithms in LGBM, a distributed and extremely effective gradient boosting framework [97]. Motivated by these advantages, the metamodel used in this study to forecast building energy performance is LGBM. Equations (1) and (2) demonstrate how the mean absolute percentage error (MAPE) and coefficient of determination (R2) are used to quantitatively assess the performance of the LGBM-based prediction:
where yi is the predicted value, ŷi is the measured value, and yi is the mean of the measured value.
Gradient-based One-side Sampling (GOSS) and Exclusive Feature Bundling (EFB) are two novel concepts that LGBM integrates. During instance down-sampling based on gradients, GOSS, a unique sampling technique, randomly discards instances with lesser gradients and keeps examples with bigger gradients, resulting in a more accurate estimation of information gain with a significantly reduced data size. EFB successfully avoids unnecessary actions on zero feature values by lowering feature dimensions, recognizing and combining mutually incompatible features into fewer dense features, and doing so with almost lossless Ly. Algorithms related to LGBM can achieve good prediction performance with a much faster and simpler training process. The mean absolute percentage error (MAPE) and coefficient of determination (R2) are used to objectively assess the performance of the LGBM-based prediction [98]. The goodness of fit is measured by R2, and scale independence and interpretability are provided by MAPE, which is the average absolute percentage error. As in Equation (3), higher R2 values nearer one and lower MAPE values nearer zero denote better prediction performance.
where f(x) is the objective function.
Furthermore, finding an improved hyperparameter setup helps create a machine learning model that performs better in predictions. In this sense, optimizing model design now heavily depends on hyperparameter adjustment. Conventional manual parameter searches can be time-consuming and tedious. An automated hyperparameter optimization (HPO) procedure is required to solve this problem and improve the machine learning model’s reproducibility and usefulness while requiring fewer human interactions [99]. Surprisingly, Bayesian optimization (BO) has become a potent hyperparameter tuning method that makes it possible to effectively optimize costly black-box functions globally [100]. LGBM incorporates two innovative concepts: Exclusive Feature Bundling (EFB) and Gradient-based One-side Sampling (GOSS). The estimated variance Ṽj(d) is obtained from Equation (4):
where the sum of gradients throughout dataset B with occurrences in lower gradients is standardized using the coefficient (1 − a)/b. Using a Gaussian process to assess surrogate uncertainty, Bayesian optimization, as opposed to random and grid searching, builds a probability model of the objective function. Its distinctive features include its ability to save historical assessments and rapidly determine, in fewer configuration space iterations, the ideal set of hyperparameters.
3.2. Multi-Objective Optimization and Explainable Machine Learning for Green Building Design
The metamodel-determined nonlinear relationship between inputs and outputs remains incompletely accounted for by the LGBM model, notwithstanding its exceptional predictive capability. To generate an explainable machine learning solution, a method known as LIME (Local Interpretable Model-agnostic Explanations), which was introduced in 2017, measures each feature’s contribution to the LGBM-based prediction [101,102]. Managers can have more faith in the forecast findings because of LIME’s ability to provide insights into the operation of the LGBM model. When it comes to providing attribution values that are locally accurate, consistent, and unique based on game theory, LIME outperforms traditional feature significance approaches [103,104]. The LIME value, which may be computed, takes the meaning of a feature value’s marginal contribution over all conceivable feature combinations [105].
where S is the subset of input features that excludes the ith feature, fx (S ∧ (i)) is the model output with the ith feature, and fx(S) = E(f(x)|xS) is the model output without the ith feature (the expected value of the function conditioned on S). However, the computation efficiency of calculating E(f(x)|xS) is low, and the LIME value calculation is exponentially complex. Therefore, a speedier estimate version called tree LIME was created, which is better able to understand how each feature influences the outcome and comprehend tree-based machine learning models like LGBM. Tree LIME reduces the computational complexity from O(TL2M) to O(TLD2) when T is the number of trees, L is the maximum number of leaves a tree may have, and D is the maximum depth of the tree. The integration of LIME into LGBM facilitates the advancement of traditional machine learning models towards more transparency, hence augmenting the model’s usefulness and decision-making trust.
Multi-objective optimization (MOO) can also be defined as the problem of finding the most effective data-driven design strategies for green buildings. Energy consumption, carbon emissions, and interior thermal comfort are three goals connected to green buildings that may be optimally optimized at the same time by applying the MOO process to the established BO-LGBM metamodel. The MOO issue and optimization constraints may be stated mathematically as follows:
where X is a feature vector made up of twelve variables x from a feasible space D, and F(X) stands for the prediction function from the BO-LGBM model. There is not a single optimal answer to a MOO problem. Alternatively, it is possible to acquire the entire set of Pareto-optimal solutions x′ = (x′1…, x′k), which satisfy:
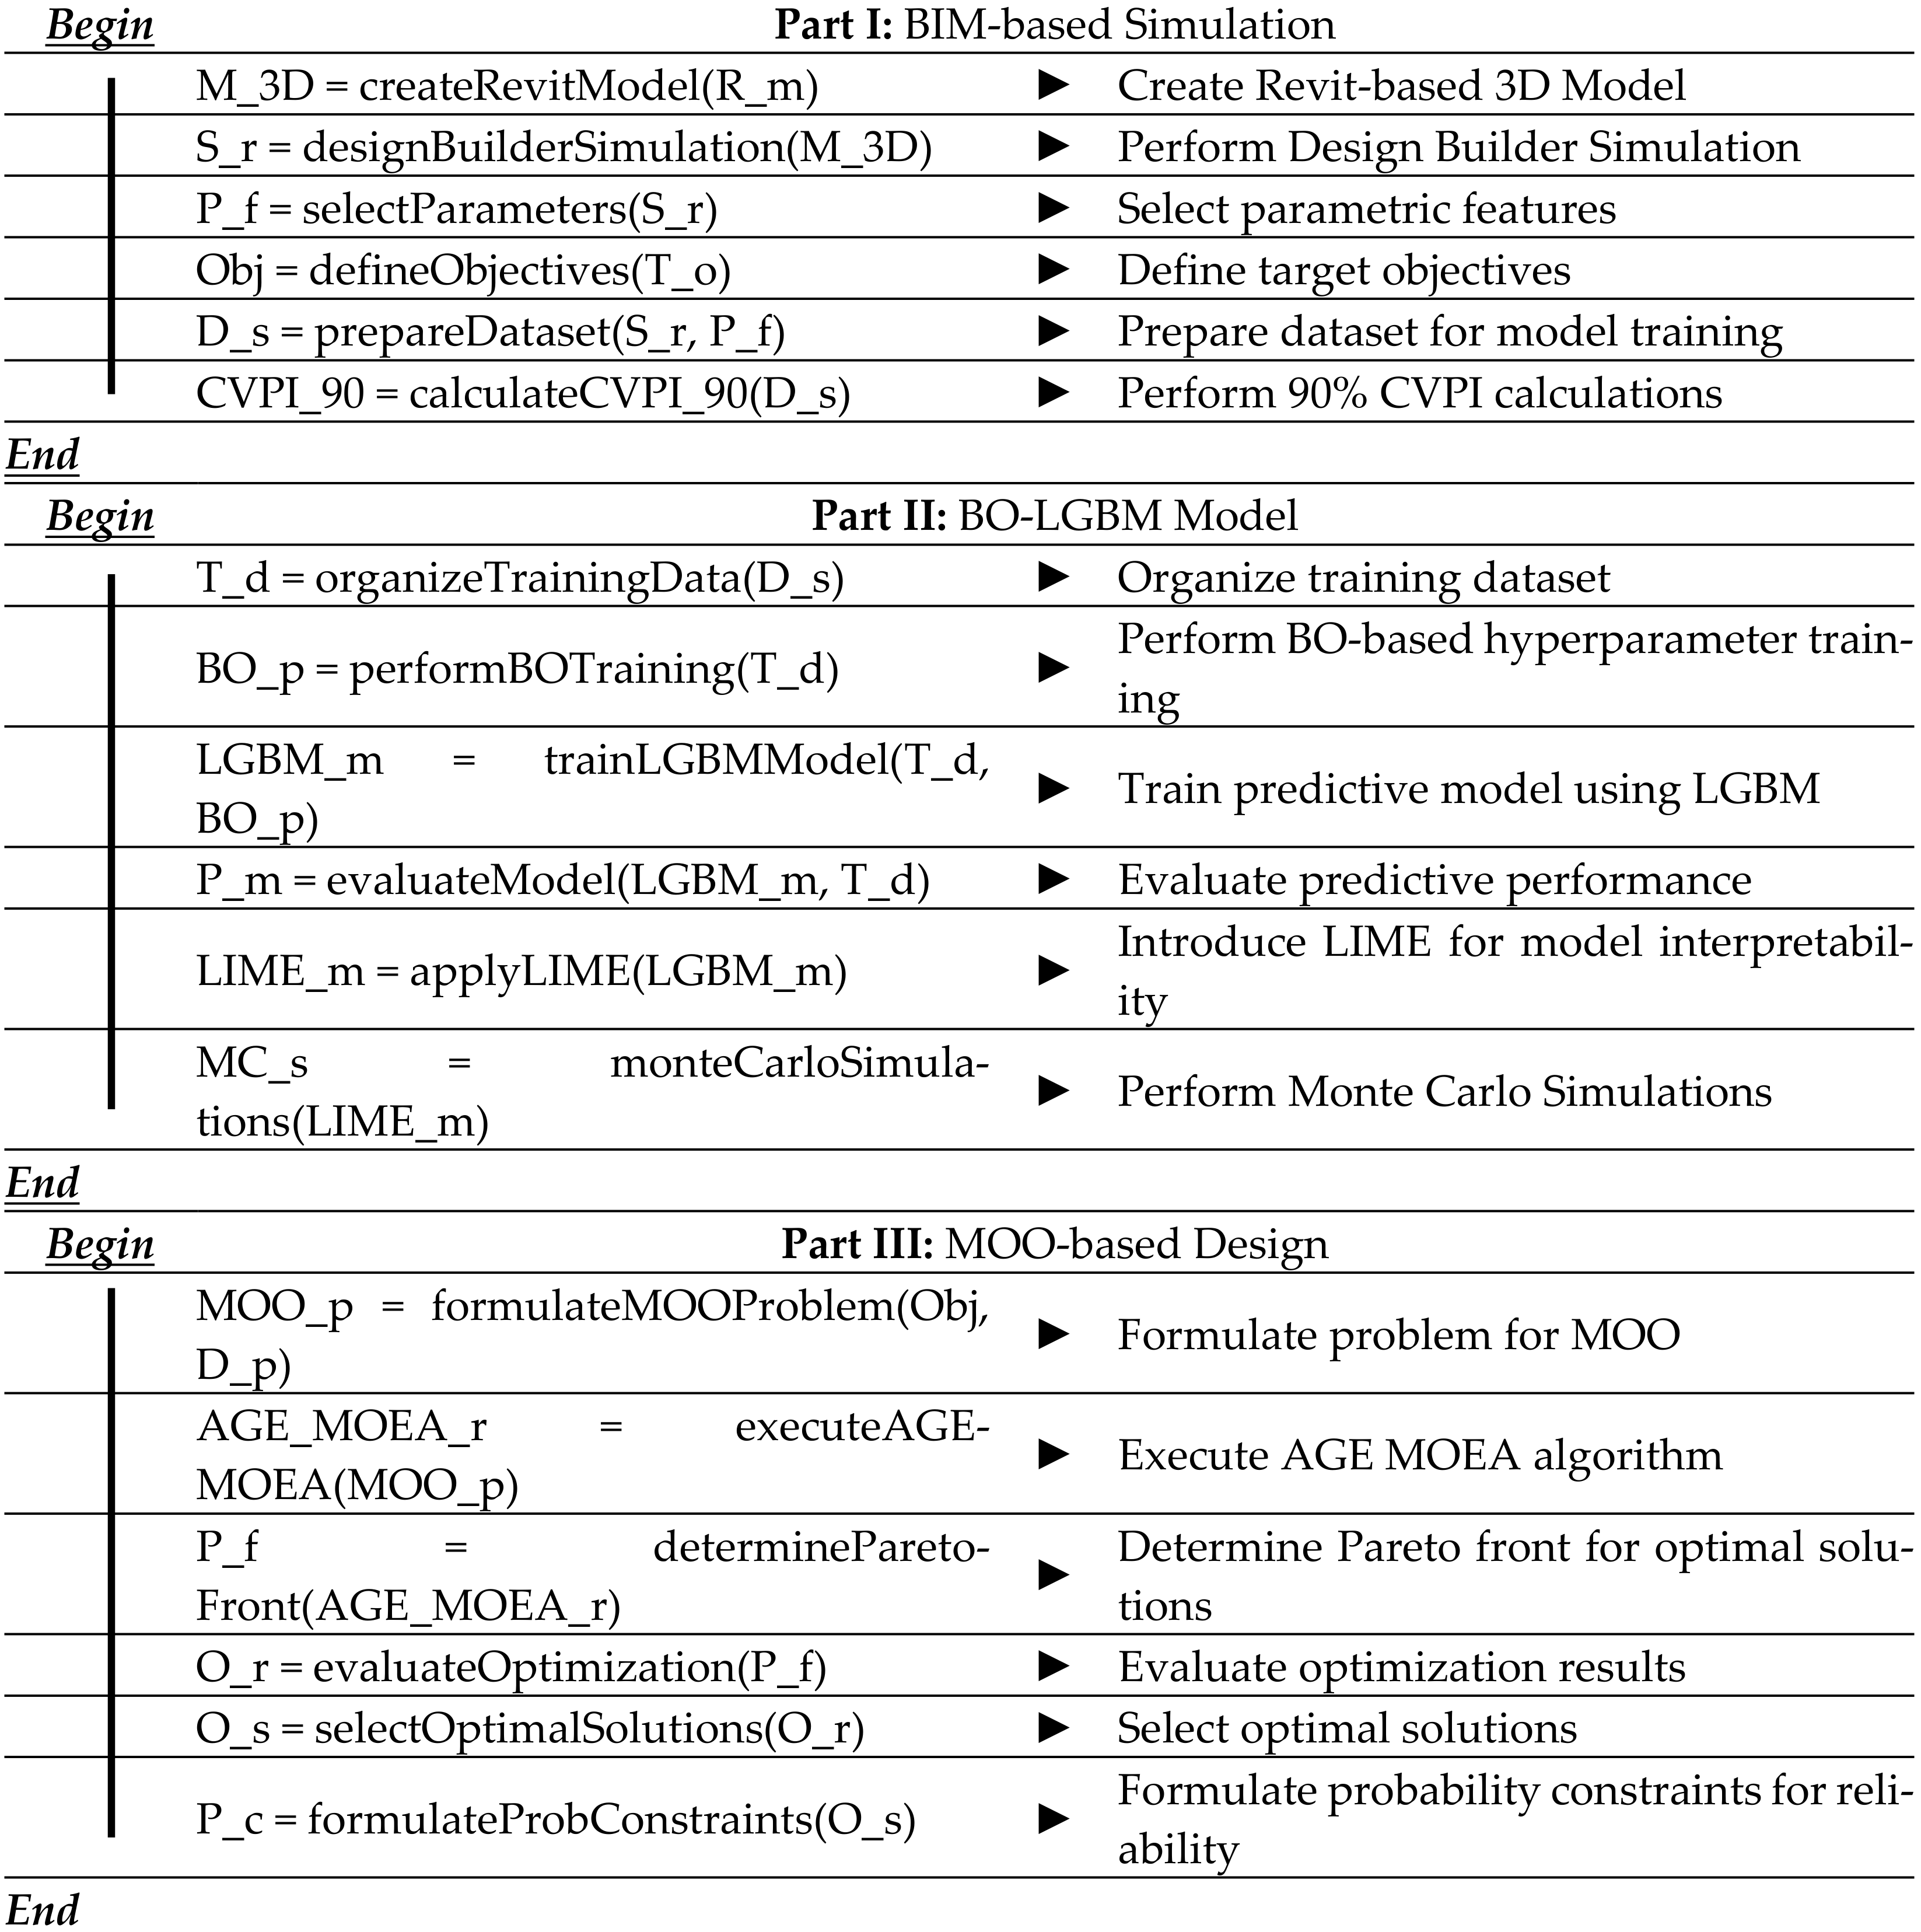
As shown in Figure 2, these Pareto front-based solutions are non-dominated, which means they outperform every other solution x = (x1…, xk) in the remaining search space.
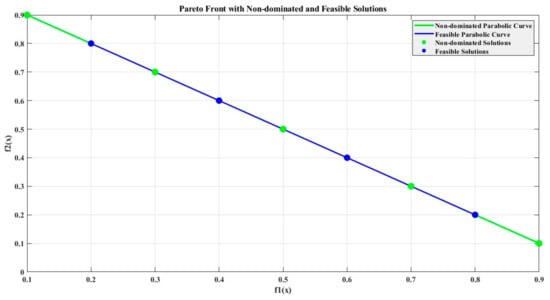
Figure 2.
A Pareto front schematic diagram.
4. Case Study on Practical Implementation
4.1. Building Information Modeling and Simulation Configuration
The proposed technique’s effectiveness is validated through a case study involving a residential building for energy efficiency prediction and optimization in green buildings. First, using Autodesk Revit modeling software (2020) and architectural drawings, a 3D model of the planned building is created, as shown in Figure 3. The primary structural framework comprises reinforced concrete, incorporating elements such as doors, floors, walls, ceilings, columns, and other critical components.
Figure 3.
(a) Three-dimensional (3D) (b) Side view of the specified building’s Revit model.
The office arrangement is the same on every floor and includes familiar places for teaching, toilets, lobbies, corridors, staircases, and more. The measurements of the construction area are 14.1 m in height, 29.0 m in length, and 41.1 m in width, totaling 2381.8 m2. A centralized HVAC system that is powered by electricity can control the temperature inside. Specifically, by combining multidisciplinary data and fundamental building characteristics into a well-structured model, BIM-based simulation highlights its benefits. The efficacy of BIM-based simulation hinges on robust interoperability and tight integration between BIM platforms and simulation tools. These factors are governed by the seamlessness of data exchange and communication across various BIM-based applications. A data-sharing standard called Green Building XML (gbXML) is used to record building geometry and performance measurements in areas such as thermal characteristics. A common format for model import, this widely used schema is used by many sophisticated programs, such as DesignBuilder. The newly produced gbXML file may accurately and rapidly represent any changes made in DesignBuilder and any subsequent simulation results when a building parameter in the Revit model is changed. This eliminates the need to restart the modeling process using the graphical user interface (GUI). This methodology for interacting with data provides prospective knowledge and methodical feedback for data-driven improvement and prediction. It may be used to investigate lighting, natural ventilation, energy, carbon emissions, and other topics. DesignBuilder, a building energy simulation program that combines a powerful simulation engine with a simple user interface, is used to conduct a complete and accurate BIM-based energy simulation on the target building. The 3D Revit model is first converted to the gbXML format and then loaded directly into DesignBuilder for space division and parameter property assignment. As the foundation for the next data-driven study, Figure 4 presents the derived gbXML format setup and simulation model. One other crucial step is to establish several fundamental energy simulation parameters based on the imported model. DesignBuilder has correctly established six building variables pertaining to power, temperature, and occupancy, as shown in Table 2. These factors fulfil the Design Standard for Energy Efficiency of Public Buildings (GB 50189–2015) [106] as well as the actual project needs {Guo, 2022 #766}.
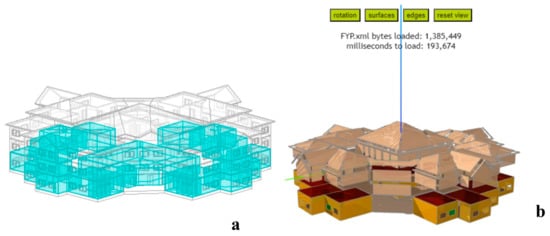
Figure 4.
Procedure for exporting Revit: (a) configure the gbXML format; (b) import the DesignBuilder simulation model.
Table 2.
Enhanced building parameters.
4.2. Preparing Datasets from Building Energy Models
An evaluation index system, such as the one shown in Figure 5, must be meticulously created to evaluate the building’s energy performance. Empirically, a green building’s total energy performance may be summarized in three specific goals related to two primary areas. The goals of energy consumption and CO2 emissions are taken into consideration from an environmental perspective.
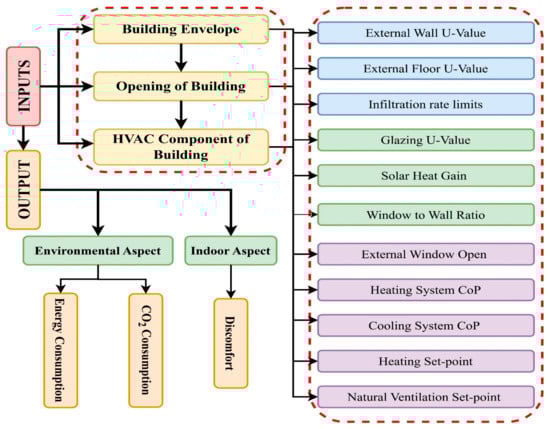
Figure 5.
Building energy performance study using an assessment index methodology. The acronym for the coefficient of performance is CoP.
The goal of the discomfort degree, on the other hand, is to determine the level of interior thermal comfort. This is the quantity of uncomfortable hours that occur when indoor air temperature rises above the summer or winter thermal comfort range constraints. The interior temperature is calculated by DesignBuilder using a 0.5 h time step. Determining the influential factors for green building standards involves considering three types of influential elements, each with several measured subfactors for the best possible design of energy-efficient structures, which have a substantial impact on building energy efficiency. Appropriate modifications of these significant variables are essential for managing the energy usage and thermal comfort of a structure. The building envelope, which separates the interior from the outside and controls the internal temperature and the functioning of the mechanical system, is the first category. Building apertures are included in the second category since they are thought to be weak spots in the structural thermal envelope. It is preferable to enhance interior thermal quality with a well-designed glazing system since doors and windows give off a substantial amount of heat. The major energy users in a building fall under the third group, which is HVAC equipment. Proper HVAC settings can significantly reduce building energy consumption while improving indoor air quality, comfort, and energy efficiency.
4.3. Preprocessing and Data Generation
Several simulations are run in DesignBuilder to explain the energy performance of buildings under several scenarios, relying on the evaluation index system. Interestingly, a total of twelve identified relevant factors are subjected to the orthogonal test, with the goal of generating a variety of factor combinations that would yield representative and diverse data. Table 3 lists the factor setting values for each. It includes details such as the external wall and floor U-values, which determine the rate of heat transfer through the building envelope. The infiltration rate represents the amount of air leakage impacting heating and cooling loads. Glazing properties like U-value and solar heat gain coefficient (SHGC) influence heat gain and loss through windows. Other factors like the window-to-wall ratio, heating and cooling system efficiencies, and temperature set-points for heating, cooling, and natural ventilation are also listed. Each feature has a description, units, range of values, and a baseline value, allowing for the analysis and optimization of building energy consumption.
Table 3.
Expanded orthogonal test settings.
The feature type and its range of values define these values. The orthogonal test of building energy consumption may be used to find 248 potential factor combinations related to building energy performance. Figure 6, which shows each point as a potential factor combination, shows the excellent representativeness of these tests with an equal number of test combinations for each prospective value of the heating system CoP. Using the proposed methodology, it is also possible to identify the 248 sets of simulations that produced the highest building energy efficiency as the benchmark for comparing the optimization impact. The optimal location (0, 0, 0) and the shortest distance (627,511.7) discovered in the simulation results are the origins of the baseline shown in Table 4. It provides insight into the central tendency (mean) and spread (standard deviation) of each variable, as well as the minimum, maximum, and quantile values. For instance, the external wall U-value (x1) has a mean of 0.3 W/m2-K, indicating the average thermal transmittance, with a standard deviation of 0.3, reflecting the variability in the data. The infiltration rate (x3) has a mean of 12.7 m3/hm2, with values ranging from 0 to 24 m3/hm2. The statistics for glazing properties (x4, x5), the window-to-wall ratio (x6), and system efficiencies (x8, x9) provide a comprehensive understanding of the different factors influencing energy consumption. Additionally, it includes information on temperature set-points for heating (x10), cooling (x11), and natural ventilation (x12), allowing for an analysis of their impact on energy usage. The goal of green construction is more likely to be accomplished when the target building is constructed with the feature configuration that the baseline offers. The optimization challenge therefore looks for the best design approach to reduce the distance even more, to less than 627,511.7. The building energy dataset produced by the BIM-based simulation ultimately has 248 valid lines, 3 output variables, and 12 input variables thanks to the assistance of the orthogonal test and assessment index system. This provides a strong database for the technical application of building green.
Figure 6.
Orthogonal test combination settings diagram.
Table 4.
Improved statistical overview of important elements for building energy efficiency.
A significant amount of simulated information is examined to ensure dataset integrity for a forecasting job. Table 5 contains a statistical overview of the generated dataset. The search spaces and ideal values are given for different hyperparameters in a machine learning model that forecasts discomfort levels, energy utilization, and CO2 emissions. The num_leaves hyperparameter controls the maximum number of leaves in the decision trees, with an optimal value of 45 for energy prediction, 100 for CO2 prediction, and 65 for discomfort prediction. The max_depth hyperparameter sets the maximum depth of the trees, with optimal values of 8, 11, and 5 for energy, CO2, and discomfort, respectively. The minimal total of instance weights needed in a child node is determined by the min_child_weight hyperparameter, whose ideal values vary across the various target variables from 5 to 101. Moreover, a correlation matrix produced by calculating the Pearson correlation coefficients between input pairs is shown in Figure 7. This indicates that no dataset contains highly related data with absolute Pearson values lower than 0.5. The correlation matrix heatmap reveals intricate relationships among the variables, with shades of red indicating positive correlations, blues representing negative correlations, and lighter colors suggesting little to no correlation. This visual representation highlights potential multicollinearity issues and variable dependencies, serving as a valuable tool for initial data exploration and identifying influential factors within the dataset.
Table 5.
Enhancing the LGBM algorithm’s hyperparameters through Bayesian optimization.
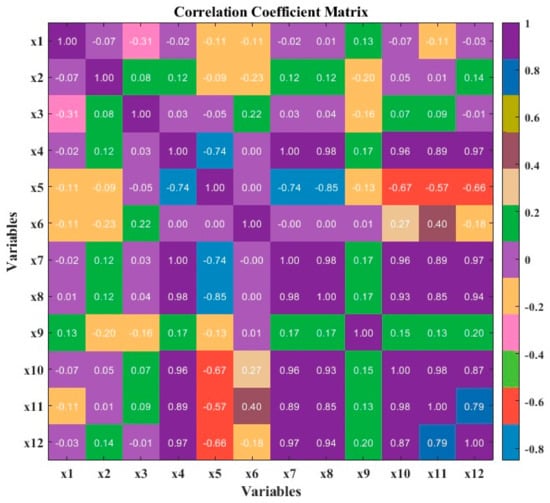
Figure 7.
Matrix of correlation coefficients for the selected influential elements.
4.4. Metamodeling for Building Energy Performance Prediction
Based on a thorough understanding of the dataset created by the BIM-based simulation, BO-LGBM is a metamodel that simulates the nonlinear connections between major components and energy performance objectives. The three goal targets, which reflect building energy performance, are predicted by three distinct BO-LGBM prediction models.
4.4.1. Data Splitting and Preprocessing
The complete dataset is first separated into training and testing sets in a 3:1 ratio. For fitting the model, 164 random subsets of data are chosen as the training set, and 96 observations are allocated to the test set. Data shuffling can also help to reduce overfitting and increase the model’s capacity to generalize.
4.4.2. Hyperparameter Optimization
The process of optimizing hyperparameters to improve the prediction performance of the LGBM model, which is greatly impacted by its hyperparameter settings, is automated by the Bayesian optimization (BO) technique. In this the leaf-wise tree growth method, which is renowned for its fast convergence speed, the primary hyperparameters considered are the total number of leaves required to control the complexity of the model, the greatest tree depth that impacts the ideal leaf count, and the smallest number of information points in a leaf that will avoid overfitting in leaf-wise trees. Table 6 displays the configuration space for LGBM hyperparameters, with a maximum of fifteen iterations allowed. The ability to forecast energy consumption, CO2 emissions, and discomfort levels is evaluated using the Bayesian optimization with LightGBM (BO-LGBM) model. The model performs exceptionally well on the training set for energy consumption prediction, with an R-squared value of 0.9999 and an extremely low mean absolute percentage error (MAPE) of 0.0001%. The test set performance is still very good, with an R-squared of 0.9975 and a MAPE of 0.33%. Similar high accuracy is observed for CO2 emissions and discomfort degree predictions on both training and test sets. Bayesian optimization is an effective method for determining the appropriate values of these three hyperparameters inside this preset search space. The ideal hyperparameter settings via Bayesian optimization are shown in Table 7, which may improve the LGBM model’s prediction accuracy. The enhanced parameter settings are used for the AGE-MOEA algorithm, a multi-objective evolutionary algorithm used for optimization. The population size is set to 20, and the algorithm runs for 100 generations. The crossover operation employs the Simulated Binary Crossover (SBX) with an eta value of 15 and a probability of 0.9. Mutation is performed using the Polynomial Mutation (PM) with an eta value of 20. The number of offspring per generation is dynamically determined, and a seed value of 1 is used for reproducibility purposes.
Table 6.
Reevaluation of BO-LGBM-centered forecasting in training and testing data.
Table 7.
Optimized algorithm parameter setups for the AGE-MOEA process.
4.4.3. Performance Evaluation
These potential metamodels allow for the following analysis of the building energy efficiency forecast results:
Prediction Performance Evaluation
The building energy performance forecasts made by the three BO-LGBM models are very accurate. The predicted values and the simulated values from the training and test sets are plotted in Figure 8, which shows a good agreement with the results from the BIM-based energy simulation. A strong performance is shown by the comprehensive metric analysis on several measures. The training and testing datasets for energy consumption show remarkably high R2 values, which indicate good predictive power and correlation, together with low MAPE values that imply little error. The energy consumption standard deviation and variance figures are likewise quite low, indicating consistency and reliability in the projections. In a similar vein, CO2 emissions show excellent R2 values, despite a minor decline in testing dataset prediction accuracy. High R2 values for the discomfort degree parameter indicate great predictive power; nevertheless, a discernible difference between the training and testing datasets raises the possibility of overfitting. Even though MAPE values for energy consumption are lower than those for CO2 emissions and discomfort level, they are still within acceptable bounds. For CO2 emissions and the discomfort degree, the forecast variability is somewhat larger, but generally, the model performs reliably across all assessed parameters.

Figure 8.
Error in prediction for training and test sets.
The three targets (y1–y3) have MAPE values of 0.33%, 1.14%, and 2.13%, respectively. The prediction assessment metrics (R2 and MAPE) for the training and test sets are also included in Table 8. The improved multi-objective optimization (MOO) overcomes the problem of being unable to input feature constraints. It defines the permissible value ranges for each variable, ensuring that the optimization algorithm explores solutions within these specified bounds. For instance, the external wall U-value (x1) can range from 0.12 to 1.05 W/m2-K, while the external floor U-value (x2) is constrained between 0.21 and 0.80 W/m2-K. Similarly, limits are imposed on the infiltration rate (x3), glazing properties (x4, x5), window-to-wall ratio (x6), and external window open rate (x7). The constraints also encompass the ranges for heating and cooling system efficiencies (x8, x9), as well as temperature set-points for heating (x10), cooling (x11), and natural ventilation (x12). These input feature constraints ensure the optimization problem explores realistic and feasible solutions within practical bounds. The BO-LGBM models provide R2 values more than 0.934 and MAPE values less than 2.13%, demonstrating how well autonomous hyperparameter adjustment under Bayesian optimization contributes to the three metamodels’ high fitting degree. The metamodel performs best at forecasting energy consumption (y1) out of the three objectives; its MAPE is 1.80% less than that of assessing the discomfort level (y3) and CO2 emissions (y2).
Table 8.
Updated input feature constraint setting for the MOO issue.
4.4.4. Comparative Analysis
When compared to XGBoost (XGB), another well-liked GBDT method for building energy performance forecasts, the BO-LGBM shows superior accuracy. An experiment is conducted to evaluate the performance of the XGB and LGBM algorithms using the Bayesian optimization technique. In Figure 9, a scatter plot is used to evaluate and analyze the prediction accuracy of the two potential methods on the set of test data. The findings show that when compared to the BO-XGB approach, the BO-LGBM-based prediction yields a higher R2 value and a smaller mean absolute percentage error (MAPE). When contrasted against simulated data, an analysis of the three factors (energy consumption, CO2 emissions, and discomfort level) yields informative findings about the performances of the BO-LGBM and BO-XGB models. The scatter plot of energy consumption indicates that there is close agreement between the two models for this specific measure, as indicated by the tight clustering of points around the diagonal line. The discomfort level and CO2 emissions show a similar trend, indicating consistent performance across all criteria. Plots show little deviation from the diagonal line, suggesting that both models produced accurate predictions. In general, the comparison shows that BO-XGB and BO-LGBM perform comparably across the parameters that are assessed, demonstrating their efficacy in modeling and forecasting discomfort levels and energy-related measures. The models’ dependability and resilience in simulating and evaluating intricate datasets are highlighted by their consistent performance.
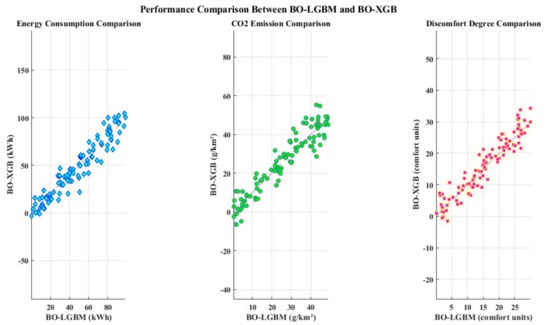
Figure 9.
A scatterplot comparing the performance of BO-LGBM with BO-XGB.
The BO-LGBM model outperforms the BO-XGB model in terms of R2 (4.27%, 1.46%, and 7.26%), as well as MAPE (351.52%, 33.33%, and 232.86%). BO-LGBM is going to serve as the metamodel for the next MOO challenge in green building design because of its exceptional predictive power. The full MAPE distribution across data intervals of the simulation data is given in Figure 10, which shows how the BO-LGBM model continuously outperforms the BO-XBG model in terms of prediction performance throughout all data intervals. Three metrics are compared between actual and expected values: energy, CO2 emissions, and discomfort. The results are displayed as a grouped bar plot with error bars overlaying it to show two possibilities. The lower mean values in Scenario 1 indicate that the expected values for energy, CO2, and discomfort are somewhat lower than in Scenario 2. Error bars show the variation in expected values for each scenario; Scenario 2 shows a significantly broader dispersion. Both scenarios nearly match the actual mean values despite these deviations, demonstrating the efficacy of the prediction models. The performance of each scenario across several metrics is clearly shown by the grouped bar plot, allowing for comparisons and insights into the models’ predictability and accuracy.
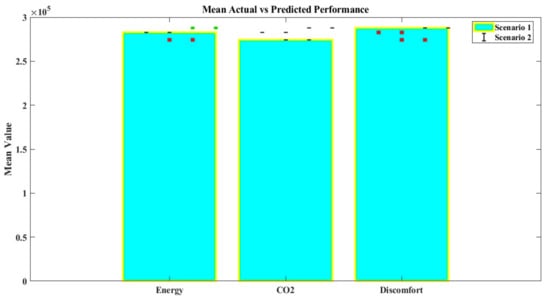
Figure 10.
Analyzing the prediction performance of BO-LGBM using data intervals. The symbols in the figure, such as red squares or green squares, represent different scenarios in the grouped bar plot with error bars. Red Squares: These may represent the predicted values for Scenario 1. The red color differentiates Scenario 1’s predicted values from the actual values. Green Squares: These may represent the predicted values for Scenario 2. The green color is used to distinguish Scenario 2’s predicted values from the others.
4.4.5. Feature Importance Analysis
The HVAC category characteristics are more significant in the building energy performance prediction, according to the explainable machine learning technique. Specifically, the well-known BO-LGBM model is explained naturally using the LIME technique, which enhances machine learning interpretation and transparency while imposing crucial decisions on green building design. The heatmap that was developed to demonstrate the values of LIME for a small dataset comprises six features and three metrics, as shown in Figure 11. Each cell in the heatmap represents the matched LIME value for a certain feature–metric combination. The color intensity of the heatmap shows how much and in which direction each feature affects the relevant metric’s forecast. Metrics are shown along the y-axis, labeled as Metric 1 to Metric 3, while features are shown along the x-axis, designated as Feature 1 to Feature 6. Warmer colors indicate stronger positive impacts and cooler colors indicate higher negative impacts in the heatmap’s color gradient, which is specified by the ‘parula’ colormap. This visual interpretation of the LIME values is provided. Model interpretation and feature analysis are made easier by this representation, which helps to grasp the relative value and contribution of each feature to the prediction of various metrics. The red dots indicate greater values of the heating set-point temperature (x10), which are strongly positively correlated with the model’s prediction skills. On the other hand, the model’s ability to forecast is negatively impacted by lower values of this feature, which are represented by the blue dots. Raise the heating set-point temperature, and the effect is essentially more energy use and CO2 emissions. Conversely, there appears to be an overall negative trend in the association between the cooling set-point temperature (x11) and the goal variable y3 (pain degree), indicating that lower degrees of discomfort are associated with higher cooling set-point temperatures.
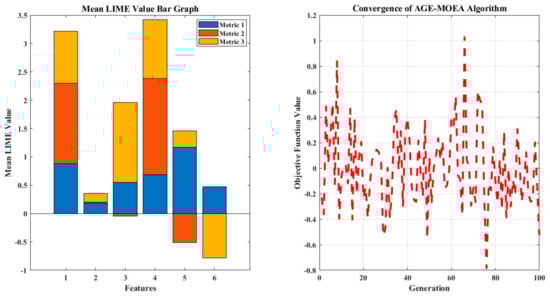
Figure 11.
Mean LIME value and LIME plot of feature importance.
Using sample convergence data, the graphic illustrates the convergence behavior of an AGE-MOEA (Adaptive Genetic Algorithm-based Multi-Objective Evolutionary Algorithm) [107]. The generation number is shown by the x-axis, while the goal function value is represented by the y-axis. The mean objective function value across 100 generations and 10 separate runs is shown by the dark green line in Figure 12. Plotting the method’s convergence across several generations shows how well the algorithm optimizes the objective function. One may evaluate the algorithm’s stability and rate of convergence, which are crucial elements in determining how well it works, by looking at the curve’s trend. By helping to comprehend the efficacy and efficiency of the optimization process, the visualization directs future iterations and adjustments to the evolutionary algorithm. The two most influential characteristics, with a much bigger mean LIME value than other components, are the heating (x10) and cooling (x11) set-point temperatures. These findings imply that, to maximize building energy performance and meet sustainability objectives, these two HVAC system components must be given top priority [108,109].
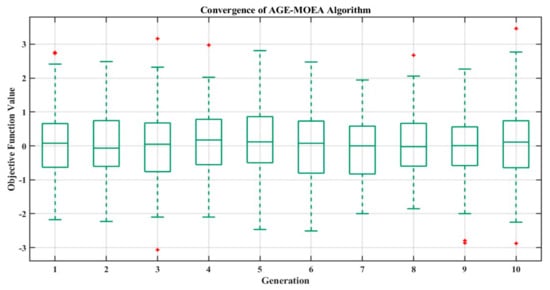
Figure 12.
Convergence of the AGE-MOEA algorithm. The red plus signs in the box plot represent outliers in the data. In a box plot: The central line in each box represents the median of the data. The top and bottom edges of the box represent the 25th (Q1) and 75th (Q3) percentiles, respectively. The whiskers extend to the smallest and largest values within 1.5 times the interquartile range (IQR) from the lower and upper quartiles. Data points that fall outside this range are considered outliers and are marked with red plus signs.
4.5. Optimizing Building Energy Performance through Multi-Objective Evolutionary Algorithms
The three well-established BO-LGBM metamodels were immediately subjected to the AGE-MOEA approach to solve the multi-objective optimization (MOO) problem and identify the optimal designs for green buildings. As part of the optimization procedure, the value ranges for the twelve pertinent components (Table 9) and the AGE-MOEA algorithm parameters (Table 10) were established. Many MOO algorithms are efficient in decreasing a total distance measure while maximizing energy consumption, greenhouse gas emissions, and comfort levels. The baseline scenario serves as a reference point. The NSGA-II and NSGA-III algorithms achieve improvements of 8.59% and 9.26%, respectively, over the baseline. The MOEA/D and C-TAEA algorithms further enhance the optimization rate to 11.79% and 12.53%. However, the AGE-MOEA algorithm emerges as the top performer, delivering a 13.43% optimization rate with the lowest aggregate distance of 543,245.7, indicating the most favorable trade-off among the conflicting objectives. The AGE-MOEA algorithm’s best solution’s feature values produce the lowest aggregate distance of 543,245.7. The solution suggests an external wall U-value of 0.21 W/m2-K, an external floor U-value of 0.56 W/m2-K, and an infiltration rate of 13 m3/hm2. The solar heat gain coefficient is 0.34 and the U-value is 5.96 W/m2-K for the glazing. The window-to-wall ratio is set at 12%, with an external window open rate of 30%. The heating and cooling system efficiencies are 3.7 and 4.8, respectively, while the temperature set-points are 16.3 °C for heating, 27.4 °C for cooling, and 25.5 °C for natural ventilation. AGE-MOEA iteratively looked for locations that could be close to the perfect solution inside the search space. Figure 13 depicts the convergence behavior of the three metamodels, indicating the optimization process achieved a convergence point after roughly 20 generations. The Pareto front is generated in an ambiguous circumstance of AGE-MOEA (Multi-Objective Evolutionary Algorithm-based Adaptive Genetic Algorithm) optimization. Plots of fifty randomly generated solutions, each with two goal values, are presented. The trade-off connection between the two objectives is shown in a scatter plot, where the answers are indicated by light blue markers. The Pareto front may be used to identify non-dominated solutions that provide the best possible trade-offs between conflicting goals. Some solutions also have labels attached to them to show where they fall on the Pareto front. In multi-objective optimization issues, this visualization helps to discover the most promising solutions that offer the best compromise between competing objectives, enabling well-informed decision-making. The three metamodels are subjected to four additional well-known MOO algorithms (NSGA-II, NSGA-III, MOEA/D, and C-TAEA) to compare their optimization performance [110,111].
Table 9.
Detailed description of candidate MOO algorithm optimization results.
Table 10.
Characteristic values of the optimal solution ascertained by the AGE-MOEA method.
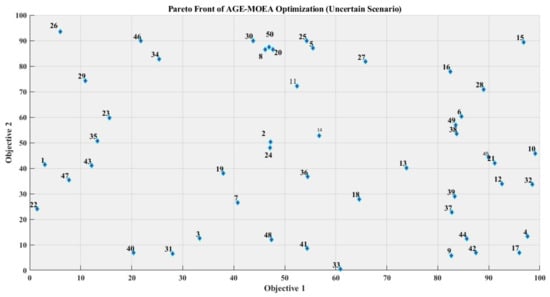
Figure 13.
Uncertain scenario: Pareto front of AGE-MOEA optimization.
(1) These five MOO algorithms produce Pareto front solution sets, as shown in Figure 14, which indicate optimum solutions that concurrently decreased energy use, CO2 emissions, and pain levels. Similarity in the relative placements and sizes of the optimum front solution sets suggests that the evolutionary algorithms share a computational logic. The association between the objectives is graphically represented by the Pareto fronts: the degree of discomfort has a negative correlation with the other two objectives, but energy usage rises with CO2 emissions. Due to its closeness to the ideal location (0,0,0), the optimal solution (highlighted in red) has an optimization rate of 13.43%. Table 11 offers data-driven techniques for managing the development of green buildings and optimizing sustainability potential by presenting the matching ideal profile of significant components. The sensitivity analysis assesses how different architectural factors affect CO2 emissions and energy use. Energy consumption and CO2 emissions are significantly influenced by parameters such as the exterior wall U-value (x1), infiltration rate (x3), glazing U-value (x4), window-to-wall ratio (x6), and system efficiencies (x8, x9). Additional variables with a considerable influence are temperature set-points (x10, x11), the solar heat gain coefficient (x5), and the exterior floor U-value (x2). The exterior window open rate (x7) and natural ventilation set-point (x12) are two examples of parameters that affect thermal comfort yet have a negligible effect on energy usage and emissions.
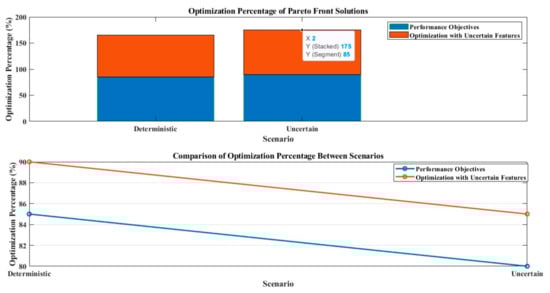
Figure 14.
Optimization percentages of Pareto front solutions and comparison of optimization percentages between scenarios.
Table 11.
Sensitivity analysis for building parameters.
(2) The AGE-MOEA algorithm yields greater gains in building energy efficiency and realizes minimal energy usage, CO2 releases, and more comfortable indoor conditions than the other four candidate algorithms [112]. It also proves to be more appropriate for the existing metamodels. Every one of the five methods attains an optimization rate higher than 8.59%. In descending order, the algorithms can be ranked as follows: NSGA-III > NSGA-II > AGE-MOEA > C-TAEA > MOEA/D [113]. However, due to trade-offs, the optimal performance in all three target dimensions is not guaranteed by a higher optimization rate. A cost–benefit analysis for various upgrades to building systems is carried out, considering initial costs, annual savings, payback periods, and CO2 reductions [114]. Insulation upgrades require an initial investment of USD 20,000 but yield USD 3000 in annual savings, with a payback period of 6.67 years and a potential CO2 reduction of 15,000 kg/year. High-efficiency HVAC systems cost USD 30,000 upfront but offer USD 4500 in annual savings, a 6.67-year payback, and a 20,000 kg/year CO2 reduction. Window replacements have a USD 15,000 initial cost, USD 2000 annual savings, a 7.5-year payback, and a 10,000 kg/year CO2 reduction. Finally, solar panels require a USD 25,000 investment but provide USD 5000 in annual savings, a 5-year payback, and a 25,000 kg/year CO2 reduction, as shown in Table 12.
Table 12.
Cost–benefit analysis of upgrades to building systems.
(3) The optimization performance is significantly impacted by the two most notable attributes discovered by the LIME XML method: the cooling set-point temperature (x11) and the heating set-point temperature (x10). The optimization rate when a single feature is changed alone is shown in Figure 14, showing that the relevance of each feature in the metamodel correlates with its contribution to the optimization improvement. While changing less significant elements like glazing-SHGC (x5) and exterior window openings (x7) has a limited optimization effect, changing the top factors is essential for moving the solution closer to the optimal point.
(4) The investigations depicted in Figure 15 involve the amalgamation of the two most prominent attributes with additional noteworthy attributes. Just modifying x10 and x11 for the AGE-MOEA algorithm might produce around 57% of the intended optimization result. Simultaneously adjusting x11 - x10 - x10 or x8 - x1 - x11 can yield an optimization rate of more than 9%, demonstrating how easy it is to meet energy optimization goals. After modifying the top six features (i.e., half of the total) simultaneously, the optimization rate is close to 11.43%, the optimal performance determined by all twelve features. These adaptable tactics with minor feature modifications might increase the application value of the suggested strategy by ensuring that green building design goals are met even in the face of time and resource restrictions.
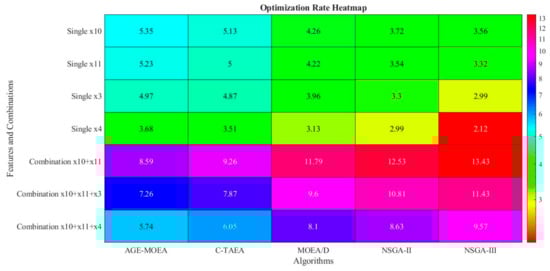
Figure 15.
Optimization rate heatmap.
A comparative analysis of feature selection techniques for optimizing algorithm performance produces insightful results, as shown in Figure 16. Principal component analysis (PCA) exhibits deviations between predicted and actual optimization rates, suggesting potential limitations in accurate prediction. Recursive feature elimination (RFE), on the other hand, demonstrates a closer alignment between predicted and actual rates, indicating its effectiveness in identifying relevant features for optimization. Random forest regression (RFR), used as a baseline, assumes predicted rates as the means of actual rates, providing a reference point. The error bars quantify the variability and uncertainty associated with each technique’s predictions, highlighting the importance of considering prediction robustness. Additionally, the investigation addresses missing data by assuming predicted rates, showcasing the adaptability of the employed methods. These findings underscore the significance of employing sophisticated feature selection strategies and the potential advantages of techniques like RFE in enhancing algorithmic outcomes.

Figure 16.
Validation and comparison of feature selection techniques.
5. Discussion
Improving the dependability of optimization in data-driven building energy performance forecast and optimization requires addressing both data and metamodel uncertainty. Discrepancies in prediction findings, as measured by confidence intervals (CIs) and prediction intervals (PIs), are referred to as metamodel uncertainty. The confidence level of the BO-LGBM model is indicated by the PI in Figure 16, which is evaluated at a significance level of 5%. The wider breadth of the PI indicates a higher coverage probability. The unpredictability and error distributions present in simulated data, however, are the sources of data uncertainty. Probability descriptions of characteristics under specified restrictions are produced using Monte-Carlo simulation. Four characteristics (x8, x9, x7, and x3) greatly susceptible to operational uncertainties are the focus of the uncertainty analysis, which is predicated on their normal distribution. In Section 4, utilizing a metamodel that considers these uncertainties, the multi-objective optimization (MOO) work under uncertainty was compared to the deterministic situation, with the following outcomes:
- As uncertainty increased, the BO-LGBM metamodel’s prediction accuracy steadily decreased. We found reduced MAPE values for each of the three targets (y1–y3) in the uncertain situation. Notably, the discomfort degree (y3) displayed a significant 2.6-fold increase in comparison to the deterministic scenario.
- Decisions made by the optimization model were more dependable when the two sources of uncertainty were considered, and outcomes were obtained within predetermined bounds. The top three preferred options (red circles) had better optimization performances than the other choices. The optimization rate rose from 12.79% to 17% in comparison to the deterministic scenario, indicating how crucial it is to take uncertainties into account to optimize sustainability potential. The third target’s indoor thermal discomfort level decreased to less than 36% in the uncertain scenario compared to the deterministic one.
- In Figure 17, which shows how taking uncertainty into account may improve optimization performance, the optimization rates of new Pareto front points within the permitted limit are contrasted with the original deterministic values. The median optimization rate significantly increased from 10.85% (deterministic) to 12.70% (uncertain) when all twelve input variables were changeable. The two areas with the biggest improvements were energy consumption (y1) and pain level (y3), where the mean and median values significantly outperformed the deterministic scenario. The values of the CO2 emission optimization rate were more steadily distributed around the median, even if the optimization rate’s median was constant. Even with only four unknown variables altered, all methods improved the mean and median optimization rates in comparison to the deterministic situation as shown in Figure 18. This highlights the need to take uncertainty sources into consideration to develop more effective green building design schemes.
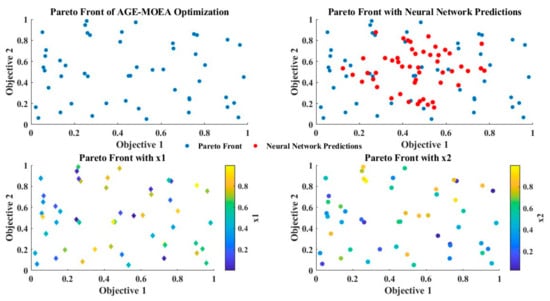 Figure 17. Visualization of Pareto front in AGE-MOEA optimization under uncertainty with neural network predictions.
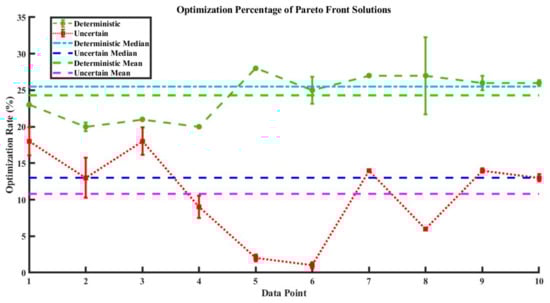 Figure 18. The percentage of Pareto front solutions that are optimal in settings with both determinism and uncertainty. Performance objectives (a), each confusing feature’s optimization (b), and their combination.
6. Conclusions and Future Works
This study provides an automated approach to building energy efficiency analysis that combines multi-objective optimization and explainable machine learning with artificial intelligence and BIM technologies. The innovative data-driven approach has both theoretical and practical significance, aiming to enhance decision-making for sustainable green building design. The analytical results demonstrate the versatility and robustness of the proposed framework through various approaches. The systematic framework comprises three fundamental components:
- Data Simulation and Mining: Building energy performance data are simulated using DesignBuilder and serve as the inputs for data mining operations. This step ensures a comprehensive dataset that captures the complexities of building energy dynamics.
- Predictive Metamodeling: The hybrid Bayesian optimization–LightGBM (BO-LGBM) technique constructs a predictive metamodel with high prediction accuracy, automating hyperparameter tuning. The Local Interpretable Model-agnostic Explanations (LIME) approach enhances the interpretability of the metamodel, allowing stakeholders to understand and trust the model’s predictions.
- Multi-Objective Optimization: The metamodel undergoes optimization using the Adaptive Generalized Evolutionary Multi-Objective Optimization Algorithm (AGE-MOEA), which accounts for uncertainties and identifies optimal solutions across multiple objectives. This step ensures the practical applicability of the framework by providing optimal feature profiles for green building design.
The findings comprehensively address the questions raised in the introduction by demonstrating how advanced computational methods can improve green building design. Key insights from the case study include the following:
- I.
- Prediction Accuracy: The hybrid BO-LGBM method achieved a highly accurate metamodel with mean absolute percentage errors (MAPEs) of 0.33%, 1.14%, and 2.13% for energy consumption, CO2 emissions, and discomfort levels, respectively.
- II.
- Feature Importance: LIME identified heating and cooling set-point temperatures as the most critical features, guiding subsequent feature adjustments.
- III.
- Optimization Performance: AGE-MOEA outperformed four widely used optimization techniques, increasing the optimization rate by 13.43% and providing the best feature settings and trade-off solutions. Adjusting the most crucial features improved performance by 5.35%, aligning with LIME’s feature priority ranking.
- IV.
- Incorporating Uncertainties: The optimization process integrated model and data uncertainties through prediction intervals and Monte Carlo simulations, respectively. This novel step resulted in optimal solutions, with the top three scenarios outperforming the deterministic scenario in terms of optimization rate and rebuilding the Pareto front to meet objective function probability constraints.
The proposed framework offers a reliable and objective tool for optimizing green building design, supporting the development of energy-efficient and environmentally friendly buildings. By replacing dependence on specialized knowledge and engineering experience, this data-driven approach generates strategic implications for sustainable building development early in the construction process. Future research should focus on the following:
- Comparing predicted and observed reductions in energy consumption, CO2 emissions, and discomfort levels, as well as validating the real-world importance by applying ideal feature combinations to actual buildings.
- Examining the applicability of the approach to both commercial and residential buildings.
- Incorporating generative design capabilities using parametric programming tools like Grasshopper and Dynamo to help develop an automated design system. This system should aim to reduce subjectivity and manual intervention in green building design by combining intelligent algorithms, parametric modeling, intelligent BIM 3D models, and user-friendly interfaces.
Author Contributions
Methodology, S.K.U.R. and M.S.; Validation, S.K.U.R.; Formal analysis, T.S.; Data curation, T.S.; Writing—original draft, A.M.K.; Writing—review & editing, M.A.T.; Visualization, M.S.; Supervision, M.A.T.; Project administration, F.K.A.; Funding acquisition, F.K.A. All authors have read and agreed to the published version of the manuscript.
Funding
This research was funded by the Researchers Supporting Project number (RSP2024R264), King Saud University, Riyadh, Saudi Arabia.
Data Availability Statement
The original contributions presented in the study are included in the article, further inquiries can be directed to the corresponding author.
Acknowledgments
The authors extend their appreciation to the Researchers Supporting Project number (RSP2024R264), King Saud University, Riyadh, Saudi Arabia for funding this work.
Conflicts of Interest
The authors declare that there are no conflicts of interest regarding the publication of this paper.
References
- Li, R.; Satchwell, A.J.; Finn, D.; Christensen, T.H.; Kummert, M.; Le Dréau, J.; Lopes, R.A.; Madsen, H.; Salom, J.; Henze, G. Ten questions concerning energy flexibility in buildings. Build. Environ. 2022, 223, 109461. [Google Scholar] [CrossRef]
- González-Torres, M.; Pérez-Lombard, L.; Coronel, J.F.; Maestre, I.R.; Yan, D. A review on buildings energy information: Trends, end-uses, fuels and drivers. Energy Rep. 2022, 8, 626–637. [Google Scholar] [CrossRef]
- Wang, X.; Qu, L.; Wang, Y.; Xie, H. Dynamic scenario predictions of peak carbon emissions in China’s construction industry. Sustainability 2023, 15, 5922. [Google Scholar] [CrossRef]
- Zhu, J.; Lin, N.; Zhu, H.; Liu, X. Role of sharing economy in energy transition and sustainable economic development in China. J. Innov. Knowl. 2023, 8, 100314. [Google Scholar] [CrossRef]
- Zhong, X.; Hu, M.; Deetman, S.; Steubing, B.; Lin, H.X.; Hernandez, G.A.; Harpprecht, C.; Zhang, C.; Tukker, A.; Behrens, P. Global greenhouse gas emissions from residential and commercial building materials and mitigation strategies to 2060. Nat. Commun. 2021, 12, 6126. [Google Scholar] [CrossRef] [PubMed]
- Thapa, S.; Rijal, H.B.; Pasut, W.; Singh, R.; Indraganti, M.; Bansal, A.K.; Panda, G.K. Simulation of thermal comfort and energy demand in buildings of sub-Himalayan eastern India-Impact of climate change at mid (2050) and distant (2080) future. J. Build. Eng. 2023, 68, 106068. [Google Scholar] [CrossRef]
- Noh, Y.; Jafarinejad, S.; Anand, P. A Review on Harnessing Renewable Energy Synergies for Achieving Urban Net-Zero Energy Buildings: Technologies, Performance Evaluation, Policies, Challenges, and Future Direction. Sustainability 2024, 16, 3444. [Google Scholar] [CrossRef]
- Tran, Q.; Nazir, S.; Nguyen, T.-H.; Ho, N.-K.; Dinh, T.-H.; Nguyen, V.-P.; Nguyen, M.-H.; Phan, Q.-K.; Kieu, T.-S. Empirical examination of factors influencing the adoption of green building technologies: The perspective of construction developers in developing economies. Sustainability 2020, 12, 8067. [Google Scholar] [CrossRef]
- Waqar, A.; Khan, A.M.; Othman, I. Blockchain empowerment in construction supply chains: Enhancing efficiency and sustainability for an infrastructure development. J. Infrastruct. Intell. Resil. 2024, 3, 100065. [Google Scholar] [CrossRef]
- Jayalath, A.; Vaz-Serra, P.; Hui, F.K.P.; Aye, L. Thermally comfortable energy efficient affordable houses: A review. Build. Environ. 2024, 256, 111495. [Google Scholar] [CrossRef]
- Waqar, A.; Othman, I.; Shafiq, N.; Khan, A.M. Integration of passive RFID for small-scale construction project management. Data Inf. Manag. 2023, 7, 100055. [Google Scholar] [CrossRef]
- Li, Q.; Zhang, L.; Zhang, L.; Wu, X. Optimizing energy efficiency and thermal comfort in building green retrofit. Energy 2021, 237, 121509. [Google Scholar] [CrossRef]
- Waqar, A.; Shafiq, N.; Othman, I.; Alqahtani, F.K.; Alshehri, A.M.; Sherif, M.A.; Almujibah, H.R. Examining the impact of BIM implementation on external environment of AEC industry: A PEST analysis perspective. Dev. Built Environ. 2024, 17, 100347. [Google Scholar] [CrossRef]
- Vijayan, D.S.; Sivasuriyan, A.; Patchamuthu, P.; Jayaseelan, R. Thermal performance of energy-efficient buildings for sustainable development. Environ. Sci. Pollut. Res. 2022, 29, 51130–51142. [Google Scholar] [CrossRef] [PubMed]
- Gassar, A.A.A.; Koo, C.; Kim, T.W.; Cha, S.H. Performance optimization studies on heating, cooling and lighting energy systems of buildings during the design stage: A review. Sustainability 2021, 13, 9815. [Google Scholar] [CrossRef]
- Wang, J.; Li, Y.; Gao, R.X.; Zhang, F. Hybrid physics-based and data-driven models for smart manufacturing: Modelling, simulation, and explainability. J. Manuf. Syst. 2022, 63, 381–391. [Google Scholar] [CrossRef]
- Taherahmadi, J.; Noorollahi, Y.; Panahi, M. Toward comprehensive zero energy building definitions: A literature review and recommendations. Int. J. Sustain. Energy 2021, 40, 120–148. [Google Scholar] [CrossRef]
- Li, Y.; Li, S.; Xia, S.; Li, B.; Zhang, X.; Wang, B.; Ye, T.; Zheng, W. A review on the policy, technology and evaluation method of low-carbon buildings and communities. Energies 2023, 16, 1773. [Google Scholar] [CrossRef]
- Musarat, M.A.; Alaloul, W.S.; Khan, A.M.; Ayub, S.; Jousseaume, N. A survey-based approach of framework development for improving the application of internet of things in the construction industry of Malaysia. Results Eng. 2024, 21, 101823. [Google Scholar] [CrossRef]
- Cortiços, N.D. Labels’ Standard Deviation in Energy Performance Certificates: Portuguese Housing. J. Sustain. Res. 2021, 3, e210019. [Google Scholar]
- Shen, Y.; Faure, M. Green building in China. Int. Environ. Agreem. Politics Law Econ. 2021, 21, 183–199. [Google Scholar] [CrossRef]
- Manley, S.C.; Hair, J.F.; Williams, R.I.; McDowell, W.C. Essential new PLS-SEM analysis methods for your entrepreneurship analytical toolbox. Int. Entrep. Manag. J. 2021, 17, 1805–1825. [Google Scholar] [CrossRef]
- Waqar, A.; Othman, I.; Saad, N.; Qureshi, A.H.; Azab, M.; Khan, A.M. Complexities for adopting 3D laser scanners in the AEC industry: Structural equation modeling. Appl. Eng. Sci. 2023, 16, 100160. [Google Scholar] [CrossRef]
- Maimour, M.; Ahmed, A.; Rondeau, E. Survey on digital twins for natural environments: A communication network perspective. Internet Things 2024, 25, 101070. [Google Scholar] [CrossRef]
- Ali, U.; Shamsi, M.H.; Bohacek, M.; Purcell, K.; Hoare, C.; Mangina, E.; O’Donnell, J. A data-driven approach for multi-scale GIS-based building energy modeling for analysis, planning and support decision making. Appl. Energy 2020, 279, 115834. [Google Scholar] [CrossRef]
- Wang, Z.; Liu, J.; Zhang, Y.; Yuan, H.; Zhang, R.; Srinivasan, R.S. Practical issues in implementing machine-learning models for building energy efficiency: Moving beyond obstacles. Renew. Sustain. Energy Rev. 2021, 143, 110929. [Google Scholar] [CrossRef]
- Musarat, M.A.; Khan, A.M.; Alaloul, W.S.; Blas, N.; Ayub, S. Automated monitoring innovations for efficient and safe construction practices. Results Eng. 2024, 22, 102057. [Google Scholar] [CrossRef]
- Olu-Ajayi, R.; Alaka, H.; Sulaimon, I.; Sunmola, F.; Ajayi, S. Building energy consumption prediction for residential buildings using deep learning and other machine learning techniques. J. Build. Eng. 2022, 45, 103406. [Google Scholar] [CrossRef]
- Alotaibi, B.S.; Waqar, A.; Radu, D.; Khan, A.M.; Dodo, Y.; Althoey, F.; Almujibah, H. Building information modeling (BIM) adoption for enhanced legal and contractual management in construction projects. Ain Shams Eng. J. 2024, 15, 102822. [Google Scholar] [CrossRef]
- Zhang, L.; Wen, J.; Li, Y.; Chen, J.; Ye, Y.; Fu, Y.; Livingood, W. A review of machine learning in building load prediction. Appl. Energy 2021, 285, 116452. [Google Scholar] [CrossRef]
- Lu, C.; Li, S.; Lu, Z. Building energy prediction using artificial neural networks: A literature survey. Energy Build. 2022, 262, 111718. [Google Scholar] [CrossRef]
- Hong, T.; Wang, Z.; Luo, X.; Zhang, W. State-of-the-art on research and applications of machine learning in the building life cycle. Energy Build. 2020, 212, 109831. [Google Scholar] [CrossRef]
- Forootan, M.M.; Larki, I.; Zahedi, R.; Ahmadi, A. Machine learning and deep learning in energy systems: A review. Sustainability 2022, 14, 4832. [Google Scholar] [CrossRef]
- Ayoub, M. A review on machine learning algorithms to predict daylighting inside buildings. Sol. Energy 2020, 202, 249–275. [Google Scholar] [CrossRef]
- Alabi, T.M.; Aghimien, E.I.; Agbajor, F.D.; Yang, Z.; Lu, L.; Adeoye, A.R.; Gopaluni, B. A review on the integrated optimization techniques and machine learning approaches for modeling, prediction, and decision making on integrated energy systems. Renew. Energy 2022, 194, 822–849. [Google Scholar] [CrossRef]
- Khalil, M.; McGough, A.S.; Pourmirza, Z.; Pazhoohesh, M.; Walker, S. Machine Learning, Deep Learning and Statistical Analysis for forecasting building energy consumption—A systematic review. Eng. Appl. Artif. Intell. 2022, 115, 105287. [Google Scholar] [CrossRef]
- Stergiou, K.; Ntakolia, C.; Varytis, P.; Koumoulos, E.; Karlsson, P.; Moustakidis, S. Enhancing property prediction and process optimization in building materials through machine learning: A review. Comput. Mater. Sci. 2023, 220, 112031. [Google Scholar] [CrossRef]
- Pinto, G.; Wang, Z.; Roy, A.; Hong, T.; Capozzoli, A. Transfer learning for smart buildings: A critical review of algorithms, applications, and future perspectives. Adv. Appl. Energy 2022, 5, 100084. [Google Scholar] [CrossRef]
- Farzaneh, H.; Malehmirchegini, L.; Bejan, A.; Afolabi, T.; Mulumba, A.; Daka, P.P. Artificial intelligence evolution in smart buildings for energy efficiency. Appl. Sci. 2021, 11, 763. [Google Scholar] [CrossRef]
- Antonopoulos, I.; Robu, V.; Couraud, B.; Kirli, D.; Norbu, S.; Kiprakis, A.; Flynn, D.; Elizondo-Gonzalez, S.; Wattam, S. Artificial intelligence and machine learning approaches to energy demand-side response: A systematic review. Renew. Sustain. Energy Rev. 2020, 130, 109899. [Google Scholar] [CrossRef]
- Akinosho, T.D.; Oyedele, L.O.; Bilal, M.; Ajayi, A.O.; Delgado, M.D.; Akinade, O.O.; Ahmed, A.A. Deep learning in the construction industry: A review of present status and future innovations. J. Build. Eng. 2020, 32, 101827. [Google Scholar] [CrossRef]
- Qiao, Q.; Yunusa-Kaltungo, A.; Edwards, R.E. Towards developing a systematic knowledge trend for building energy consumption prediction. J. Build. Eng. 2021, 35, 101967. [Google Scholar] [CrossRef]
- Forde, J.; Hopfe, C.J.; McLeod, R.S.; Evins, R. Temporal optimization for affordable and resilient Passivhaus dwellings in the social housing sector. Appl. Energy 2020, 261, 114383. [Google Scholar] [CrossRef]
- Grillone, B.; Danov, S.; Sumper, A.; Cipriano, J.; Mor, G. A review of deterministic and data-driven methods to quantify energy efficiency savings and to predict retrofitting scenarios in buildings. Renew. Sustain. Energy Rev. 2020, 131, 110027. [Google Scholar] [CrossRef]
- Sajjad, M.; Hu, A.; Alshehri, A.M.; Waqar, A.; Khan, A.M.; Bageis, A.S.; Elaraki, Y.G.; Shohan, A.A.A.; Benjeddou, O. BIM-driven energy simulation and optimization for net-zero tall buildings: Sustainable construction management. Front. Built Environ. 2024, 10, 1296817. [Google Scholar] [CrossRef]
- Seyedzadeh, S.; Rahimian, F.P.; Oliver, S.; Glesk, I.; Kumar, B. Data driven model improved by multi-objective optimisation for prediction of building energy loads. Autom. Constr. 2020, 116, 103188. [Google Scholar] [CrossRef]
- Waqar, A.; Houda, M.; Khan, A.M.; Khan, M.B.; Raja, B.N.K.; Elmazi, G. Limitations to the BIM-based safety management practices in residential construction project. Environ. Chall. 2024, 14, 100848. [Google Scholar] [CrossRef]
- Pan, Y.; Zhang, L. Integrating BIM and AI for smart construction management: Current status and future directions. Arch. Comput. Methods Eng. 2023, 30, 1081–1110. [Google Scholar] [CrossRef]
- Zhang, J.; Zhu, X.; Khan, A.M.; Houda, M.; Rehman, S.K.U.; Jameel, M.; Javed, M.F.; Alrowais, R. BIM-based architectural analysis and optimization for construction 4.0 concept (a comparison). Ain Shams Eng. J. 2023, 14, 102110. [Google Scholar] [CrossRef]
- Al-Ashmori, Y.Y.; Othman, I.; Rahmawati, Y.; Amran, Y.M.; Sabah, S.A.; Rafindadi, A.D.u.; Mikić, M. BIM benefits and its influence on the BIM implementation in Malaysia. Ain Shams Eng. J. 2020, 11, 1013–1019. [Google Scholar] [CrossRef]
- Pan, X.; Khan, A.M.; Eldin, S.M.; Aslam, F.; Rehman, S.K.U.; Jameel, M. BIM adoption in sustainability, energy modelling and implementing using ISO 19650: A review. Ain Shams Eng. J. 2024, 15, 102252. [Google Scholar] [CrossRef]
- Shukra, Z.A.; Zhou, Y. Holistic green BIM: A scientometrics and mixed review. Eng. Constr. Archit. Manag. 2021, 28, 2273–2299. [Google Scholar] [CrossRef]
- Maglad, A.M.; Houda, M.; Alrowais, R.; Khan, A.M.; Jameel, M.; Rehman, S.K.U.; Khan, H.; Javed, M.F.; Rehman, M.F. Bim-based energy analysis and optimization using insight 360 (case study). Case Stud. Constr. Mater. 2023, 18, e01755. [Google Scholar] [CrossRef]
- Cascone, S. Digital technologies and sustainability assessment: A critical review on the integration methods between BIM and LEED. Sustainability 2023, 15, 5548. [Google Scholar] [CrossRef]
- Huang, B.; Lei, J.; Ren, F.; Chen, Y.; Zhao, Q.; Li, S.; Lin, Y. Contribution and obstacle analysis of applying BIM in promoting green buildings. J. Clean. Prod. 2021, 278, 123946. [Google Scholar] [CrossRef]
- Jalaei, F.; Jalaei, F.; Mohammadi, S. An integrated BIM-LEED application to automate sustainable design assessment framework at the conceptual stage of building projects. Sustain. Cities Soc. 2020, 53, 101979. [Google Scholar] [CrossRef]
- Rehman, S.K.U.; Khan, A.M.; Khan, H.; Ali, S.; Zaki, A. BIM adoption over the entire life cycle of a constructed asset and using ISO standards in Pakistan. AIP Conf. Proc. 2023, 2846, 060006. [Google Scholar]
- Motalebi, M.; Rashidi, A.; Nasiri, M.M. Optimization and BIM-based lifecycle assessment integration for energy efficiency retrofit of buildings. J. Build. Eng. 2022, 49, 104022. [Google Scholar] [CrossRef]
- Feng, K. Environmentally Friendly Construction Processes under Uncertainty: Assessment, Optimisation and Robust Decision-Making; Luleå University of Technology: Luleå, Sweden, 2020. [Google Scholar]
- Abuhussain, M.A.; Waqar, A.; Khan, A.M.; Othman, I.; Alotaibi, B.S.; Althoey, F.; Abuhussain, M. Integrating Building Information Modeling (BIM) for optimal lifecycle management of complex structures. Structures 2024, 60, 105831. [Google Scholar] [CrossRef]
- Pan, Y.; Zhang, L. Roles of artificial intelligence in construction engineering and management: A critical review and future trends. Autom. Constr. 2021, 122, 103517. [Google Scholar] [CrossRef]
- Lin, B.; Chen, H.; Yu, Q.; Zhou, X.; Lv, S.; He, Q.; Li, Z. MOOSAS–A systematic solution for multiple objective building performance optimization in the early design stage. Build. Environ. 2021, 200, 107929. [Google Scholar] [CrossRef]
- Seyedzadeh, S.; Rahimian, F.P.; Oliver, S.; Rodriguez, S.; Glesk, I. Machine learning modelling for predicting non-domestic buildings energy performance: A model to support deep energy retrofit decision-making. Appl. Energy 2020, 279, 115908. [Google Scholar] [CrossRef]
- Pham, T.; Le-Hong, T.; Tran, X. Efficient estimation and optimization of building costs using machine learning. Int. J. Constr. Manag. 2023, 23, 909–921. [Google Scholar] [CrossRef]
- Zhang, H.; Feng, H.; Hewage, K.; Arashpour, M. Artificial neural network for predicting building energy performance: A surrogate energy retrofits decision support framework. Buildings 2022, 12, 829. [Google Scholar] [CrossRef]
- Uncuoglu, E.; Citakoglu, H.; Latifoglu, L.; Bayram, S.; Laman, M.; Ilkentapar, M.; Oner, A.A. Comparison of neural network, Gaussian regression, support vector machine, long short-term memory, multi-gene genetic programming, and M5 Trees methods for solving civil engineering problems. Appl. Soft Comput. 2022, 129, 109623. [Google Scholar] [CrossRef]
- Ghasemieh, A.; Lloyed, A.; Bahrami, P.; Vajar, P.; Kashef, R. A novel machine learning model with Stacking Ensemble Learner for predicting emergency readmission of heart-disease patients. Decis. Anal. J. 2023, 7, 100242. [Google Scholar] [CrossRef]
- Sibindi, R.; Mwangi, R.W.; Waititu, A.G. A boosting ensemble learning based hybrid light gradient boosting machine and extreme gradient boosting model for predicting house prices. Eng. Rep. 2023, 5, e12599. [Google Scholar] [CrossRef]
- Mishra, D.; Naik, B.; Nayak, J.; Souri, A.; Dash, P.B.; Vimal, S. Light gradient boosting machine with optimized hyperparameters for identification of malicious access in IoT network. Digit. Commun. Netw. 2023, 9, 125–137. [Google Scholar] [CrossRef]
- Sajid, S.W.; Hasan, M.; Rabbi, M.F.; Abedin, M.Z. An ensemble LGBM (light gradient boosting machine) approach for crude oil price prediction. In Novel Financial Applications of Machine Learning and Deep Learning: Algorithms, Product Modeling, and Applications; Springer: Berlin/Heidelberg, Germany, 2023; pp. 153–165. [Google Scholar]
- Walker, S.; Khan, W.; Katic, K.; Maassen, W.; Zeiler, W. Accuracy of different machine learning algorithms and added-value of predicting aggregated-level energy performance of commercial buildings. Energy Build. 2020, 209, 109705. [Google Scholar] [CrossRef]
- Ali, S.; Abuhmed, T.; El-Sappagh, S.; Muhammad, K.; Alonso-Moral, J.M.; Confalonieri, R.; Guidotti, R.; Del Ser, J.; Díaz-Rodríguez, N.; Herrera, F. Explainable Artificial Intelligence (XAI): What we know and what is left to attain Trustworthy Artificial Intelligence. Inf. Fusion 2023, 99, 101805. [Google Scholar] [CrossRef]
- Kim, M.-Y.; Atakishiyev, S.; Babiker, H.K.B.; Farruque, N.; Goebel, R.; Zaïane, O.R.; Motallebi, M.-H.; Rabelo, J.; Syed, T.; Yao, H. A multi-component framework for the analysis and design of explainable artificial intelligence. Mach. Learn. Knowl. Extr. 2021, 3, 900–921. [Google Scholar] [CrossRef]
- Minh, D.; Wang, H.X.; Li, Y.F.; Nguyen, T.N. Explainable artificial intelligence: A comprehensive review. Artif. Intell. Rev. 2022, 55, 3503–3568. [Google Scholar] [CrossRef]
- Roscher, R.; Bohn, B.; Duarte, M.F.; Garcke, J. Explainable machine learning for scientific insights and discoveries. IEEE Access 2020, 8, 42200–42216. [Google Scholar] [CrossRef]
- Chen, X.; Geyer, P. Machine assistance in energy-efficient building design: A predictive framework toward dynamic interaction with human decision-making under uncertainty. Appl. Energy 2022, 307, 118240. [Google Scholar] [CrossRef]
- Buhrmester, V.; Münch, D.; Arens, M. Analysis of explainers of black box deep neural networks for computer vision: A survey. Mach. Learn. Knowl. Extr. 2021, 3, 966–989. [Google Scholar] [CrossRef]
- Gan, V.J.; Lo, I.M.; Ma, J.; Tse, K.T.; Cheng, J.C.; Chan, C.M. Simulation optimisation towards energy efficient green buildings: Current status and future trends. J. Clean. Prod. 2020, 254, 120012. [Google Scholar] [CrossRef]
- Muzahid, A.J.M.; Kamarulzaman, S.F.; Rahman, M.A.; Murad, S.A.; Kamal, M.A.S.; Alenezi, A.H. Multiple vehicle cooperation and collision avoidance in automated vehicles: Survey and an AI-enabled conceptual framework. Sci. Rep. 2023, 13, 603. [Google Scholar] [CrossRef]
- Fu, X.; Ponnarasu, S.; Zhang, L.; Tiong, R.L.K. Online multi-objective optimization for real-time TBM attitude control with spatio-temporal deep learning model. Autom. Constr. 2024, 158, 105220. [Google Scholar] [CrossRef]
- Ciardiello, A.; Rosso, F.; Dell’Olmo, J.; Ciancio, V.; Ferrero, M.; Salata, F. Multi-objective approach to the optimization of shape and envelope in building energy design. Appl. Energy 2020, 280, 115984. [Google Scholar] [CrossRef]
- Tanhadoust, A.; Madhkhan, M.; Nehdi, M.L. Two-stage multi-objective optimization of reinforced concrete buildings based on non-dominated sorting genetic algorithm (NSGA-III). J. Build. Eng. 2023, 75, 107022. [Google Scholar] [CrossRef]
- Chen, B.; Liu, Q.; Chen, H.; Wang, L.; Deng, T.; Zhang, L.; Wu, X. Multiobjective optimization of building energy consumption based on BIM-DB and LSSVM-NSGA-II. J. Clean. Prod. 2021, 294, 126153. [Google Scholar] [CrossRef]
- Wang, M.; Chen, C.; Fan, B.; Yin, Z.; Li, W.; Wang, H.; Chi, F.a. Multi-Objective Optimization of Envelope Design of Rural Tourism Buildings in Southeastern Coastal Areas of China Based on NSGA-II Algorithm and Entropy-Based TOPSIS Method. Sustainability 2023, 15, 7238. [Google Scholar] [CrossRef]
- Abdel-Basset, M.; Mohamed, M.; Abdel-Monem, A.; Elfattah, M.A. New extension of ordinal priority approach for multiple attribute decision-making problems: Design and analysis. Complex Intell. Syst. 2022, 8, 4955–4970. [Google Scholar] [CrossRef] [PubMed]
- Tang, S.; Shelden, D.R.; Eastman, C.M.; Pishdad-Bozorgi, P.; Gao, X. A review of building information modeling (BIM) and the internet of things (IoT) devices integration: Present status and future trends. Autom. Constr. 2019, 101, 127–139. [Google Scholar] [CrossRef]
- Xiang, X.; Ma, X.; Ma, Z.; Ma, M. Operational carbon change in commercial buildings under the carbon neutral goal: A LASSO–WOA approach. Buildings 2022, 12, 54. [Google Scholar] [CrossRef]
- Peirelinck, T.; Kazmi, H.; Mbuwir, B.V.; Hermans, C.; Spiessens, F.; Suykens, J.; Deconinck, G. Transfer learning in demand response: A review of algorithms for data-efficient modelling and control. Energy AI 2022, 7, 100126. [Google Scholar] [CrossRef]
- Xiang, X.; Ma, M.; Ma, X.; Chen, L.; Cai, W.; Feng, W.; Ma, Z. Historical decarbonization of global commercial building operations in the 21st century. Appl. Energy 2022, 322, 119401. [Google Scholar] [CrossRef]
- Miah, J.; Koh, S.; Stone, D. A hybridised framework combining integrated methods for environmental Life Cycle Assessment and Life Cycle Costing. J. Clean. Prod. 2017, 168, 846–866. [Google Scholar] [CrossRef]
- Aati, K.; Houda, M.; Alotaibi, S.; Khan, A.M.; Alselami, N.; Benjeddou, O. Analysis of Road Traffic Accidents in Dense Cities: Geotech Transport and ArcGIS. Transp. Eng. 2024, 16, 100256. [Google Scholar] [CrossRef]
- Visani, G.; Bagli, E.; Chesani, F.; Poluzzi, A.; Capuzzo, D. Statistical stability indices for LIME: Obtaining reliable explanations for machine learning models. J. Oper. Res. Soc. 2022, 73, 91–101. [Google Scholar] [CrossRef]
- Patacas, J.; Dawood, N.; Kassem, M. BIM for facilities management: A framework and a common data environment using open standards. Autom. Constr. 2020, 120, 103366. [Google Scholar] [CrossRef]
- Sadeghifam, A.N.; Zahraee, S.M.; Meynagh, M.M.; Kiani, I. Combined use of design of experiment and dynamic building simulation in assessment of energy efficiency in tropical residential buildings. Energy Build. 2015, 86, 525–533. [Google Scholar] [CrossRef]
- Chi, D.A.; Moreno, D.; Esquivias, P.M.; Navarro, J. Optimization method for perforated solar screen design to improve daylighting using orthogonal arrays and climate-based daylight modelling. J. Build. Perform. Simul. 2017, 10, 144–160. [Google Scholar] [CrossRef]
- Peng, Y.; Wang, S.; Chen, W.; Ma, J.; Wang, C.; Chen, J. LightGBM-Integrated PV Power Prediction Based on Multi-Resolution Similarity. Processes 2023, 11, 1141. [Google Scholar] [CrossRef]
- Qi, H.; Sparks, E.R.; Talwalkar, A. Paleo: A performance model for deep neural networks. In Proceedings of the International Conference on Learning Representations, Online, 25–29 April 2022. [Google Scholar]
- Wang, W.; Feng, H.; Li, Y.; You, Q.; Zhou, X. Research on Prediction of EPB Shield Tunneling Parameters Based on LGBM. Buildings 2024, 14, 820. [Google Scholar] [CrossRef]
- Feurer, M.; Hutter, F. Hyperparameter optimization. Autom. Mach. Learn. Methods Syst. Chall. 2019, 3–33. [Google Scholar] [CrossRef]
- Aghaabbasi, M.; Ali, M.; Jasiński, M.; Leonowicz, Z.; Novák, T. On hyperparameter optimization of machine learning methods using a Bayesian optimization algorithm to predict work travel mode choice. IEEE Access 2023, 11, 19762–19774. [Google Scholar] [CrossRef]
- Xi, B.; Li, E.; Fissha, Y.; Zhou, J.; Segarra, P. LGBM-based modeling scenarios to compressive strength of recycled aggregate concrete with SHAP analysis. Mech. Adv. Mater. Struct. 2023, 1–16. [Google Scholar] [CrossRef]
- Tan, L.; Huang, C.; Yao, X. A Concept-Based Local Interpretable Model-Agnostic Explanation Approach for Deep Neural Networks in Image Classification. In Proceedings of the International Conference on Intelligent Information Processing, Shenzhen, China, 3–6 May 2024; pp. 119–133. [Google Scholar]
- Kumar, I.E.; Venkatasubramanian, S.; Scheidegger, C.; Friedler, S. Problems with Shapley-value-based explanations as feature importance measures. In Proceedings of the International Conference on Machine Learning, Virtual Event, 13–18 July 2020; pp. 5491–5500. [Google Scholar]
- Silva, R.M.; Sbrana, A.; de Castro, P.A.; Soma, N.Y. Developing and Assessing a Human-Understandable Metric for Evaluating Local Interpretable Model-Agnostic Explanations. Int. J. Intell. Eng. Syst. 2023, 16. [Google Scholar] [CrossRef]
- Chen, Z.; Lian, Z.; Xu, Z. Interpretable Model-Agnostic Explanations Based on Feature Relationships for High-Performance Computing. Axioms 2023, 12, 997. [Google Scholar] [CrossRef]
- Guo, C.; Bian, C.; Liu, Q.; You, Y.; Li, S.; Wang, L. A new method of evaluating energy efficiency of public buildings in China. J. Build. Eng. 2022, 46, 103776. [Google Scholar] [CrossRef]
- Qiao, K.; Liang, J.; Yu, K.; Wang, M.; Qu, B.; Yue, C.; Guo, Y. A self-adaptive evolutionary multi-task based constrained multi-objective evolutionary algorithm. IEEE Trans. Emerg. Top. Comput. Intell. 2023, 7, 1098–1112. [Google Scholar] [CrossRef]
- Hu, S.; Zhou, X.; Yan, D.; Guo, F.; Hong, T.; Jiang, Y. A systematic review of building energy sufficiency towards energy and climate targets. Renew. Sustain. Energy Rev. 2023, 181, 113316. [Google Scholar] [CrossRef]
- Hafez, F.S.; Sa’di, B.; Safa-Gamal, M.; Taufiq-Yap, Y.; Alrifaey, M.; Seyedmahmoudian, M.; Stojcevski, A.; Horan, B.; Mekhilef, S. Energy efficiency in sustainable buildings: A systematic review with taxonomy, challenges, motivations, methodological aspects, recommendations, and pathways for future research. Energy Strategy Rev. 2023, 45, 101013. [Google Scholar] [CrossRef]
- Song, Z.; Wang, H.; Xue, B.; Zhang, M.; Jin, Y. Balancing objective optimization and constraint satisfaction in expensive constrained evolutionary multi-objective optimization. IEEE Trans. Evol. Comput. 2023. [Google Scholar] [CrossRef]
- Cao, J.; Yan, Z.; Chen, Z.; Zhang, J. A coevolutionary constrained multi-objective algorithm with a learning constraint boundary. Appl. Soft Comput. 2023, 148, 110845. [Google Scholar] [CrossRef]
- Shi, G.; Yao, S.; Song, J.; Bi, W.; Qin, G.; Ni, P. Multi-performance collaborative optimization of existing residential building retrofitting in extremely arid and hot climate zone: A case study in Turpan, China. J. Build. Eng. 2024, 89, 109304. [Google Scholar] [CrossRef]
- Zandifaez, P. Increasing Sustainability in Buildings Through Energy-Efficient Concrete. Ph.D. Thesis, The University of Sydney, Camperdown, Australia, 2023. [Google Scholar]
- Mavi, R.K.; Shekarabi, S.A.H.; Mavi, N.K.; Arisian, S.; Moghdani, R. Multi-objective optimisation of sustainable closed-loop supply chain networks in the tire industry. Eng. Appl. Artif. Intell. 2023, 126, 107116. [Google Scholar] [CrossRef]
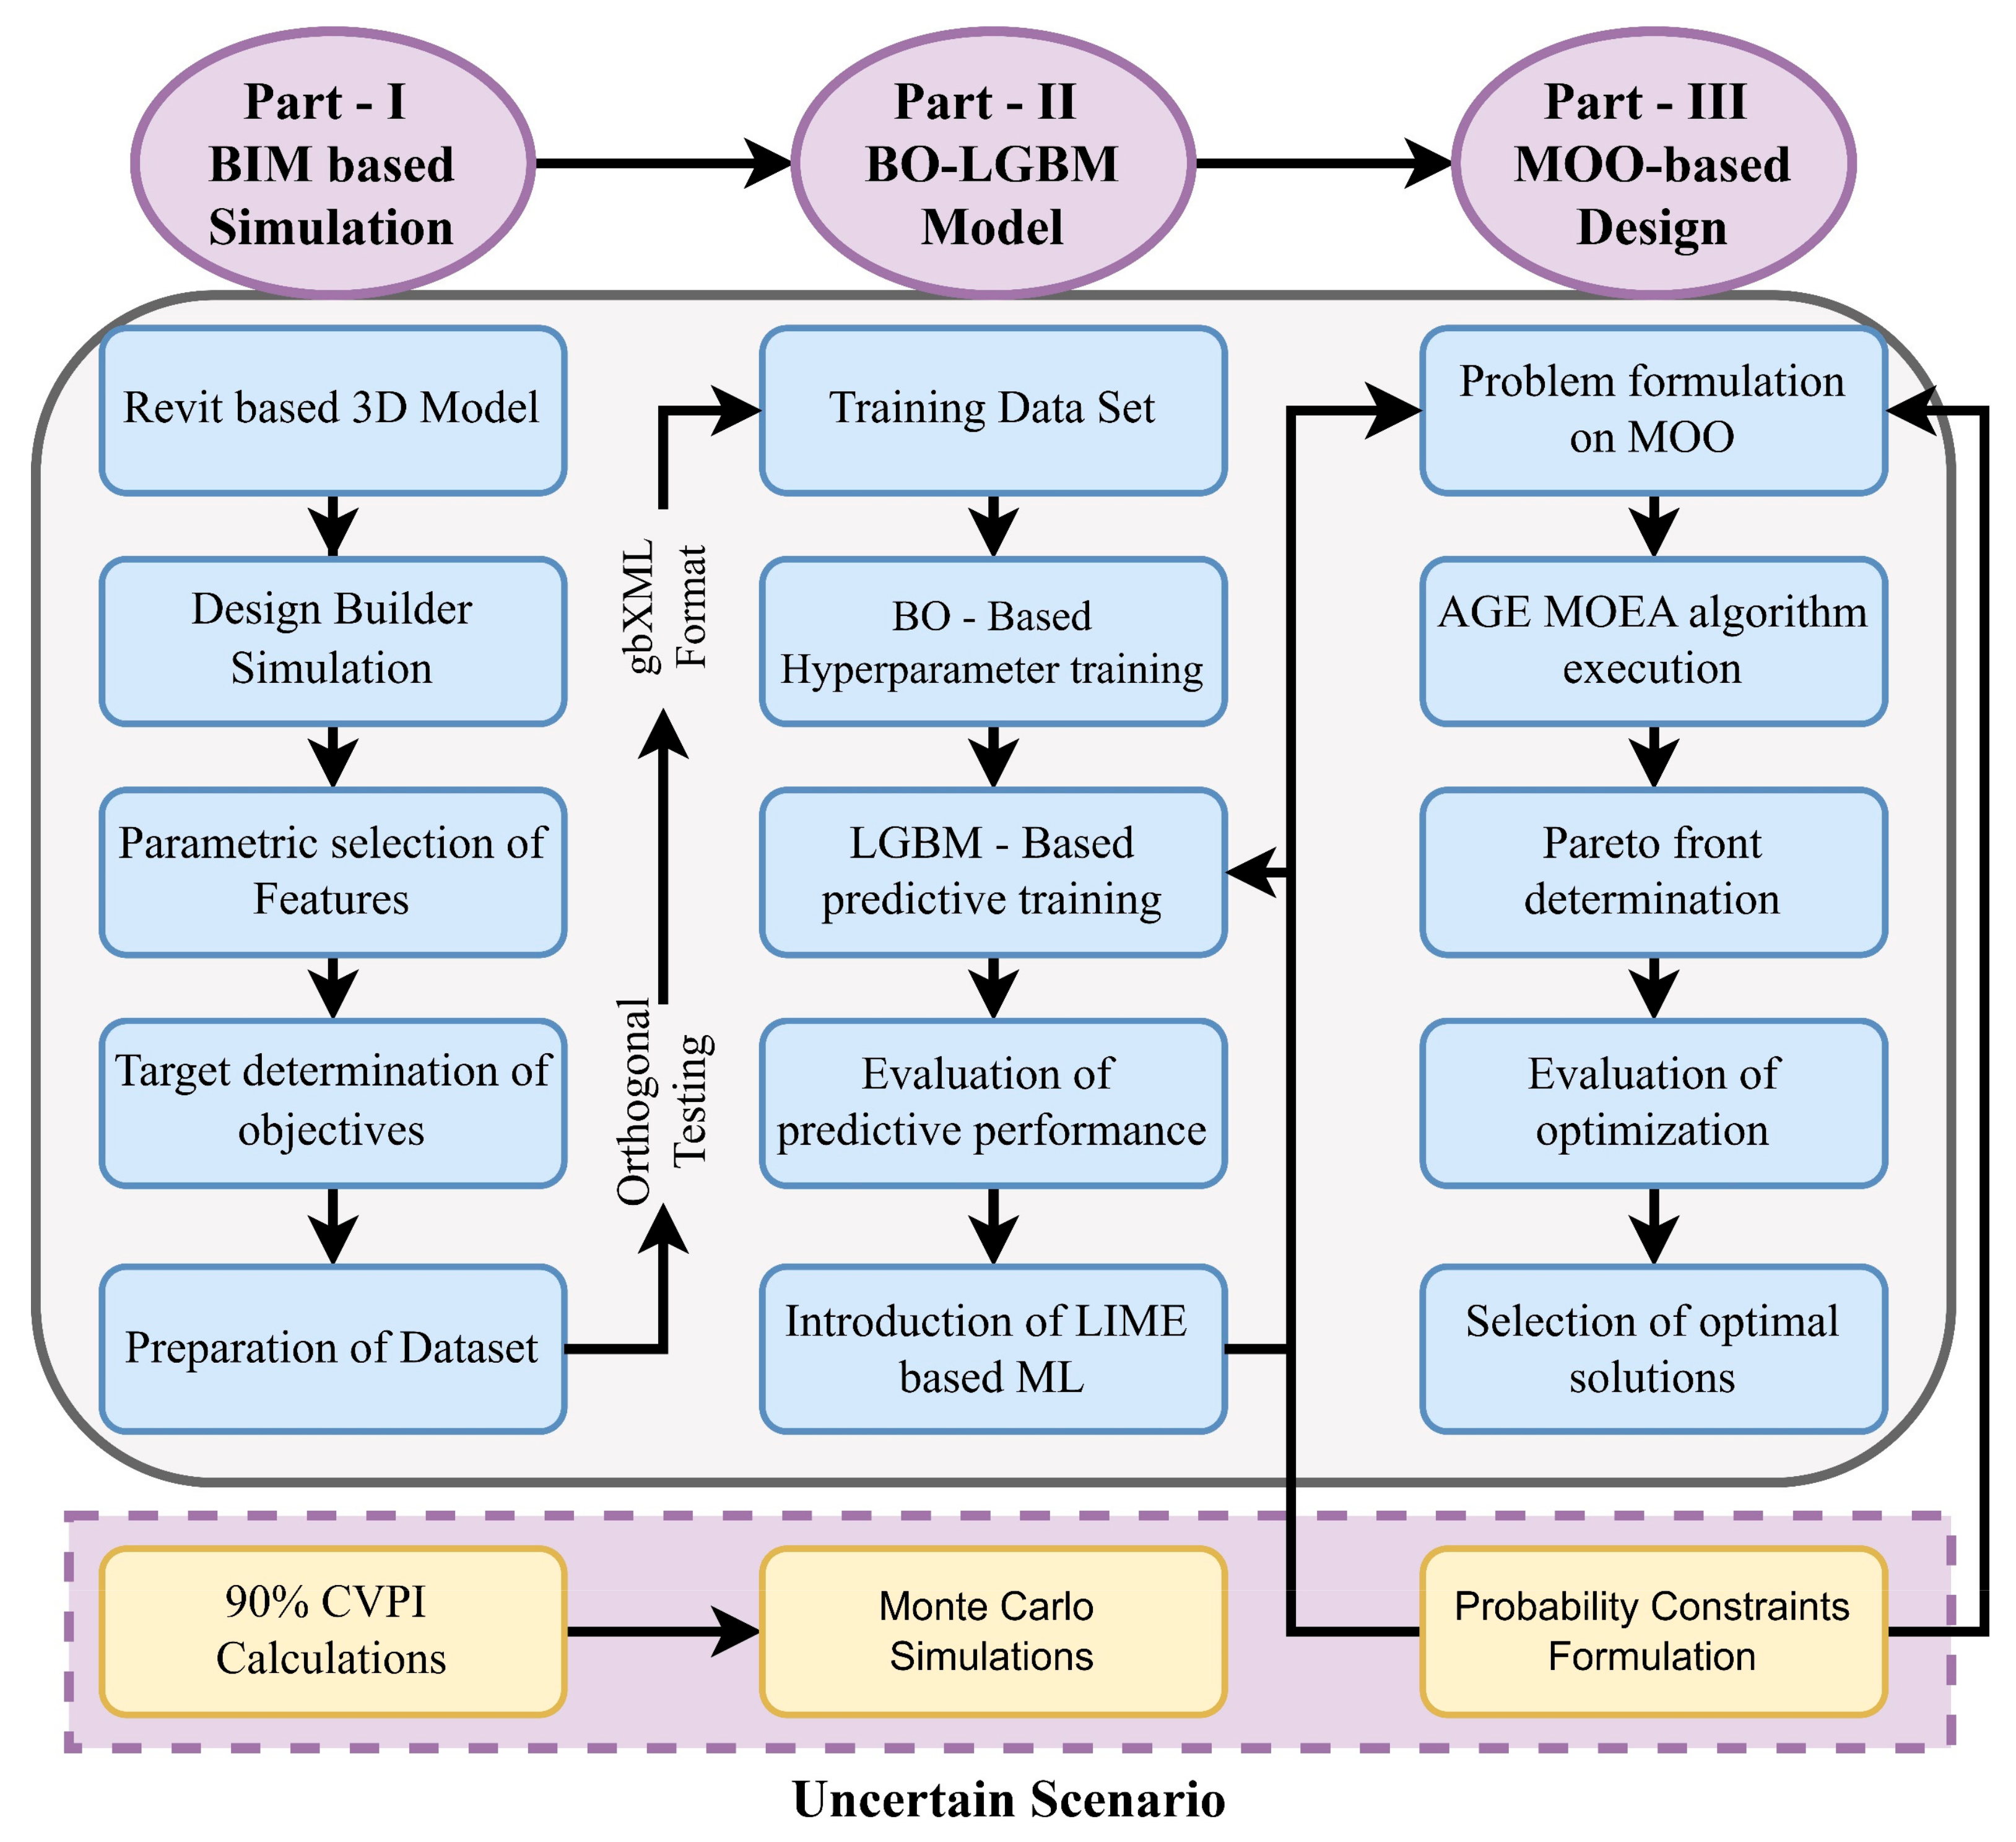

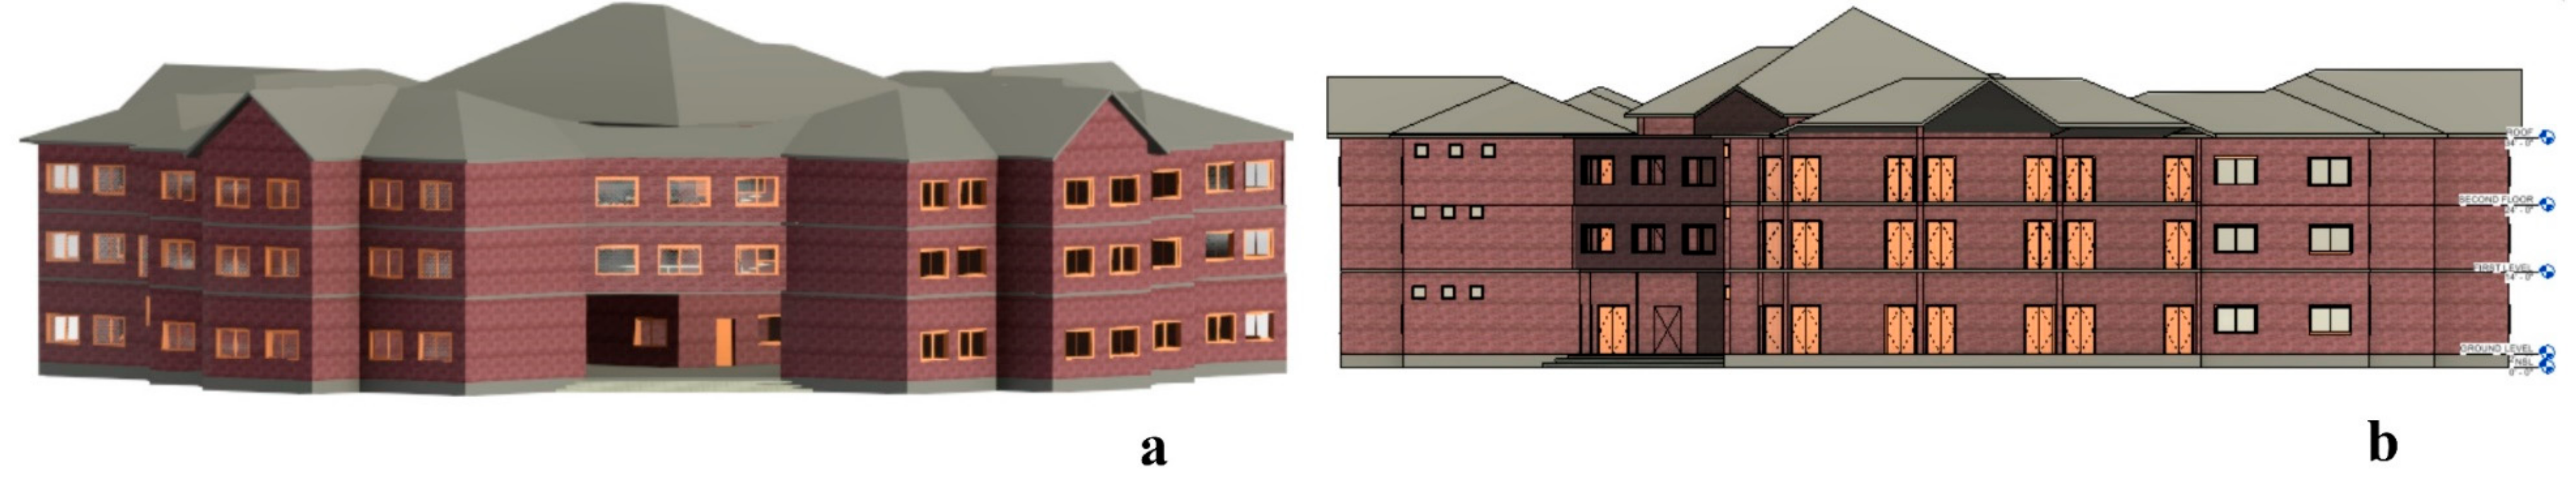


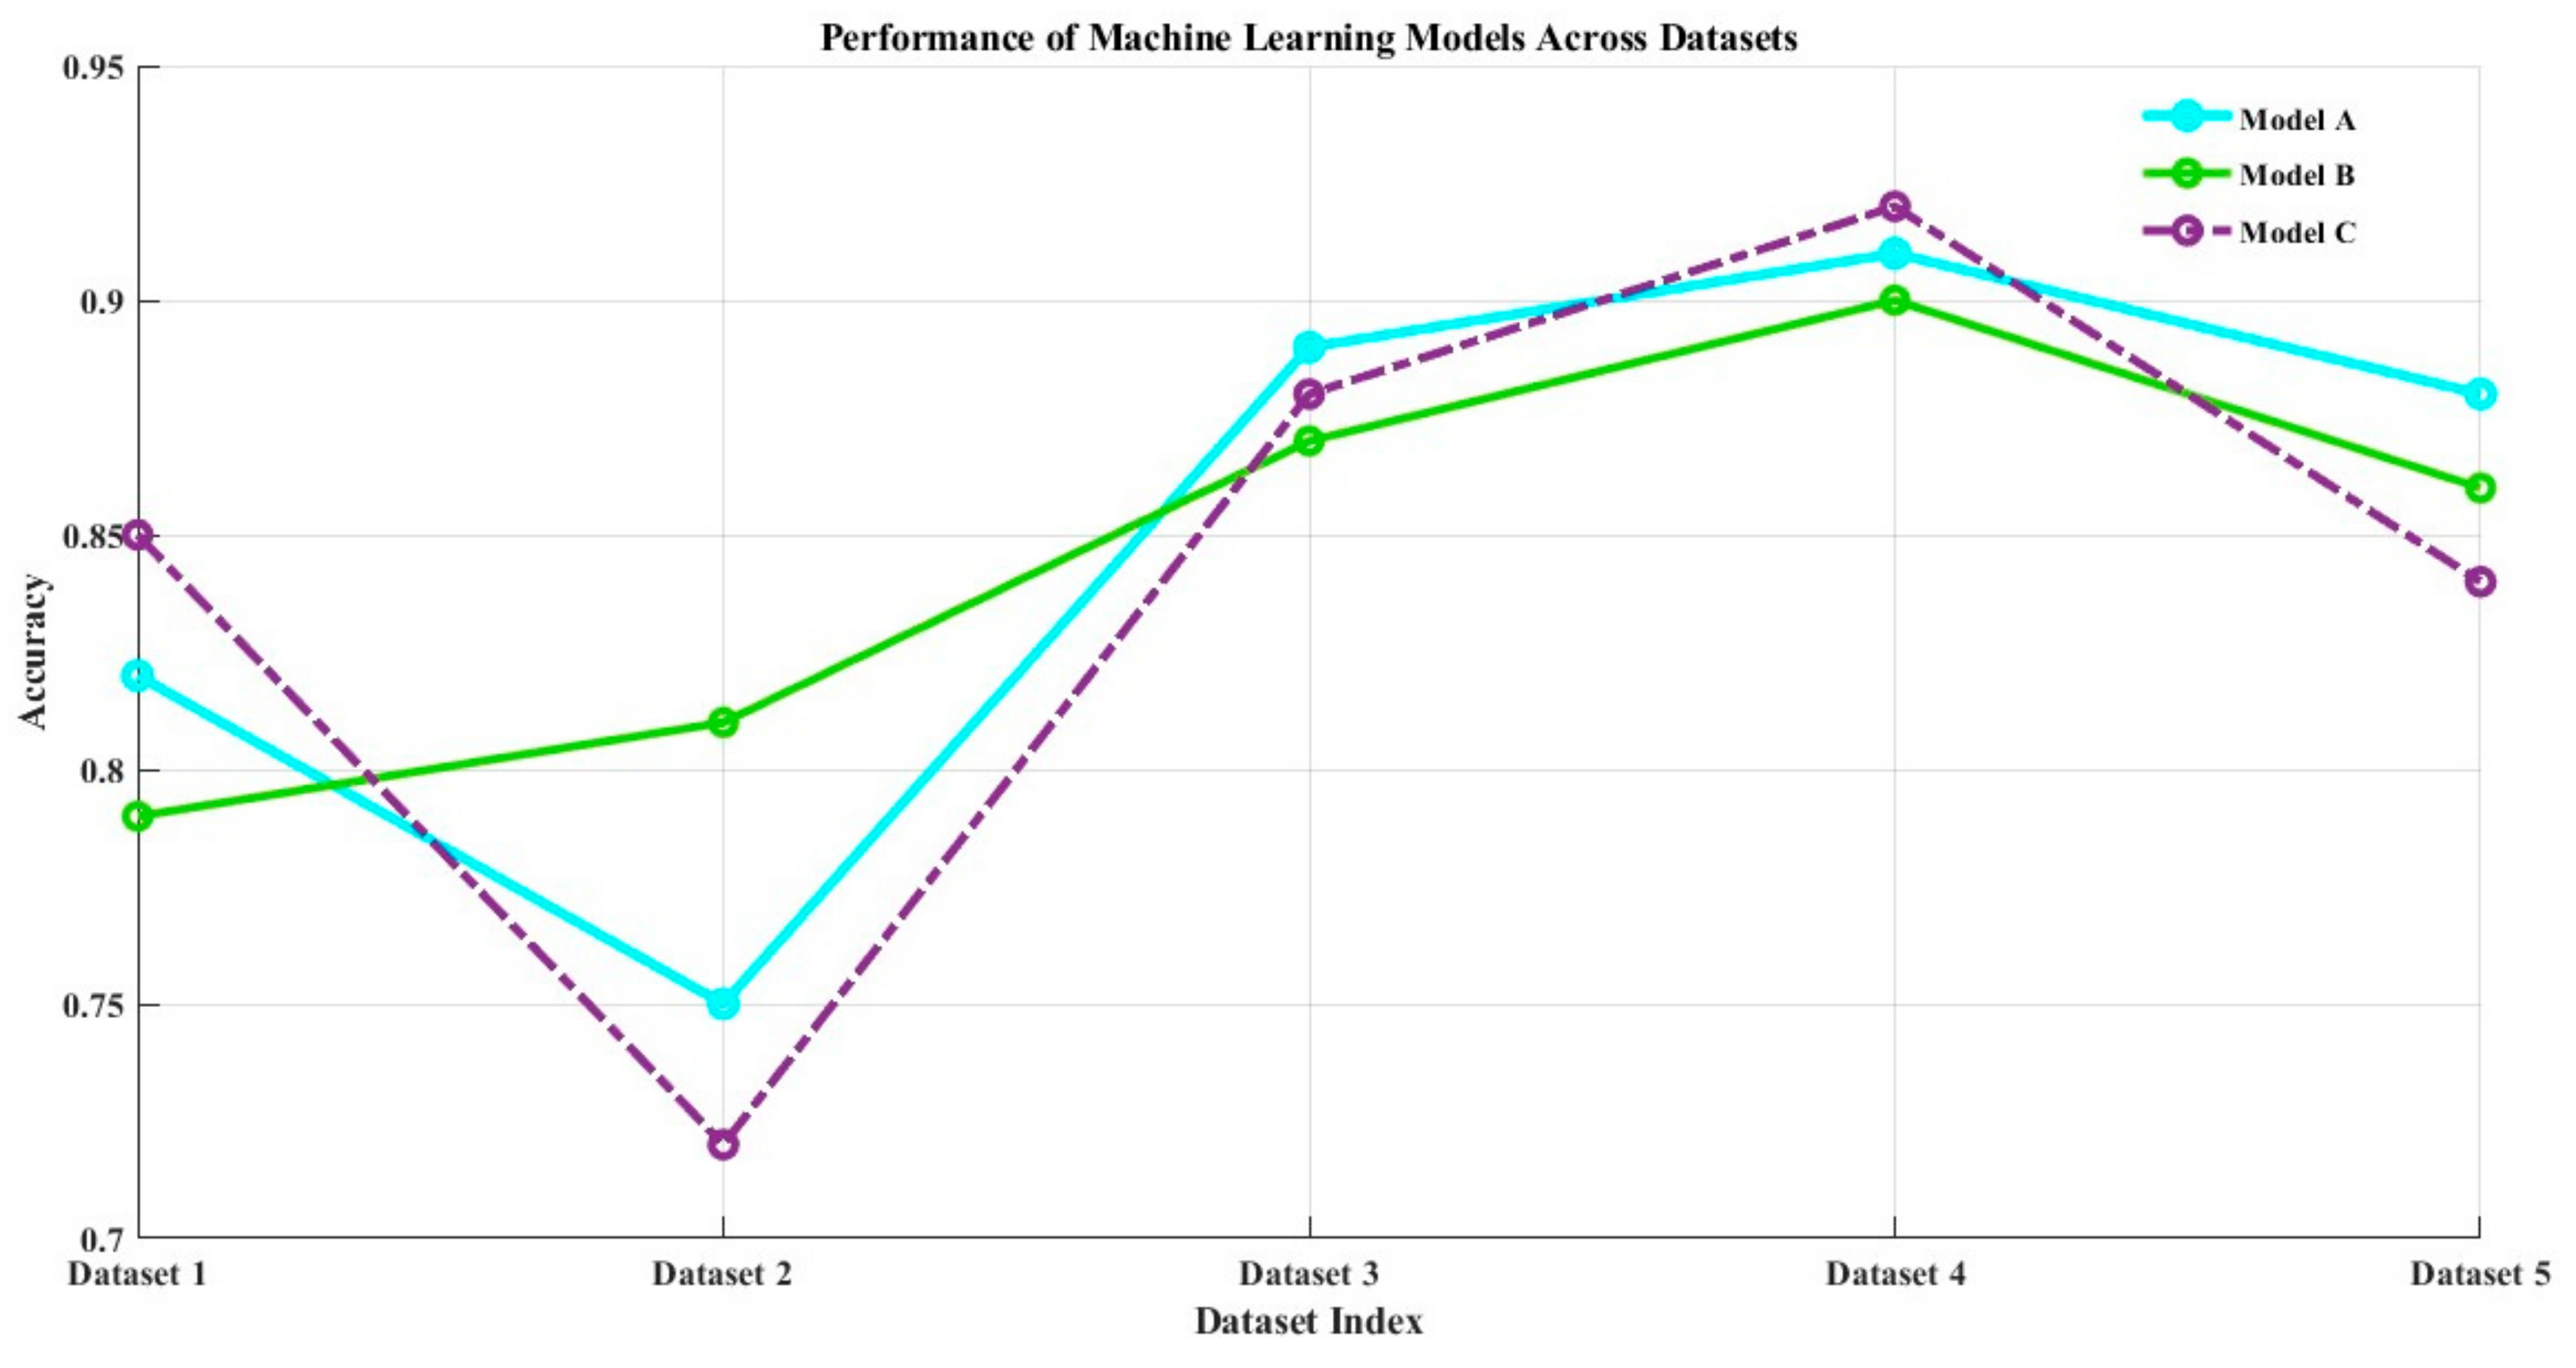

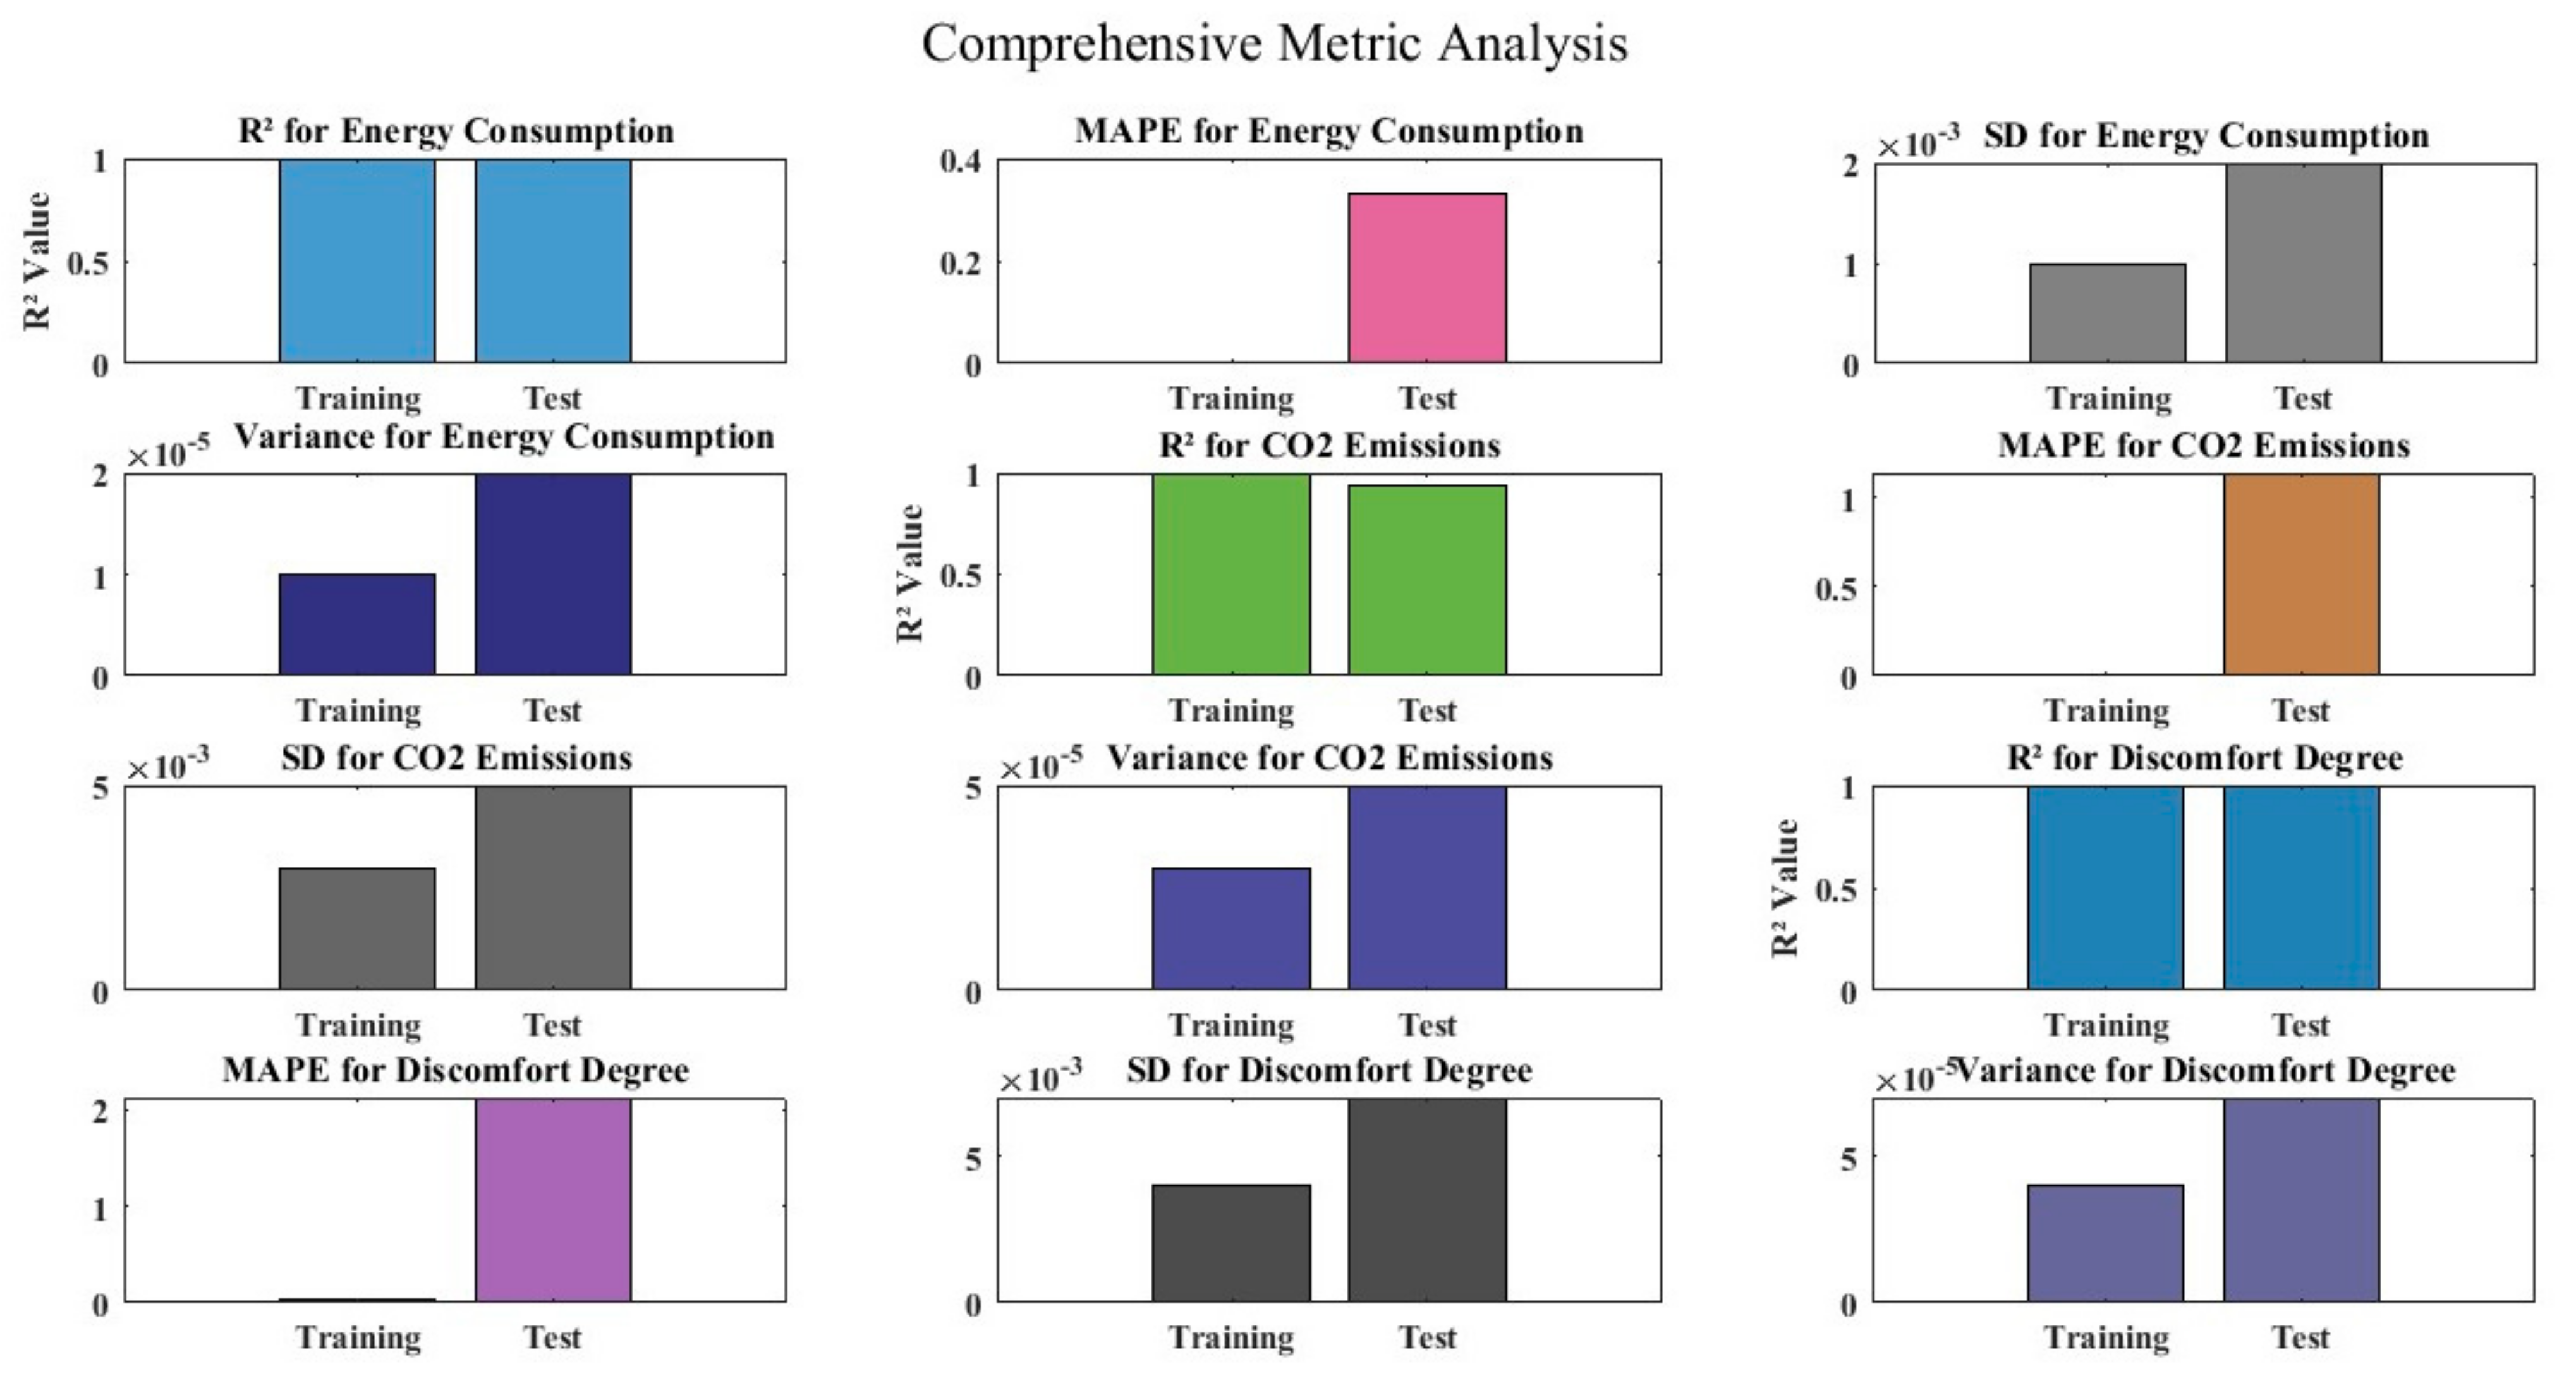
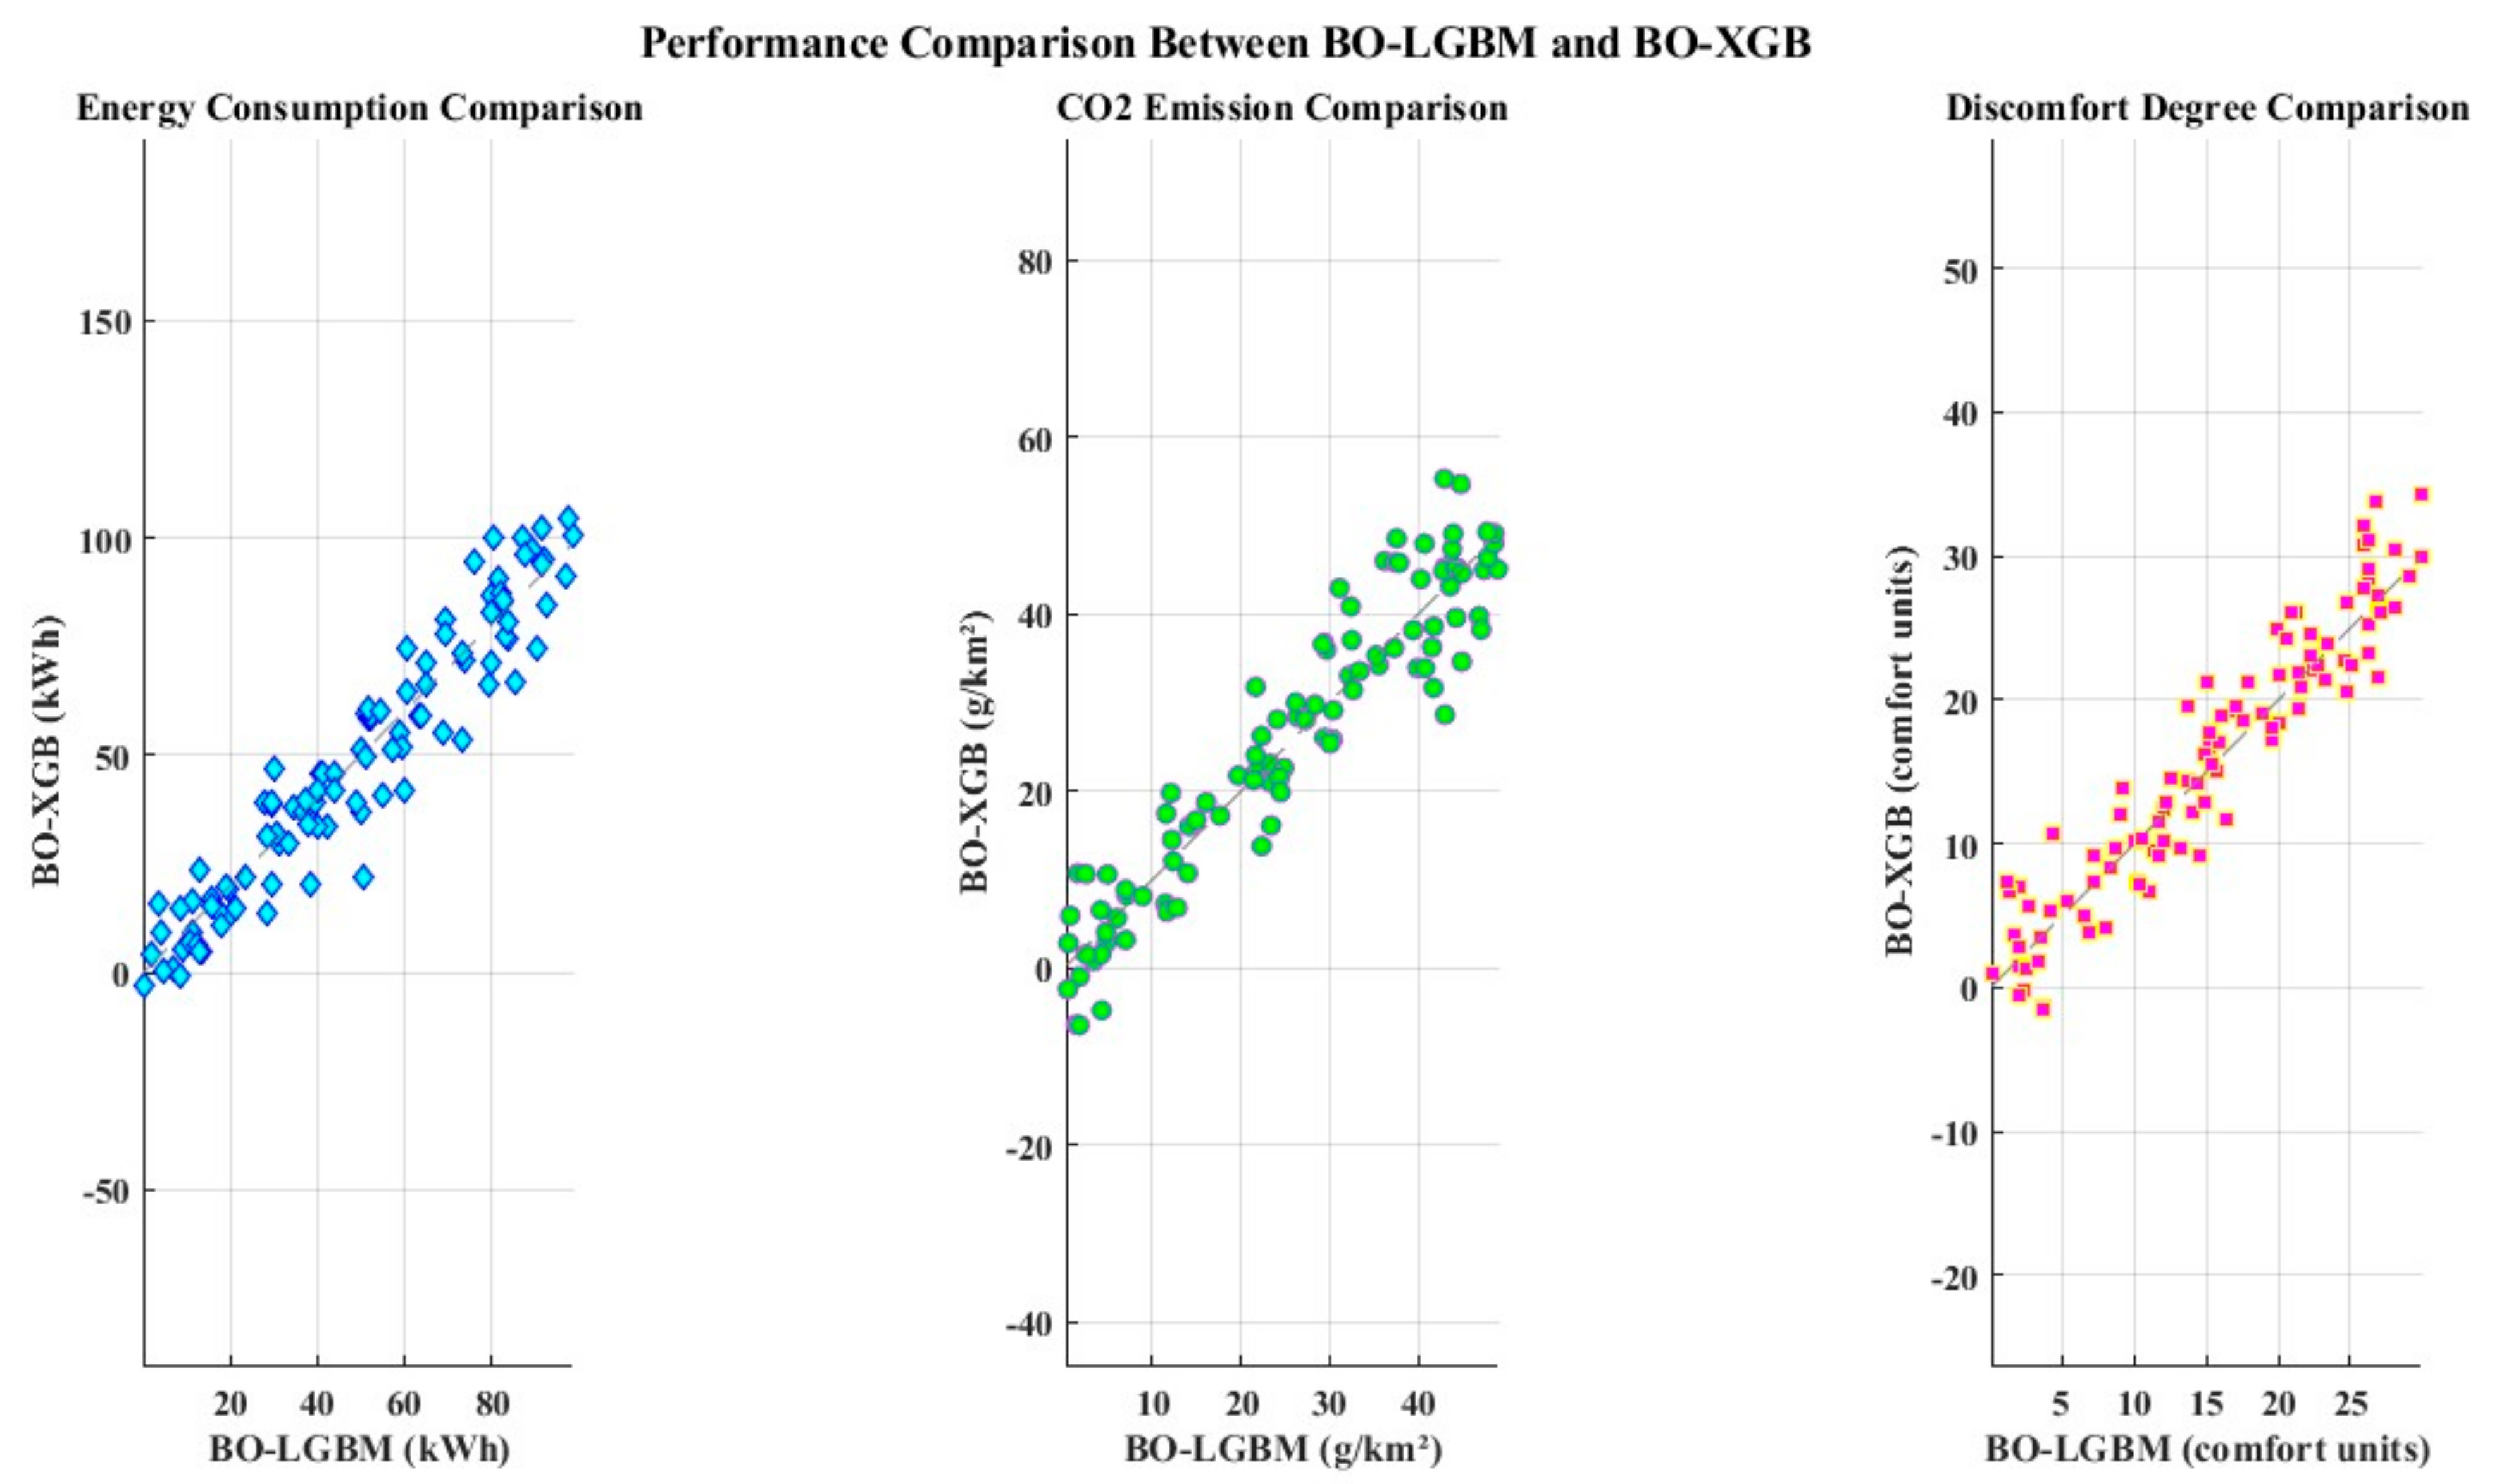
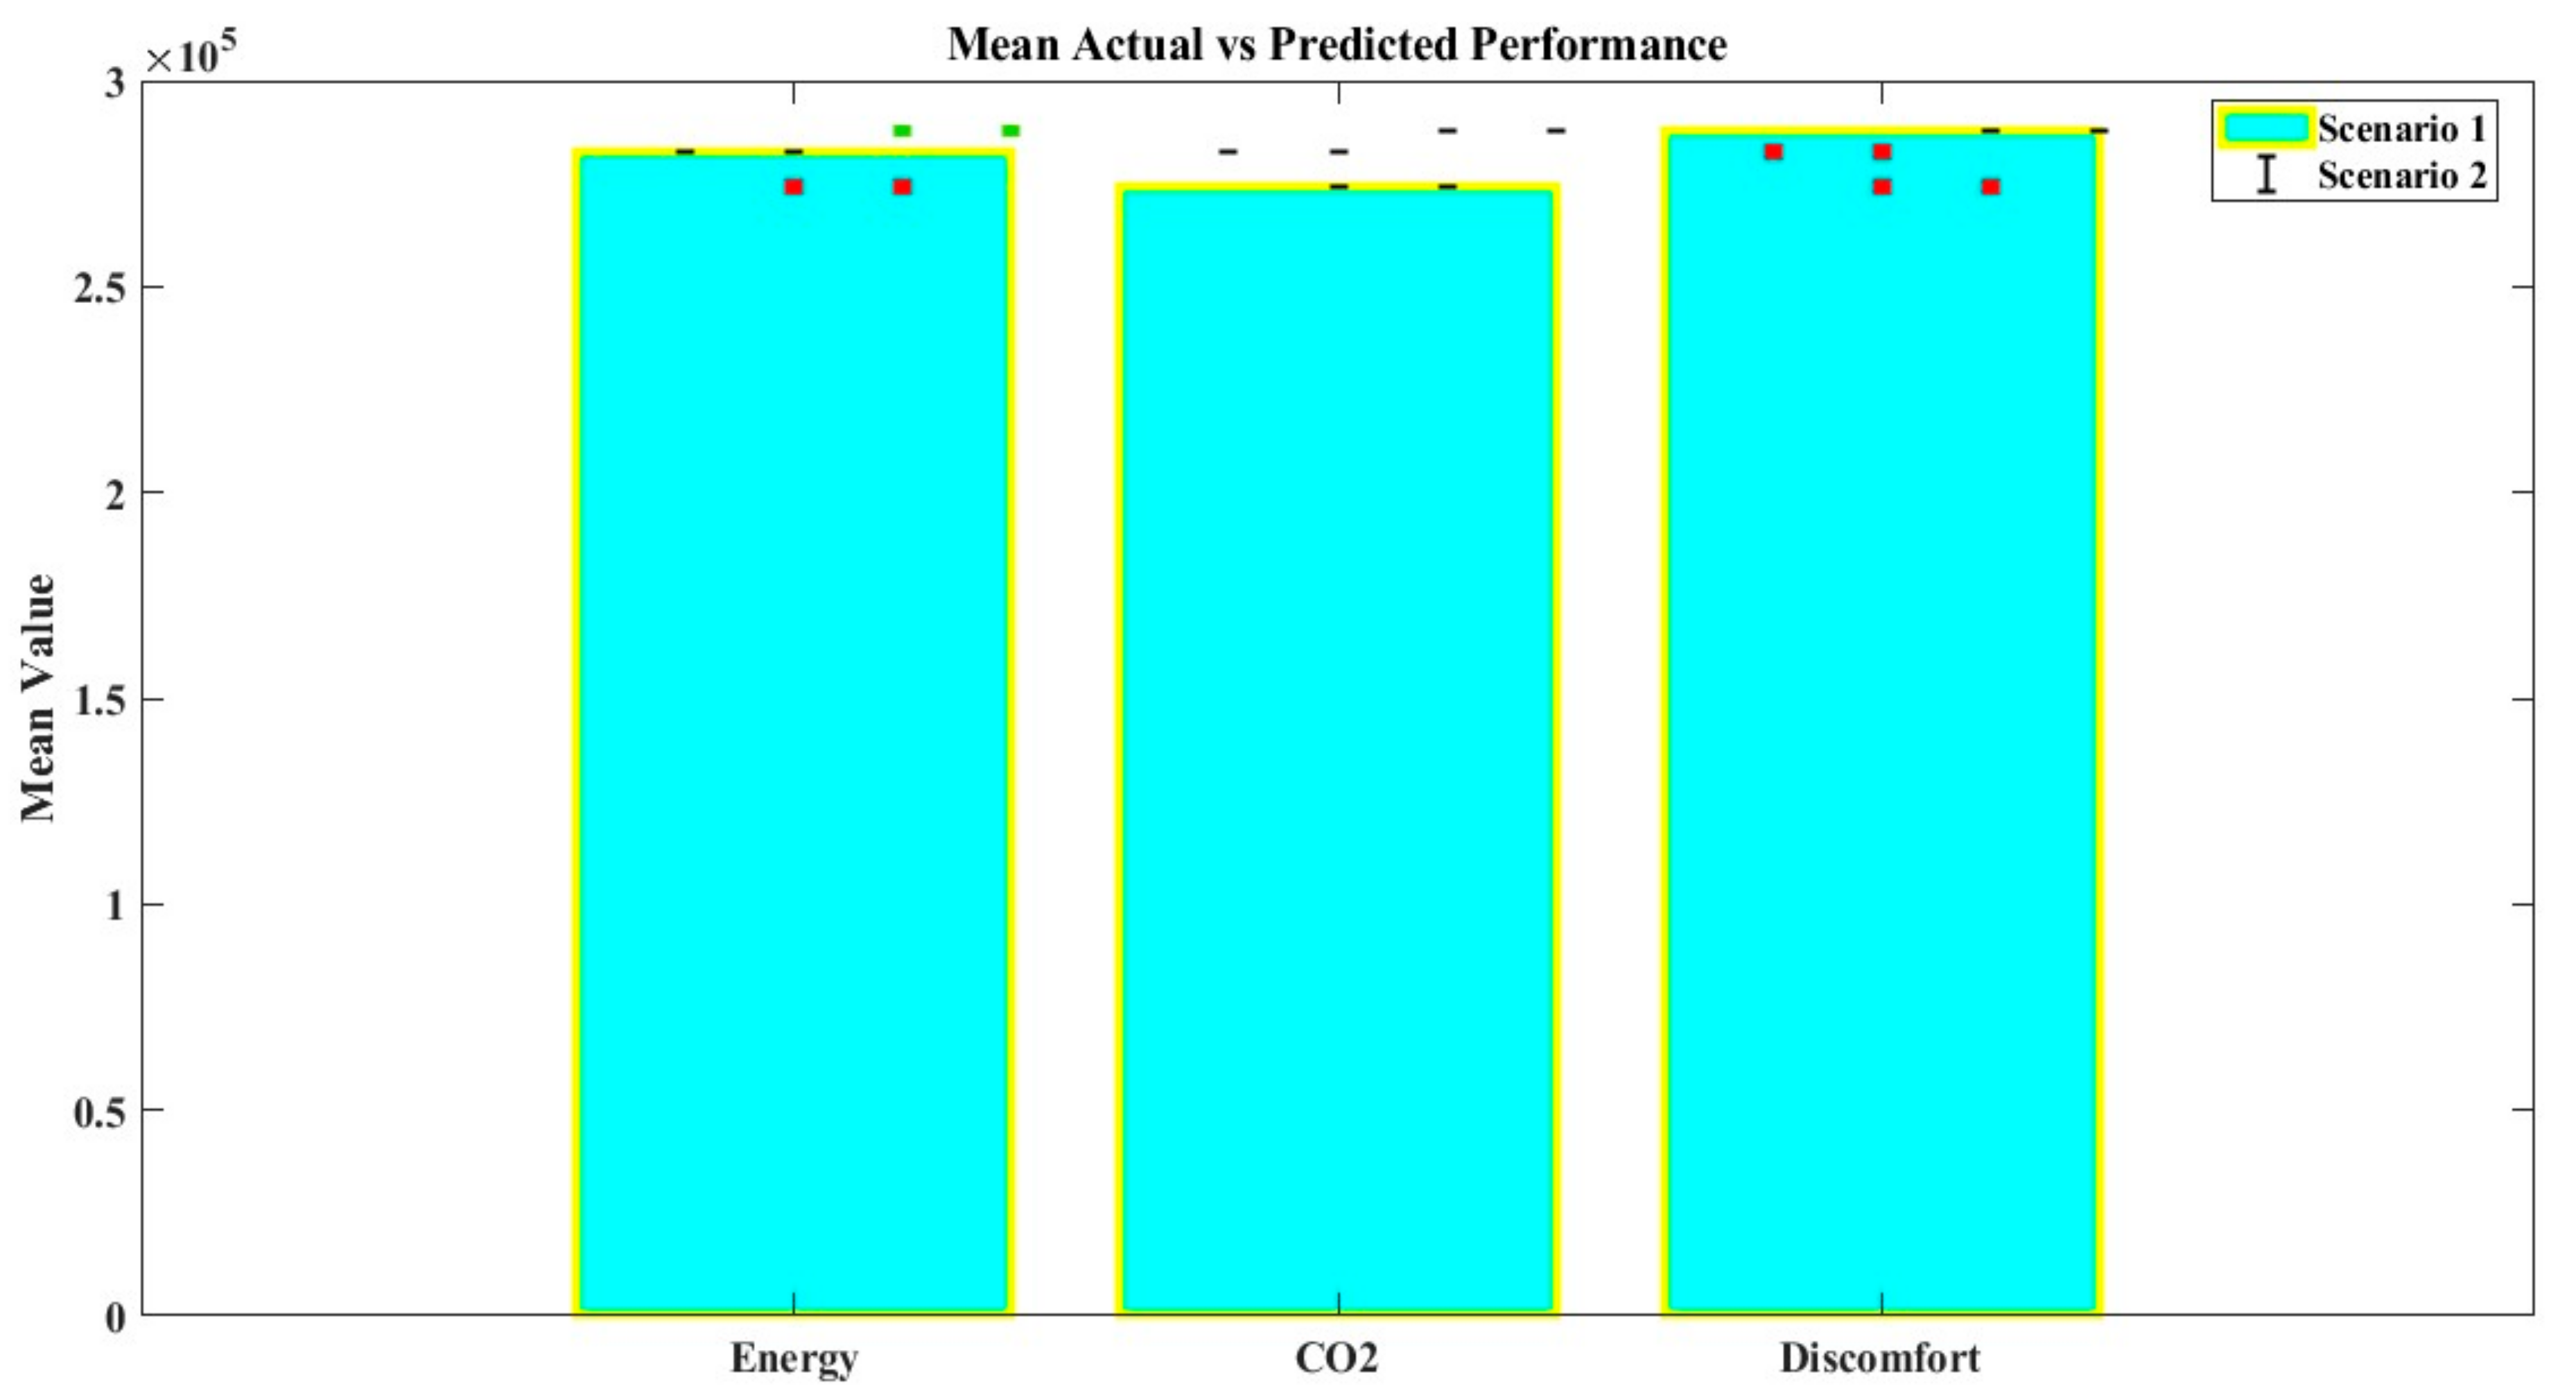

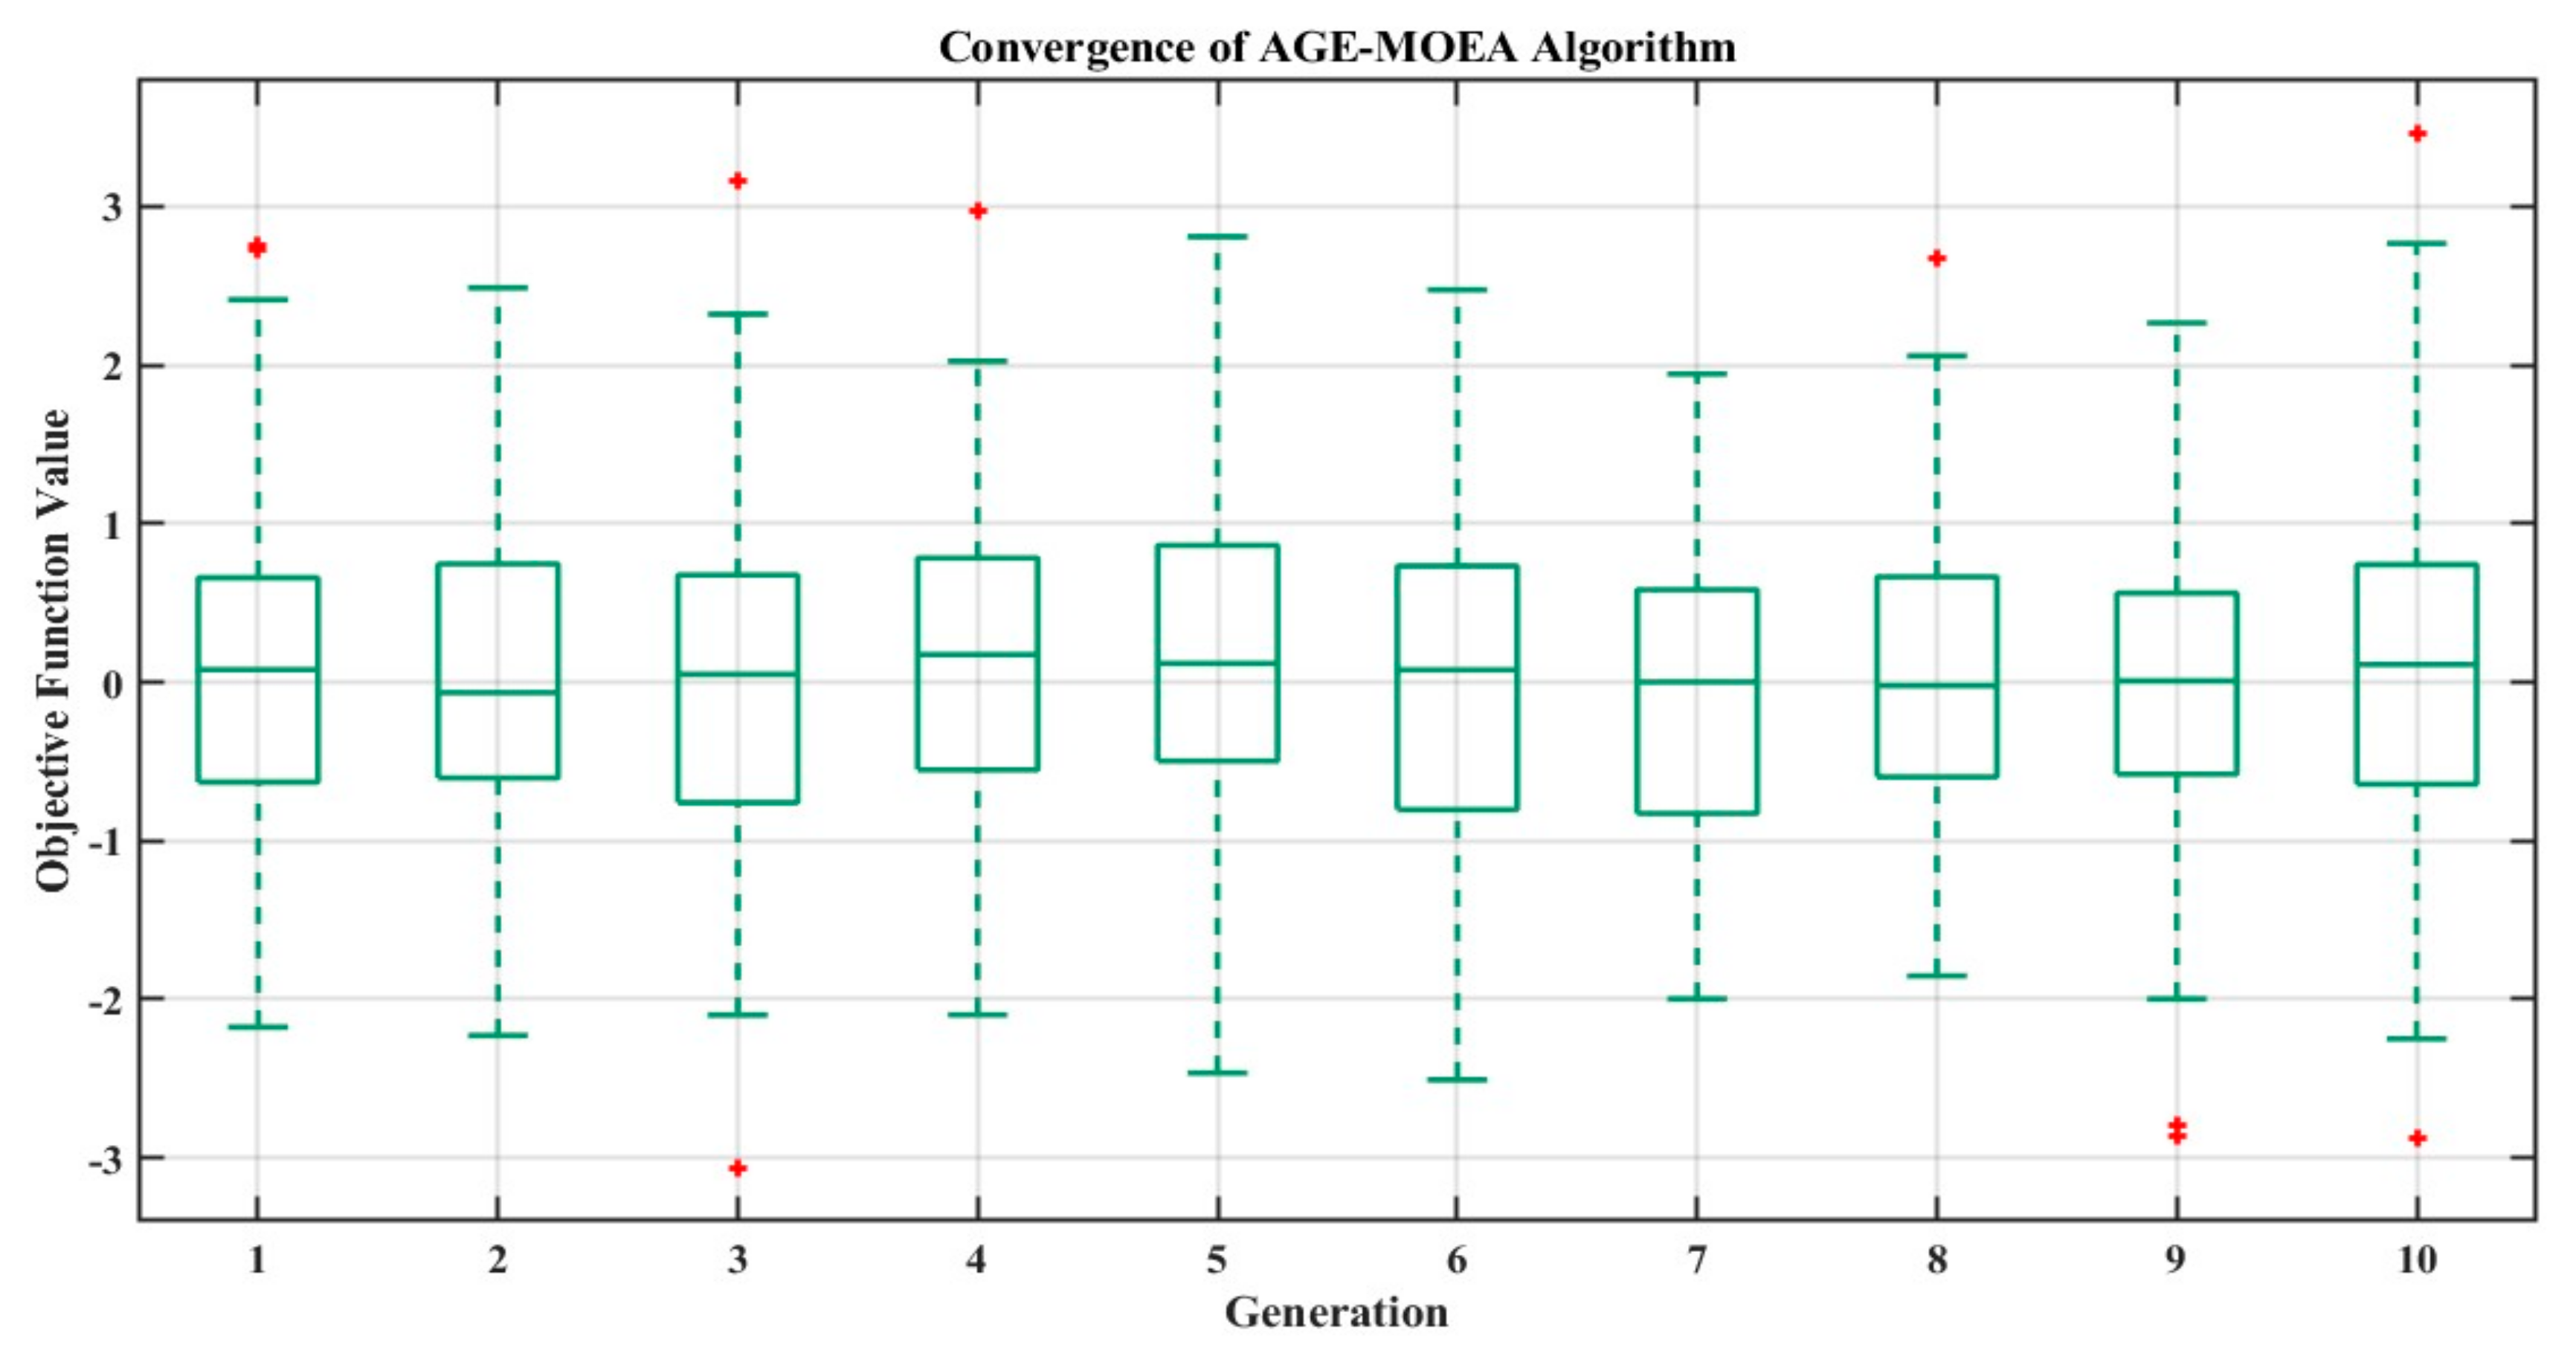
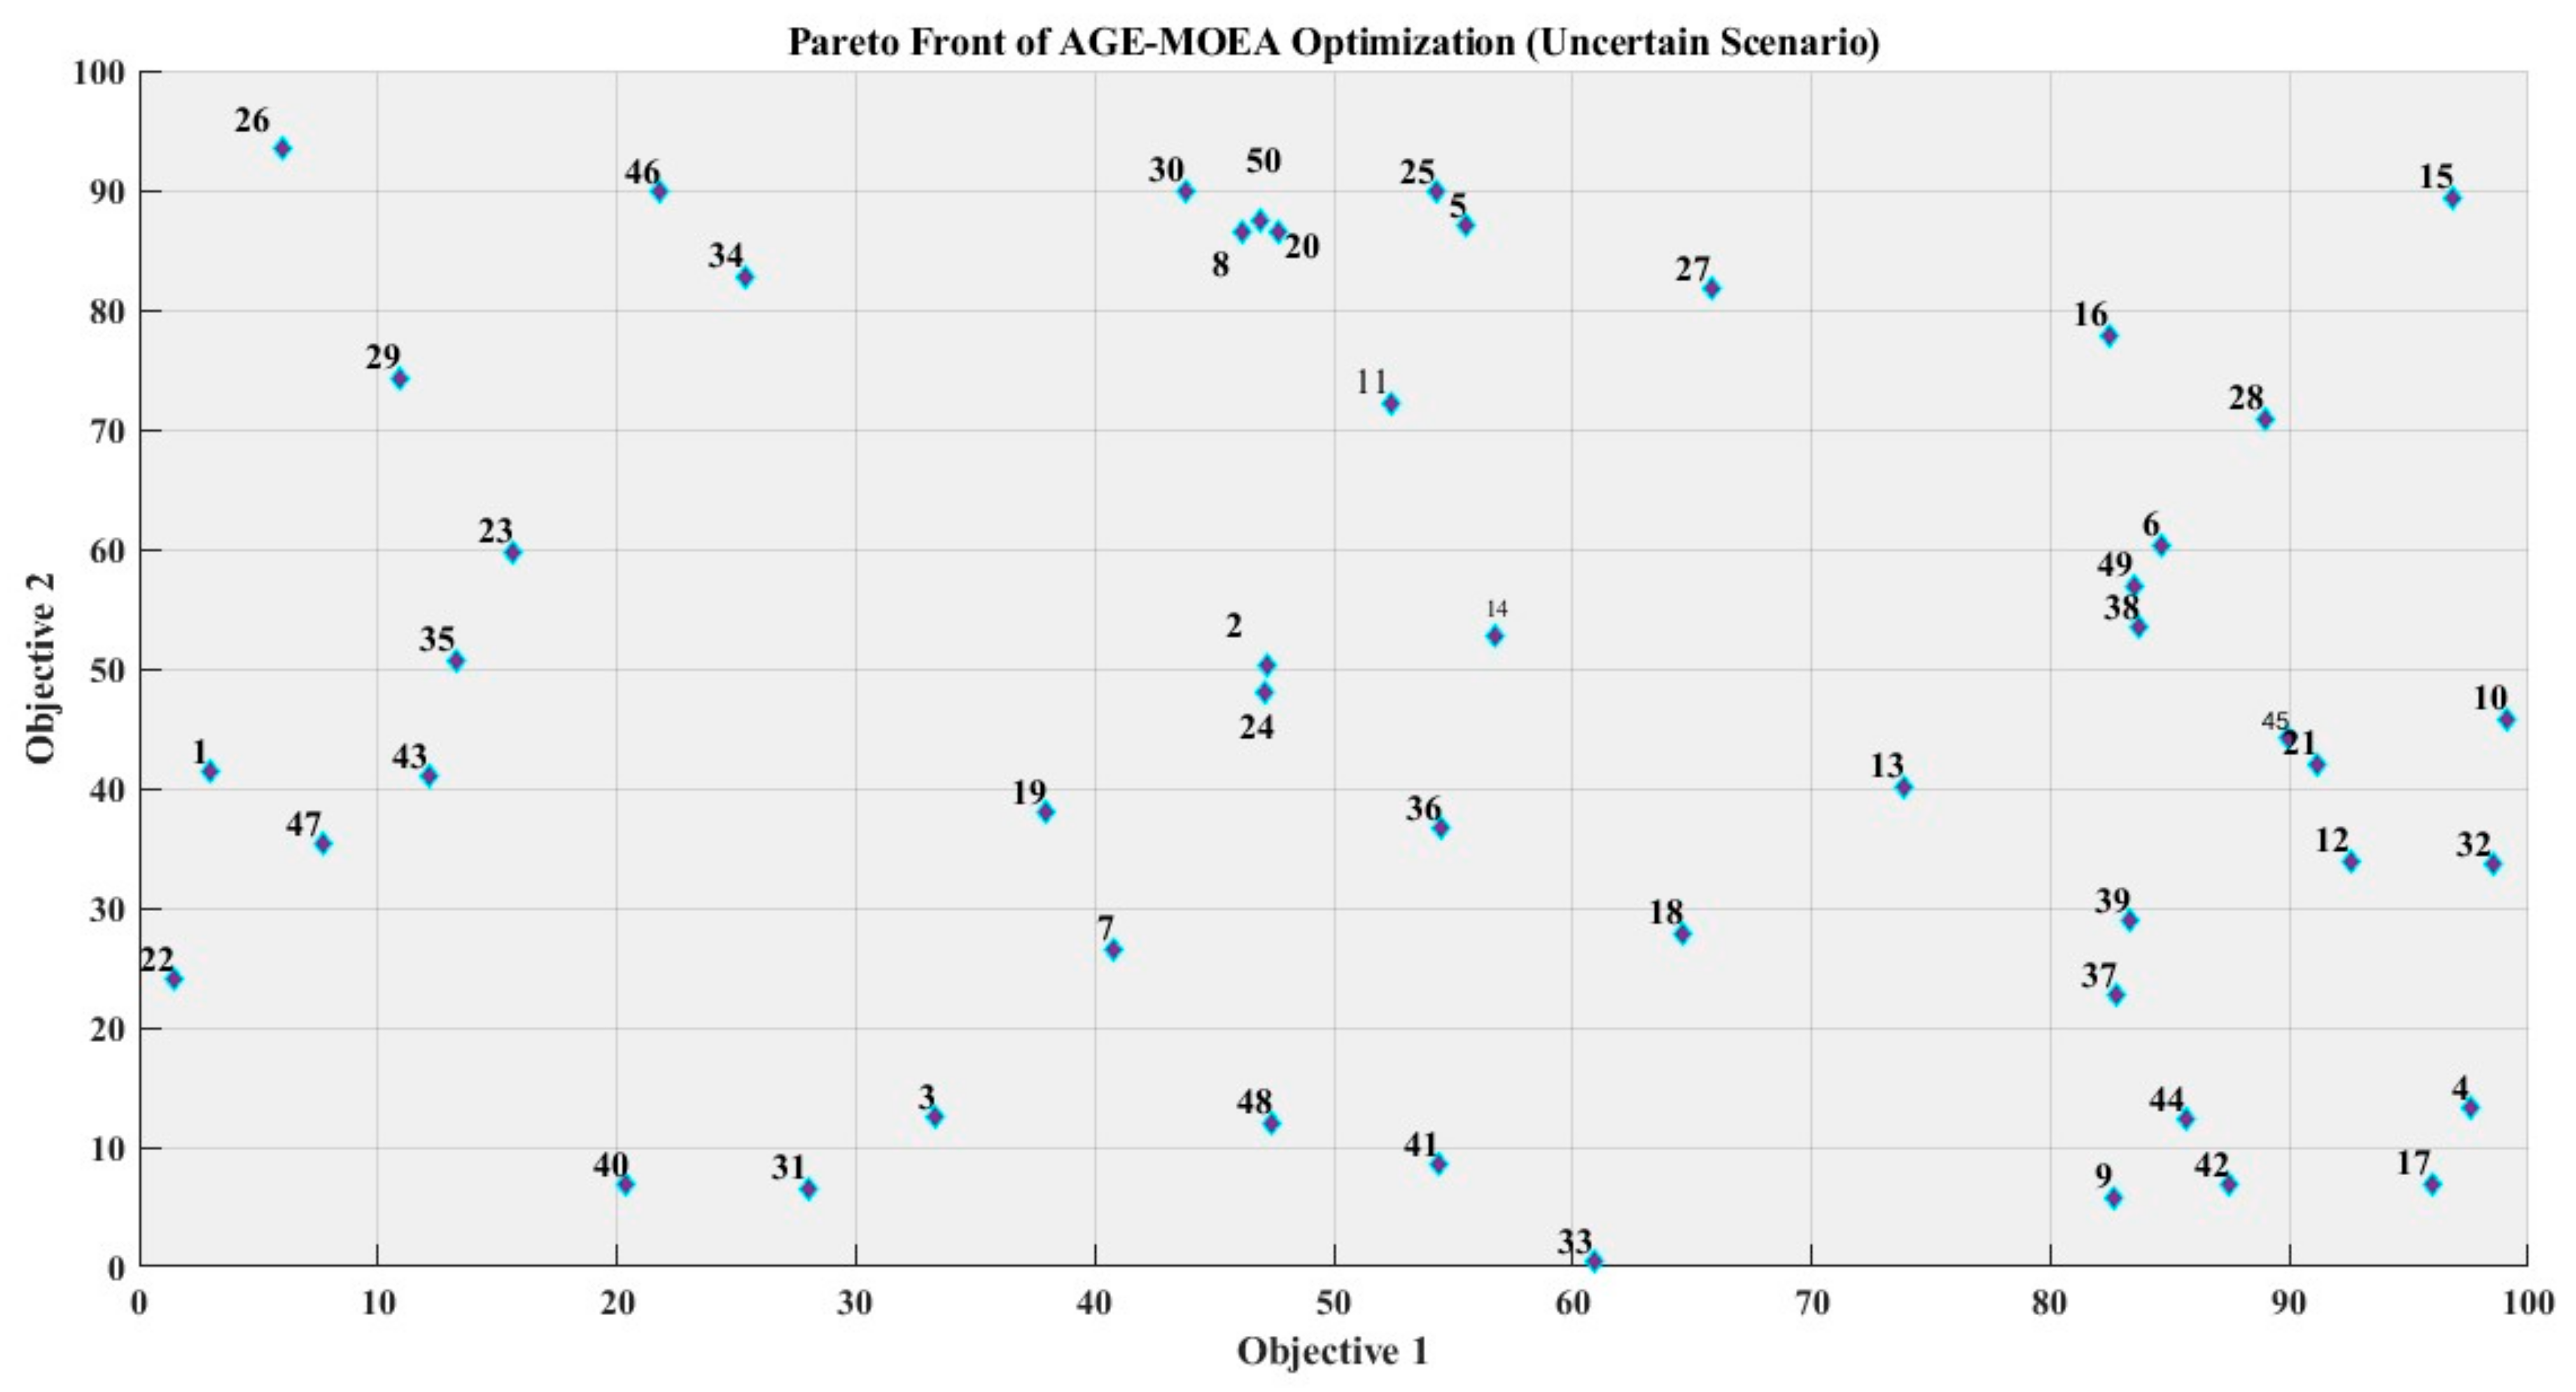

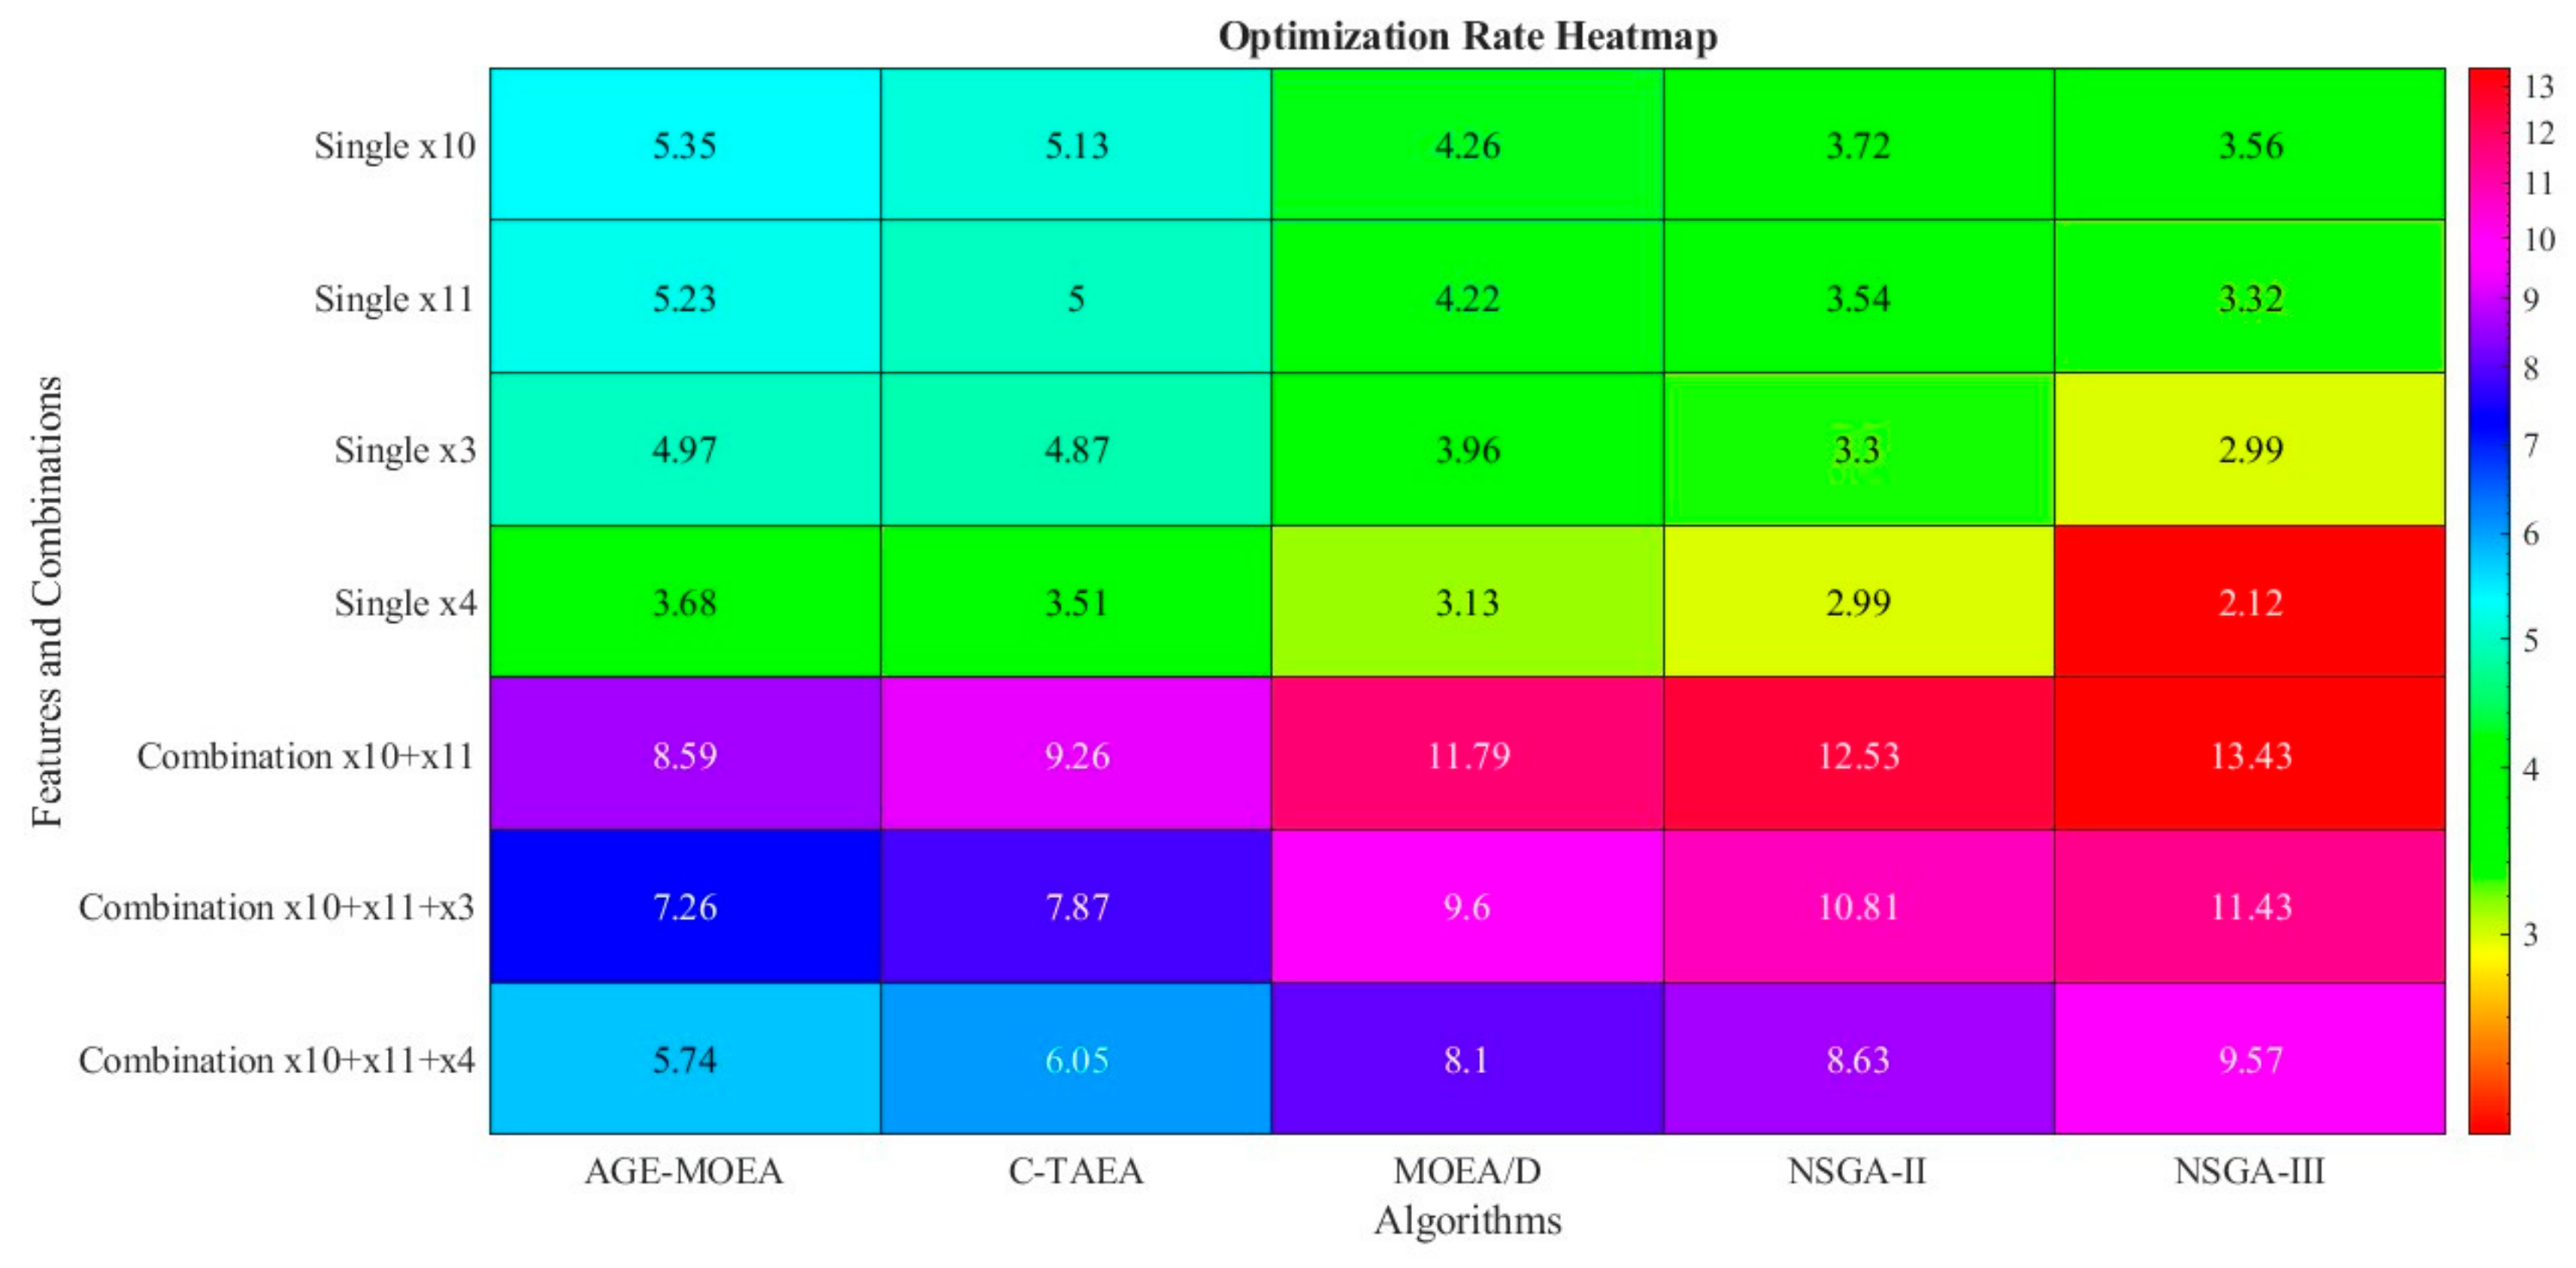
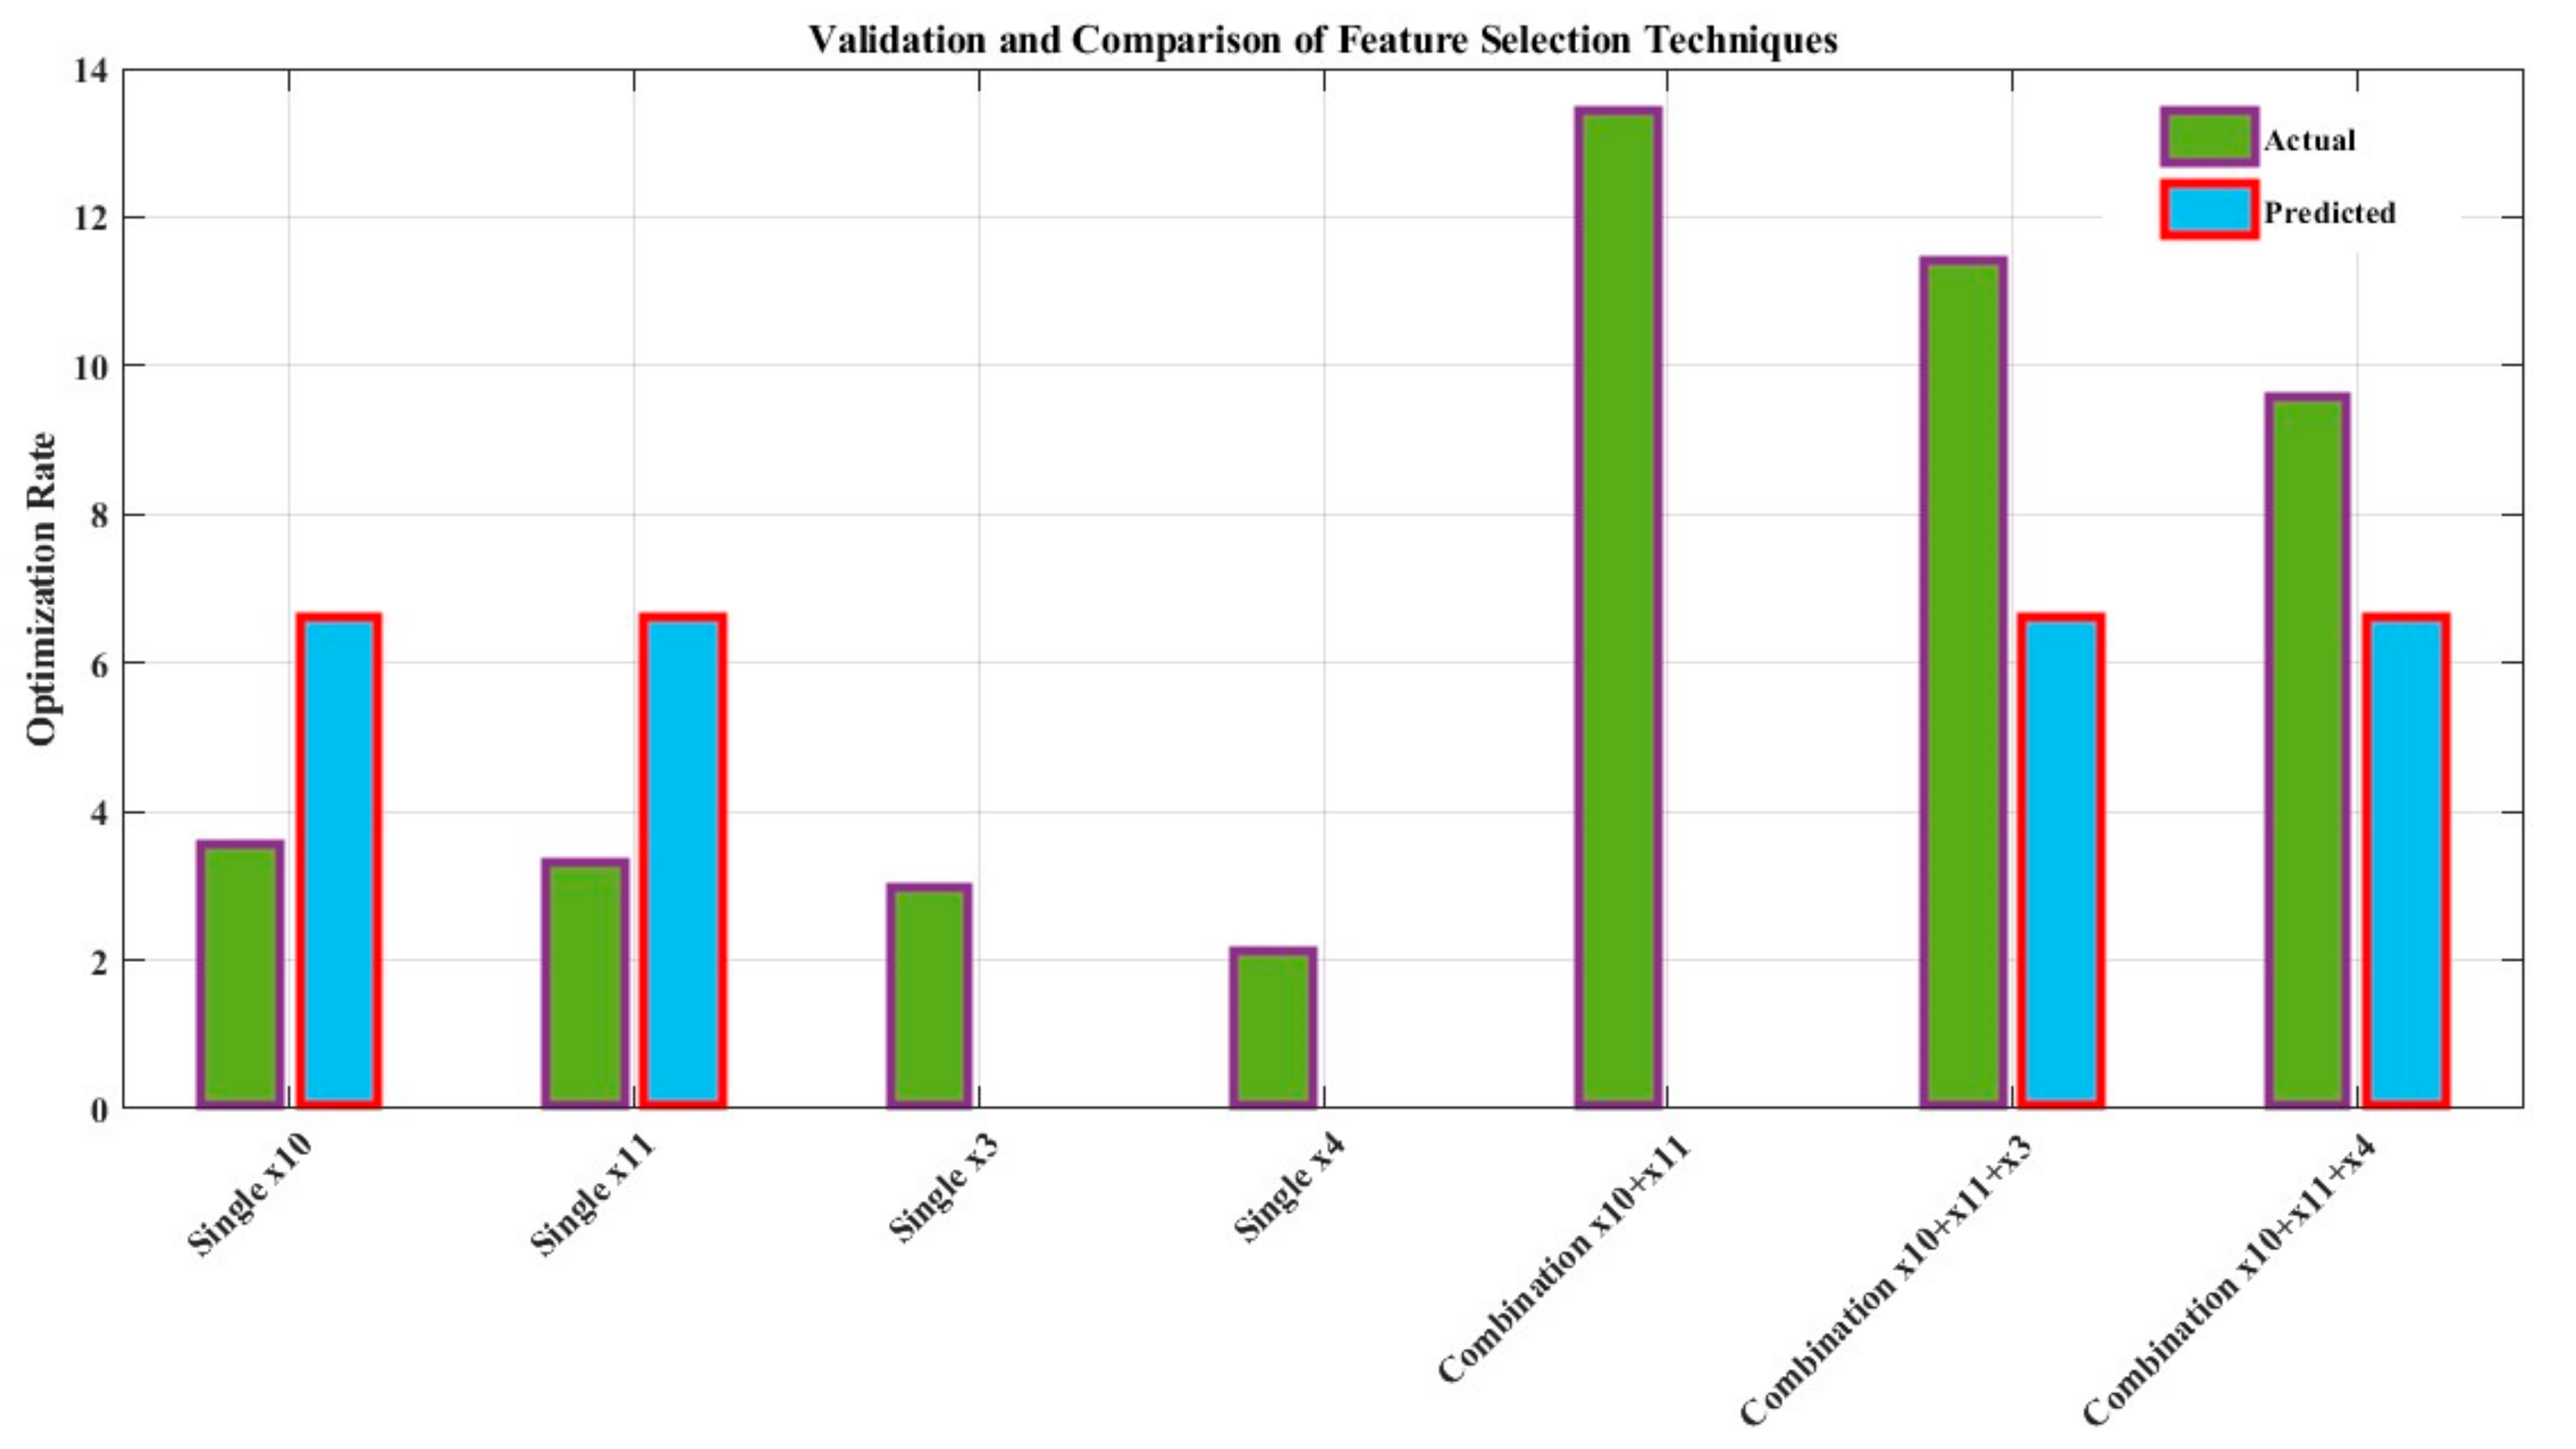
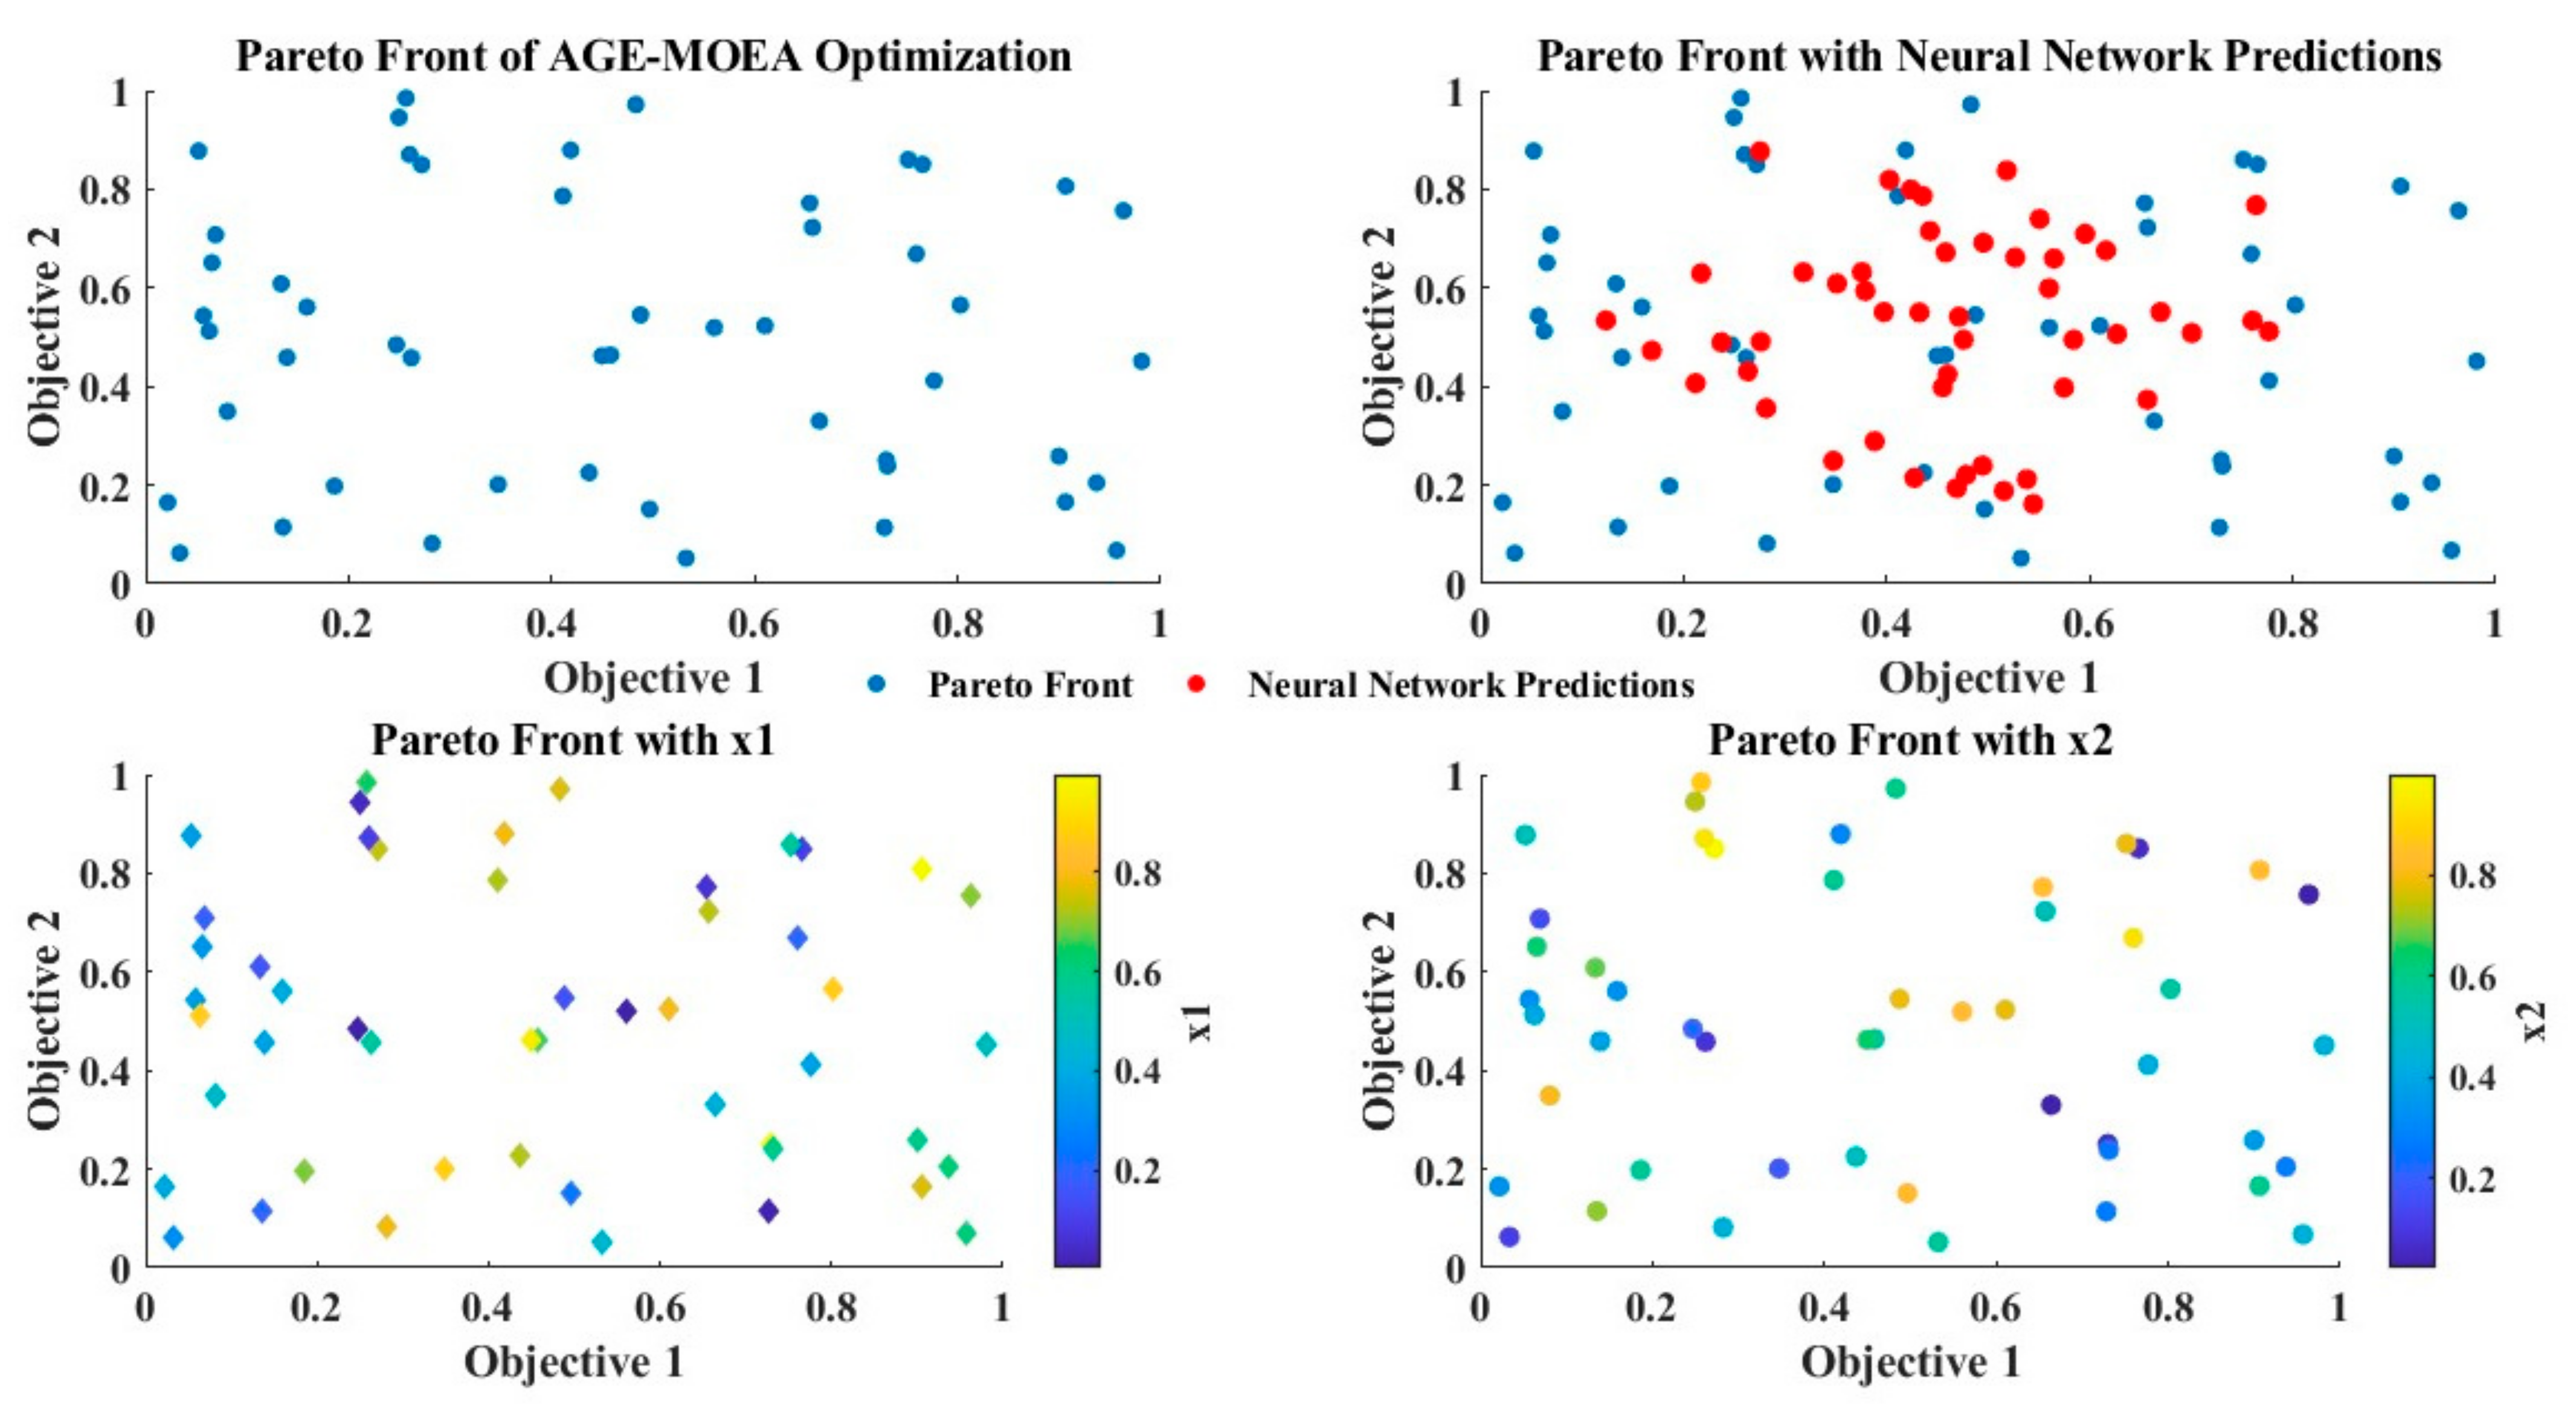
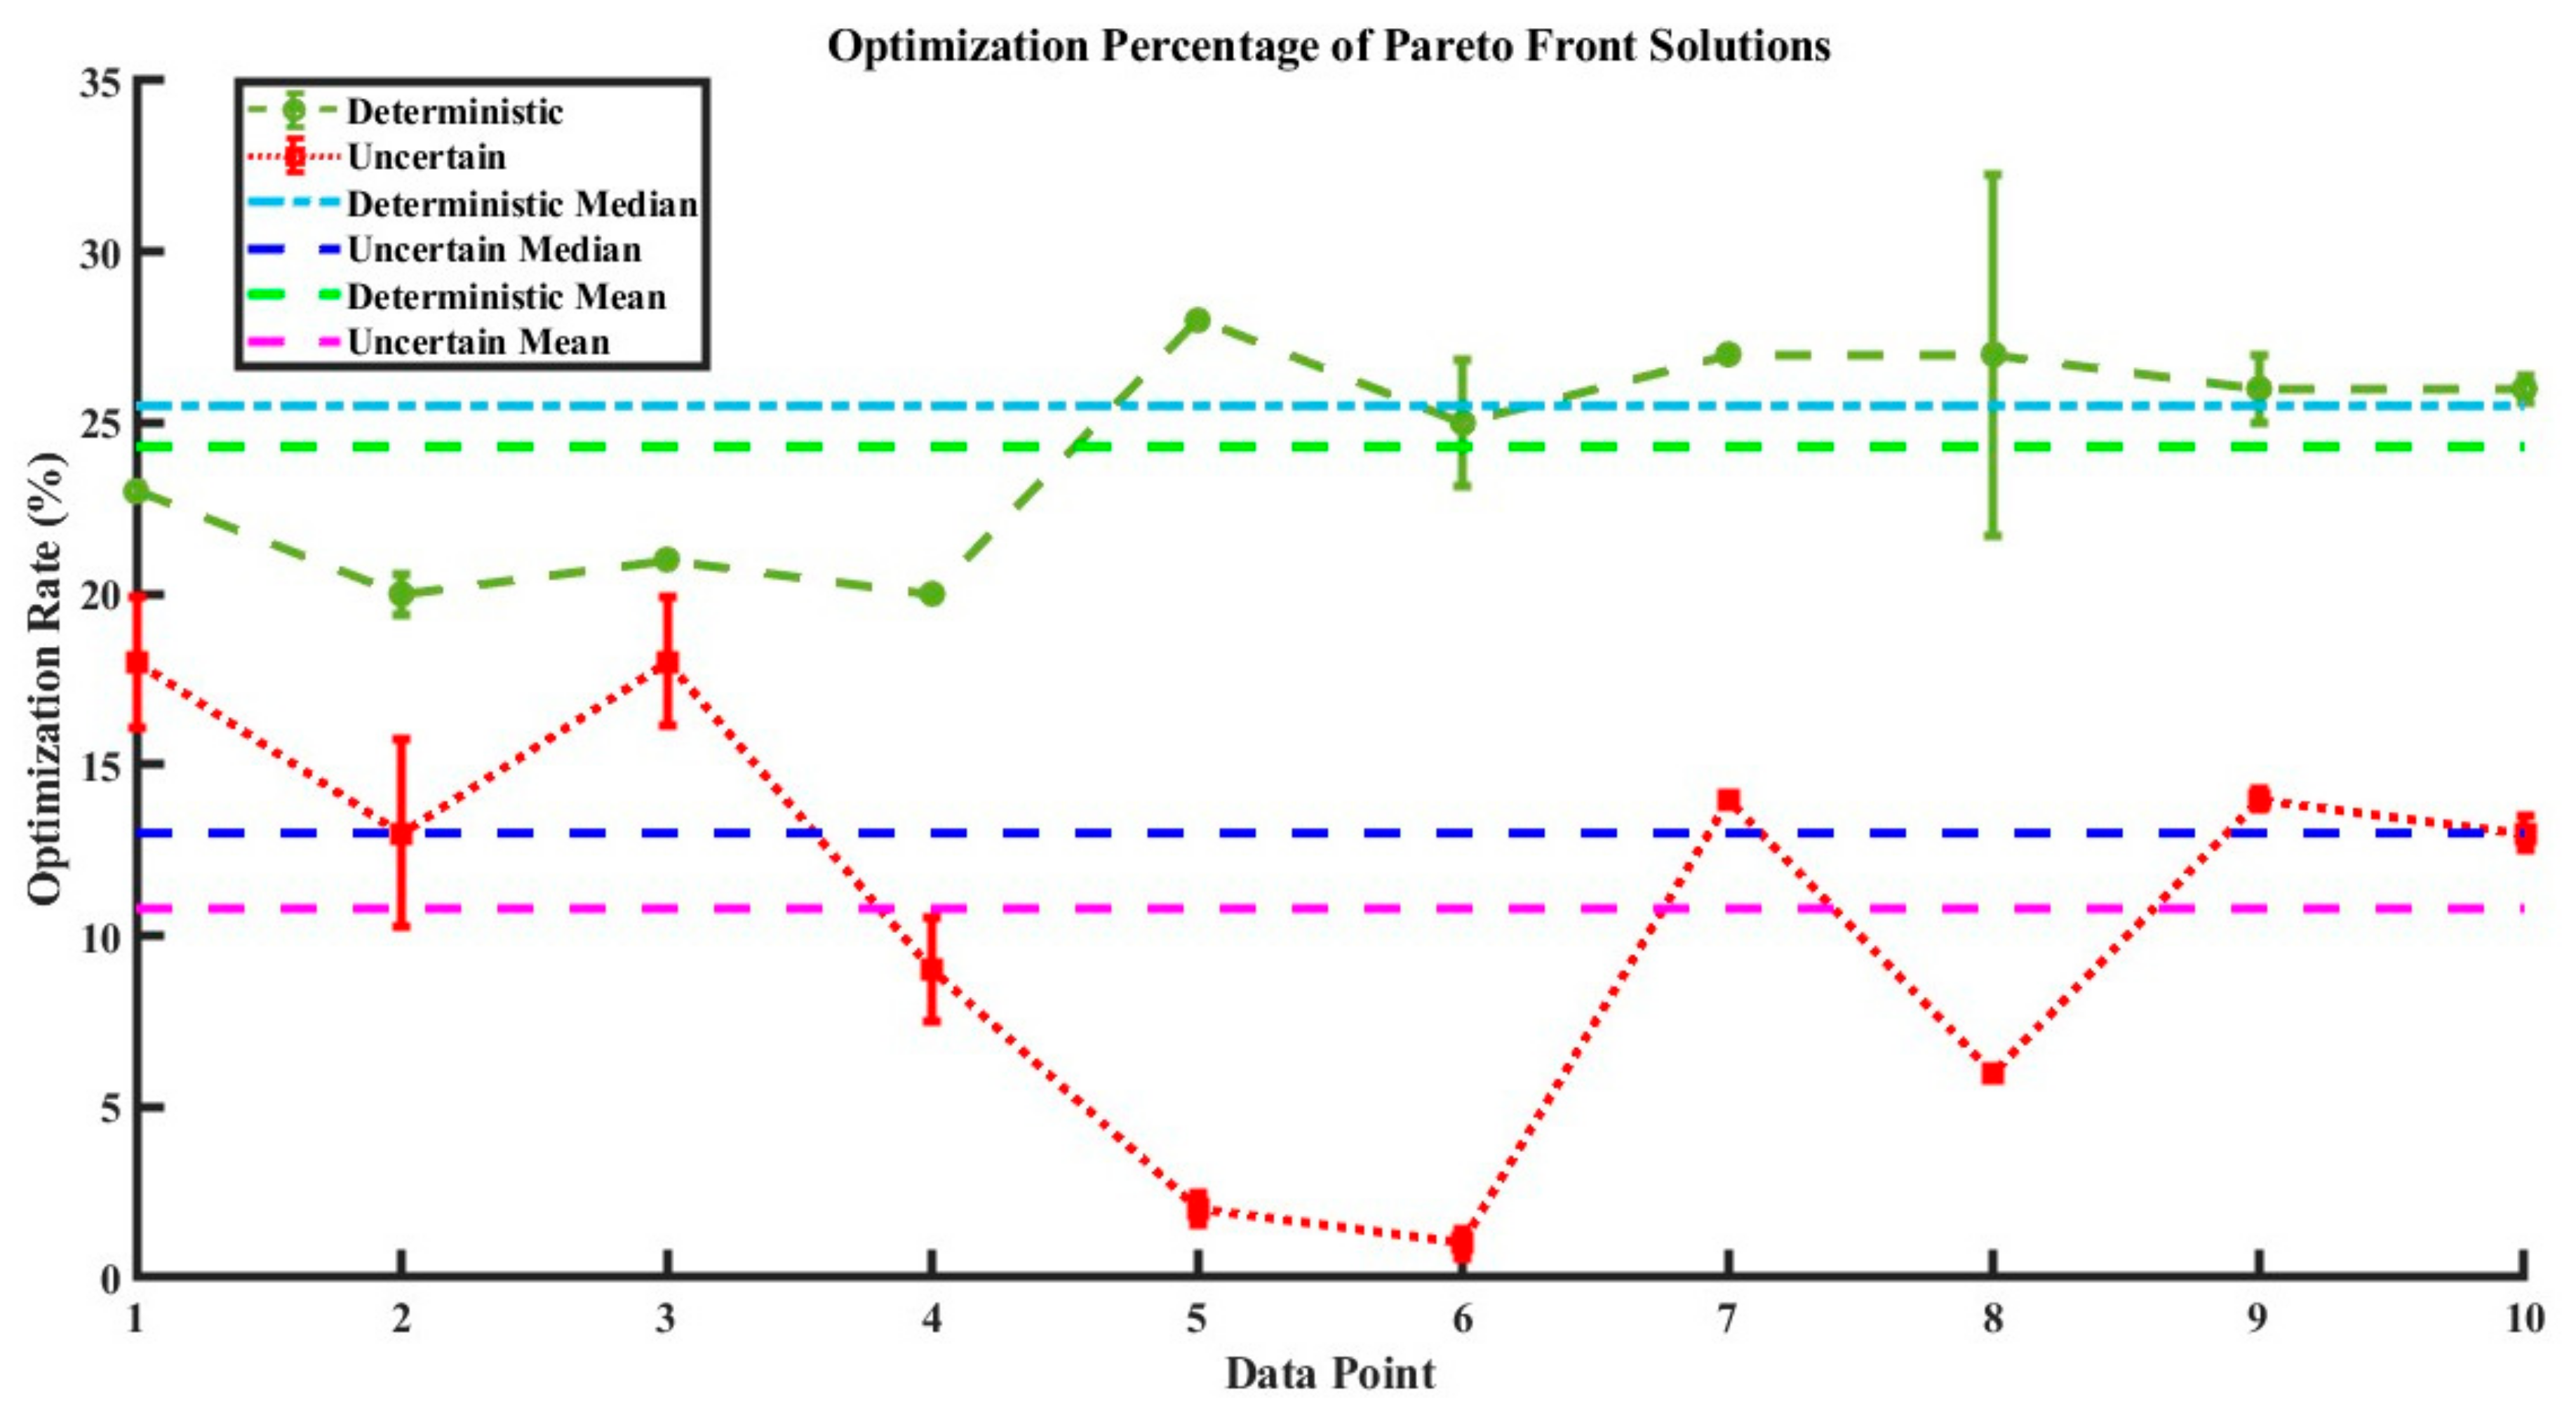
Disclaimer/Publisher’s Note: The statements, opinions and data contained in all publications are solely those of the individual author(s) and contributor(s) and not of MDPI and/or the editor(s). MDPI and/or the editor(s) disclaim responsibility for any injury to people or property resulting from any ideas, methods, instructions or products referred to in the content. |
© 2024 by the authors. Licensee MDPI, Basel, Switzerland. This article is an open access article distributed under the terms and conditions of the Creative Commons Attribution (CC BY) license (https://creativecommons.org/licenses/by/4.0/).