Abstract
This article presents the possibilities of using mining waste from hard coal mines in flood and road embankments. For this reason, the management of mining waste is a very important issue. It was proposed to use mining waste to build flood embankments that also serve as a road. The results of research and numerical analyses using the Finite Element Method (FEM) are presented for the example of mining waste from the Sobieski Mining Plant. The results of testing the physical and mechanical properties of the waste, waste with the addition of 8% Portland cement and waste with the addition of 8% metallurgical cement are presented. The results of laboratory tests showed better physical and mechanical properties for mining waste with the addition of metallurgical cement. The results of the numerical analyses showed that no flood embankment built of mining waste alone retained the required stability coefficient according to Polish requirements (FoS > 1.3) at the highest flood wave. The best result is achieved by the flood embankment in the variant—the road being on the side of the air slope, built from mining waste with the addition of 8% metallurgical cement; this has the highest stability coefficient, both without a vehicle load (FoS = 1.72) and with a vehicle load (FoS = 1.67).
1. Introduction
Hard coal is the basic energy raw material in Poland, and Poland is a producer of electricity from coal. In the world, the largest producers of electricity from coal are China and India. In Poland, underground hard coal exploitation is always associated with the problem of mining waste. One of the largest heaps of mining waste in Poland is the heap known as the Szarlota heap in the town of Rydułtowy.
One way to solve the problem of waste storage is to use it for construction purposes. This article assesses the possibility of using cement-reinforced mining waste as a building material for earthworks. The assessment of the possibility of using mining waste was performed for a hypothetical flood embankment, where there is a road on the crest of the embankment. The analysis was conducted using Finite Element Method (FEM) numerical modelling. The parameters of the waste material collected from the Sobieski Mining Plant in Poland were determined in detailed laboratory tests.
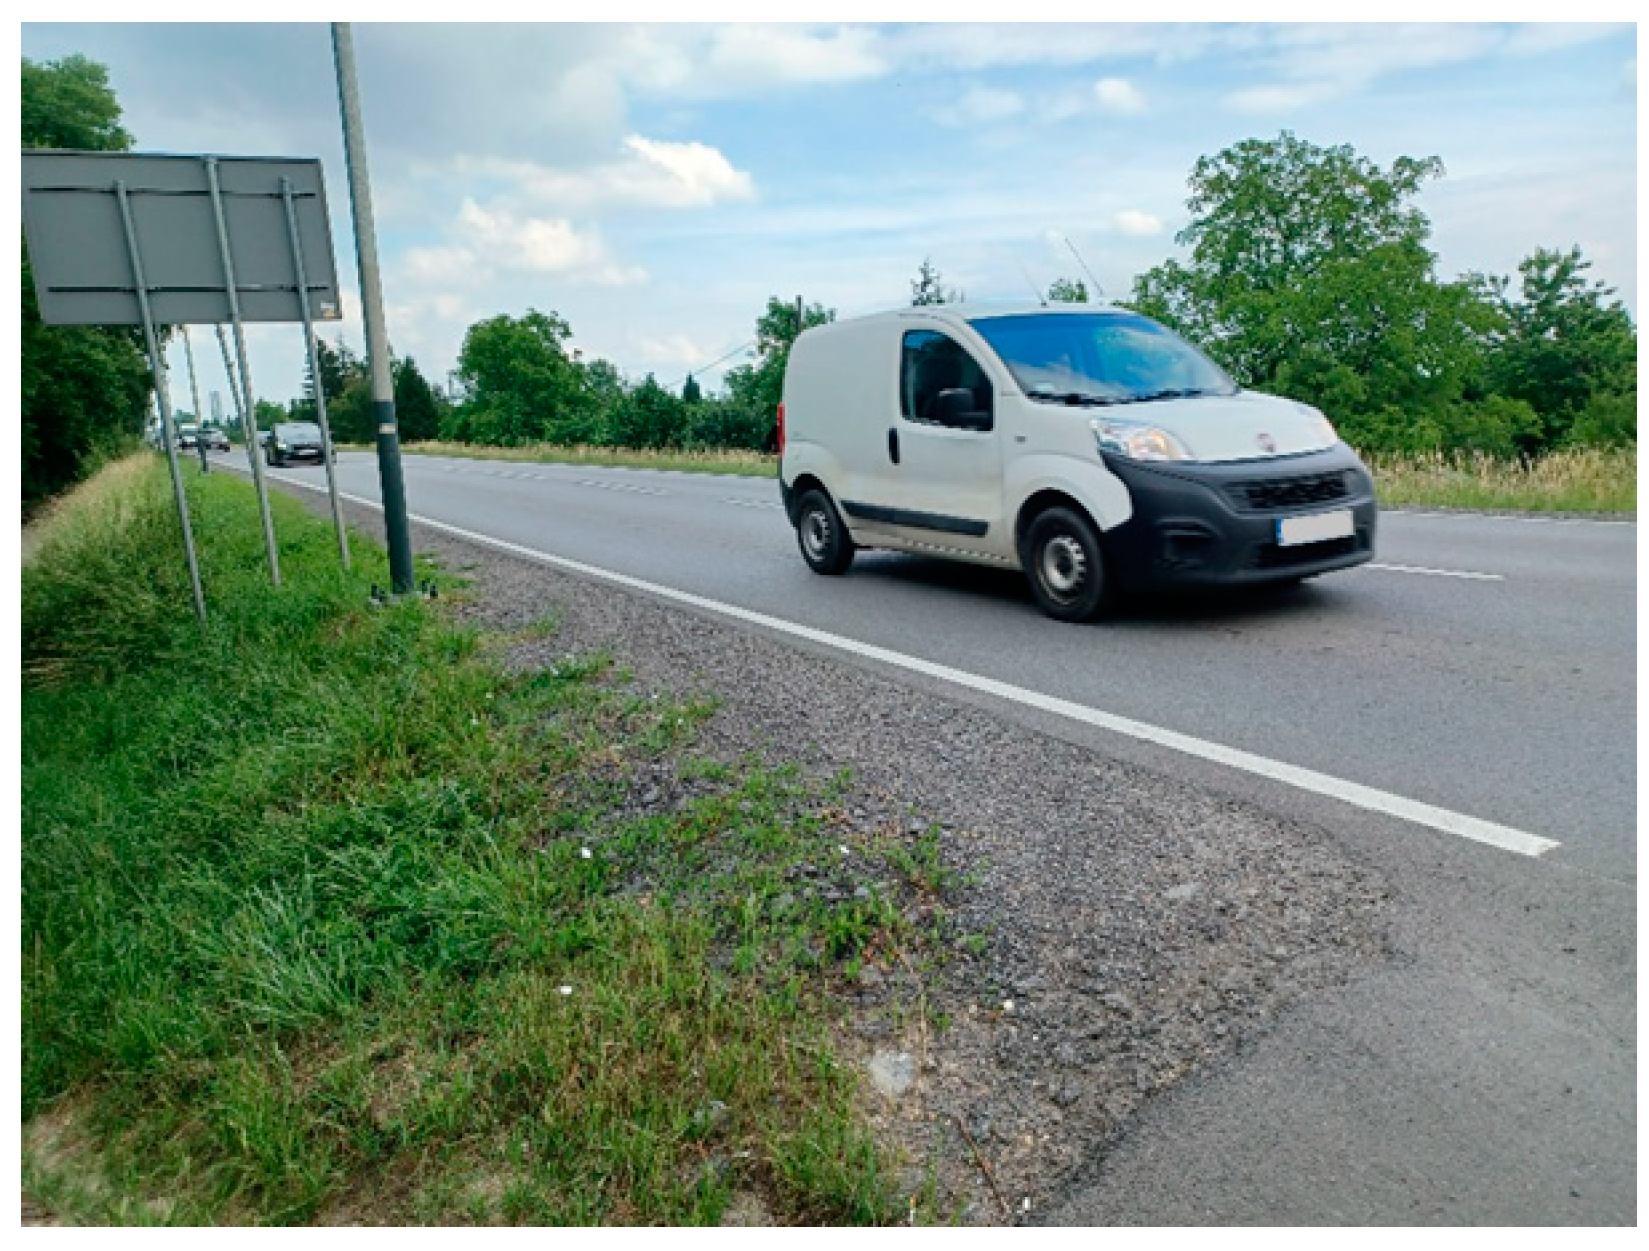
Flood embankments are sometimes used as roadways or railways. This is practised in many countries such as China [1,2], Belgium, the Netherlands and the United States [3]. In Poland, there are also examples of roads located on embankments, including Wał Międzeszyński in Warsaw or ul. Podbięty in Cracow and (Figure 1).
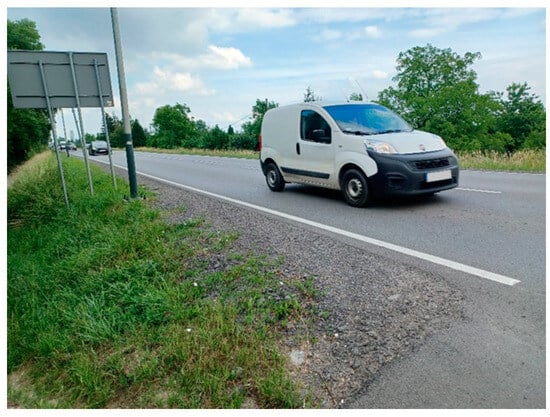
Figure 1.
An example of a road on a flood embankment in Cracow (photo: Pilecka).
Such a solution is sometimes necessary to provide access to private properties or workplaces, particularly as an emergency route for emergency vehicles. The ability to quickly move emergency vehicles guarantees the safety of residents. In particular, the problem of the inability to move around the centres of large cities due to the large number of cars encourages city governments to become interested in the possibilities of using flood embankments as roads.
The pressure of transport development also encourages the development of flood embankments, which is the reason for an increasing number of research works on the possibility of designing expressways and high-speed railways on flood embankments [4].
In Poland, mining waste from the mines of the Upper Silesian Coal Basin (GZW) has been used for many years to build flood embankments [5,6,7,8,9]. Research is also being carried out on the use of mining waste for the construction of road embankments [10,11,12,13]. The reason for using mining waste is its low price and ecological impact. Due to the need for materials with low water permeability, mining waste with a grain size of up to 2 mm from the Sobieski Mining Plant (eastern region of GZW) was used for research. The novelty in the presented research results is the use of mining waste from a Polish mine for the construction of flood embankments that can also serve as roads, using the example of mining waste from ZG Sobieski. Laboratory tests and numerical analyses were carried out.
Based on a randomly selected sample of 438 geotechnical sections from the documentation of a five-year assessment of the technical condition of flood embankments, it was identified what percentage of embankments had mining waste embedded in them. The analysis showed that mining waste was used to build embankments in 26% of the entire sample [14].
The thickness of the mining waste layers in the tested sample usually ranged from 1.5 to 4.0 m (Figure 2). In sixteen cases, the embankment bodies are made entirely of mining waste.
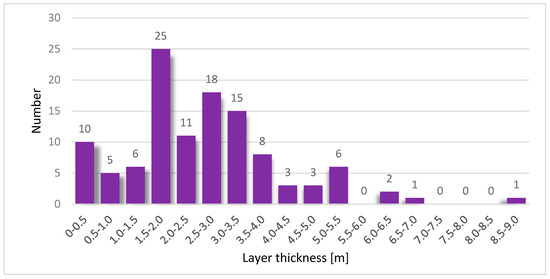
Figure 2.
The thickness of mining waste layers in the embankment body for 438 geotechnical sections in the province. Lesser Poland [15].
River embankments are the basic form of flood protection. For flood embankments in Poland, there is a ban on vehicles and horse riding along the embankment crown, which is included in Art. 176 Section 1 [16]. The above prohibition may be lifted on specific sections of flood embankments by the authority of Polish Waters, when vehicle traffic does not affect the tightness and stability of the embankments—Art. 176 Section 4 [16]. As practice shows, this provision is often used. Currently, efforts are being made to use flood embankments as bicycle paths, emergency vehicle paths and roads to shorten travel time.
2. Characteristics of Mining Waste and Laboratory Testing Methodology
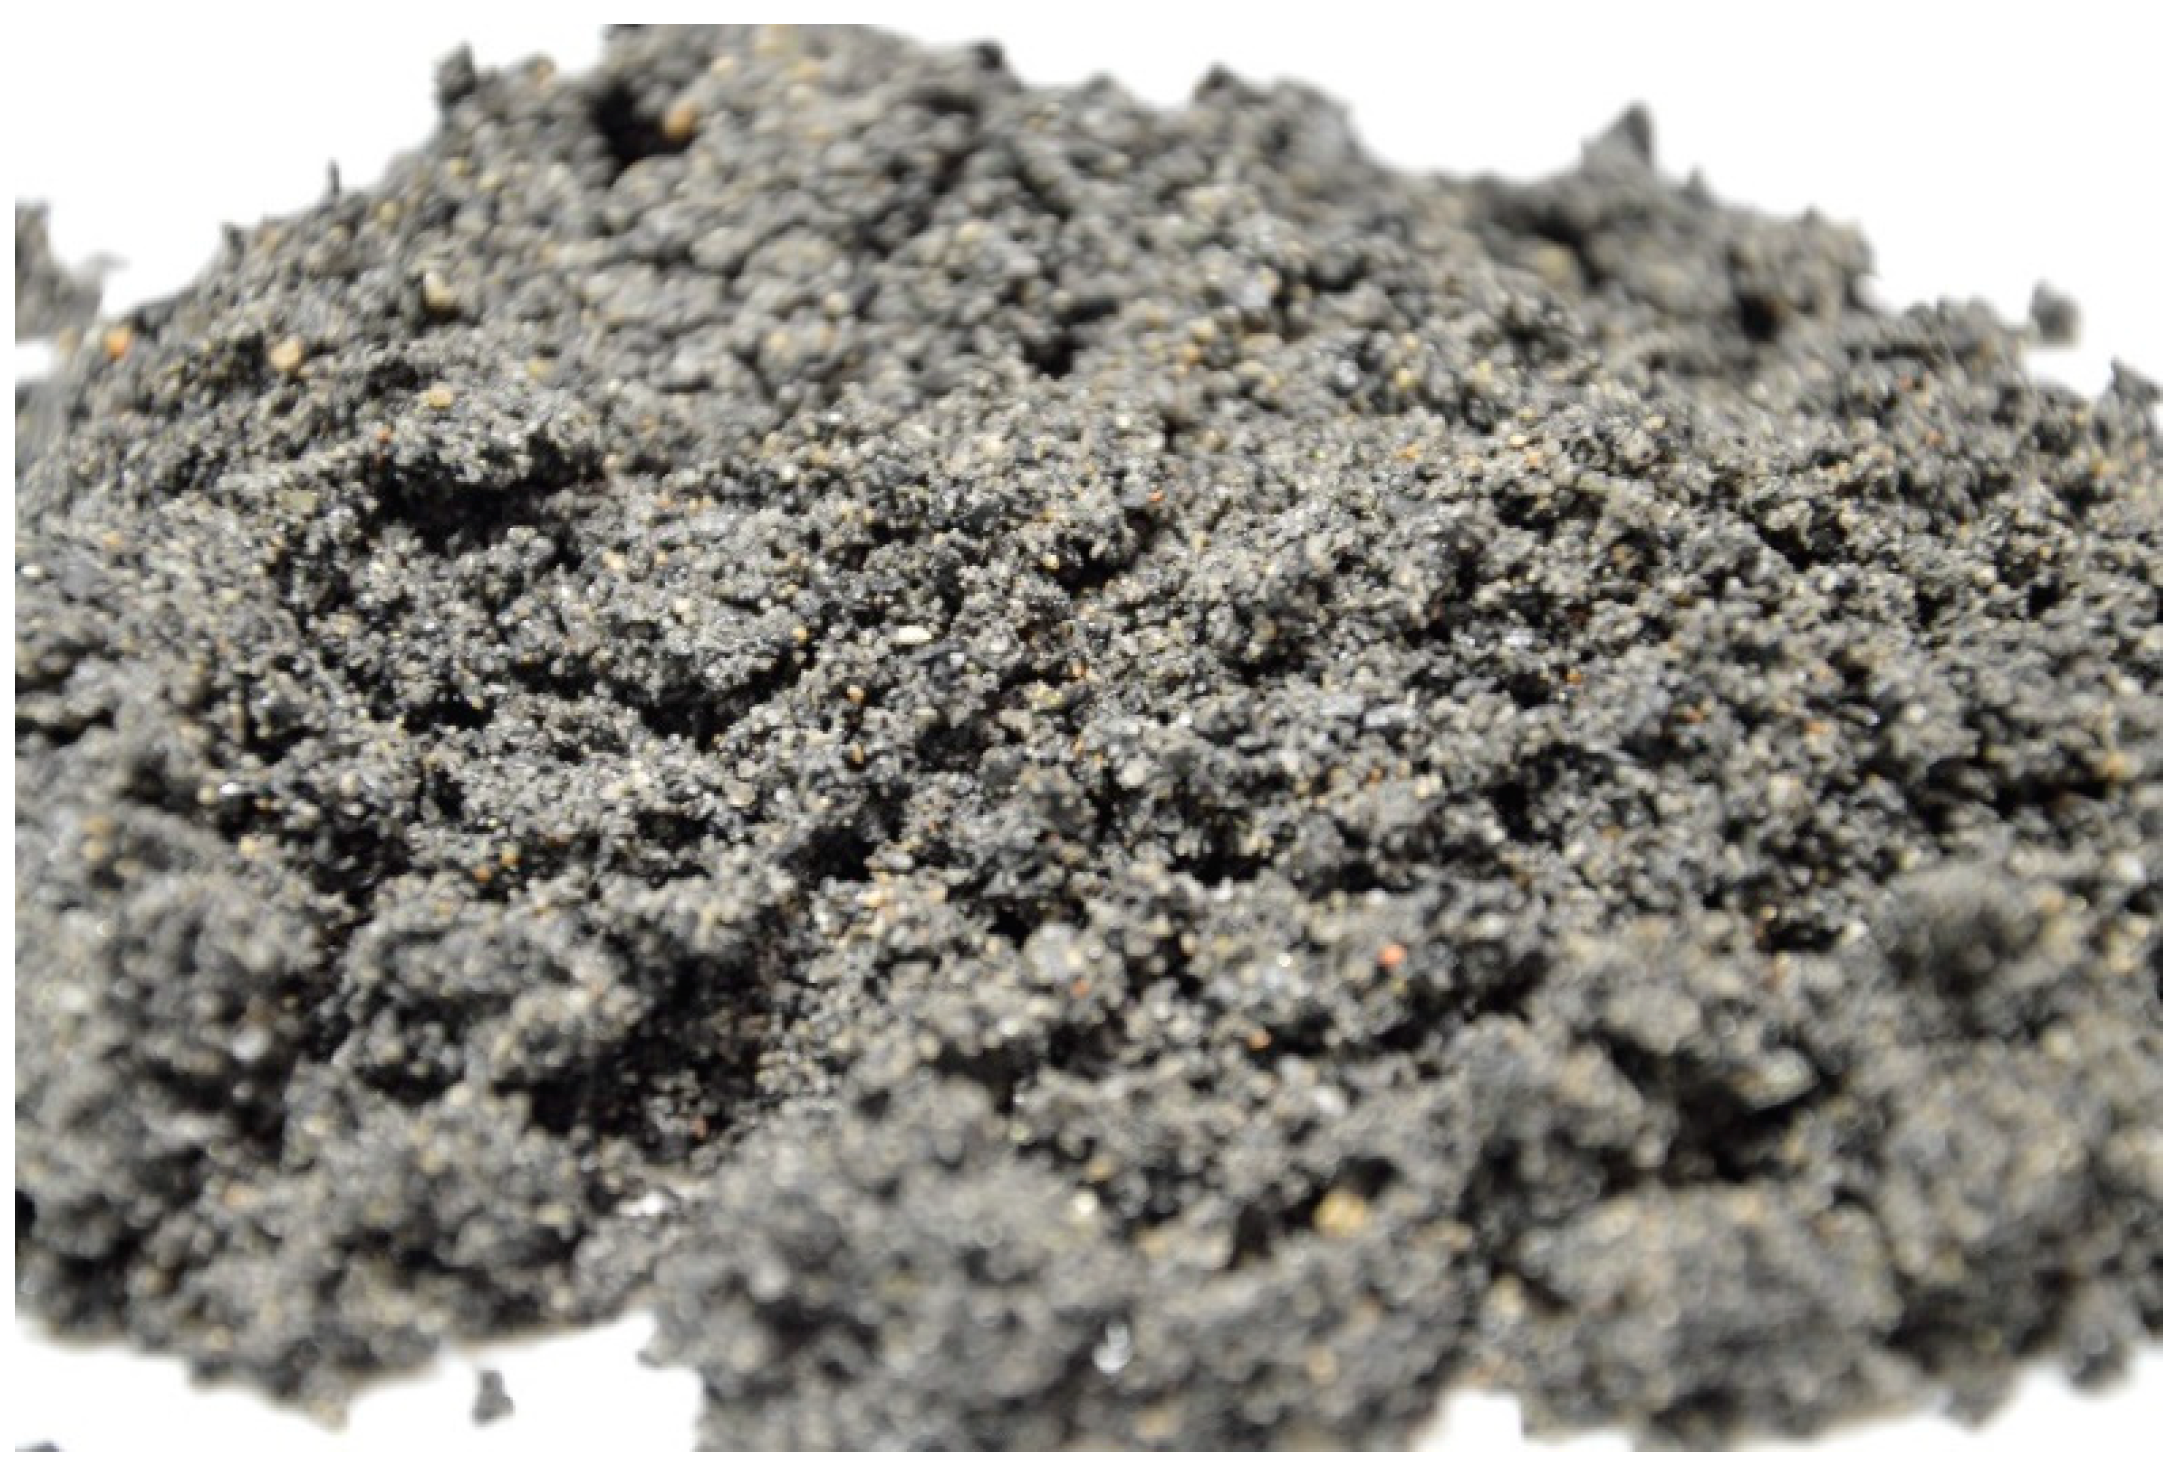
Laboratory tests of mining waste were performed on typical waste from the Upper Silesian Mining Basin (GZW) in Poland. The mining waste (designation—ZG) was collected from the eastern part of the Sobieski Mining Plant. A macroscopic analysis of the mining waste showed that the lithological composition of the sample consists mainly of quartz fragments, fragments of claystones, mudstones, coal fragments and grains of fragmentary rocks. In the case of waste collected from the Sobieski Mining Plant, small, shimmering pyrite minerals are also macroscopically visible (Figure 3).
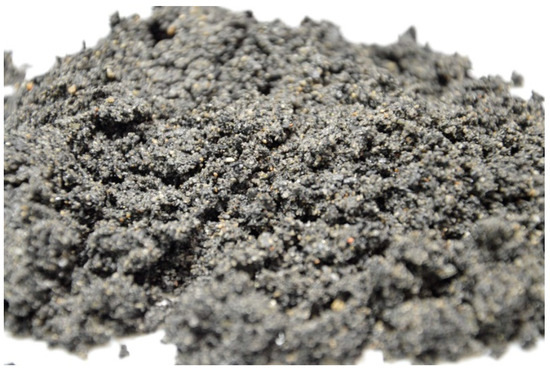
Figure 3.
Mining waste from the Sobieski Mining Plant with grain sizes of 0 to 2 mm—macroscopic view [15].
A particle size analysis was performed. The granulometric analysis shows that mining waste from the Sobieski Mining Plant with a grain size of 0 to 2 mm can be defined as fine sand (FSa) according to the geotechnical classification (in accordance with [17]). The grain size composition was dominated by the sand fraction, constituting 87.89% (FSa 53.84%, MSa 32.68%, CSa 1.38%), while the dusty fraction was 12.11%. Mining waste collected from the mechanical processing plant of ZG Sobieski was characterised by an average moisture content of wn = 18.31%. The specific density of the soil framework was determined in accordance with the standard [18]. The maximum specific density of the soil skeleton was 2.418 g/cm3; the minimum specific density of the soil skeleton was 2.405 g/cm3. The determined average specific density of the soil skeleton was 2.413 g/cm3. The specific density of the soil skeleton is lower than the specific density of the soil skeleton of typical mineral soils with a grain size of 0–2 mm. According to the standard [19], the specific density of soil for quartzite sand is 2.65 g/cm3. Testing the optimal humidity for mining waste is a complex problem for this material. Tests of the optimal humidity for the mining waste were conducted in accordance with method I of the standard [19] for compaction energy Ez = 0.59 J/cm3. The analysis of the test results showed that the optimal humidity was in the range of 12.9–20.1%, and its average value was 17.3%. The maximum bulk density of the soil skeleton was 1.378–1.452 g/cm3, and its average value was 1.421 g/cm3.
The filtration coefficient k10 of the mining waste was in the range of 4.32 · 10−4 to 5.52 · 10−4 m/s. The filtration coefficient was determined in an oedometer with a changing hydraulic drop [18]. The order of magnitude of the filtration rate is typical for the filtration rate of silty sands. During the filtration index test, it was observed that the flowing water was grey in colour, which indicated that small particles from the sample were washed out by the water.
To test the effective angle of internal friction and cohesion, mining tailings with a binder were prepared by compaction in a Proctor cylinder to a compaction index of Is = 0.97. Steel pipes with an internal diameter of 37 mm and a height of 120 mm were pressed into the cylinder. While caring for the samples in the pipes, they were protected against loss of humidity, and after seven days, they were immersed in water. The care of the test samples lasted twenty-eight days. The determination of the internal friction angle and cohesion was performed in triaxial compression apparatus in accordance with the standard [19]. The tests of the optimal humidity [wopt] and the maximum bulk density of the soil framework [ρds] were performed in accordance with the standard [19]. The determination of the oedometric compressibility modulus, filtration coefficient, swelling pressure and swelling index were conducted in an oedometer for tests in plastic bands with a diameter of 70 mm and a height of 37 mm, brought to a compaction index of Is = 0.95, 0.97 and 1.0 and at the mixture humidity of 0.95–1.15 (wopt). After the compaction stage, the samples were protected against moisture loss. The sample curing time lasted twenty-eight days in accordance with the standard [20].
Laboratory tests were performed on mining waste from the Sobieski Coal Mine with the addition of binders. The addition of binder was intended to reduce the possibility of washing out small waste particles and to improve compaction and shear and compressive strength parameters [21,22,23,24,25]. The tests were conducted for mining waste with the addition of Portland cement (designation—CEM I) and with the addition of metallurgical cement (designation—CEM III). Portland cement (CEM I) is cement that contains only one ingredient, Portland clinker, in an amount of not less than 95%. Metallurgical cement (CEM III) consists of Portland clinker, blast furnace slag and calcium sulphate. The amount of the additive was determined as the maximum recommended for improving the substrate for road traffic categories 4 to 6 in accordance with the standard [21]. In order to maintain a comparative scale, the tests were conducted for mining waste with the addition of 8% to the weight of the soil skeleton of each of the mentioned binders. The tests for waste with binders were performed in accordance with the scheme and standards used for testing only mining waste without binders. The results of the laboratory tests showed better physical and mechanical properties for mining waste with the addition of metallurgical cement.
3. Research Methodology Using Finite Element Method (FEM)
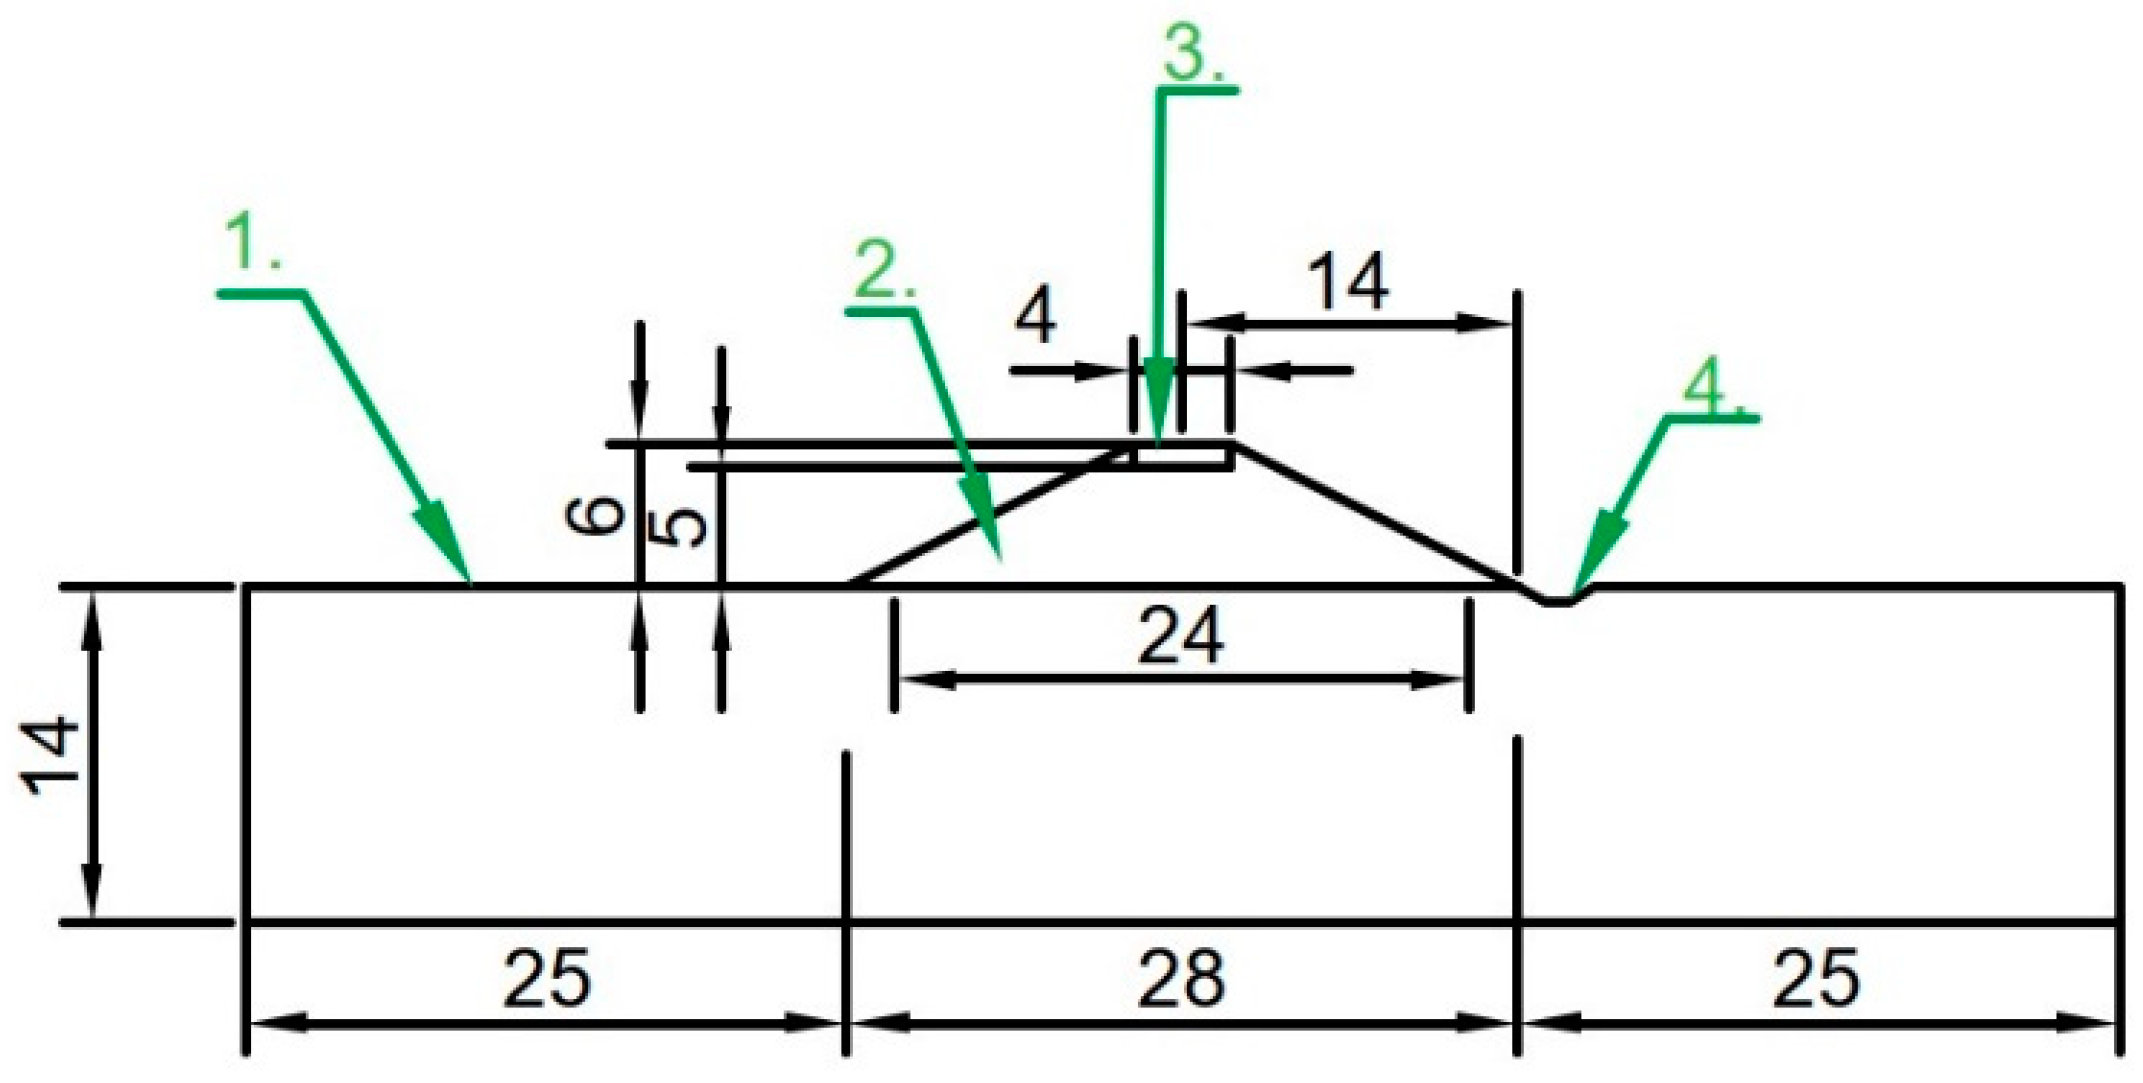
The article presents the results of numerical modelling in a program based on the Finite Element Method, MIDAS GTS NX. Numerical calculations were made for the stability of the body of flood embankments serving as road embankments for roads with light and medium traffic. The stability assessment in the MIDAS GTS NX program is based on the limit equilibrium method, according to the procedure for reducing strength parameters. The Shear Strength Reduce Method (SSRM) is used to determine the FoS stability coefficient. To calculate the stability of the designed flood embankment, the elastic–plastic Coulomb–Mohr soil model was used, and the soil parameters were introduced in accordance with the standard [26] and the D3 calculation approach: A2 + M2 + R3. It was assumed that the obtained test parameters are characteristic values (Xk), and the design parameters (Xd) were obtained as a result of applying appropriate partial coefficients in accordance with the Eurcode 7 standard. The shaft geometry and layer arrangement are shown in the drawing (Figure 4) and in the extended version (Figure 5). The slope of the water and air slopes was assumed to be at the ratio of 1:2. The height of the embankment crown was 6 m, the width of the embankment body at the base was 28 m. A 4 m wide road strip was planned. A drainage ditch was planned on the side of the air slope. The base of the model was 14 m deep, and the width of the entire model was 78 m. An L-class road (local) was designed for the embankment, with a permissible load of 115 kN per axle, which gives a load on a single wheel weighing 57.5 kN in accordance with the Catalogue of Typical Structures of Flexible and Semi-rigid Pavements [27]. Loads in accordance with the standard [23] were considered to be unfavourable variables, for which the safety factor γf = 1.3 was adopted (set A2). The wheel spacing on the axle was assumed according to the standard [28] and was 2 m. The most unfavourable load was assumed, placing the wheel load at a distance of 0.4 m from the edge of the road on the side of the air slope (Figure 6).

Figure 4.
Assumed shaft geometry variant 1: 1. subsoil, 2. embankment body, 3. road base, 4. drainage ditch.
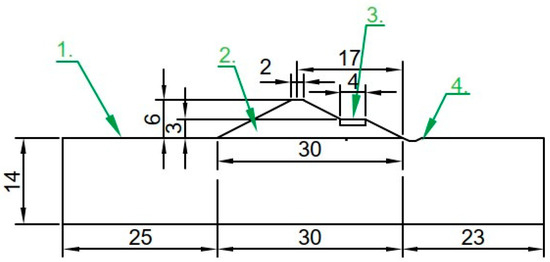
Figure 5.
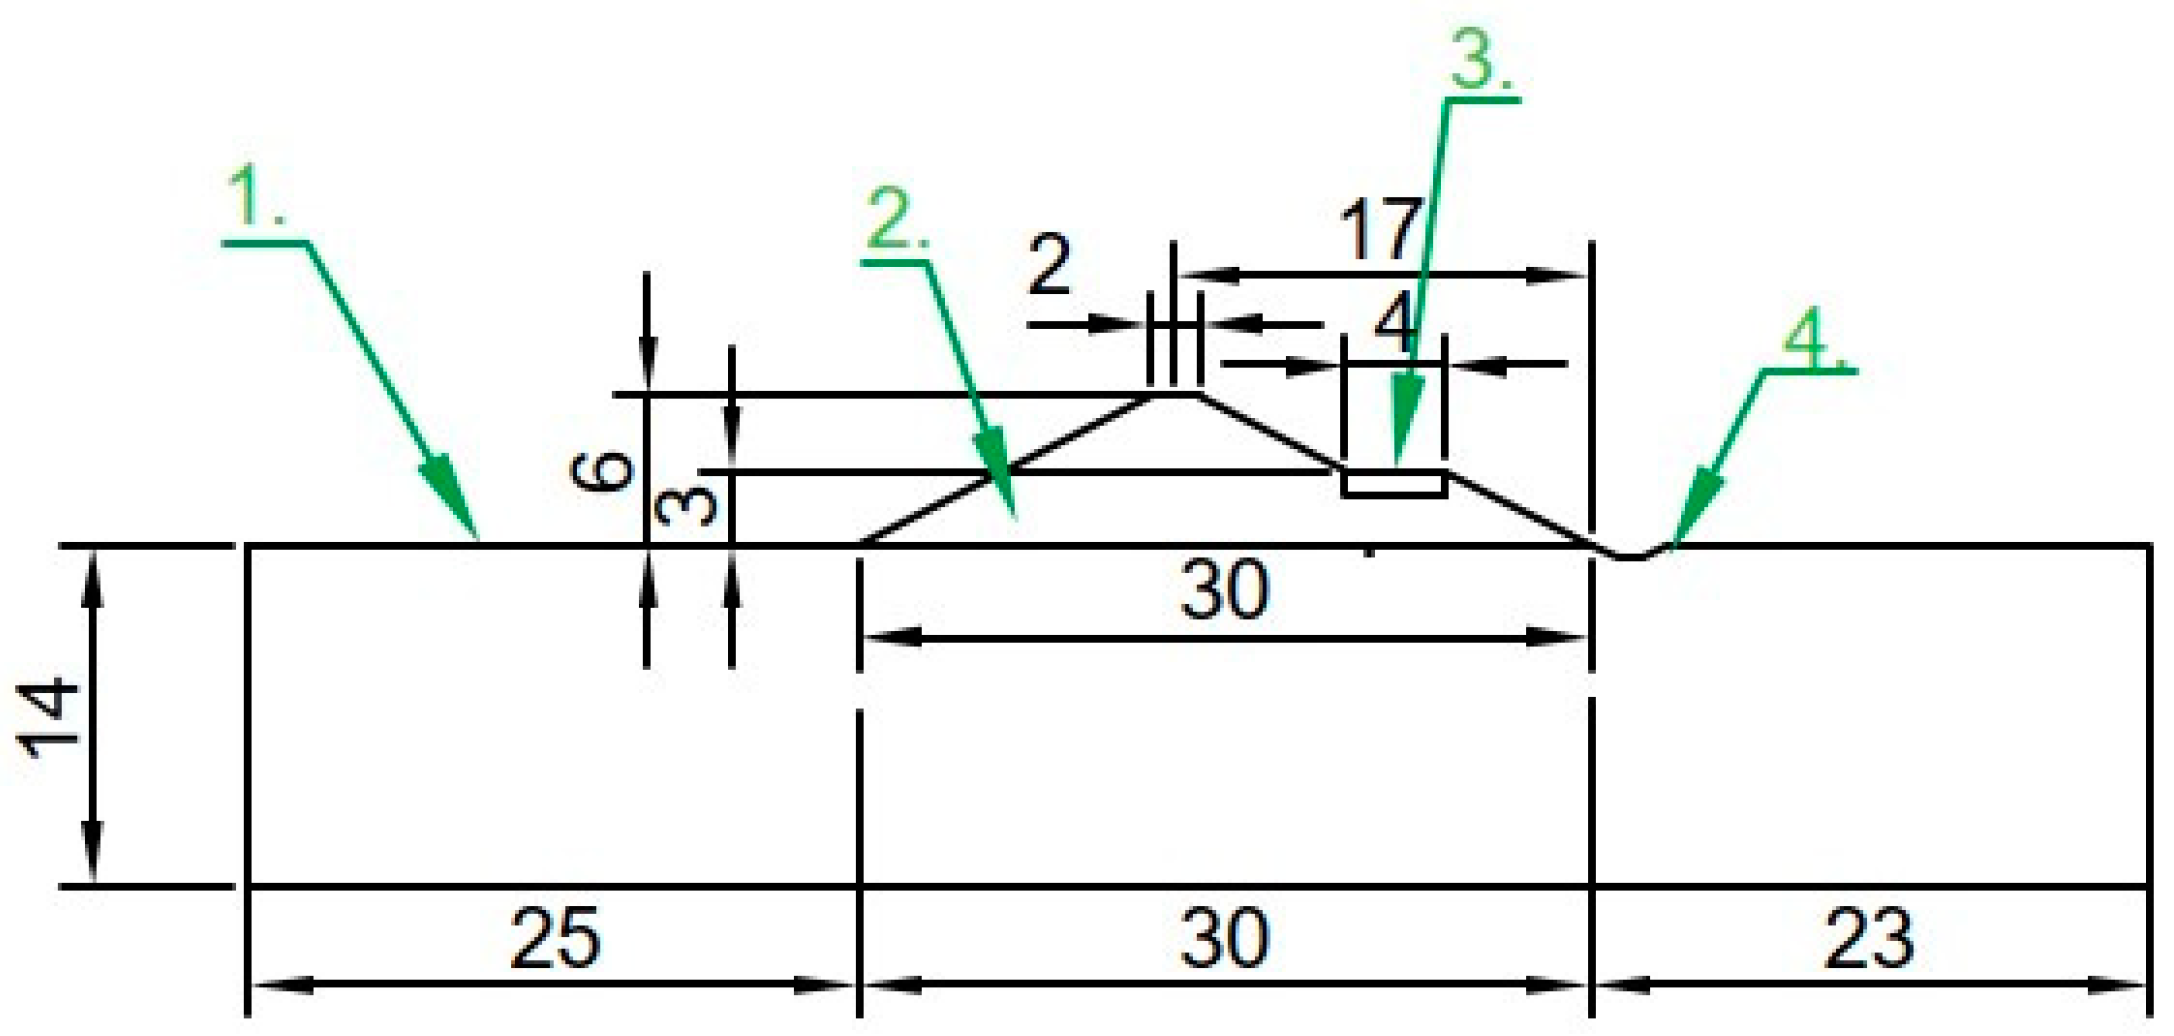
Assumed shaft geometry variant 2: 1. subsoil, 2. embankment body, 3. road base, 4. drainage ditch.
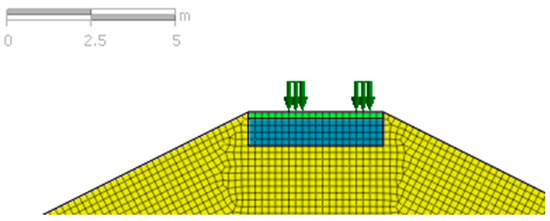
Figure 6.
Load distribution on shaft crown.
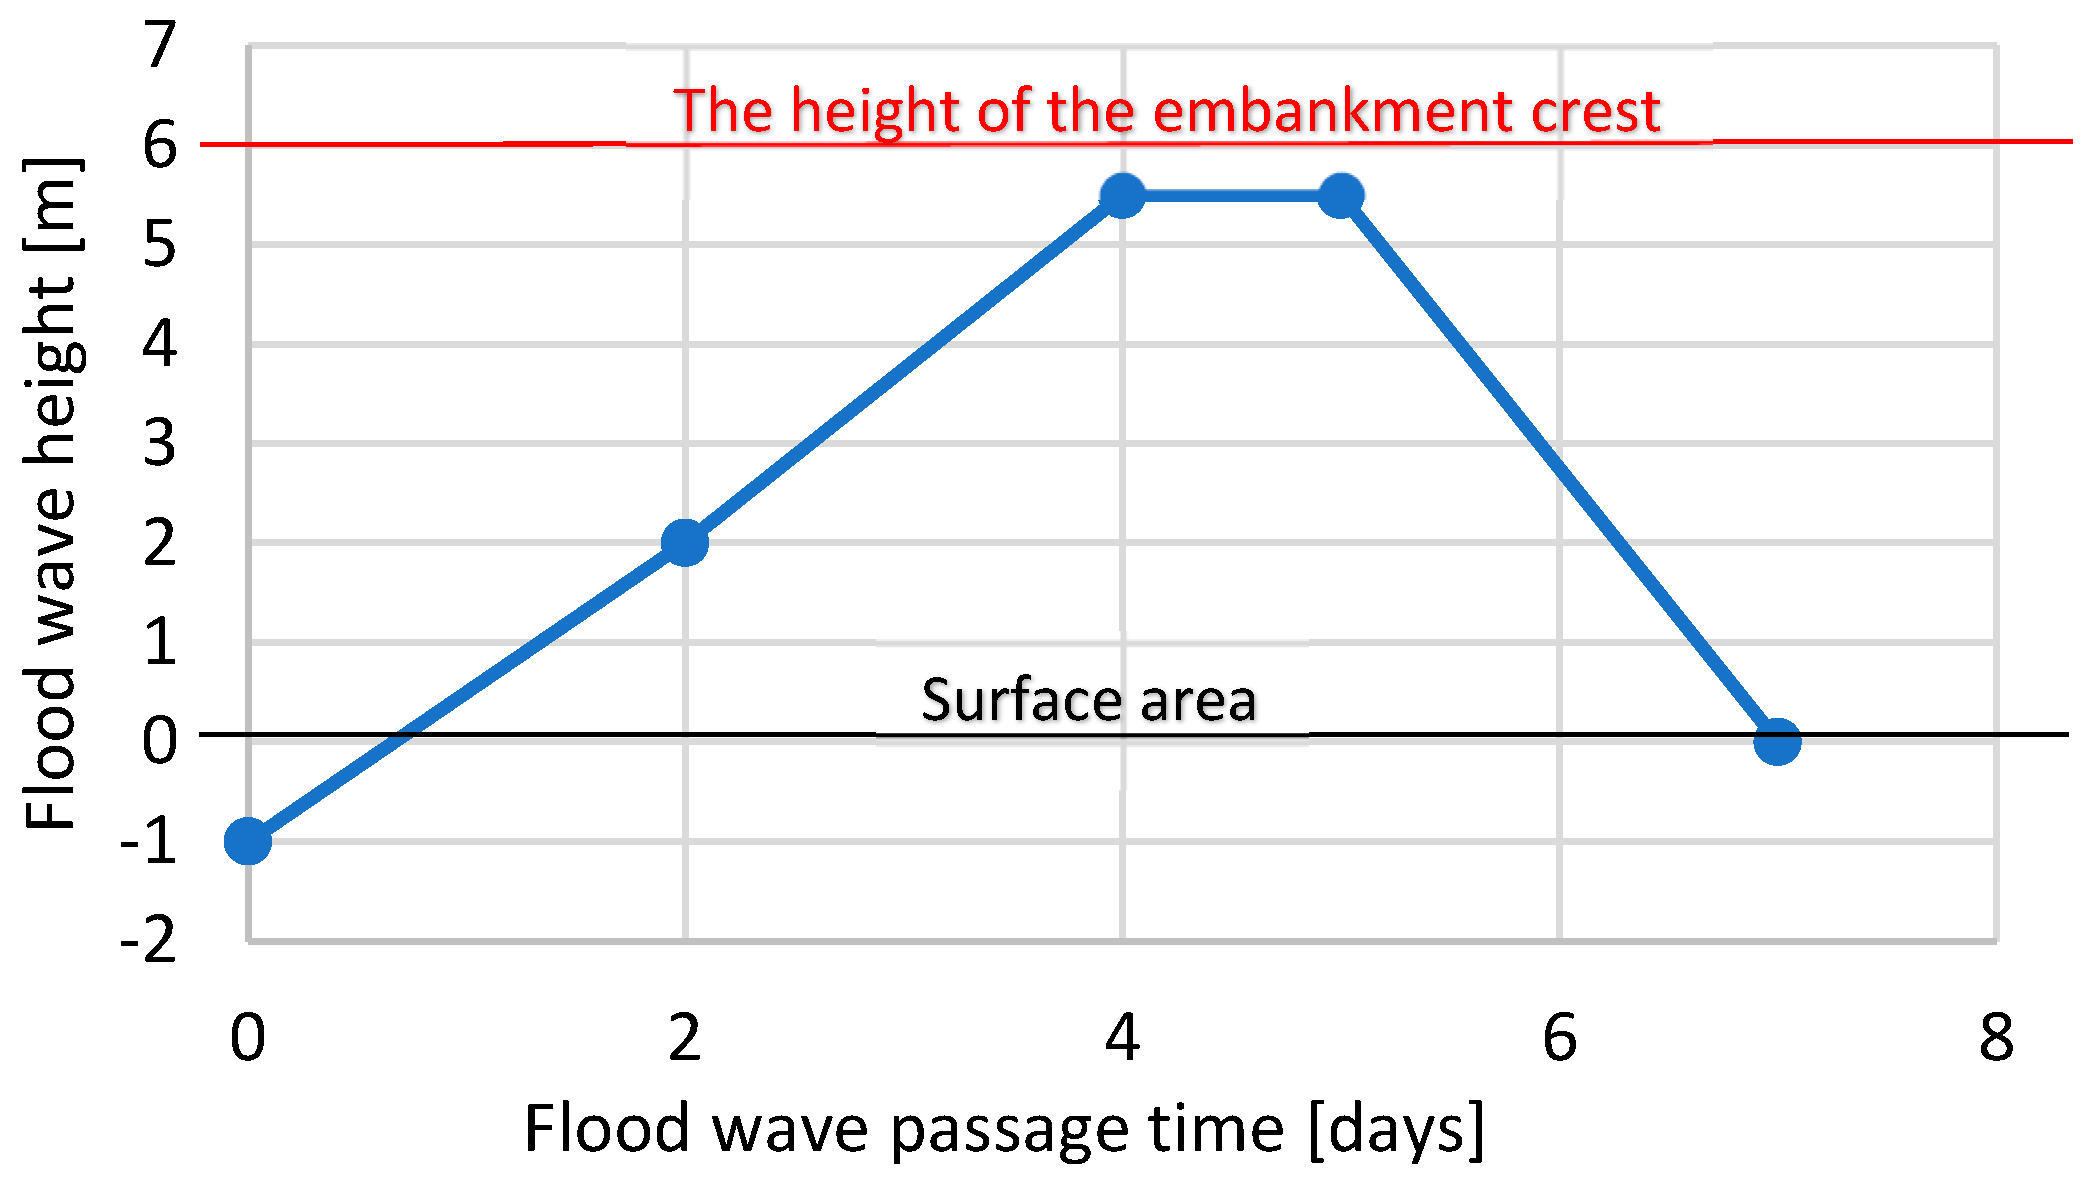
In the numerical calculations, it was assumed that the flood wave would rise from the river level to 5.5 m above ground level at the waterside slope on the fourth day. The water level was expected to remain at this level for one day, and then the water would drop to ground level within two days. The flood wave diagram is shown in the figure (Figure 7).

Figure 7.
Hydrograph of water damming on water slope.
Stability calculations were conducted for the designed flood embankment, taking into account the passage of the flood wave in conditions of unsteady filtration, in accordance with the flood wave hydrograph (Figure 7). The article presents the calculated coefficient of stability (FoS) for the initial conditions and after the fifth day of damming the flood wave on the waterside slope. Numerical calculations were performed for flood embankments built from mining waste in two variants:
- Variant 1: a road on the embankment crest for a flood embankment unloaded or loaded with a vehicle;
- Variant 2: a road on the ventral side of the embankment for a flood embankment unloaded or loaded with a vehicle.
In subsequent calculation variants, it was checked whether the flood embankment loaded with vehicles would remain stable during water damming. For comparison, the results of the coefficient of stability (FoS) of the loaded embankment are presented for the initial state after the fifth day of damming the flood wave.
Considering the stability of flood embankments that also serve as road embankments, and referring to the regulations of the Minister of the Environment on the technical conditions to be met by hydrotechnical structures and their location [29], it was assumed that the flood embankment and the flood embankment loaded with vehicle traffic should meet the stability conditions for the basic load system (FoS > 1.5). The highest possible flood wave level was assumed in the calculations; therefore, the permissible values of the stability coefficient for the fifth day of flood wave damming were adopted for a unique load system (FoS > 1.3).
4. Analysis of the Results of Tests on the Properties of Mining Waste with the Addition of Cement
The numerical calculations performed for flood embankments made of mining waste in two versions (version 1—a road on the embankment crown or version 2—a road on the air side of the embankment and for flood embankments unloaded or loaded with a vehicle) showed unacceptable values of stability (safety) coefficients.
Therefore, laboratory tests were conducted for mining waste with the addition of cement. The tests were performed for two varieties of cement: 1. Portland cement (designation ZG +8% CEMI) and 2. metallurgical cement (designation ZG +8% CEMIII). For mining waste with the addition of cement, the optimal moisture content [wopt] and the maximum bulk density of the soil skeleton [ρds] were determined. The results are summarised in Table 1. The determination of the filtration coefficient for mining waste with the addition of binder was performed after mixing and compacting the samples to a concentration index of Is = 0.97. The tests were performed in an oedometer twenty-eight days after compaction. Table 1 presents the marked filtration coefficients. The lowest filtration coefficient was recorded for mining waste with the addition of 8% Portland cement.

Table 1.
Summary of the results of the optimal humidity and maximum bulk density of the soil skeleton [15].
The addition of Portland cement increased the optimum humidity. The average value of optimal humidity for mining waste with the addition of metallurgical cement was 0.3% lower than the average value of optimal humidity for mining waste alone. The average value of the maximum bulk density of the soil framework for mining waste with cement additions increased in each examined case. In order to obtain strength parameters, laboratory tests were conducted in a triaxial compression apparatus for mining waste and mining waste with the addition of cement.
Table 2 summarises the results of laboratory tests on the mining waste and waste with the addition of cement binder. The obtained parameters were used in FEM computational models. The addition of each type of cement resulted in an increase in the parameters of the effective internal friction angle and effective cohesion. The best results were observed in a mixture of mining waste with the addition of 8% Portland cement binder. The addition of this type of binder resulted in obtaining the highest value of the effective internal friction angle of 41.01 deg. However, the highest effective cohesion of 59.67 kPa was achieved by the mixture with the addition of 8% metallurgical cement. For mining waste and mining waste with cement, the oedometric compressibility modulus was determined in accordance with the [17] standard. The addition of 8% Portland cement in relation to the mass of the soil framework resulted in the greatest increase in the oedometric compressibility modulus. Geotechnical parameters for the subsoil used in the numerical calculations were adopted based on the standard [30] (Table 3). The article presents the case of a silty and compact clay base typical of Polish Quaternary soil conditions.
Table 2.
Table of mining waste parameters [15].
Table 3.
Geotechnical parameters of selected geotechnical layers occurring in base of flood embankments [15].
5. Discussion of the Results of the FEM Modelling Tests
Numerical calculations were performed using the FEM method in the MIDAS GTS NX program. This article presents the results showing the maximum specific deformation only for the zero state and for the fifth day, which had the largest flood wave. For all tested cases, the values of the stability coefficient FoS are presented in Table 4. The designed embankment made of mining waste from the Sobieski Coal Mine meets the stability conditions for clay soil under conditions without additional loads (Table 4).
Table 4.
The value of the general stability coefficient for the calculation variants of the models.
Calculations were performed in two geometric variants. The first variant is a road on the top of the flood embankments, and the second variant is a road from the air side. In the initial conditions, the flood embankment showed stability in all variants (Figure 8 and Figure 9). The stability coefficient had a value of FoS > 1.5. In variant 1, the probable slip planes are located on both sides of the flood embankment. It is worth noting that the FoS stability coefficient was higher in the case of variant 1, which was the flood embankment with a road on the embankment crown. In variant 2, the probable slip plane occurred only on the water side of the flood embankment. Calculations were also performed for the fifth day of water damming, which is when the height of the flood wave was 5.5 m (Figure 7). In this case, all models showed an instability of FoS < 1.3 (Figure 10 and Figure 11). Additionally, a higher (but less than 1.3) stability coefficient FoS = 1.26 was identified for variant 2, which was the variant with the widened flood embankment (the road on the air side). In each variant, the potential slip planes were only on the upstream side of the flood embankment. Due to such results, it was necessary to take action to obtain a new geomaterial, namely, mining waste with the addition of a binder.
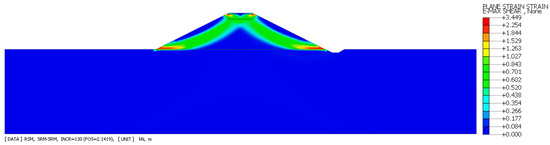
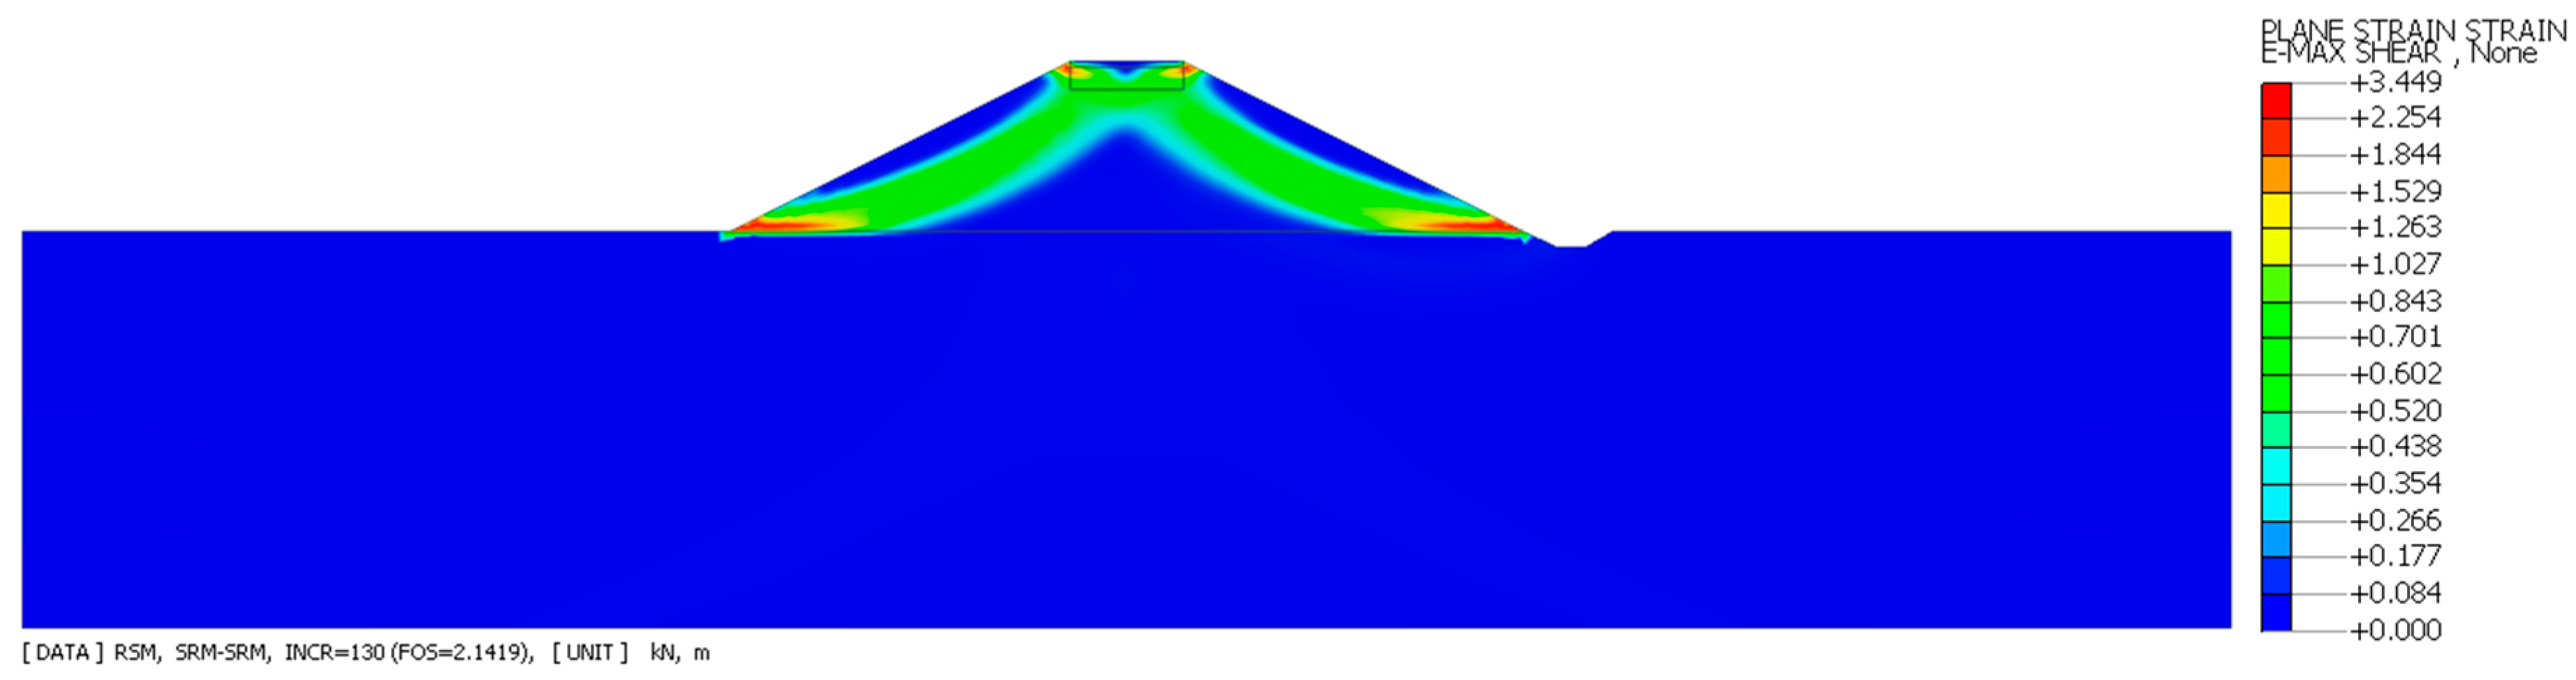
Figure 8.
Maximum specific deformations–initial conditions, shaft body made of mining waste (FoS = 2.14), variant 1.

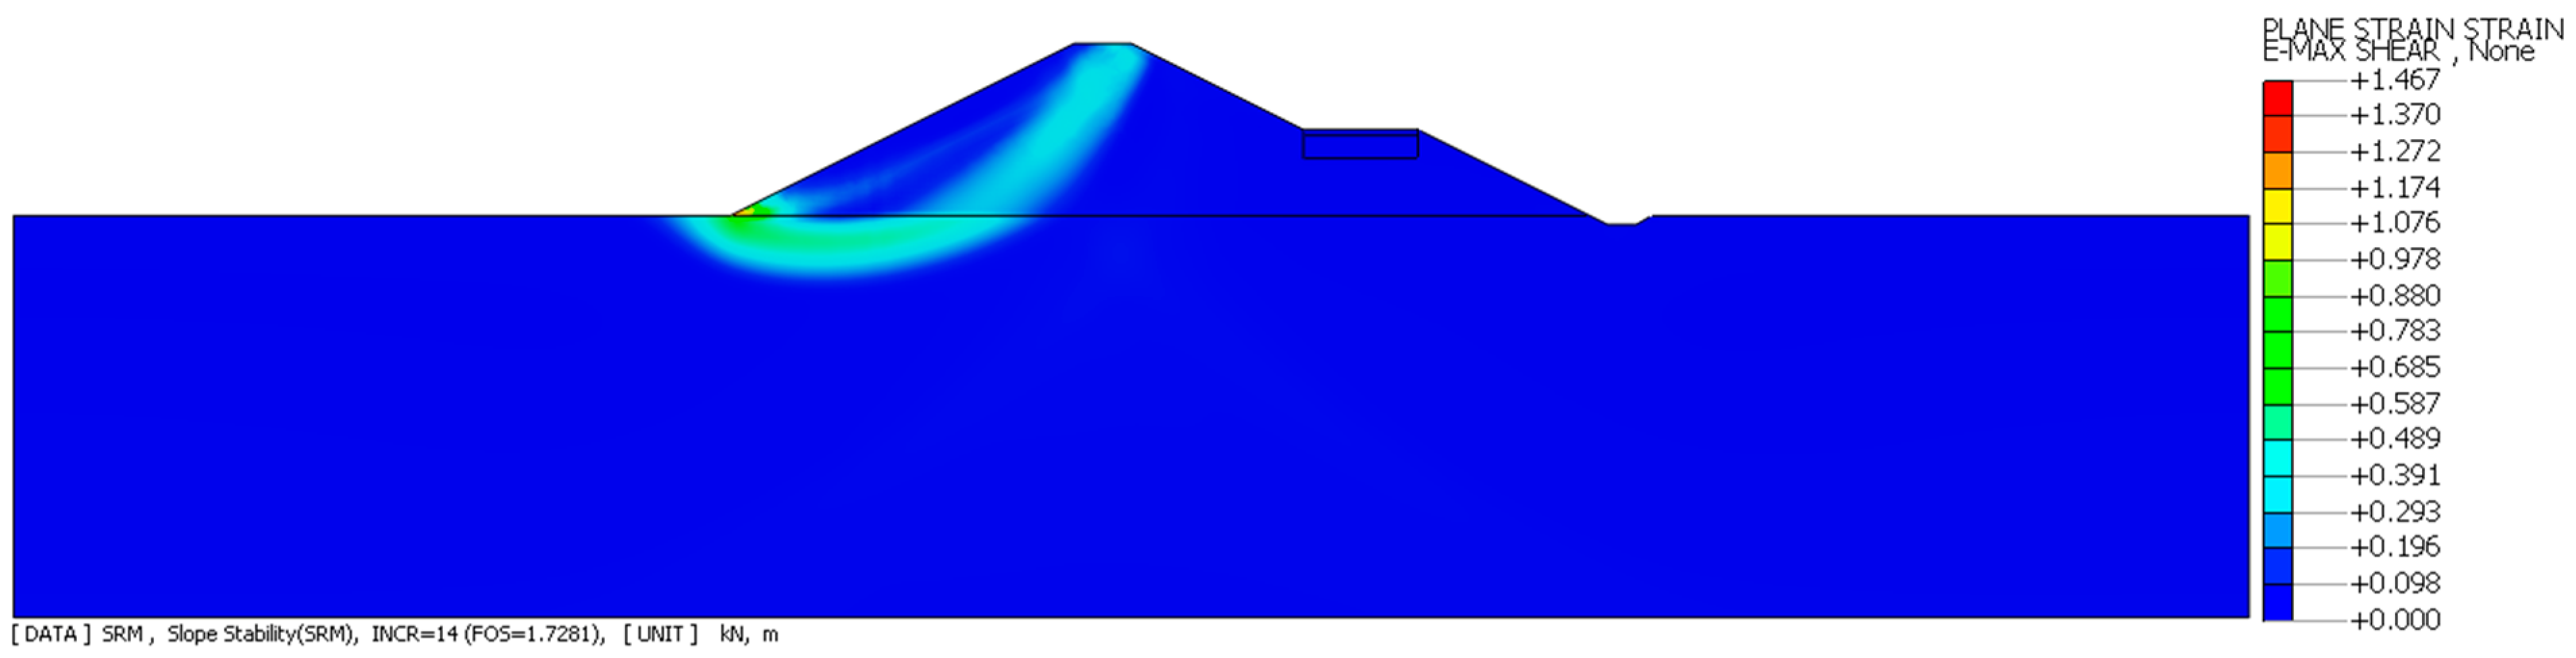
Figure 9.
Maximum specific deformations–initial conditions, shaft body made of mining waste (FoS = 1.72), variant 2.
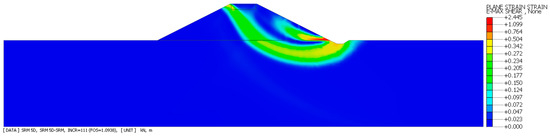
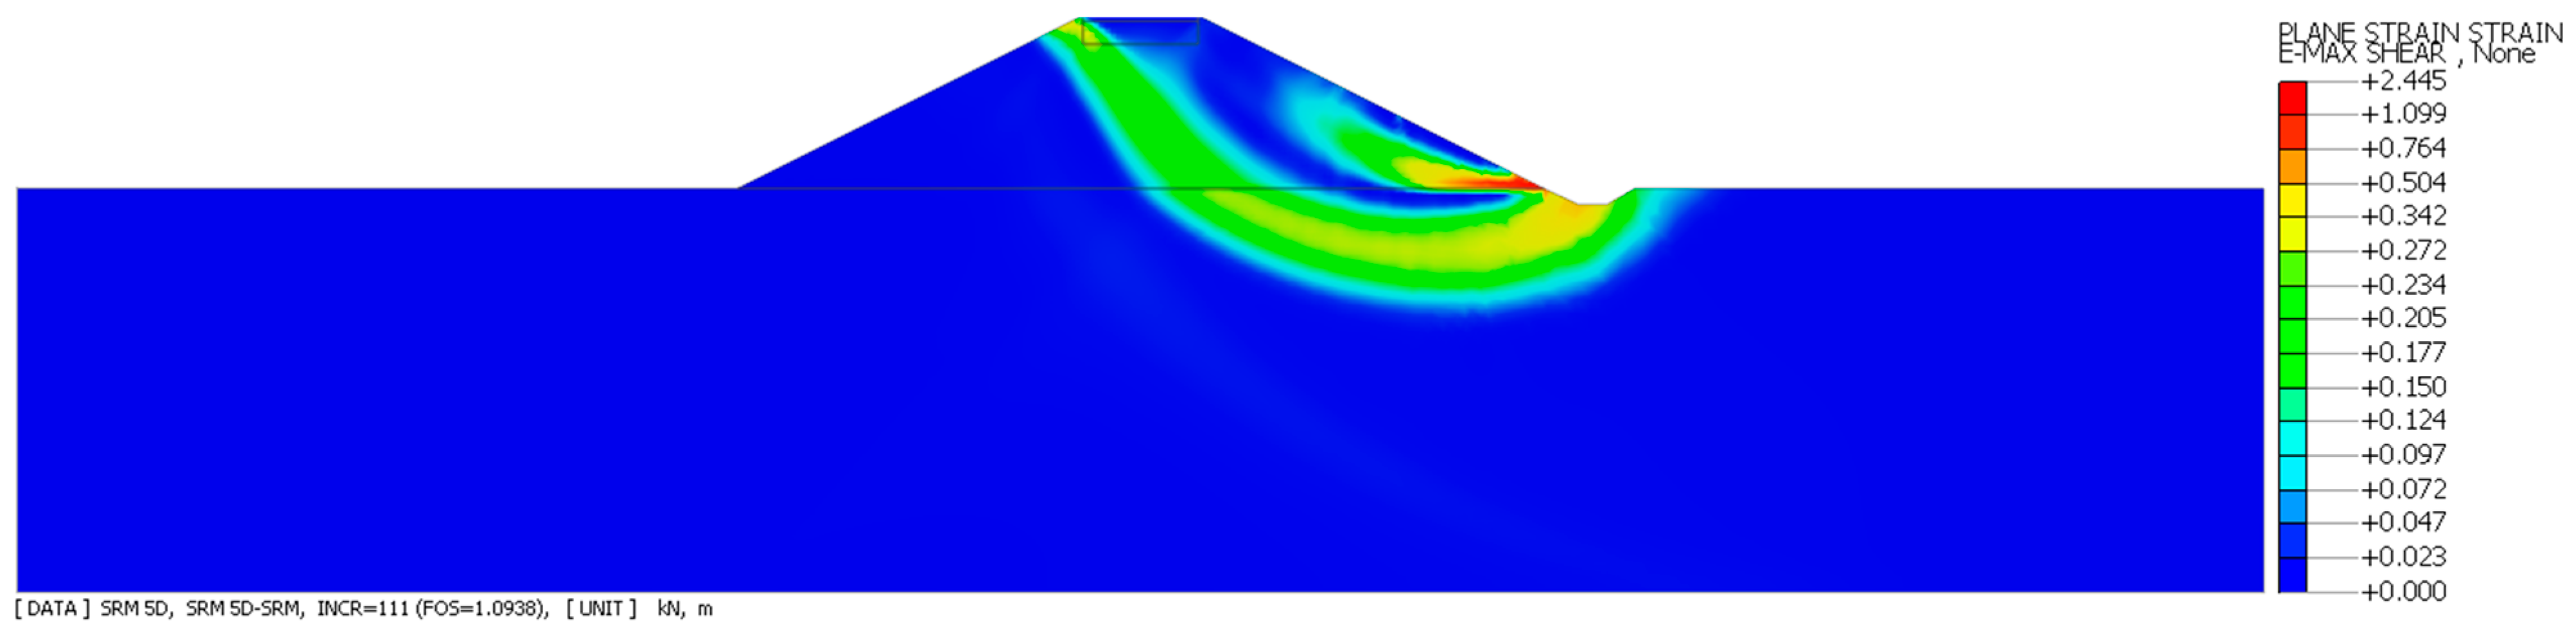
Figure 10.
Maximum shape deformations on fifth day of water damming on waterside slope, embankment body made of mining waste (FoS = 1.09), variant 1.

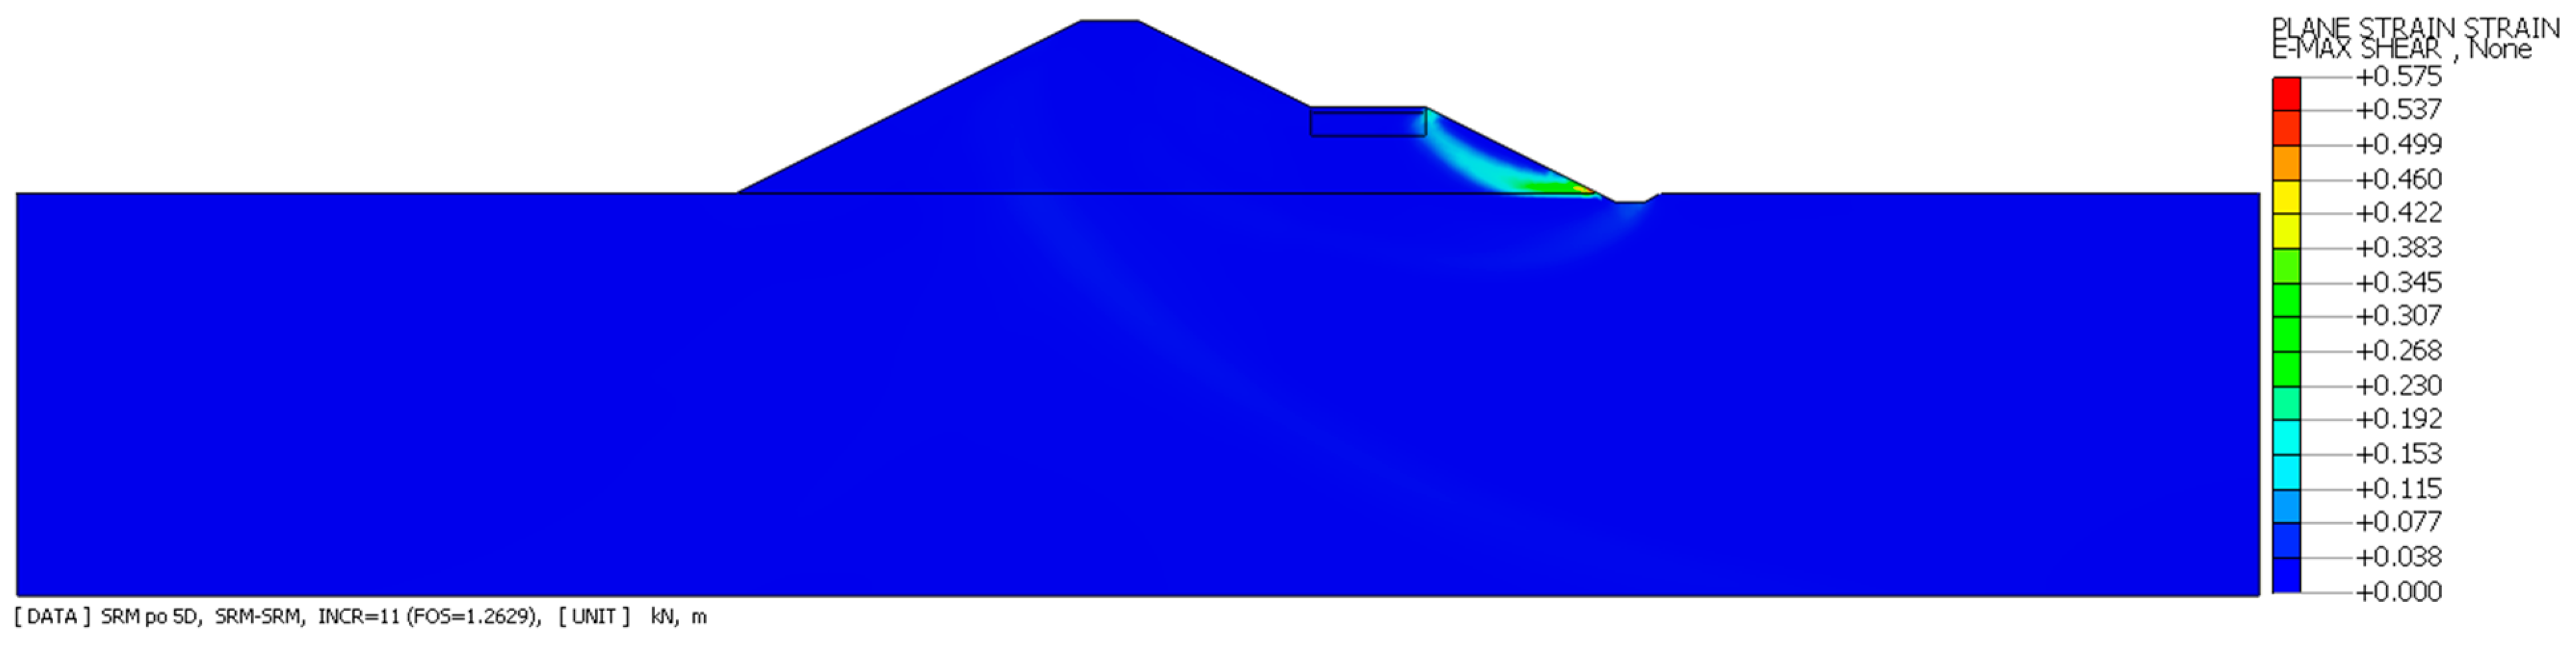
Figure 11.
Maximum shape deformations on fifth day of water damming on off-water slope, embankment body made of mining waste (FoS = 1.26), variant 2.
Variant 1 and 2. A flood embankment made of mining waste in the initial state and on the fifth day of the flood wave.
For the first and second variants of the flood embankment with a load, the stability coefficients behave the same as for the variants without a load. In the initial state, the probable slip planes are located on both sides of the flood embankment (Figure 12), and in the case of the widened embankment, on the water side (Figure 13). The flood embankments did not lose stability in the highest flood wave, but the stability coefficients are below the required value, i.e., FoS < 1.3 (Figure 14 and Figure 15). On the fifth day of the flood wave on the flood embankment, a probable slip plane was formed only on the ventral side of the embankment in both variants of the embankment shape (Figure 14 and Figure 15).
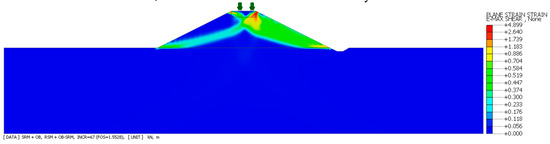
Figure 12.
Maximum shape deformations–initial conditions, shaft body made of mining waste with vehicle load (FoS = 1.55), variant 1.
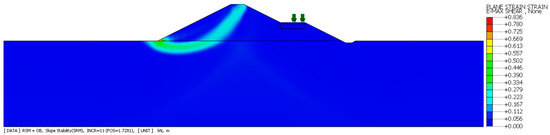
Figure 13.
Maximum specific deformations–initial conditions of water damming on upstream slope, embankment body made of mining waste and with vehicle load (FoS = 1.72), variant 2.
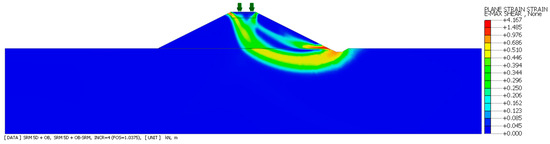
Figure 14.
Maximum shape deformations on fifth day of water damming on waterside slope, embankment body made of mining waste and with vehicle load (FoS = 1.04), variant 1.

Figure 15.
Maximum shape deformations on the fifth day of water damming on the upstream slope, the embankment body made of mining waste and with a vehicle load (FoS = 1.22), variant 2.
Variant 1 and 2. A flood embankment made of mining waste and loaded with a vehicle, in the initial state and on the fifth day of the flood wave.
For the first and second variants, flood embankments made of mining waste with the addition of Portland cement show stability and meet the required conditions, i.e., they have coefficients greater than FoS > 1.5 (Figure 16 and Figure 17). Probable slip planes in the first variant were formed on both sides of the embankment slopes (Figure 16), and in the second variant on the water side (Figure 17). In the highest flood wave, the flood embankment in variant 1 did not lose stability, but the stability coefficient was below the required value, i.e., FoS < 1.3 (Figure 18). On the fifth day of the flood wave, a probable slip plane was formed only on the ventral side of the flood embankment in both variants of the embankment shape (Figure 18 and Figure 19). The stability coefficient in the second variant meets the required FoS value > 1.3 (Figure 19).
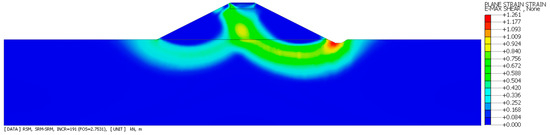
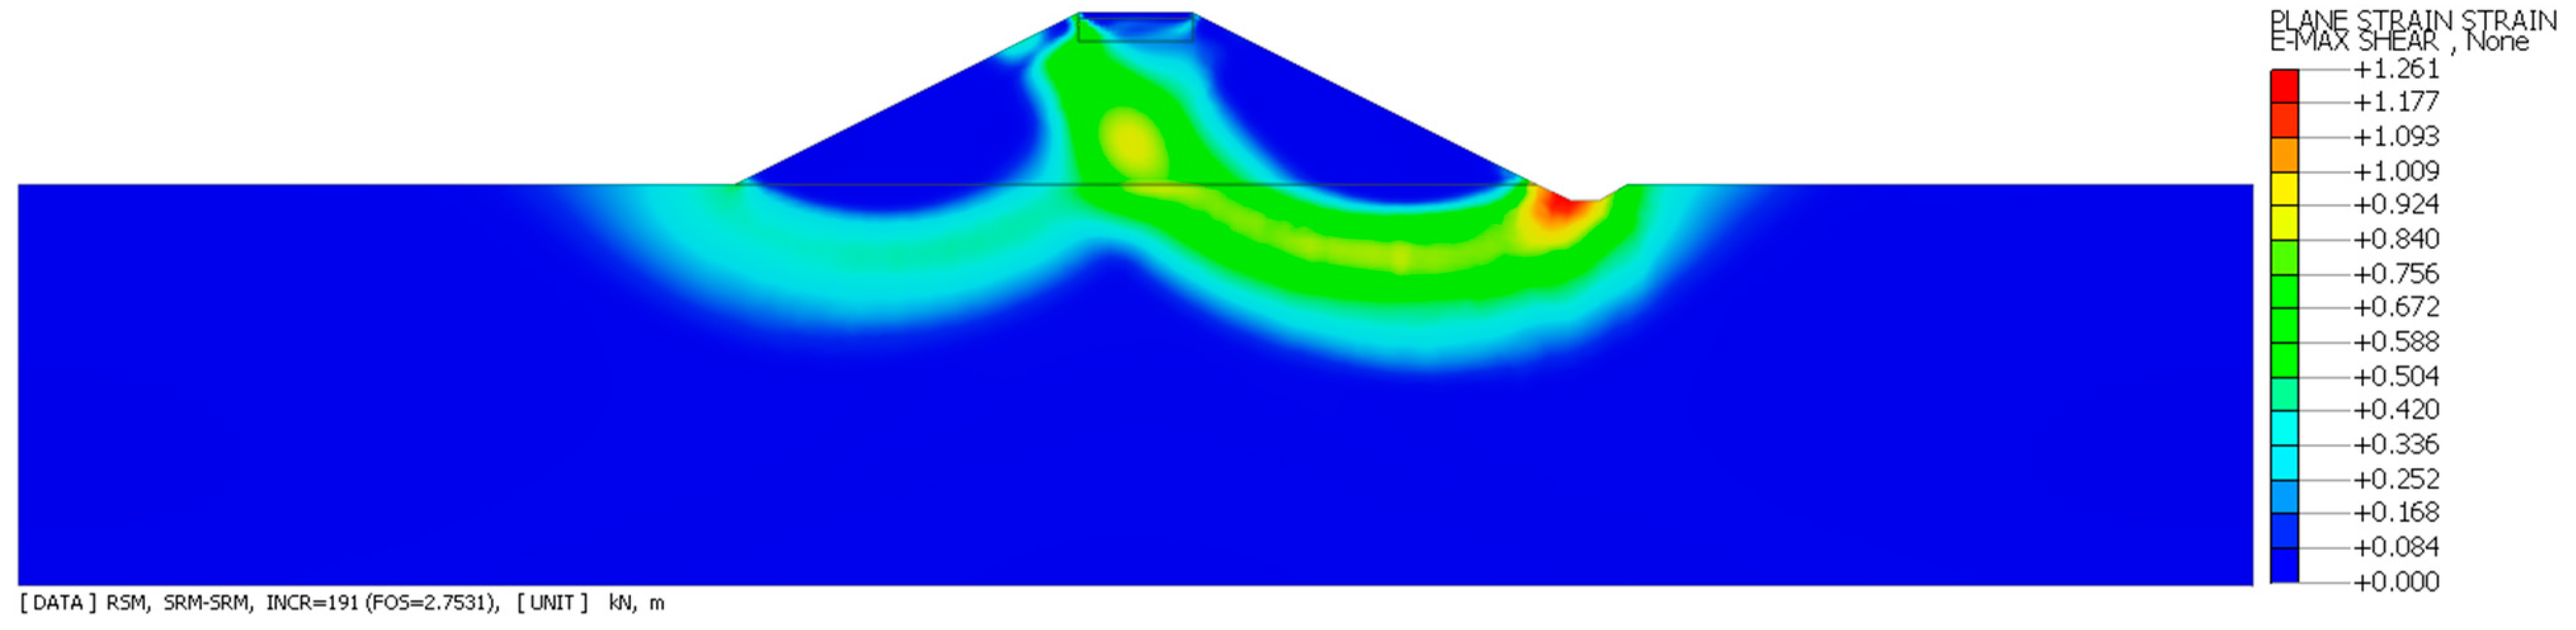
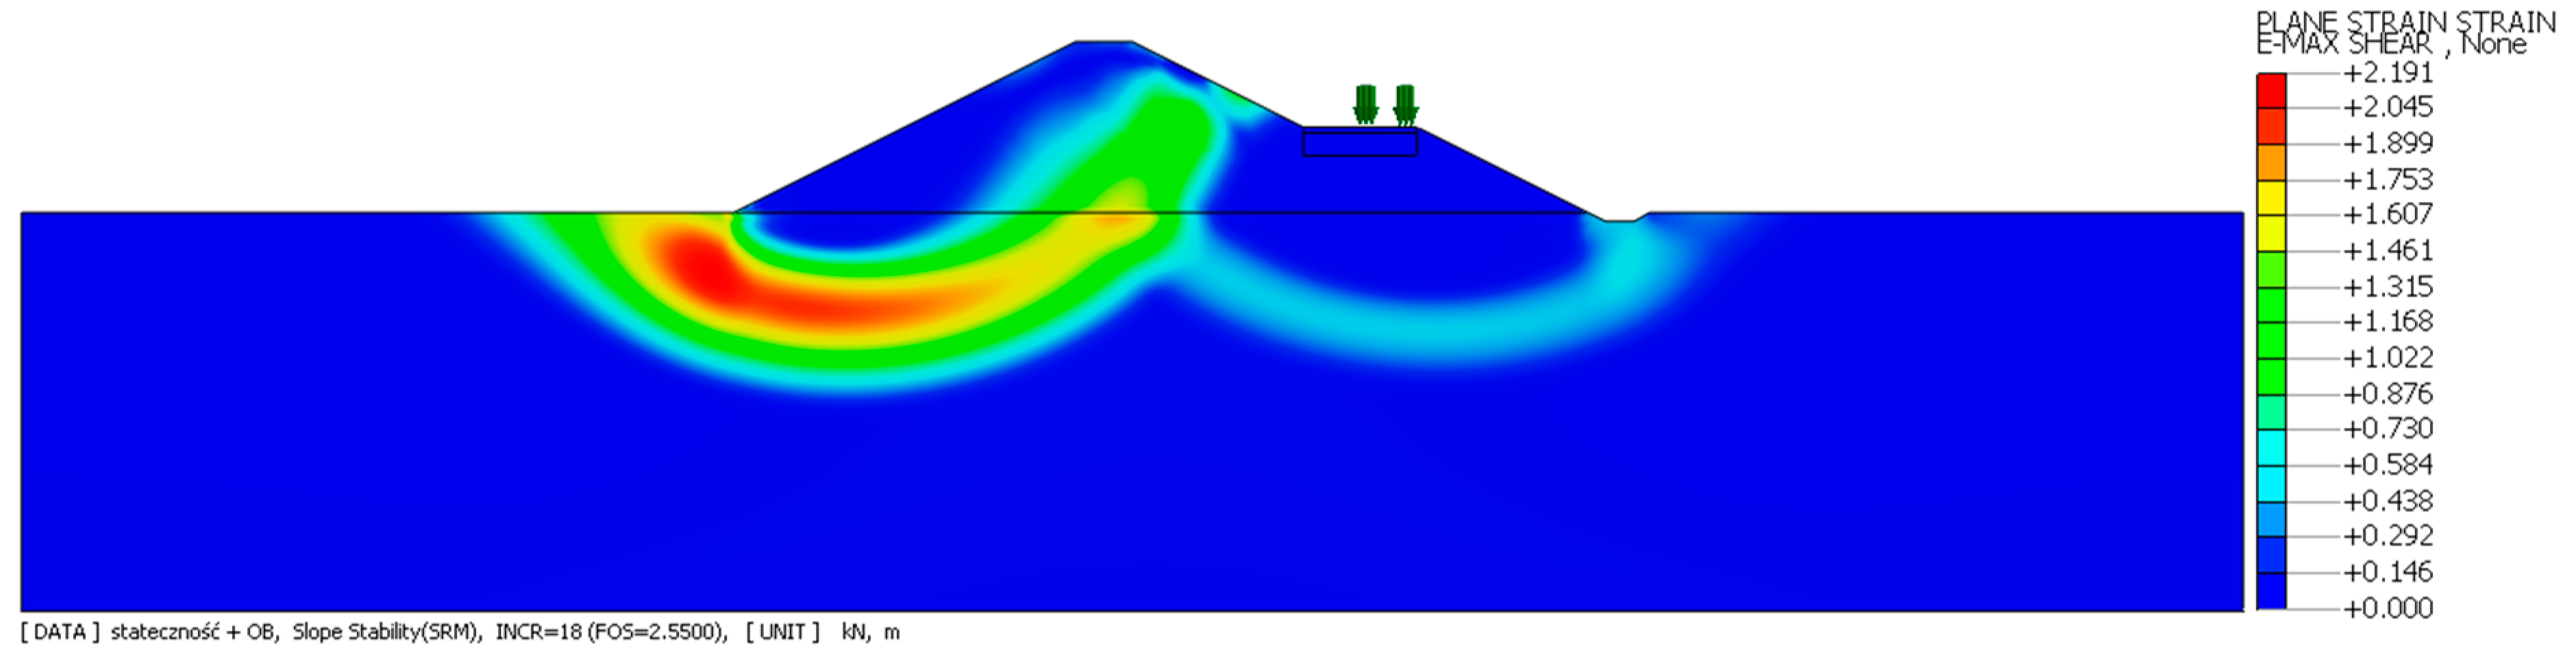
Figure 16.
Maximum specific deformations–initial conditions, shaft body made of mining waste with addition of Portland cement (FoS = 2.75), variant 1.
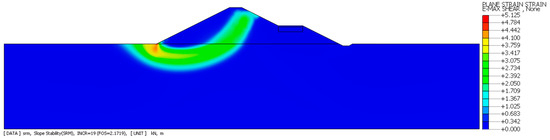
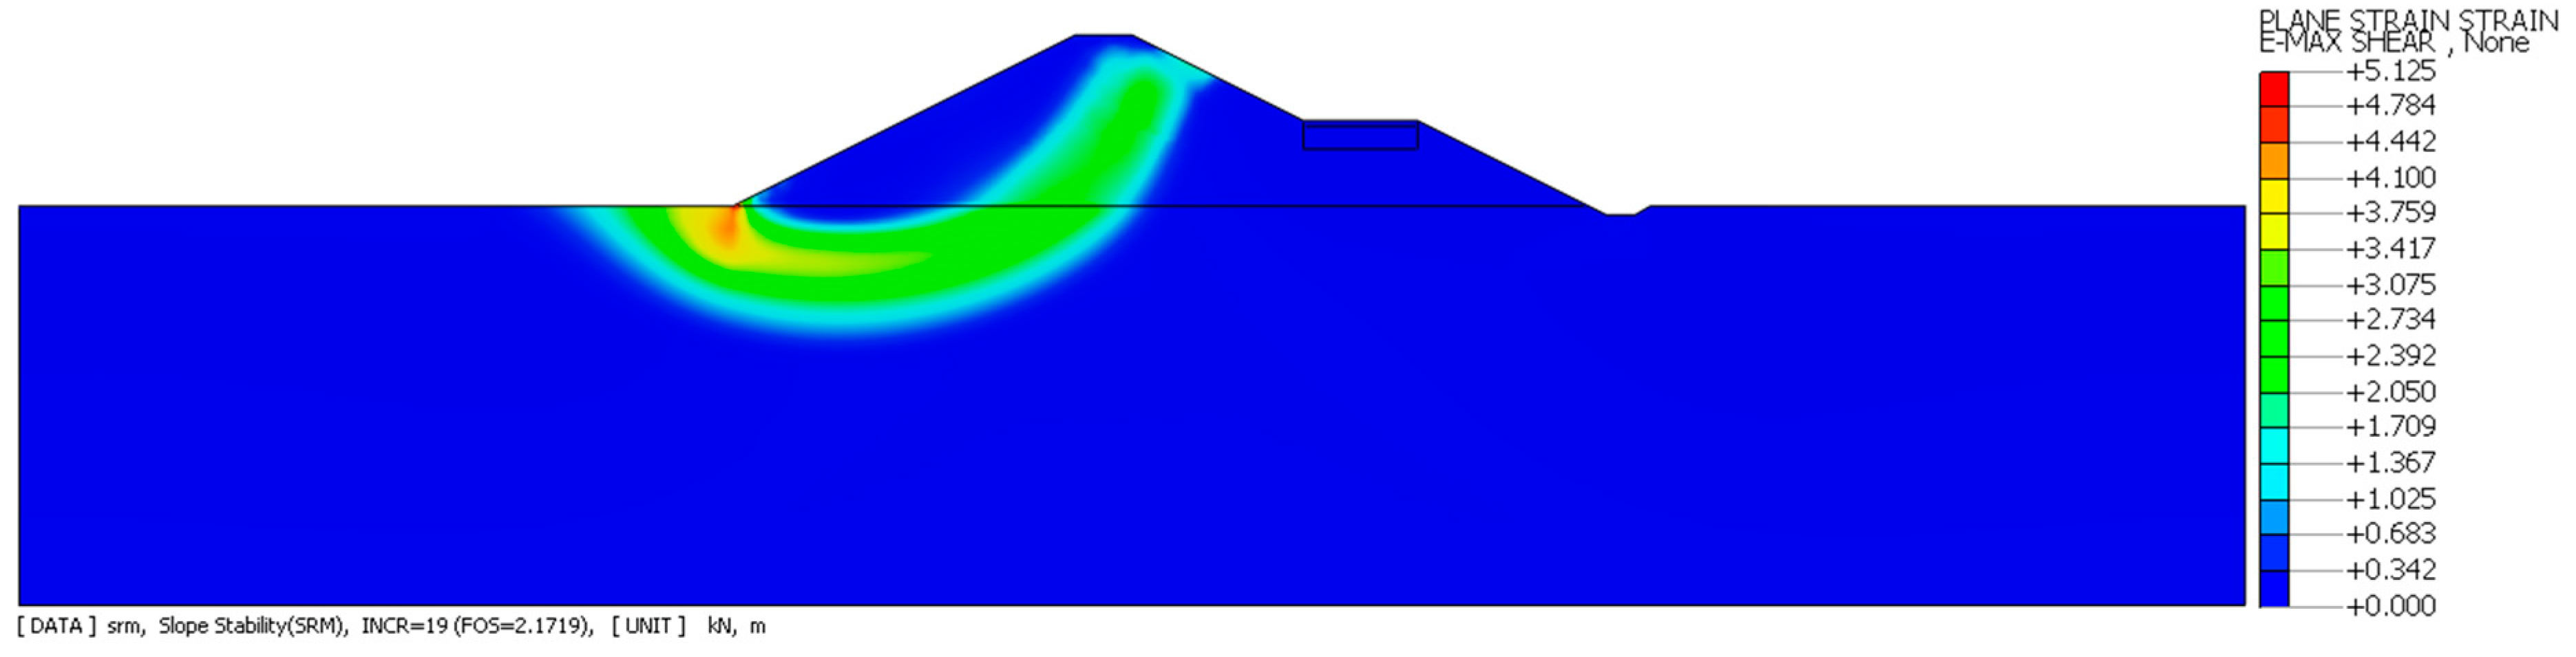
Figure 17.
Maximum specific deformations–initial conditions, shaft body made of mining waste with addition of Portland cement (FoS = 2.17), variant 2.
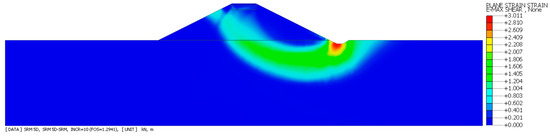
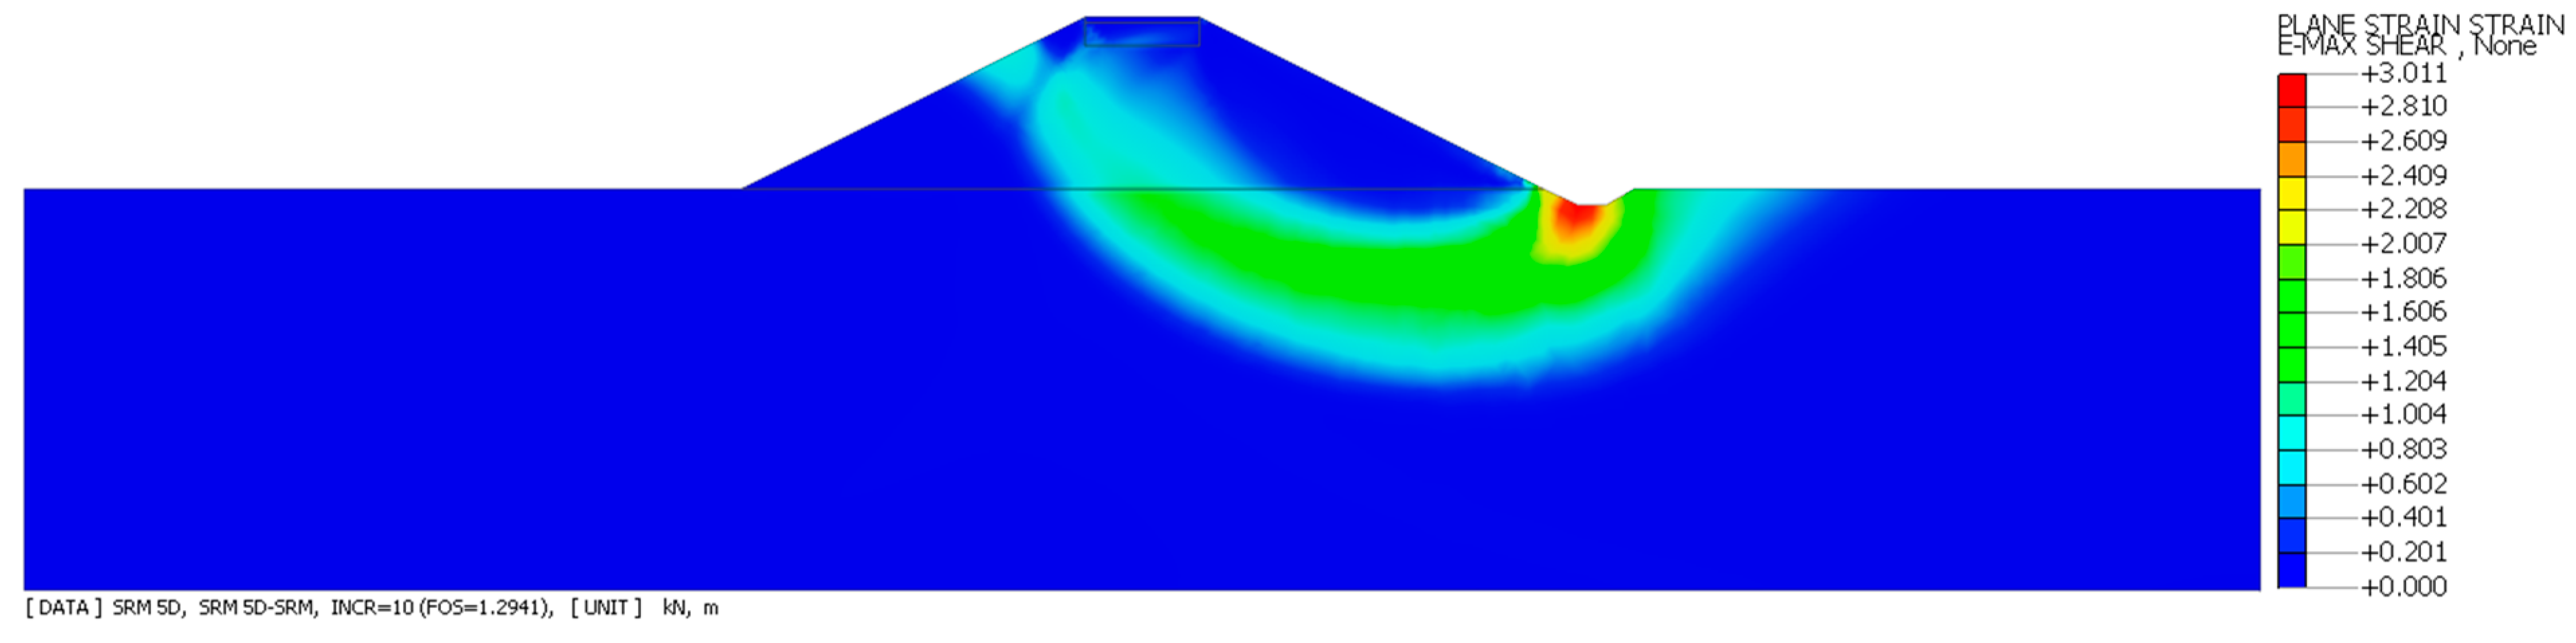
Figure 18.
Maximum specific deformations on the fifth day of water damming on the waterside slope, the embankment body made of mining waste with the addition of Portland cement (FoS = 1.29), variant 1.
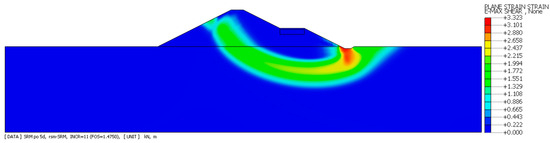
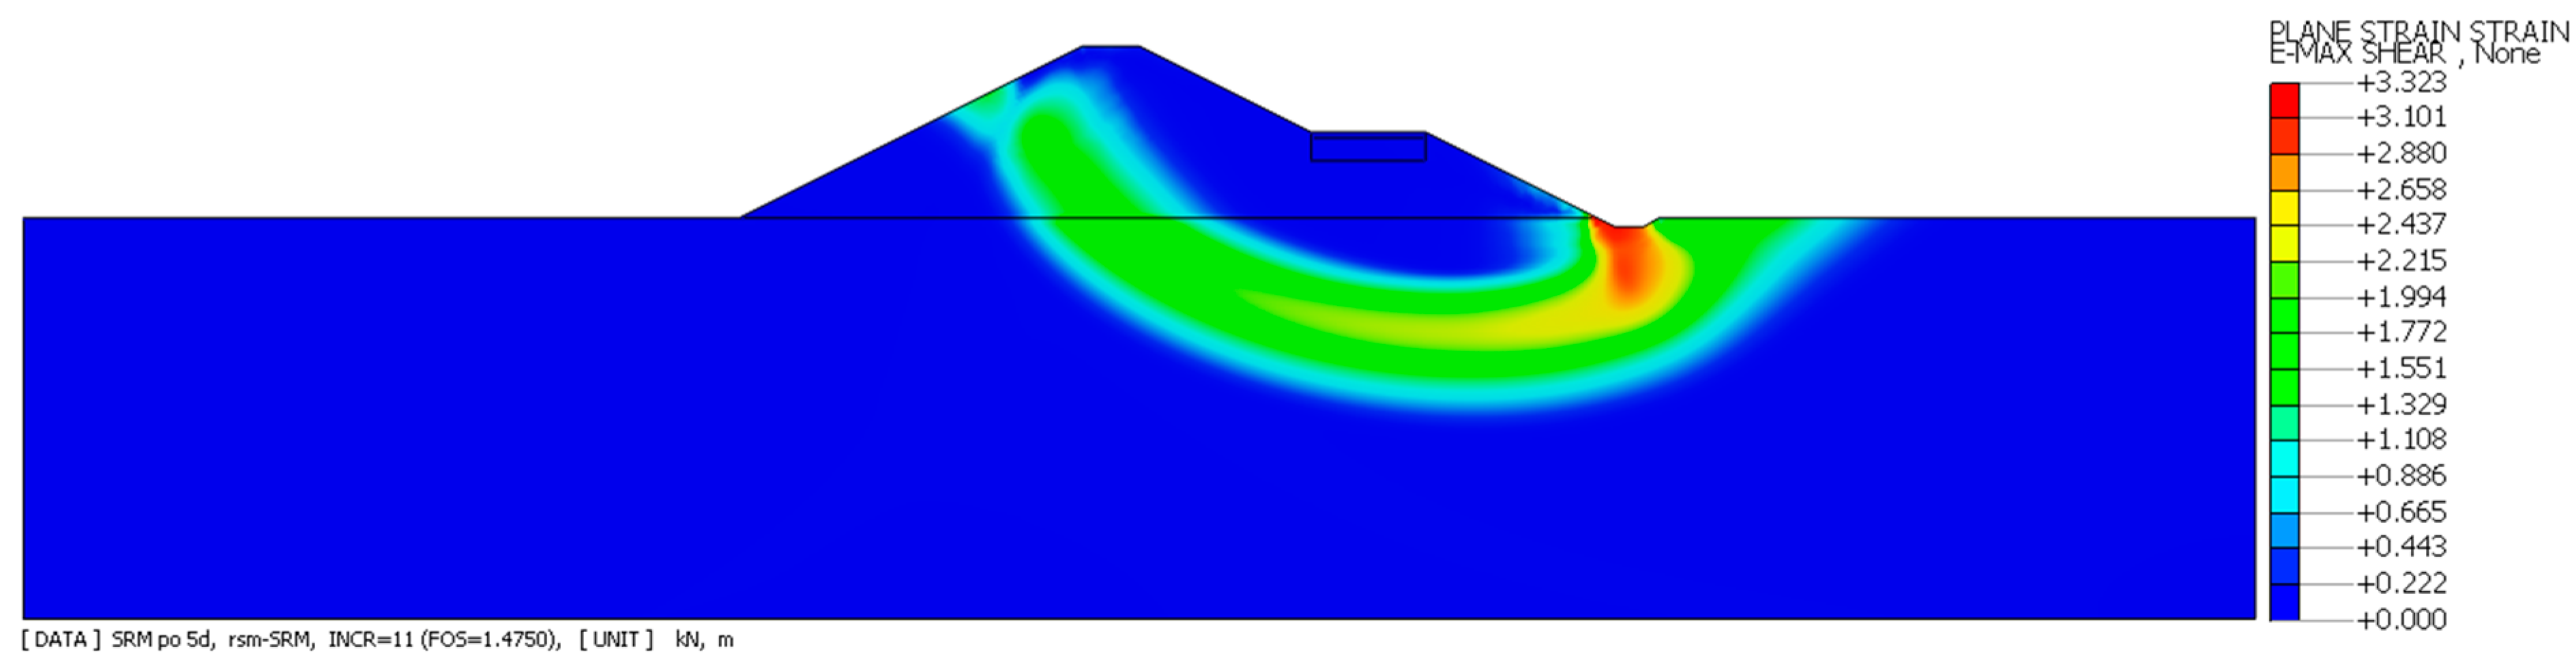
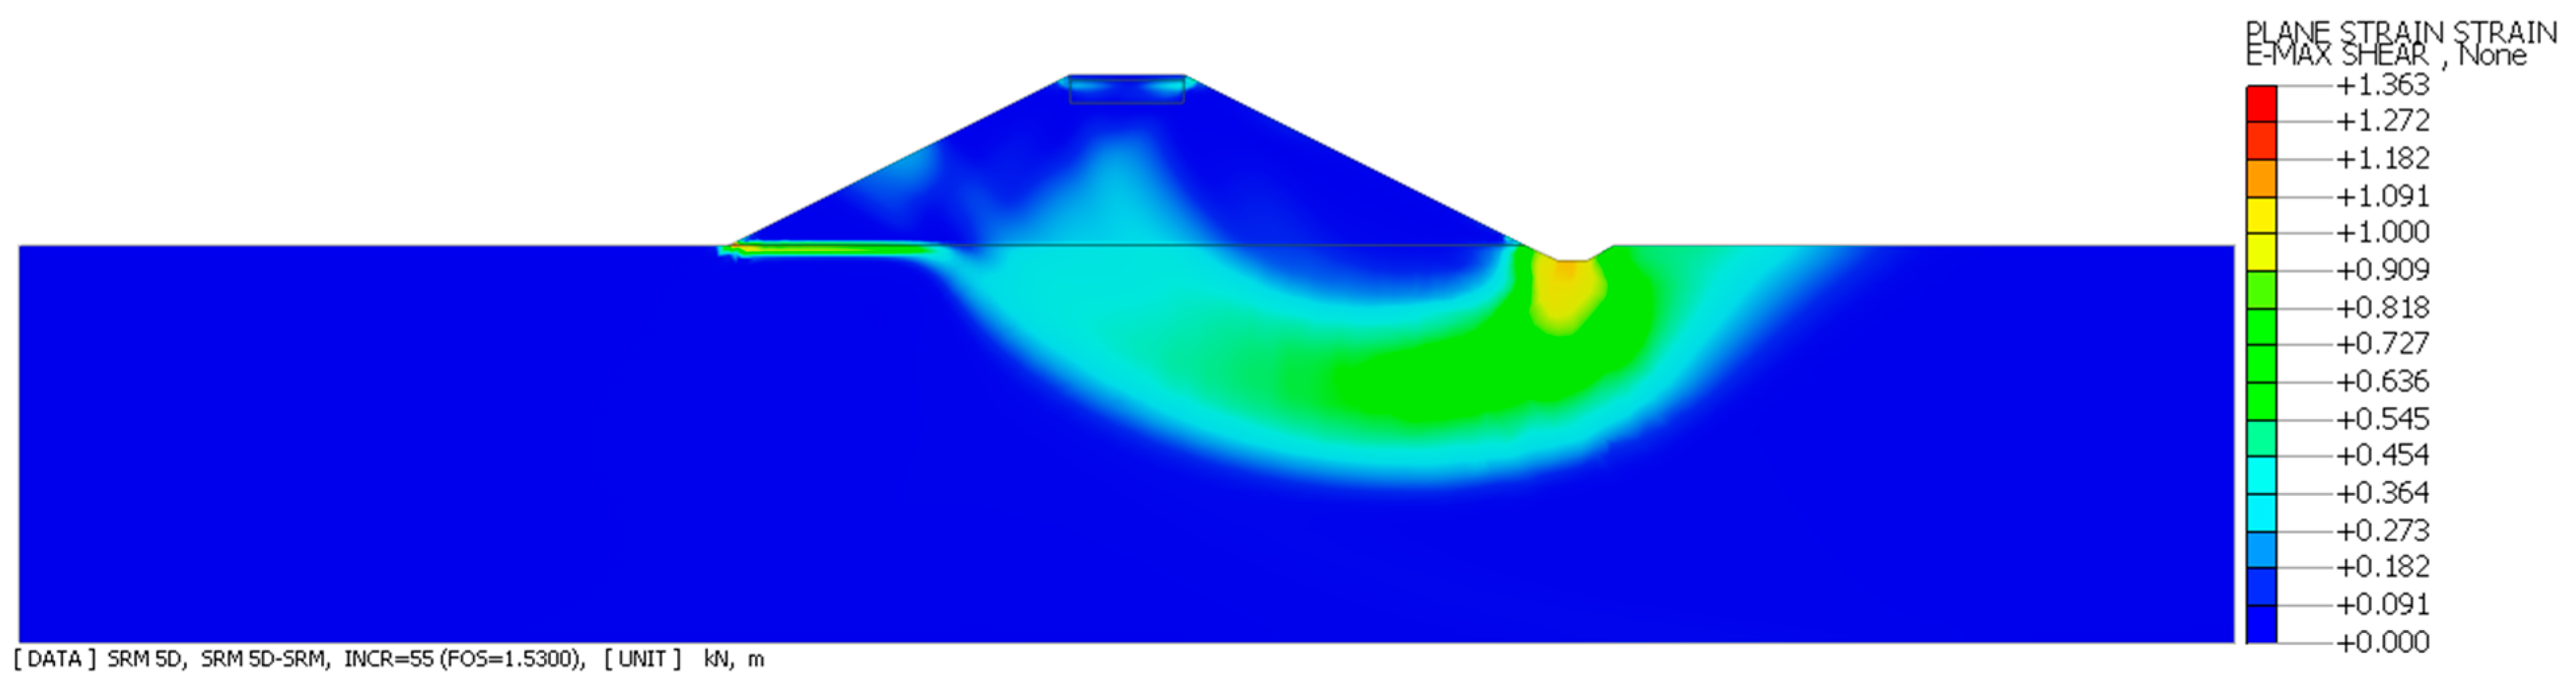
Figure 19.
Maximum specific deformations on the fifth day of water damming on the waterside slope, the embankment body made of mining waste with the addition of Portland cement (FoS = 1.47), variant 2.
Variant 1 and 2. A flood embankment made of mining waste with the addition of Portland cement in the initial state and on the fifth day of the flood wave.
For the first and second variants and with a vehicle load, flood embankments made of mining waste with the addition of Portland cement and loaded with a vehicle are stable and meet the required conditions, specifically that they have coefficients greater than FoS > 1.5 (Figure 20 and Figure 21). Probable slip planes in the first variant were formed on both sides of the embankment slopes (Figure 20), and in the second variant on the water side (Figure 21). In the highest flood wave, the flood embankment in variant 1 did not lose stability, but the stability coefficient was below the required value, FoS < 1.3 (Figure 22). On the fifth day of the flood wave, a probable slip plane was formed only on the air side of the flood embankment in both variants of the embankment shape (Figure 22 and Figure 23). The stability coefficient in the case of the second variant had the required value of FoS > 1.3.
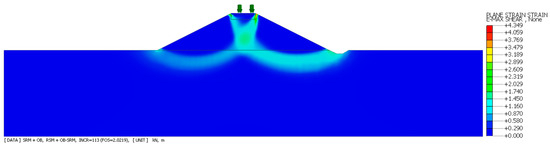
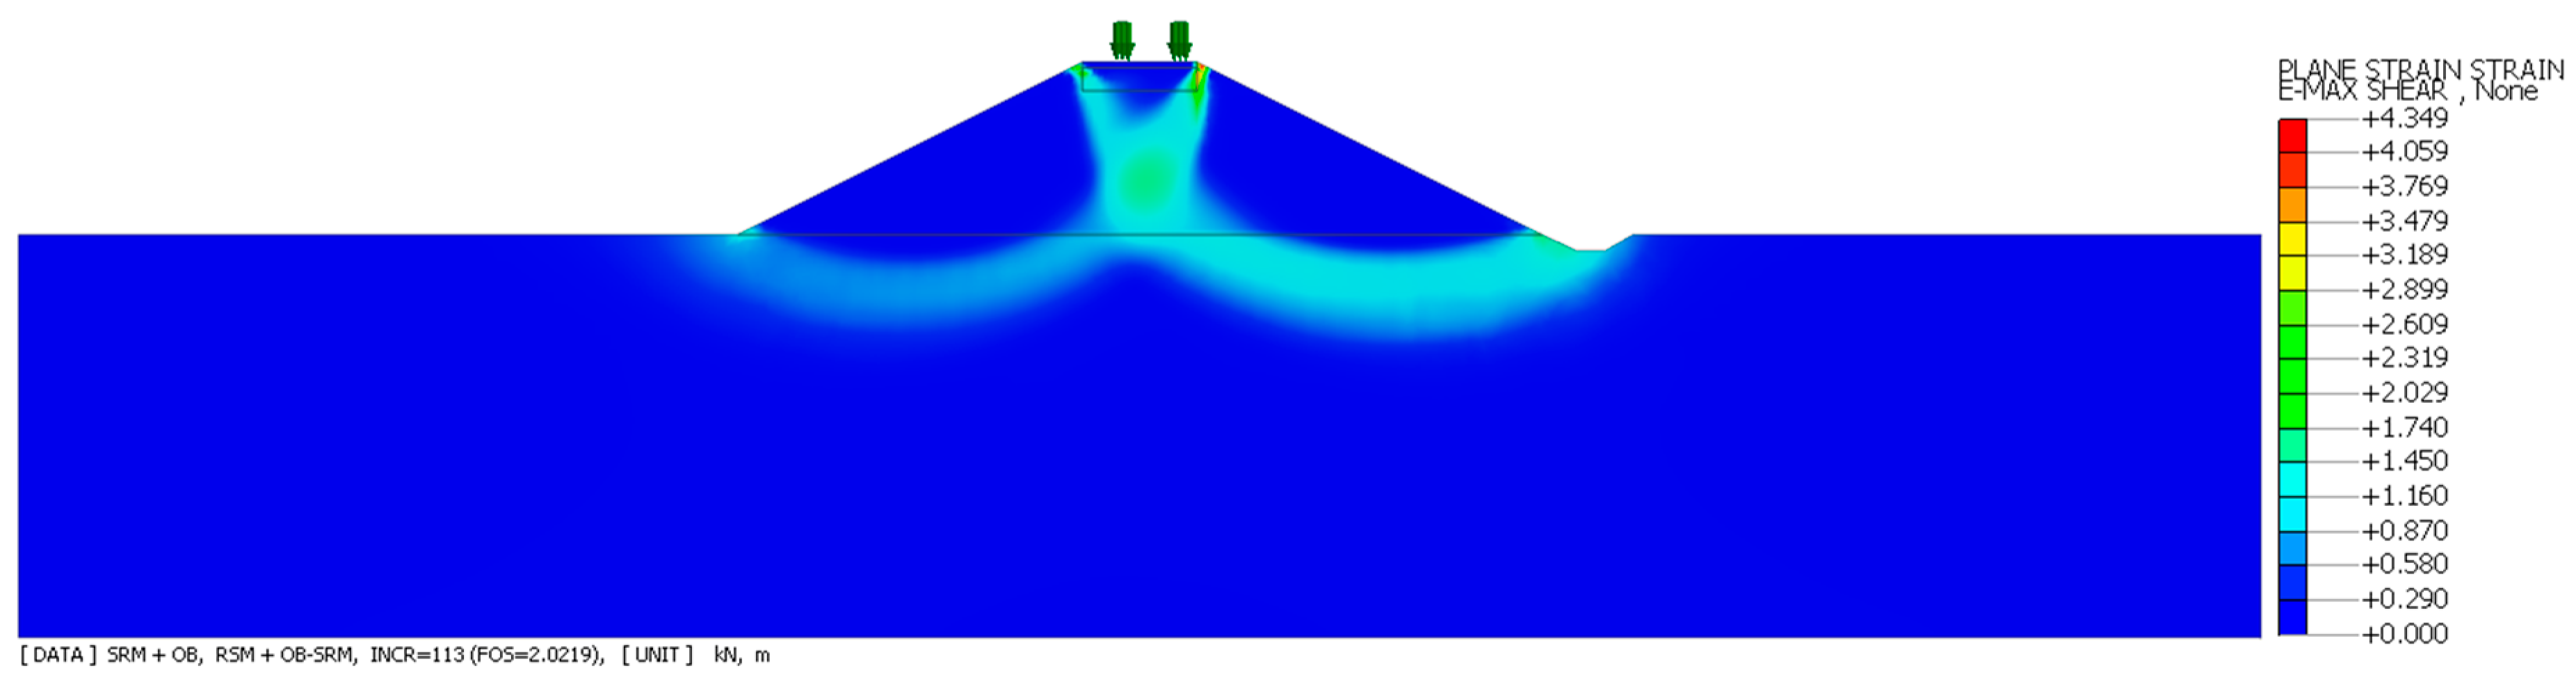
Figure 20.
Maximum specific deformations–initial conditions, shaft body made of mining waste with addition of Portland cement and vehicle loads (FoS = 2.02), variant 1.
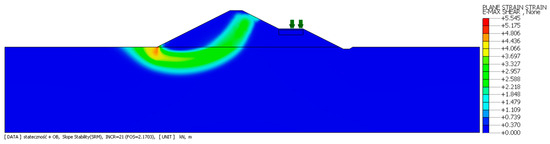
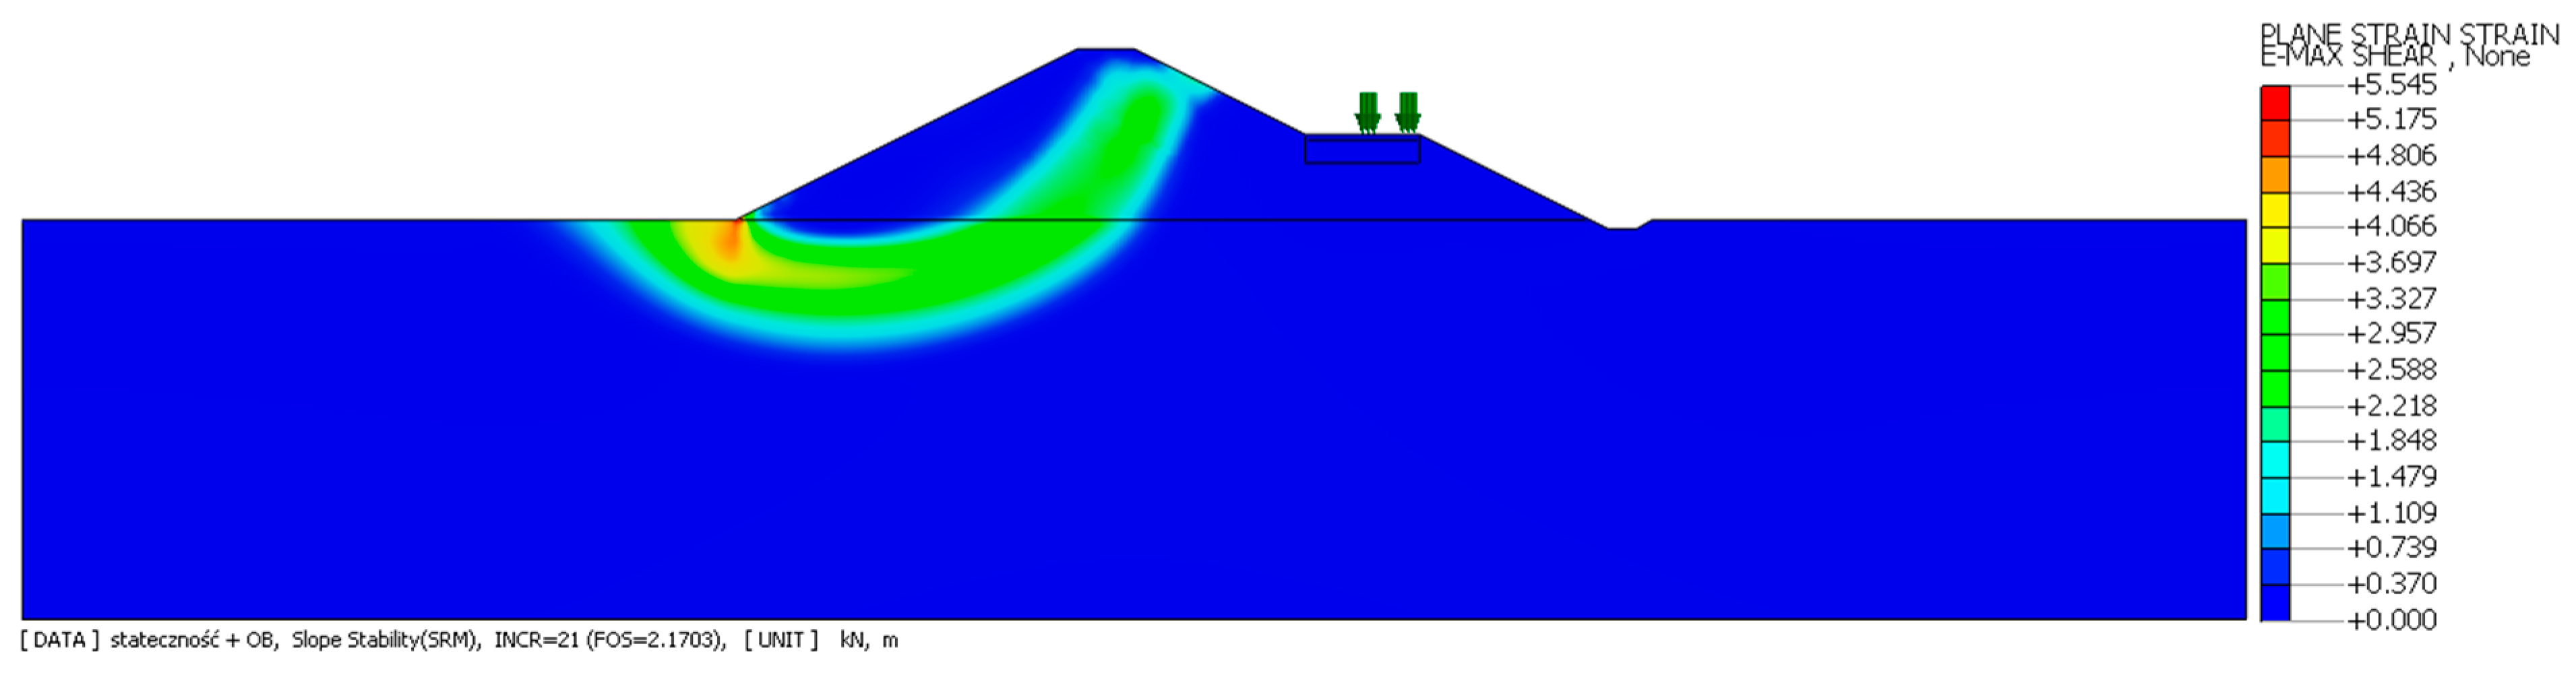
Figure 21.
Maximum specific deformations–initial conditions, shaft body made of mining waste with addition of Portland cement and with vehicle load (FoS = 2.17), variant 2.
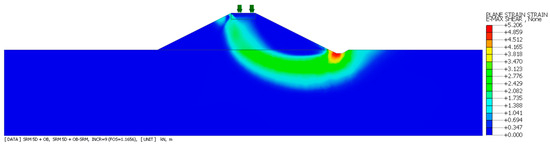
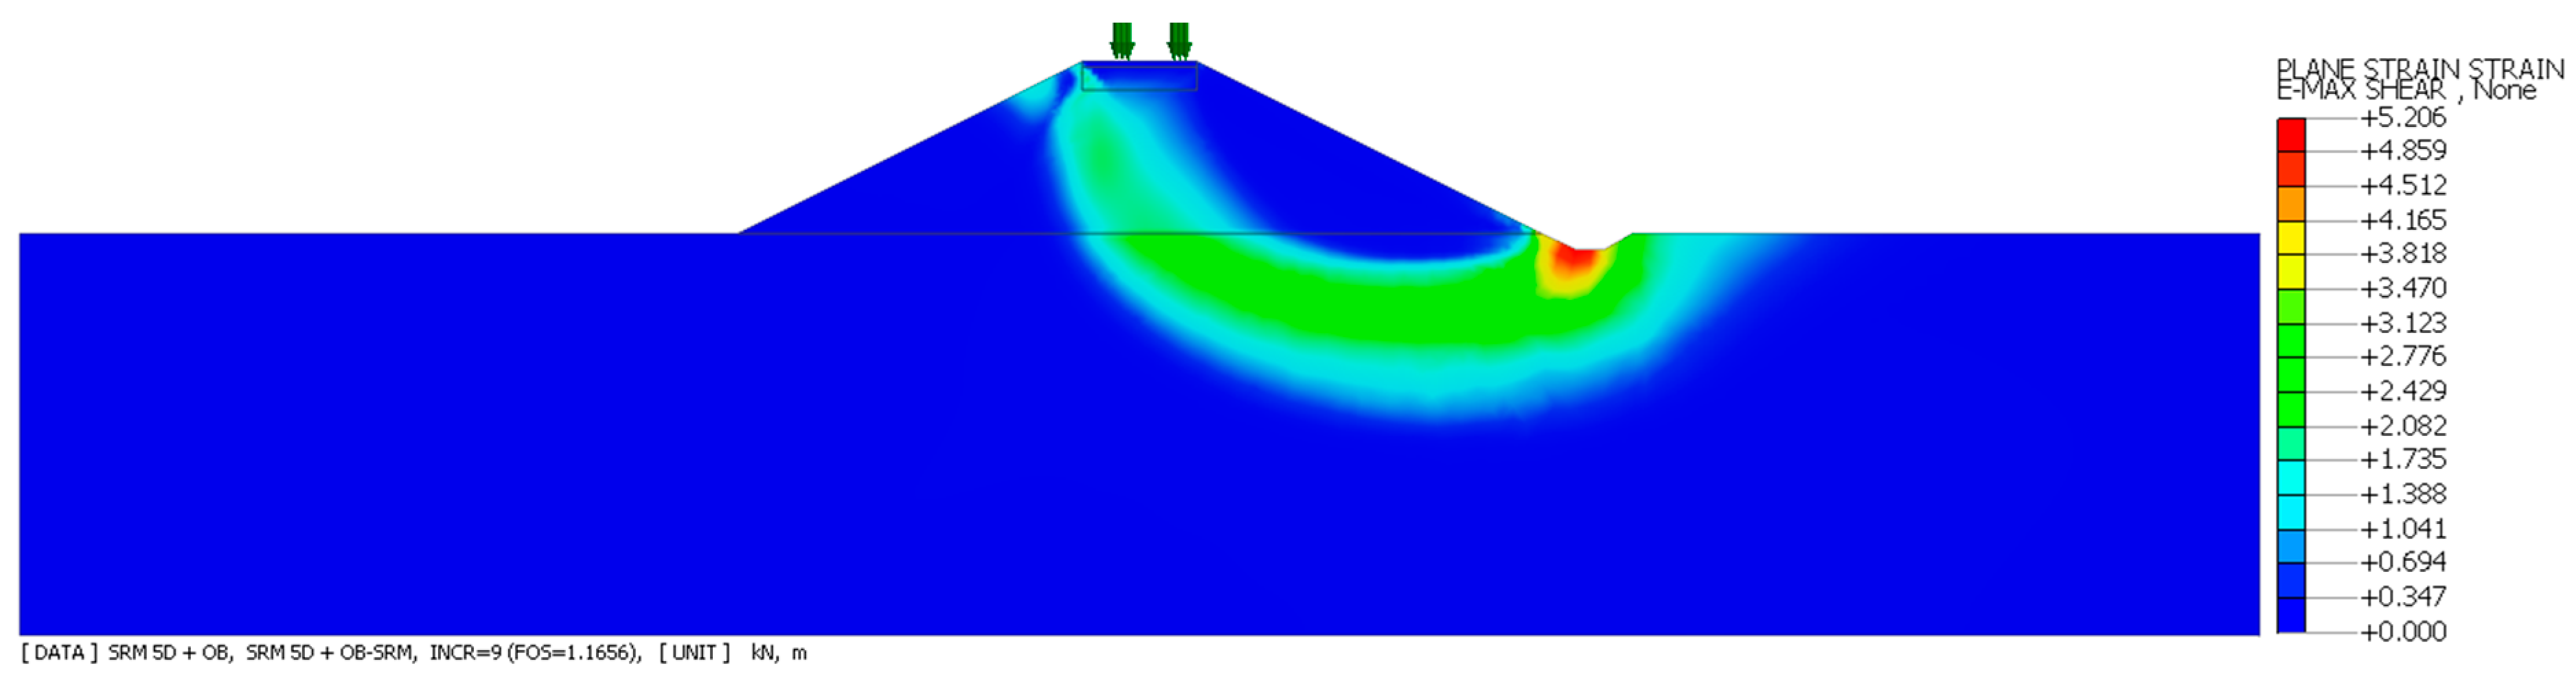
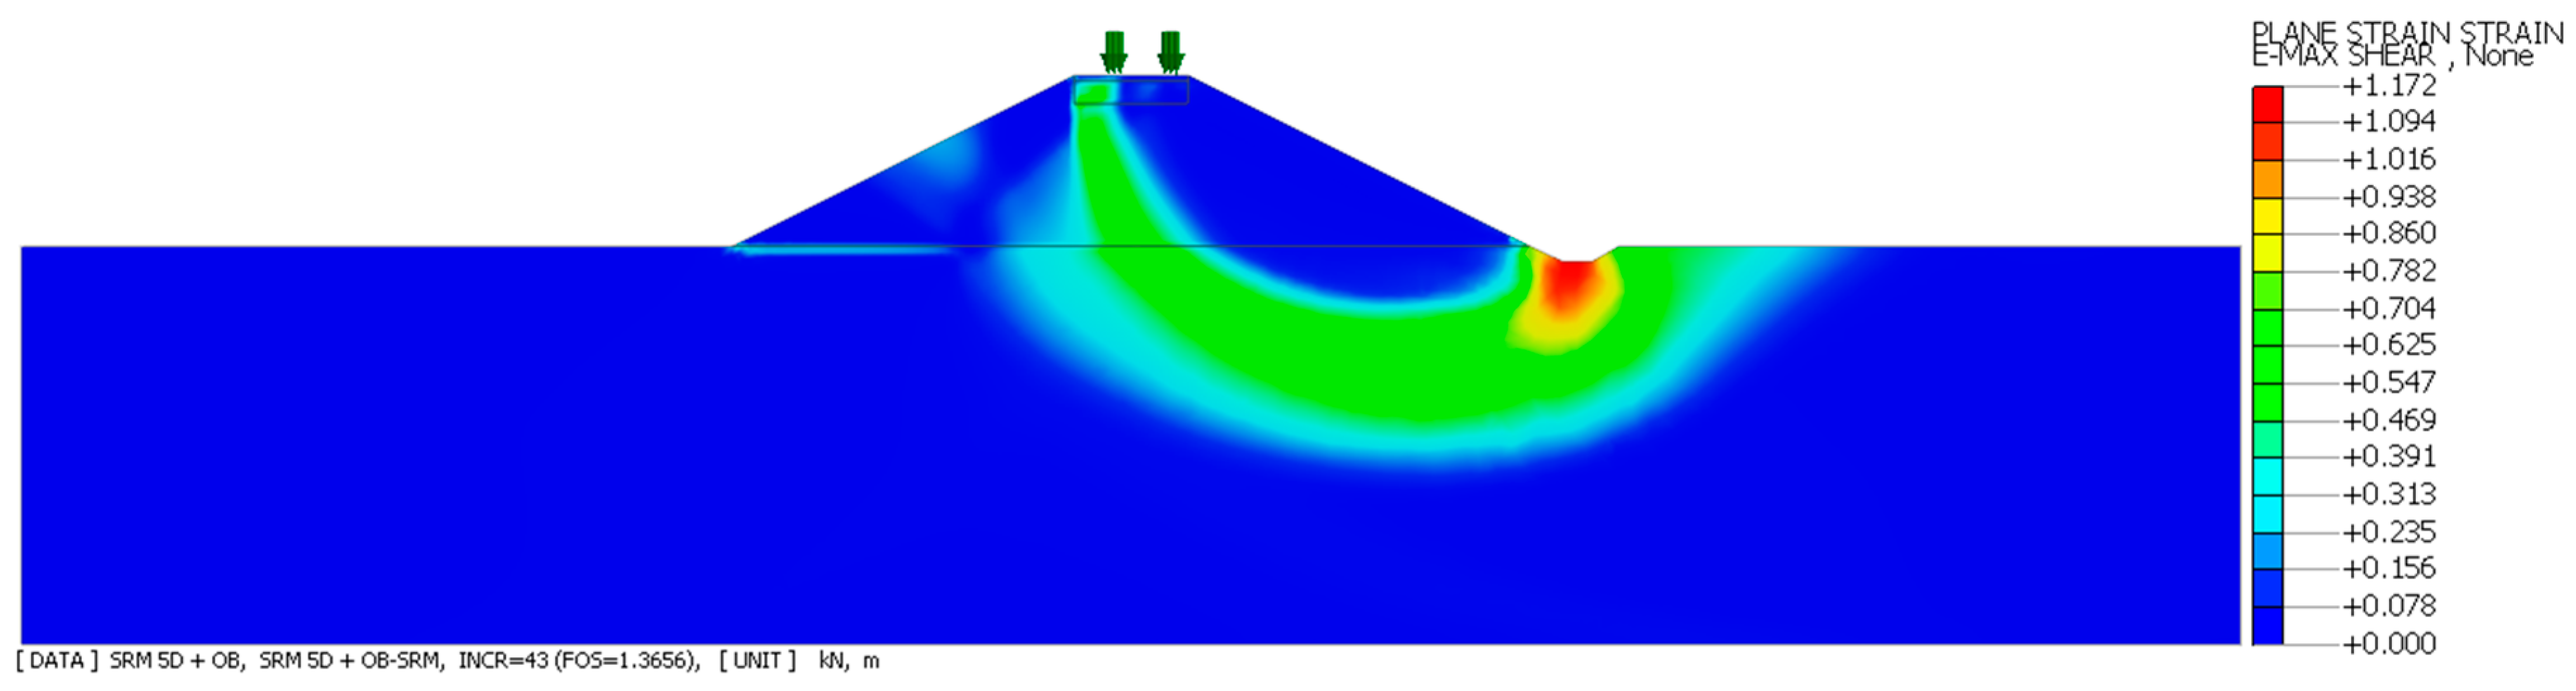
Figure 22.
Maximum shape deformations on the fifth day of water damming on the upstream slope, the embankment body made of mining waste with the addition of Portland cement and with a vehicle load (FoS = 1.17), variant 1.
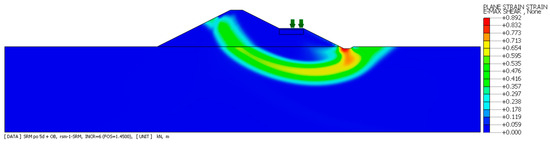
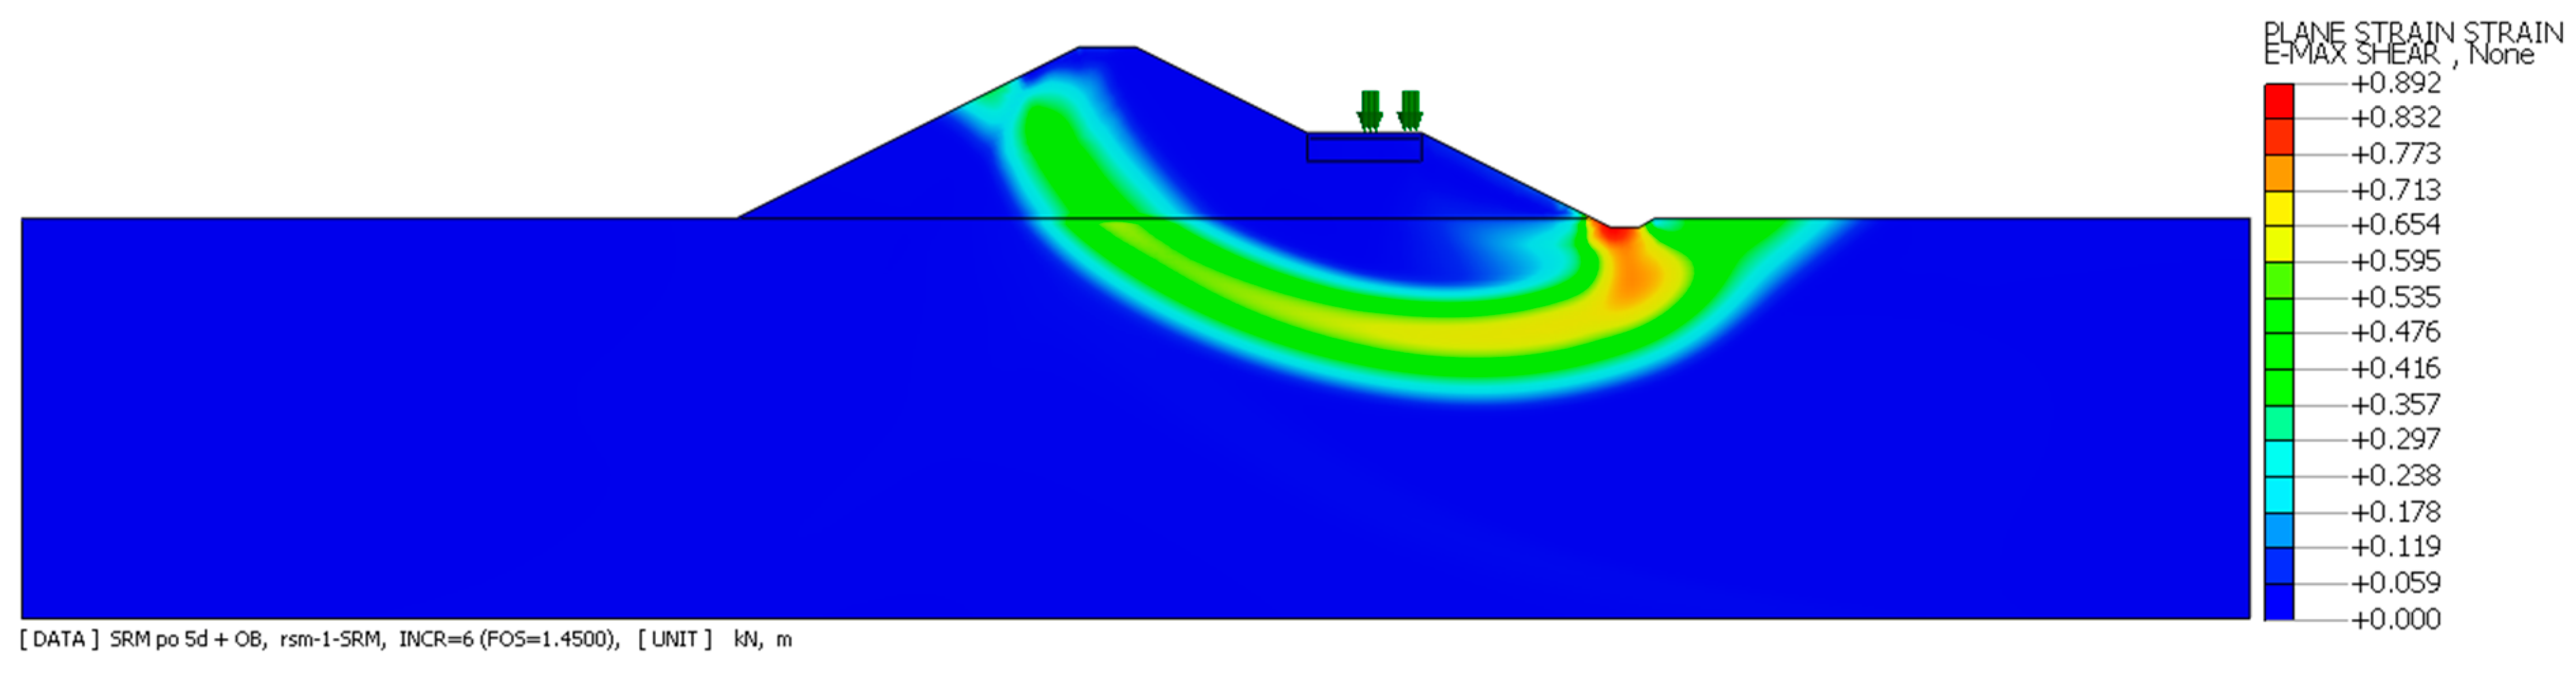
Figure 23.
Maximum specific deformations on the fifth day of water damming on the waterside slope, the embankment body made of mining waste with the addition of Portland cement and with a vehicle load (FoS = 1.45), variant 2.
Variant 1 and 2. A flood embankment made of mining waste with the addition of Portland cement and loaded with a vehicle, in the initial state and on the fifth day of the flood wave.
For the first and second variants and with a vehicle load, flood embankments made of mining waste with the addition of metallurgical cement are stable and meet the required conditions, i.e., they have coefficients greater than Fos > 1.5 (Figure 24 and Figure 25). Probable slip planes in the first variant were formed on both sides of the embankment slopes (Figure 24), and in the second variant, a more probable slip surface was formed on the water side (Figure 25). In the highest flood wave, the flood embankments in both variants lost their stability, and the stability coefficient was above the required value, i.e., FoS > 1.3 (Figure 26 and Figure 27). On the fifth day of the flood wave, a probable slip plane was formed only on the ventral side of the flood embankment in both variants of the embankment shape (Figure 26 and Figure 27).
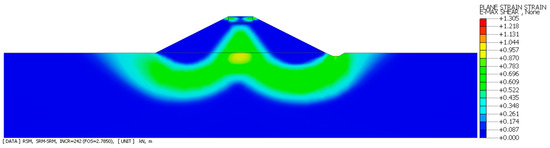
Figure 24.
Maximum specific deformations–initial conditions, shaft body made of mining waste with addition of metallurgical cement (FoS = 2.79), variant 1.

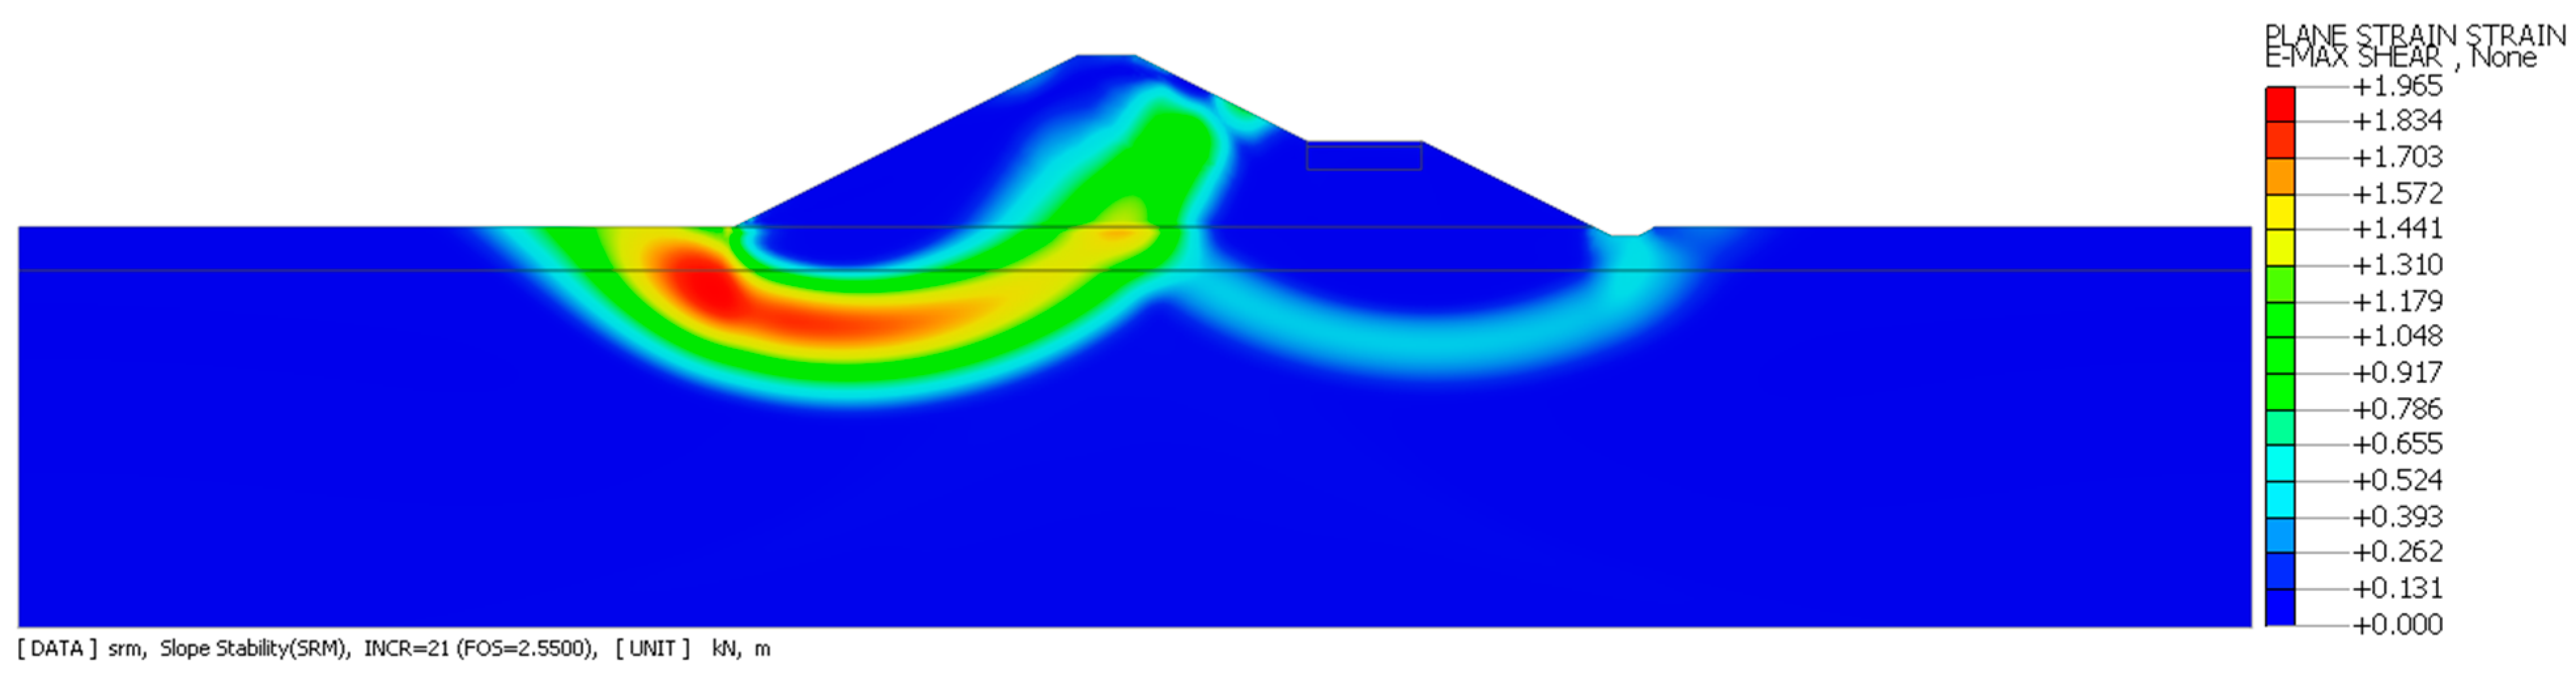
Figure 25.
Maximum specific deformations–initial conditions, shaft body made of mining waste with addition of metallurgical cement (FoS = 2.55), variant 2.

Figure 26.
Maximum specific deformations on the fifth day of water damming on the waterside slope, the embankment body made of mining waste with the addition of metallurgical cement (FoS = 1.53), variant 1.

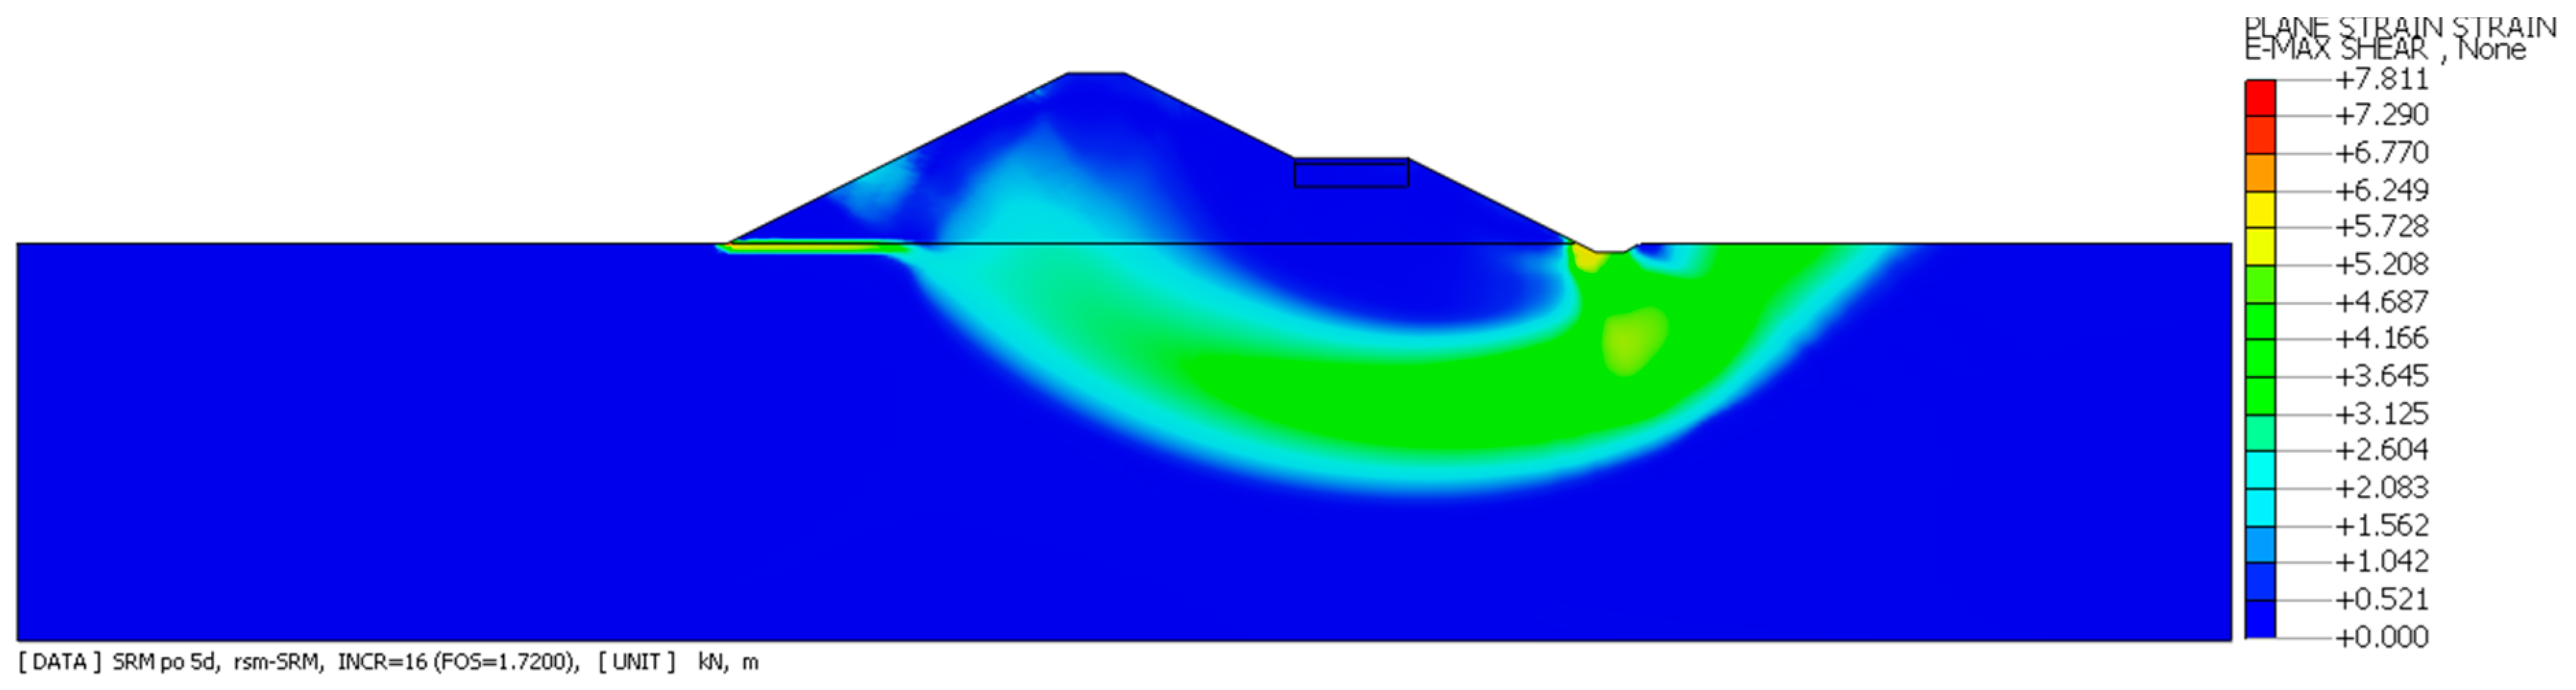
Figure 27.
Maximum specific deformations on the fifth day of water damming, the embankment body made of mining waste with the addition of metallurgical cement (FoS = 1.72), variant 2.
Variant 1 and 2. A flood embankment made of mining waste with the addition of metallurgical cement, in the initial state and on the fifth day of the flood wave.
For the first and second variants and with a vehicle load, flood embankments made of mining waste with the addition of metallurgical cement are stable and meet the required conditions, i.e., they have coefficients greater than Fos > 1.5 (Figure 28 and Figure 29). In the first variant, probable slip planes were formed on both sides of the embankment slopes (Figure 28), and in the second variant, a more probable slip surface was formed on the water side (Figure 29). In the highest flood wave, the flood embankments in both variants are stable, and the stability coefficient was above the required value, i.e., FoS > 1.3 (Figure 30 and Figure 31). On the fifth day of the flood wave, a probable slip plane was formed only on the ventral side of the flood embankment in both variants of the embankment shape (Figure 30 and Figure 31).
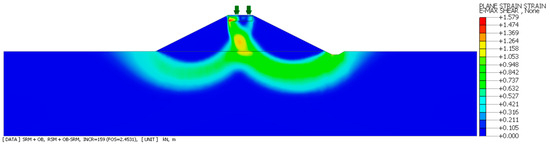
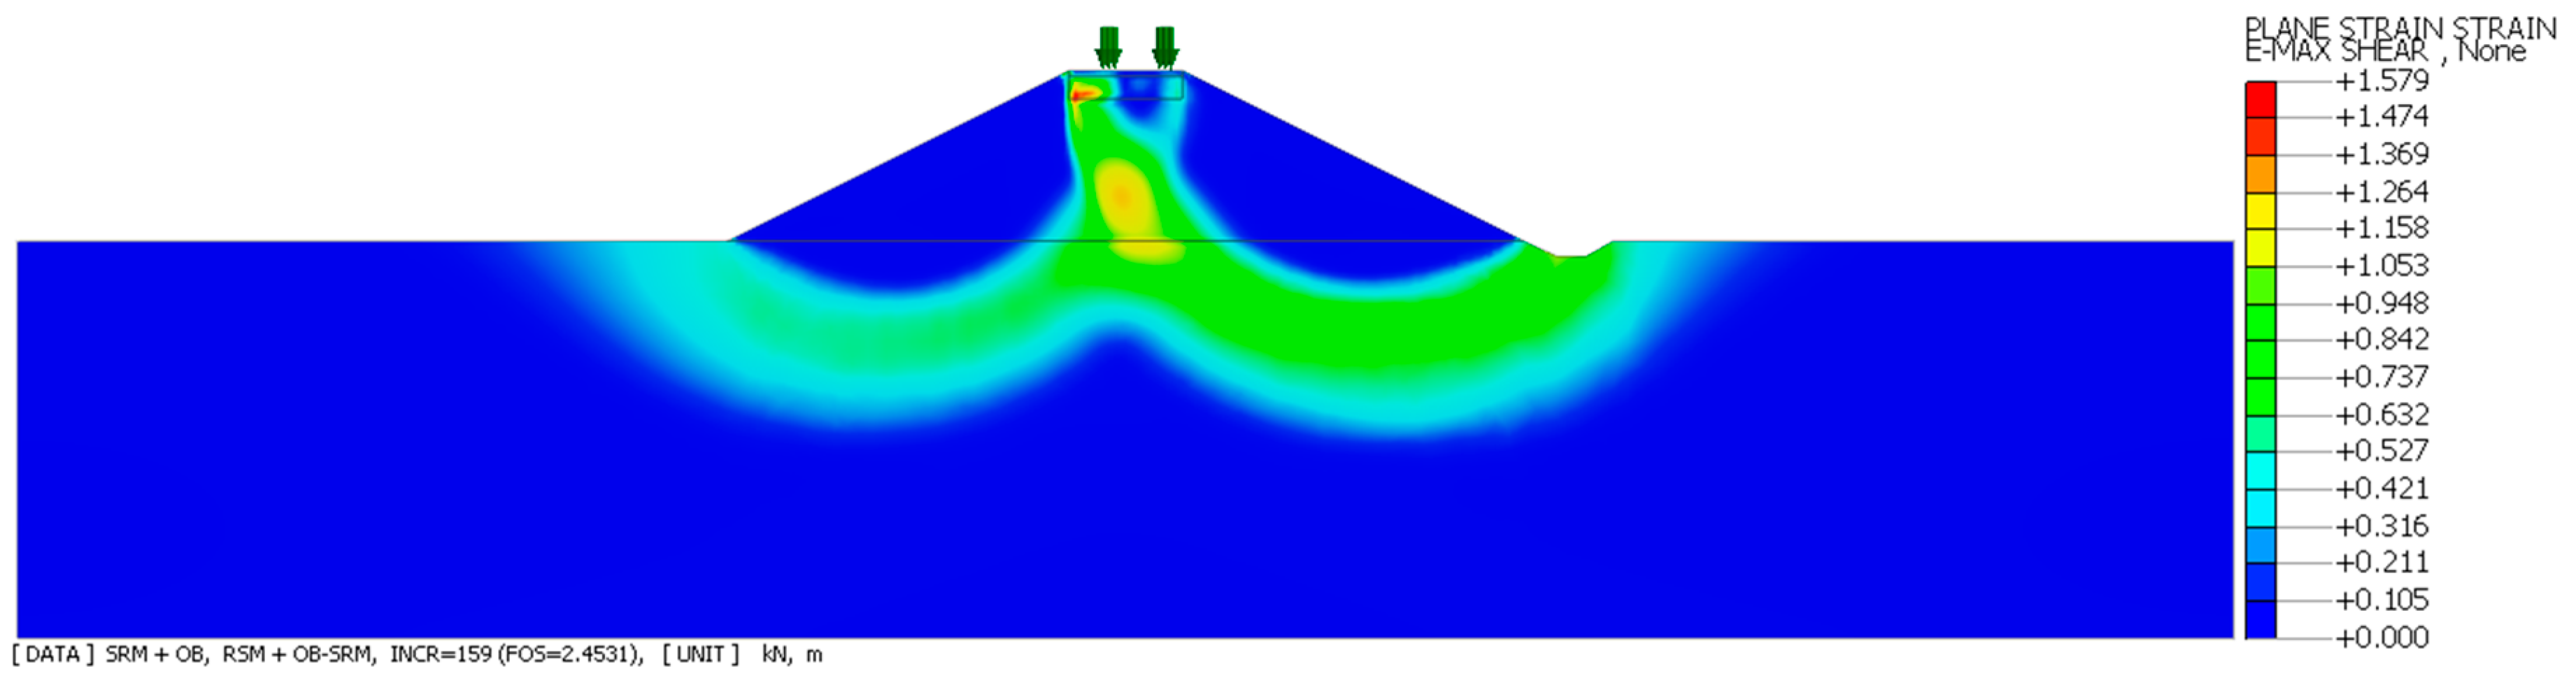
Figure 28.
Maximum specific deformations–initial conditions, embankment body made of mining waste with addition of metallurgical cement and loads from vehicles (FoS = 2.45), variant 1.

Figure 29.
Maximum specific deformations–initial conditions, shaft body made of mining waste with addition of metallurgical cement and loads from vehicles (FoS = 2.55), variant 2.

Figure 30.
Maximum shape deformations on the fifth day of water damming on the upstream slope, the embankment body made of mining waste with the addition of metallurgical cement and with a vehicle load (FoS = 1.37), variant 1.
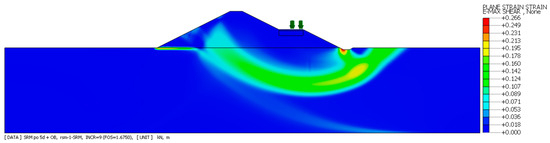
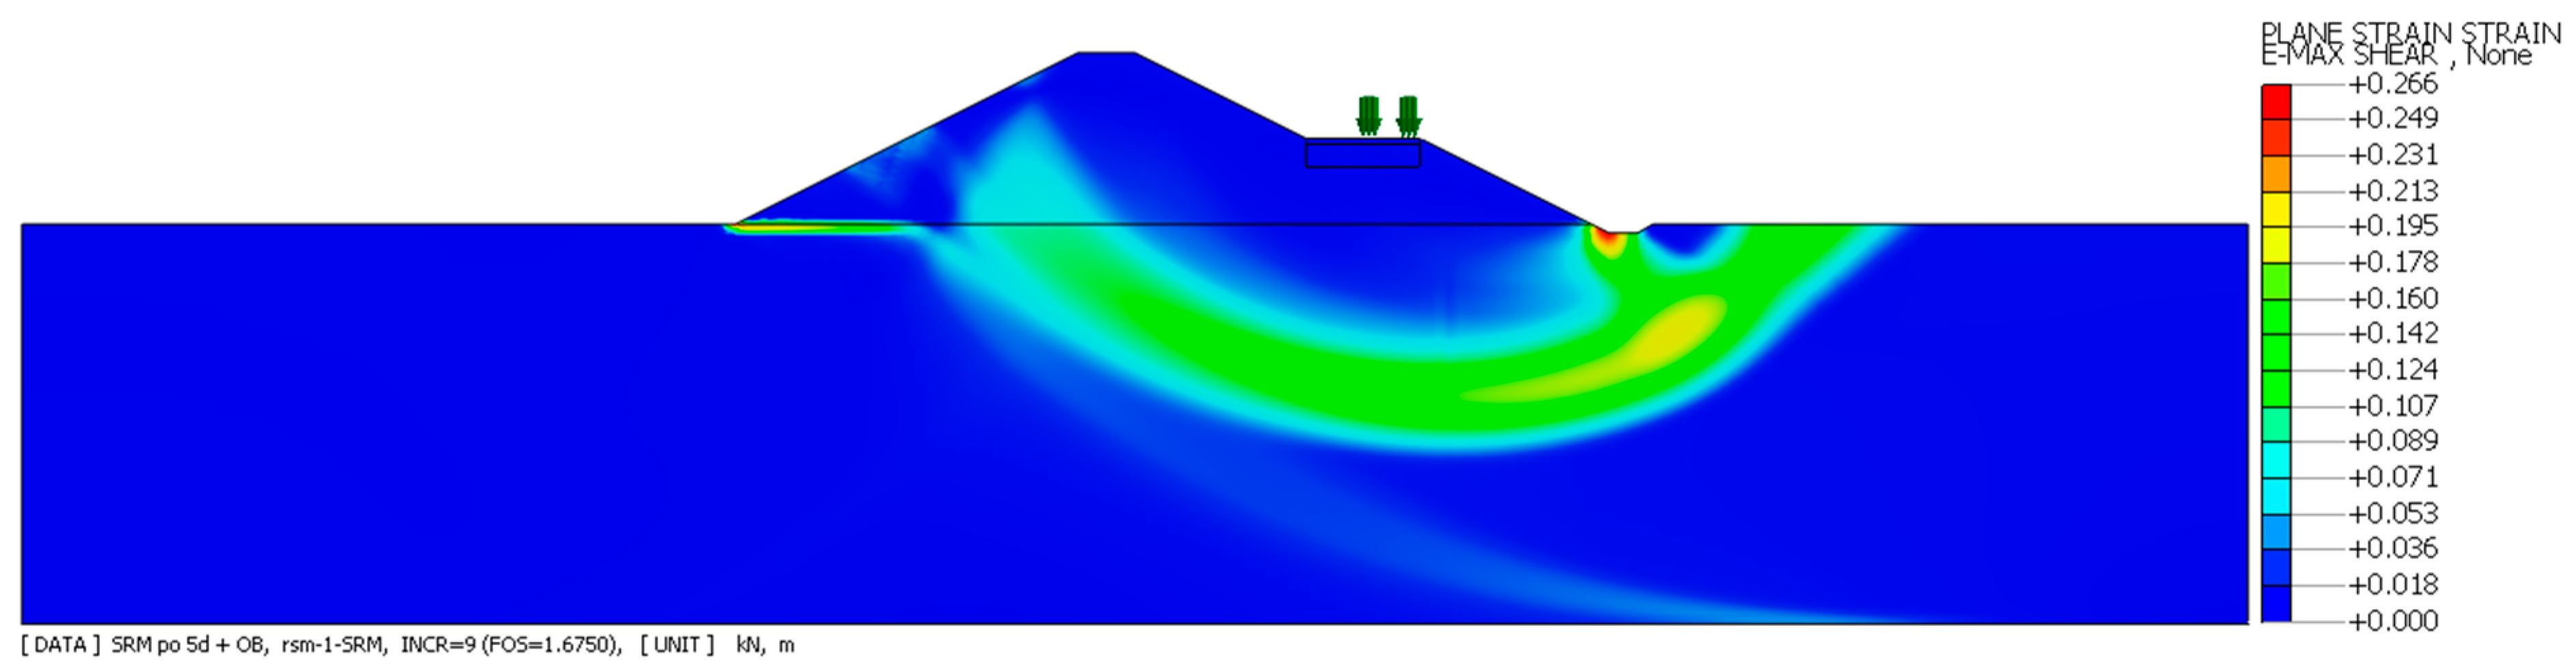
Figure 31.
Maximum specific deformations on the fifth day of water damming on the upstream slope, the embankment body made of mining waste with the addition of metallurgical cement and with a vehicle load (FoS = 1.67), variant 2.
Variant 1 and 2. A flood embankment made of mining waste with the addition of metallurgical cement and loaded with a vehicle, in the initial state and on the fifth day of the flood wave.
The vehicle loading of the embankment made of mining waste with the addition of metallurgical cement did not result in a loss of stability. The calculations show that the shaft with the addition of metallurgical cement meets the required stability coefficients for all calculation variants and additional loads (water and vehicle traffic). Table 4 presents the values of the stability coefficients for all computational variants.
6. Conclusions
Considering the Polish regulations of the Minister of the Environment on the technical conditions to be met by hydrotechnical structures and their location [26], the stability of flood embankments that also serve as road embankments must have a stability coefficient greater than 1.5 (FoS > 1.5). In the case of the highest flood wave level, the stability coefficient must be greater than 1.3 (FoS > 1.3). In the FEM calculations, the highest level of the flood wave was assumed for the fifth day, in accordance with the hydrograph of water damming on a water slope (Figure 7).
The FEM tests conducted above and the numerical analyses in the MIDAS program show that, because the FoS stability coefficient is greater than 1.5, the stability of the flood embankment will be maintained for the initial conditions in each of the calculated cases (Table 4).
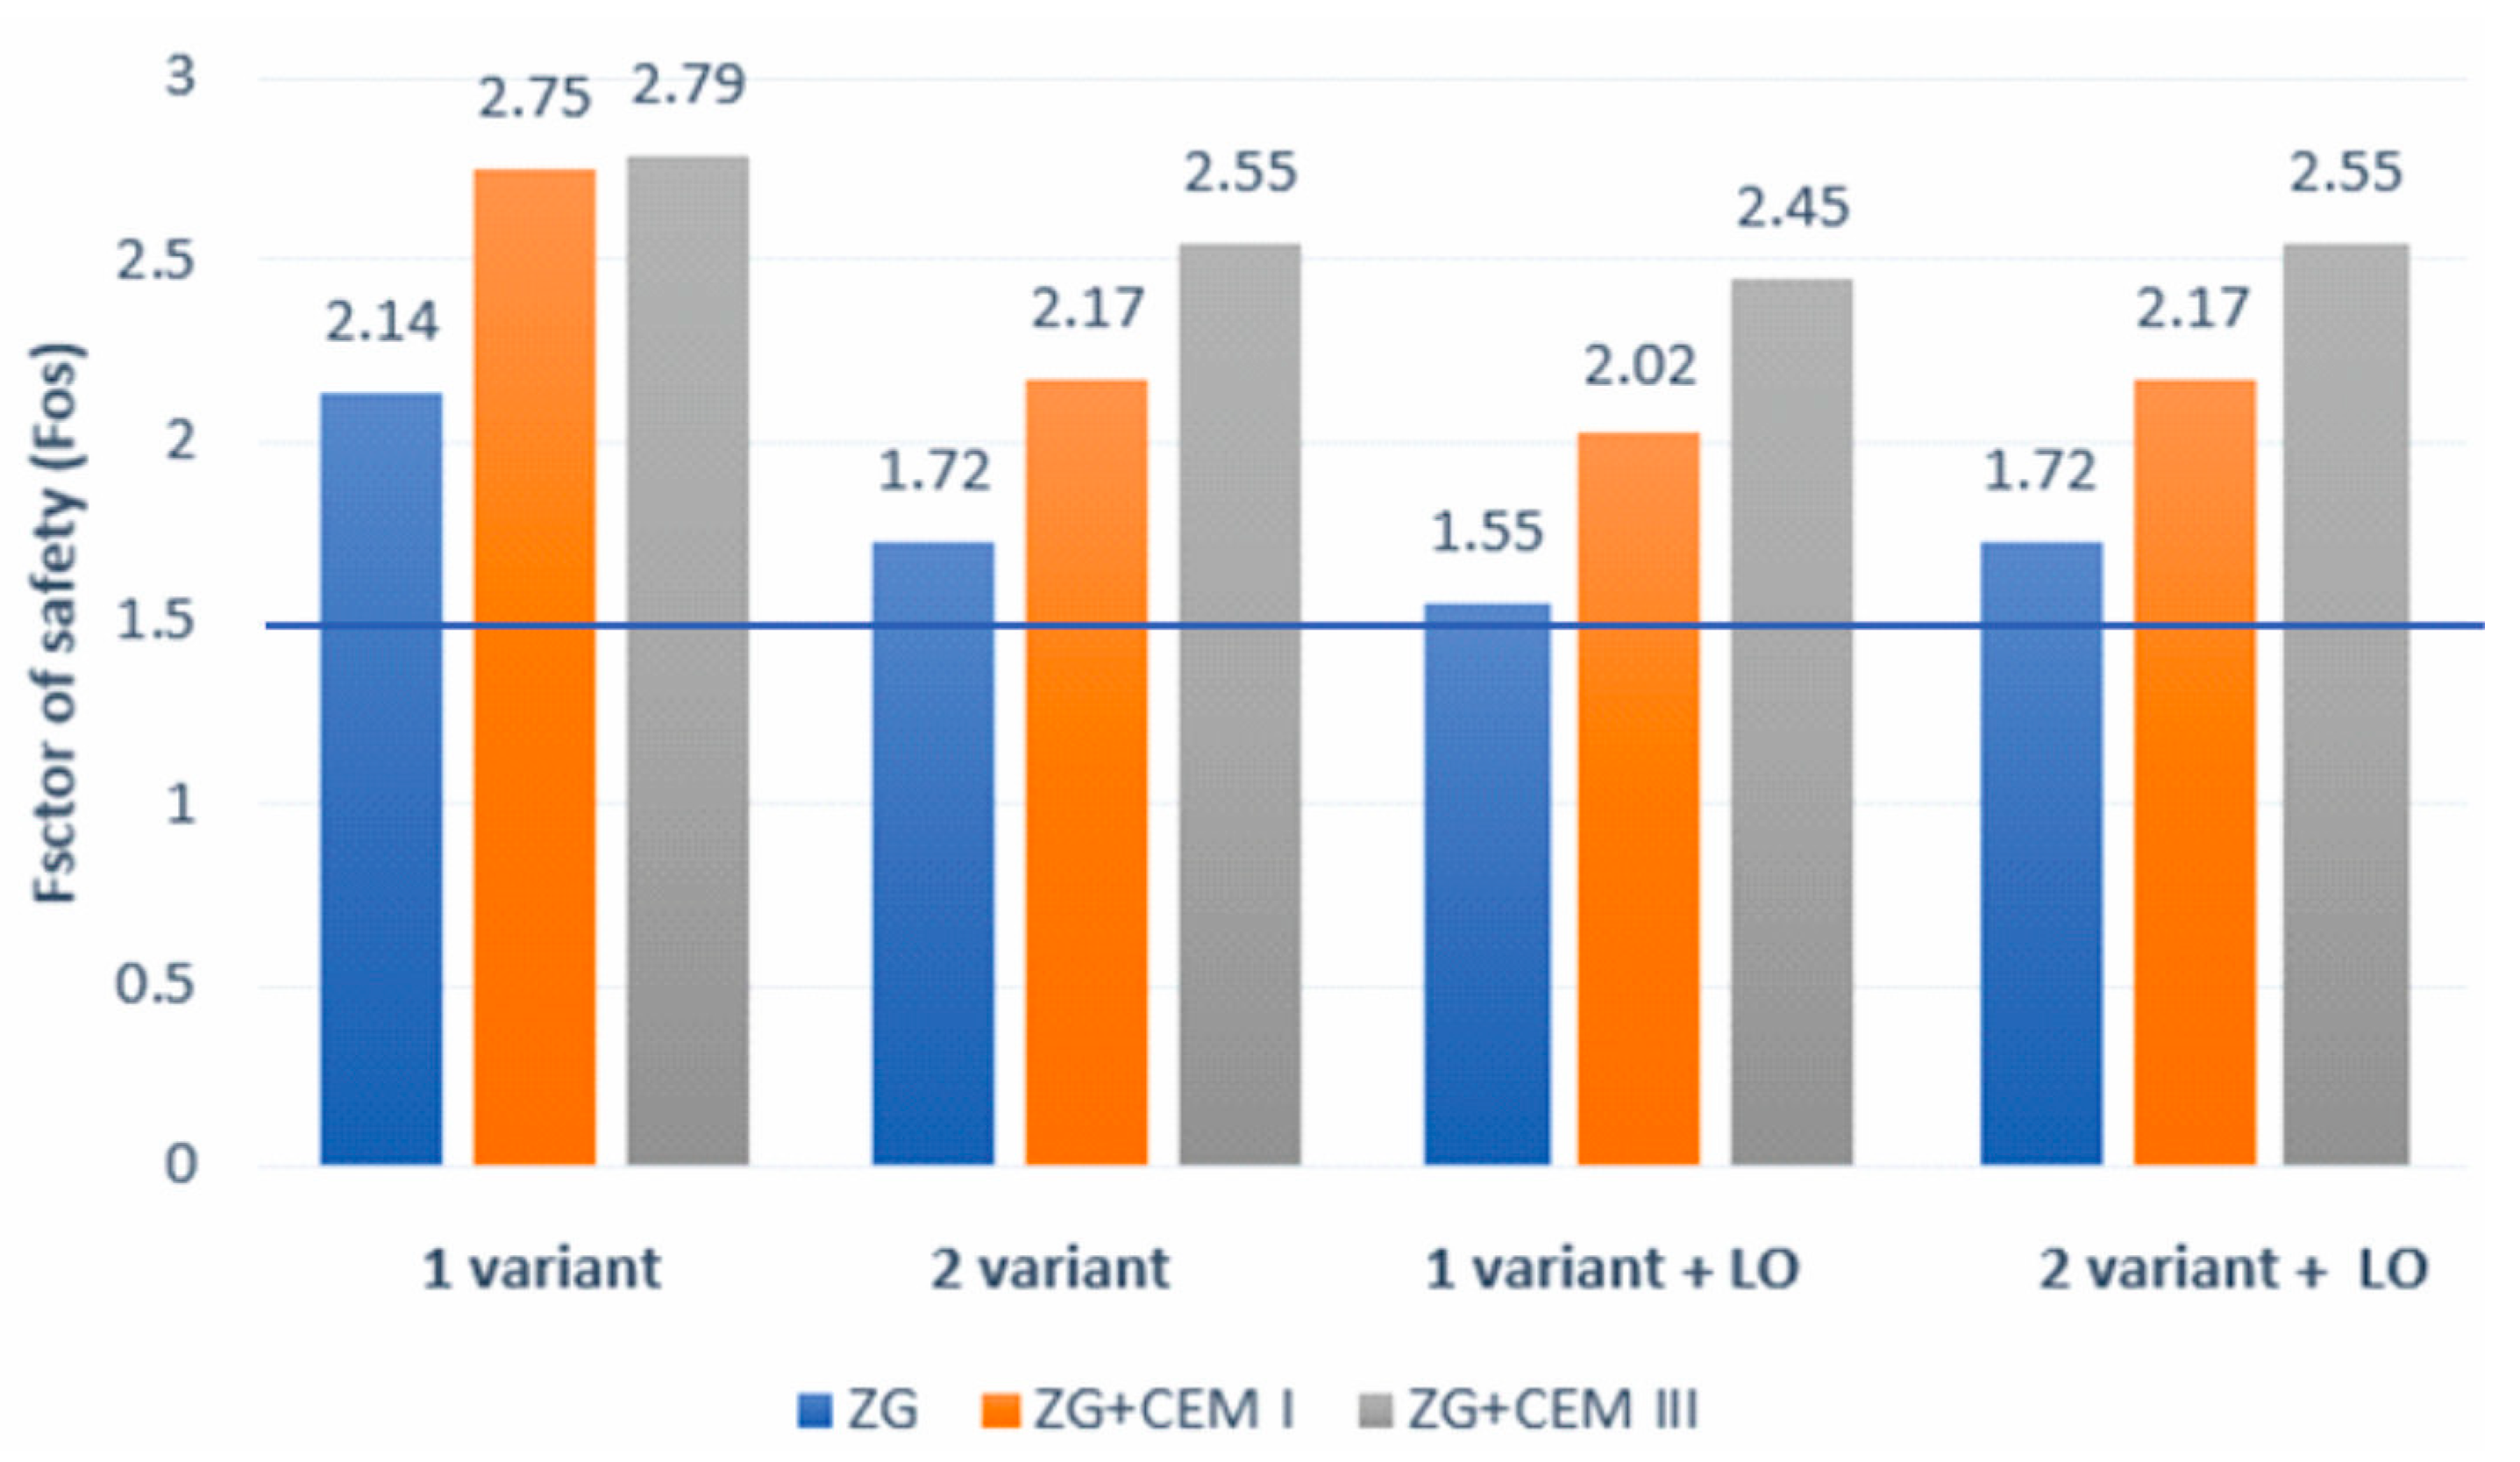
Figure 32 shows the individual stability coefficients. The best results were achieved for a flood embankment made of mining waste with the addition of 8% metallurgical cement and not loaded with a vehicle (Fos = 2.79). For a loaded vehicle, the best result of the FoS stability coefficient is for mining waste with the addition of 8% metallurgical cement (Fos = 2.55) in the second variant, where the road is on the side of the air slope.
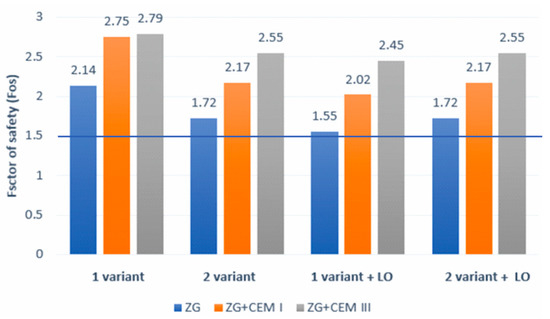
Figure 32.
Changes in the value of the stability coefficient of flood embankments made of ZG mining waste for initial conditions, 1 variant, 2 variant, 1 variant + LO (vehicle load), 2 variant + LO (vehicle load), blue line—FoS = 1.5.
The situation is different in the case of flood embankments where the flood wave occurs on the fifth day, i.e., at the highest water level (Table 4). Figure 33 shows all the analysed cases in variant 1 (with the road at the top of the embankment) and in variant 2 (when the road runs on the slope of the slope). As you can see, no flood embankment built from mining waste alone maintained the required stability coefficient FoS > 1.3. An FoS stability coefficient greater than 1.3 is the value required in Poland according to Polish requirements, i.e., regulation [26] in the case of the highest flood wave level.
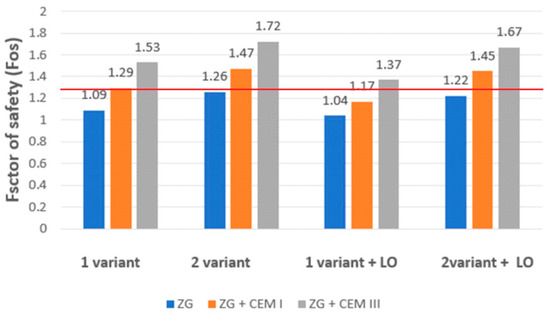
Figure 33.
Changes in the value of the stability coefficient of flood embankments made of mining waste during the passage of a flood wave, 1 variant, 2 variant, 1 variant + LO (vehicle load), 2 variant + LO (vehicle load), red line—FoS = 1.3.
FEM tests and numerical analyses in the MIDAS program show that in the case of an FoS stability coefficient greater than 1.3, the stability of the flood embankment will be maintained for the highest flood wave (i.e., on the fifth day) in the following cases (Table 4):
- Flood embankments made from mining waste with a binder in the form of the addition of 8% metallurgical cement (ZG + CEM III) in the first variant, with a road on the embankment crown (FoS = 1.53);
- Flood embankments made from mining waste with a binder in the form of the addition of 8% Portland cement (ZG + CEM I) in the second variant, where the road is on the side of the air slope (FoS = 1.47);
- Flood embankments made from mining waste with a binder in the form of the addition of 8% metallurgical cement (ZG + CEM III) in the second variant, where the road is on the side of the air slope (FoS = 1.72);
- Flood embankments made from mining waste with a binder in the form of the addition of 8% metallurgical cement (ZG + CEM III) in the first variant, with a road on the embankment crown additionally loaded with a vehicle (LO) (FoS = 1.37);
- Flood embankments made from mining waste with a binder in the form of the addition of 8% Portland cement (ZG + CEM I) in the second variant, where the road is on the side of the air slope additionally loaded with a vehicle (LO) (FoS = 1.45);
- Flood embankments made from mining waste with a binder in the form of the addition of 8% metallurgical cement (ZG + CEM III) in the second variant, where the road is on the side of the air slope additionally loaded with a vehicle (LO) (FoS = 1.67).
The best result is achieved by a flood embankment built from mining waste with the addition of 8% metallurgical cement (ZG + CEM III) (Figure 33). It shows stability without a vehicle load and with a vehicle load. The best result is in the second variant, when the road is on the side of the air slope.
To summarise, this article shows that mining waste from the mining of hard coal can be used to build flood embankments serving as a road. The best results were obtained for flood embankments built from mining waste with the addition of 8% metallurgical cement. Cohesive mineral soils (with a compaction index Is = 0.97) are used for the construction of flood embankments, the mechanical parameters of which, such as the angle of internal friction, cohesion and oedometric modulus of density, are comparable to those for mining waste reinforced with cement [30]. However, the use of mining waste is based on its economic and ecological value. Further research will be carried out to check the properties of mining waste with the addition of various percentages of metallurgical cement. The possibilities of using mining waste with cement added to build local roads or flood embankments that also serve as a road will also be explored. These will be different geotechnical conditions, and stability calculations will need to be carried out using the FEM method.
Author Contributions
Methodology, E.P.; Formal analysis, E.P.; Investigation, J.M.-W.; Data curation, J.M.-W.; Writing—original draft, J.M.-W. and E.P.; Writing—review & editing, E.P.; Visualization, J.M.-W. All authors have read and agreed to the published version of the manuscript.
Funding
This research received no external funding.
Data Availability Statement
The original contributions presented in the study are included in the article, further inquiries can be directed to the corresponding author/s.
Conflicts of Interest
The authors declare no conflict of interest.
References
- Hue, N.H.; Huong, D.C.; Thanh, N.H. A Technical Solution to Improve the Existing River Dikes for both Flood Prevention and Transportation Purposes. IOP Conf. Ser. Mater. Sci. Eng. 2019, 507, 012012. [Google Scholar] [CrossRef]
- Hao, W.; Fan, H.-. h Zhang, Z.-q. Advances in Research and Technology of Levee Road in China. J. Yangtze River Sci. Res. Inst. 2018, 35, 58–63. [Google Scholar]
- Bozkurt, S.; Dekens, P.; Gartland, R.; Gragg, J.; Lawyer, J.; McGoogan, M. Evaluation of Setback Levees on the Sacramento River; University of California: Santa Barbara, CA, USA, 2000. [Google Scholar]
- Lukić, D.; Zlatanović, E.; Milosavljević, N.; Basarić, I. Road and railway embankments as flood-control dikes. In Proceedings of the 6th International Conference on Road and Rail Infrastructure, Zagreb, Croatia, 20–21 May 2021. [Google Scholar]
- Borys, M.; Filipowicz, P. Characteristics of Coal and Energy Waste for Their Use in the Construction and Modernization of Hydrotechnical Embankments; Zeszyty Problemowe Pstępów Nauk Rolniczych: Warszawa, Poland, 2005; Volume 506. (In Polish) [Google Scholar]
- Gruchot, A. The use of composites from coal waste and fly ash for the construction of flood embankments. Min. Rev. 2014, 70, 158–164. [Google Scholar]
- Gruchot, A. Utilization of Coal and Energy Waste for Engineering Purposes as a Factor in Shaping and Protecting the Environment; Wydawnictwo Uniwersytetu Rolniczego: Cracow, Poland, 2016; Volume 533. (In Polish) [Google Scholar]
- Pilecka, E.; Morman, J. Stability of Flood Embankments with a Built-in Layer of Coal Waste in the Light of Numerical Calculations; Science Notebooks; Institute of Mineral Resources and Energy Management of the Polish Academy of Sciences: Kraków, Poland, 2016; Volume 94, pp. 173–184. (In Polish) [Google Scholar]
- Pilecka, E.; Morman, J. The Use of Fine-Grained Mining Waste Reinforced with Cement for the Modernization of Flood Embankments; Scientific Journals of the Institute of Mineral Resources and Energy Management of the Polish Academy of Sciences: Kraków, Poland, 2017; Volume 101, pp. 347–360. (In Polish) [Google Scholar]
- Kuranchie, F.A.; Shukla, S.K.; Habibi, D. Mine Wastes in Western Australia and Their Suitability for Embankment Construction. In Geo-Congress 2013: Stability and Performance of Slopes and Embankments III; American Society of Civil Engineers: San Diego, CA, USA, 2013. [Google Scholar] [CrossRef]
- Durante Ingunza, M.d.; dos Santos Júnior, O.F.; Gerab, A.T.F.d.C. Potential Use of Sandy Mining Wastes as Raw Material in Road Construction. Geotech. Geol. Eng. 2020, 38, 5681–5691. [Google Scholar] [CrossRef]
- Amrani, M.; Taha, Y.; El Haloui, Y.; Benzaazoua, M.; Hakkou, R. Sustainable Reuse of Coal Mine Waste: Experimental and Economic Assessments for Embankments and Pavement Layer Applications in Morocco. Minerals 2020, 10, 85. [Google Scholar] [CrossRef]
- Segui, P.; el Mahdi Safhim, A.; Amrani, M.; Benzaazoua, M. Mining Wastes as Road Construction Material: A Review. Minerals 2023, 13, 90. [Google Scholar] [CrossRef]
- Pilecka, E.; Morman-Wątor, J. Using modified mining waste to build embankments. Build. Mater. 2022, 7, 599, 33–37. (In Polish) [Google Scholar]
- Morman-Wątor, J. Assessment of the Possibility of Using Waste from the GZW Mines for the Construction of Flood Embankments Serving as Road Embankments. Ph.D. Thesis, Cracow University of Technology Library, Cracow, Poland, 2022. (In Polish). [Google Scholar]
- Water Law of 20 July 2017 [Dz.U. 2017 poz. 1566]. Available online: https://isap.sejm.gov.pl/isap.nsf/DocDetails.xsp?id=WDU20170001566 (accessed on 10 June 2024).
- PN-EN ISO 14688-2:2018-05; Geotechnical Exploration and Research-Marking and Classification of Land-Part 2: Principles of Classification. Polish Committee for Standardization: Warsaw, Poland, 2018. (In Polish)
- PN-EN ISO 17892-9:2018-05; Geotechnical Exploration and Tests-Laboratory Tests of Soils-Part 9: Triaxial Compression with Consolidation on Samples Completely Saturated with Water. Polish Committee for Standardization: Warsaw, Poland, 2018. (In Polish)
- PN-B-04481:1988; Construction Land. Soil Sample Testing. Polish Committee for Standardization: Warsaw, Poland, 2018. (In Polish)
- Pisarczyk, S. Ground Engineering, Warszawa. 2014. Available online: https://ksiegarnia.pwn.pl/Gruntoznawstwo-inzynierskie,68482938,p.html (accessed on 10 June 2024). (In Polish).
- PN-S-96012:1997; Motor Roads-Subbase and Improved Subgrade Made of Cement-Stabilized Soil. Polish Committee for Standardization: Warsaw, Poland, 1997. (In Polish)
- Morman, J. Strengthening mining waste with a grain size of up to 2 mm used in flood embankments with cement binder. Contemporary construction in the research of young scientists. Gdańsk 2017, 167, 161–167. (In Polish) [Google Scholar]
- Morman, J. Results of the freeze resistance test, swelling index and coefficient of perme-ability of finegrained mining waste reinforced with cements. E3S Web Conf. 2018, 36, 03004. [Google Scholar] [CrossRef]
- Morman-Wątor, J. Comparison of physical and mechanical properties of mining waste with a grain size up to 2 mm reinforced with cement CEM I and CEM III. E3S Web Conf. 2019, 106, 01023. [Google Scholar] [CrossRef]
- Gruchot, A.; Zydroń, T. Shear Strength of Industrial Wastes and Their Mixtures and Stability of Embankments Made of These Materials. Appl. Sci. 2020, 10, 250. [Google Scholar] [CrossRef]
- PN-EN 1997-1:2008; Eurokod 7—Geotechnical Design-Part 1: General Principles. Polish Committee for Standardization: Warsaw, Poland, 2008. (In Polish)
- Judycki, J.; Judycki, J.; Jaskula, P.; Pszczola, M.; Rys, D.; Jaczewski, M.; Alenowicz, J.; Dolzycki, B.; Stienss, M. Catalog of Typical Structures of Flexible and Semi-Rigid Pavements. (In Polish). 2014. Available online: https://www.gov.pl/attachment/d7ded9b0-1b73-4c62-b3c5-9eecf20daeef (accessed on 10 June 2024).
- PN-EN 1991-2:2007; Eurokod 1—Impacts on Structures-Part 2: Moving Loads on Bridges. Polish Committee for Standardization: Warsaw, Poland, 2007. (In Polish)
- Regulation of the Minister of the Environment of April 20, 2007 on the Technical Conditions to be Met by Water Management Buildings and Their Location. [Dz.U. nr 86 poz. 579]. Available online: https://isap.sejm.gov.pl/isap.nsf/DocDetails.xsp?id=WDU20070860579 (accessed on 10 June 2024). (In Polish)
- PN-B-03020:1981; Construction Land-Direct Foundation of Buildings-Static Calculations and Design. Polish Committee for Standardization: Warsaw, Poland, 1981. (In Polish)


Disclaimer/Publisher’s Note: The statements, opinions and data contained in all publications are solely those of the individual author(s) and contributor(s) and not of MDPI and/or the editor(s). MDPI and/or the editor(s) disclaim responsibility for any injury to people or property resulting from any ideas, methods, instructions or products referred to in the content. |
© 2024 by the authors. Licensee MDPI, Basel, Switzerland. This article is an open access article distributed under the terms and conditions of the Creative Commons Attribution (CC BY) license (https://creativecommons.org/licenses/by/4.0/).