Abstract
The potential applications of hydrogen in various fields of the energy sector are attracting attention worldwide, including the use of hydrogen for decarbonizing power systems. In Vietnam, hydrogen is considered to gradually replace natural gas in power generation to achieve the country’s net zero target by 2050 but there is a lack of research about this new subject. This study focuses on the computational simulation of the evolution of Vietnam’s power system in the period 2030–2050 according to non-conversion and slow, moderate, and accelerated scenarios of natural gas-to-hydrogen conversion at gas turbine power plants. Based on a total power system generation capacity of 150.5 GW in 2030, the modeling results show that the system capacity range of the scenarios is between 568.7 GW and 584.6 GW. In terms of economic performance, the slow conversion scenario has the lowest system cost of USD 1269.0 billion, and the accelerated scenario represents the highest system cost of USD 1283.2 billion. As for CO2 emissions of the power system, the accelerated scenario has the lowest cumulative CO2 emissions in the studied period while the non-conversion appears highest, 2933 and 3212 million tons, respectively. Based on the study results, the possible pathway recommendation of natural gas-to-hydrogen conversion for Vietnam’s power system is proposed.
1. Introduction
In recent years, hydrogen has been considered as one of the potential and promising solutions to decarbonize the economies, aiming at neutral emissions target by the middle of this century. Hydrogen energy technology is recently achieving notable development and is expected to be widely used in the next few decades with recognizable advantages and potential for commercialization. The Net Zero Emissions by 2050 Scenario of the International Energy Agency (IEA) presented that hydrogen will be used in transport, industries, and power generation with the sharing value of about 9% of total final energy consumption by 2050. After 2030, the use of low-emission hydrogen and ammonia in fossil fuel power plants and the adoption of carbon capture solutions will contribute to cutting emissions from existing power plants and support electricity security [1].
At present, many research works worldwide are focusing on the technology and performance of hydrogen-fired gas turbines, economic efficiency, competitiveness when operating in combination with other types of renewable energy (RE) sources, and the ability to contribute to CO2 emission reductions. In particular, the investigation and analysis of technological progress and achievement of using hydrogen as fuel in gas turbines were performed to decarbonize the power generation sector [2,3,4]. Moreover, the operation of existing gas turbine equipment, fuel consumption, and other operating parameters using hydrogen/natural gas (NG) blended fuel were simulated and examined [5,6,7,8]. Some papers explored the potential participation of hydrogen energy in a power system from the aspect of competitiveness of the fuel types and suggested that gas turbine power sources using hydrogen fuel can be competitive in the power system with a large share of RE sources and strict constraints on emissions of the system [9,10]. Another case study of hydrogen fuel deployment in grid-connected gas turbine power plants analyzed in detail the costs and competitiveness of introducing hydrogen fuel into power plants in the European power grid. Furthermore, gas turbine technologies in hydrogen/NG mixing ratio scenarios were considered with different hydrogen price and carbon price assumptions [11]. Potential drawbacks and challenges of the use of hydrogen in gas turbine systems were determined to find several outstanding issues including higher NOx emission, more stringent requirements for reliable and safe operation, and the high price of green hydrogen [4,12,13].
Vietnam had the target to achieve net emissions to zero by 2050 at the Conference COP26. Thus, the government issued a roadmap for greenhouse gas emission reduction according to the National Strategy on Climate Change in the period up to 2050 [14]; the power sector is considered to rapidly cut emissions in the near future. To realize this goal, thermal power plants using fossil fuels will be converted to low- or zero-emission fuel forms such as hydrogen and hydrogen-based fuels (ammonia) or gradually phased out during the period from 2030 to 2050 [15,16].
In Vietnam, some studies have been conducted in the field of hydrogen energy, such as hydrogen development policies and hydrogen energy technologies [17,18,19]. Another study evaluated the feasibility and potential of producing hydrogen from rooftop solar power systems in industrial parks in Vietnam [20]. Nguyen et al. [21] used hydrogen fuel to supplement diesel fuel in diesel engines and small engines to evaluate cost efficiency and GHG emission reduction. Thi et al. [22] studied hydrogen production from Vietnamese macroalgae in a single stage of dark fermentation using a microbial electrolysis cell.
However, the application possibility of hydrogen for future energy systems in general and power generation in particular has not been comprehensively examined and studied in Vietnam. Moreover, the applicability of hydrogen energy is anticipated as a potential solution for gas turbine power plant fleets to reduce emissions towards a net zero target by 2050. The feasibility of this process greatly depends on the commercialization of hydrogen energy applications, the technological maturity of hydrogen firing technology in gas turbine facilities, as well as the affordability and acceptability of the power system in terms of technical and economic aspects.
This paper studies the penetration possibility of hydrogen as a replacement for NG in gas turbine power plant fleet in Vietnam power system during the period 2030–2050 from the point of view of power system economics and emissions. This study focuses on modeling the power system development for several scenarios of hydrogen penetration pathway to gas turbine power plant fleets for the period 2030–2050. This research aims to clarify the optimized generation capacity mix, CO2 emissions, and economic performance of the power system. Study results also provide a reference and basis for relevant scholars and institutions to further elaborate on scientific, technological, and economic aspects of the energy transition perspective in Vietnam. Furthermore, policymakers, power system operators, and the owners of gas turbine power plants can also prepare the course of fuel conversion to hydrogen in the future based on the findings of this study.
2. Materials and Methods
2.1. Vietnam’s Power System and Its Gas-fired Power Plant Fleet
2.1.1. Overview of Vietnam’s Power System
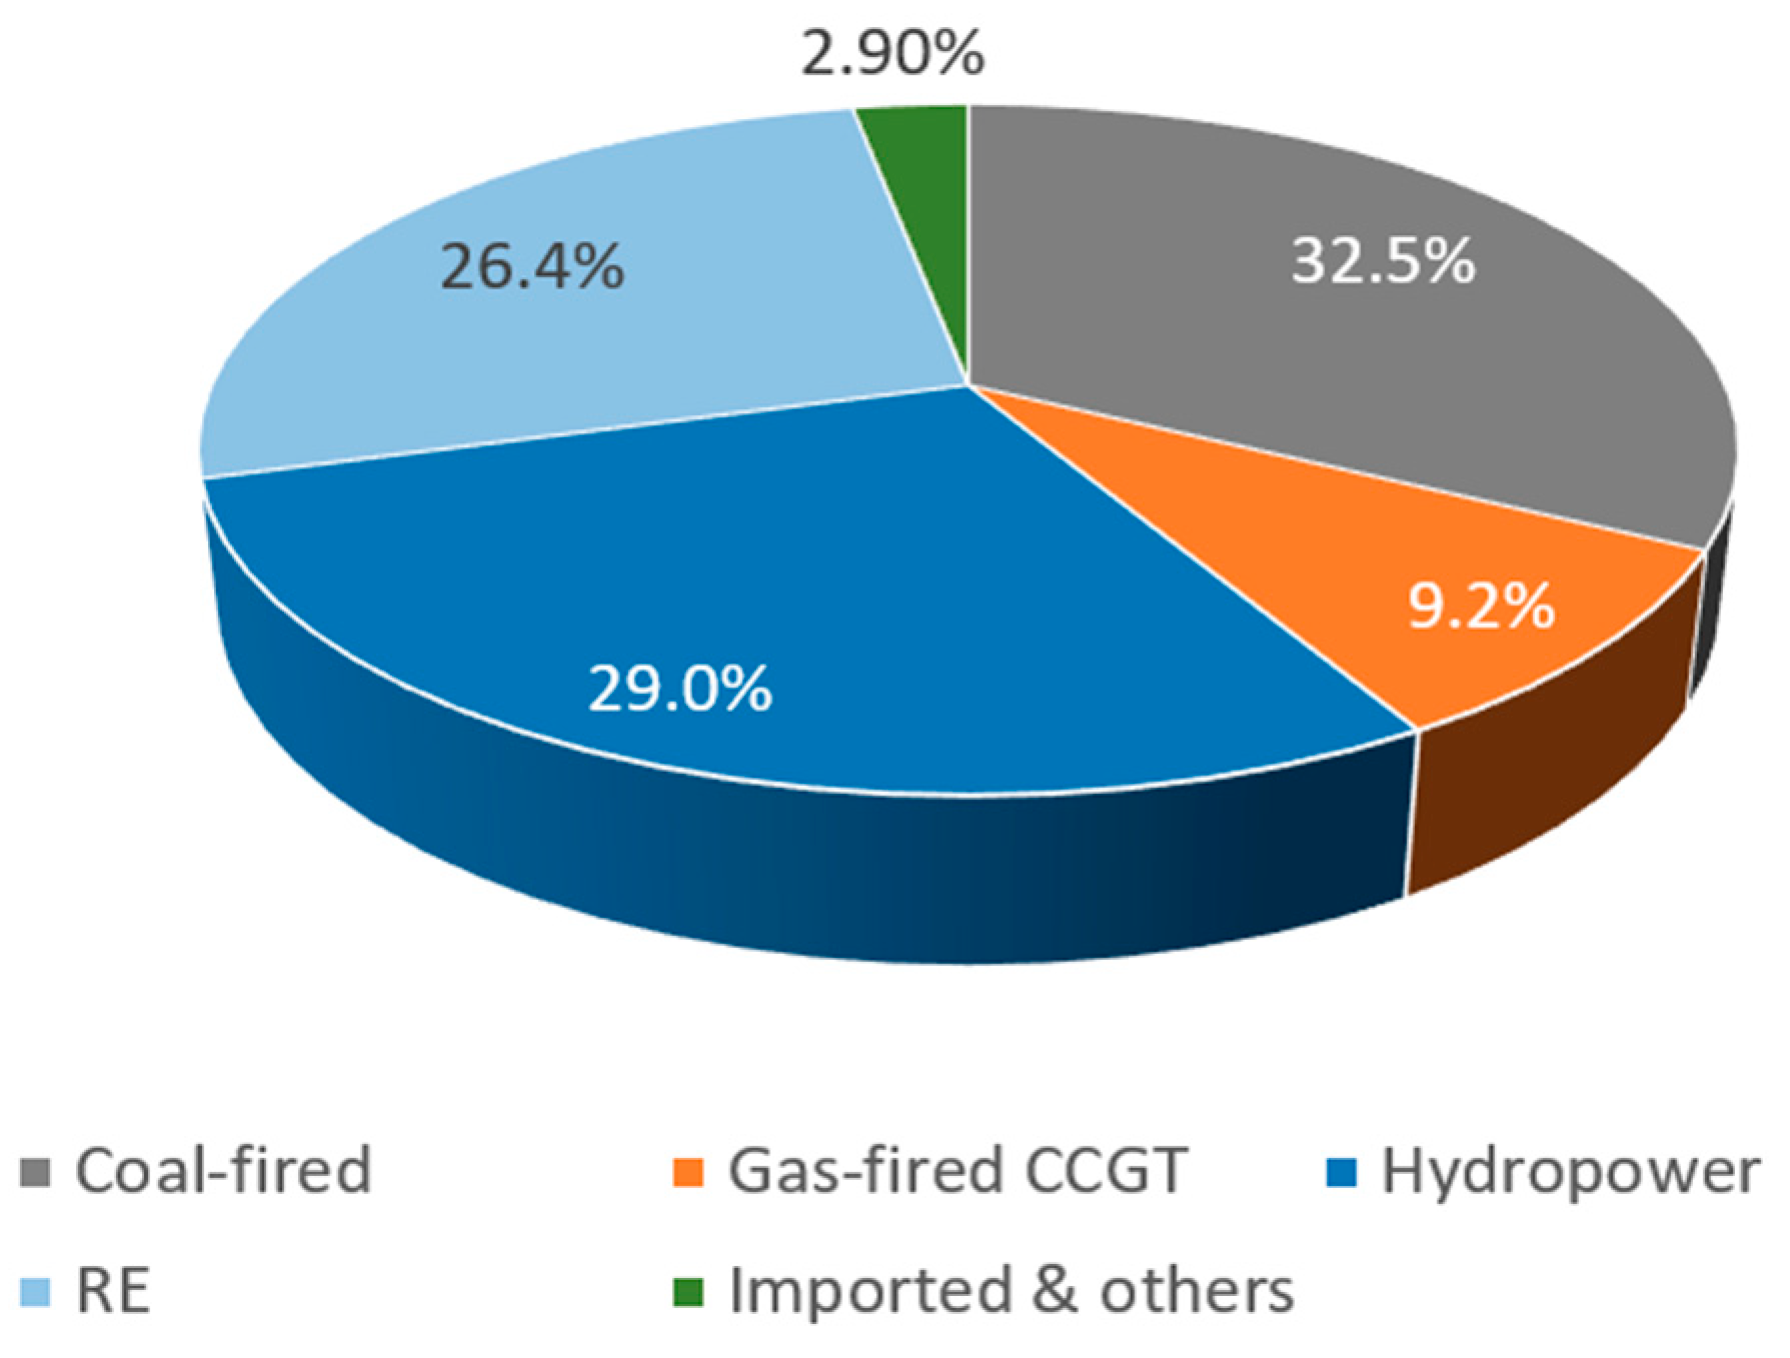
By the end of 2022, the Vietnam’s power system had a total installed capacity of about 77.8 GW. The generation capacity scale of the country topped the ASEAN region for the first time. In the mix of power generation capacity, coal-fired thermal power, and hydropower continue were the largest proportions with shares of about 32.5% and 29%, respectively. Additionally, renewable energy sources account for about 26.4% (of which wind power is about 6% and solar power is about 20.4%). Combined cycle gas turbine (CCGT) power plants using domestic gas account for about 9.2%. Other types of sources such as biomass power, imports, and diesel represent the remaining about 2.9%, as can be seen in Figure 1 [15].

Figure 1.
Generation mix of Vietnam’s power system in 2022 [15].
During the period 2017–2020, the development of solar and onshore wind power sources swiftly increased the total capacity of Vietnam’s electricity system (the capacity of these two types of power generation sources increased sharply from almost negligible in 2017 to nearly 20 GW in 2020). The growing trend of renewable energy slowed down in the years 2021–2023 but is forecasted to continue from now to 2030, focusing mainly on wind power sources (onshore and offshore) and biomass.
2.1.2. Power Development Plan to 2030 and Perspective to 2050
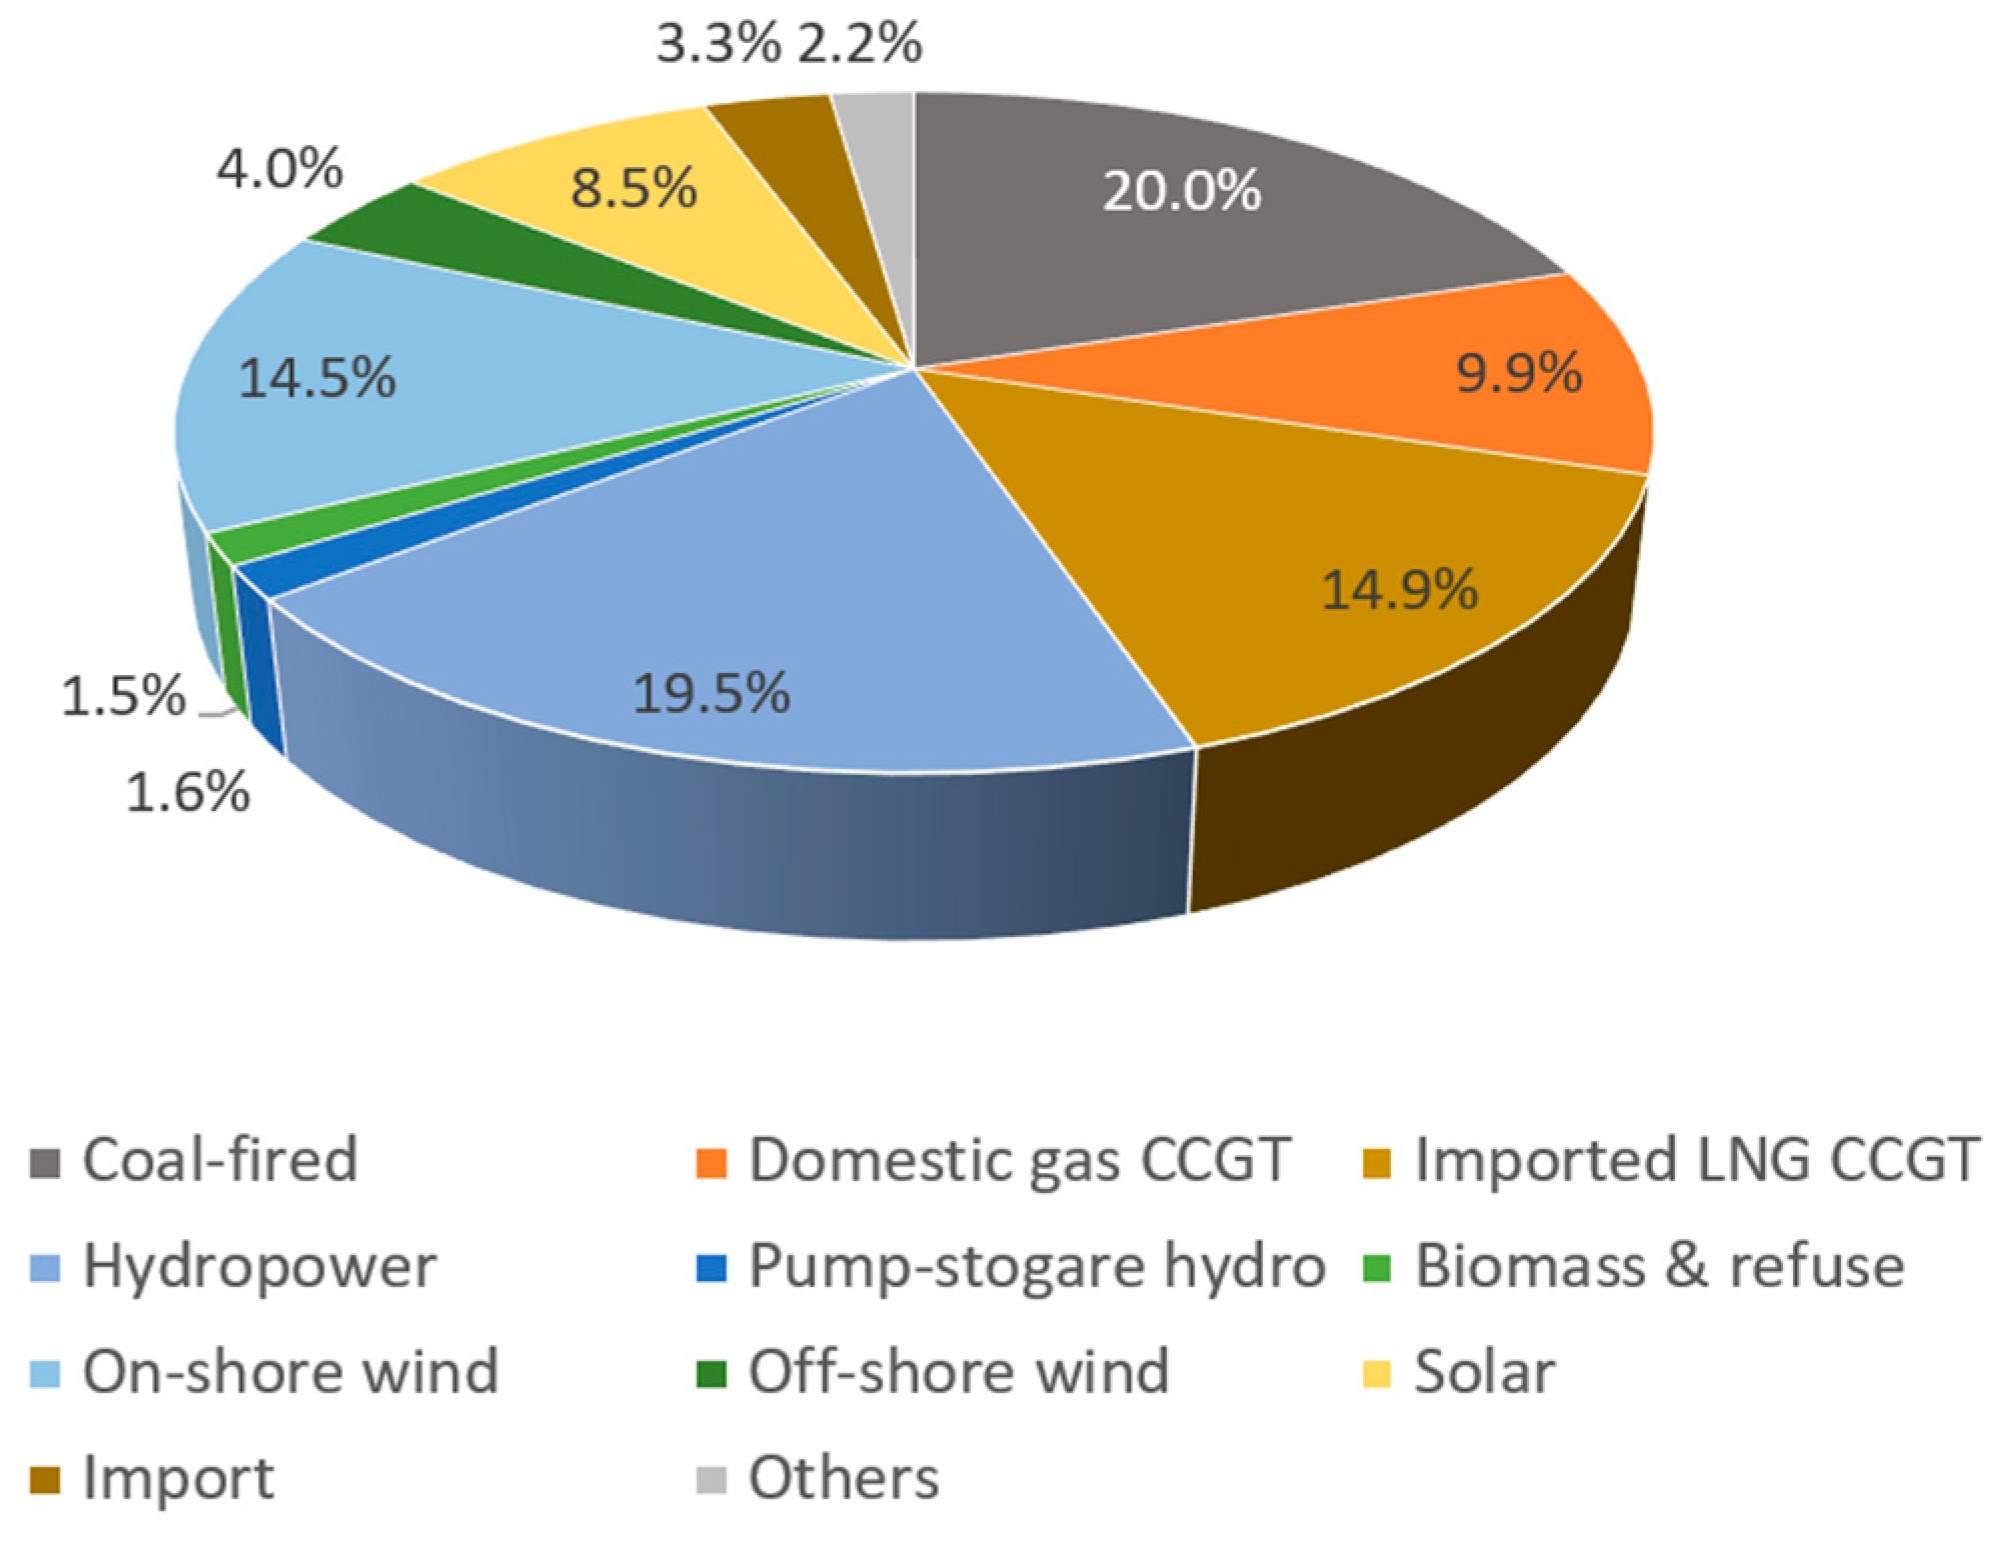
According to the National Power Development Plan for the period 2021–2030, vision to 2050 (PDP8) approved by the prime minister, the total installed capacity of the national power system in 2030 achieves about 150.5 GW, as depicted in Figure 2. The maximum CO2 emission from power system will be expected at as high as 254 million tons of CO2 in 2030 [15].

Figure 2.
Generation mix of Vietnam’s power system in 2030 [15].
Up to 2050, the PDP8 puts an ambitious vision to a national power system with a massive scale of total generation capacity where renewable energy sources account for a majority portion. There are some notable orientations anticipated, as follows:
- In 2050, the total capacity of the power system will be in the range of 490.5–573.1 GW (excluding those for exports and new energy production) depending on base/high scenarios of economic growth rates of the country in the period 2030–2050;
- Reducing CO2 emissions to about 27–31 million tons by 2050 and increasing the renewable energy proportion from 67.5% to 71.5% of total electricity production by 2050;
- By 2050, there will be no coal used for power generation. Thermal power sources initially designed and operated with coal will be gradually phased down or converted to non-emission fuels like biomass, green ammonia, etc.
Furthermore, PDP8 anticipates that the total emissions of power system will be less than 31 million tons CO2 by 2050 [15]. The reduction in CO2 emissions will be achieved by implementing the country’s carbon market which will set to be operational by 2028 with the type of “cap and trade”. Therefore, all large CO2 emitters, including CCGT power plants, will have to compulsorily adopt the reduction trajectories via the “emission caps” assigned by relevant authorities in the near future [23].
2.1.3. The Evolution of Gas Turbine Power Plant Fleet in the Power System up to 2050
At present, there are 7030 MW CCGT power sources using domestic gas in service to Vietnam’s power system. Up to 2030, some new 7900 MW CCGT sources utilizing domestic gas will be developed. Furthermore, until 2035, there will be a total of 25,400 MW of new CCGT power sources using imported LNG constructed and put into operation. Except for the group of new 7900 MW CCGT sources using domestic gas, all existing domestic gas-based and LNG-based sources will be converted to hydrogen in the period 2030–2050 to meet the CO2 reduction target [15]. A summary of CCGT power sources and prospective fuel conversion for the period 2030–2050 is shown in Table 1.

Table 1.
Types of fuel used in CCGT power plants up to 2050 [15].
It is noted that the existing group of 7030 MW has various levels of operating age. The elder ones have already reached more than 25 years of operation with relatively low electricity generation efficiencies, while the younger ones range from more than 10 to 20 years of age with higher efficiencies. According to PDP8, those plants are expected to be in service until 2050 with the orientation converting to hydrogen. However, this plan seems unlikely feasible in terms of technoeconomic aspects because of old age and low efficiency. Thus, the penetration of hydrogen energy into CCGT power plants in Vietnam’s power system is mainly considered using imported LNG with a total capacity of 25,400 MW (newly constructed from 2026 to 2035).
2.2. Hydrogen as Fuel in Gas Turbine Power Plant
2.2.1. Overview of Hydrogen Energy
According to the IEA, hydrogen is a flexible energy carrier that can help tackle various critical energy challenges. Hydrogen can decarbonize a range of sectors like long-haul transport, chemical and steel manufacturing, and power generation (fuel cell technology and fuel in engines/turbines). Hydrogen can be the lowest-cost option for storing electricity generated from renewable sources [24]. However, it is noted that the economic efficiency of hydrogen application depends on many factors, including the availability and costs of renewable energy sources, hydrogen production, storage, and transport. Thus, the use of hydrogen should be carefully considered and adopted only when there are no practical alternatives [25].
The current price of green hydrogen is still very high, with a value of about 4–8 USD/kg depending on the type of renewable energy source used for production, making it difficult to compete with traditional energy sources. Although the efficiency and capacity of electrolyzers have been improved to reduce the cost of hydrogen production, the recent rise in equipment and financial cost are threatening the investment of projects across the entire hydrogen value chain. Nevertheless, the price of green hydrogen is expected to continue decreasing, especially in regions that have abundant potential for renewable energy. It is forecasted that green hydrogen prices will decrease to about 1.5–5 USD/kg and 1–3 USD/kg by 2030 and 2050, respectively [26,27,28].
2.2.2. Current status of R&D and Commercialization Perspective of Hydrogen Gas Turbine Technology
The technology of firing NG blended with hydrogen in gas turbine equipment is being actively researched and developed by major manufacturers such as GE, Siemens, Mitsubishi Power, Ansaldo Energia, etc. The research and testing mainly focus on the necessary adjustments to the hardware equipment (turbine combustion system) and control system to solve the problem of safely and reliably burning a mixture of hydrogen and NG while effectively controlling NOx emissions. Up to now, most manufacturers have revealed that all of their gas turbine product lines are capable of operating with at least 30–50% hydrogen blending (by volume). Some manufacturers even proclaim the capability of handling 100% hydrogen in several new generations of commercial products [29,30,31,32]. Siemens affirmed successful tests on its SGT-400 industrial gas turbine at site conditions in Saillat-sur-Vienne, France; the turbines can be fueled with up to 100% hydrogen with NG and any blend [33]. Furthermore, several commercial-scale CCGT power plant projects, both newly planned and retrofitted from existing ones with hydrogen-ready features, are being constructed around the world [34,35,36,37], indicating significant achievements in the commercialization process of hydrogen gas turbine technology.
The European Turbine Network [12] states that the technology and design characteristics of the gas turbine equipment have significant influence on the ability and extent of hydrogen conversion at existing power plants. Specifically, the mixing of hydrogen with NG at 10–30% by volume will likely not affect the turbine’s operating performance and will not require significant upgrades. At a mixing ratio of 30% and above, the extent of retrofitting depends on the design and condition of equipment, which may require larger upgrade of the fuel supply system, turbine’s combustion module, and control and monitoring system. The US National Energy Technology Laboratory (NETL) compiled the results of new technology development (up to 2022) for gas turbines firing NG blended with hydrogen, regarding operability and NOx emission control. The report concluded that gas turbines capable of 100% hydrogen combustion will be commercialized and ready for operation by 2030 [13].
Based on the notable achievements of gas turbine manufacturers in researching fuel conversion to hydrogen, hydrogen combustion technology in gas turbines, including upgrading and renovating existing systems for hydrogen co-firing, will be commercialized within this decade. Therefore, the development orientation for gas turbine power plants in Vietnam using hydrogen blended with NG from around 2030 to full use of hydrogen around 2050 is likely reasonable.
2.3. Methodology
2.3.1. Study Method
To investigate possible pathways of applying hydrogen into Vietnam’s power system through the fuel conversion process of NG-to-hydrogen in CCGT power plants, this study focuses on examining the evolution of Vietnam’s power system for the period 2030–2050 in terms of the capacity scale development, emissions, and economic performance.
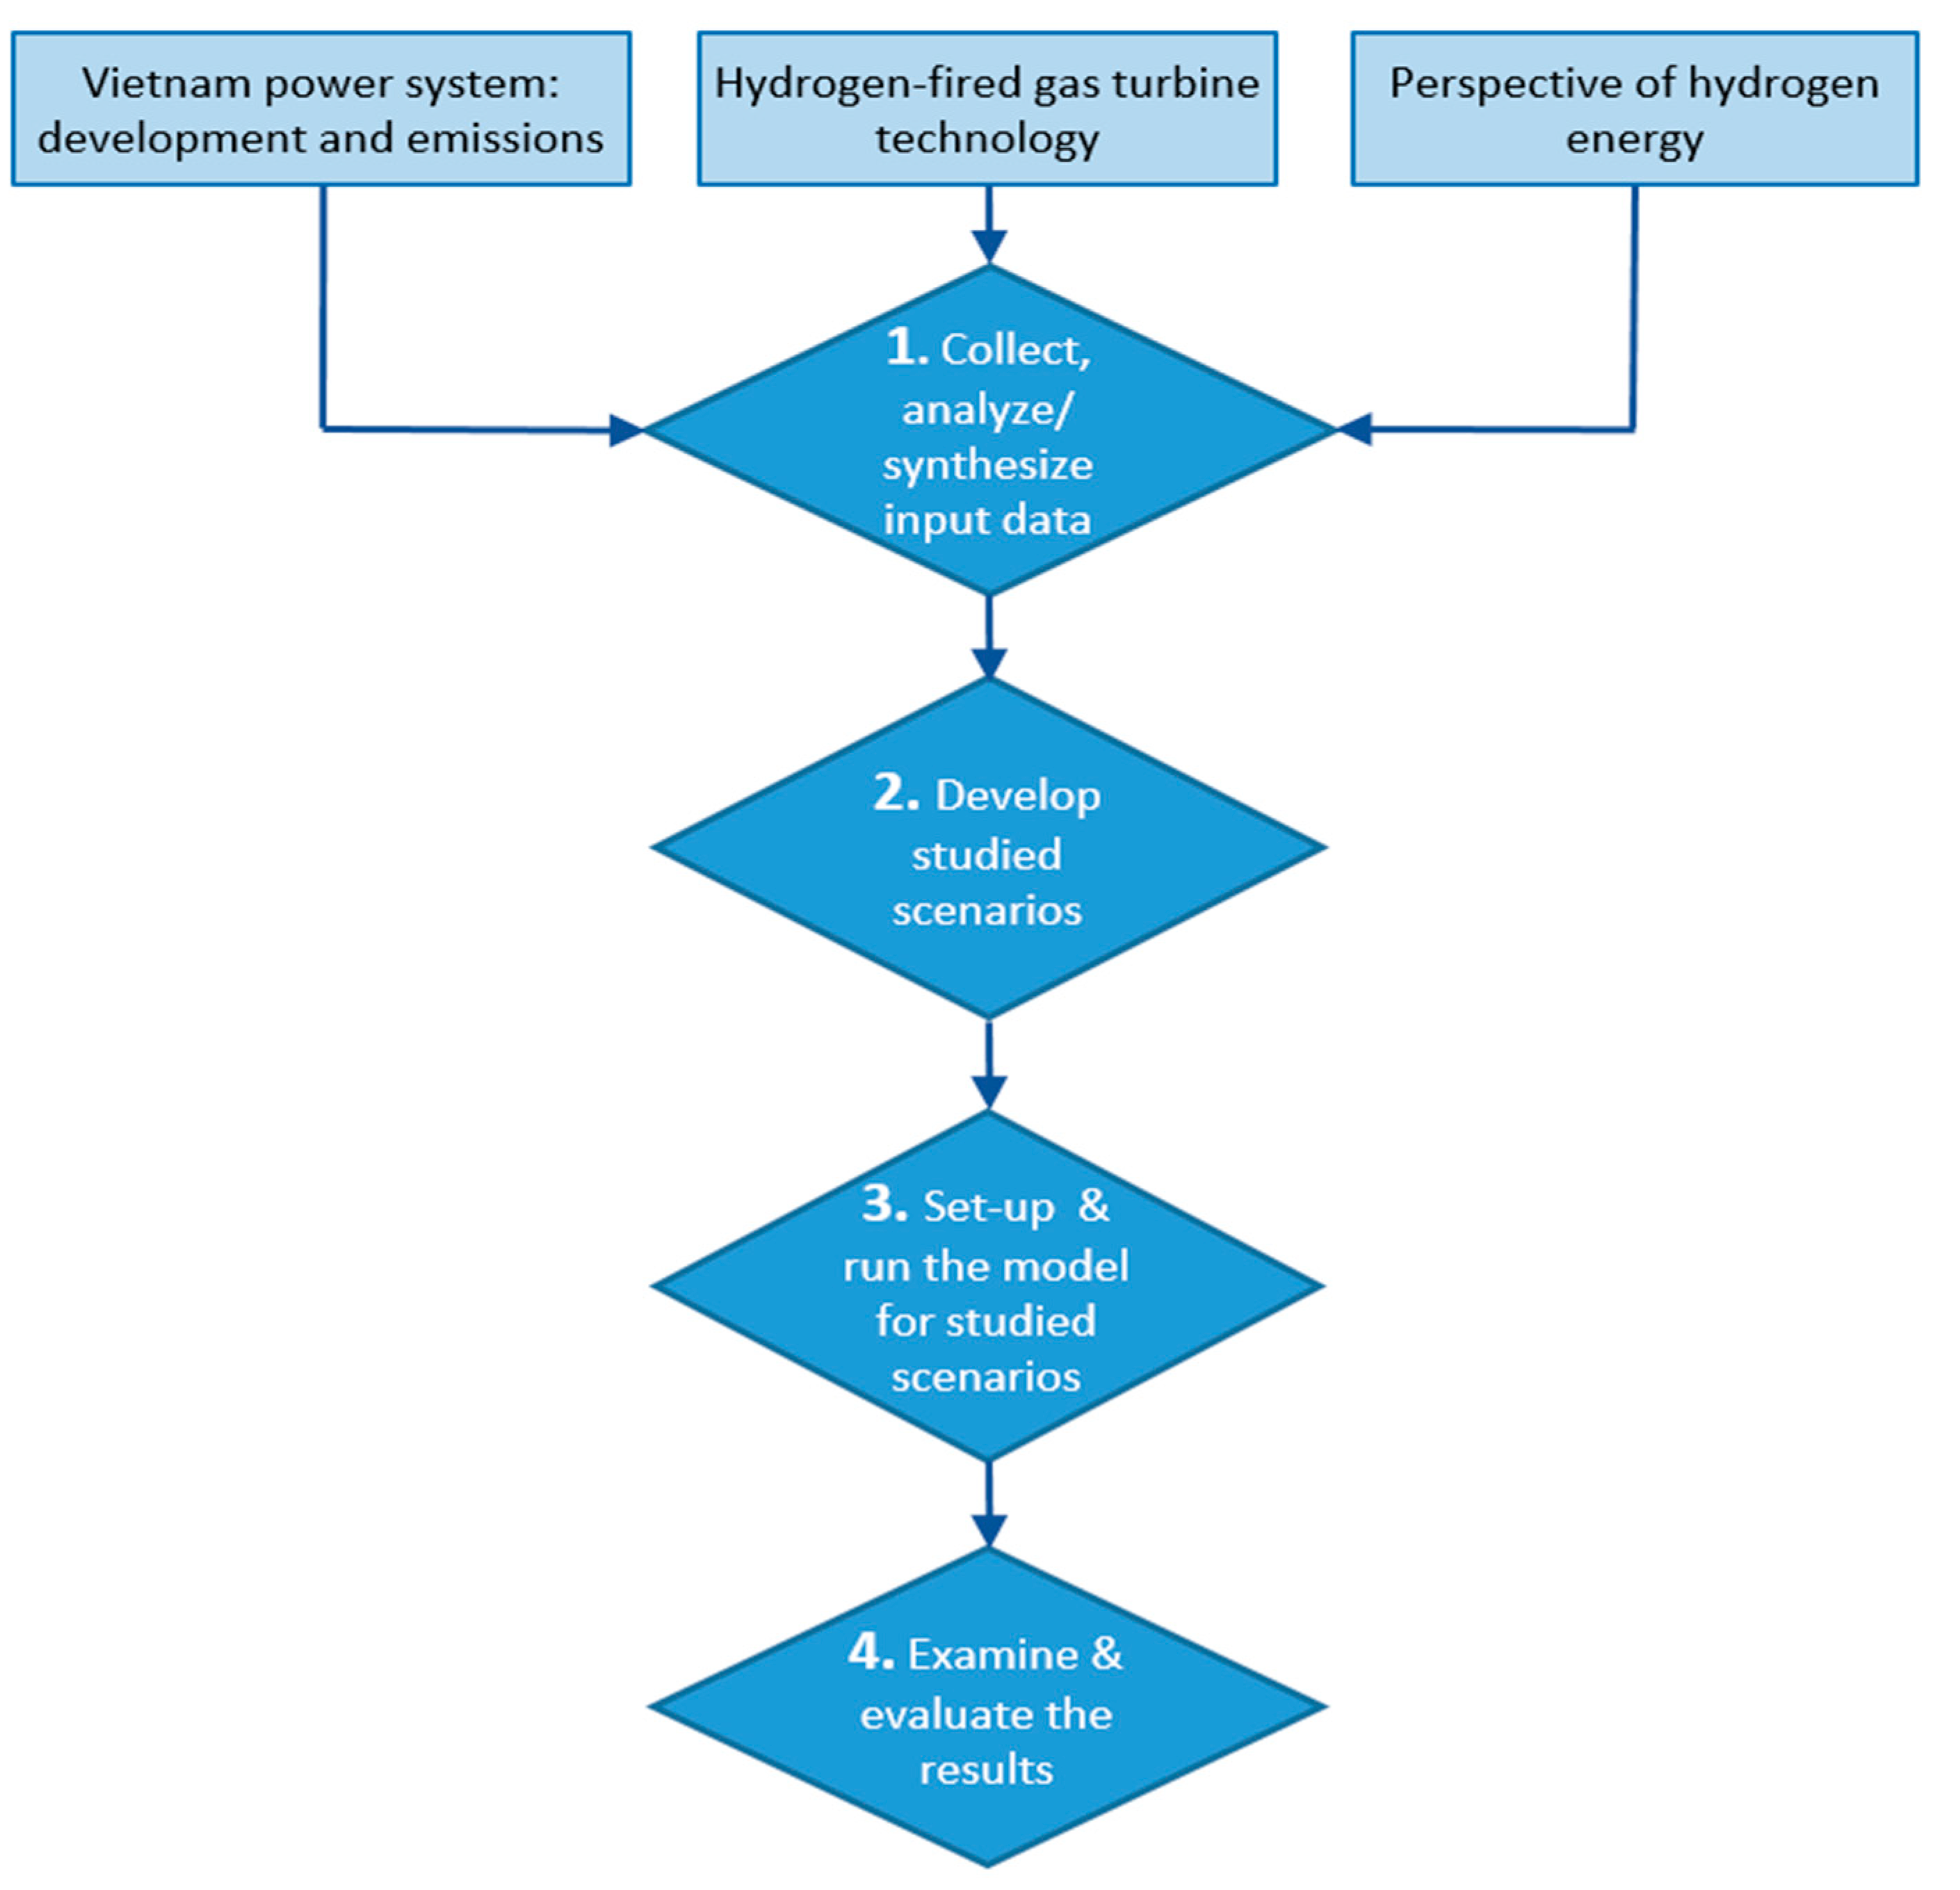
So, several scenarios of NG-to-hydrogen conversion are considered based on the evaluation of the worldwide development trend of hydrogen-fired gas turbine technology and hydrogen supply, and the specific situation of the domestic CCGT power plant fleet in Vietnam. In addition, a scenario of “non-conversion” is also considered for comparison with the conversion ones. Thus, the planning of the power generation mix and capacity in 2030 [15] (see Section 2.1.2) is used at the starting year of the modeling period. A large range of input data and assumptions for modeling are also taken from used available sources [15], and some data relating to hydrogen-fired gas turbine technology; the CCGT generation unit’s technoeconomic performance when firing an NG/hydrogen blend are collected and analyzed. The Vietnam power system is then modeled for the period 2030–2050 using specialized computer software based on the principle of “least cost” optimization of the capacity expansion and power dispatching while meeting electricity demands and policy constraints. The modeling results of the scenarios are then interpreted focusing on the system’s capacity scale, cumulative CO2 emissions volume, and the system costs. This is a popular method used for quantitative research and the in-depth analysis of future electricity system development under different policy conditions and input assumptions. The study method is illustrated in the flow chart in Figure 3.
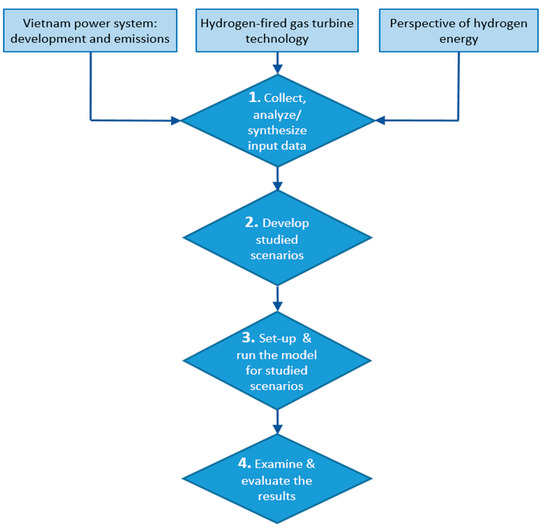
Figure 3.
Summary of study workflow.
2.3.2. Input Data and Assumptions
Key Input Data for Modeling
In this study, most of the key input data relating to power system operation and development planning were obtained [15], as presented in Table 2.
Table 2.
Key input data for modeling [15].
Table 2.
Key input data for modeling [15].
| No. | Type of Input Data | Description | Remark |
|---|---|---|---|
| 1 | Characteristics of power system | Power generation mix of the system by the year 2030 (see Section 2.1.2). | 2030 is the starting year of simulation period |
| 2 | Electricity demand of the country | Projection of electricity demands (in MW and kWh) for the regions and the whole country for each year of the studied period. | Forecasted for high scenario of country’s economic growth rate |
| 3 | Specifications of power generation technologies | Technical and economic characteristics/specifications of power generation sources (solar, wind, gas-fired, etc.) that will be considered in the model for development and operation in the period 2030–2050:
| |
| 4 | Unit commitment parameters | Technical information of power generation units of various technologies that will be considered and mobilized for operation in power system by the model:
| |
| 5 | The potential of primary energy sources for power generation | The available technical potential of fuel supplies (domestic fossil fuels like coal, natural gas, biomass, hydropower), imported fuel sources (coal, LNG), and renewable energy resources (solar, onshore wind, offshore wind—in MW) of the country is chosen for power generation. | |
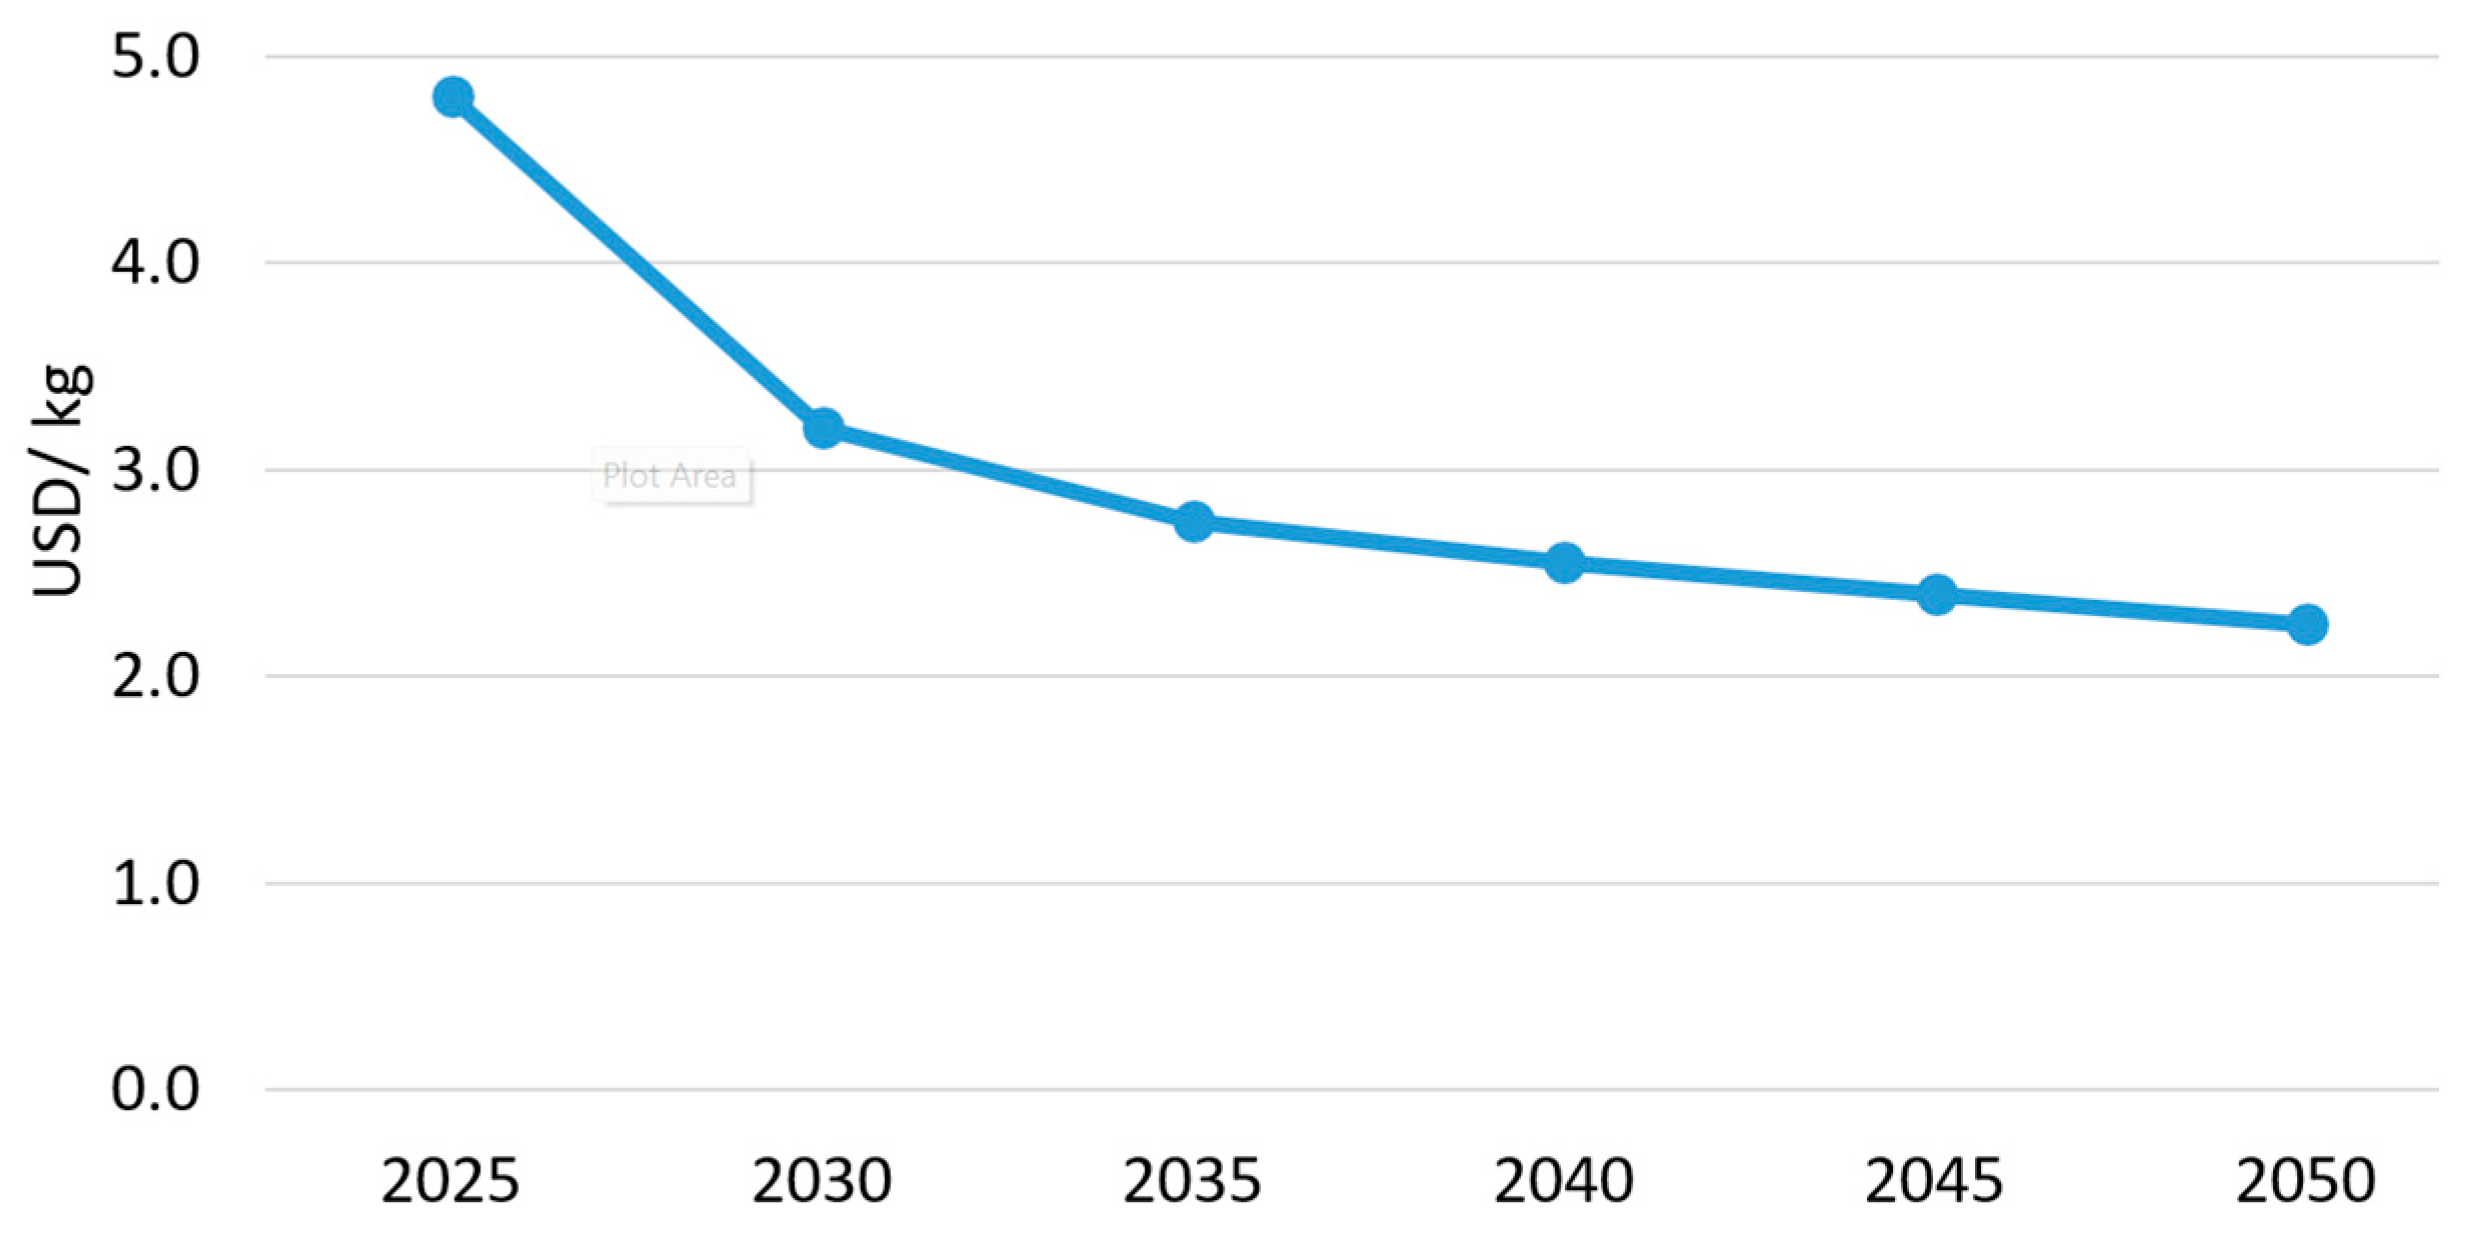
| 6 | Fuels | Fuel data include heating values (MJ/kg) and prices (for coal, natural gas, LNG, biomass, etc.) supplied to the power plants over the studied period (USD/ton, USD/MJ) (for instance, green hydrogen price, as shown in Figure 4), and associated characteristics like fuel emission coefficients. | Fuel price estimates at power plant sites |
| 7 | Power transmission capacities | Capacities of power transmission network between the regions of national power system, including expected losses and costs of transmission. | |
| 8 | Environmental restrictions | Target caps of CO2 emission of power system for milestone years of the study period (2030, 2050). |

Figure 4.
Expected green hydrogen price at Vietnam’s CCGT power plant sites [15].
Figure 4.
Expected green hydrogen price at Vietnam’s CCGT power plant sites [15].
Other Input Data
Data on the impact of firing hydrogen/NG mixture on the performance of gas turbine units includes information on retrofit costs for CCGT power units (USD/MW) corresponding to certain hydrogen/NG mixing ratios, the estimated change in efficiencies of the CCGT power units (in %) according to those mixing ratios, and the increase in NOx emissions according to mixing ratios (in % compared to original gas-fired operation), etc. These data were collected and synthesized for use in modeling.
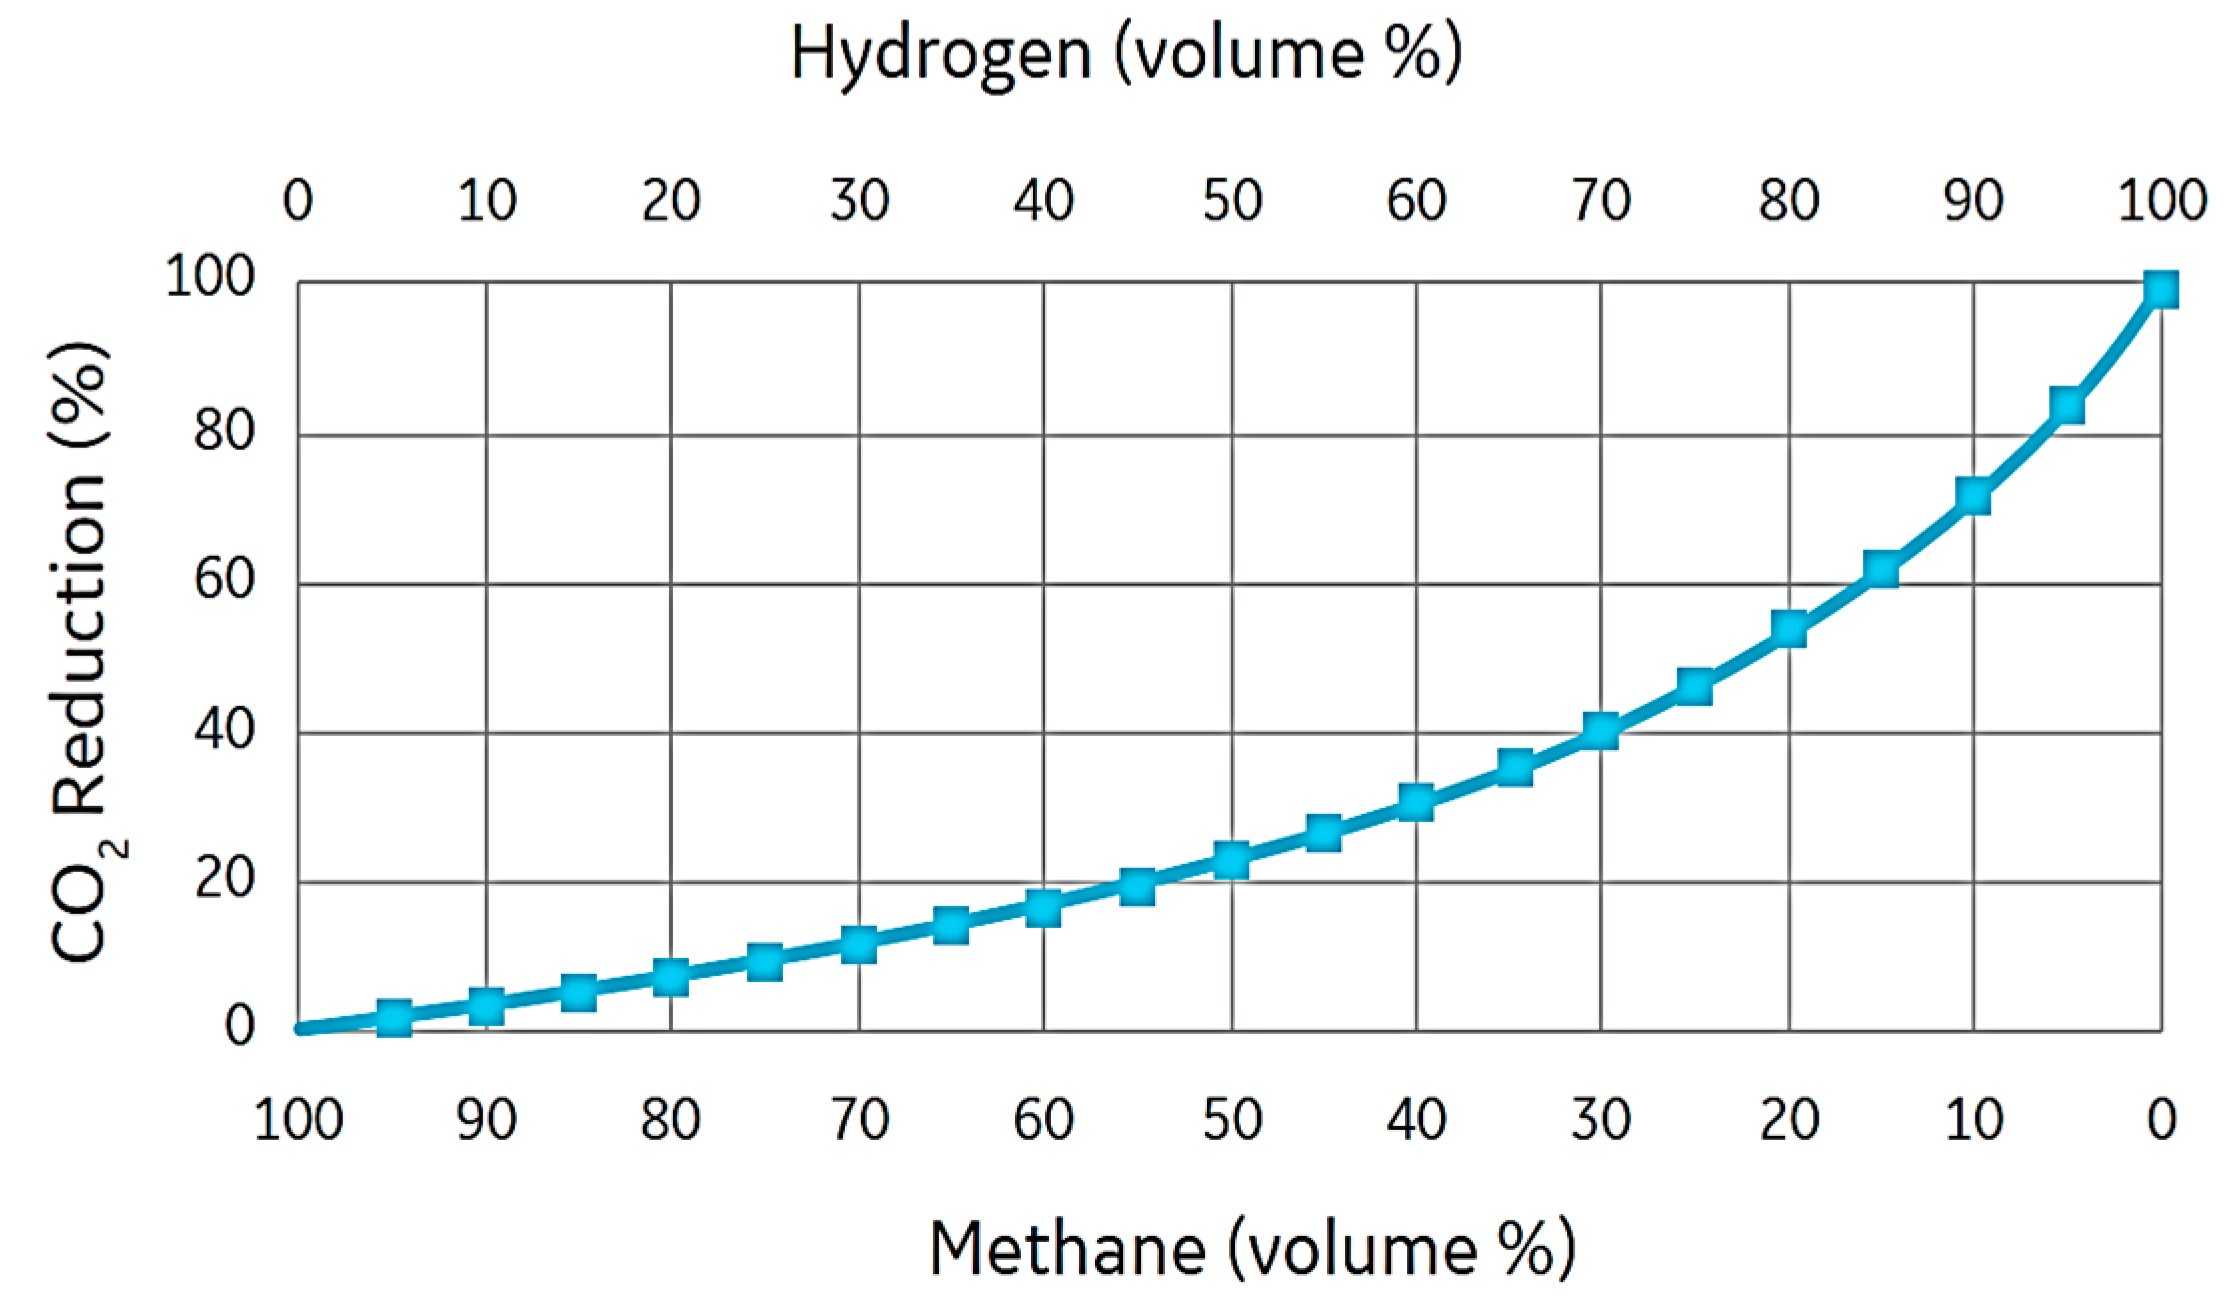
Data on the reduction in CO2 emissions corresponding to different hydrogen/NG (methane) blending ratios when firing in a gas turbine power generation unit are shown in Figure 5 [30].

Figure 5.
Relationship between CO2 emissions and hydrogen/methane fuel mixtures [30].
The social cost of CO2 was made by the US Government [38] in 2021 based on the social cost of carbon, methane, and nitrous oxide, as presented in Table 3. Thus, the discount rate of 3% average was taken for consideration of the social cost of CO2 emissions in this study.
Table 3.
Social cost of CO2 (USD/ton) [38].
Modeling Boundary and Assumptions
The scope and boundary of the modeling and calculation are determined by the definition in PDP8 [15]. Thus, the Vietnam national power system includes power generation plants and major transmission items (substations, lines) of a voltage of 220 kV and above. The power system is divided into regions with a simplified interconnection transmission network. The modeling does not include the “heating” component, as it is not applicable in Vietnam.
This study has the assumption that green hydrogen will be commercially available for use at the CCGT power plants in Vietnam in the studied period 2030–2050. This means the green hydrogen price as shown in Figure 4 includes delivery costs up to the power plant’s receiving point.
The USD value in 2020 is used to describe and calculate various costs in this study.
2.3.3. Modeling Software
The Balmorel open-source energy system model is used in this study to simulate the Vietnam power system in the period 2030–2050. Balmorel is a computer-based model developed to support analysis of the energy sector with an emphasis on electricity and combined heat and power systems. The model is suited for energy and environmental analyses of relevant economic and policy-related issues. The base model was first written for Nordic countries and is now used worldwide in at least 31 countries, including Vietnam (for formulation of PDP8) [15,39].
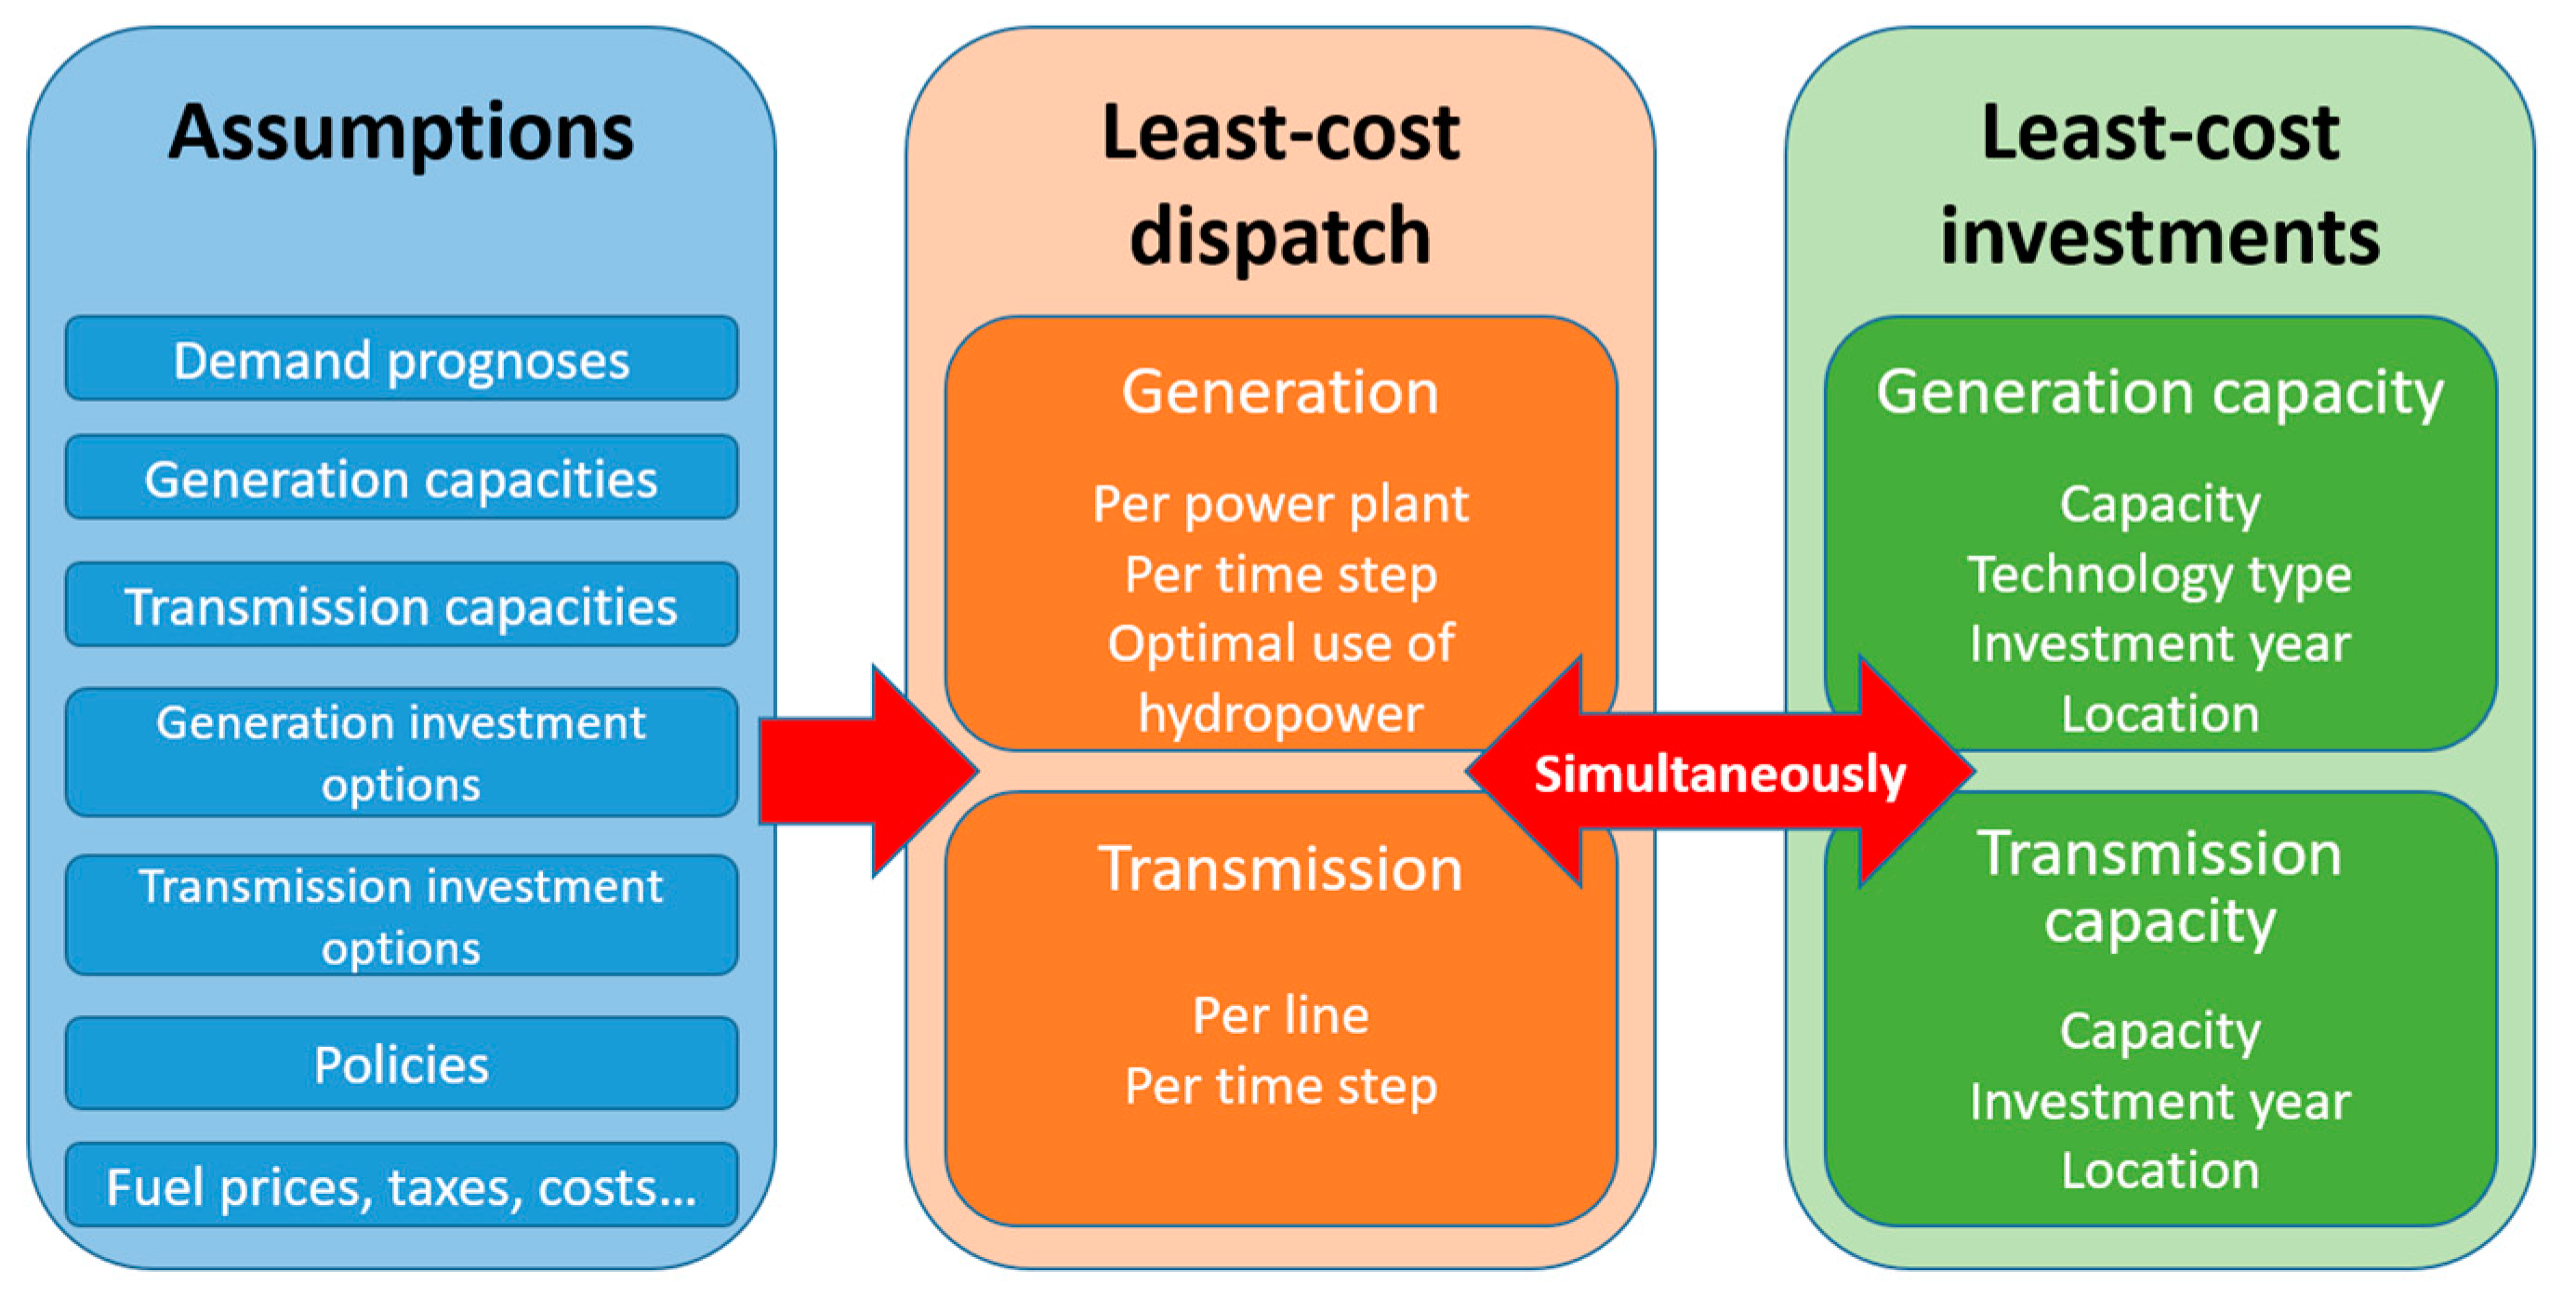
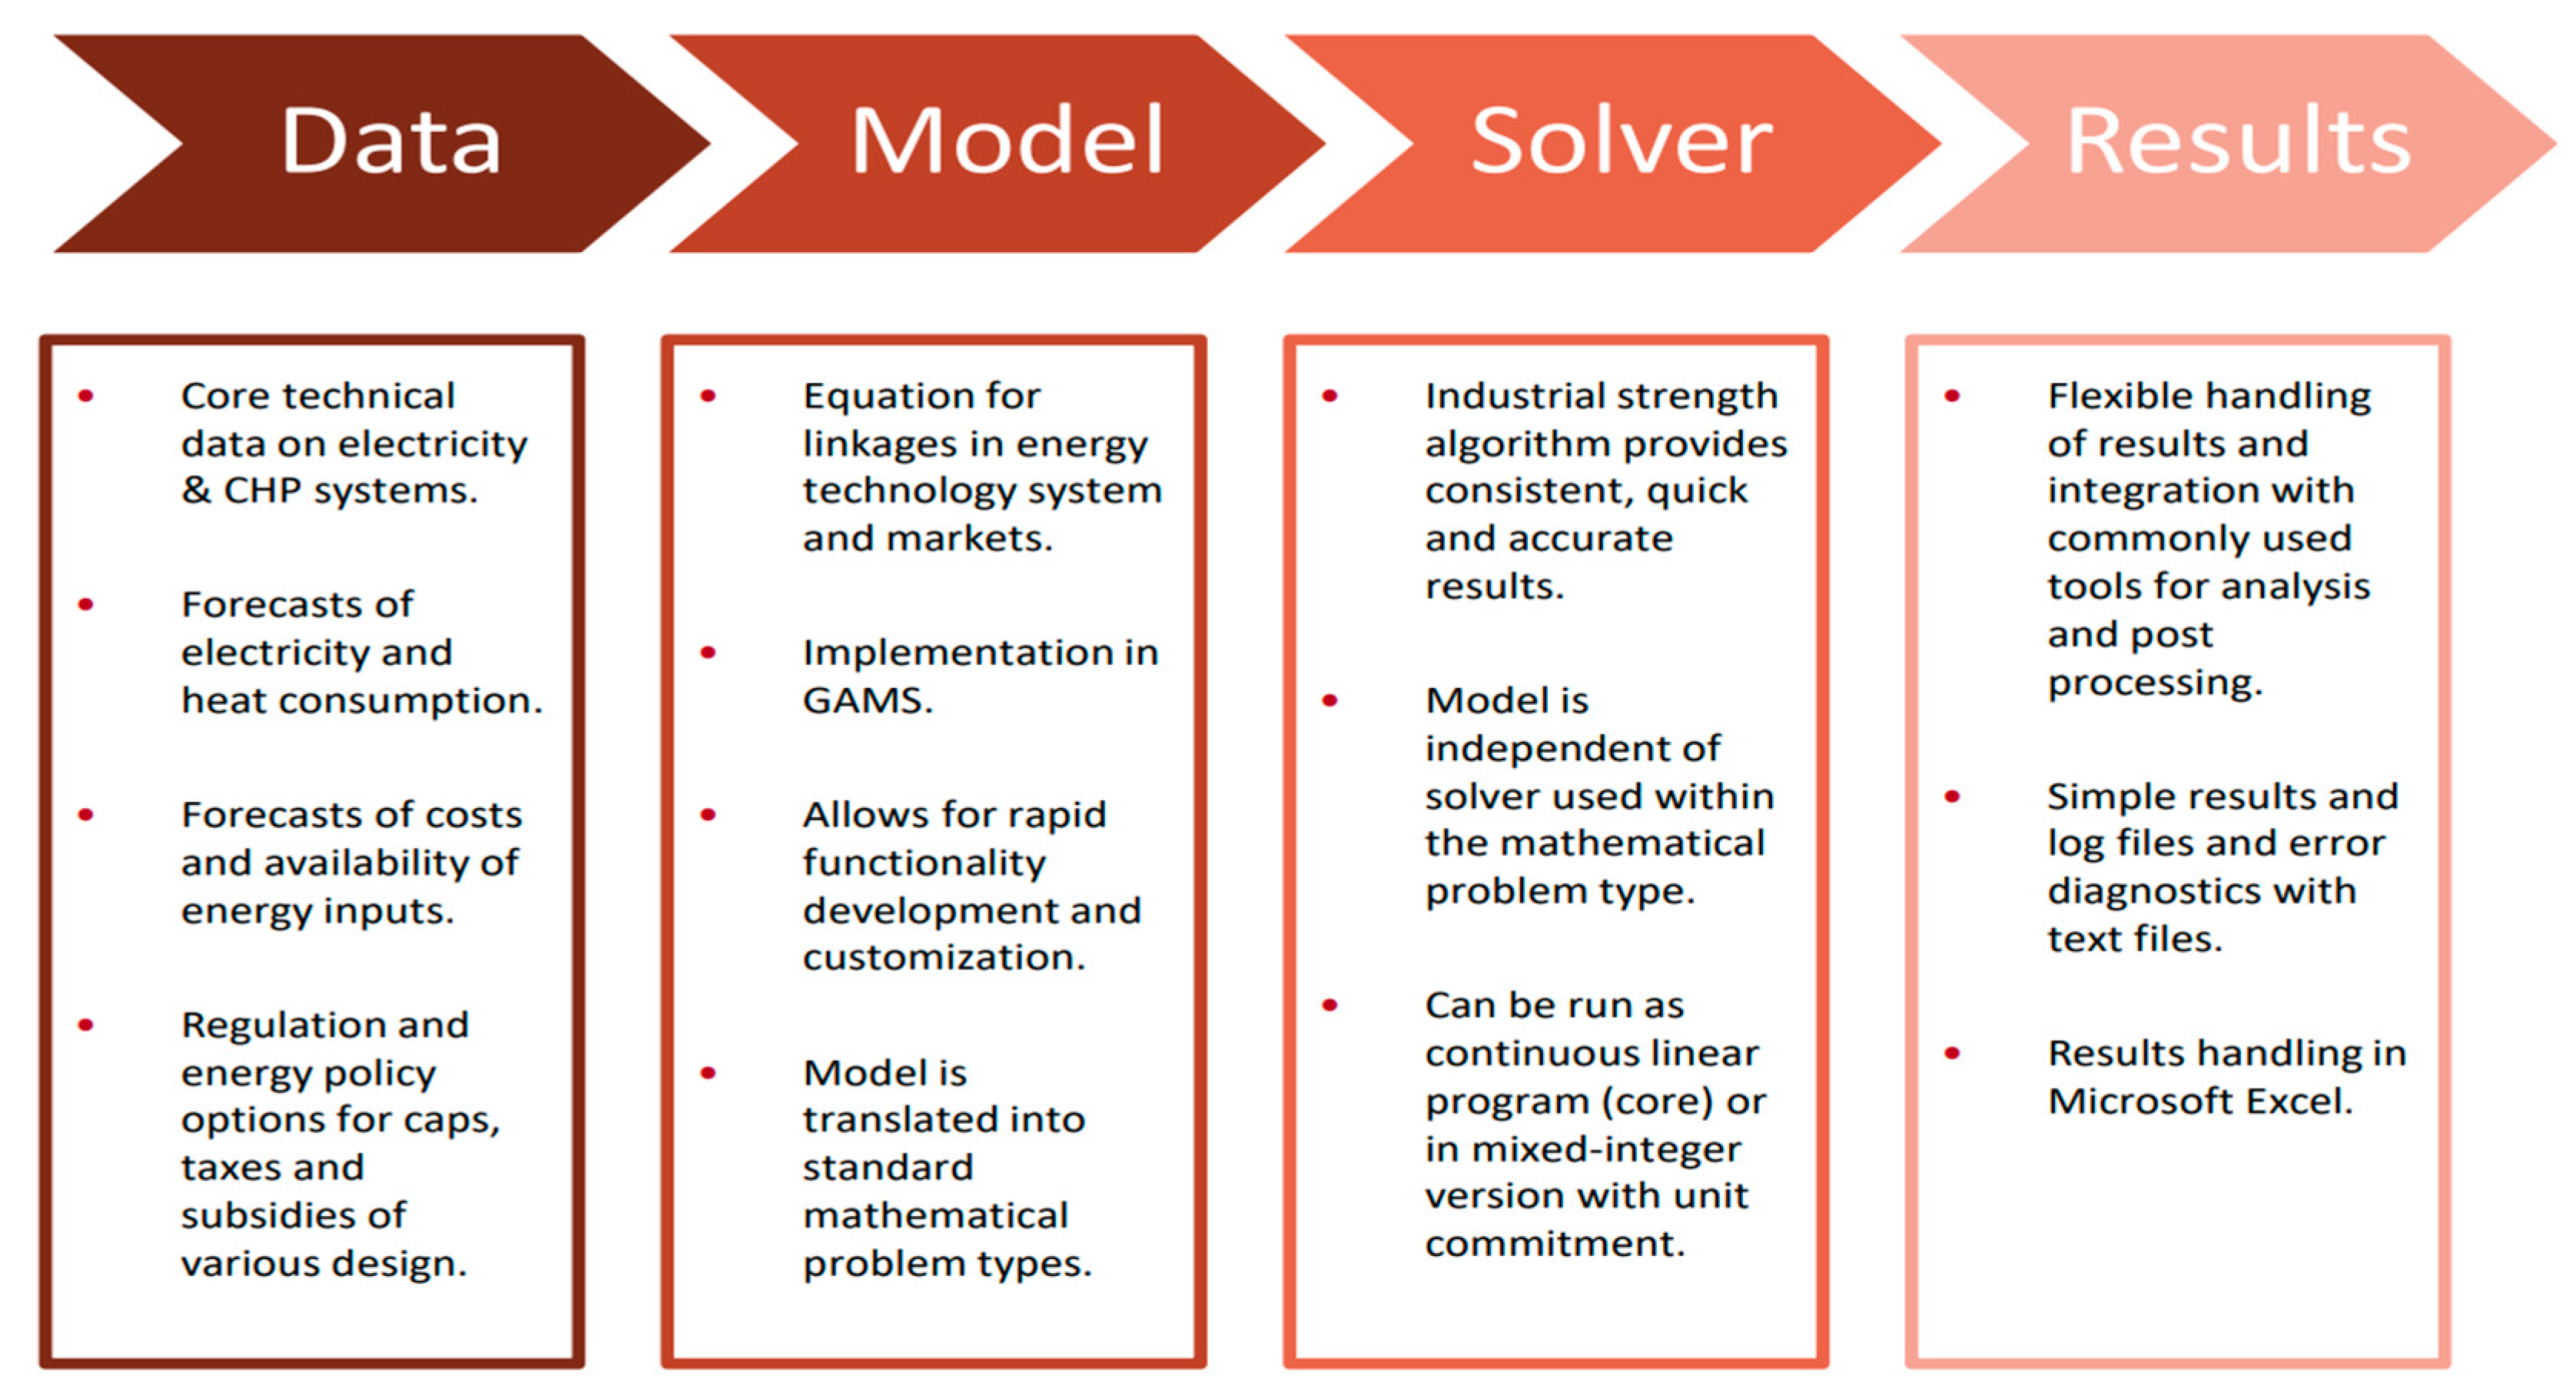
In the research field, the Balmorel model is used in many published studies for the sectors of electricity, heating, and gas supply, as well as energy and electricity policy research, concentrated mainly in the Nordic countries. In particular, this model is used regularly for academic and educational purposes and has been applied to research and calculation in some master’s and doctoral theses [40]. In general, Balmorel is a partial equilibrium model that essentially finds the least-cost economical dispatch and capacity expansion solution for the represented energy system. The model is well recognized for its generality, scalability, transparency, transferability, and customizability. The fundamentals of simultaneous least-cost optimization and the contents of system components of the simulation process are illustrated in Figure 6 and Figure 7 [39].
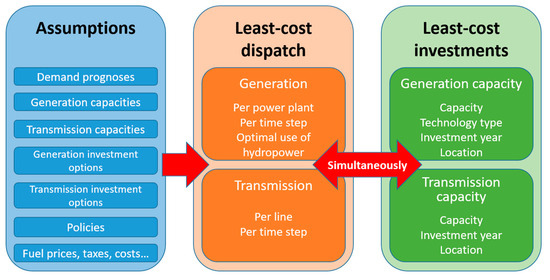
Figure 6.
Fundamental of Balmorel simultaneous least-cost optimization [39].
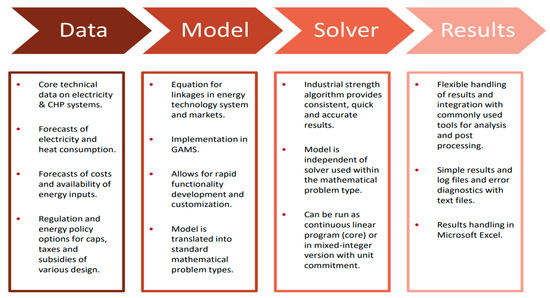
Figure 7.
The contents of system components of the simulation process [39].
The input data and assumptions for modeling are described in Section 2.3.2. The results of simulation modeling include the following:
- Generation of electricity of each power generation unit/plant in the power system;
- Consumption of electricity, heat, and primary energy (fuels);
- Transmission of electricity between connected regions of the power system;
- Prices of electricity;
- Investments in electricity generation capacity;
- Emissions from electricity generation;
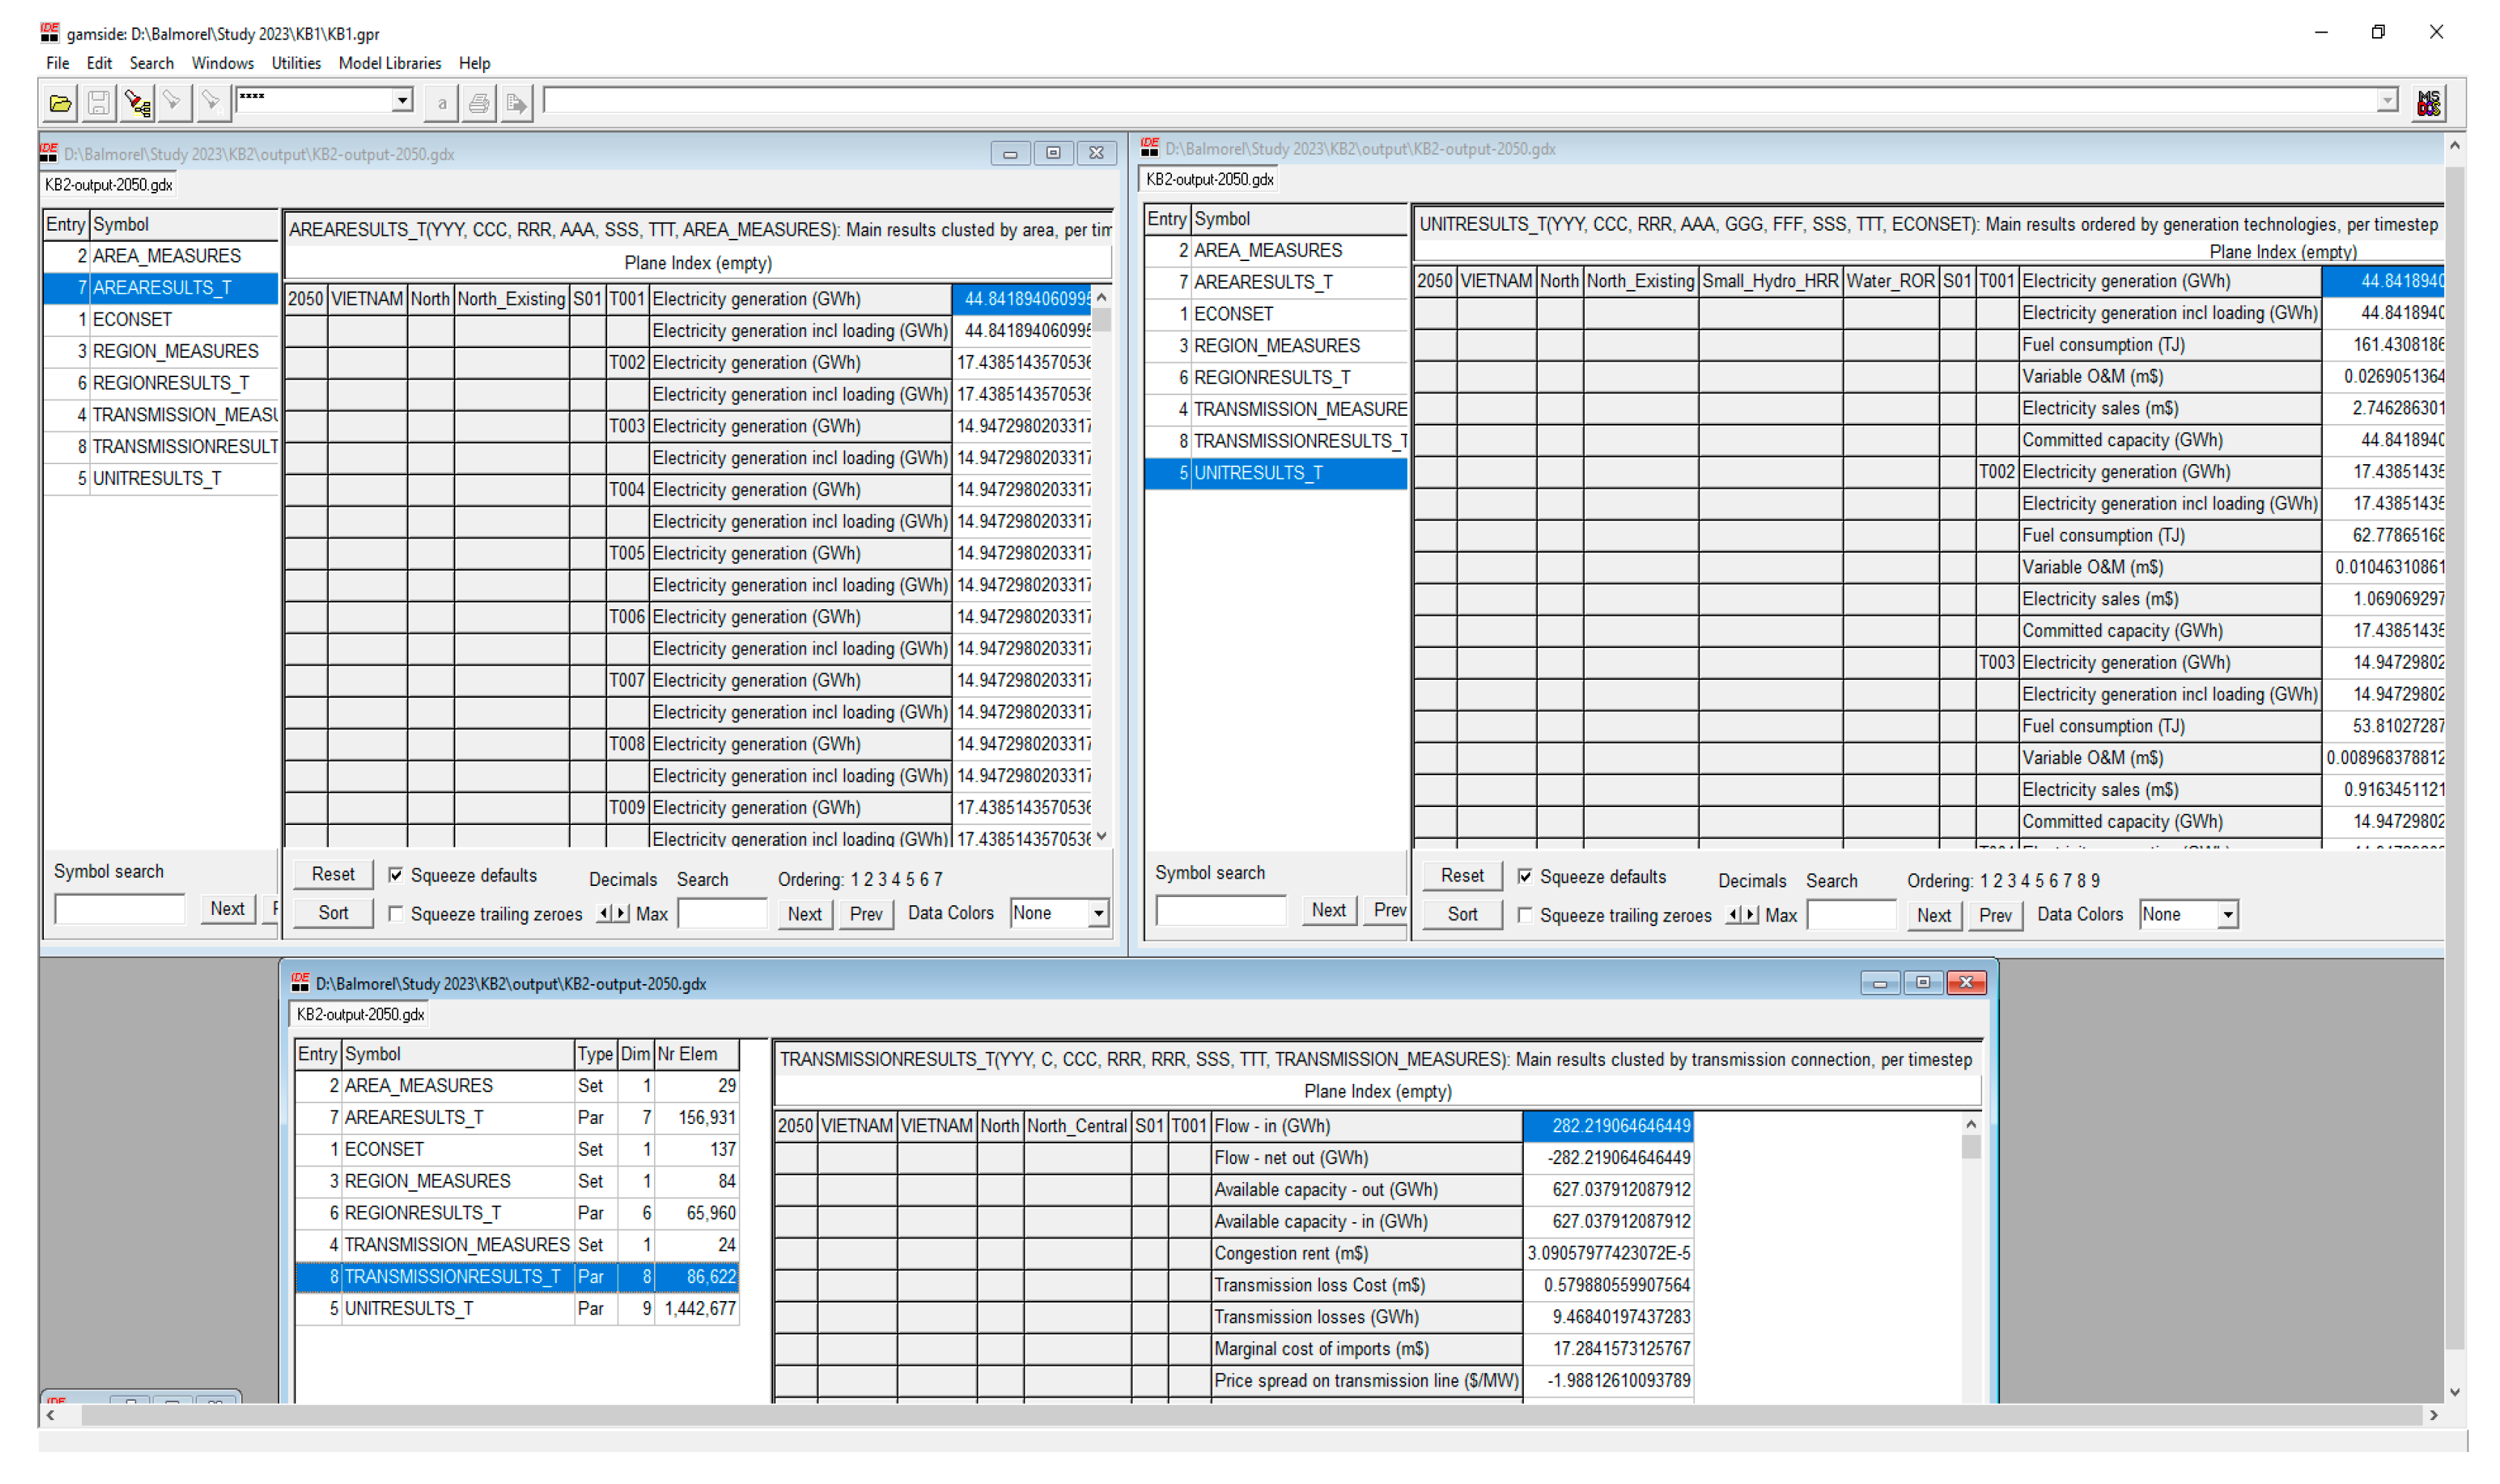
- An output screen of Balmorel modeling result is illustrated in Figure 8.
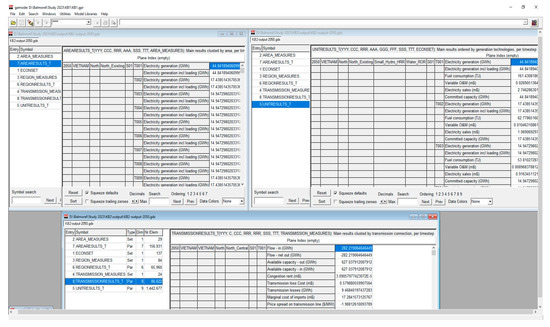 Figure 8. Output screen of Balmorel model.
As described in [39], the model has several limitations: (i) the model assumes a perfect competition (perfect market) between electricity generation sources instead of considering an actual power market; (ii) the transmission grid in the model is reduced to a single capacity between regions; therefore, it does not consider voltages and grid stabilities but only looks at the energy balance between regions; and (iii) it assumes perfect prediction of variable renewable energy sources (wind, solar). To analyze the power system development over a large period (20 years) in this study, these limitations are acceptable, as they do not have a big impact on the result of simulation modeling.
2.3.4. Scenarios Studied
To investigate possible pathways of applying hydrogen into the power system through the fuel conversion process of NG-to-hydrogen in CCGT power plants, there were three scenarios set up for modeling Vietnam’s power system in the period 2030–2050 with different hydrogen penetration rates, namely, the slow conversion (SC), moderate conversion (MC), and accelerated conversion (AC) scenarios. In addition, there is also another scenario considered, the non-conversion (NC) scenario, where no fuel conversion occurs at all. This scenario serves as a “baseline” for comparison with the above 3 conversion scenarios.
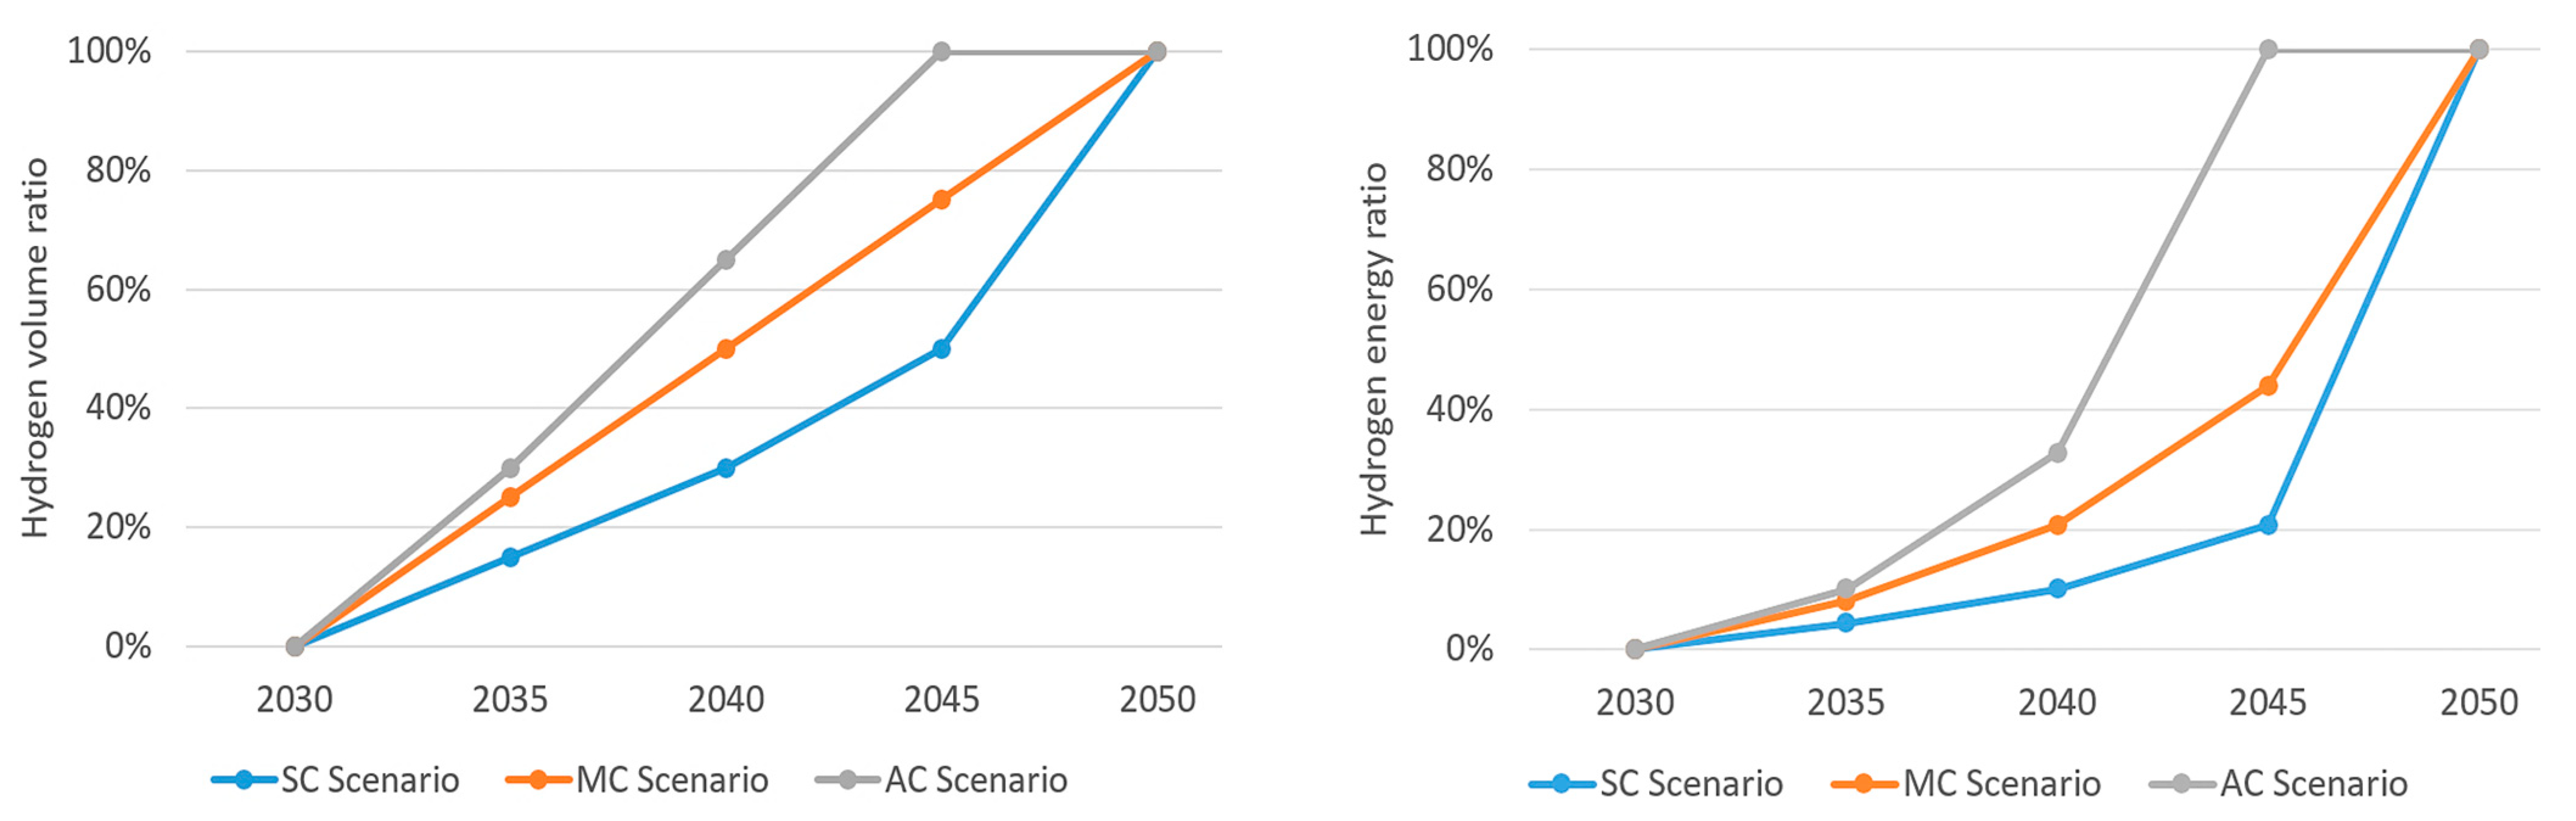
It can be seen that the SC scenario assumes a slow rate for the first half of the studied period where the expected share of hydrogen in the blend reaches 30% by 2040, then increases to 50% in 2045 before arriving at 100% by 2050. In this scenario, major conversion occurs in the second half of the period following the assumptions that (i) the commercial availability of green hydrogen supply at large scale happens late (around 2040 onwards), and (ii) the stakeholders of CCGT power plants (policymakers, plant owners, etc.) have a prudent approach to the fuel conversion. On the other hand, the AC scenario is based on an optimistic perspective that (i) green hydrogen markets, both domestic and international, rise quickly and a large scale of green hydrogen supply is available right after 2030, and (ii) owners of CCGT power plants have preferences on speeding up the process thanks to encouraging policies. In this scenario, the penetration of hydrogen goes quite constantly at a high rate from 2030 so that it reaches the final rate of 100% by 2045. The remaining scenario, MC, comes in between SC and AC with a moderate expectation of both the economical scale of hydrogen supply and the stakeholders’ approach.
Graphically, the conversion rates based on the increasing of the blending ratio hydrogen/NG in % volume and correspondingly by energy sharing are illustrated in Figure 9.
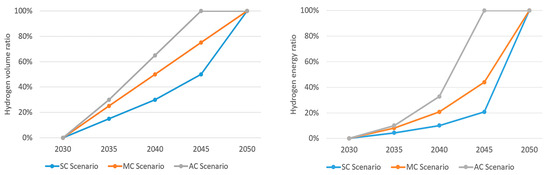
Figure 9.
Studied scenarios based on different hydrogen penetration rates in hydrogen/NG blending ratios.
3. Study Results
3.1. The Expansion of Generation Capacity of the Power System in the Studied Period
The modeling results of total system generation capacity for four scenarios are shown in Table 4 (it is noted that the total capacity in 2030 is 150.5 GW, in which there is wind power capacity of about 27.9 GW, as mentioned in Section 2.1.2).
Table 4.
Total system generation capacity of the scenarios in 2050 (GW).
The system capacity expands from 150.5 GW in 2030 to 584.6 GW in 2050 under the NC scenario, while the remaining three conversion scenarios range between 568.7 GW and 573.2 GW without considerable disparity in GW. The system capacity of the three conversion scenarios is not much different from the capacity data in PDP8 of 573.1 GW [15].
It is noted that among all scenarios, the capacity scales of several major generation sources like hydropower, solar, biomass, and coal-fired are almost uniform. The difference in total system capacities of the scenarios is determined almost solely by the difference in the corresponding wind power capacities (mainly offshore wind, according to the modeling result), as can be seen in Table 4. The wind power capacity in the NC scenario will reach from 27.9 GW in 2030 to 190.1 GW by 2050, while the three others range from 174.1 GW to 177.3 GW. This can be interpreted that due to the lack of non-emitted dispatchable power sources in the NC scenario, the optimization model opts for more wind power sources (mainly offshore wind power), resulting in higher capacity of this type of power source.
Among the three fuel conversion scenarios, the AC scenario aims for the earliest and fastest conversion, so the volume of low-emission CCGT generation capacity will be more available for the optimization model. However, this does not impact the development of the amount of wind power capacity (mainly offshore wind power). On the contrary, it is slightly higher than in other conversion scenarios, so the total system capacity in this scenario is higher (573.2 GW compared to 568.7 GW and 570.3 GW) due to two factors: (i) the hydrogen price in the first half of the studied period is still high (meaning the levelized cost of electricity (LCOE) of CCGT sources burning hydrogen/NG blend is still less competitive than the LCOE of offshore wind), and (ii) the pressure to reduce CO2 emissions in the power system in the early years of the studied period is not too heavy, so the model chooses to partly cut the production output of the cluster of CCGT sources while maximizing the output of other non-emitted sources to meet both electricity demand and emissions constraints in parallel.
3.2. The CO2 Emissions of Power System per Scenarios
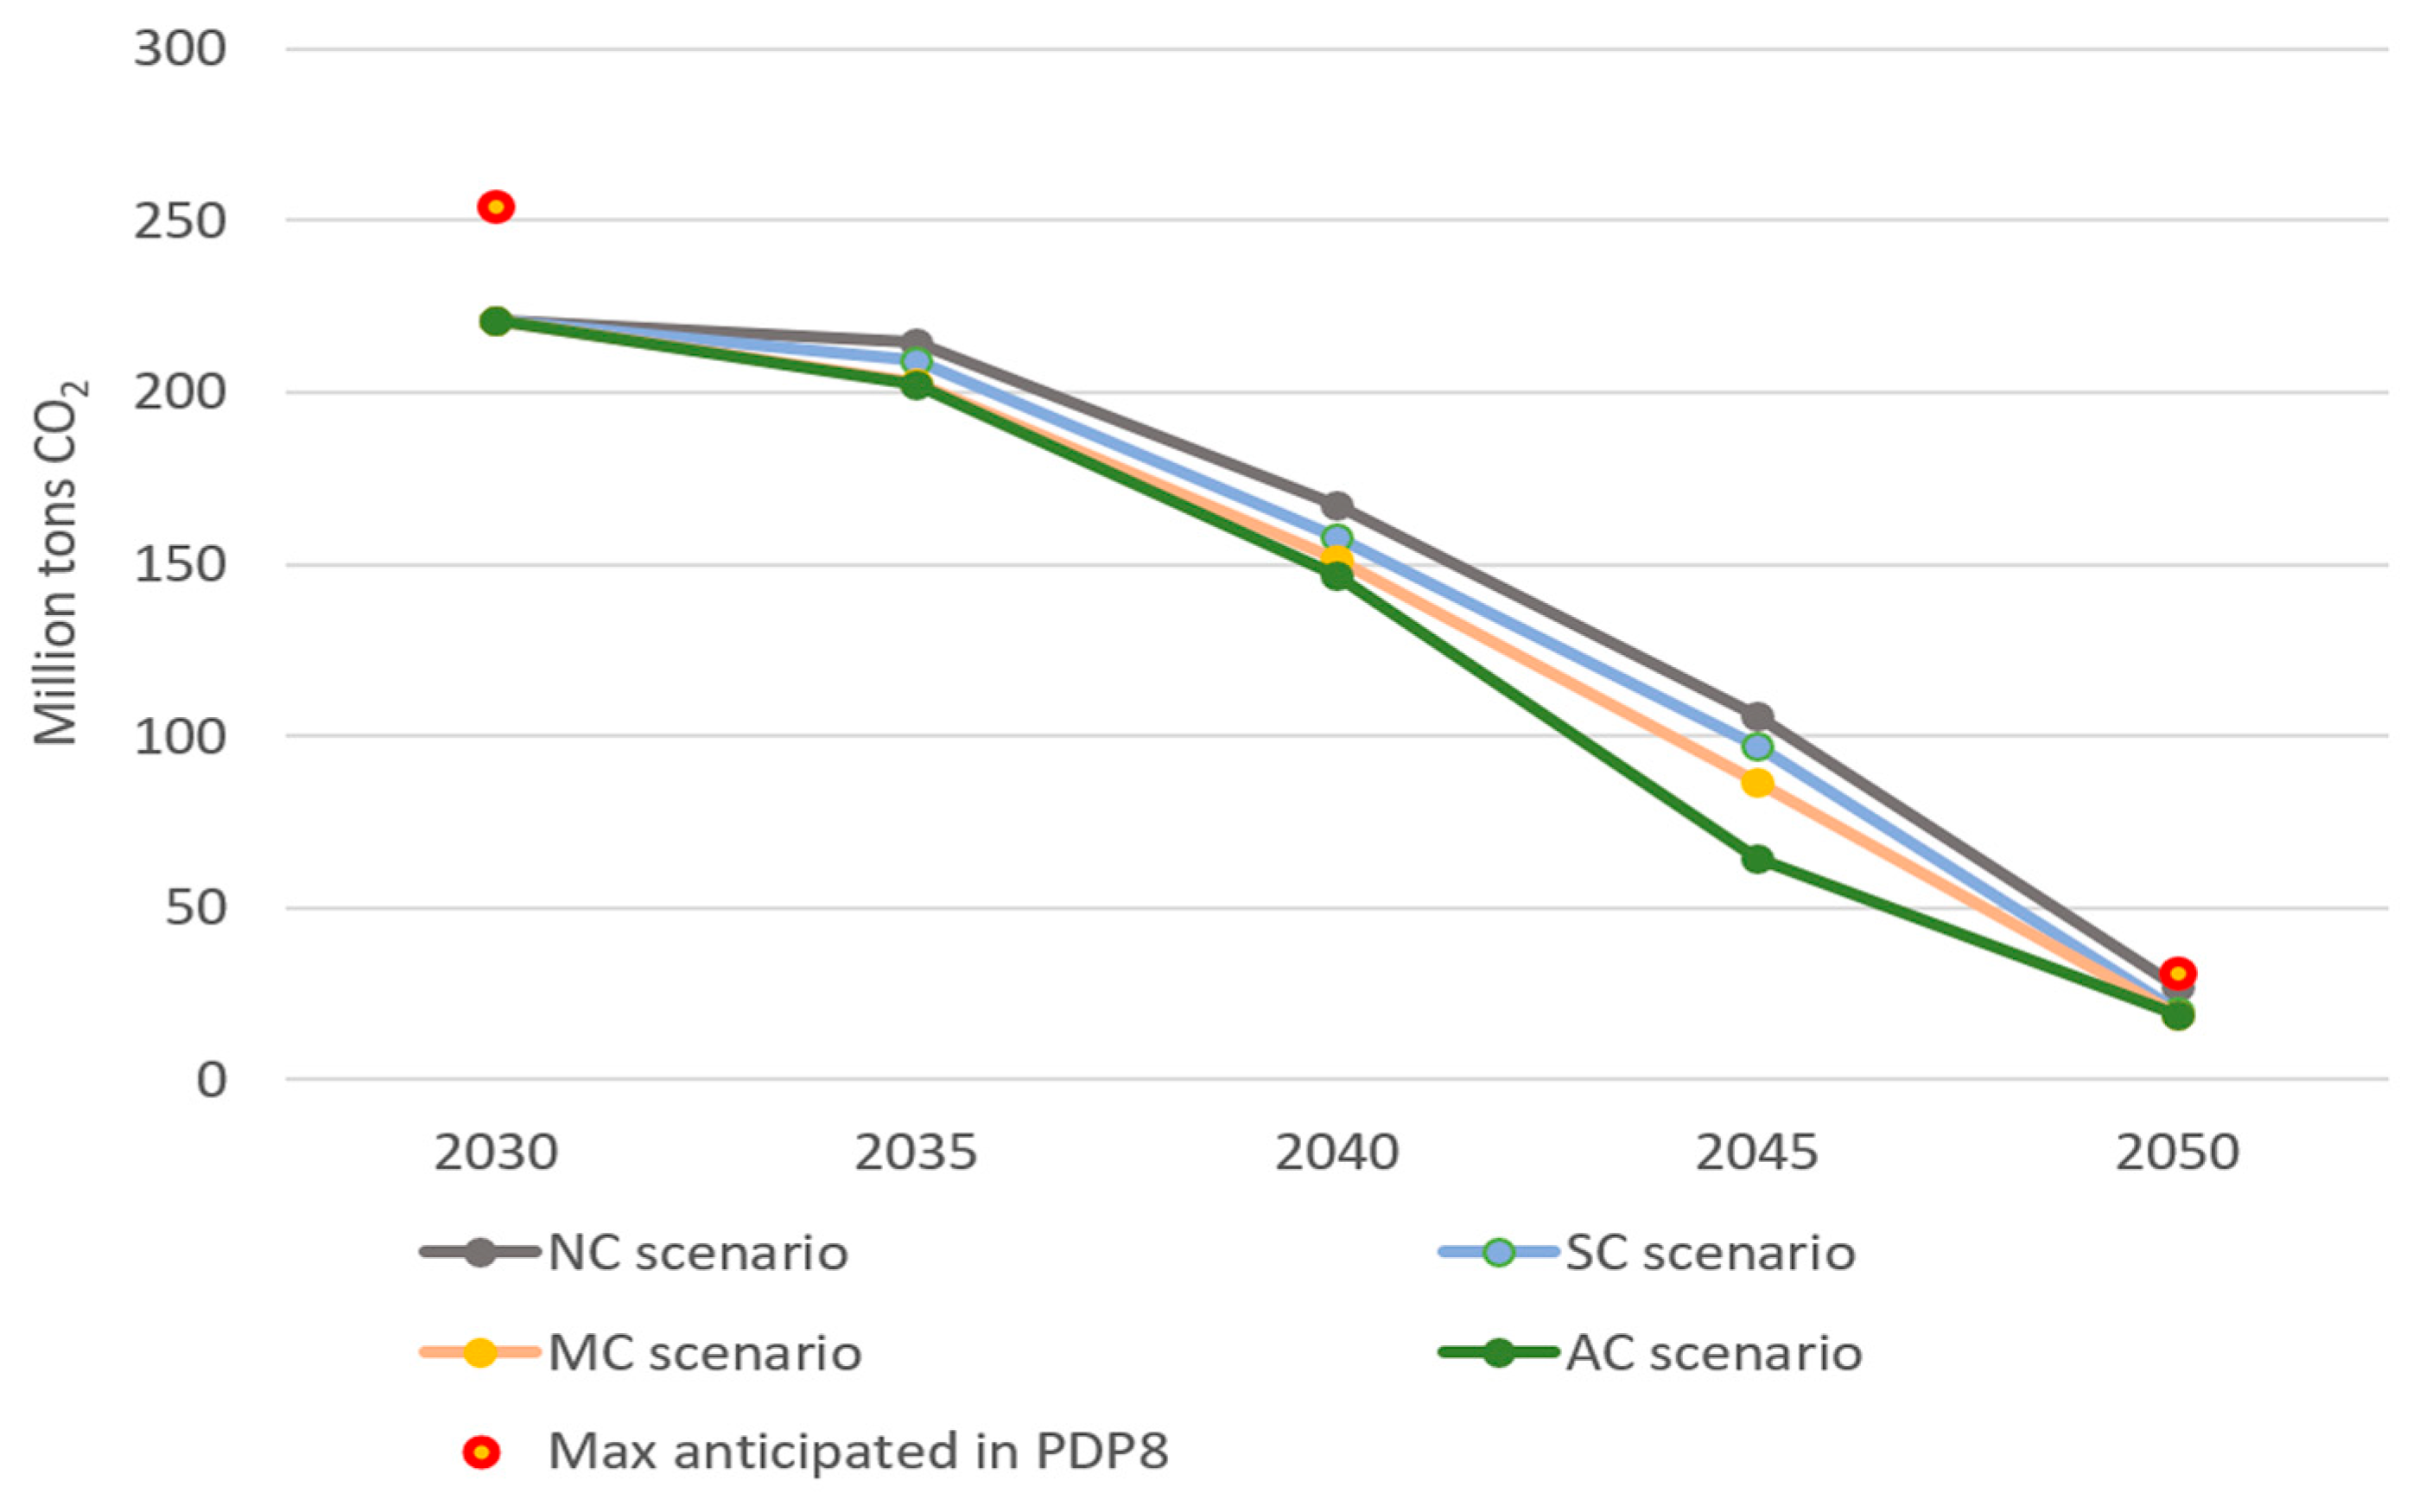
The modeling optimization results in the CO2 emissions for the four power system scenarios studied are shown in Figure 10, in which the “Max anticipated in PDP8” points are target emissions of the power system envisaged in PDP8 [15].
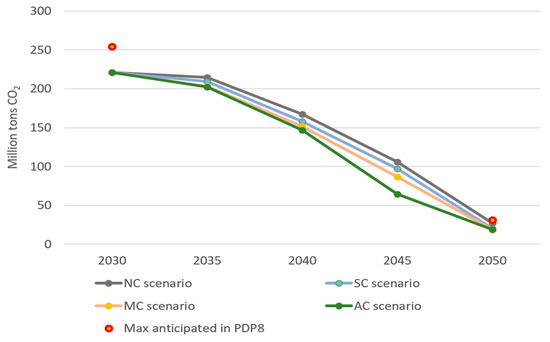
Figure 10.
CO2 emissions of power system for the studied scenarios.
It can be seen that the NC scenario has the highest emissions level, which can be said to be the “upper envelope”. This scenario, as analyzed above, is based on a combination of gradually reducing the output of CCGT sources (burning NG) to reduce CO2 emissions while increasing the development of wind power sources to ensure the generation output of the system. On the other hand, the AC scenario aims to maximize CCGT power output using zero-emission hydrogen fuel, so total system emissions are the lowest, and it can be considered as the “lower envelope”. The remaining scenarios lie between these two boundaries. For comparison, the aggregate volumes of CO2 emissions of the power system for studied scenarios over the period 2030–2050 are illustrated in Figure 11.

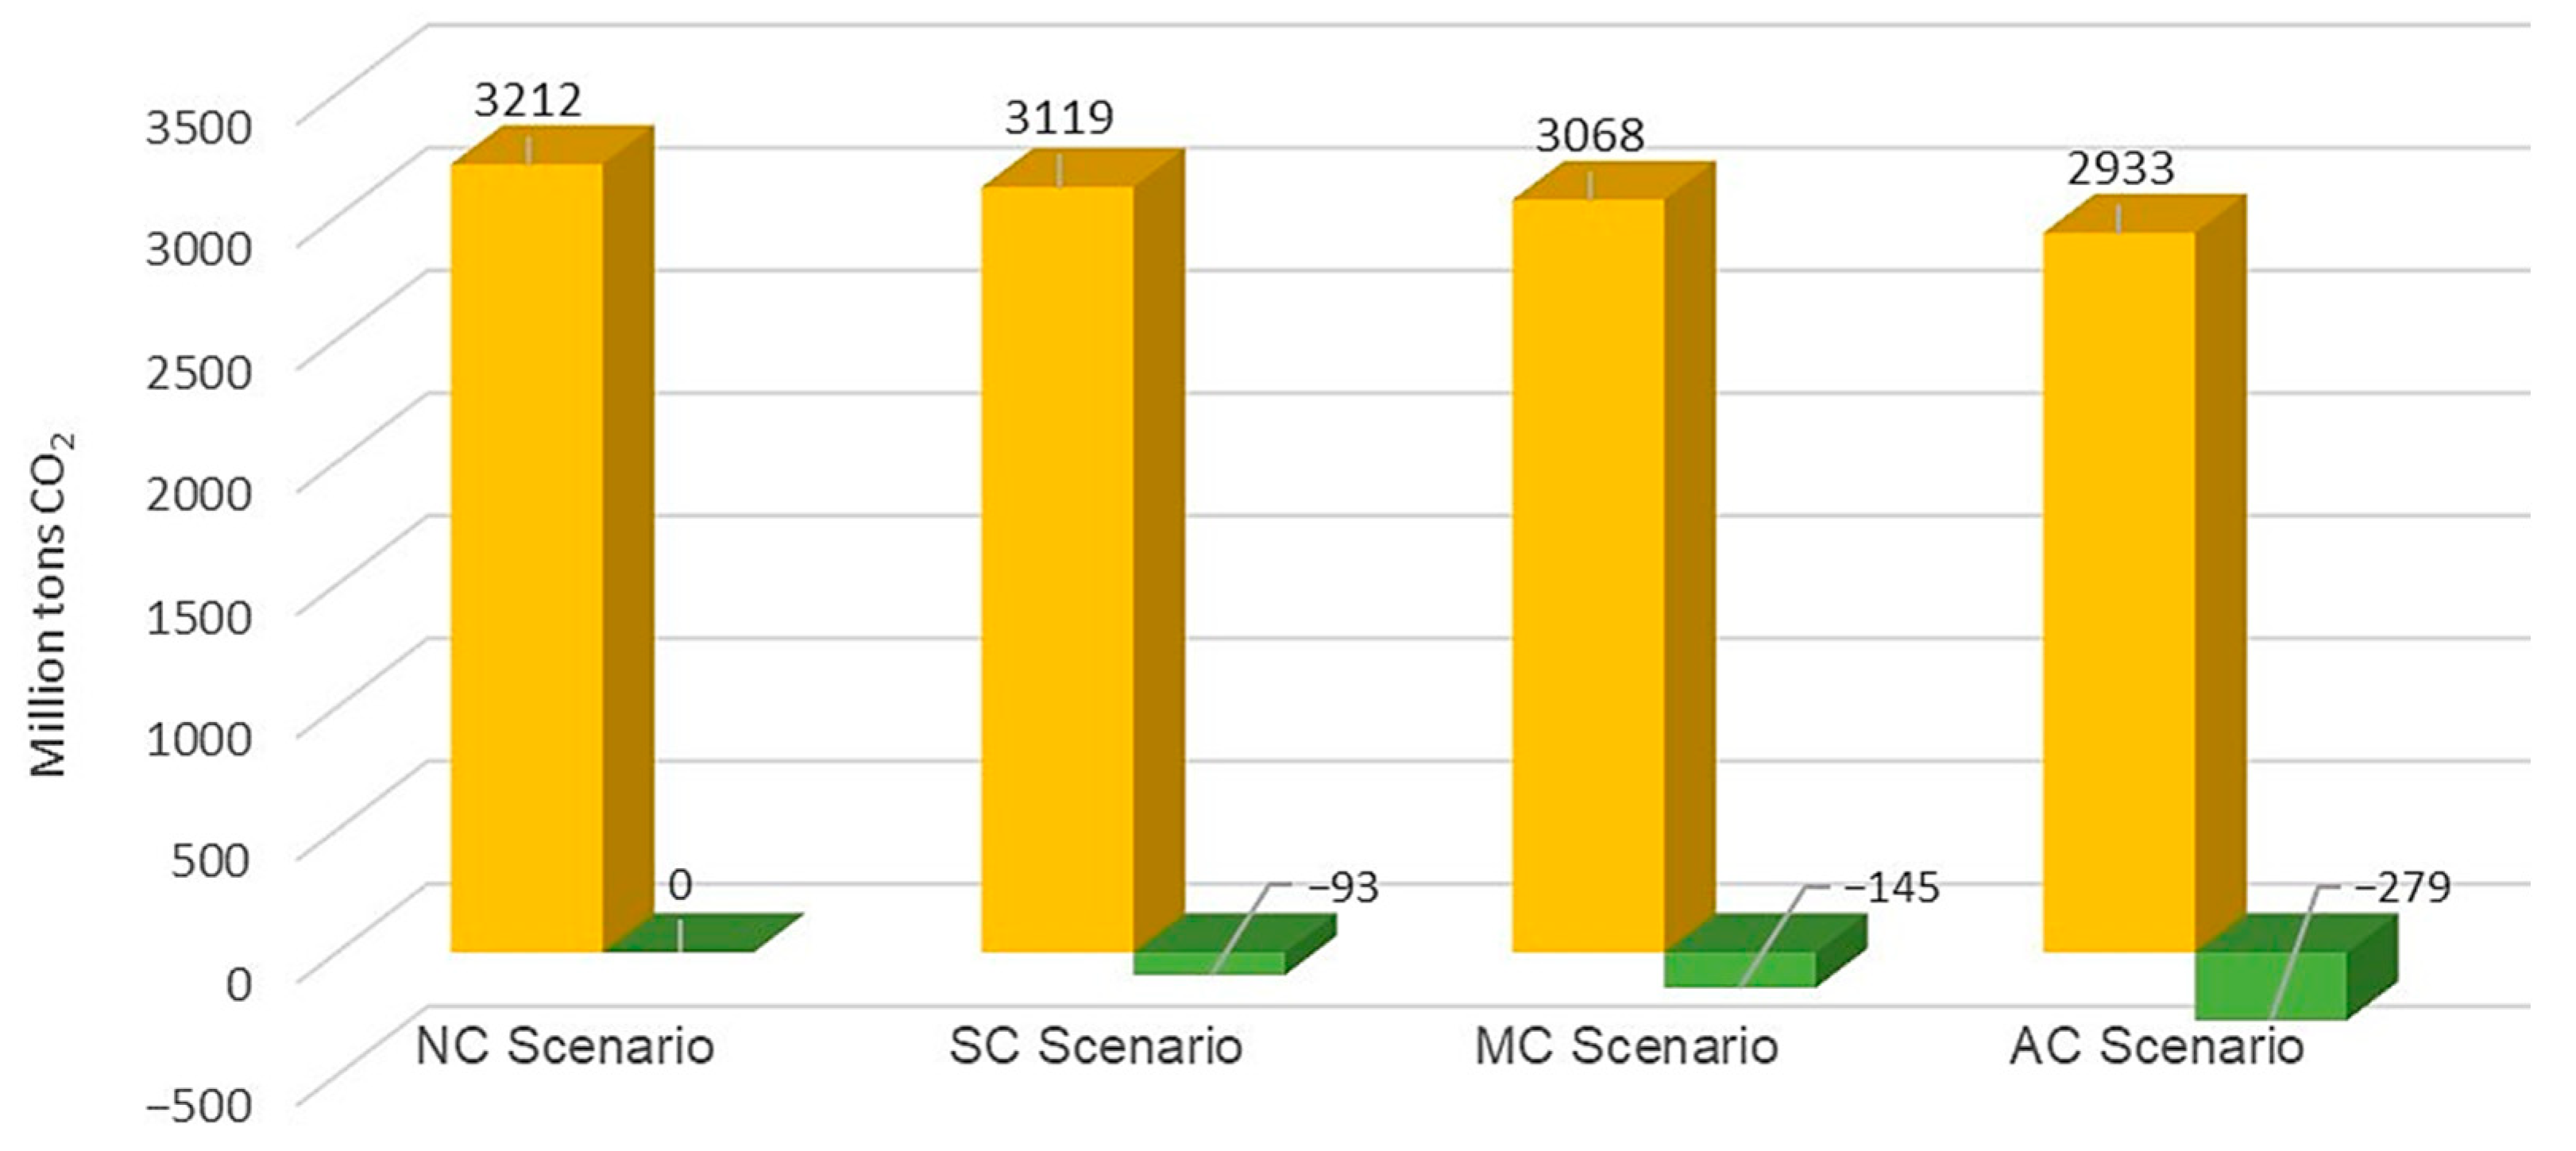
Figure 11.
Aggregate volumes of CO2 emissions of the power system according to scenarios.
It is noted that, as the fastest pathway of penetration of hydrogen into the system, scenario AC will save most CO2 emissions, while scenario NC, as a “baseline” for comparison, saves “zero” for this emission.
3.3. The Economic Performance of the Power System for the Studied Scenarios
The modeling optimization results of four scenarios in terms of the key system costs are presented in Figure 12.
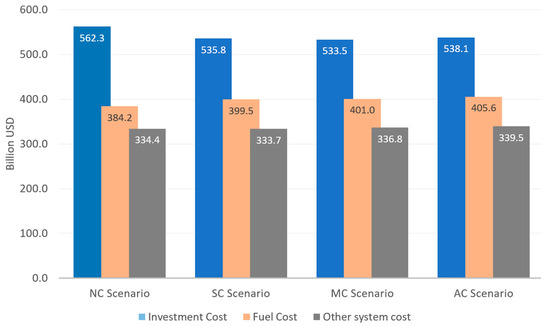
Figure 12.
Costs of power system for the studied scenarios over the period 2030–2050.
The total power system cost for the period 2030–2050 includes three key components: (i) investment cost (CAPEX, for building new power generation sources and key grid transmission items operational in the studied period), (ii) fuel cost (fossil fuels, biomass, hydrogen, etc.), and (iii) other system costs (mainly OPEX such as fixed O&M, variable O&M, and others like inter-regional transmission losses, etc.).
In the total system cost, the investment cost accounts for the largest proportion due to the rapid development scale of the power system during the studied period. When considering investment costs alone, the NC scenario is the highest due to the development of the largest scale of the power system (as described above). The investment costs of fuel conversion scenarios are not much different and follow the final capacity scale of the power system (in 2050).
The second largest cost of the system is fuel cost. Among them, it is easy to see that the NC scenario has the lowest total fuel cost because the main option of this scenario is to gradually cut fossil fuels (NG) according to emission reduction requirements. The AC scenario has the highest total fuel cost due to mobilizing the highest generation output of CCGT sources using hydrogen, while hydrogen prices in the studied period are still quite expensive compared to NG. The SC and MC scenarios have the same base fuel costs.
Finally, the components of “Other system costs” in the four scenarios are not much different, revealing that the calculation model optimized the system, dispatching problems in a quite appropriate and consistent manner.
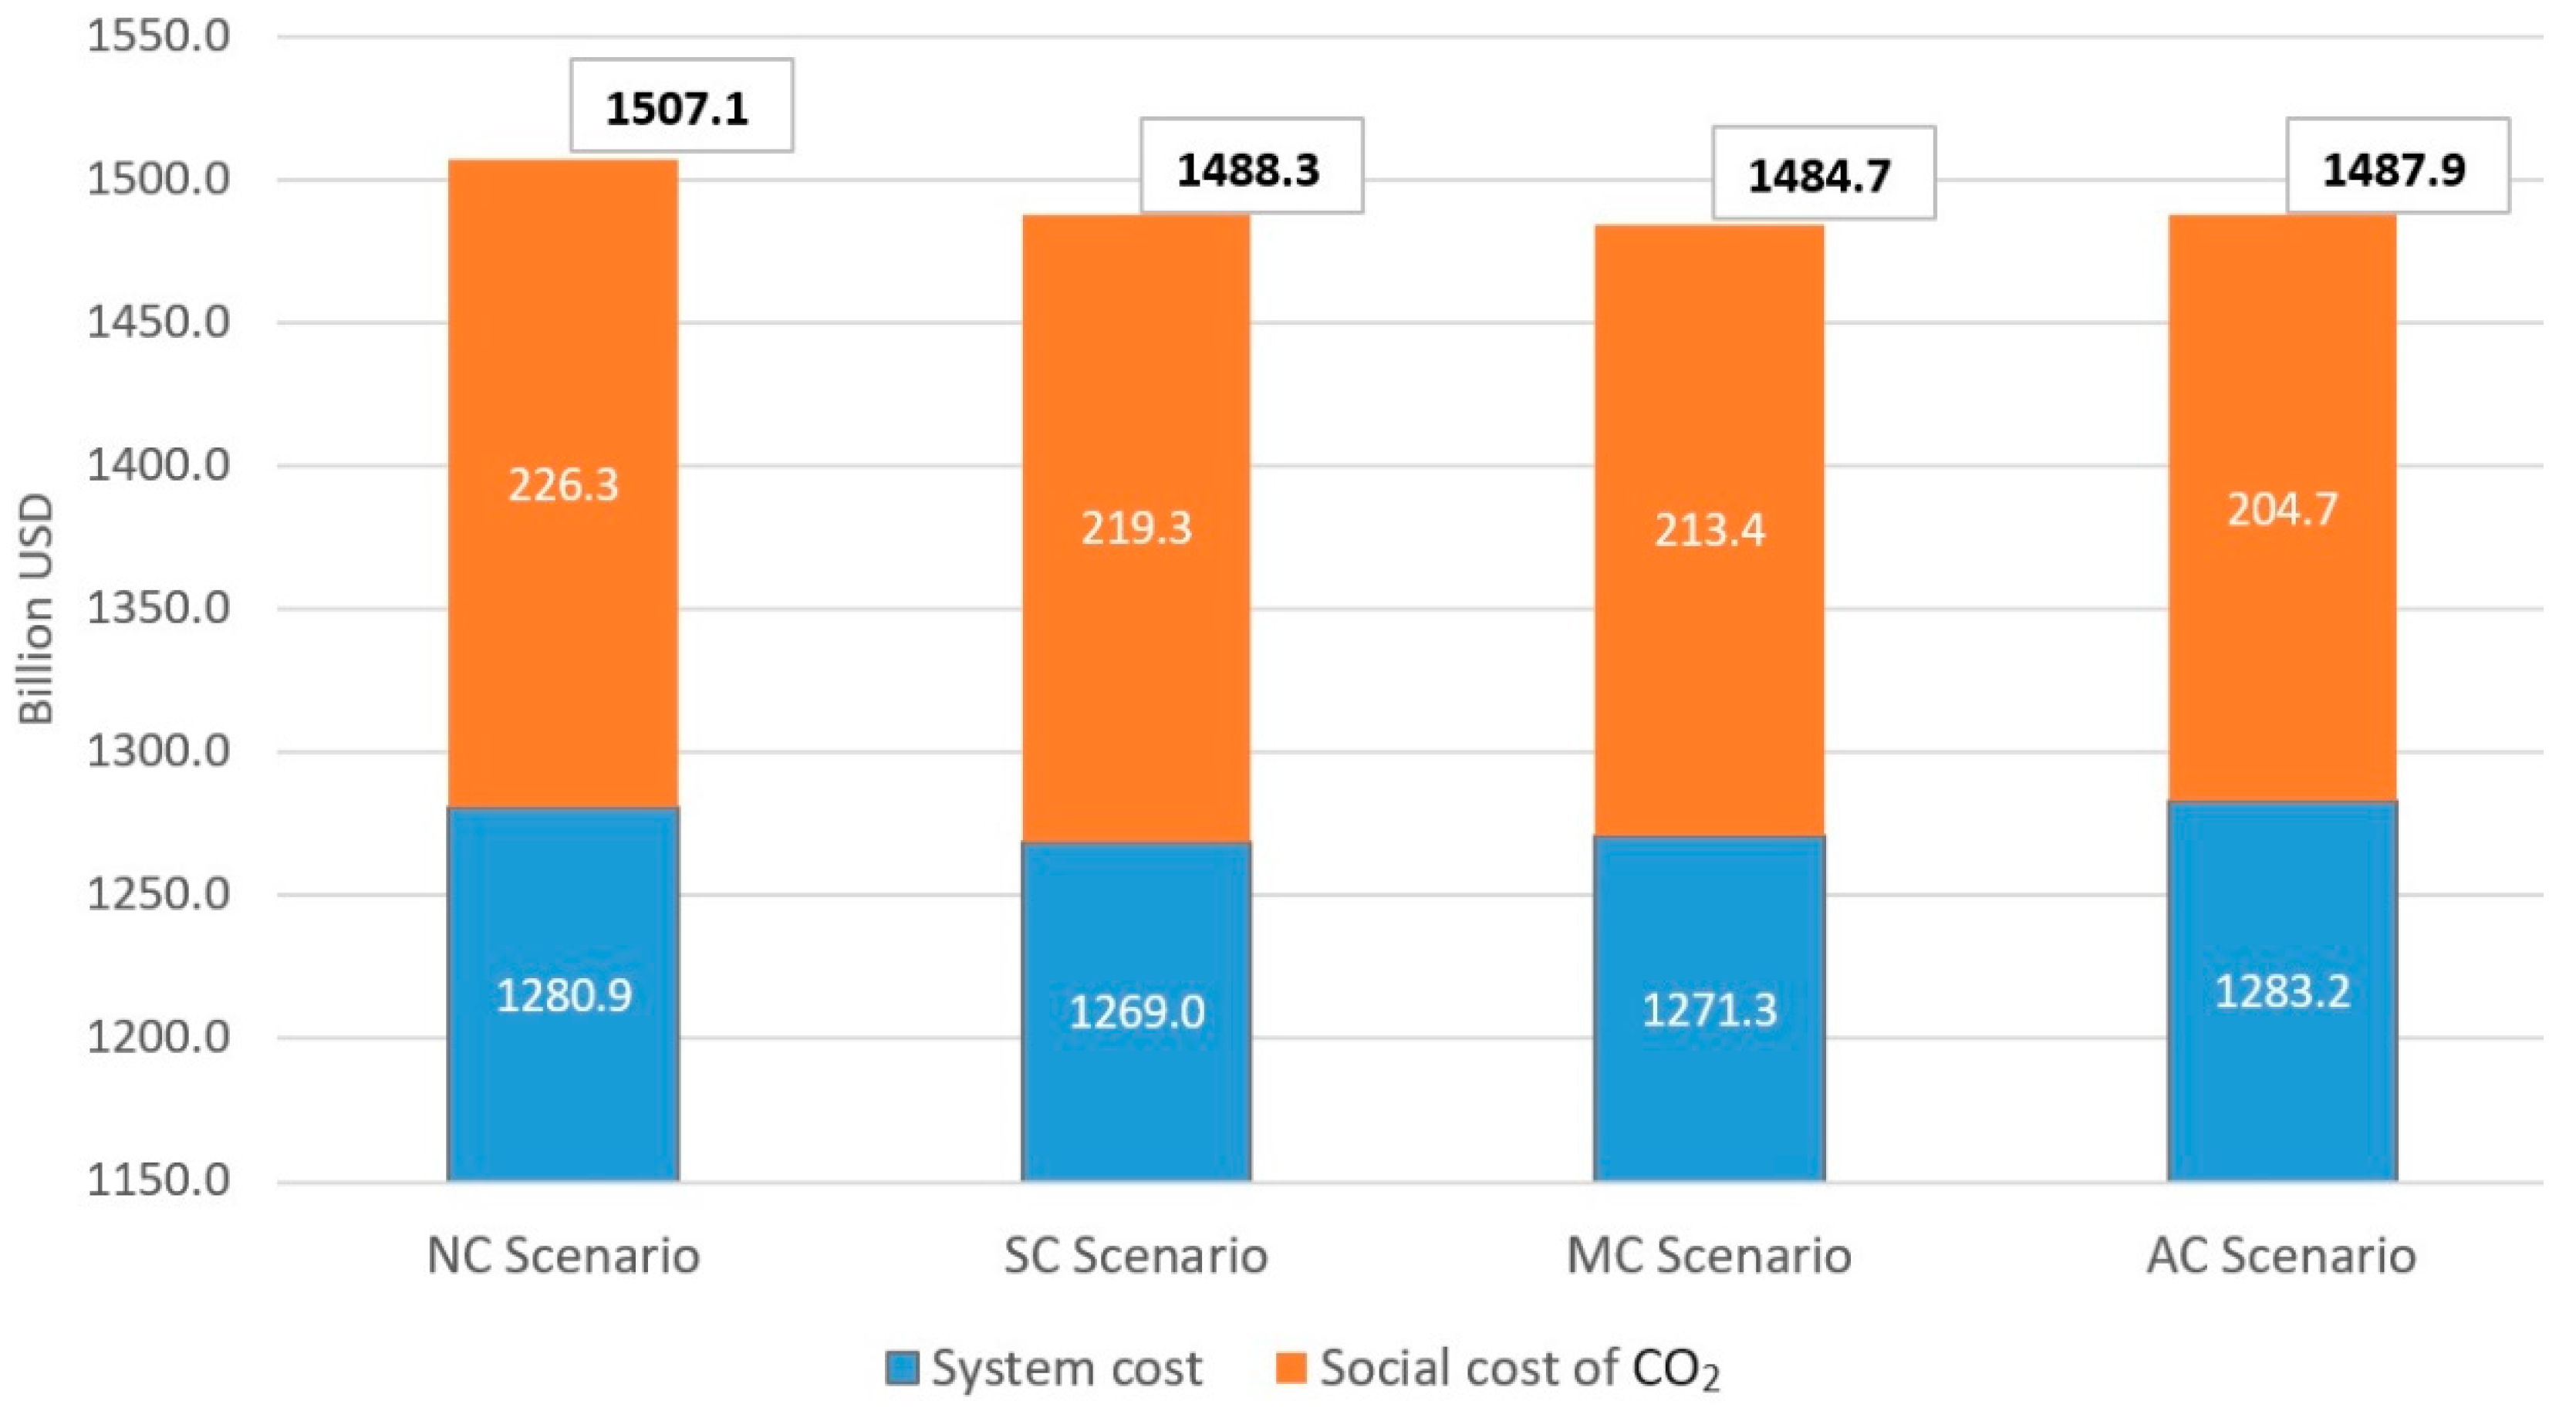
In Figure 13, the AC scenario has the highest total system cost while the SC scenario is the lowest. When considering the social cost of CO2 based on the assumption of CO2 social cost and the total aggregate volume of each scenario, the study result of the total cost of the power system shows that the NC is the highest one while MC is the lowest.
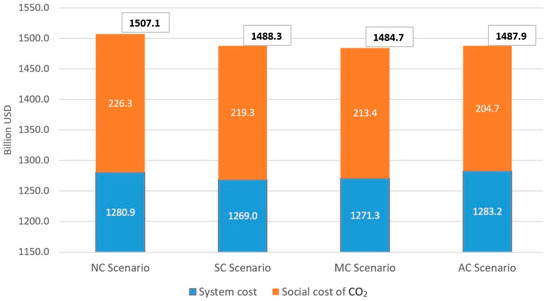
Figure 13.
Total system cost considering the social cost of CO2 for the studied scenarios.
4. Discussions and Recommendations
4.1. Discussions
The total power system cost of the SC scenario is the lowest. This means that the penetration pathway of hydrogen energy into Vietnam’s future power system should be considered in the “slow, prudent” approach of the SC scenario. The MC scenario can also be considered because the total system cost is just slightly higher than that of SC (about 0.16% only), while the investment cost is lower, with a value of about USD 2 billion.
The NC scenario has the second highest total system cost and the highest investment cost (CAPEX) among the scenarios, notably about USD 24.2–28.8 billion higher than the fuel conversion scenarios. In the studied period, the CCGT power sources are unusable in the NC scenario, while the system still needs additional wind power to meet with electricity demand. Thus, it can be recognized that converting the fuel of the CCGT power plant fleet from NG to hydrogen will be more beneficial than not converting when considering from the power system point of view. From the perspective of the owners of CCGT power sources, this is even more true, as retrofitting CCGT power plants to switch to hydrogen will enable the ability to be mobilized for generation, avoiding “stranded assets” risks and helping to maintain income revenue for the projects.
Additionally, if the social cost of CO2 is considered, there will be a significant difference (higher) between the total cost of the NC scenario (USD 1507.1 billion) compared to the fuel conversion scenarios (USD 1484.7–1488.3 billion). This further strengthens the above viewpoint regarding the need to convert to hydrogen fuel for CCGT power sources in the Vietnam power system.
The calculation results of the scenarios reveal that the price of hydrogen used in this study is not yet competitive with NG (in terms of LCOE) and is unable to compete even with offshore wind power. This is reflected in the resulting logic that the slower hydrogen is fed into the system, the lower the total system cost. Nevertheless, it is noted that the SC and MC scenarios are almost equivalent in terms of costs, suggesting that the assumed hydrogen price is already near the “competitive” point and the hydrogen conversion pathway may be considered between slow and moderate rates. In case the hydrogen price is more competitive in the studied period, an early and rapid transition from NG to hydrogen will be even more beneficial.
4.2. Recommendations
Based on the above study results and discussions, the following recommendations are proposed:
- The possible pathway of application of hydrogen energy into Vietnam’s power system through the CCGT power plant fleet should be considered a “slow, prudent” approach, with a slow-to-moderate NG-to-hydrogen conversion rate. In case the future green hydrogen price appears to be more competitive, an early and more rapid conversion from NG to hydrogen could be a better choice.
- From both points of view of the power system and power plants’ owners, applying conversion from NG to hydrogen in CCGT power plants will be more beneficial than not applying at all. This is truer if the social cost of CO2 is considered in the studied period.
- The process of conversion of fuel from NG to hydrogen at CCGT power plants will face significant challenges that require great efforts from policymakers, project developers, and related stakeholders to overcome, such as (1) comprehensively building a system of policy and framework that supports and enables the application of hydrogen in power generation in terms of pricing method, power market adaptation, and other incentive mechanisms as necessary; (2) to successfully implement technical/financial support and technological transfer to realize the hydrogen retrofit/upgrade of equipment and facilities of CCGT power plants; and (3) to create and maintain a commercially available supply chain of green hydrogen, meeting demand for fuel conversion at those power plants, including solutions to ensuring hydrogen supply sources and logistics means for storage, transport, and delivery of hydrogen to the respective power plant sites.
5. Conclusions
According to the PDP8 of Vietnam, the capacity scale of CCGT power plants using imported LNG will increase very rapidly in the period up to 2035, reaching a maximum of about 25.4 GW. The development of this fleet of power sources is necessary to support the operation of Vietnam’s power system with a large scale and high proportion of variable renewable energy sources.
After that, to achieve the goals of reducing CO2 emissions according to Vietnam’s commitments, the CCGT power sources will also have to cut most emissions in the period 2030–2050. The directional solution to the above problem is to convert fuel from using imported LNG to hydrogen fuel. It is anticipated that this process will have a significant impact on the investment and operation of the CCGT power plants themselves, as well as the economics and efficiency of the entire power system.
Aiming to investigate the process of penetration of hydrogen energy into the power generation from the perspective of the economics of the system, this study models the evolution of Vietnam’s power system for the period 2030–2050 according to different scenarios on the penetration rate of hydrogen energy at the fleet of gas-fired CCGT power plants, including the scenario without hydrogen energy (no conversion) for verification. The modeling results show the different total power generation capacities and system costs for the scenarios. As a result, the slow conversion scenario has a lowest total cost of about USD 1269.0 billion, while the accelerated scenario has the highest total cost of USD 1283.2 billion, and the moderate and no-conversion scenarios are in between. The investment cost of no-conversion scenario is about USD 562.3 billion—this is the highest among studied scenarios—while the other conversion ones range between USD 533.5 and 538.1 billion. As for CO2 emissions, the accelerated scenario represents the lowest aggregate emissions while the non-conversion one appears to be highest, 2933 and 3212 million tons, respectively. The outcome of this study reveals that a “slow, prudent” conversion approach should be taken with the hydrogen price assumed for modeling. In case the hydrogen price is more competitive, the penetration rate should be accelerated to take that advantage. The analysis also helps to realize that in all cases, converting fuel to hydrogen in the CCGT power plant fleet should be considered because the basic benefits will be better than not converting, especially when taking into account the social cost of CO2.
The results of this study provide policymakers, power systems, market operators, the owners of CCGT power plants, as well as other stakeholders with a reference basis to well prepare for the process of fuel conversion to hydrogen in the future, minimizing adverse impacts to the power system’s economics and every CCGT power plant operating in the system.
Author Contributions
Conceptualization, K.D.T.; methodology, K.D.T. and P.V.M.; software, D.D.N. and P.V.M.; data curation, D.D.N.; writing—original draft preparation, D.D.N. and P.V.M.; writing—review and editing, K.D.T. All authors have read and agreed to the published version of the manuscript.
Funding
This research received no funding.
Data Availability Statement
The datasets presented in this article are not readily available due to technical/time limitations. Requests to access the datasets should be directed to the authors.
Acknowledgments
The authors acknowledge the support by the Institute of Energy and the Ministry of Industry and Trade of Vietnam in sharing the data and information used to formulate Vietnam’s National Power Development Plan for the period 2021–2030, vision to 2050.
Conflicts of Interest
The authors declare no conflicts of interest.
Correction Statement
This article has been republished with a minor correction to the existing affiliation information. This change does not affect the scientific content of the article.
References
- IEA. World Energy Outlook 2023; IEA: Paris, France, 2023. [Google Scholar]
- Bothien, M.R.; Ciani, A.; Wood, J.P.; Fruechtel, G. Toward Decarbonized Power Generation with Gas Turbines by Using Sequential Combustion for Burning Hydrogen. J. Eng. Gas Turbines Power 2019, 141, 121013. [Google Scholar] [CrossRef]
- Schulthoff, M.; Rudnick, I.; Bose, A.; Gençer, E. Role of Hydrogen in A Low-Carbon Electric Power System: A Case Study. Front. Energy Res. 2021, 8, 585461. [Google Scholar] [CrossRef]
- Nazari, M.A.; Alavi, M.F.; Salem, M.; Assad, M.E.H. Utilization of hydrogen in gas turbines: A comprehensive review. Int. J. Low-Carbon Technol. 2022, 17, 513–519. [Google Scholar] [CrossRef]
- Ditaranto, M.; Heggset, T.; Berstad, D. Concept of hydrogen fired gas turbine cycle with exhaust gas recirculation: Assessment of process performance. Energy J. 2020, 192, 116646. [Google Scholar] [CrossRef]
- Koç, Y.; Yağlı, H.; Görgülü, A.; Koç, A. Analysing the performance, fuel cost and emission parameters of the 50 MW simple and recuperative gas turbine cycles using natural gas and hydrogen as fuel. Int. J. Hydrogen Energy 2020, 45, 22138–22147. [Google Scholar] [CrossRef]
- Marin, G.E.; Mendeleev, D.I.; Osipov, B.M. A Study on the Operation of a Gas Turbine Unit Using Hydrogen as Fuel. J. Phys. Conf. Ser. 2021, 1891, 012055. [Google Scholar] [CrossRef]
- Ryu, J.-Y.; Park, S.; Lee, C.; Hwang, S.; Lim, J. Techno-Economic Analysis of Hydrogen-Natural Gas Blended Fuels for 400 MW Combined Cycle Power Plants (CCPPs). Energies 2023, 16, 6822. [Google Scholar] [CrossRef]
- Oberg, S.; Odenberger, M.; Johnsson, F. Exploring the Competitiveness of Hydrogen-fueled Gas Turbines in Future Energy Systems. Int. J. Hydrogen Energy 2021, 47, 624–644. [Google Scholar] [CrossRef]
- Oberg, S.; Odenberger, M.; Johnsson, F. The value of flexible fuel mixing in hydrogen-fueled gas turbines—A techno-economic study. Int. J. Hydrogen Energy 2022, 47, 31684–31702. [Google Scholar] [CrossRef]
- ETN Global. Hydrogen Deployment in Centralized Power Generation—A Techno-Economic Case Study; ETN Global: Brussels, Belgium, 2022. [Google Scholar]
- ETN Global. Hydrogen Gas Turbines—The Path Towards a Zero-Carbon Gas Turbine; ETN Global: Brussels, Belgium, 2020. [Google Scholar]
- National Energy Technology Laboratory (U.S.). A Literature Review of Hydrogen and Natural Gas Turbines: Current State of the Art with Regard to Performance and NOx Control; National Energy Technology Laboratory: Morgantown, WV, USA, 2022. [Google Scholar]
- Government of Vietnam. National Strategy on Climate Change for the Period to 2050; Government of Vietnam: Hanoi, Vietnam, 2022. [Google Scholar]
- Institute of Energy (Vietnam). National Power Development Plan for the Period 2021–2030, Vision to 2050; Institute of Energy: Hanoi, Vietnam, 2023. [Google Scholar]
- Institute of Energy (Vietnam). National Master Plan on Energy for the Period of 2021–2030, Vision to 2050; Institute of Energy: Hanoi, Vietnam, 2023. [Google Scholar]
- Nguyen, H.L. Potential market and impact of clean hydrogen development to 2050 in Vietnam. Petrovietnam J. 2021, 12, 40–47. [Google Scholar] [CrossRef]
- Hoang, A.T.; Pandey, A.; Lichtfouse, E.; Bui, V.G.; Veza, I.; Nguyen, H.L.; Nguyen, X.P. Green hydrogen economy: Prospects and policies in Vietnam. Int. J. Hydrogen Energy 2023, 48, 31049–31062. [Google Scholar] [CrossRef]
- Huy, N.Q.; Son, T.T. Evaluation of standalone solar hydrogen for off-grid electrification in remote areas of Vietnam. J. Sci. Technol. 2017, 11, 46–50. [Google Scholar]
- Phap, V.M.; Sang, L.Q.; Ninh, N.Q.; Van Binh, D.; Hung, B.B.; Huyen, C.T.T.; Tung, N.T. Feasibility Analysis of Hydrogen Production Potential from Rooftop Solar Power Plant for Industrial Zones in Vietnam. Energy Rep. 2022, 8, 14089–14101. [Google Scholar] [CrossRef]
- Han, N.T.; Dien, V.M.; Nam, P.H.; Long, L.H. Research on Hho Technology Application For Diesel Automobile. Sci. Technol. 2017, 42, 73–76. [Google Scholar]
- Phan, T.P.; Nguyen, T.L.; Nguyen, P.K.T. Evaluation and enhancement of hydrogen production from Vietnamese macroalgae in the single-stage of dark fermentation and microbial electrolysis cell. Biomass Bioenergy 2023, 175, 106885. [Google Scholar] [CrossRef]
- Government of Vietnam. Decree on Regulations to Mitigate Greenhouse Gas Emissions and Protect the Ozone Layer; Government of Vietnam: Hanoi, Vietnam, 2022. [Google Scholar]
- IEA. The Future of Hydrogen; IEA: Paris, France, 2019. [Google Scholar]
- IRENA. World Energy Transitions Outlook 2023 (1.5 °C Pathway); IRENA: Masdar City, Abu Dhabi, 2023. [Google Scholar]
- IEA. Global Hydrogen Review 2023; IEA: Paris, France, 2023. [Google Scholar]
- IRENA. Global H2 Trade to Meet the 1.5 °C Climate Goal: Part III—Green H2 Cost and Potential; IRENA: Masdar City, Abu Dhabi, 2022. [Google Scholar]
- 2023 Hydrogen Levelized Cost Update: Green Beats Gray|BloombergNEF (bnef.com). Available online: https://about.bnef.com/blog/2023-hydrogen-levelized-cost-update-green-beats-gray/ (accessed on 10 May 2024).
- Mitsubishi Power. Hydrogen Power Generation Handbook; Mitsubishi Power: Tokyo, Japan, 2021. [Google Scholar]
- General Electric. Hydrogen for Power Generation: Experience, Requirements, and Implications for Use in Gas Turbines; General Electric: Hongkong, China, 2022. [Google Scholar]
- Siemens Energy. Hydrogen Power and Heat with Siemens Energy Gas Turbine; Siemens Energy: Munich, Germany, 2022. [Google Scholar]
- Ansaldo Energia. Hydrogen Technology; Ansaldo Energia: Genova, Italy, 2022. [Google Scholar]
- HYFLEXPOWER Consortium Successfully Operates a Gas Turbine with 100 Percent Renewable Hydrogen, a World First. Available online: https://www.siemens-energy.com/global/en/home/press-releases/hyflexpower-consortium-successfully-operates-a-gas-turbine-with-.html (accessed on 10 May 2024).
- World’s Largest Hydrogen Fuel Blending Project Completed. Available online: https://www.powerprogress.com/news/World-s-largest-hydrogen-fuel-blending-project-completed/8021356.article (accessed on 10 May 2024).
- Power Plants of the World: A Hydrogen Pilot by GE. Available online: https://www.powerprogress.com/news/power-plants-of-the-world-a-hydrogen-pilot-by-ge/8027273.article (accessed on 10 May 2024).
- Mitsubishi Power Delivers Hydrogen-Ready Gas Turbines to “IPP Renewed” Project in Utah to Meet Decarbonization Goals in the Western US. Available online: https://power.mhi.com/regions/amer/news/20230727 (accessed on 10 May 2024).
- What the World Could Learn from Austria’s First Hydrogen Field Tests. Available online: https://www.siemens-energy.com/global/en/news/magazine/2022/donaustadt-hydrogen-trial.html (accessed on 10 May 2024).
- Interagency Working Group on Social Cost of Greenhouse Gases of the United States Government. Technical Support Document: Social Cost of Carbon, Methane, and Nitrous Oxide—Interim Estimates under Executive Order 13990; United States Government: Washington, DC, USA, 2021. [Google Scholar]
- EA Energy Analyses. Balmorel Energy System Model—User Guide; EA Energy Analyses: Copenhagen, Denmark, 2018. [Google Scholar]
- Wiese, F.; Bramstoft, R.; Koduvere, H.; Alonso, A.P.; Balyk, O.; Kirkerud, J.G.; Tveten, Å.G.; Bolkesjø, T.F.; Münster, M.; Ravn, H. Balmorel Open Source Energy System Model. Energy Strategy Rev. 2018, 20, 26–34. [Google Scholar] [CrossRef]

Disclaimer/Publisher’s Note: The statements, opinions and data contained in all publications are solely those of the individual author(s) and contributor(s) and not of MDPI and/or the editor(s). MDPI and/or the editor(s) disclaim responsibility for any injury to people or property resulting from any ideas, methods, instructions or products referred to in the content. |
© 2024 by the authors. Licensee MDPI, Basel, Switzerland. This article is an open access article distributed under the terms and conditions of the Creative Commons Attribution (CC BY) license (https://creativecommons.org/licenses/by/4.0/).