Abstract
As the share of variable renewables in the power system generation mix increases, meeting capacity requirements becomes challenging. In this context, hydropower reservoirs can play a vital role in integrating renewable energy due to their storage potential, contributing to meeting power supply criteria. However, given that reservoirs serve multiple purposes, various constraints can limit their capacity potential. This article introduces an analytical methodology that is designed to evaluate the maximum available power of hydro plants in critical scenarios. By applying concepts related to hydropower production calculations for the peak power demand and metrics evaluating the compliance with supply criteria, this study distinguishes itself from region-specific investigations. It conducts a generalized analysis of power availability across all regions of Brazil, with a focus on identifying the reasons for the most significant power losses and their specific locations. The results of this analysis demonstrate the feasibility of enhancing the available power of reservoirs, effectively addressing demand fluctuations, and sustainably improving energy security. This is particularly crucial in countries that are heavily reliant on renewables, including hydropower, for a huge portion of their electricity. The findings underscore the feasibility of increasing the penetration of variable renewable generation by optimizing the operation of existing hydropower plants. This optimization not only enhances energy security but also contributes to a more resilient and sustainable future, benefiting policy makers, energy planners, and stakeholders in the field of hydropower with reservoirs.
1. Introduction
The increasing share of variable renewables in Brazil’s generation mix underscores the critical need for more specific technologies that can enhance capacity [1]. Hydroelectric plants, constituting 58% of the country’s installed generation capacity by the end of 2021, must increasingly address capacity demands. Therefore, improving the operational management and predictability is imperative. This prompts the question of how much hydroelectric plants, especially those with large reservoirs, can contribute to capacity adequacy, thus minimizing or postponing new investments in alternatives like thermal power plants with adverse environmental impacts.
Thus, this article employs an analytical methodology to gauge the maximum available power of hydro plants for critical scenarios, considering Brazil’s hydrological diversity. It aims to assess how improvements in hydropower operation can boost power availability.
The global transition toward a more renewable energy matrix in recent decades has raised several concerns. Researchers have investigated the impacts of integrating substantial amounts of variable renewable generation. For instance, some argue that ensuring flexibility in the power system is crucial for managing renewable variability and uncertainty, impacting all system levels. Consequently, the integration of electricity system regulation is essential for optimizing overall performance [2]. Other studies assert that for nations integrating substantial amounts of variable renewables, a battery revolution is not necessary. However, discussions on the technical design of their power systems should prioritize the energy, capacity, flexibility, reliability, and resilience that are required for each grid, coordinating resources for an optimal least-cost mix [3]. Furthermore, optimizing the generation mix of technologies can also decrease the need for thermal power generation and minimize greenhouse gas emissions [4]. Whether focusing on analyses of optimization in the expansion mix, improvements in regulation, or power system design, studies converge to indicate that existing hydropower reservoirs play a crucial role in achieving optimal dispatchability and balancing variations in the electricity supply.
Countries with a significant hydropower share in their generation mix, such as advanced economies like Norway, Austria, Switzerland, Canada, and New Zealand, as well as developing and emerging economies like Paraguay, Costa Rica, Colombia, and Brazil [5], have an advantage amid the increasing penetration of variable renewables. This advantage stems from hydropower’s substantial capacity to provide flexibility and storage for electricity systems [6]. On the other hand, maximizing the use of this resource to its fullest potential remains a challenge.
Therefore, this study analyzes hydropower’s contribution to Brazil’s power supply, aiming to enhance its operation. This improvement is essential for any country with substantial hydropower and variable renewable generation, especially those that are transitioning to a cleaner energy matrix. Given the potential for cost overruns that is associated with further hydropower expansion, particularly megaprojects [7,8], this work primarily focuses on existing Brazilian dams.
The Brazilian power system has continental dimensions, with 172 GW of centralized installed capacity and 175 km of transmission lines in 2021 [1].
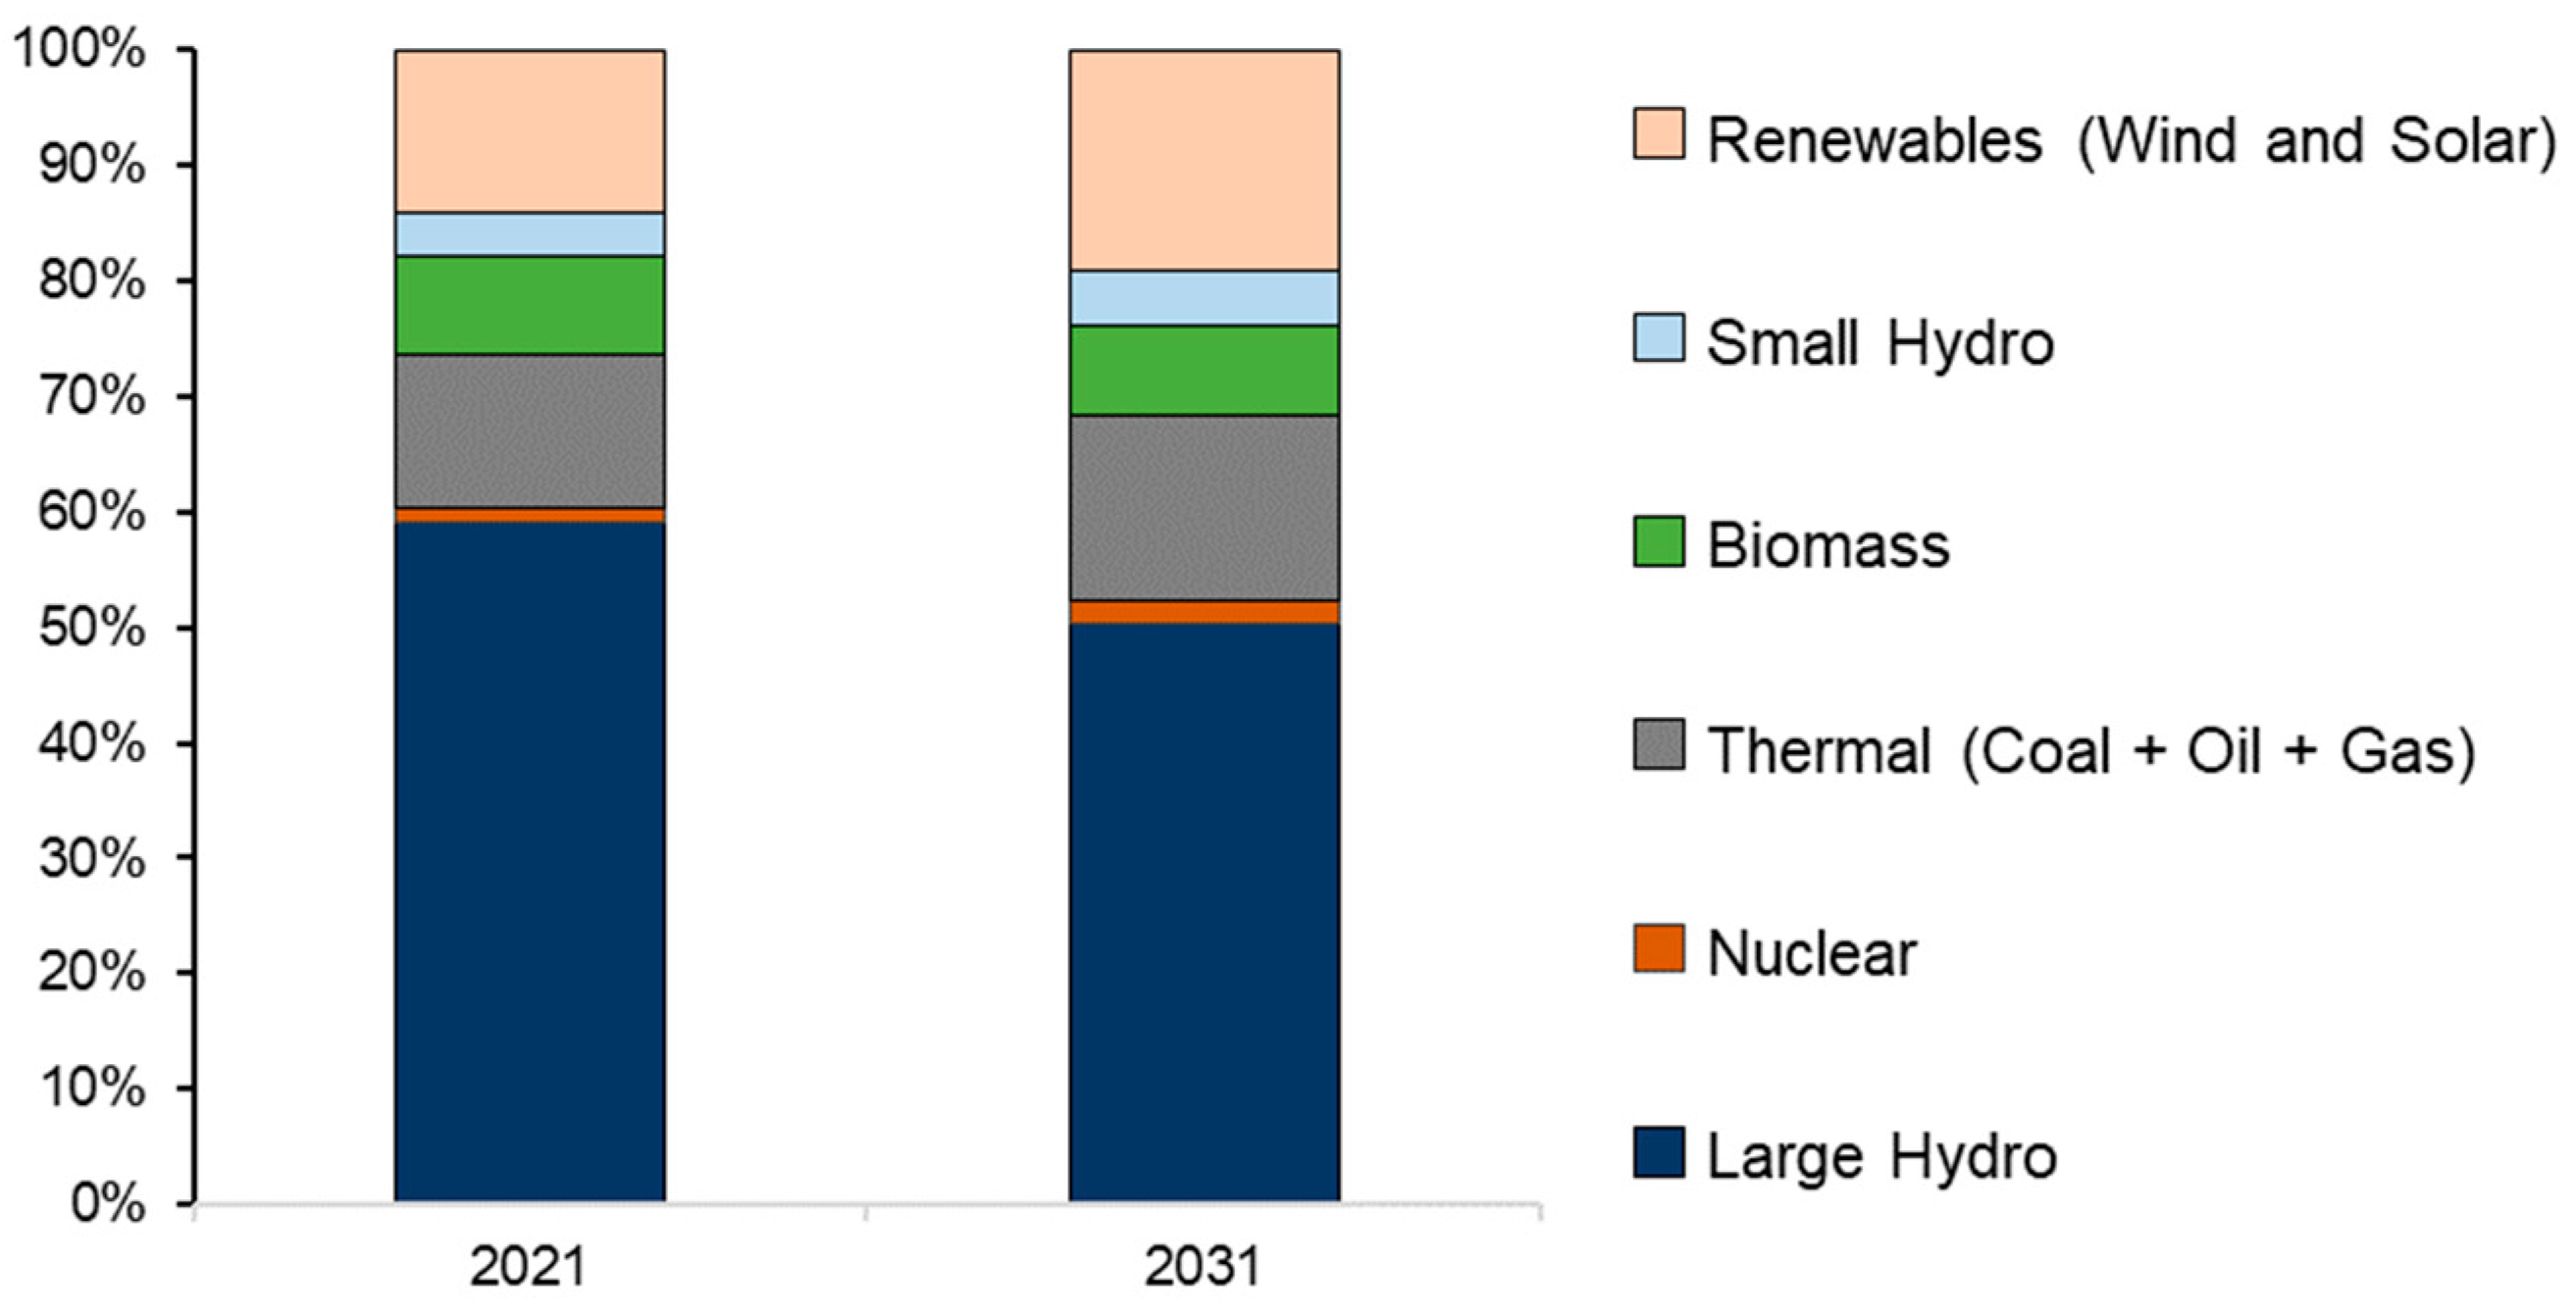
Historically hydro-dominated, it features large reservoirs providing multi-year regulation capabilities. These large hydro plants are organized in complex cascades across various river basins. Large-scale hydro power accounted for 59% of the installed capacity in 2021, followed by 15% from thermal plants and 26% from other renewables, of which 14% were variable renewables. Brazilian official energy planning projects a decline in the participation of large hydro plants to 50% over a ten-year horizon, while variable renewables are expected to increase to 19% of the total centralized installed capacity of the system (Figure 1). In Brazil, continuous and disruptive technological innovation leads to an increased participation of new non-controllable renewable sources (mainly wind and solar photovoltaic), with a reduction in the prevalence of hydroelectricity [9].
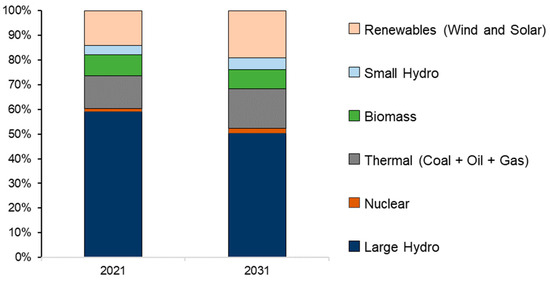
Figure 1.
Brazilian planned electricity mix expansion [1].
Power systems that are primarily supplied by hydropower plants often face energy constraints due to the high uncertainty of water inflow, caused by factors such as snow melting in temperate zones or rainy seasons in tropical regions. Hydropower plants are typically designed with a focus on optimal hydroelectric use of the river basin, resulting in a frequent surplus capacity margin. In the past, when the choices for generation expansion were limited to hydro or thermal plants—both reliable capacity providers—system planners and operators in hydropower-dominant systems were less concerned about capacity constraints. However, with the growing competitiveness of variable renewables, the landscape has changed. While variable renewables contribute significantly to the energy mix, their short-term variability poses challenges to capacity and flexibility adequacy. Consequently, the Brazilian power system is increasingly in need of specific solutions to address peak capacity requirements.
Hydropower plants, especially those with reservoirs, have substantial potential to meet the power demand. They can quickly ramp to full loading status and adjust their capacity by up to 50% within minutes [10]. Hydropower is recognized as one of the most flexible power-generating technologies [6], capable of supporting variable renewables by absorbing steep ramps in net load without compromising the environment regarding emissions [11,12]. Strategies to maintain higher reservoir levels, providing more power during periods of renewable energy source variability, can reduce electricity costs and carbon dioxide emissions from thermal sources [12]. As the share of variable renewables increases, hydro plants’ optimal operation is expected to evolve to meet both energy and capacity demands.
This shift may impact hydropower revenues, as current market structures, like in Brazil, do not adequately reward the services that hydropower can provide. Despite energy sales remaining the primary revenue source for hydropower plants operating in liberalized electricity markets [6], their value depends on the market design [13]. Hydropower, including conventional and pumped storage, has a promising role in the future power landscape, leveraging capacity markets due to its load-following capabilities, peaking capacity, and power quality attributes, which can reduce prices during peak load hours [14,15].
Like a traditional battery, a hydropower system can store and generate energy later. However, operational complexities arise due to reservoirs serving multiple purposes such as flood control, irrigation, fish migration, transportation, and recreation. Therefore, it is important to minimize the conflicts related to multiple water uses [16] and water allocation between energy production and environmental constraints, since the exploitation of river flows for energy production also has environmental impacts [17,18,19]. Additionally, assessing the storage value requires running models simulating the hydropower system’s operation under various future conditions [20] while accounting for the complexities of both hydropower and electrical system operations [21].
In Brazil, hydroelectric power plants are integrated into a centralized system, with the National Grid Operator (ONS) overseeing energy dispatch within the National Interconnected System (NIS) [22]. Hydrothermal coordination spans from long-term multi-year reservoir optimization to short-term hourly dispatch. The computational program NEWAVE [23], based on Stochastic Dual Dynamic Programming (SDDP) [24,25], and accounting for inflow uncertainty, addresses the long-term multi-year reservoir optimization challenge. However, 2021 witnessed Brazil facing the most adverse hydrological conditions in its historical inflows since 1931. Consequently, ONS, in collaboration with the Ministry of Mines and Energy (MME) and regulatory bodies such as the National Electricity Agency (ANEEL) and the Brazilian National Water Agency (ANA), alongside hydroelectric generation agents, introduced a series of operational constraint flexibilities. These measures aimed at preserving national grid hydropower storage levels to ensure the safety of the electric energy supply. Notably, they included a reduction in minimum outflows at the Jupiá and Porto Primavera hydroelectric plants and across the São Francisco River basin [26].
Given the substantial impact of severe drought scenarios on hydroelectric production, these operational flexibilities were implemented cohesively to address the various uses of the rivers and mitigate environmental impacts. Consequently, the restoration of hydroelectric storage assumes critical importance to mitigate operational costs and risks, and this fact highlights the importance of considering flexible reservoir rules [27]. Additionally, the interplay between climate change effects on water availability and the exploration of alternatives to hydroelectric power generation underscores the need to maintain a synergy among energy sources, ensuring energy security sustainably [28].
Recently, Brazil introduced two criteria for capacity adequacy evaluation [29]. This benchmark represents significant progress, as the Brazilian power system faces growing constraints in capacity, extending beyond mere energy considerations amidst the challenges that are posed by the ongoing energy transition. The pre-existing economic standard, ensuring parity between short-term (operational) and long-term (expansion) marginal costs, alongside a capped risk of a 5% energy deficit, proved insufficient in this evolving scenario. Consequently, the newly introduced power supply criteria embrace a more probabilistic perspective, demanding an assessment not only of the probability of a deficit but also of its potential magnitude.
Within this framework, the primary criterion for capacity adequacy evaluation is the Annual Loss of Load Probability (LOLP), set at 5%. The secondary criterion involves the Conditional Value at Risk (CVaR) in the 5% most unfavorable hydrological scenarios. This criterion has a specific threshold, equivalent to 5% of the peak load forecast, considering each month. These criteria represent a comprehensive approach to ensuring the reliability and adequacy of the power supply in the transitioning landscape of the Brazilian power system.
This article presents an analytical method to assess the maximum available power of hydroelectric plants in critical scenarios. The methodology quantifies the two primary factors that may prevent a unit from meeting its nameplate capacity: firstly, the reduction in capacity due to reservoir depletion, and secondly, the unavailability of water to achieve maximum instantaneous power while adhering to the minimum water outflow during off-peak periods. By identifying the most significant power losses and their specific locations, the research provides a generalized analysis of the power availability across all regions of Brazil.
2. Materials and Methods
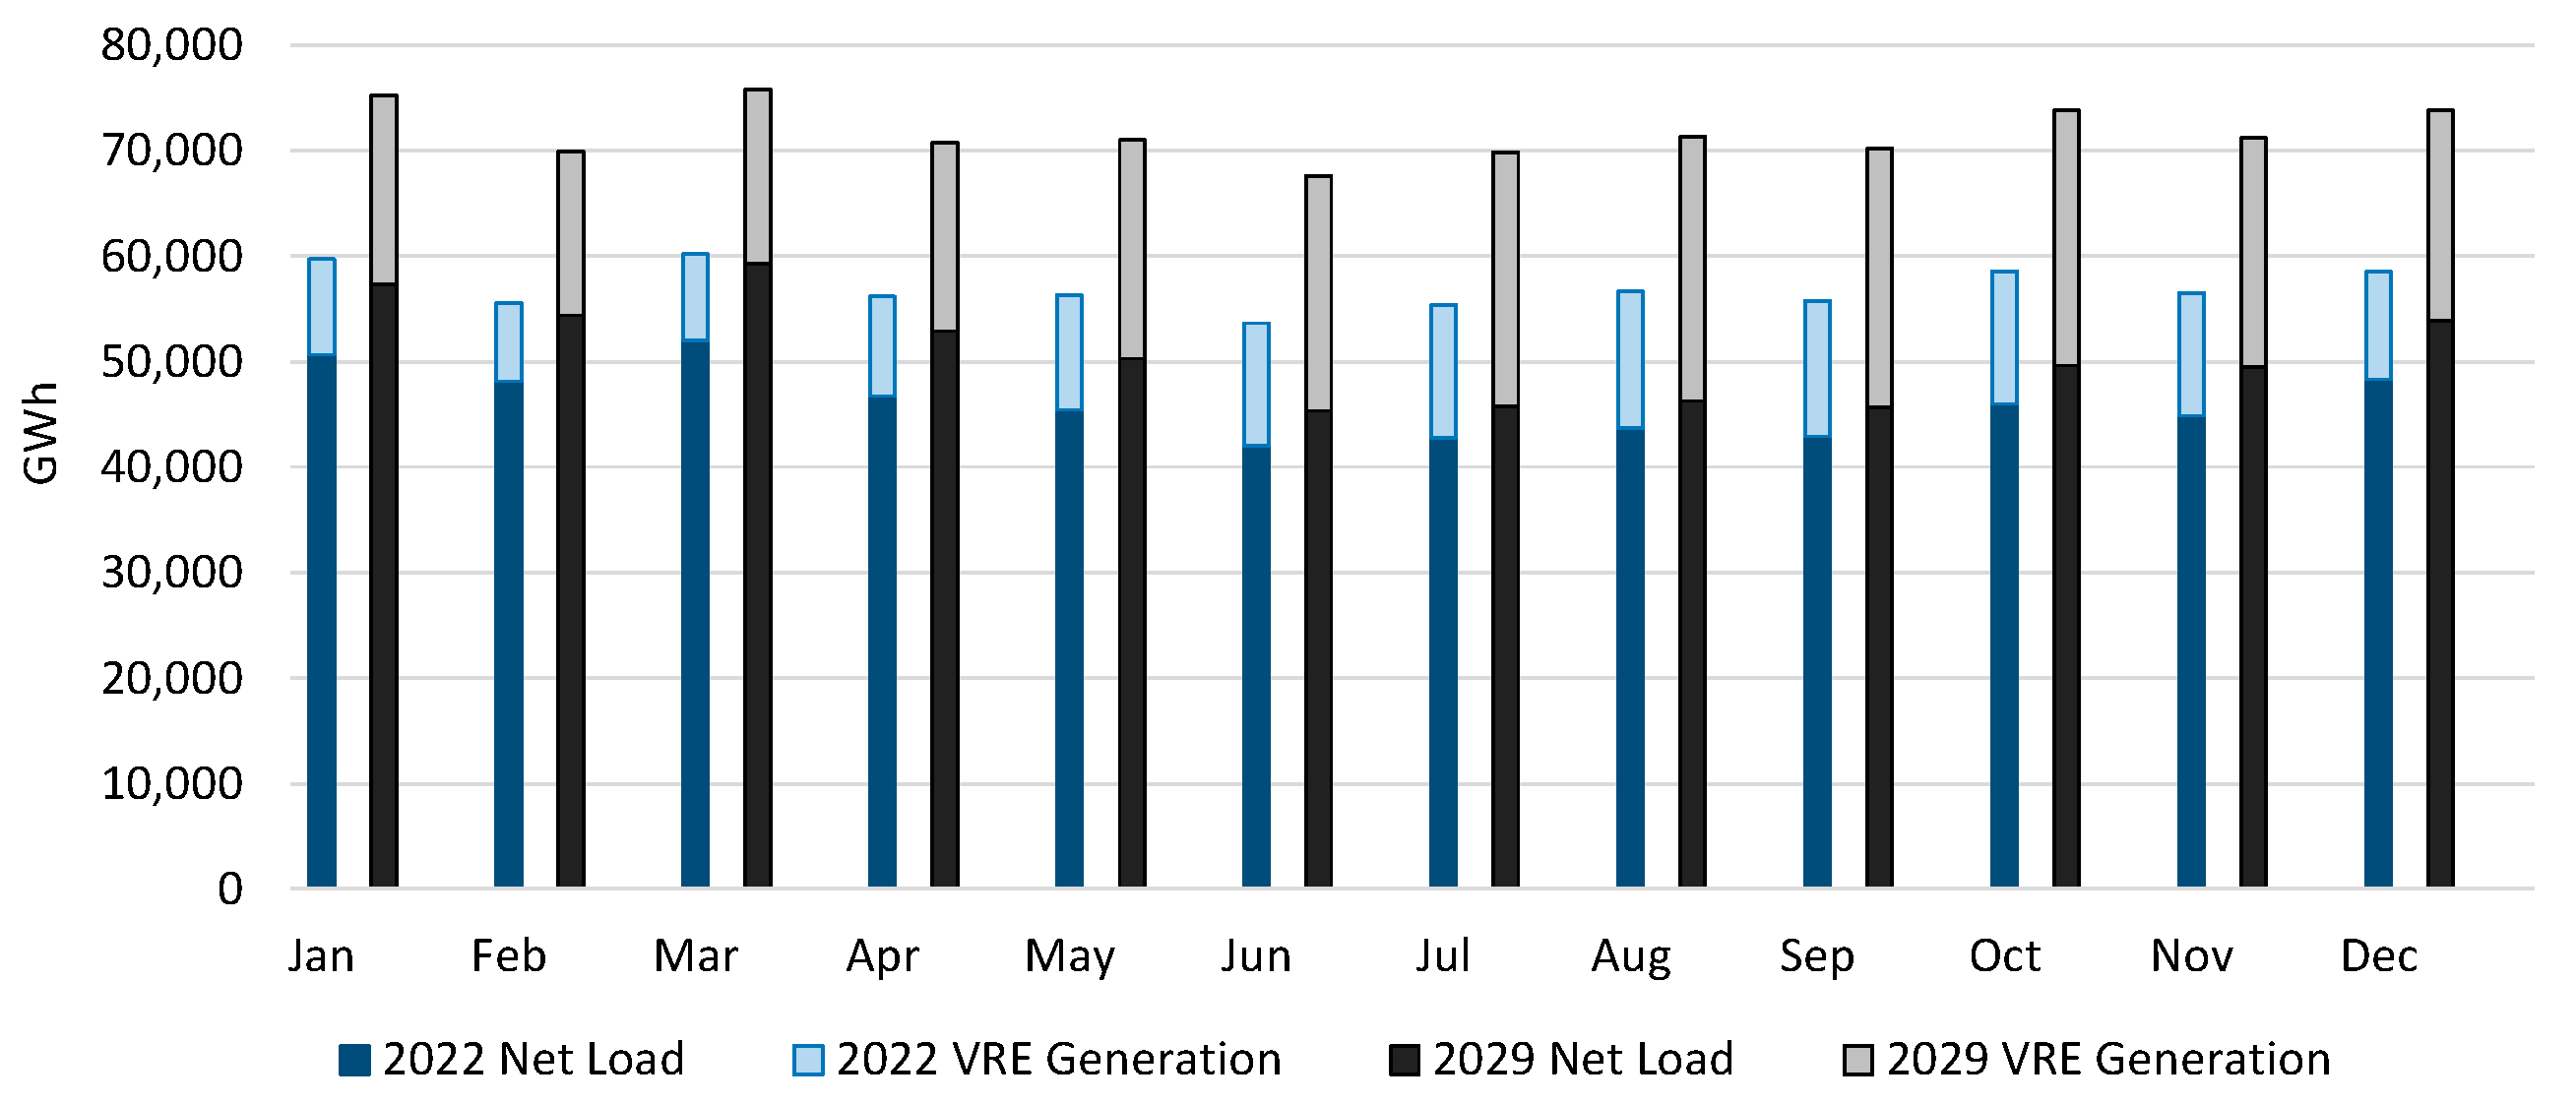
This analysis encompasses the government’s electricity expansion plan until 2029 [30], defined by a mixed-integer programming optimization model [31]. The objective function is to reduce the expected value of the total investment and operation expansion cost, considering all available generation projects in the Brazilian power system. The resulting matrix in this case depicts a substantial expansion of variable renewables, practically doubling VRE generation from 2022 to 2029, as observed in Figure 2. Moreover, the significant energy that is supplied by renewables that is indicated in this case can lower the monthly net load (defined as load after deducting VRE generation). This condition is particularly noticeable when wind generation performs optimally, mainly during Brazil’s dry season (between May and November). In times of scarce water, causing electricity prices to spike, wind generation alleviates pressure on hydro generation, thereby favoring hydroelectric storage [32].
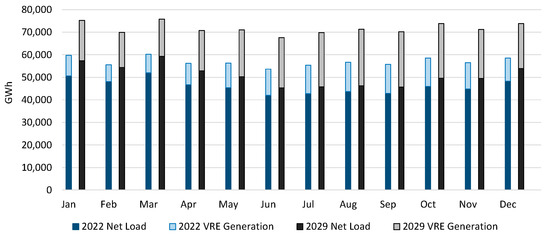
Figure 2.
Net load [30].
For instance, this study examines the operational impact of renewable expansion on hydropower plants, focusing on reservoir levels and monthly hydro generation.
The integration of a substantial share of variable renewable energy (VRE) sources, such as wind and solar photovoltaic (PV), can potentially affect power supply reliability if not properly addressed [33]. So, determining the limits to the penetration of these sources is a complex challenge [34], particularly when installing a large amount of wind capacity may result in significant wind spills [32]. One solution to ensure a sustainable and secure penetration of VRE sources is the integration of energy storage devices, such as hydropower storage [35], leveraging their flexibility.
In Brazilian energy planning, there is a dual concern: evaluating both energy supply risk and capacity supply risk. This evaluation aligns with a law that establishes metrics and parameters to guarantee supply adequacy [29]. Given the hydro-dominated nature of the Brazilian system, assessing the available power of hydro plants is crucial to meet peak demand and ensure capacity adequacy.
Therefore, this work considers hydroelectric plants’ available power to meet peak demand. This assessment is conducted using a power balance tool [36,37] after simulating 2000 hydrological scenarios with the NEWAVE model [38]. Based on these data, the methodology relies on the metrics used for assessing compliance with supply criteria to evaluate the most critical scenarios of hydroelectric power availability. The aim is to quantify the reasons for the most impactful losses in meeting supply criteria.
The NEWAVE model is officially employed by institutions within the Brazilian Electrical Sector (BES). It serves not only for operational planning but also for expansion planning (for decision making and ensuring supply adequacy) and determining energy spot prices. In summary, the model calculates the optimal operation policy for hydrothermal systems, minimizing the expected operational cost during the planning period. This aims to achieve a balanced system operation by deciding between using water and depleting reservoirs, with the decision variable being the volume of water that is stored at the operational period’s end [23,39,40]. As hydroelectric plants predominate in the Brazilian generating facilities, hydrological stochasticity is pivotal for optimizing the total operational cost. Future costs are influenced by the randomness of future inflows, while immediate costs depend on current dispatches of thermal and hydroelectric plants [39]. However, for a monthly scenario, wind and solar PV production are currently deterministically included in the NEWAVE model by calculating the net load (demand minus wind and solar PV production). With the increasing share of variable renewable generation, ongoing improvements are being made to the current methodologies used in the NEWAVE model to estimate their generation amounts.
This methodology is carried out in two sequential steps: The first evaluates the maximum power that can be dispatched for each reservoir level. In this step, there is a deduction of the loss of reservoir depletion from the plant’s nameplate capacity, since there is a reduction in hydropower generation when reaching lower storage levels. The second considers the modulation capacity of the monthly generation to meet the power demand for a period “t”, with respect to the minimum water flow constraints at the off-peak period. More specifically, it evaluates these constraints’ negative impact on hydropower ramping ability, principally when facing drought scenarios.
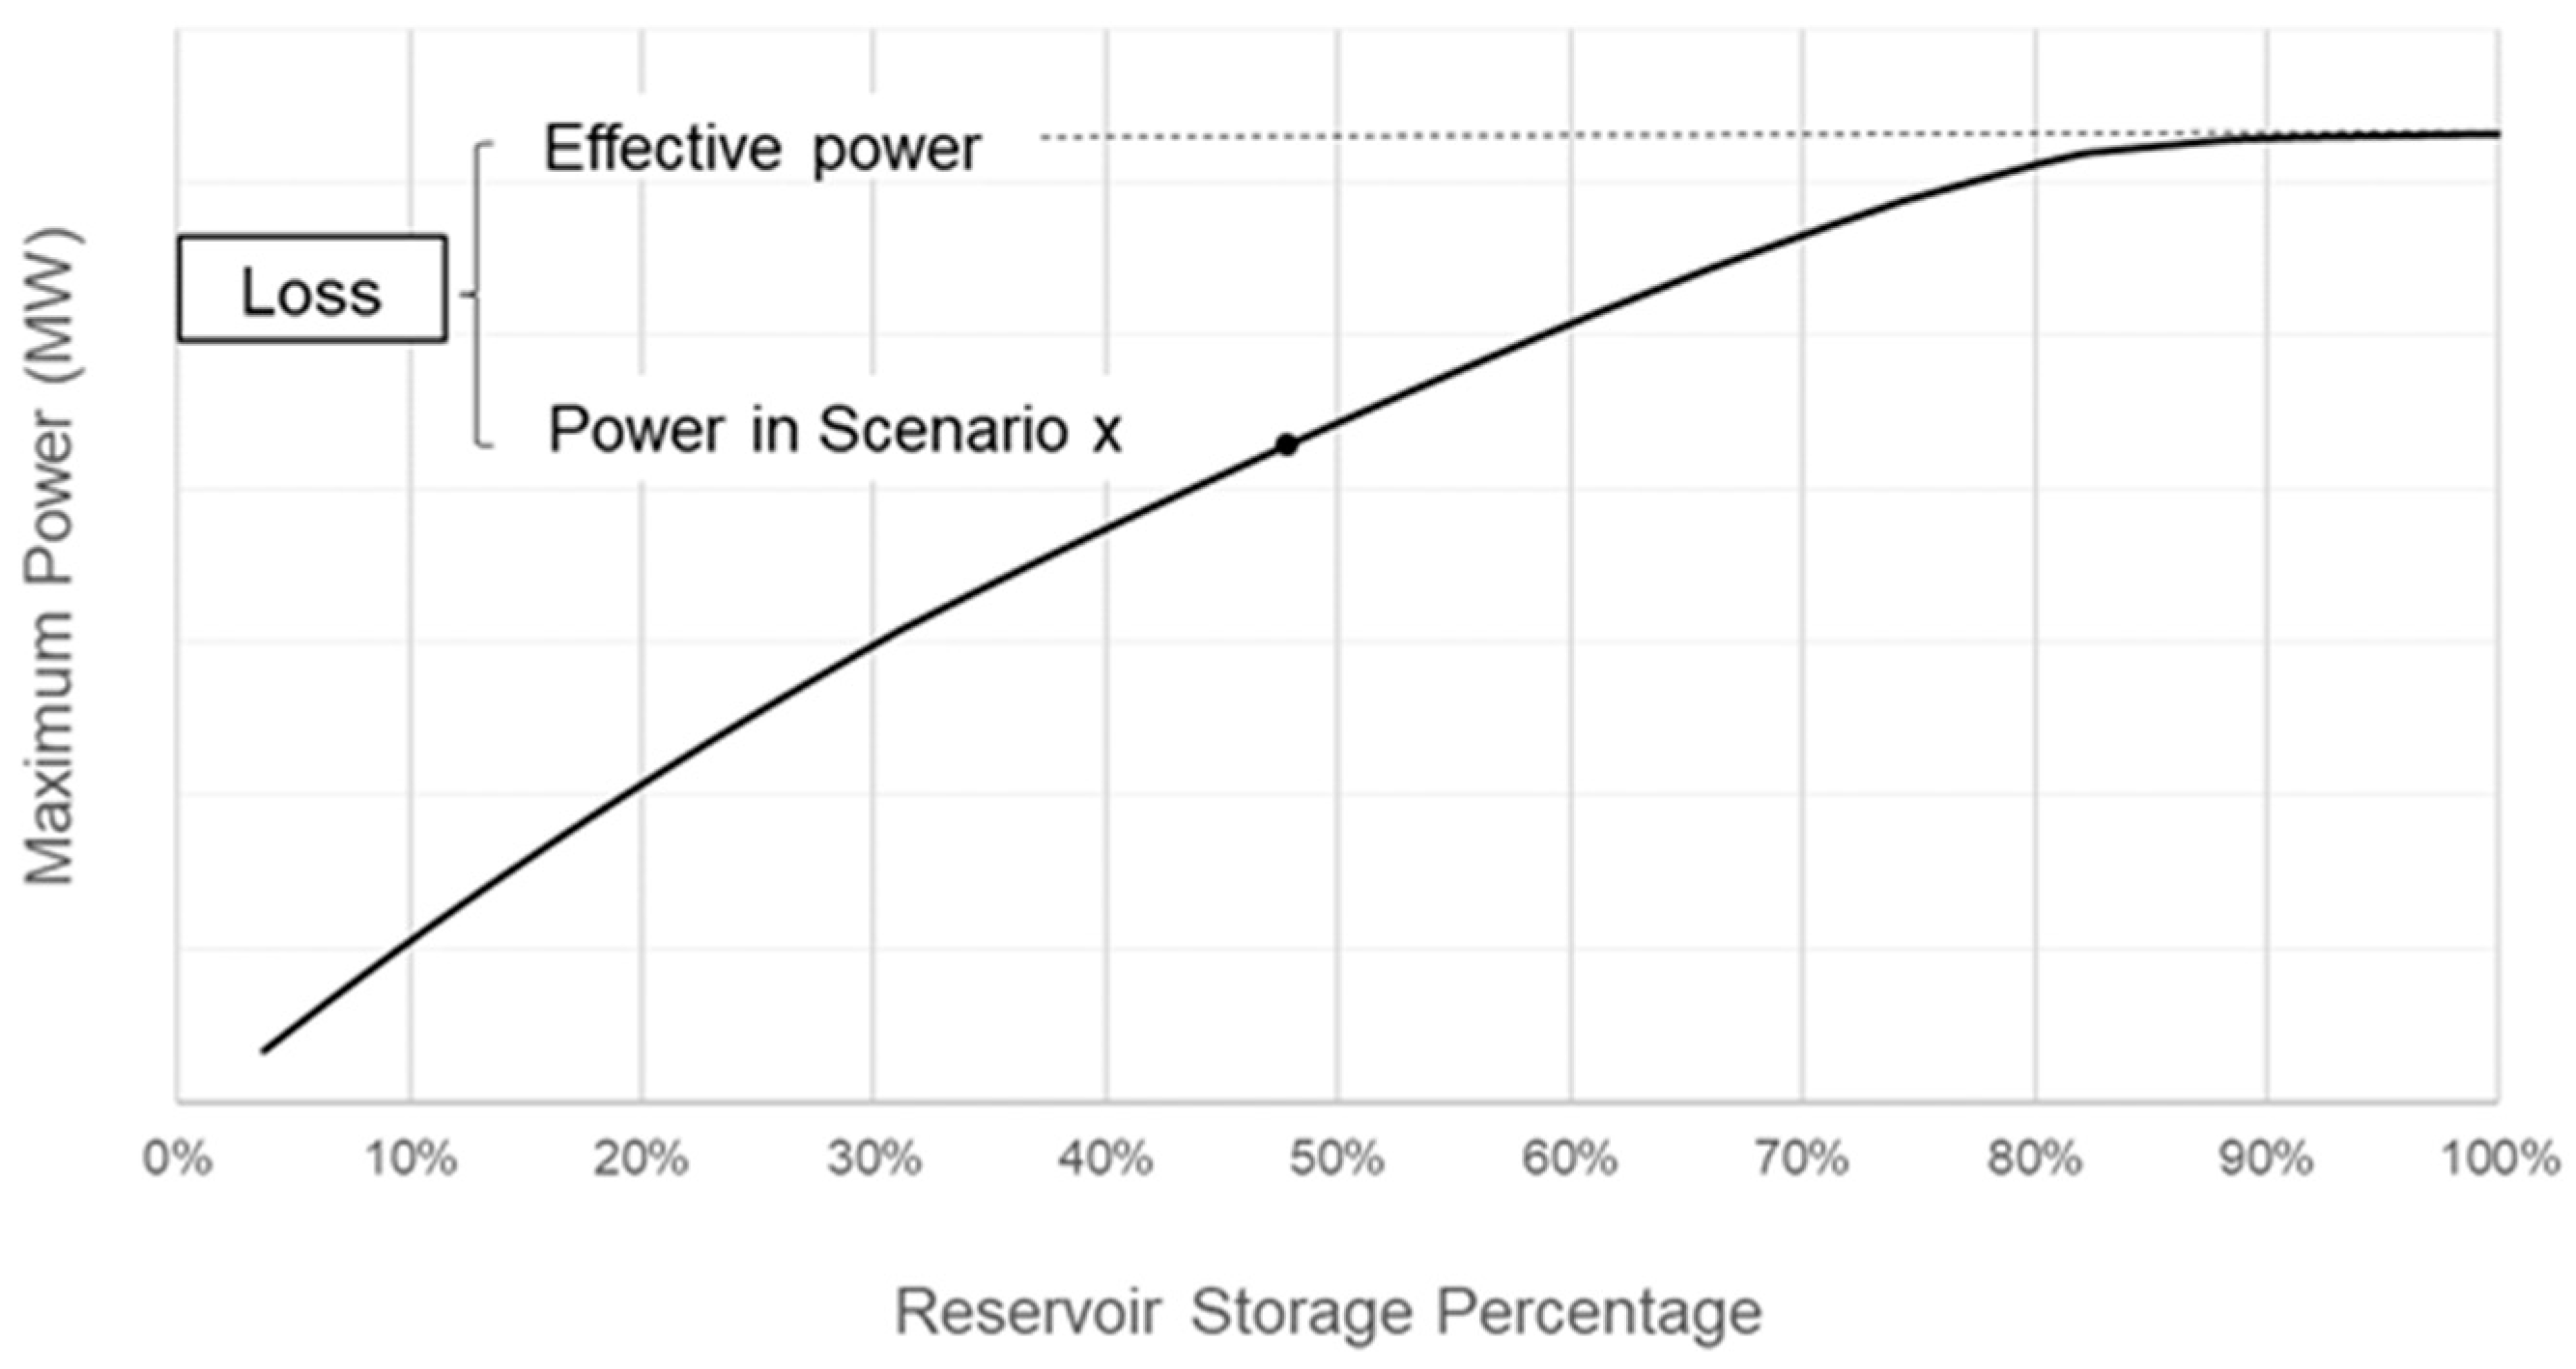
The primary objective is to quantify the losses associated with each stage and identify the reservoirs where the greatest losses occur. This assessment aims to determine if it is possible to maximize capacity availability. The first step calculates the loss due to reservoir depletion, representing the difference between effective power and available power associated with the reservoir level (Figure 3). This process is repeated for all simulated scenarios throughout the study horizon.
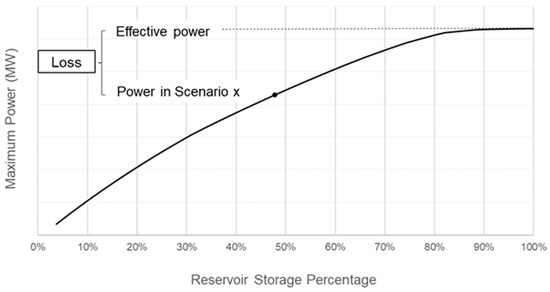
Figure 3.
Maximum power by reservoir storage percentage.
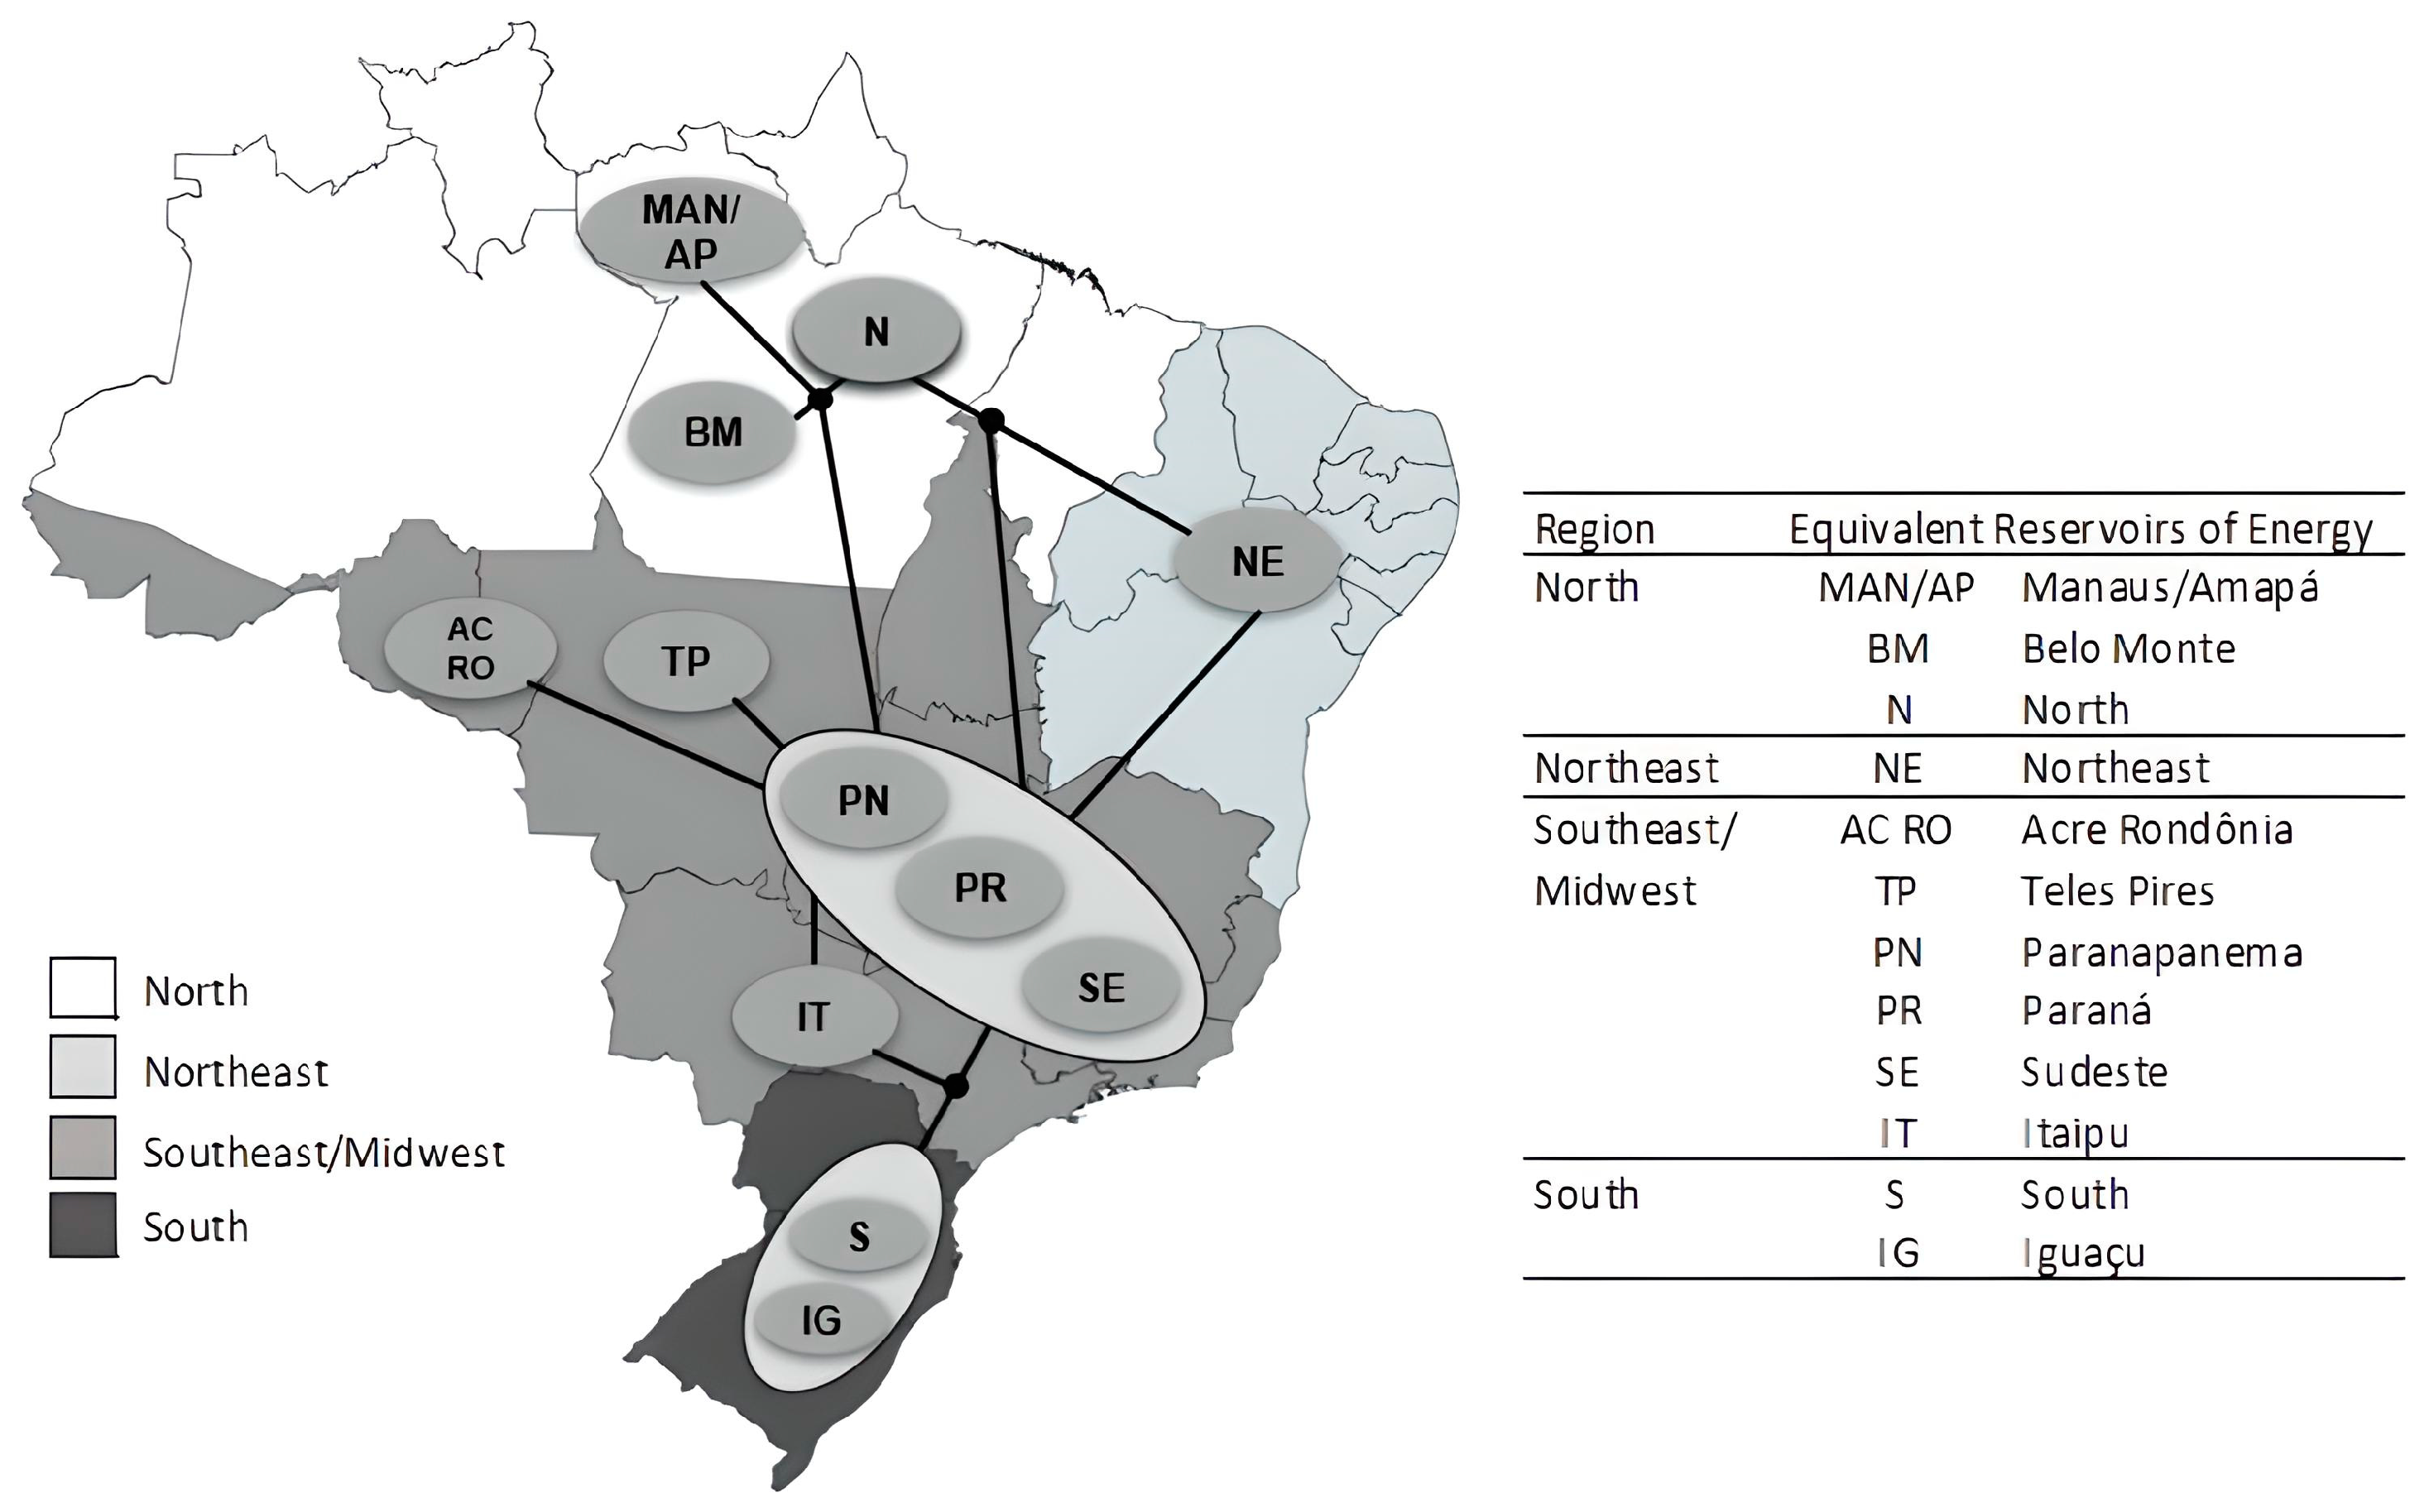
Given the complexity of operation optimization and the abundance of reservoirs in the Brazilian system, the NEWAVE model simplifies the problem by aggregating hydro plants in the same or similar river basins into equivalent energy reservoirs, as depicted in Figure 4.
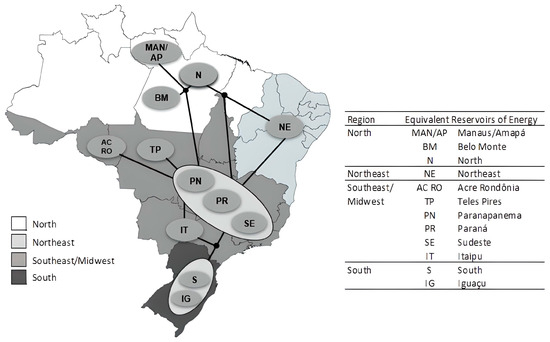
Figure 4.
Equivalent energy reservoirs [30].
The assumption is that the reservoir storage percentage for each hydropower plant “p” during a specific period (month) aligns with the simulation-derived percentage for the equivalent energy reservoir “r” that it represents in the model.
With the known reservoir storage percentage, the elevation of each reservoir is determined using a polynomial elevation–storage curve. The net water head is then calculated as the difference between the reservoir elevation and the average level of the discharge channel, accounting for hydraulic head losses.
Equations (1) and (2) illustrate the maximum power and effective power, where the turbines’ coefficients arise from their design characteristics, particularly in relation to the head height of the power plant.
where
- —installed capacity of power plant “p”;
- —Forced Outage Rate of power plant “p”;
- —Scheduled Outage Factor of power plant “p”.
The second step involves maximizing the power that is available during peak time “t” while adhering to the minimum generation requirements related to flow restrictions () to be maintained outside peak time “”. This step, termed power modulation of the monthly hydro generation (), limits the maximum available power to the previously calculated maximum power (). Formula (3) outlines the process of determining the maximum available power () during the “t” peak time ().
The previously discussed steps lay the foundation for the methodology to be introduced in this study. This approach incorporates pre-calculated maximum power, effective power, and maximum available power for each simulated scenario across all hydropower plants. The subsequent steps outline the methodology, which links one of the supply criteria assessment metrics (CVaR 5%) with losses tied to the available power of hydropower plants for peak demand fulfillment. The objective is to quantify the factors contributing to losses due to reduced hydropower availability and pinpoint the plants/regions experiencing the most significant losses.
Specifically, in this analytical methodology, the initial calculated loss (Loss 1) represents the difference between effective power and maximum power associated with the reservoir level. Subsequently, the loss attributed to reduced hydraulic availability (Loss 2) is determined by the gap between the maximum power calculated in step 1 (based on the reservoir levels) and the maximum available power resulting from the modulation of monthly generation.
The process is illustrated in Figure 5, which depicts an example of hourly fluctuations in hydropower generation throughout a month (Figure 5a). The same hourly generation is depicted in the dashed curve (Figure 5b), presented in a descending order. In the context of a drier scenario, depicted by the area in monthly generation (), all water resources utilized in the month can be shifted to the peak time (), ensuring sufficient water resources to meet at least the minimum generation during off-peak time ().

Figure 5.
Maximum available power in peak time by hydro monthly modulation. (a) Hourly fluctuations in hydropower generation throughout a month; (b) Hourly generation presented in a descending order.
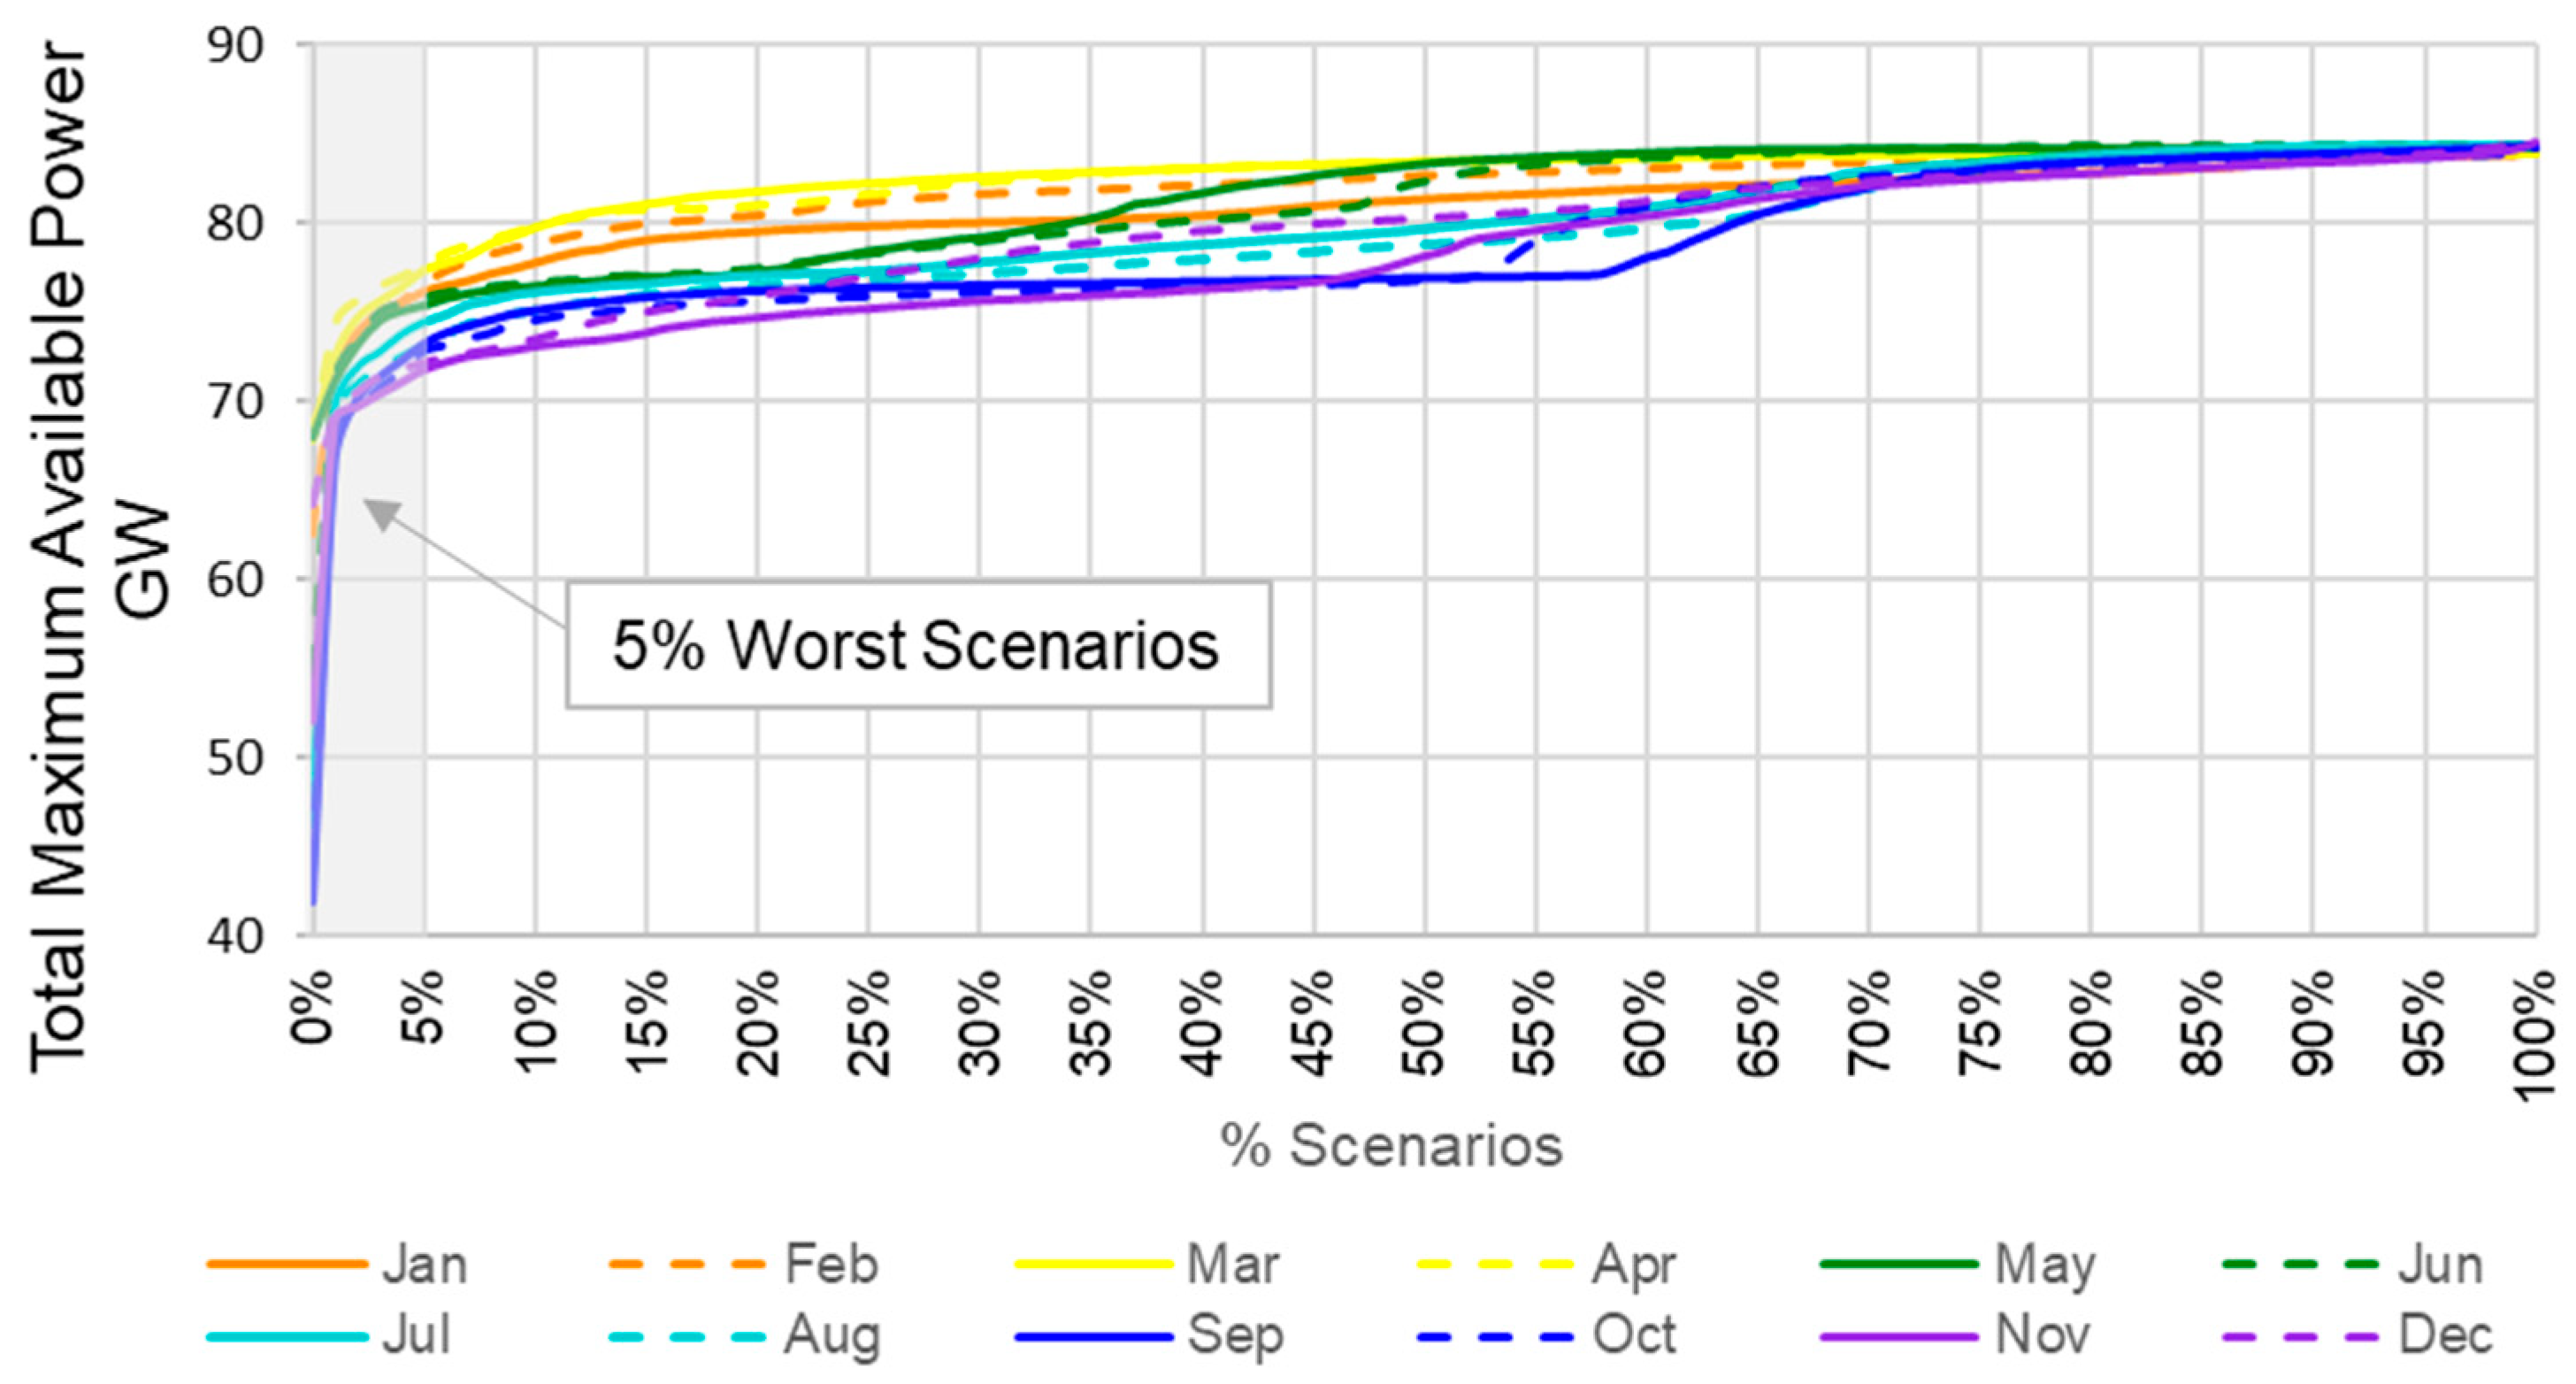
After completing the two-step calculation, the maximum available power (PmaxAv) for all plants “p” is aggregated to determine the overall system capacity for each month across the 2000 simulated hydrological scenarios. Using these values, we calculate the Conditional Value at Risk (CVaR) for the 5% worst scenarios of each month, providing a measure of power availability losses in these challenging situations, as illustrated in Figure 6.
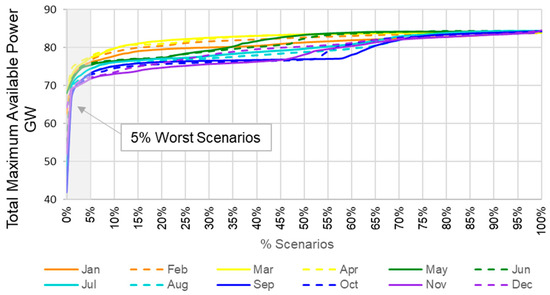
Figure 6.
Total maximum available power.
The subsequent analysis focuses on each region or basin, thoroughly examining their respective losses due to depletion and evaluating in detail the possible operational causes associated with the obtained results.
3. Results and Discussion
In the dry period, wind and hydropower exhibit seasonal complementarity, favoring reservoir storage and preventing level reduction. This ensures a balanced operation between storage and generation, which is crucial for maximizing the power availability in hydro plants, contributing to a reliable energy and capacity supply. Therefore, the analysis of the reservoir storage percentage evolution becomes vital.
Despite the complementary nature of wind and hydroelectric plants in terms of energy supply, the rising share of renewables raises concerns regarding the system’s capacity and flexibility to meet future requirements. In this context, the role of hydro storage becomes fundamental when integrating variable renewables, gaining value as the system faces capacity constraints.
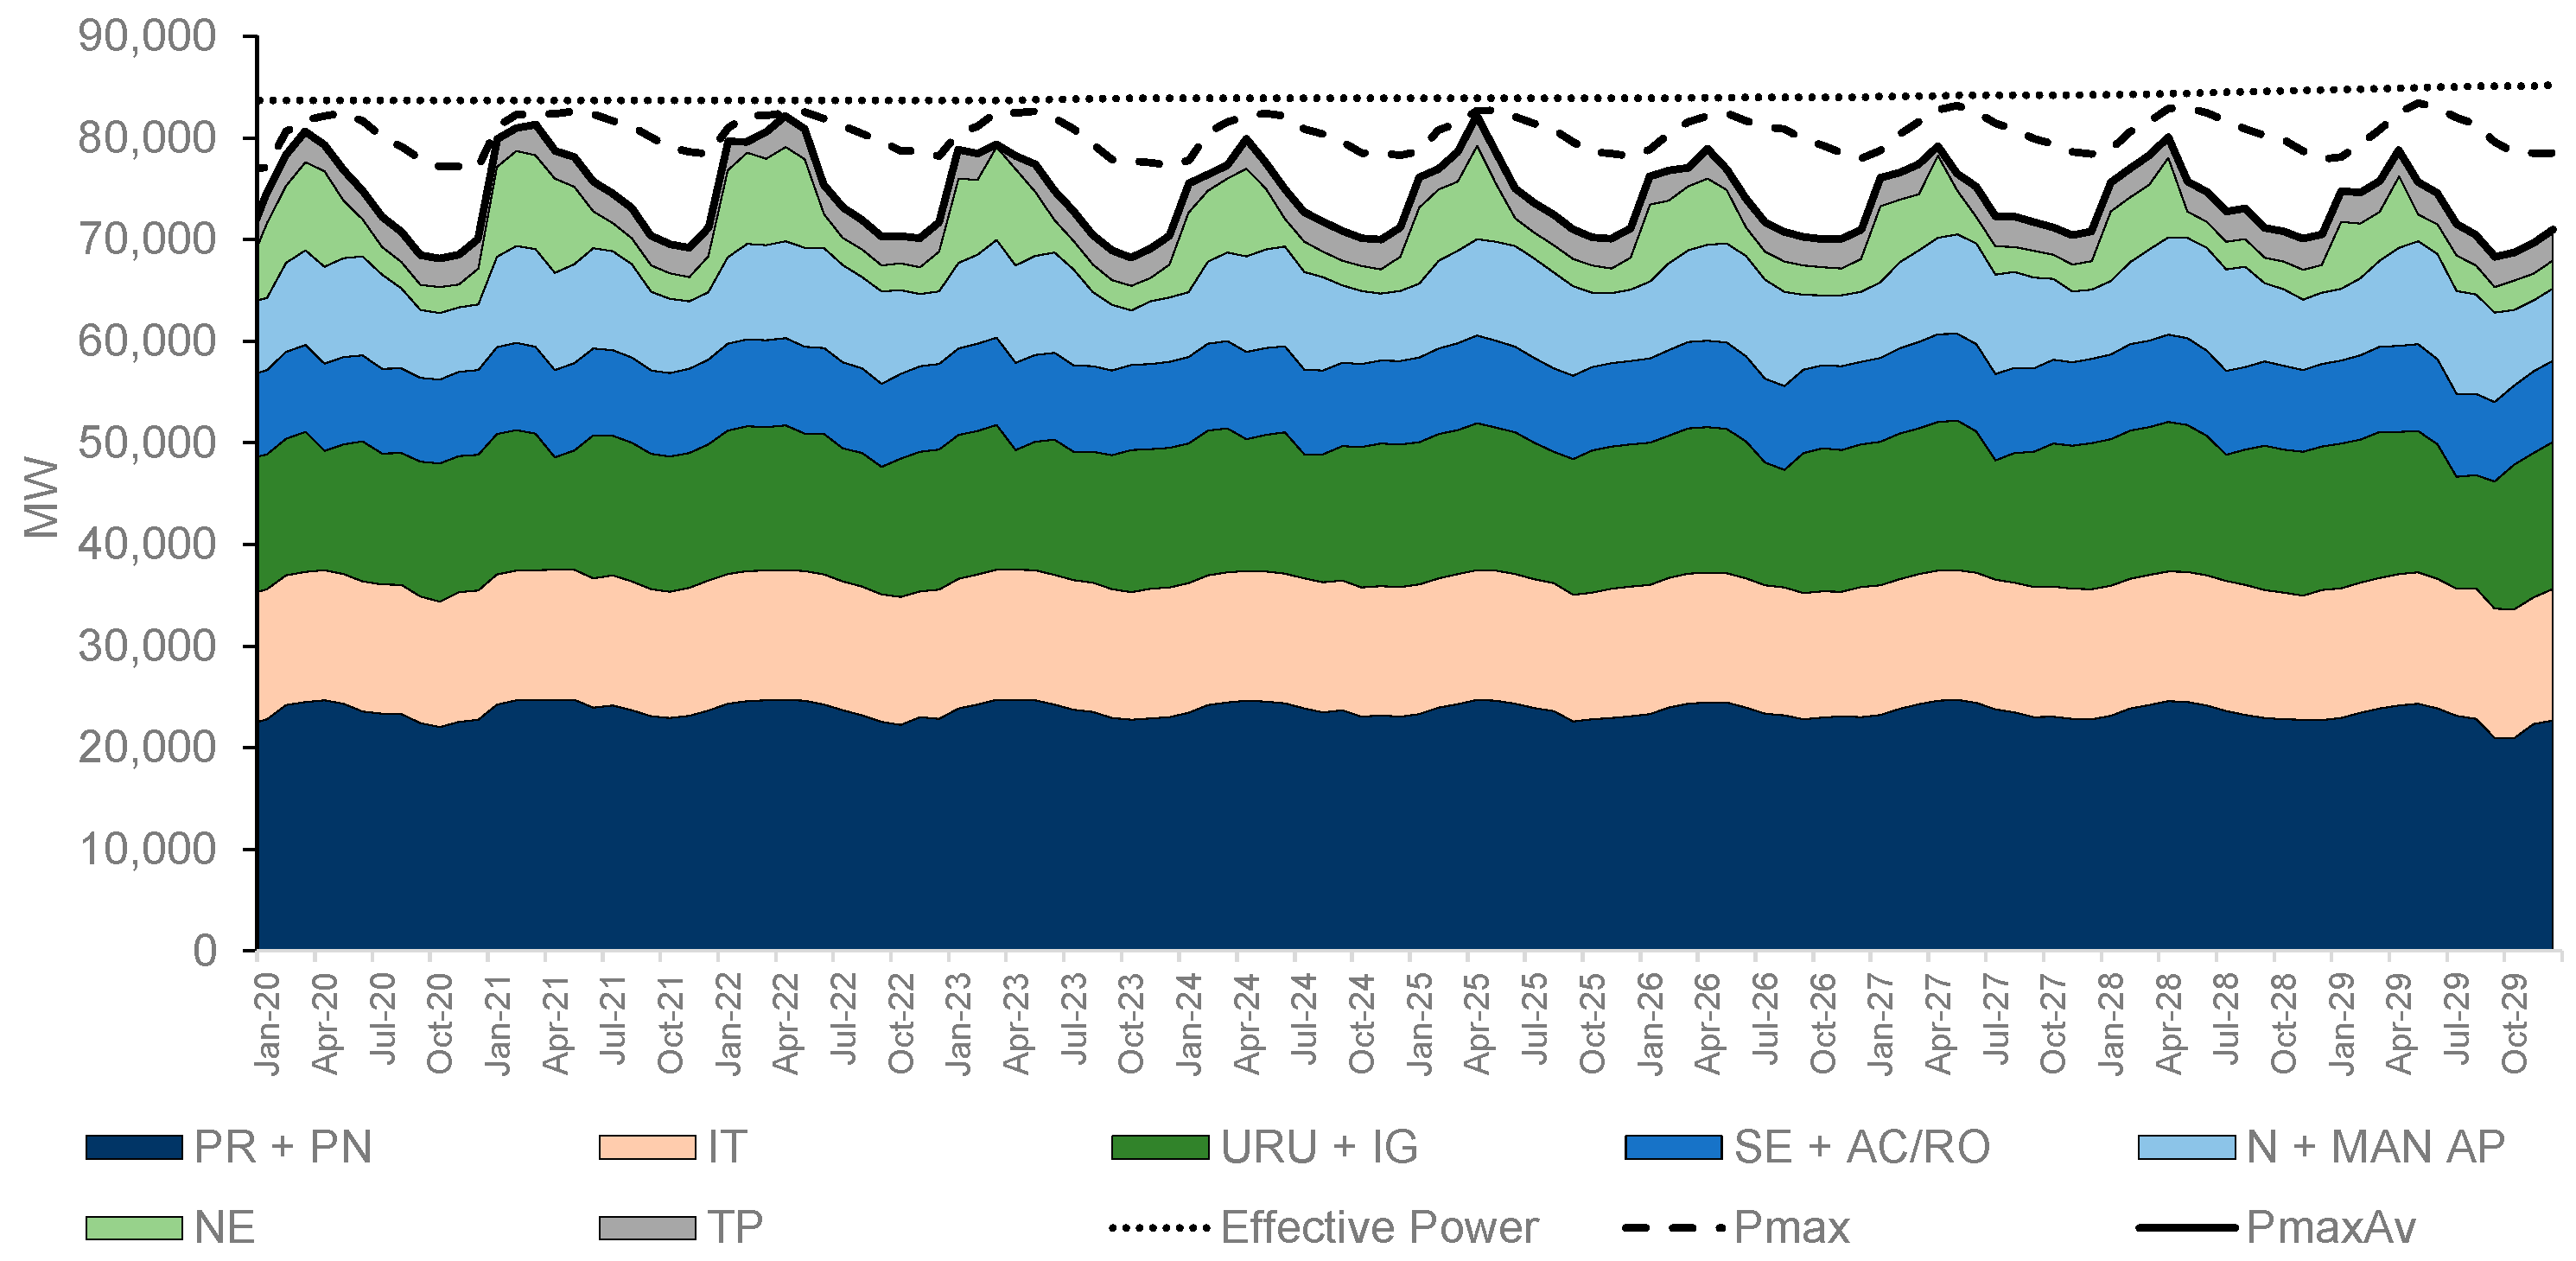
The proposed methodology aims to assess the potential maximization of hydroelectric plants’ available power to meet capacity requirements and identify key reasons for significant power losses. Figure 7 displays the Hydro Maximum Available Power (PmaxAv) for the 5% worst hydraulic scenarios (CVaR5%) across all Brazilian regions. Regions such as PR + PN (Paraná + Paranapanema), Itaipu, SE + AC/RO (Sudeste + Acre Rondônia), and Teles Pires, previously presented in Figure 4, represent equivalent energy reservoirs in the optimization model for the Southeast/Midwest region.
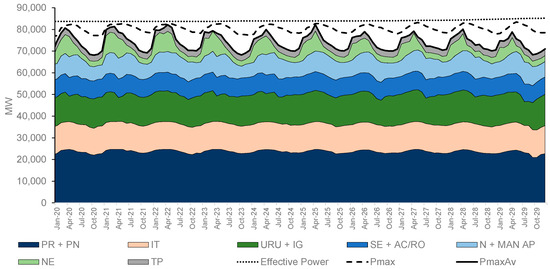
Figure 7.
Available hydro power by regions for the worst 5% scenarios (CVaR5%).
The analysis reveals substantial power losses, particularly during the dry season, compared to the effective power of the plants. The figure illustrating the maximum power (Pmax) of the system facilitates the separate identification of the two aforementioned loss categories.
Examining the figure from top to bottom illustrates that the disparity between the effective power and Pmax signifies the loss attributed to reservoir depletion (Loss 1). Subsequently, the difference between Pmax and PmaxAv represents the insufficient water availability in the system to attain Pmax while adhering to the minimum water outflow during off-peak periods (Loss 2). Additionally, it allows for the identification of locations experiencing the most considerable losses, which will be further elucidated in subsequent figures.
Each region in Brazil contributes differently to the installed hydro capacity and storage. For example, the Paraná River basin houses the majority of the largest reservoirs, including the renowned Binational hydropower Itaipu, situated downstream in the Paraná River. Due to its size and significance for the Brazilian system, Itaipu is presented separately from upstream plants.
Despite the Northeast region having a smaller installed hydro capacity compared to the Paraná River basin, its reservoirs play a crucial role in energy production and flow regulation for multi-purpose uses in the São Francisco River. Operational constraints on these reservoirs were relaxed after severe droughts in 2013–2017 [41] and again in 2021 [26].
In the North region, Tucuruí hydropower holds significant storage potential. However, one of its powerhouses imposes a more restrictive minimum level for turbine operation. The second powerhouse’s total or partial operation depends on the reservoir level, resulting in only half of the plant’s generation units being available during lower water elevations [38].
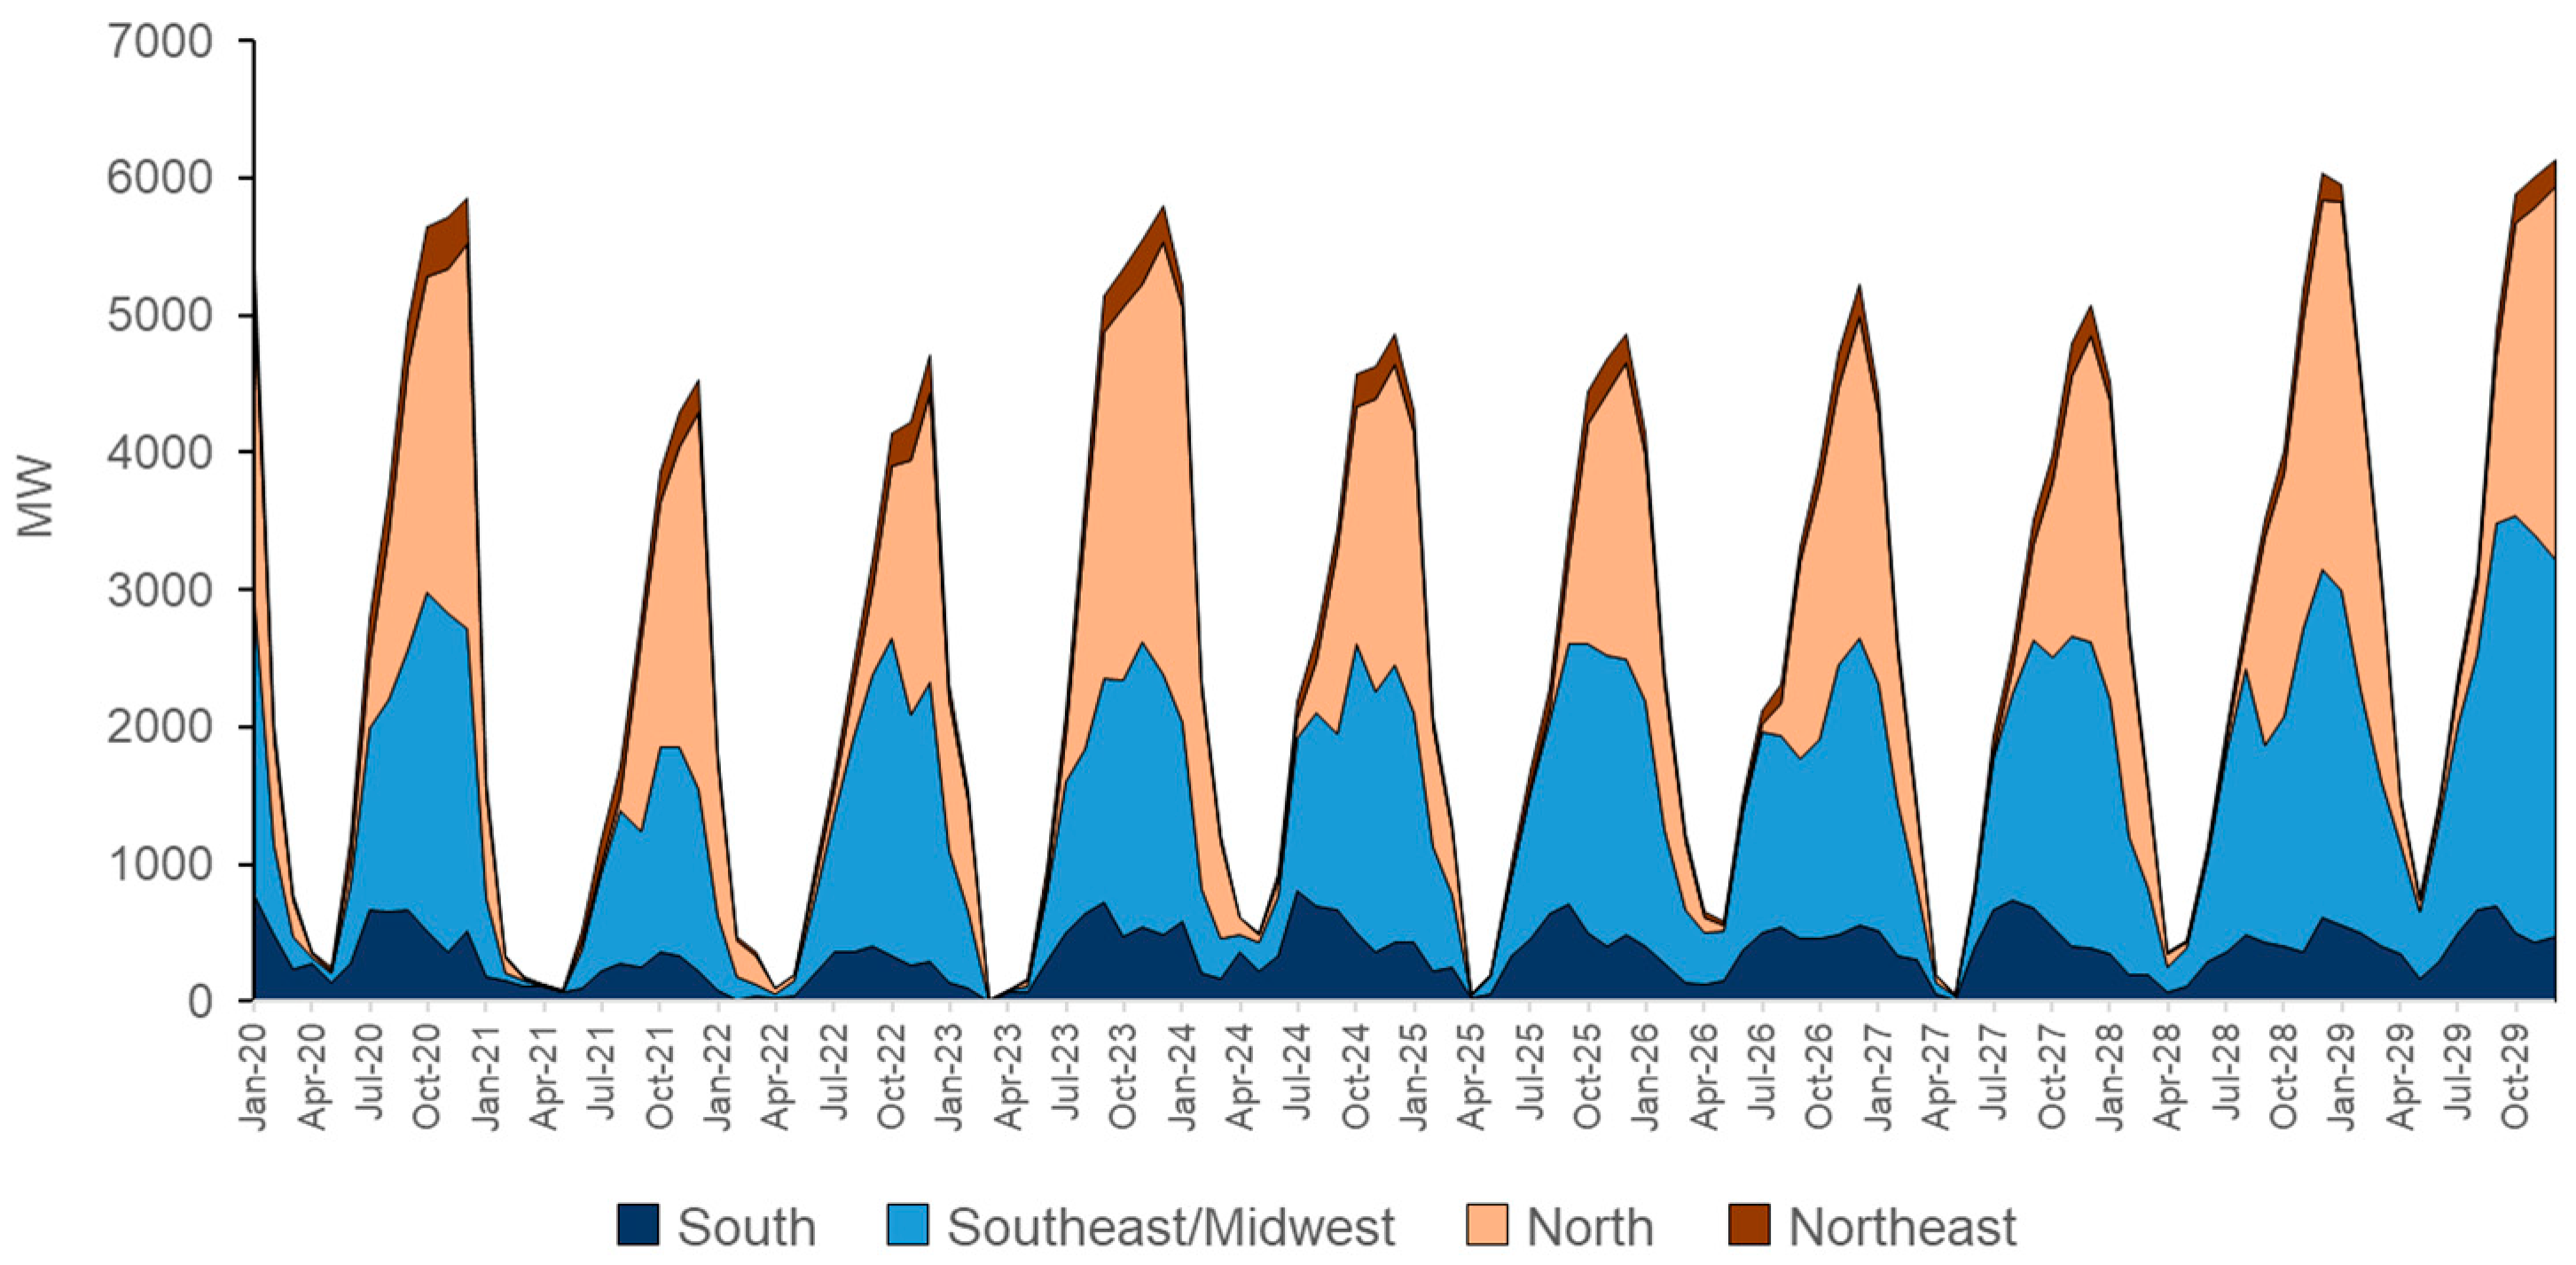
When applying the proposed methodology to evaluate losses in the 5% worst total hydropower availability scenarios due to reservoir depletion (Loss 1), the results indicate that the North and Paraná River basin reservoirs incur the most substantial losses (Figure 8). In the Paraná River basin, where the majority of Southeast/Midwest region’s reservoirs are situated, the substantial storage potential leads to an average capacity reduction of 2000 MW to the system at the end of the dry season. Similarly, in the North region, Tucuruí hydropower alone experiences an average power availability loss of 2000 MW during the same period. So, a substantial portion of these losses can be mitigated by avoiding the operational restrictions on the second powerhouse of the Tucuruí power plant (located in the North region) and maintaining reservoirs in the Paraná basin at higher levels during the dry season.
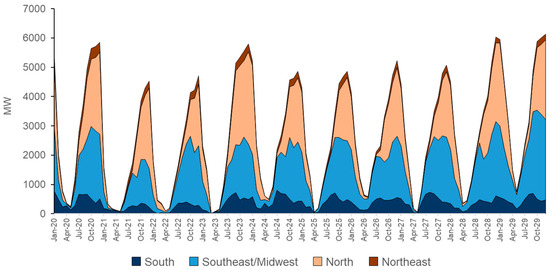
Figure 8.
Losses by depletion of the reservoirs in 5% worst scenarios.
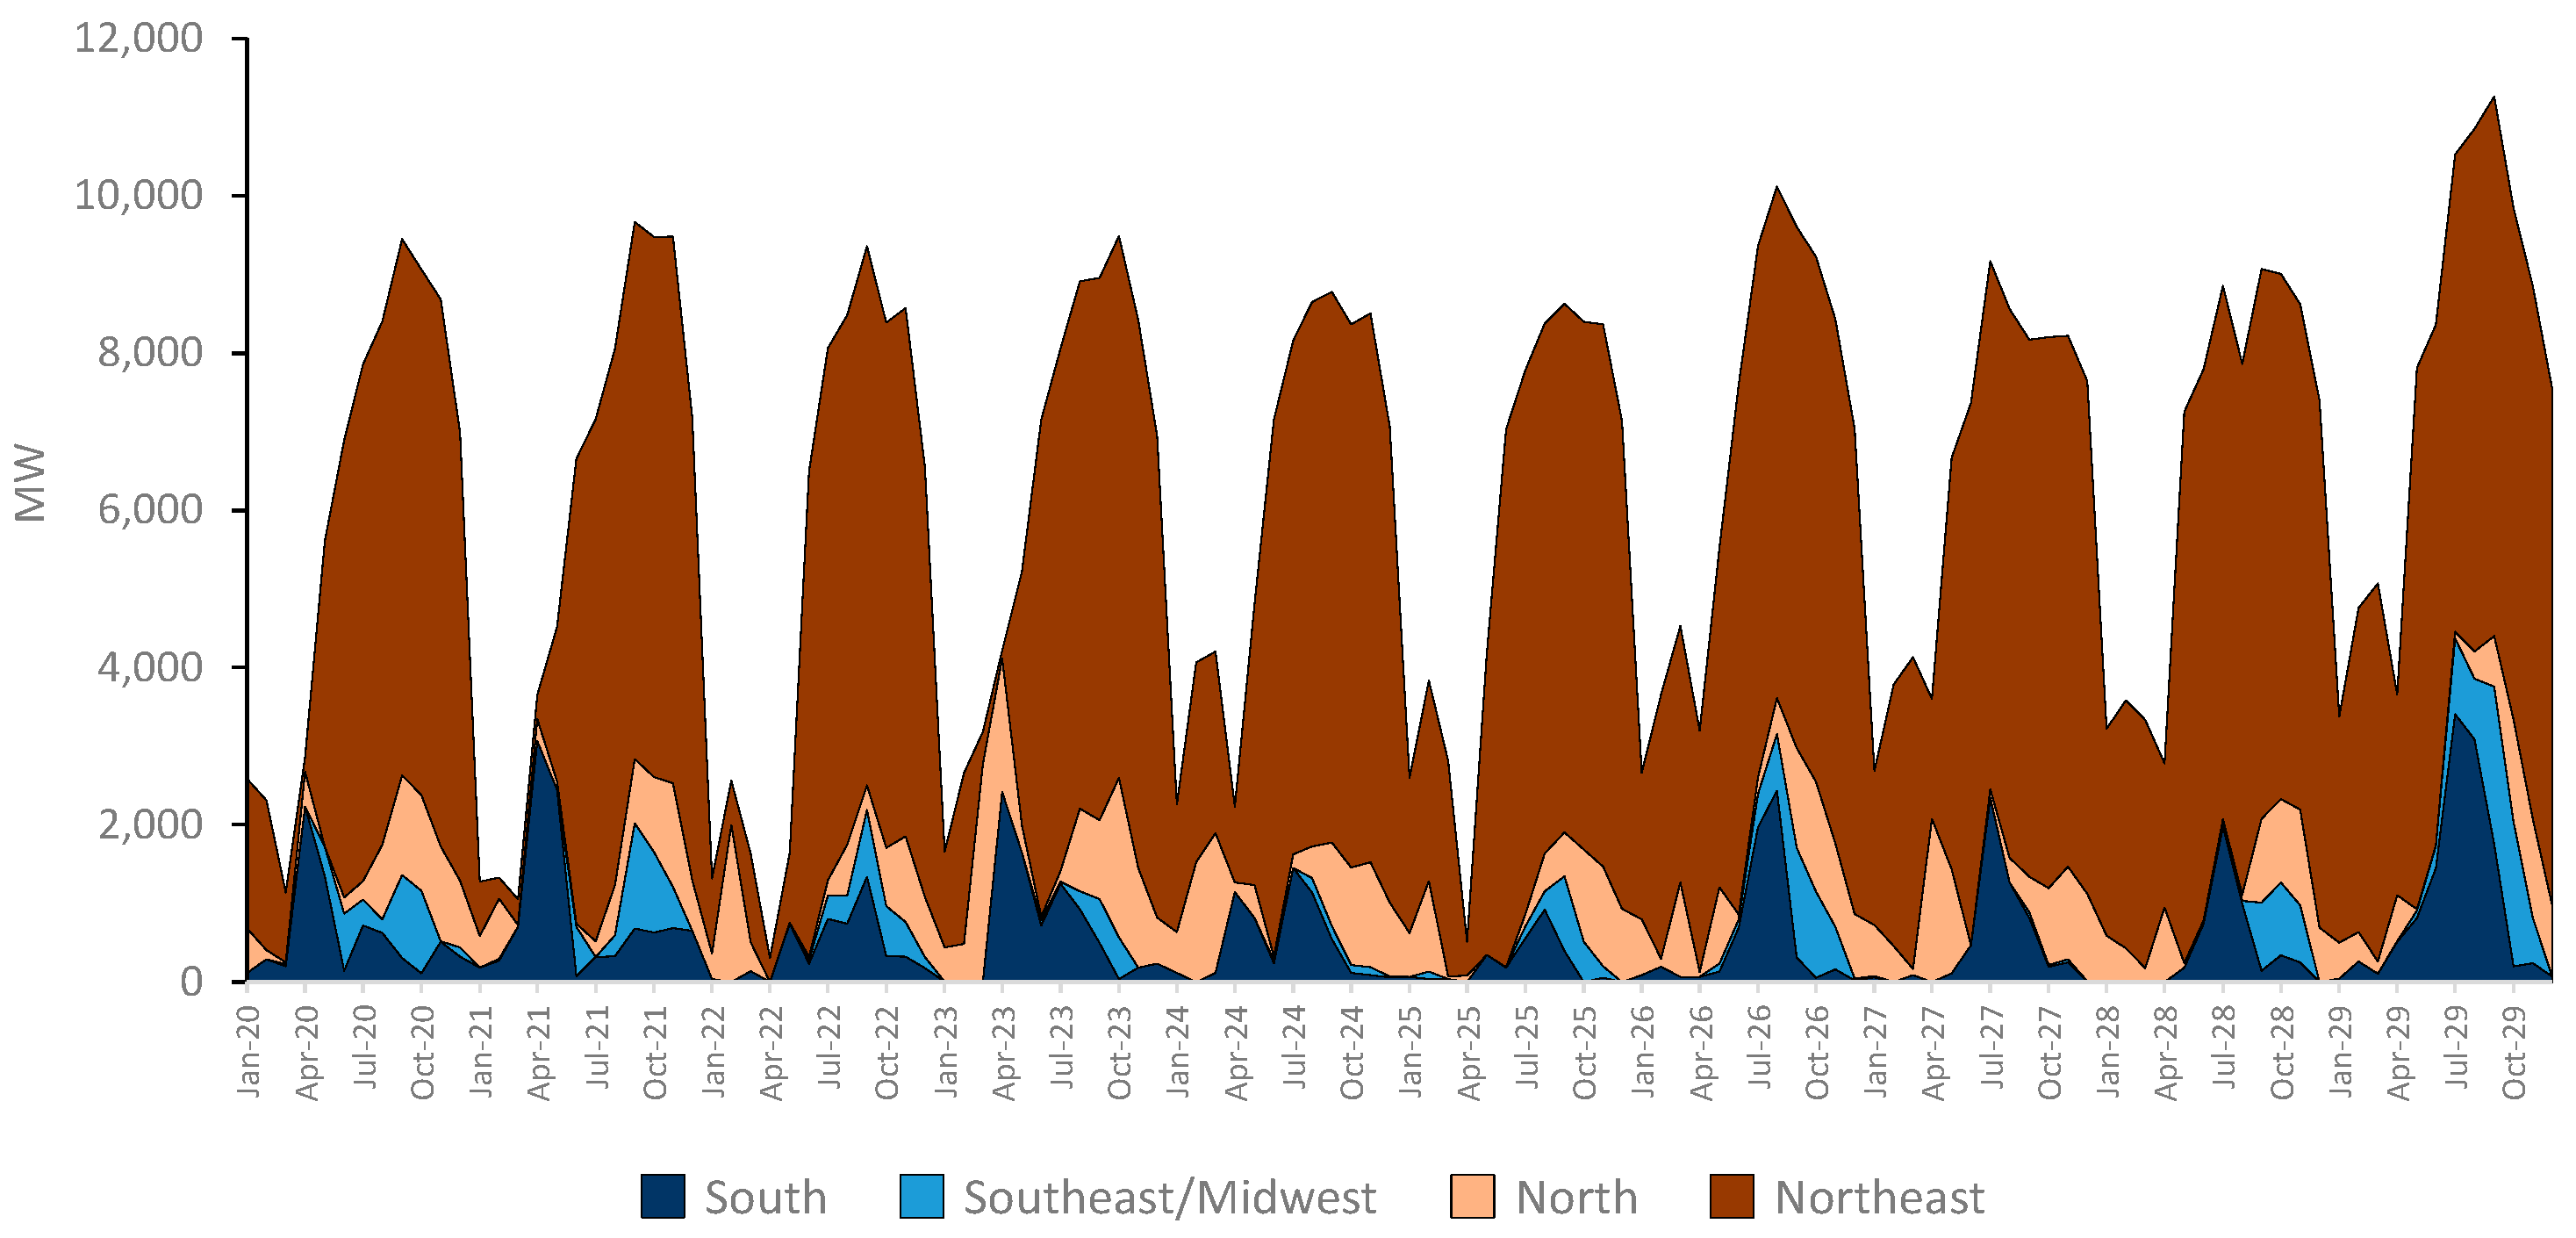
Concerning the hydraulic availability for modulation, the computed losses indicate that the Northeast region experiences the most substantial impact on power loss (Figure 9). This is primarily attributed to the necessity of adhering to minimal outflow constraints (Loss 2). Given that the reservoirs serve multiple purposes, these obligations restrict the capacity potential in this region, particularly during the dry season. In scenarios representing the 5% worst inflows, this results in a loss of nearly 7000 MW, exclusively within the Northeast region. These results highlight that relaxing these operational constraints can have a significant impact on reducing these losses in this region.
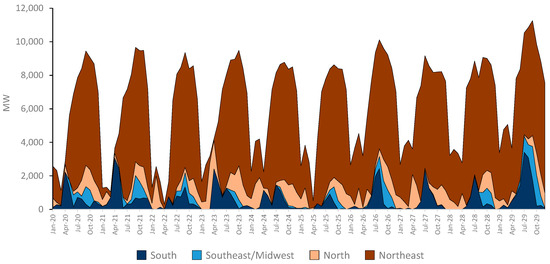
Figure 9.
Losses due to insufficient modulation capacity in the 5% worst scenarios.
In fact, the analyses mentioned above align with the measures to make the operational restrictions that are implemented in Brazil more flexible [26] during years of critical hydrological conditions. These measures are aimed at the necessity of reservoir level recovery. It is emphasized that, despite the benefits that operational restriction flexibilization may bring to the energy sector, solutions are needed to minimize the impacts on other water uses.
4. Conclusions
Renewables and hydropower resources complement each other in Brazil, allowing for optimized reservoir operation to meet the energy demand. This involves storing water during the dry season when wind generation is higher, thus allocating more hydro production to capacity and flexibility services. However, with the increasing share of renewables in Brazil’s total installed capacity, there will be a growing demand for capacity.
To enhance the grid capacity, hydroelectric plants can contribute through operational adjustments, such as maintaining reservoirs at higher levels. However, these changes must be coordinated to prevent environmental issues. This study conducts a regional analysis to identify impactful changes in Brazil’s hydropower operation. Examples include analyzing the potential for relaxing the minimum outflow constraints in northeastern reservoirs, taking into account their diverse uses, such as electrical energy production, water supply, and irrigation, avoiding the loss of the second powerhouse of the Tucuruí power plant (located in the North region), and optimizing reservoir levels in the Paraná basin to meet capacity during the dry season.
Energy planning in Brazil already accounts for these losses. By adjusting the operation of large reservoir hydropower plants to reduce losses and increase capacity, the system can accommodate higher shares of variable renewable generation, promoting a transition to a more sustainable energy matrix. Energy markets that are structured under an energy-only model may consider implementing mechanisms to ensure adequate compensation for reservoir-level maintenance services, thereby promoting the sustainable operation of large reservoir hydropower plants. Addressing the operational issues that were identified in this study may necessitate changes in policies, regulations, and market design to assign additional value to the specific services that reservoirs can offer. This becomes particularly relevant as the Brazilian power system encounters capacity constraints.
The results from the Brazilian case demonstrate the feasibility of increasing the penetration of variable renewable generation by optimizing the operation of existing hydropower plants. It may be essential to engage in discussions with society and the government to reconcile the multiple uses of water, considering hydropower’s potential to provide clean capacity in a future focused on decarbonizing the power sector.
In recognizing the evolving landscape of technologies and solutions that are aimed at enhancing capacity in the context of increased renewable integration, such as reversible hydropower plants, it is essential to acknowledge a limitation in the scope of this study. The analysis presented in this work predominantly focuses on conventional hydropower plants, given their significant contribution to the Brazilian generation mix.
Author Contributions
Conceptualization, E.E.R. and S.Q.B.; methodology, S.Q.B.; software, S.Q.B.; validation, S.Q.B. and R.V.P.; formal analysis, S.Q.B. and R.V.P.; investigation, S.Q.B.; resources, E.E.R.; data curation, S.Q.B.; writing—original draft preparation, S.Q.B.; writing—review and editing, S.Q.B., R.V.P. and R.N.F.d.C.; visualization, S.Q.B.; supervision, E.E.R.; project administration, S.Q.B. All authors have read and agreed to the published version of the manuscript.
Funding
This research received no external funding.
Data Availability Statement
The data supporting the reported results can be found in the References. Additionally, they are available upon request from the corresponding authors.
Conflicts of Interest
The authors declare that the research was conducted in the absence of any commercial or financial relationships that could be construed as a potential conflict of interest.
References
- Ministério de Minas e Energia (MME); Empresa de Pesquisa Energética (EPE). Plano Decenal de Energia 2031. Available online: https://www.epe.gov.br/pt/publicacoes-dados-abertos/publicacoes/plano-decenal-de-expansao-de-energia-2031 (accessed on 2 October 2023).
- De Vries, L.J.; Verzijlbergh, R.A. How Renewable Energy Is Reshaping Europe’s Electricity Market Design. Econ. Energy Environ. Policy 2018, 7, 31–49. [Google Scholar] [CrossRef]
- Lovins, A.B. Reliably Integrating Variable Renewables: Moving Grid Flexibility Resources from Models to Results. Electr. J. 2017, 30, 58–63. [Google Scholar] [CrossRef]
- Schmidt, J.; Cancella, R.; Pereira, A.O. An Optimal Mix of Solar PV, Wind and Hydro Power for a Low-Carbon Electricity Supply in Brazil. Renew. Energy 2016, 85, 137–147. [Google Scholar] [CrossRef]
- The World Bank. World Bank Open Data|Data. Available online: https://data.worldbank.org/ (accessed on 2 October 2023).
- International Energy Agency (IEA). International Energy Agency Reports—IEA Hydropower. Available online: https://www.ieahydro.org/publications/international-energy-agency-reports (accessed on 2 October 2023).
- Callegari, C.; Szklo, A.; Schaeffer, R. Cost Overruns and Delays in Energy Megaprojects: How Big Is Big Enough? Energy Policy 2018, 114, 211–220. [Google Scholar] [CrossRef]
- Arbuckle, E.J.; Binsted, M.; Davies, E.G.R.; Chiappori, D.V.; Bergero, C.; Siddiqui, M.S.; Roney, C.; McJeon, H.C.; Zhou, Y.; Macaluso, N. Insights for Canadian Electricity Generation Planning from an Integrated Assessment Model: Should We Be More Cautious about Hydropower Cost Overruns? Energy Policy 2021, 150, 112138. [Google Scholar] [CrossRef]
- Marchetti, I.; Rego, E.E. The Impact of Hourly Pricing for Renewable Generation Projects in Brazil. Renew. Energy 2022, 189, 601–617. [Google Scholar] [CrossRef]
- International Electrotechnical Commission (IEC). Grid Integration of Large-Capacity Renewable Energy Sources and Use of Large-Capacity Electrical Energy Storage|IEC. Available online: https://www.iec.ch/basecamp/grid-integration-large-capacity-renewable-energy-sources-and-use-large-capacity-electrical (accessed on 2 October 2023).
- IRENA. Adapting Market Design to High Shares of Variable Renewable Energy. Available online: https://www.irena.org/publications/2017/May/Adapting-Market-Design-to-High-Shares-of-Variable-Renewable-Energy (accessed on 2 October 2023).
- Hunt, J.D.; Nascimento, A.; Caten, C.S.T.; Tomé, F.M.C.; Schneider, P.S.; Thomazoni, A.L.R.; Castro, N.J.; de Brandão, R.; Freitas, M.A.V.d.; Martini, J.S.C.; et al. Energy Crisis in Brazil: Impact of Hydropower Reservoir Level on the River Flow. Energy 2022, 239, 121927. [Google Scholar] [CrossRef]
- Gaudard, L.; Romerio, F. The Future of Hydropower in Europe: Interconnecting Climate, Markets and Policies. Environ. Sci. Policy 2014, 37, 172–181. [Google Scholar] [CrossRef]
- Graabak, I.; Korpås, M.; Jaehnert, S.; Belsnes, M. Balancing Future Variable Wind and Solar Power Production in Central-West Europe with Norwegian Hydropower. Energy 2019, 168, 870–882. [Google Scholar] [CrossRef]
- IPCC. Renewable Energy Sources and Climate Change Mitigation—IPCC. Available online: https://www.ipcc.ch/report/renewable-energy-sources-and-climate-change-mitigation/ (accessed on 2 October 2023).
- Moura de Figueiredo, N.; Cavalcante Blanco, C.J.; Pinheiro Campos Filho, L.C.; Amarante Mesquita, A.L. MUWOS—Multiple Use Water Optimization System for the Power Generation and Navigation Trade-Offs Analysis. Renew. Energy 2023, 203, 205–218. [Google Scholar] [CrossRef]
- Basso, S.; Lazzaro, G.; Bovo, M.; Soulsby, C.; Botter, G. Water-Energy-Ecosystem Nexus in Small Run-of-River Hydropower: Optimal Design and Policy. Appl. Energy 2020, 280, 115936. [Google Scholar] [CrossRef]
- Kuriqi, A.; Pinheiro, A.N.; Sordo-Ward, A.; Bejarano, M.D.; Garrote, L. Ecological Impacts of Run-of-River Hydropower Plants—Current Status and Future Prospects on the Brink of Energy Transition. Renew. Sustain. Energy Rev. 2021, 142, 110833. [Google Scholar] [CrossRef]
- Garrett, K.P.; McManamay, R.A.; Witt, A. Harnessing the Power of Environmental Flows: Sustaining River Ecosystem Integrity While Increasing Energy Potential at Hydropower Dams. Renew. Sustain. Energy Rev. 2023, 173, 113049. [Google Scholar] [CrossRef]
- Karier, T.; Fazio, J. How Hydropower Enhances the Capacity Value of Renewables and Energy Efficiency. Electr. J. 2017, 30, 1–5. [Google Scholar] [CrossRef]
- Ibanez, E.; Magee, T.; Clement, M.; Brinkman, G.; Milligan, M.; Zagona, E. Enhancing Hydropower Modeling in Variable Generation Integration Studies. Energy 2014, 74, 518–528. [Google Scholar] [CrossRef]
- da Silva, A.V.; Costa, M.A.; Ahn, H.; Lopes, A.L.M. Performance Benchmarking Models for Electricity Transmission Regulation: Caveats Concerning the Brazilian Case. Util. Policy 2019, 60, 100960. [Google Scholar] [CrossRef]
- Maceiral, M.E.P.; Penna, D.D.J.; Diniz, A.L.; Pinto, R.J.; Melo, A.C.G.; Vasconcellos, C.V.; Cruz, C.B. Twenty Years of Application of Stochastic Dual Dynamic Programming in Official and Agent Studies in Brazil-Main Features and Improvements on the NEWAVE Model. In Proceedings of the 2018 Power Systems Computation Conference (PSCC), Dublin, Ireland, 11–15 June 2018; pp. 1–7. [Google Scholar]
- Pereira, M.V.F.; Pinto, L.M.V.G. Multi-Stage Stochastic Optimization Applied to Energy Planning. Math. Program. 1991, 52, 359–375. [Google Scholar] [CrossRef]
- Pereira, M.V.F.; Pinto, L.M.V.G. Stochastic Optimization of a Multireservoir Hydroelectric System: A Decomposition Approach. Water Resour. Res. 1985, 21, 779–792. [Google Scholar] [CrossRef]
- ONS. Avaliação Das Condições de Atendimento Eletroenergértico Do Sistema Interligado Nacional—Estudo Prospectivo de Julho a Novembro de 2021. Available online: https://www.gov.br/ana/pt-br/assuntos/monitoramento-e-eventos-criticos/eventos-criticos/salas-de-acompanhamento/parana/documentos/outros-documentos/cta-ons-dgl-1496-2021-avaliacao-das-condicoes-de-atendimento-eletroenergetico-do-sistema-interligado-nacional-sin.pdf/view (accessed on 2 October 2023).
- Nowak, B.; Andrzejak, A.; Filipiak, G.; Ptak, M.; Sojka, M. Assessment of the Impact of Flow Changes and Water Management Rules in the Dam Reservoir on Energy Generation at the Jeziorsko Hydropower Plant. Energies 2022, 15, 7695. [Google Scholar] [CrossRef]
- Paim, M.A.; Dalmarco, A.R.; Yang, C.H.; Salas, P.; Lindner, S.; Mercure, J.F.; de Andrade Guerra, J.B.S.O.; Derani, C.; Bruce da Silva, T.; Viñuales, J.E. Evaluating Regulatory Strategies for Mitigating Hydrological Risk in Brazil through Diversification of Its Electricity Mix. Energy Policy 2019, 128, 393–401. [Google Scholar] [CrossRef]
- Ministério de Minas e Energia (MME). Portaria No 59/2020. Available online: https://www.in.gov.br/web/dou/-/portaria-n-59-de-20-de-fevereiro-de-2020-244584752 (accessed on 2 October 2023).
- Ministério de Minas e Energia (MME); Empresa de Pesquisa Energética (EPE). Plano Decenal de Expansão de Energia 2029. Available online: https://www.epe.gov.br/pt/publicacoes-dados-abertos/publicacoes/plano-decenal-de-expansao-de-energia-2029 (accessed on 2 October 2023).
- Empresa de Pesquisa Energética (EPE). Modelo de Decisão de Investimentos (MDI)—PDE 2029. Available online: https://www.epe.gov.br/pt/publicacoes-dados-abertos/publicacoes/modelo-de-decisao-de-investimentos-mdi-pde-2029 (accessed on 27 January 2024).
- Poletti, S.; Staffell, I. Understanding New Zealand’s Wind Resources as a Route to 100% Renewable Electricity. Renew. Energy 2021, 170, 449–461. [Google Scholar] [CrossRef]
- Drouineau, M.; Maïzi, N.; Mazauric, V. Impacts of Intermittent Sources on the Quality of Power Supply: The Key Role of Reliability Indicators. Appl. Energy 2014, 116, 333–343. [Google Scholar] [CrossRef]
- Miranda, R.; Soria, R.; Schaeffer, R.; Szklo, A.; Saporta, L. Contributions to the Analysis of “Integrating Large Scale Wind Power into the Electricity Grid in the Northeast of Brazil” [Energy 100 (2016) 401–415]. Energy 2017, 118, 1198–1209. [Google Scholar] [CrossRef]
- Hirth, L. The Benefits of Flexibility: The Value of Wind Energy with Hydropower. Appl. Energy 2016, 181, 210–223. [Google Scholar] [CrossRef]
- Ministério de Minas e Energia (MME); Empresa de Pesquisa Energética (EPE). Metodologia de Análise Para o Atendimento à Demanda Máxima de Potência e Requisito de Capacidade. Available online: https://antigo.mme.gov.br/c/document_library/get_file?uuid=f86f01bd-dbb6-68c5-c4b6-77010b59f38a&groupId=36189 (accessed on 2 October 2023).
- Empresa de Pesquisa Energética. Ferramenta de Balanço de Potência. Available online: https://www.epe.gov.br/pt/publicacoes-dados-abertos/publicacoes/ferramenta-de-balanco-de-potencia (accessed on 2 October 2023).
- Maceira, M.E.P.; Duarte, V.S.; Penna, D.D.J.; Moraes, L.A.M.; Melo, A.C.G. Ten Years of Application of Stochastic Dual Dynamic Programming in Official and Agent Studies in Brazil—Description of the NEWAVE Program. In Proceedings of the 16th Power Systems Computation Conference, Glasgow, Scotland, 14–18 July 2008. [Google Scholar]
- Ferreira, P.G.C.; Oliveira, F.L.C.; Souza, R.C. The Stochastic Effects on the Brazilian Electrical Sector. Energy Econ. 2015, 49, 328–335. [Google Scholar] [CrossRef]
- Pérez-Díaz, J.I.; Belsnes, M.; Diniz, A.L. 6.05—Optimization of Hydropower Operation. In Comprehensive Renewable Energy Volume 1–9, 2nd ed.; Elsevier: Amsterdam, The Netherlands, 2022; Volume 1–6, pp. 84–104. ISBN 978-0-12-819734-9. [Google Scholar]
- Agência Nacional de Águas e Saneamento Básico (ANA). Resolução ANA No 2.081/2017. Documento no 00000.080754/2017-91. 2017. Available online: https://arquivos.ana.gov.br/resolucoes/2017/2081-2017.pdf (accessed on 2 October 2023).
Disclaimer/Publisher’s Note: The statements, opinions and data contained in all publications are solely those of the individual author(s) and contributor(s) and not of MDPI and/or the editor(s). MDPI and/or the editor(s) disclaim responsibility for any injury to people or property resulting from any ideas, methods, instructions or products referred to in the content. |
© 2024 by the authors. Licensee MDPI, Basel, Switzerland. This article is an open access article distributed under the terms and conditions of the Creative Commons Attribution (CC BY) license (https://creativecommons.org/licenses/by/4.0/).

