Article

Linear Quadratic Gaussian Controller for Single-Ended Primary Inductor Converter via Integral Linear Quadratic Regulator Merged with an Offline Kalman Filter

by
Youssef El Haj
and
Vijay K. Sood
*
Department of Electrical, Computer and Software Engineering, Ontario Tech University, Oshawa, ON L1G 0C5, Canada
*
Author to whom correspondence should be addressed.
Energies 2024, 17(14), 3385; https://doi.org/10.3390/en17143385
Submission received: 20 May 2024 / Revised: 22 June 2024 / Accepted: 3 July 2024 / Published: 10 July 2024

Abstract

:
This paper introduces a Linear Quadratic Gaussian (LQG) controller for a Single-Ended Primary Inductor Converter (SEPIC). The LQG design is based on merging an integral Linear Quadratic Regulator (LQR) with an offline Kalman Filter (commonly referred to as a Linear Quadratic Estimator (LQE)). The robustness of the LQG controller is guaranteed based on the separation principle. This manuscript addresses the need to use observer-based systems for the fourth-order SEPIC, which needs a sensor reduction as an essential requirement. This paper provides a comprehensive, yet systematic, approach to designing the LQG system. The work validates the convergences of the states in an LQG system to an actual value. Furthermore, it compares the performance of an LQG system with a benchmark Type-II industrial controller by means of a simulation of the switched converter model in the Simulink/MATLAB 2023a environment.

1. Introduction

One of the most common categorizations of a DC–DC converter is based on whether the load is isolated from the input or not. Specifically, a DC–DC converter is categorized as an isolated topology if the load is isolated from the input. On the other hand, the converter is categorized as non-isolated if the load shares a common ground with the input or has a floating ground [1,2,3,4,5,6,7,8,9,10,11]. Each topology has advantages/disadvantages, as summarized in the cited references.
A non-isolated topology is quite popular in the literature. Typically, under the constraint of unidirectional power flow, the non-isolated topologies are classified into three main groups: single-stage, multi-stage, and multi-phase converters [1,2,3,4,5,6,7,8,9,10,11]. The single-stage group (or second-order converters) includes buck, boost, and buck–boost converters. These converters have two storage elements (i.e., one inductor and one capacitor), hence the name. Multi-stage converters primarily comprise Single-Ended Primary Inductance (SEPIC), Cuk, and Zeta converters. These converters have four storage elements (i.e., two inductors and two capacitors); hence, they are called higher-order converters or fourth-order converters. Typically, higher-order converters are the result of the hybridization of two single-stage converters. The last group, multi-phase converters, is beyond the scope of this work [1,2,3,4,5,6,7,8,12,13,14,15].
In comparing the listed converters, the SEPIC (Figure 1) is a result of hybridizing a boost converter and a buck–boost converter at the input and output sides, respectively. The main characteristics of the SEPIC can be summarized as its ability to step up or step down the DC input voltage without a polarity inversion. Also, the SEPIC gate driver design is simple due to its low-side switch. From a converter structure, SEPIC power delivery from input to output is based on the energy transfer through capacitor C1 and inductor L1. From an input electro-magnetic interference (EMI) perspective, the SEPIC has an input series inductor, which reduces the EMI due to the continuous nature of the supplied current. These features make the SEPIC popular in several applications, such as solar applications and motor drives [1,2,3,4,5,6,7,8,12,13,14,15].
Deploying SEPIC in PV applications (and other similar fields) has been addressed in several studies [16,17,18,19,20,21,22,23,24]. This highlights the popularity of SEPIC and emphasizes the need to investigate simple controller techniques to achieve robust performance. Therefore, this work focuses on a simple, yet robust, controller for the SEPIC.
The first step to achieve this goal is to provide an overview of the common techniques to control SEPIC and address the research gaps. Control strategies to regulate DC–DC converters are categorized into two groups: conventional and advanced techniques.
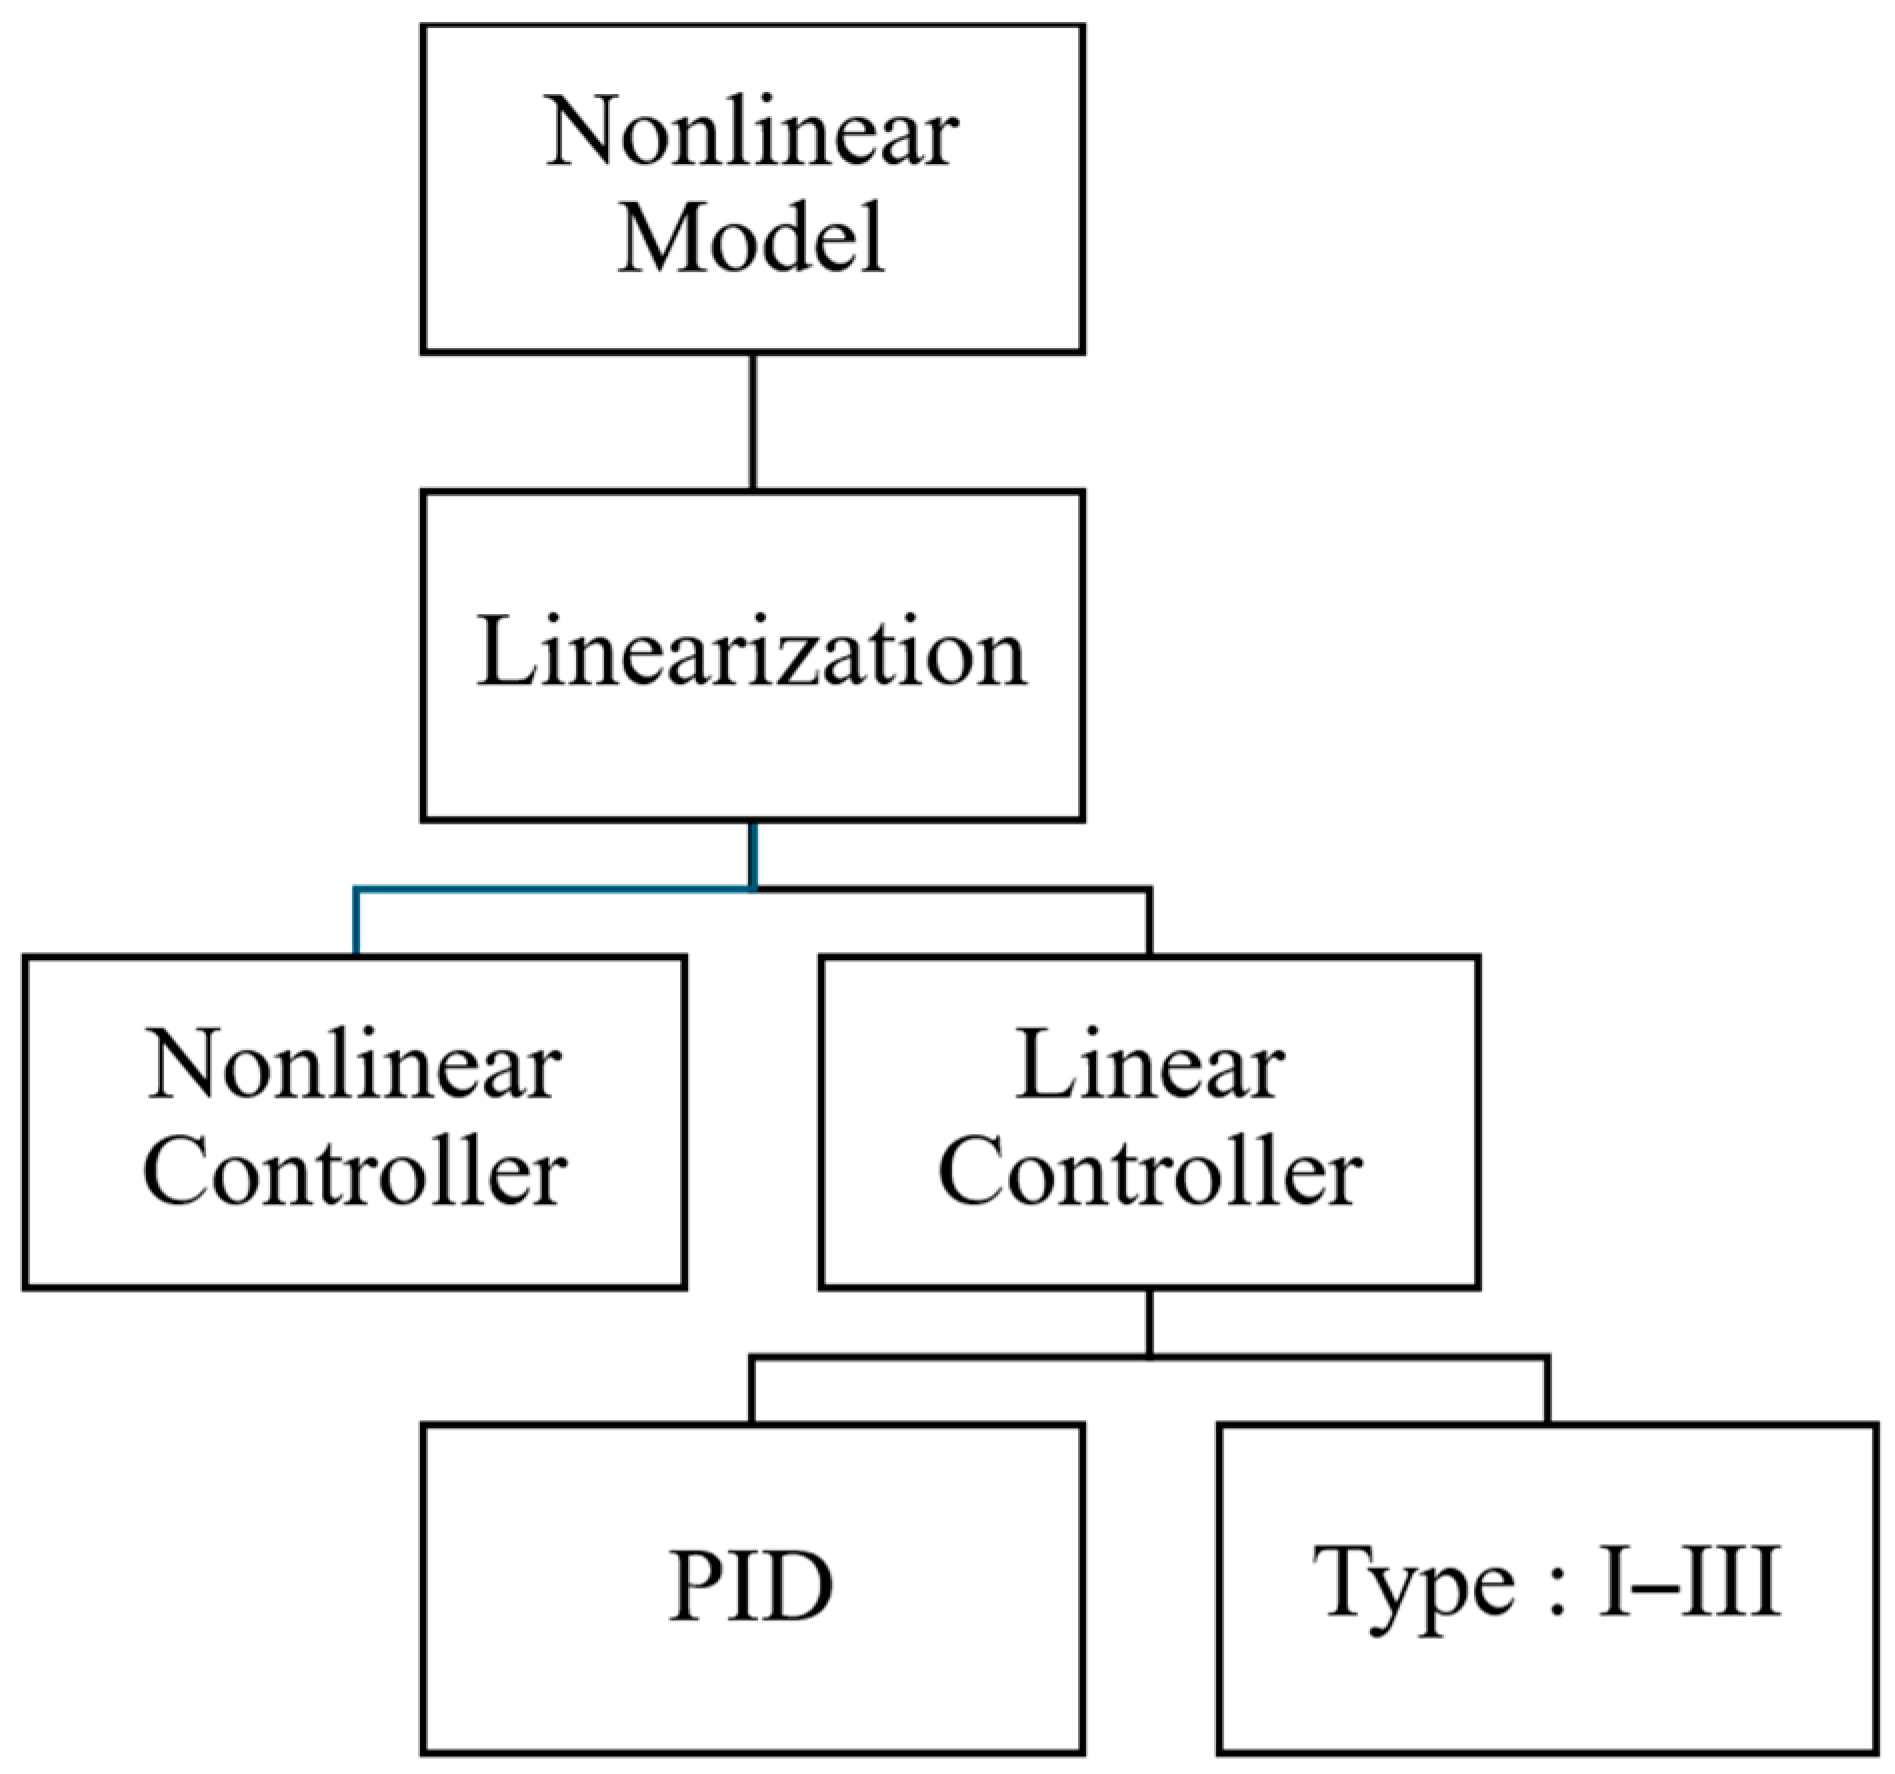
In the first group (i.e., linear or conventional techniques), a linearized model of the converter is an essential requirement to have before starting the controller design. This is because DC–DC converter models are nonlinear, while their conventional controllers are linear. Consequently, the converter model must be linearized, first around the desired point (i.e., in a small neighborhood around the desired operating condition). In the literature, the conventional controller techniques are divided into two groups: Proportional–Integral–Derivative (PID) and Type-I-III compensators [25,26,27,28,29,30,31,32,33,34]. Figure 2 depicts the linear controller categories.
In the second group (i.e., nonlinear or advanced technologies), the converters are driven by a nonlinear controller where the limitations of a linear controller are either mitigated or overcome. In the literature, the addressed technologies are composed of, but not limited to, Model Predictive Control (MPC), Backstepping Control, Sliding Mode Control, Passivity-Based control, and Disturbance Estimation Techniques. Among the alternatives, this manuscript addresses a controller strategy that is based on state estimations. Estimation or observer techniques can take two approaches: disturbance observers and/or state observers [7,35,36,37,38,39,40,41,42,43,44,45,46,47,48,49]. Figure 3 depicts the nonlinear controller categories.
In a disturbance observer, the developed estimator model estimates the uncertainty, the unmodeled dynamics, and any relevant noise that appears in the nonlinear model. This task can be fulfilled using different models, such as disturbance observers (DOs), nonlinear disturbance observers (NDOs), higher-order sliding mode observers (HOSMOs), and Kalman Filters (KFs). The prime advantages of disturbance observers and their variants are their features of being independent from the closed-loop controller, which allows for integration with other controller types, such as sliding mode, backstepping, and the Passivity-Based controller. On the other hand, a KF (and its variants) can achieve the same objectives in terms of disturbance estimation through its inherent stochastic structure [35,42,50,51,52].
Using state observers is a common approach to reduce the needed sensors, which impacts the system cost, complexity, size, and weight. Estimating the state is typically achieved through the design of either linear or nonlinear models where the input to these models is a measured state variable. The most common observers, typical for linearized models, are the Leuenberger observers. A Leuenberger observer is typically used as a linear estimator, and it offers an effective solution to a state–feedback controller because it reduces the requirements of the needed sensors significantly [25,29,30,31]. However, one of the limitations of this approach is the performance dependency on the pole placements of the observer state–space model. This limitation can be overcome if a cost function is derived such that the placement of the observer system poles is optimized. In the literature, the observer that results from placing the poles in an optimized structure is defined as a Linear Gaussian Estimator (LQE), commonly known as an offline Kalman Filter [53,54,55,56,57,58,59,60,61,62,63,64,65,66,67,68,69,70].
Within the studied literature, several approaches were introduced into SEPICs to merge the observer design with controllers; hence, the requirements for direct measurements (via sensors) of the needed states that are used in the control law are reduced. In [71], an LQR controller was derived for a SEPIC, and its performance was compared to a PID controller. The work proposed a KF that is based on reducing the expected value for the added squared error. The work did not cover the internal dynamics of KF, and it was based on an online calculation and estimation, which could place a limitation depending on the available computational power. In [72], the work designed a Lyapunov-based controller and observer for the SEPIC. The developed controller and observer were nonlinear and demonstrated superiority in comparison to linear techniques, as validated by an experimental setup. On the other hand, due to the nature of the controller and observer, the system suffered from a minor steady-state error between the actual measurement and estimated variable because the derived control law could not perform proper tracking tasks (i.e., to reach the desired reference value). Instead, the derived control law resulted in having the phase portrait as a limit cycle around the desired point of interest. The work in [73] introduced a SEPIC for PV systems that was controlled by an integral LQR controller where the states were estimated by a Leuenberger linear observer. The system was designed via pole placement techniques. The limitation on the design was based on a second-order dominant pole, and the remaining two poles were placed far in the left-half plane (i.e., to render them less significant). This limitation was also noted in the time response during disturbances.
In [74], a nonlinear controller and observer were merged. The work derived a Passivity-Based controller and observer, and it was compared to a Backstepping Controller. The transient response suffered from undesirable oscillations and overshoot at the instance of the disturbance. Additionally, the designed backstepping waveforms suffered from harmonics that could trigger a safety protection network in real-world applications. Reference [75] proposed a nonlinear observer design to estimate unobservable states using the previous and the current state measurements. The work demonstrated convergence between the estimated and actual states. However, the work proposed a complicated technique to estimate the SEPIC states. The major drawback is that the SEPIC was designed to be fully state-observable, while the technique in [75] did not offer a significant contribution based on this fact.
Estimating the desired states in a SEPIC was also addressed via a nonlinear approach in [76]. The work proposed a nonlinear sliding mode observer, and the results were verified experimentally. The limitation of the work was the complexity of the system, as it required a double integration calculation cascaded with another integration process. Furthermore, system stability was based on the definition of a referenced current expression; this became a bottleneck as the system did not have any switching terms to correct the system trajectory in case of insufficient information available in the reference current expression due to changes in the components’ parasitic values.
Another nonlinear approach was introduced in [77] to design an observer for the SEPIC controller using an Immerse and Invariance technique. The work demonstrated the advantage of the designed observer as its error estimation did not result in driving the system to be stable; instead, it resulted in a steady-state error. This limits the work, as the observer is based on having an accurate converter model; otherwise, the controlled state will suffer from a steady-state error. Overcoming this limitation requires implementing advanced adaptive controller techniques where these techniques can be merged with the existing controllers.
Overall, the addressed literature review demonstrates that SEPIC controllers are either simple with limitations in robustness and performance or complex to enhance their robustness, thus requiring multi-variable sensing to achieve robust tracking via an advanced controller structure. These limitations are addressed in this proposed work by employing an optimized Linear Quadratic Gaussian (LQG) controller. This controller derives an optimized integral Linear Quadratic Regulator (LQR) that uses an offline Kalman Filter (KF) as an estimator (commonly known as a Linear Gaussian Estimator—LQE). Furthermore, the presented LQG system demonstrates simplicity with respect to the cited research as it requires, from the state–variable perspective, only one state to measure. Furthermore, the controller loop is based on a simple mathematical calculation, including the integration process. The proposed LQG controller is compared to a benchmark Type-II compensator that is derived for the designed SEPIC.
The remaining sections of this manuscript are organized as follows. First, the mathematical model that represents the averaged large-signal nonlinear (bilinear) model is derived from the SEPIC switched model. Next, the small-signal model and the linearized state–space representation are presented. The next section covers the design procedure for the benchmark Type-II compensator, as well as the design procedure for the proposed LQG system for a designed SEPIC. This designed converter is based on a Texas Instruments Application Note (TI AN-1484). The discussion covers all of the relevant background and theory. Following that, using the Simulink/MATLAB environment, a comparison between the designed controller and the Type-II controller is presented. Finally, the conclusions are presented.

2. Material and Methods

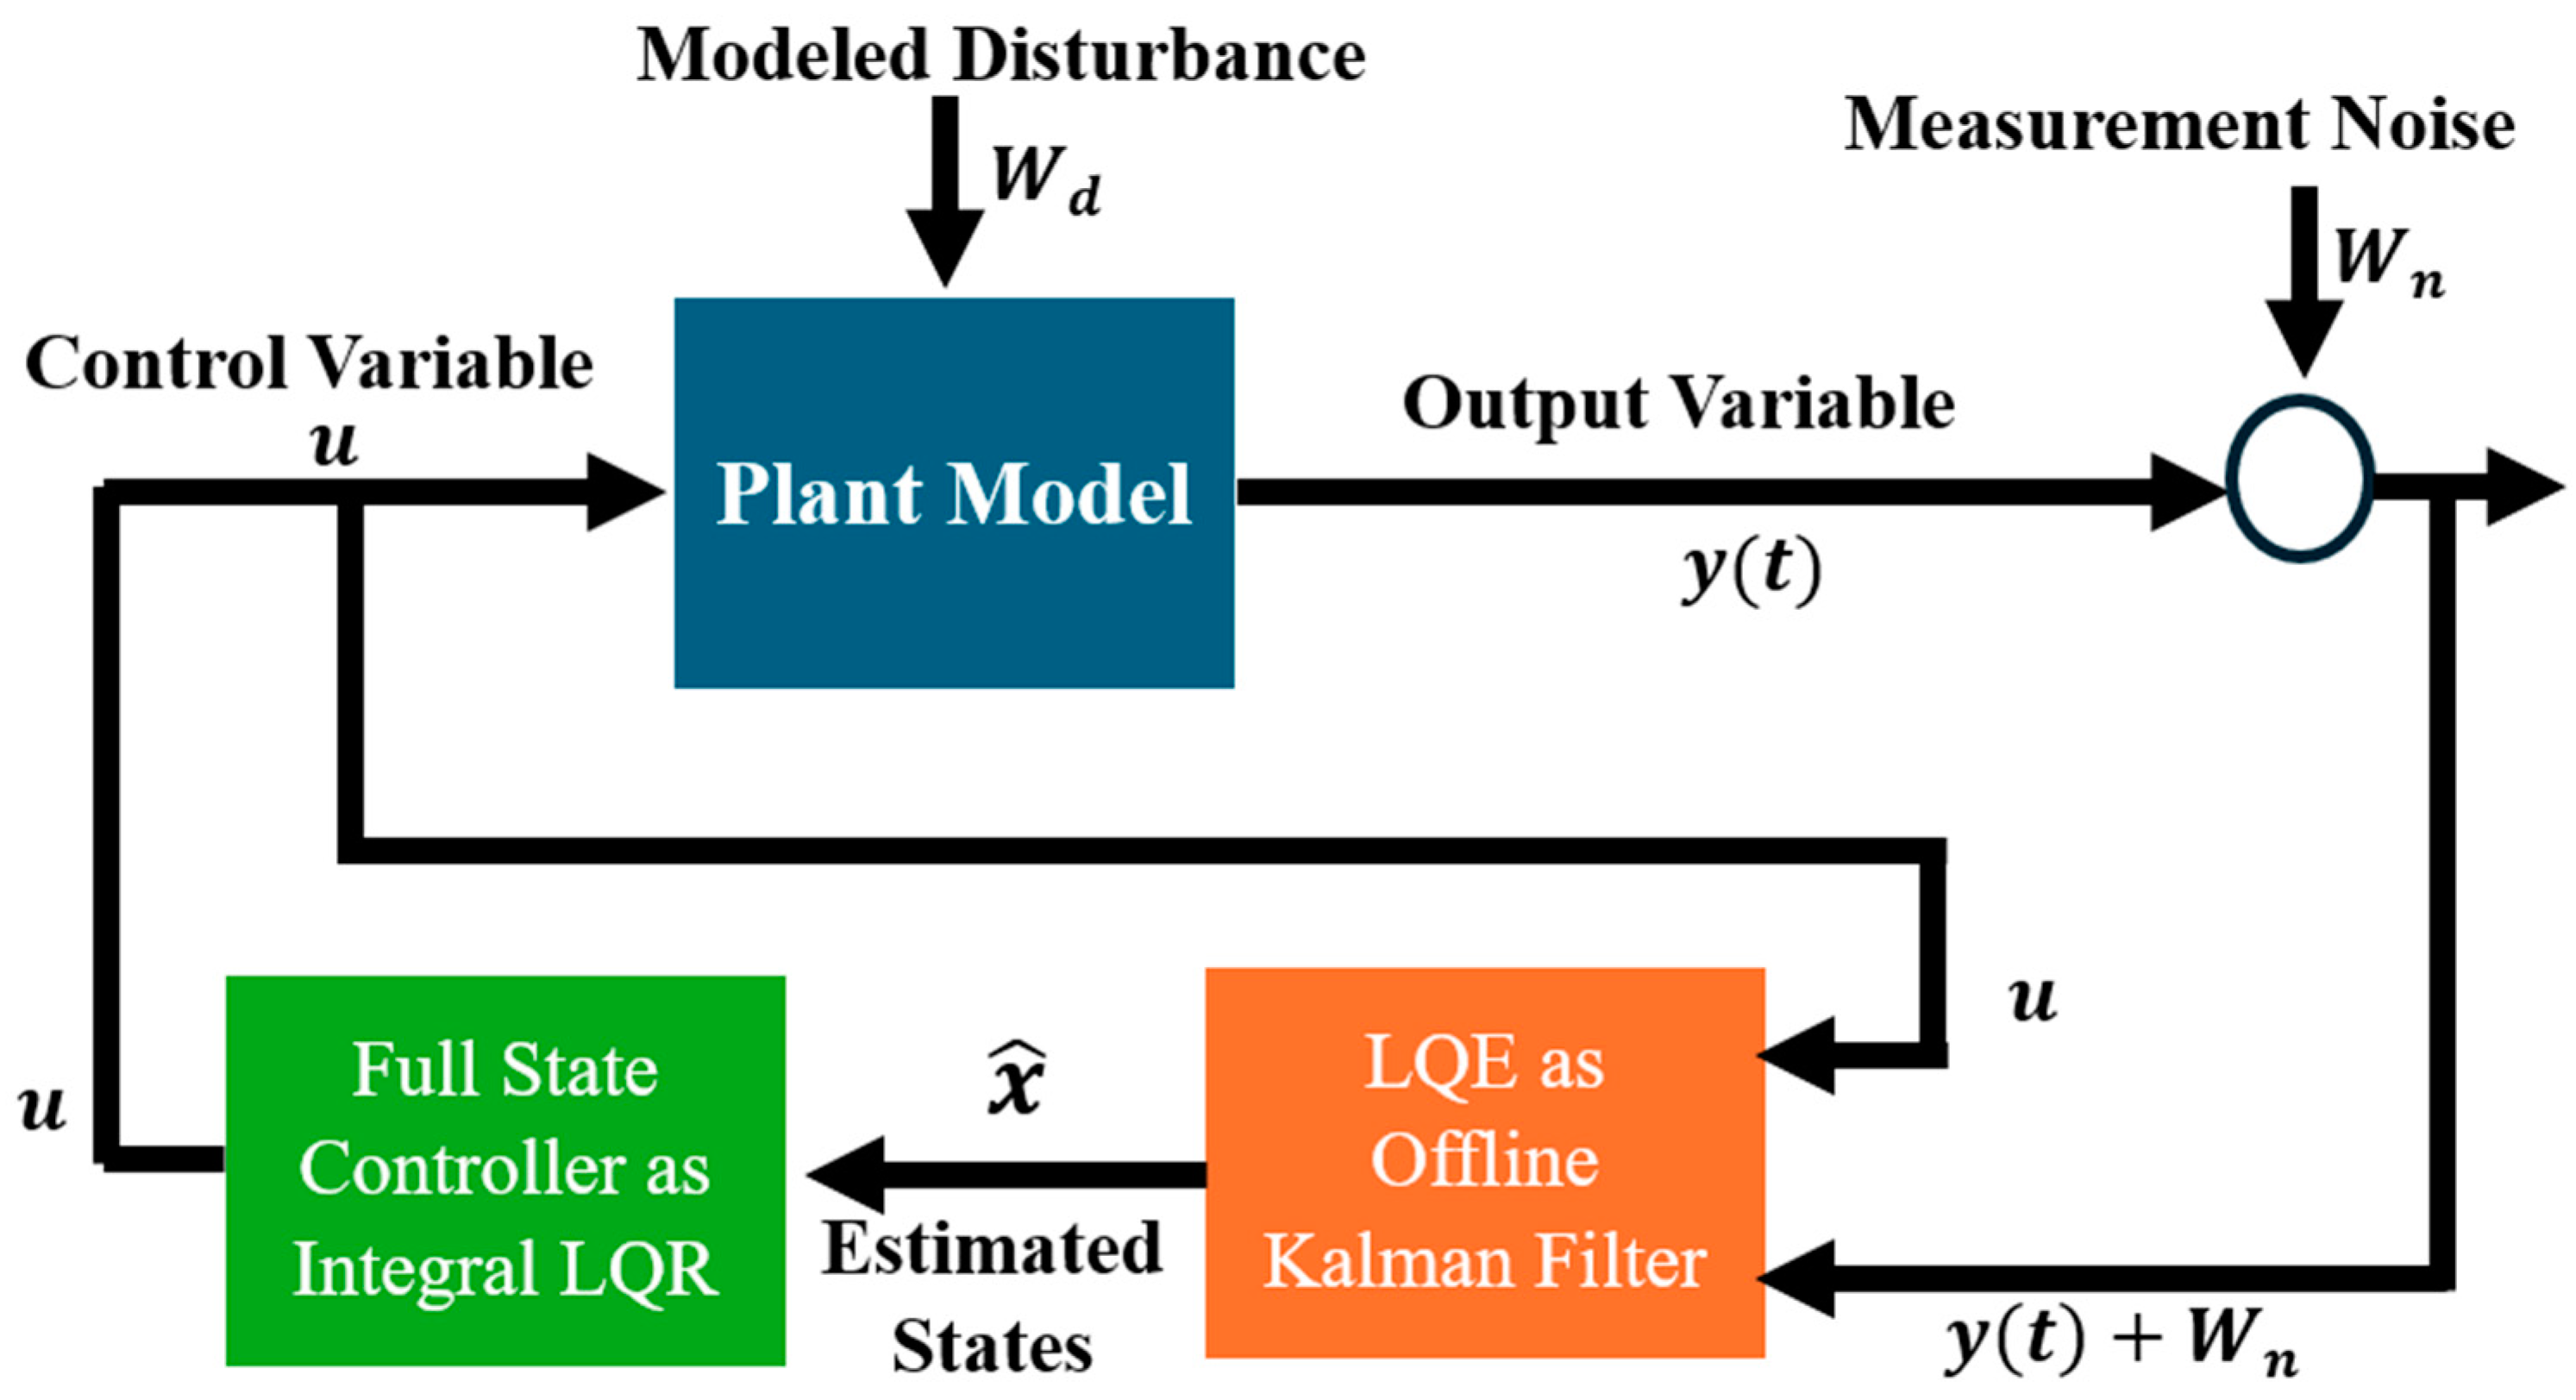
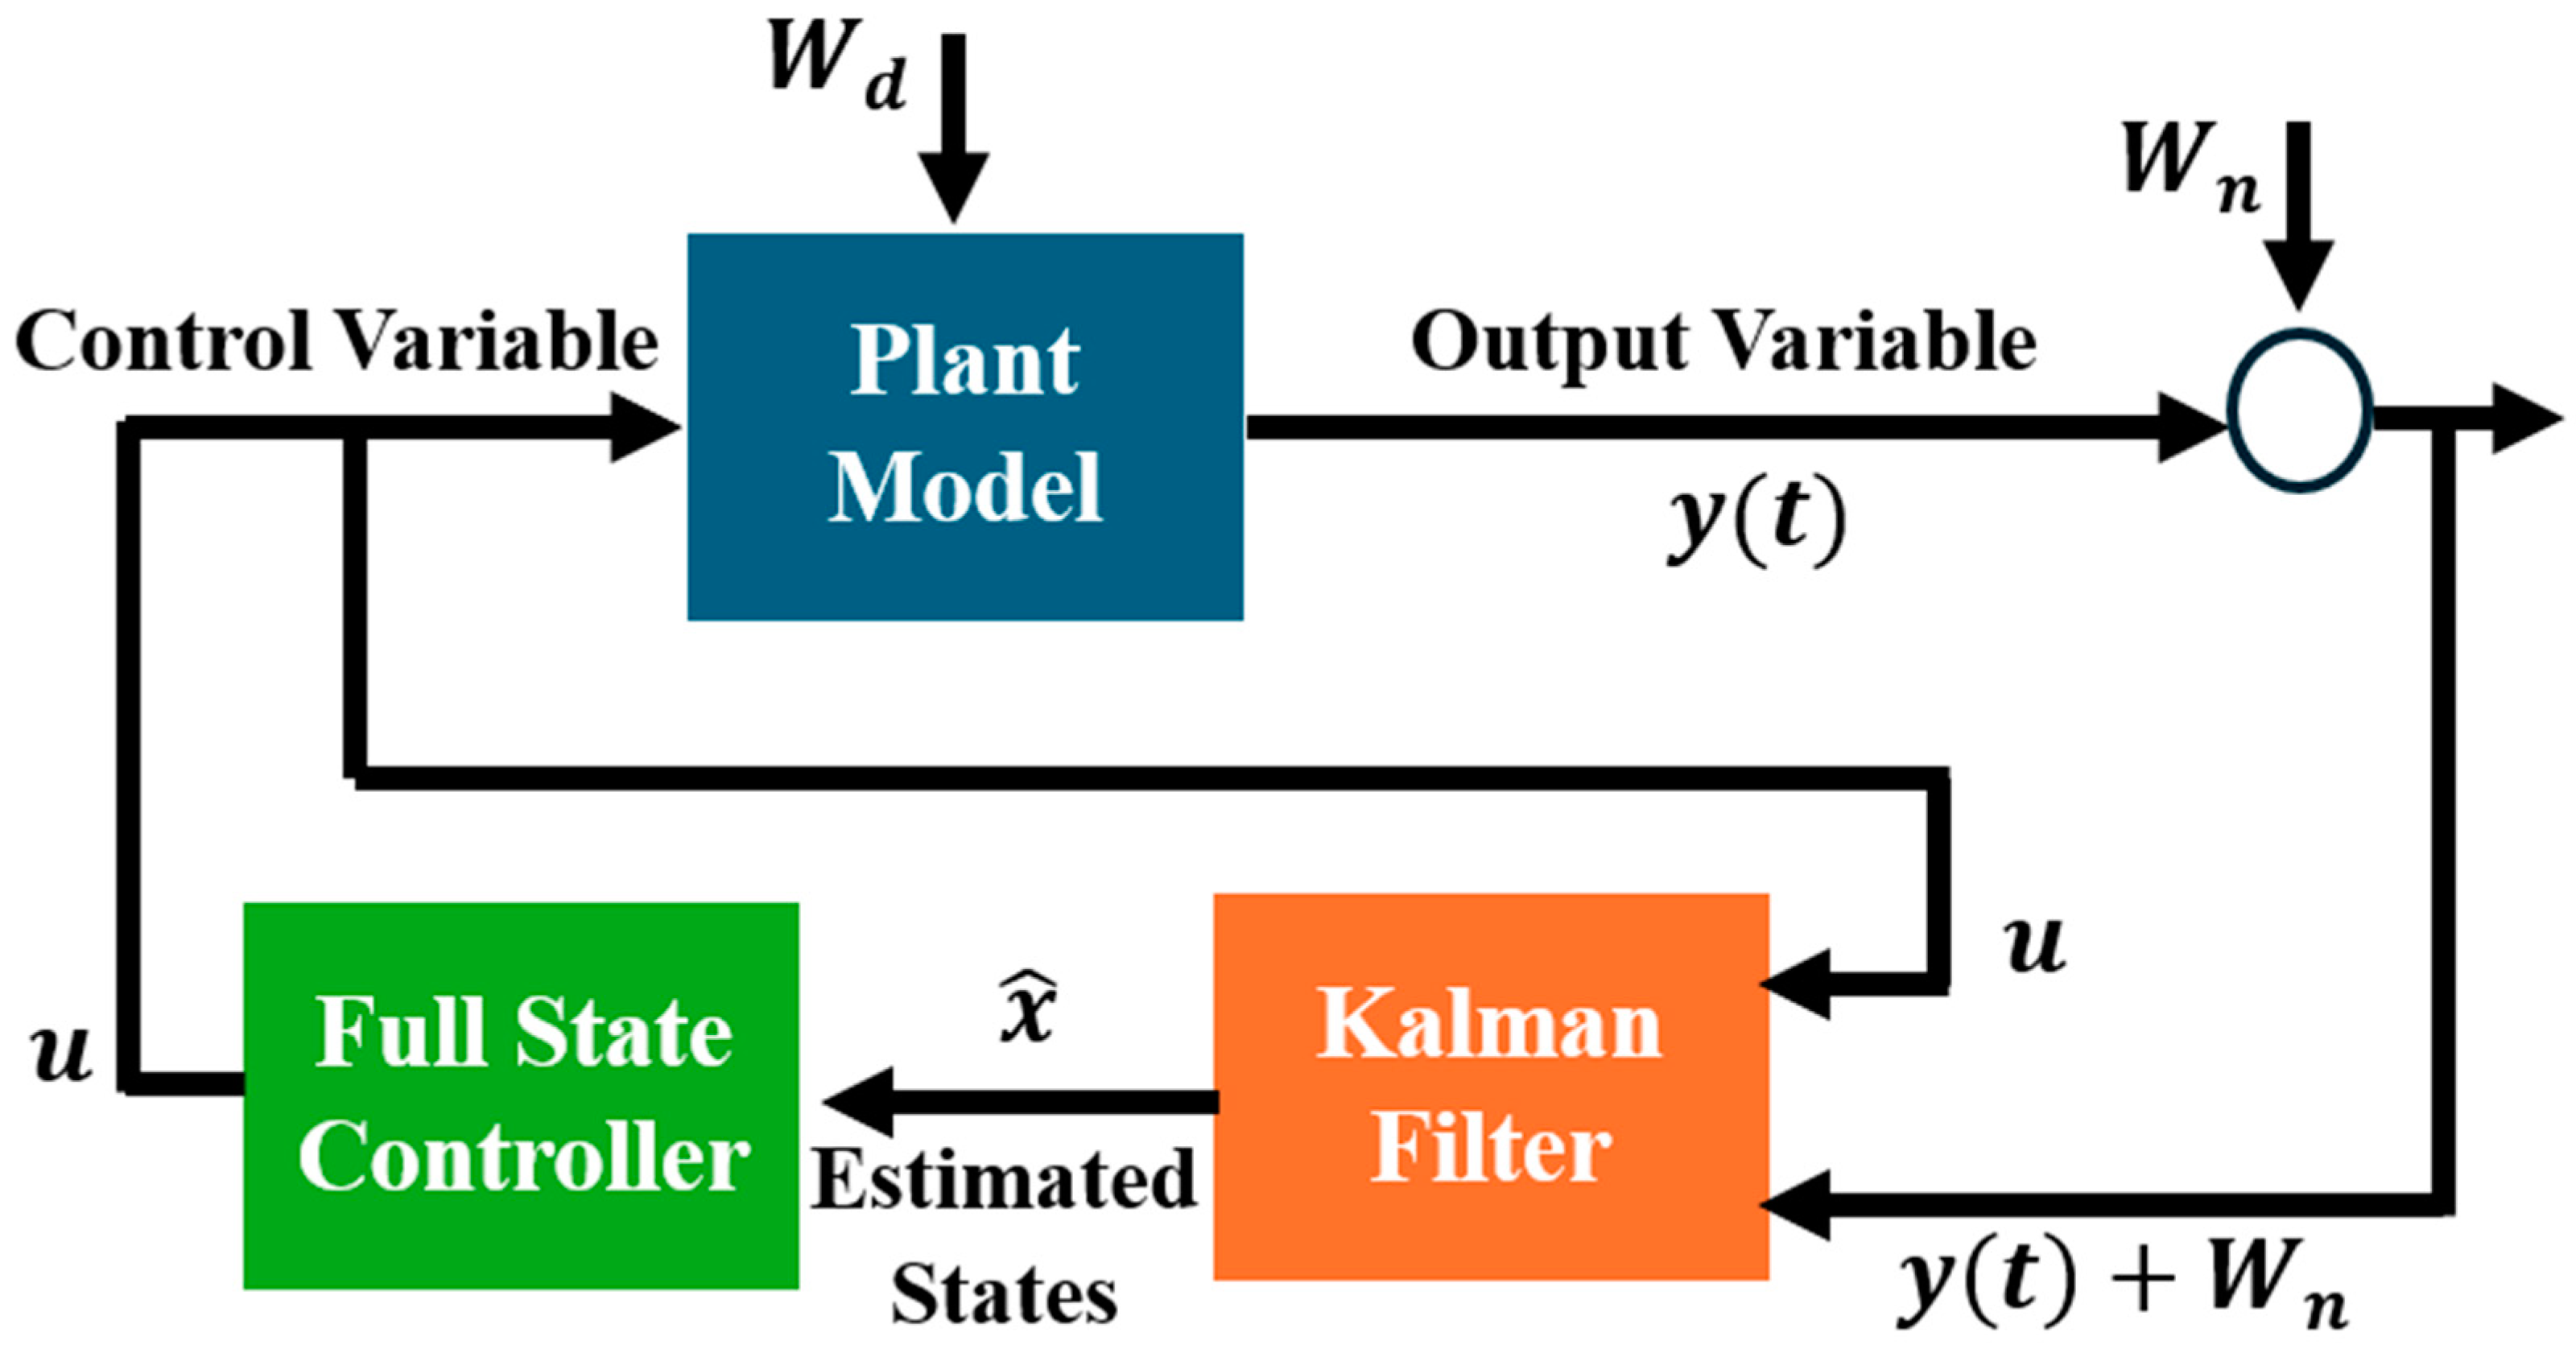
This manuscript proposes a systematic method to design and tune a Linear Quadratic Gaussian (LQG) controller for a SEPIC. The design method of the LQG controller commences with a robust Integral LQR controller for the SEPIC. The design of the integral LQR assumes that all the states are measurable, and they are available for the controller’s implementation. Next, a Linear Quadratic Estimator (LQE), commonly referred to as an offline Kalman Filter, is designed for the open-loop SEPIC using the variable of interest. The details regarding the design and tuning methods of the offline Kalman Filter are presented. In the design and in the validation process, the output voltage is used for the feedback loop and for estimation objectives. At this stage, after designing the integral LQR and LQE, the controller as well as the estimator are ready for the next step. The final step in designing the LQG controller is to merge the designed estimator with the controller. The merging process implies that the estimator will provide all of the state variables where they are used as part of the integral LQR controller. Figure 4 depicts the system block diagram where the disturbance and noise measurements are also taken into consideration. The figure shows that the offline Kalman Filter requires a measured variable (output voltage, in this case) as well as the generated control variable (duty cycle, in this case). As the offline Kalman Filter estimates the SEPIC state variables, they are fed to the integral LQR controller (shown as the Full-State Controller in Figure 4). To enhance the system’s robustness, the measured variable (output voltage) is used in the integral LQR loop (not shown in Figure 4). The robustness and convergence of the LQG system are guaranteed by the separation principle. Furthermore, the LQG approach does not require any tuning (either for the controller or for the estimator), which makes it a simple yet robust approach to designing an optimal system response.

3. Mathematical Model of SEPIC

The SEPIC (Figure 1) is operated and controlled through the switch Q1 by generating a regulated pulse-width-modulated (PWM) signal. The PWM signal has two states: on (logic 1) and off (logic 0). Hence, the SEPIC circuit has two equivalent circuits, with each corresponding to the two states of the PWM signal. Figure 5 shows the SEPIC circuit under each state of the PWM signal [4,6,76,77,78,79,80,81].
The mathematical model of the SEPIC is described by the differential equations that are derived from each circuit in Figure 5. After considering the average representation of each model, the SEPIC large-signal average model can be obtained as in Equation (1):
x 1 ˙ x 2 ˙ x 3 ˙ x 4 ˙ = r L 1 L 1   0 1 u L 1 1 u L 1 0 r L 2 L 2 u L 2 1 u L 2 1 u C 1 u C 1 0 0 1 u C 2 1 u C 2 0 1 R C 2 x 1 x 2 x 3 x 4 + V g L 1 0 0 0 ,
where x 1 = i L 1 , x 2 = i L 2 , x 3 = v C 1 , x 4 = v C 2 , r L i   = equivalent series resistance (ESR) of the i t h inductor, and v g = input voltage [4,6,76,77,78,79,80,81].
The derived model of the SEPIC is bilinear; hence, it cannot be used directly to design linear controllers. Hence, the next step is to derive/define the converter small-signal model as well as a linearized state–space representation. The derived small-signal model presents the system in the Laplace domain, and it is used to design a Type-II compensator, while the linearized state–space representation is used to derive the proposed LQG system. The SEPIC small-signal model was derived in [4,78,79], and it is given in Equation (2). It gives the transfer function between the duty cycle (i.e., the control variable) and the second/output capacitor voltage (i.e., the converter output) [4,6,76,77,78,79,80,81].
v o u t u s = K d ( A 1 s + 1 ) ( A 2 s 2 A 3 s + 1 ) ( A 4 s 2 + A 5 s + 1 ) ( A 6 s 2 + A 7 s + 1 )
where   K d = 1 D 2 and D = 1 D , D is the converter duty cycle; A 1 = L 1 R D D 2 ; A 2 = L 2 C 1 D ; A 3 = C 1 R L 1 + L 2 L 1 D D 2 ; A 4 = 1 w o 1 2 ; A 5 = 1 w o 1 Q 1 ; A 6 = 1 w o 2 2 ; A 7 = 1 w o 2 Q 2 ; Q 1 = R w o 1 L 1 D 2 D 2 + L 2 ; w o 1 = 1 L 1 C 2 D 2 D 2 + C 1 + L 2 C 1 + C 2 ; w o 2 = D 2 L 1 L 2 C 1 C 2 L 1 C 2 D D 2 + C 1 + L 2 C 1 + C 2 ; and Q 2 = R w o 2 L 1 + L 2 C 1 C 2 w o 1 w o 2 2 .
The linearized state–space representation of the SEPIC is obtained by deriving the Jacobian matrix of the large-signal model that is given in Equation (1) [4,6,76,77,78,79,80,81,82]. Therefore, the linearized model can be derived as per Equation (3):
A = 0   0 1 D u L 1 1 D u L 1 0 0 D u L 2 1 D u L 2 1 D u C 1 D u C 1 0 0 1 D u C 2 1 D u C 2 0 1 R C 2 ,   B = v 1 s s + v 2 s s L 1   v 1 s s + v 2 s s L 2 i 1 s s   i 2 s s C 1 i 1 s s   i 2 s s C 2 ,   C = 0   0   0   1 ,   D = 0 ,   x = x 1 x 2 x 3 x 4 ,
where
i 1 s s = D u 2 1 D u 2 · v g R ,     i 2 s s = D u 1 D u · v g R ,   v 1 s s = v g   and   v 2 s s = D u 1 D u · v g
Within this work, a SEPIC was designed following the Texas Instruments Application Note (TI AN-1484) with the designed converter parameters, as summarized in Table 1.
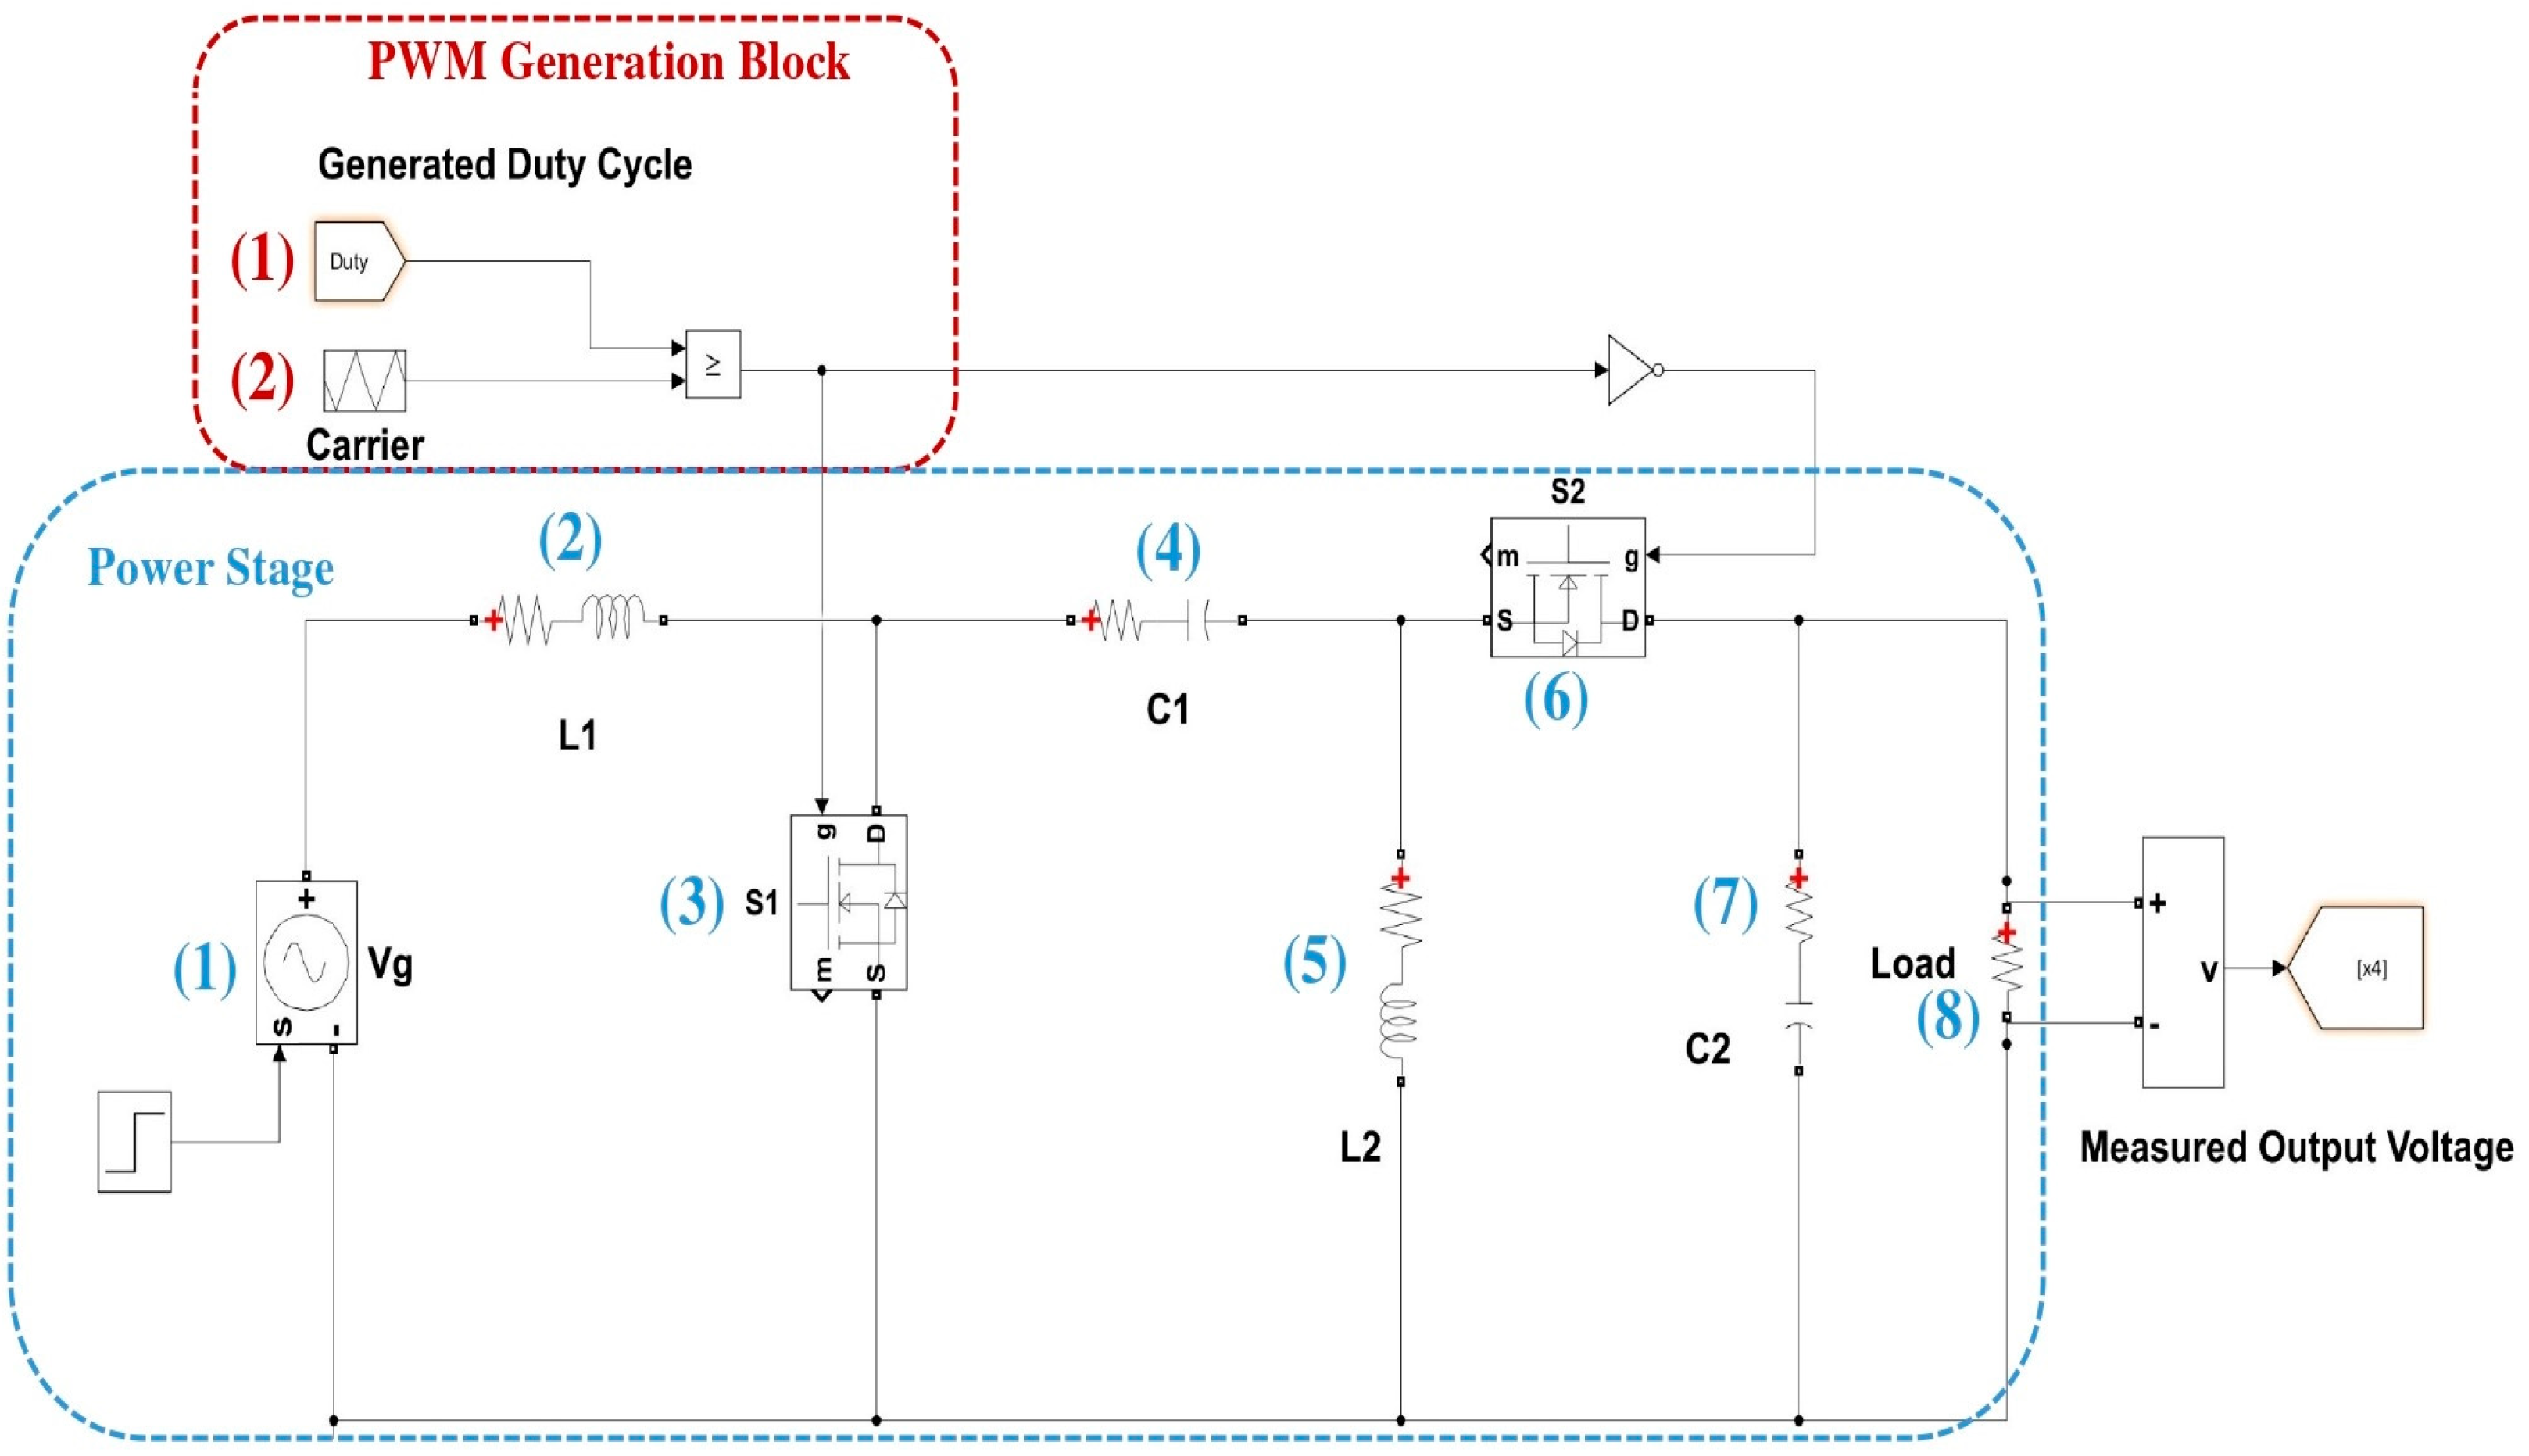
In the Simulink/MATLAB environment, the designed SEPIC in Table 1 was simulated using the switched mode model. Furthermore, it was used to evaluate the proposed controller. The SEPIC model in Simulink/MATLAB 2023a is shown in Figure 6.
Figure 6. Simulated SEPIC model in Simulink/MATLAB. Component description is in Table 2.
Energies 17 03385 g006
Table 2. Description of SEPIC model components in Figure 6.
PWM Generation Block
(1) Duty cycle generated by controller(2) Triangular reference module for duty-cycle comparison and PWM generation
Power Stage
(1) Input voltage source (2) Input inductor L1 with its ESR
(3) Primary semiconductor switch (MOSFET)(4) Capacitor C1
(5) Inductor L2 with its ESR(6) Secondary semiconductor switch (MOSFET) is used instead of diode (synchronous connection)
(7) Output capacitor C2(8) Load (modeled as resistor)

4. Controller Design

The linear controller design is based on a negative feedback loop structure, which implies a relationship between the output (i.e., the sensed states) and the input (i.e., the control variable) to the system. A linear controller can take various forms, such as Proportional–Integrator–Derivative (PID), a phase Lead–Lag controller, a state–feedback controller, and Type-I to Type-III controllers. In this work, an optimal robust state–feedback controller, specifically LQR, augmented with an offline Kalman Filter, typically referred to as LQE, is proposed and designed for the SEPIC. This controller structure is compared to a standard benchmark Type-II controller that is designed specifically for the SEPIC [6,29,30,31,78,79,80,81,82,83,84,85].

4.1. Type-II Compensator

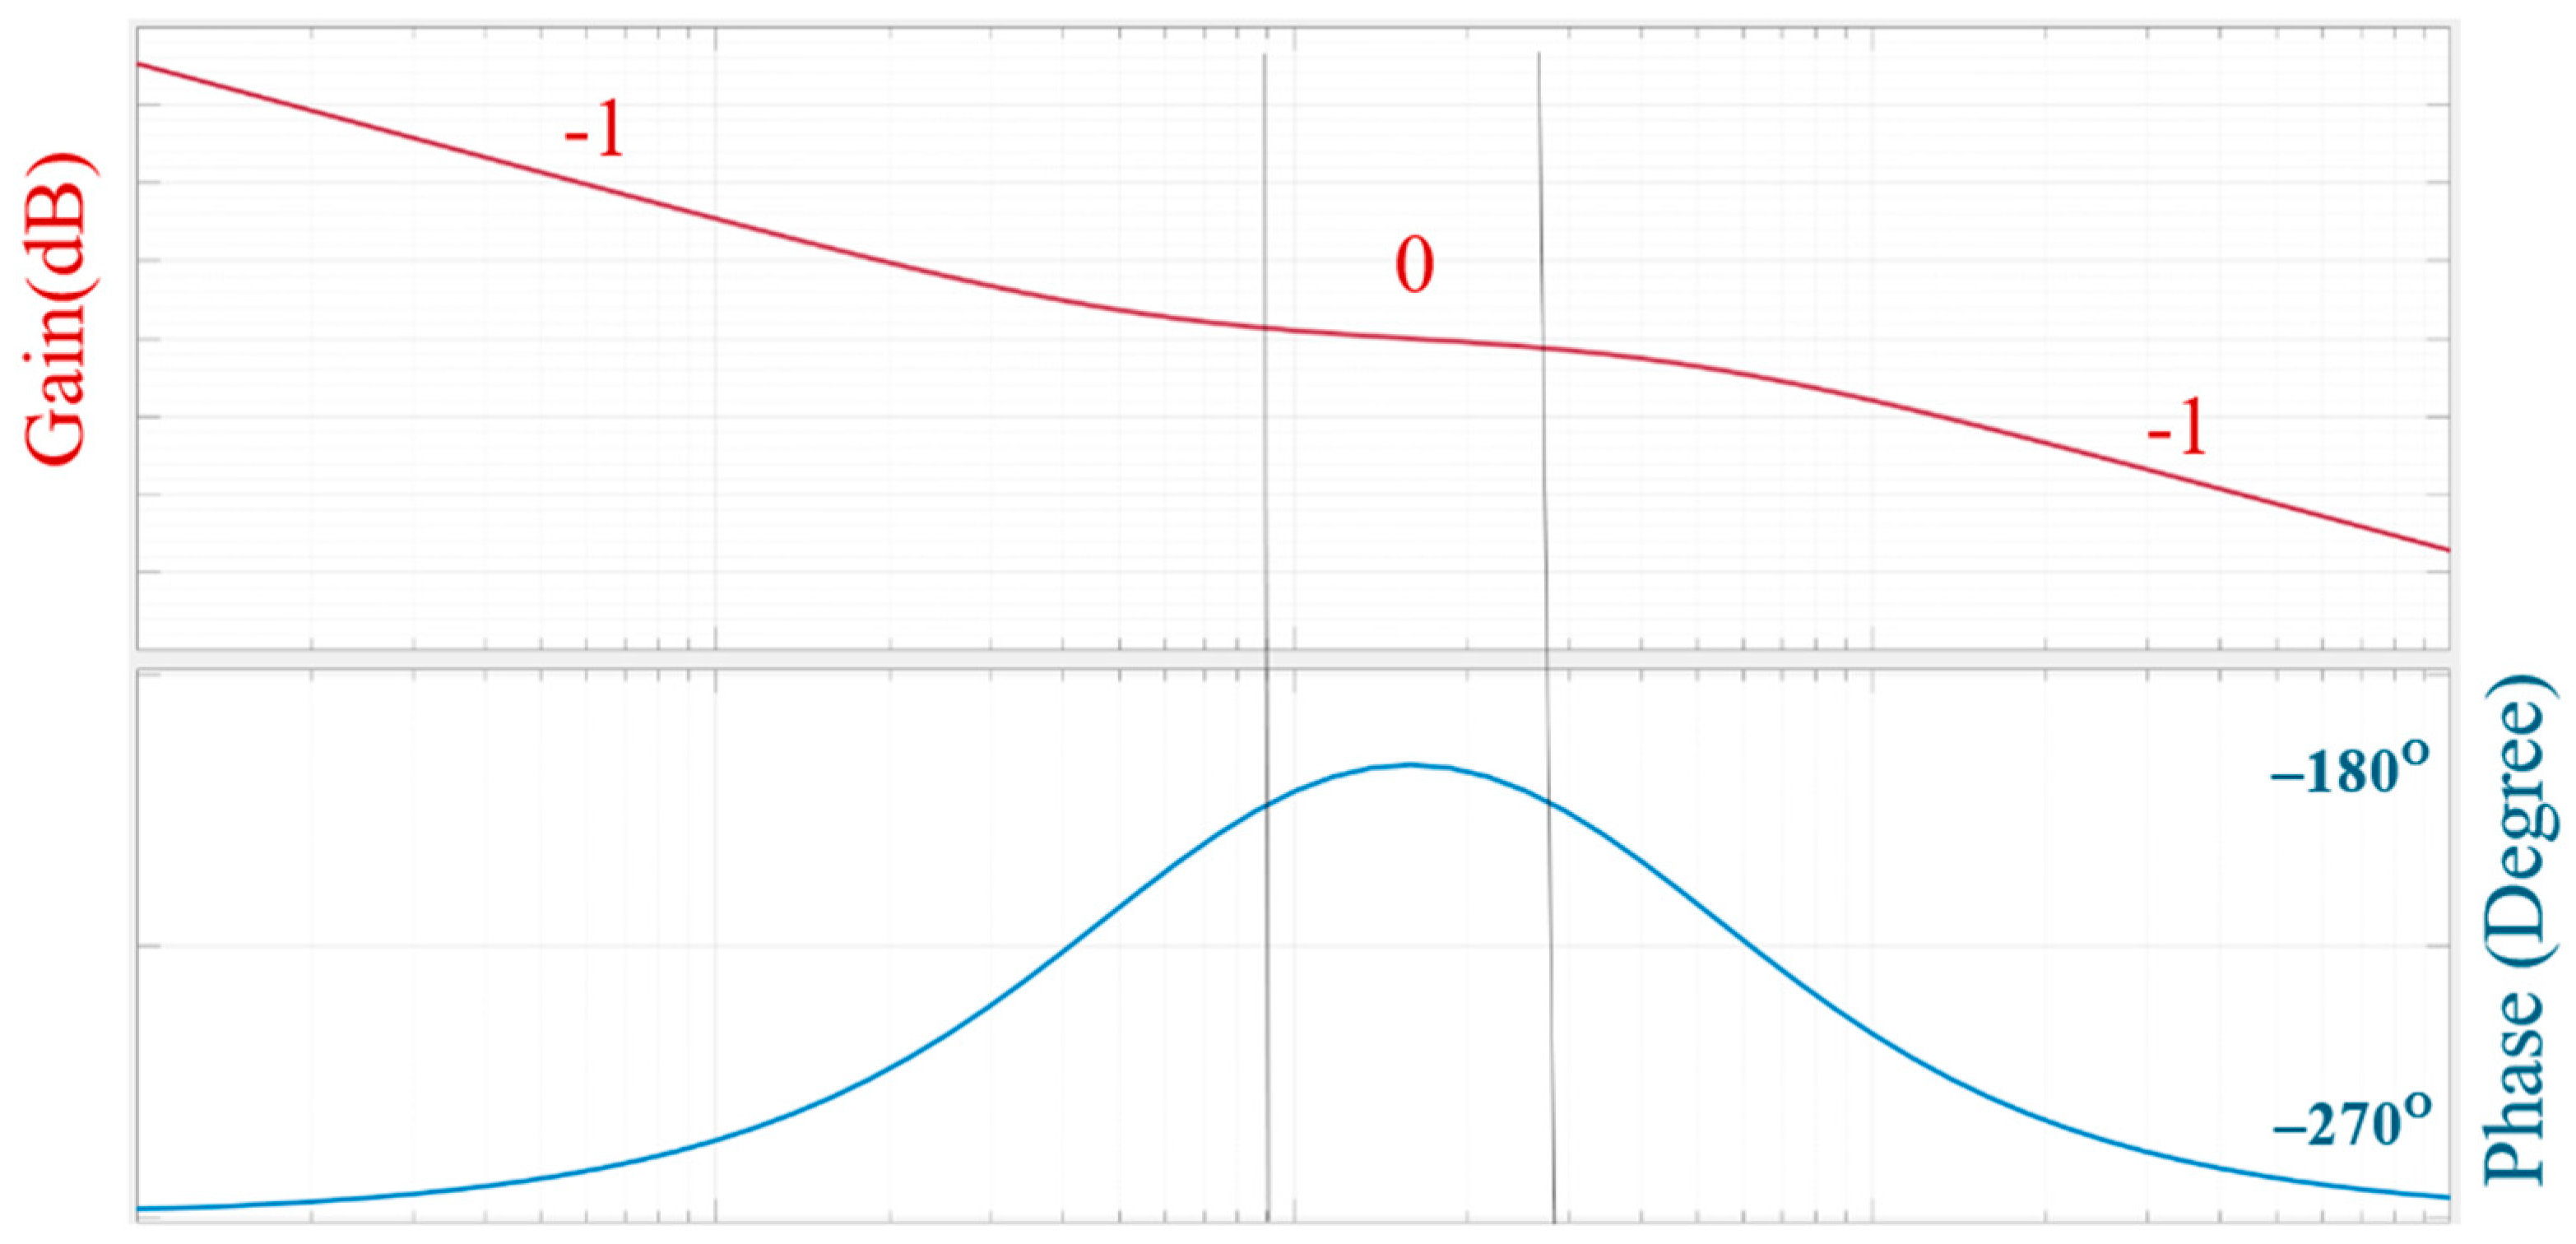
Type-I-III compensators are specifically developed for power converters. Within the scope of this work, a Type-II compensator is considered due to its ability to provide the needed phase compensation for a SEPIC; this phase compensation ability is because of the nature of the Type-II compensator, which comprises one zero, one pole, and an integrator. The placement of the zero–pole pair, as depicted in Figure 7, results in a region of zero gain slope as well as an increase in the phase margin. Considering the depicted Bode plot of a Type-II controller, the maximum phase boost provided by the controller is 90°, and the region of this phase boost is decided by the placement of the zero-pole of the controller.
One of the common strategies to design the controller for a DC–DC converter is to select the loop gain crossover frequency to be at the center of the region where the gain slope is zero. Consequently, the transfer function of the Type-II controller is given in Equation (4):
G c s = K c s · ( 1 + s w z ) ( 1 + s w P ) ,
where K c is the DC gain and it can be adjusted to cover the converter bandwidth. As a key requirement for a Type-II controller, the zero should proceed the poles (in other words, the placement should fulfill the following relationship: w z < w p ). This placement results in satisfying the phase boost requirements. In this work, for the SEPIC shown in Table 1, a Type-II compensator is designed using the K-factor method [29,30,31,80,81,82,83,84,85].
The designed Type-II compensator is given in Equation (5):
G s c o m p = 5997 s + 7.823 × 10 6 4079 s 2 + 7.823 × 10 6 s
Figure 8 shows the open-loop, loop gain, and closed-loop Bode plots of the SEPIC using the designed Type-II controller shown earlier in Equation (5).

4.2. Linear Quadratic Gaussian

The Linear Quadratic Gaussian (LQG) controller is a controller structure that requires the system to be controllable and observable. In other words, an optimal Full-State Controller (LQR) and an optimal Kalman Filter can be developed for a system given that it is full-state controllable and observable. The main advantage of an LQG structure is that it ensures that the feedback structure is optimal after merging the designed LQR and LQE systems. Therefore, in the next sections, the relevant theory, design procedure, and system stability for an LQR are covered. Next, the offline Kalman Filter theory, modeling, and the design procedure are addressed. Finally, further details regarding the LQG system are provided towards the end of this section [53,54,55,56,57,58,59,60,61,62,63,64,65,66,67,68,69,70].

4.2.1. Overview of Linear Quadrature Regulator (LQR)

LQR is a linear controller that is categorized under optimal topologies. The calculation of state–feedback gain using an LQR structure is based on minimizing the cost function. This cost function is defined as an Integral of Square Error (ISE), and it is given as per Equation (6) [29,30,31,81,86]:
J = 0 ( x T · Q ·   x + u T · R · u ) d τ
where x is the state variable and it is a vector of n × 1 ( n is number of states), u is the control input vector, Q is the n × n positive semi-definite or definite Hermitian matrix, and R is the r × r positive definite Hermitian matrix ( r is the number of system inputs).
The cost function shown in Equation (6) is optimized by solving Equation (7) (i.e., the Riccati equation) [29,30,31,81,86]:
A T · P + P · A P · B · R 1 · B T · P + Q = 0
where A is the system matrix, B is the input matrix, Q and R are as defined earlier in Equation (6), and P is the n × n positive definite matrix.
Solving Equation (7) results in deriving the P -matrix. If the Riccati relationship is satisfied (i.e., Equation (7)), then the controller cost function has been optimized. Hence, the gains of the state–feedback system are defined to be [29,30,31,81,86]
K = R 1 · B T · P
where K is the state–feedback vector.

4.2.2. Integral LQR System

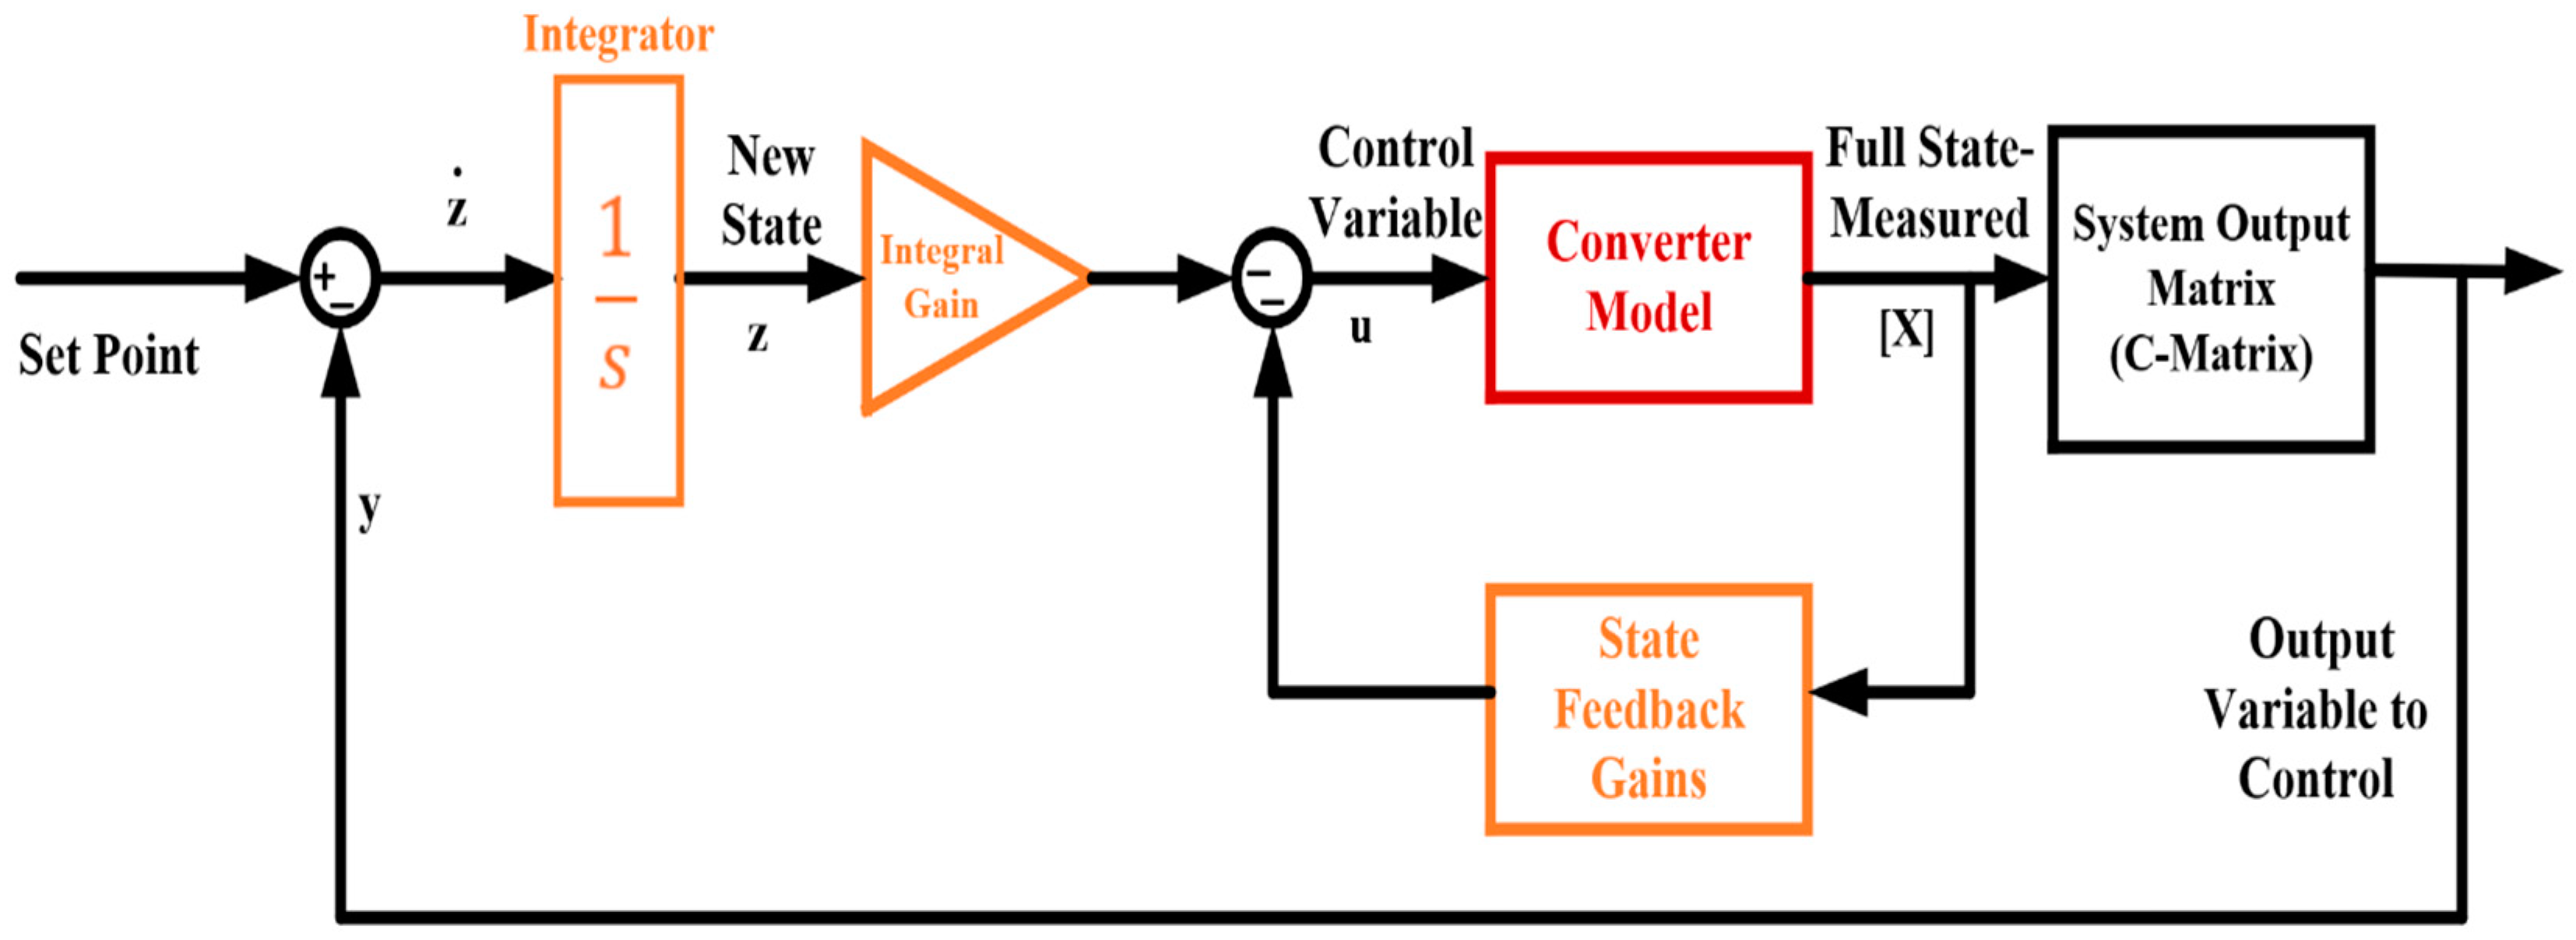
One of the drawbacks of the state–feedback controller is its incapability in some structures like high-order systems to achieve zero-steady error, reject the exposed disturbances, or compensate for system uncertainties. These issues are overcome by merging an integrator with the state–feedback structure. The block diagram of the Integral LQR system is shown in Figure 9 [29,30,31,81,86].
The new system of state equations can be derived from Figure 9 to design the integral LQR controller as follows:
(1)
Introduce a new state variable corresponding to the pole at the origin. Let the new state variable be z .
(2)
In Figure 9, the dynamics (the time derivative) of z is characterized to be
z ˙ = R e f y                   b u t               y = C · x + D · u Therefore ,     z ˙ = R e f C · x D · u
(3)
The control input ( u ) expression can be expanded by investigating the model in Figure 9, as follows:
u = K i · z K · x  
(4)
Considering the generic model of the state–space equation describes a linearized system,
x ˙ = A · x + B · u y = C · x + D · u
(5)
By combining the models in Equations (9)–(11), the new system model in matrix form is given as per Equations (12) and (13) [29,30,31,81,86]:
x ˙ z ˙ = A 0 C 0 x z + B D u + 0 1 R e f y = C             0 x _ z + D · u
The model in augmented notion is
X A ˙ = A A · X A + B A · u + F · R e f     y = C A · X A + D A · u
where
A A = A 0 C 0 ,   B A = B D ,   C A = C             0 ,     D A = D ,   X A = x z , u = K A X A     w h e r e     K A = [ K           K i ]

4.2.3. Integral LQR Controller Design

The first step to design an Integral LQR is to adopt the system model presented in Equation (14):
x ˙ z ˙ = A 0 C 0 x z + B D u + 0 1 R e f
Or, in augmented notion form:
X A ˙ = A A · X A + B A · u + F · R e f
The next step is to define the state–space matrices. The integral LQR controller is a class of linear controller; therefore, the dissected state–space models must satisfy the following two conditions before designing the controller:
  • It must be linear or linearized.
  • The state variables have a relationship with the input variable.
Hence, using the small-signal model in Equation (3), the aforementioned conditions are satisfied [29,30,31,81,86].
The next step is to construct the augmented matrices: A A ,   B A ,   F ,   a n d   X A .
  • Augmented system matrix ( A A ):
As depicted in Equation (14), matrix A A is padded with two zero matrices of ( n × 1 )   a n d   ( 1 × 1 ) , corresponding to the upper and the lower matrices, respectively. This is because the system is designed to introduce an additional pole at the origin and the system is constructed to be Single Input–Single Output (SISO). Because the SEPIC is a 4th-order system, the augmented system matrix ( A A ) dimension will be 5 × 5 .
  • Augmented input vector ( B A ):
The augmented input vector ( B A ) consists of the original input vector ( B ) and the feedforward matrix D . Consequently, the dimension of ( B A ) is 5 × 1 .
  • Augmented output matrix ( C A ):
By introducing an additional pole and having a SISO system, the augmented output matrix will be composed of the original ( C ) matrix padded with an additional zero. Hence, the dimension of ( C A ) will 1 × 5 .
The next step in the design procedure is to define the Q and the R matrices.
As discussed in the previous section, the Q matrix dimension should be equal to ( A A ) , and it should be positive semi-definite.
The SEPIC model is a 4th-order system; hence, the Q -matrix dimension should be ( 5 × 5 ) . To satisfy the positive semi-definite condition, the Q -matrix is assigned to be the diagonal matrix. The Q -matrix is tuned based on the perception that the ith diagonal element is the state-variable weight of importance from the controller objective. Because the priority is to achieve a robust tracking task, the highest value will be assigned to the fifth state variable that represents the error to the system. The second highest weight will be given to the state corresponding to the output voltage as per the tracking requirement. The other variables will be assigned unity values.
In this work, SEPIC is controlled and simulated using the SISO structure. Therefore, the R -matrix is scalar. The R -element is assigned with the highest magnitude. This assignment addresses issues related to generating a control variable that ensures an adequate system transient response and converter operations are met. Based on tuning approach, the values of Q and R matrices are adjusted until the desired response is achieved.
The next step in the Integral LQR design is to solve the optimization problem. That is the Riccati equation, which has to be solved in an analogous manner, as defined earlier in Equation (7). Solving the Riccati equation results in a positive definite matrix ( P ), which is used to derive the state–feedback gains based on a similar approach in Equation (8). In this manuscript, the MATLAB toolbox was used to solve this optimization problem.
  • Designed Integral LQR Controller Parameters:
For the presented SEPIC in Table 1, an integral LQR controller was designed and tuned following the procedure outlined in the previous subsection.
As discussed, the integral LQR controller requires adjusting the state–space representation. The augmented matrices are derived as follows.
Augmented system matrix ( A A ):
0 0 1333.33 1333.33 0 0 0 2666.67 1333.33 0 123456.79 16220.263 0 0 0 16666.67 6711.895 0.004 1085.07 0 0 0 0 1 0
Augmented input vector ( B A ):
288000 288000 540123.45 72916.67 0
Augmented output matrix ( C A ):
0 0 0 1 0
As discussed, the Q -matrix and the R -elements are selected on a tuning basis such that the desired performance is achieved. The Q -matrix and the R -element are given as follows.
Q -matrix:
1 0 0 0 0 0 1 0 0 0 0 0 1 0 0 0 0 0 1 × 10 9 0 0 0 0 0 3 × 10 15
R -element: 2 × 10¹⁴.
As stated, this work used the MATLAB toolbox to optimize the cost function; the designed state–feedback gains are summarized in Table 3.

4.2.4. Stability Analysis

To assess the stability of the LQR system, the Lyapunov function for a Linear Time Invariant (LTI) system will be used. The theory states that a system is asymptotically stable for an LTI system if the necessary and sufficient condition is satisfied, where for any positive definite (P.D) matrix Q , the unique matrix P solution of Equation (15) will be a symmetric positive definite [29,30,31,81,86].
A T P + P A = Q
where A is the system matrix.
In this section, the stability of the system using the designed integral controller is examined and evaluated. Therefore, the system matrix in Equation (15) is defined to be the closed-loop system matrix of the augmented expression in Equation (14). As a result, the A matrix, in Equation (15), will be:
A = A A B A K
where K is the state–feedback gain vector defined by the integral LQR algorithm. In this work, corresponding to designed controller and the simulated SEPIC, the A will be:
1898.57 1081.29 1328.71 1444.47 1115419.20 1898.57 1081.29 2671.28 1444.47 1115419.20 127017.43 244885.68 8.66 208.43 2091889.15 17147.35 16940.43 1.16 1056.93 282405.03 0 0 0 1 0
The next step is to define a positive definite matrix Q ; the Q matrix will be assumed to be a 5 × 5 identity matrix.
By solving the relationship in Equation (15), the P is found to be:
8.051 2.561 0.0822 25.549 0.0493 2.561 3.305 0.0820 9.301 0.0194 0.0822 0.0820 205.05 13.973 0.0041 25.549 9.301 13.97 429.969 0.500 0.0493 0.0194 0.0040 0.500 0.000768
By dissecting the P , it is evident that it is a positive definite matrix. Therefore, according to the Lyapunov theory for the LTI system, the examined system is Globally Asymptotically stable [29,30,31,81,86].

5. State Estimation Theory and Approach

5.1. Overview

One of the prime setbacks in implementing an LQR controller is the requirement to have full-state feedback; hence, an n -number, where n is the number of state variables, of sensors must be used. This constraint is more critical in applications where multiple converters, especially higher-order converters, are required to be used in applications, such as photo-voltaic farms.
The issue of sensing devices’ requirements is typically overcome by using an observers-based system. In the literature, there are linear and nonlinear observer models to estimate the state variables. Among the candidates, the Kalman Filter is one of the popular structures because of its intrinsic ability to estimate the state variable while offering a filtration process over the measured variable.
One of prime strengths of the Kalman Filter is that it can be implemented in various forms depending on the application requirements, such as the Linear Kalman Filter, the Extended Kalman Filter (EKF), the Unscented Kalman Filter (UKF), and other forms. In this work, the scope of work will focus on the offline Linear Kalman Filter.

5.2. Full-State Estimation

5.2.1. Necessary Condition and Requirements

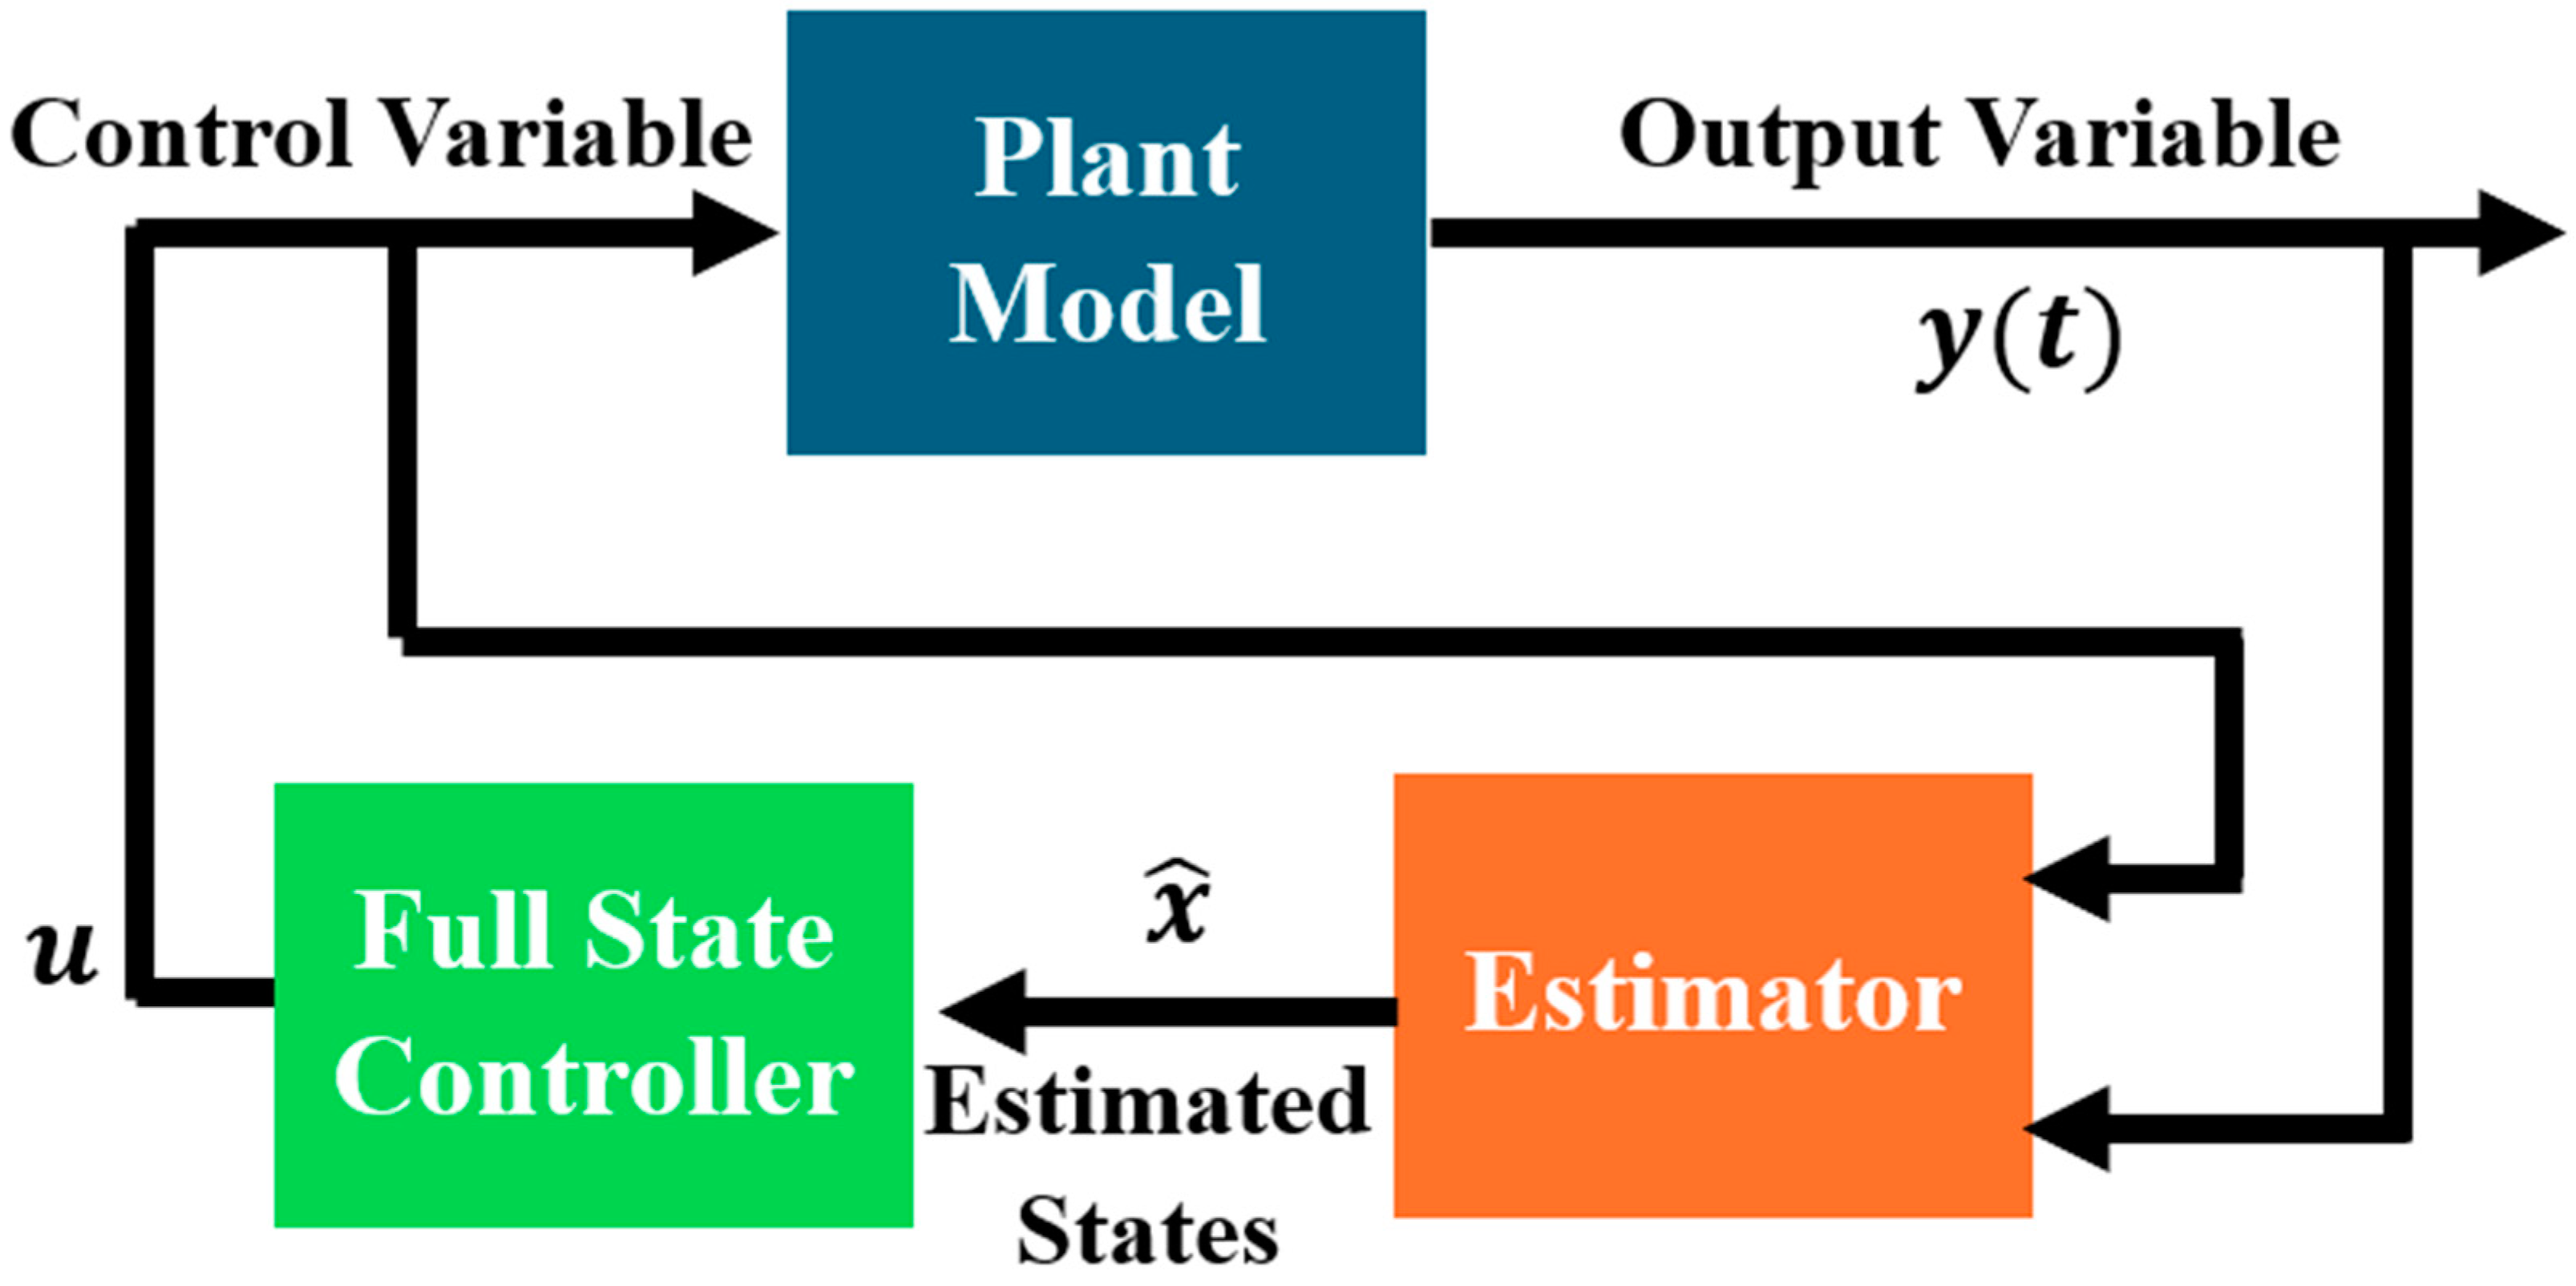
Consider the state–space representation of an LTI system given by Equation (11). Then, the goal is to estimate the state variable x _ ( t ) from the output measurement y ( t ) such that the system can be presented as in Figure 10.
The first necessary condition to design an estimator is to have a full-state observable system. Thus, the observability should be checked prior to designing any observer-based system.
For linear systems, the observability can be studied via a PBH test. Alternatively, as a direct result of the PBH test, the observability matrix ( O ) can state in a crisp structure whether the system is full-state observable or not. Hence, through the PBH test, the system in Equation (11) is observable if, and only if,
R a n k s I A C = n s C
In other words, the system is full-state observable if the matrix in Equation (17) is full-rank (i.e., it spans the entire space R n ) [53,54,55,56,57,58,59,60,61,62,63,64,65,66,67,68,69,70].
The direct result of the PBH test states that the system is full-state observable if the observability matrix ( O ) is full-rank where the observability matrix ( O ) is defined to be:
Observability   matrix   ( O ) = C C · A C · A 2 C · A n 1
If the observability matrix is a square matrix, then the system is observable if O is not a singular matrix. In other words, if the determinant of O is different than zero, then the system is full-state observable.
Using the designed SEPIC parameters as per Table 1, the observability matrix O is constructed for the SEPIC model where the output voltage is the measured state:
O = 0 0 0 1 1.67 × 10 4 1.67 × 10 4 0 1.08 × 10 3 1.80 × 10 7 1.80 × 10 7 2.22 × 10 7 4.33 × 10 7 2.02 × 10 12 6.21 × 10 12 2.41 × 10 10 9.51 × 10 10
Examining the rank of the O matrix shows that it spans the entire space R 4 and it has full rank. Therefore, the system is full-state observable if the output voltage is the measured state.
On the other hand, it should be noted that examining the observability of the augmented system where the state z is introduced results in an observability matrix that is rank-defect because the observability matrix of the augmented system does span the entire space of R 5 and it has rank of 4 where the output voltage is measured [53,54,55,56,57,58,59,60,61,62,63,64,65,66,67,68,69,70].

5.2.2. Measured State Variable Selection Criterion

The next step in designing the state estimator system is to examine the effectiveness of the measured variable. In other words, the designer shall decide which state is the best to fulfill the observability objective. This process is defined as the observability Gramian study [53,54,55,56,57,58,59,60,61,62,63,64,65,66,67,68,69,70].
The definition of the observability Gramian is summarized as follows.
If the presented system in Equation (11) is observable and stable, then there is an observability Gramian that is given by:
W o t = 0 e A τ C C e A τ d τ
The main observation about the observability Gramian is that it converges as time approaches infinity. The solution to the observability Gramian in Equation (19) is not a straightforward case; hence, a Lyapunov equation is proposed such that its solution is the observability Gramian. Therefore, the observability Gramian is given as [53,54,55,56,57,58,59,60,61,62,63,64,65,66,67,68,69,70]:
A W o + W o A + C C = 0
Following the above definitions, the procedure for examining the observability Gramian can be summarized as follows [53,54,55,56,57,58,59,60,61,62,63,64,65,66,67,68,69,70]:
(1)
Construct the system state–space representation by selecting the first state variable as the only output of the system.
(2)
Calculate the corresponding observability Gramian.
(3)
Calculate the determinant of the above derived observability Gramian.
(4)
Repeat the above steps with the second state variable as the system output.
(5)
Keep repeating the process until the determinant of the observability Gramian is calculated for all of the state variables presenting the output variable.
It should be noted that the determinant of the observability Gramian presents the geometric volume of the observable ellipsoid within the defined space. Consequently, the larger the magnitude of the determinant, the greater the volume of the Gramian matrix. From a control perspective, having a system represented with a C matrix that results in the largest determinant of observability Gramian indicates that the selected state variable offers the best signal-to-noise ratio and immunity to noise and system imperfections [53,54,55,56,57,58,59,60,61,62,63,64,65,66,67,68,69,70,71,72,73,74,75,76,77,78,79,80,81,82,83,84,85]. In this work, and using the referenced design of SEPIC parameters, the determinant of the observability Gramian is calculated and summarized in Table 4. It should be noted that the original system matrices were used to fulfill the analysis where the number of states is 4.
The result from Table 4 shows that the state variable ( x 3 ) is the best candidate for observability purposes; however, in this work, the output voltage (i.e., ( x 4 ) state variable) is selected to design the observer system and act as the observer input. This is due to the following points:
  • The LQG system is compared to a standard Type-II controller where the output voltage is taken as feedback. Hence, to hold the comparison, both systems (Type-II and LQG) should use the feedback variable.
  • The LQR controller is designed to be an integral LQR system where an additional state ( z ) is introduced. This structure performs best if the variable of interest (to perform the tracking task) is measured directly such that the measurement is accepted with high fidelity.

5.3. Observer Design

After verifying the observability and selecting the most suitable state variable for observability, the process to build an observer-based system can be started. Considering an observer block diagram as shown in Figure 10, a dynamical response describing the system can be presented in the state–space representation as follows:
d x ^ d t = A x ^ + B u + K f y y ^ y ^ = C x ^
where x ^ is the estimated stated variables, A is the system matrix, B is the input vector, C is the output row, u is the control variable, K f is observer gains, y is the measured state, and y ^ is the estimated measured state.
By re-arranging Equation (21), the observer dynamics can be presented as
d x ^ d t = A x ^ + B u + K f y K f C x ^ = A K f C x ^ + B K f u y
Equation (22) implies that to design an observer where its estimated states ( x ^ _ ) converge to the actual states ( x _ ), then the eigen values of the matrix A K f C must be placed appropriately. In this work, the eigen values of the observer are placed in an optimum location using a Linear Quadratic Estimator approach; thus, the resulted observer system is a static Kalman Filter. Thus, the coefficients of the observer (i.e., the observer gains) are selected via an optimal approach before running the system. While the system is in operation, the Kalman Filter will use the optimal designed gains to estimate the states without online computations [53,54,55,56,57,58,59,60,61,62,63,64,65,66,67,68,69,70].

5.3.1. Kalman Filter Design

To design a Kalman Filter, consider the following state–space representation where a disturbance and noise measurements are introduced, as shown in Equation (23):
d x ^ d t = A x + B u + W d y = C x + W n
where
  • W d is the disturbance acting on the system as well as the model uncertainty. W d is modeled as
    Additive White Gaussian (AWG) noise.
    Has variance V d .
    Has size of n × n .
  • W n is the noise measurement. W n is modeled as
    Additive White Gaussian (AWG) noise.
    Has variance V n .
The above system representation is shown in Figure 11.
It should be noted that the design process of a Kalman Filter depends on the confidence factor in either the plant model or in the state measurements. This implies that if the disturbance acting on the model is expected to be severe or if the model has high uncertainty, then the state measurement should be trusted to be reliable. Alternatively, if the noise acting on the measured state is severe, then the utilized model to derive the Kalman Filter gain should be reliable [53,54,55,56,57,58,59,60,61,62,63,64,65,66,67,68,69,70].
The derivation of the design procedure for a static Kalman Filter gain is started by defining the error between the actual state variable and the estimated ones by the Kalman Filter. This expression is given in Equation (24):
Error   in   Estimation = E = x x ^
Considering the dynamics of the observer to be designed and by taking the time derivative of Equation (24), the following expression is derived [53,54,55,56,57,58,59,60,61,62,63,64,65,66,67,68,69,70]:
d Ε d t = d x d t d x ^ d t = A x + B u A x ^ + K f C x ^ K f y B u = A x x ^ + K f C x ^ x = ( A K f C ) E
The results from Equation (25) imply that the error can converge to zero if the system is observable; hence, if the system is observable, then the eigen values of ( A K f C ) can be placed by choosing K f . The process of Kalman Filter design optimizes the selection of K f values such that the system error between the estimated and the actual state variables is zero. Moreover, the optimized selection of K f balances the system behavior between the existence of system disturbance modeled in W d and the noise measurement modeled in W n . This process of optimization and gain selection is fulfilled by solving an optimization problem where the goal is to minimize cost function I , given as
I = E x x ^ T x x ^
where E is the expected value.
In this work, the cost function is solved using the MATLAB optimization/control toolbox, where the system matrix A , the measured variable given by the C matrix, the covariance disturbance matrix ( V d ) , and the covariance measurement noise matrix ( V n ) are used to calculate the KF gains [53,54,55,56,57,58,59,60,61,62,63,64,65,66,67,68,69,70].

5.3.2. Kalman Filter Dynamical Model

After calculating the observer gains (Kalman Filter gains K f ), the Kalman Filter dynamical model can be constructed with the following state–space matrices representation, as shown in Table 5.
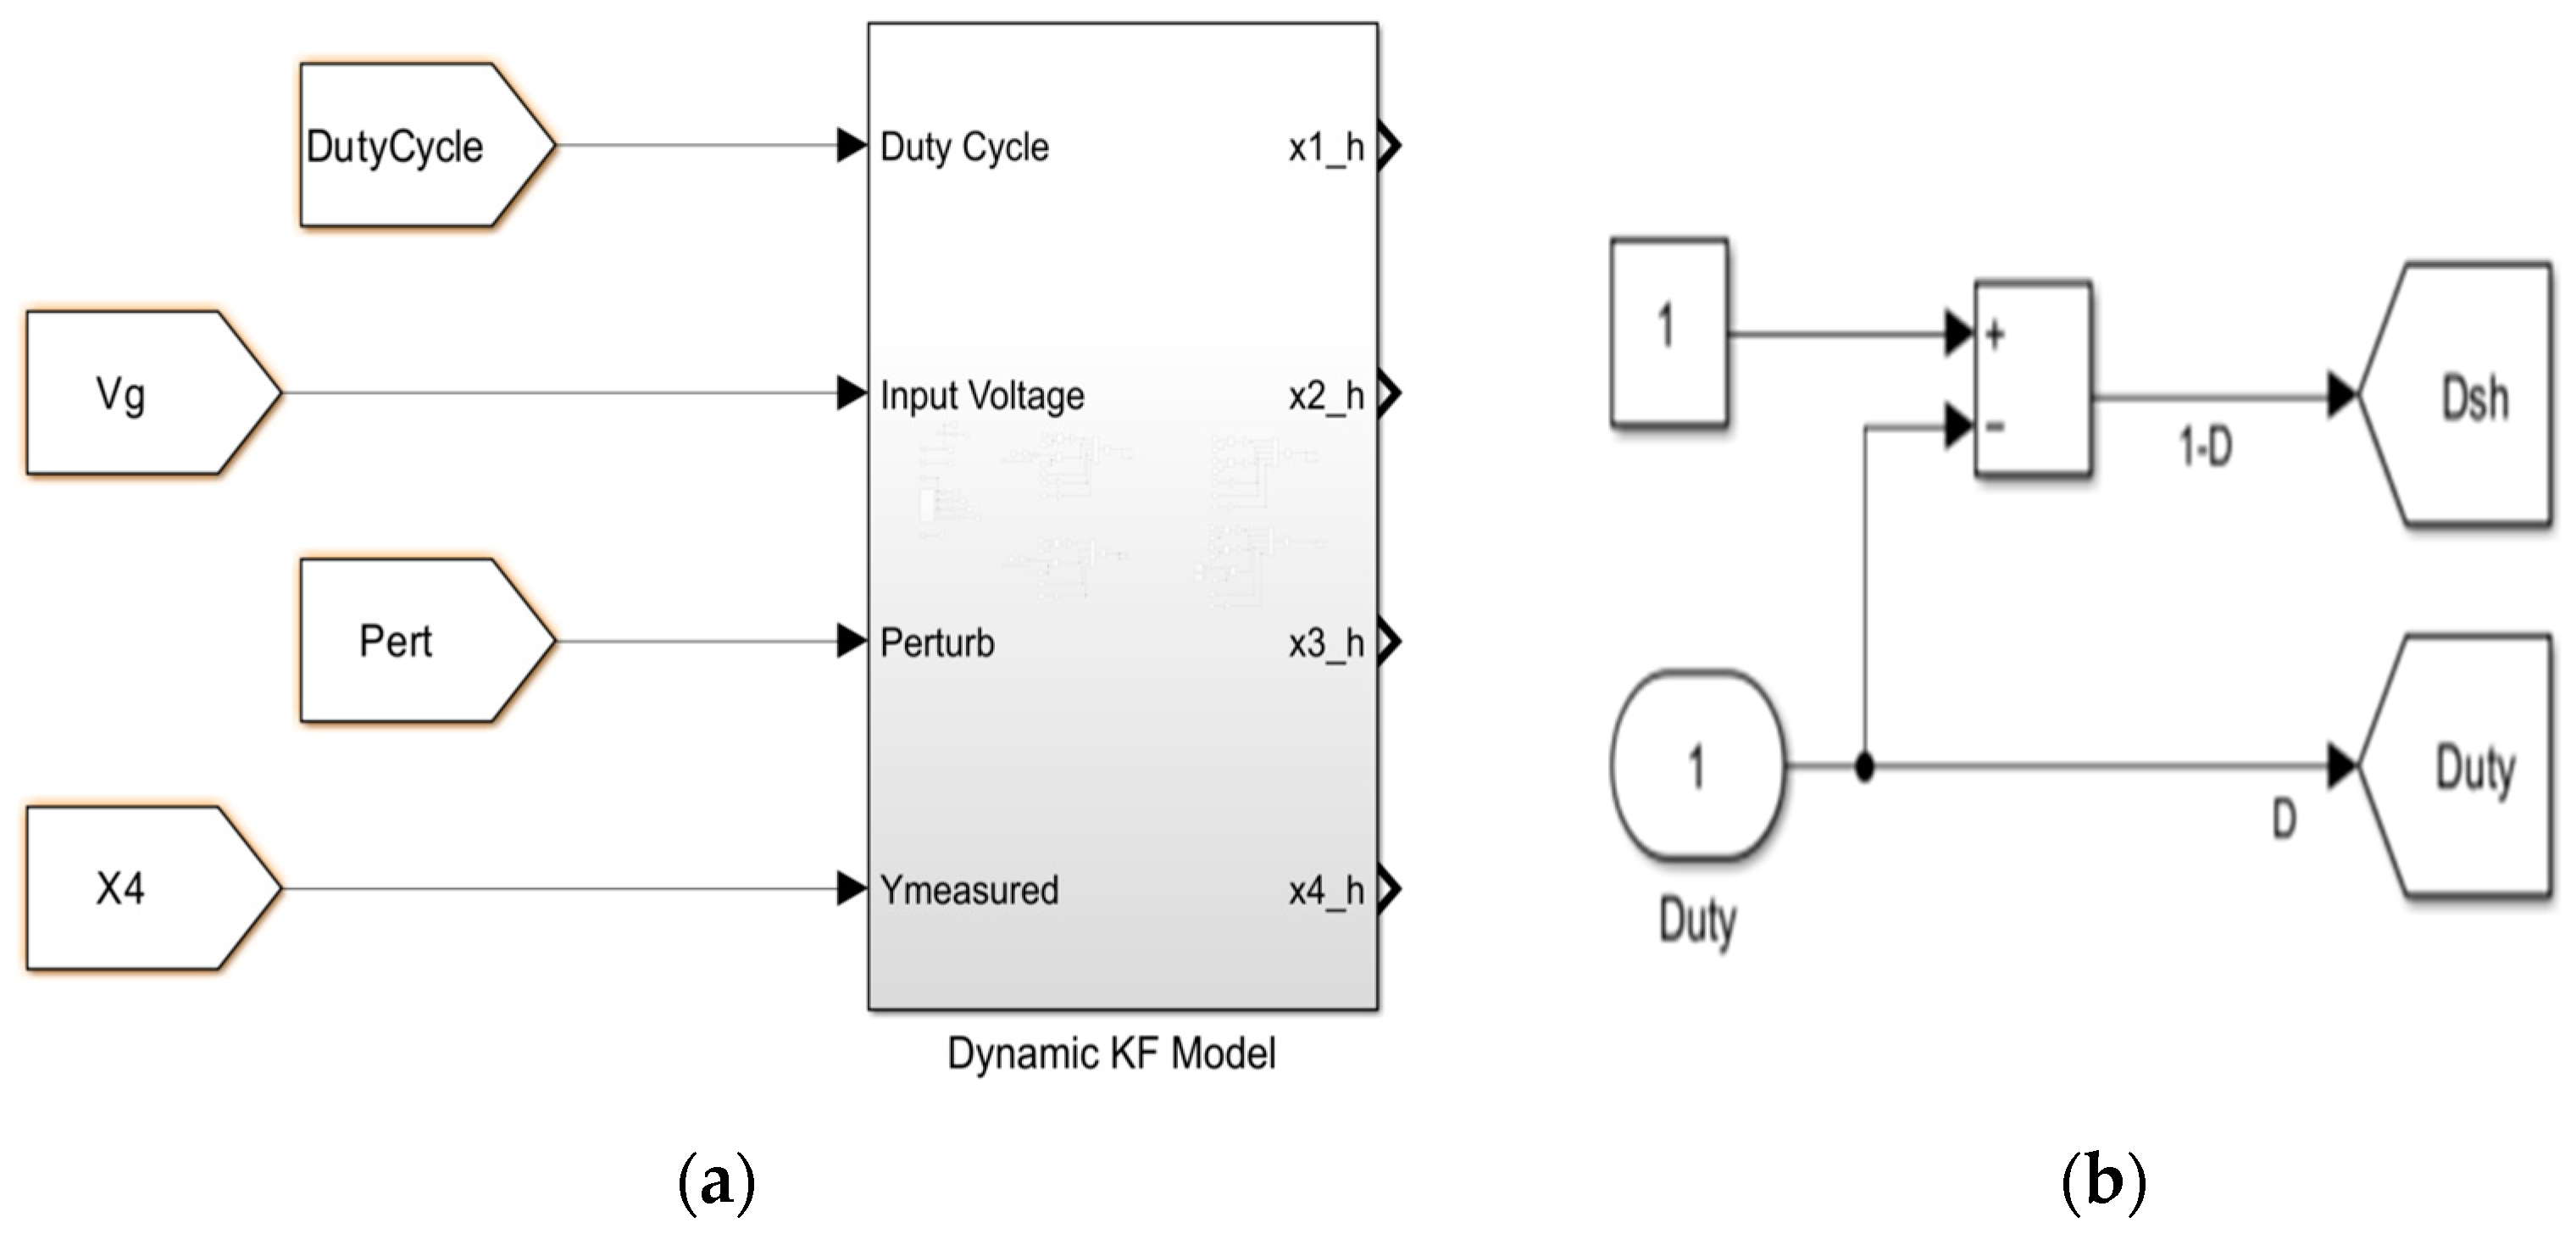
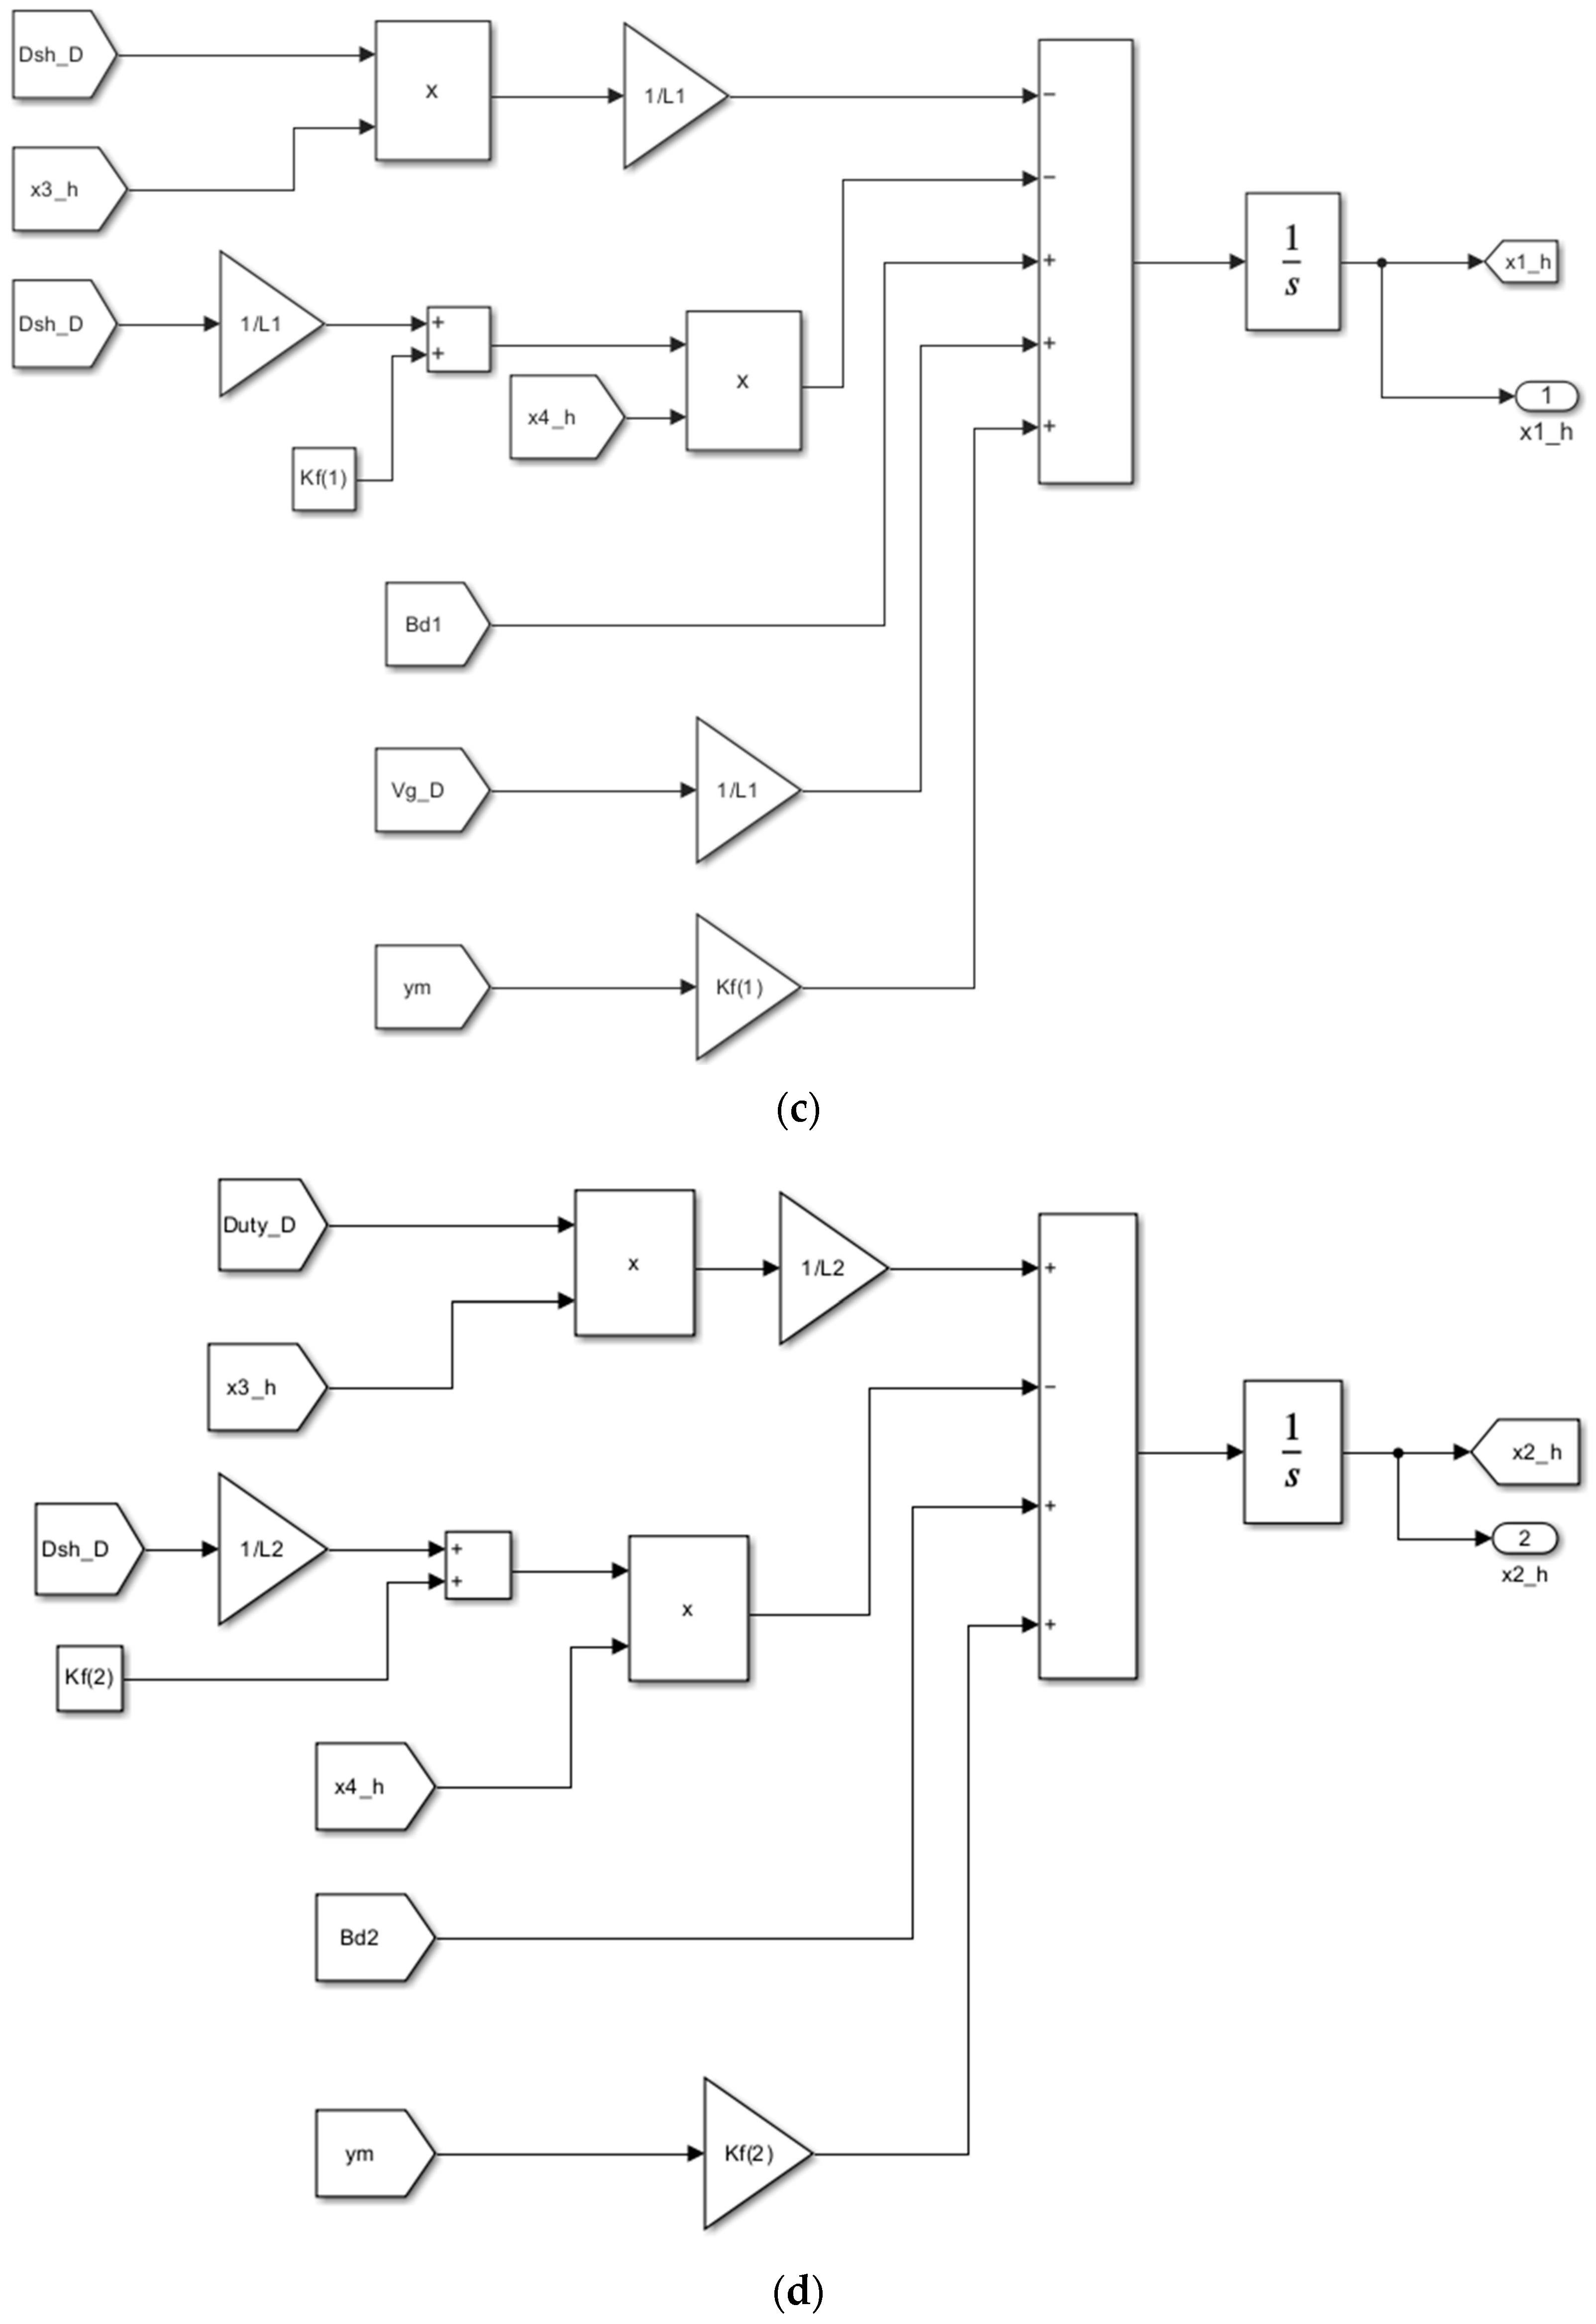
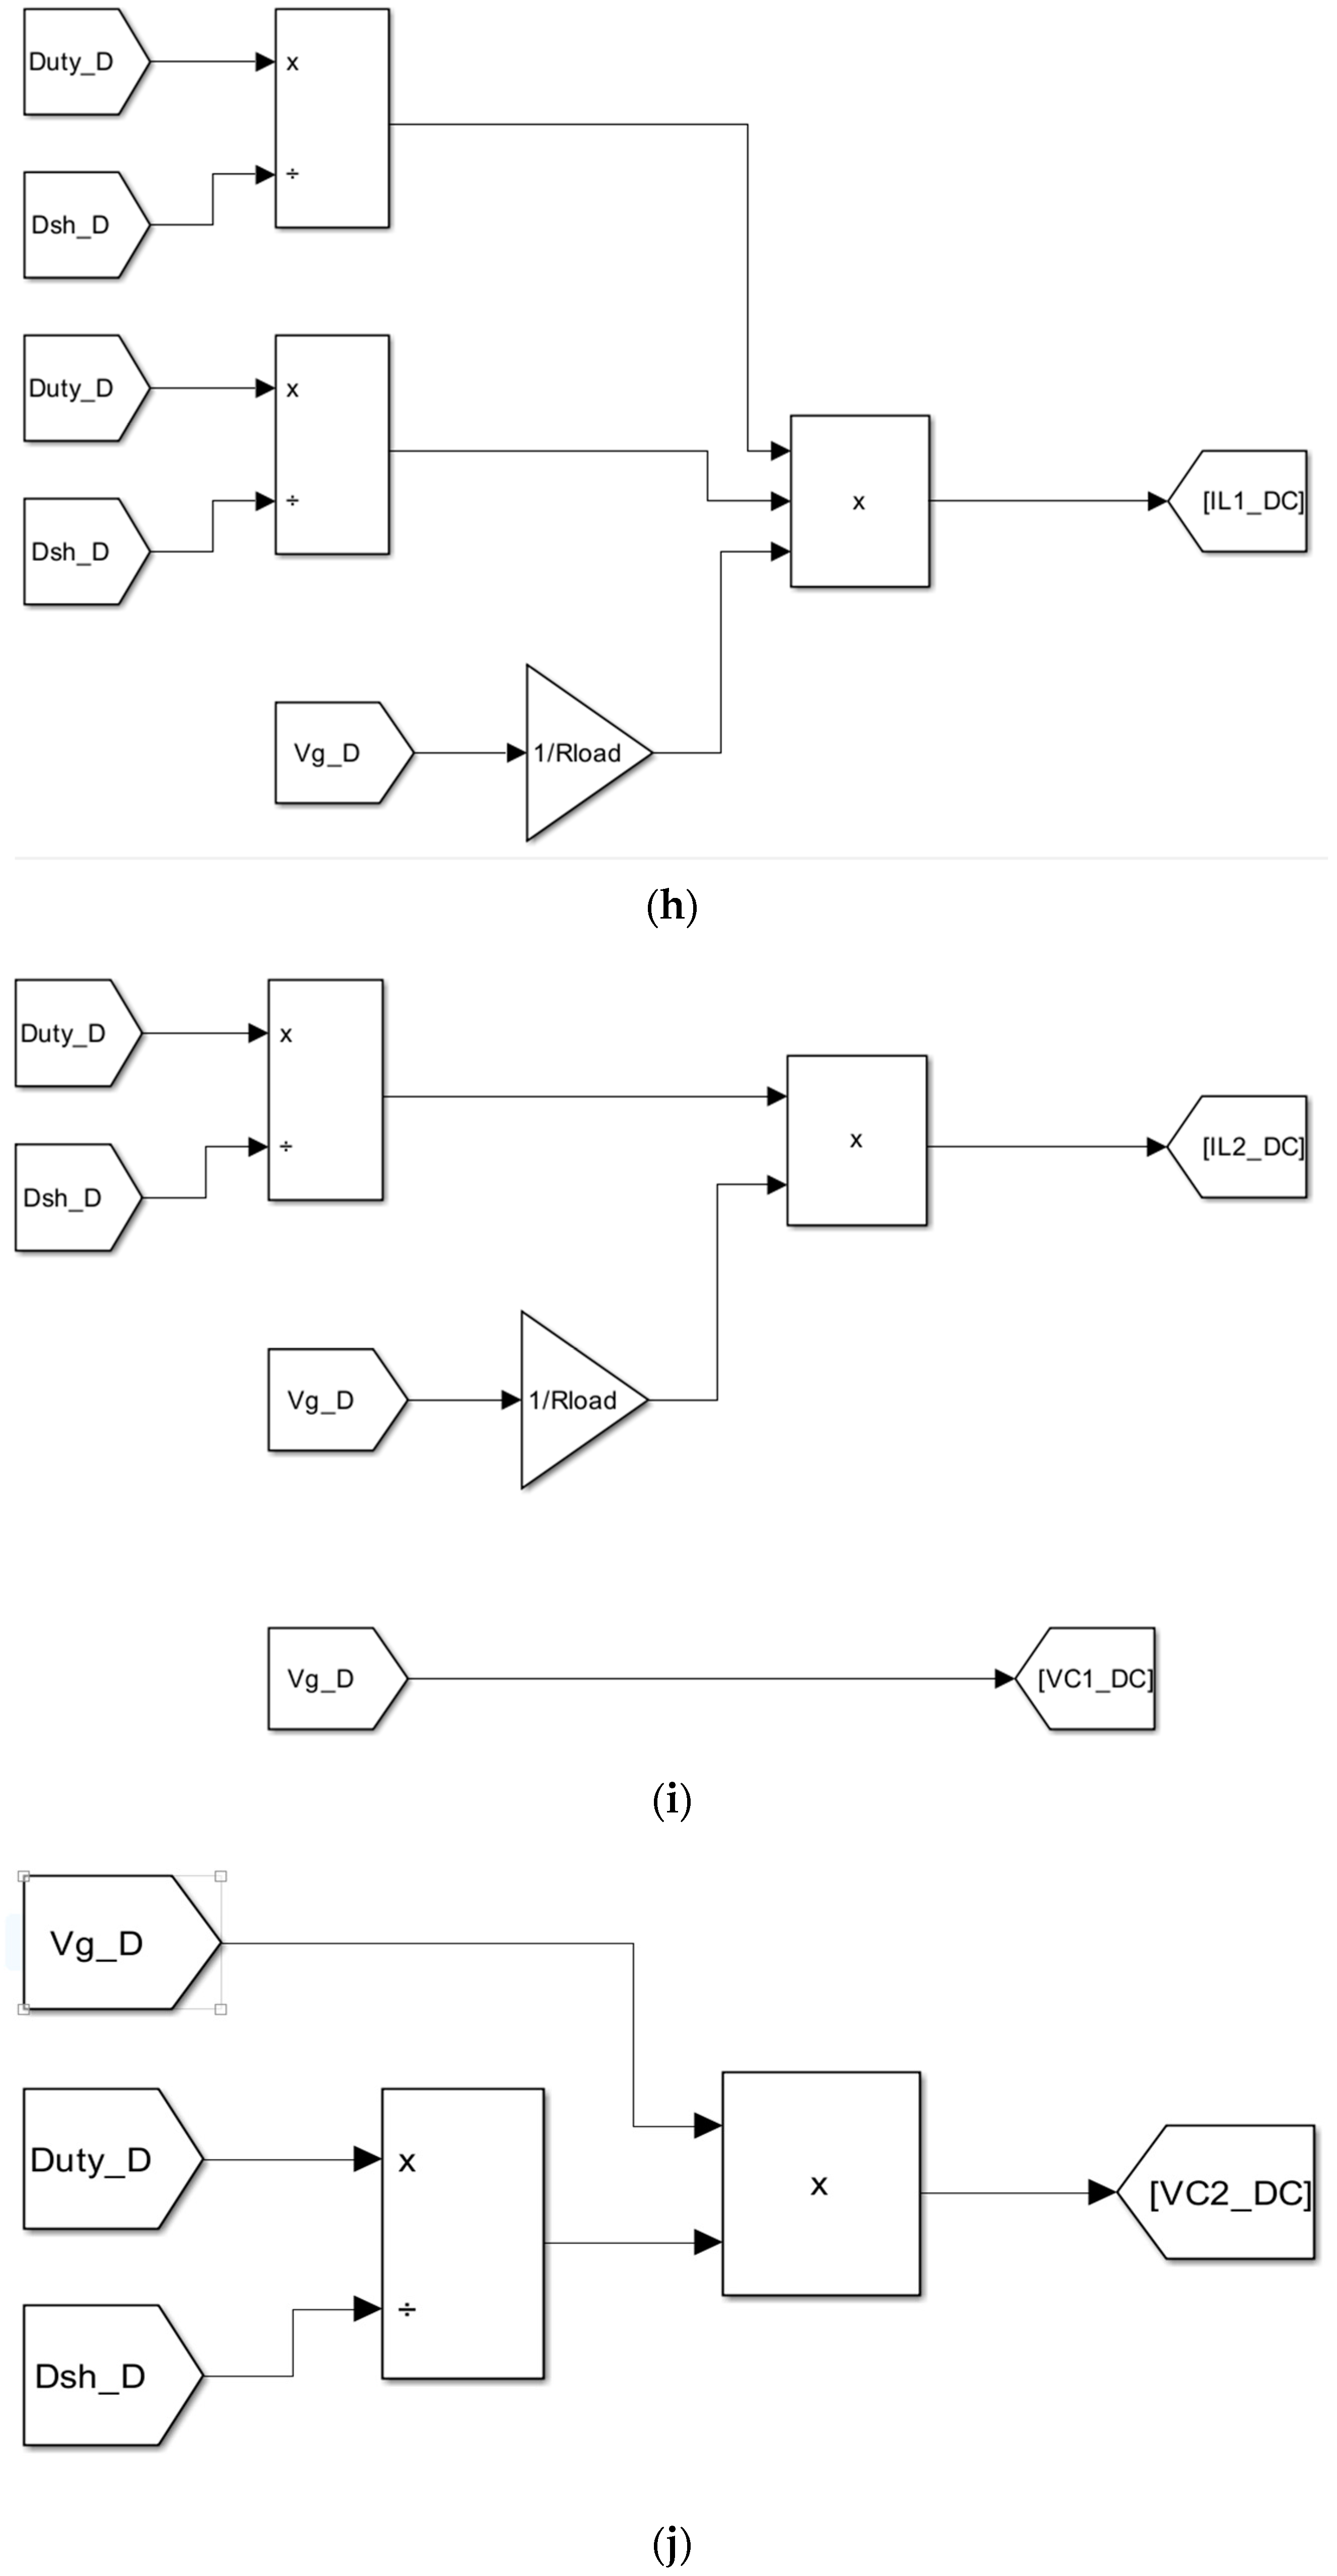
The state–space model shown in Table 5 has a limitation in physical implementation and in simulation using the MATLAB/Simulink environment. This is because the input to the system is a small perturbation while the steady-state duty cycle is incorporated into the system matrix A K f ; therefore, the generated duty cycle signal from the LQR controller is unable to drive the model in Table 5 directly using the state–space block in MATLAB/Simulink. To overcome this limitation, the dynamical model of the Kalman Filter is re-built from basics in the Simulink/MATLAB environment, where the system matrix A K f is re-arranged such that the generated duty cycle by the controller is a separate virtual input to the system matrix A K f and it corresponds to a quiescent duty cycle term. Furthermore, the input voltage to the converter is made to be a dynamic input to the vector B u . The block diagram representing this re-arrangement and the dynamical construction model for state x i are shown in Figure 12.

6. Linear Quadratic Gaussian (LQG)

As discussed earlier, an LQG is a controller structure that results from merging an LQR controller with an LQE estimator. To build the LQG system, the following two points should be addressed:
  • Design controller gains for the LQR such that the system poles (i.e., system eigen values) are placed in the desired location to obtain the desired response.
  • Design estimator gains of the LQE such that the system poles (i.e., eigen values) are placed in the desired location to obtain converged estimated states.
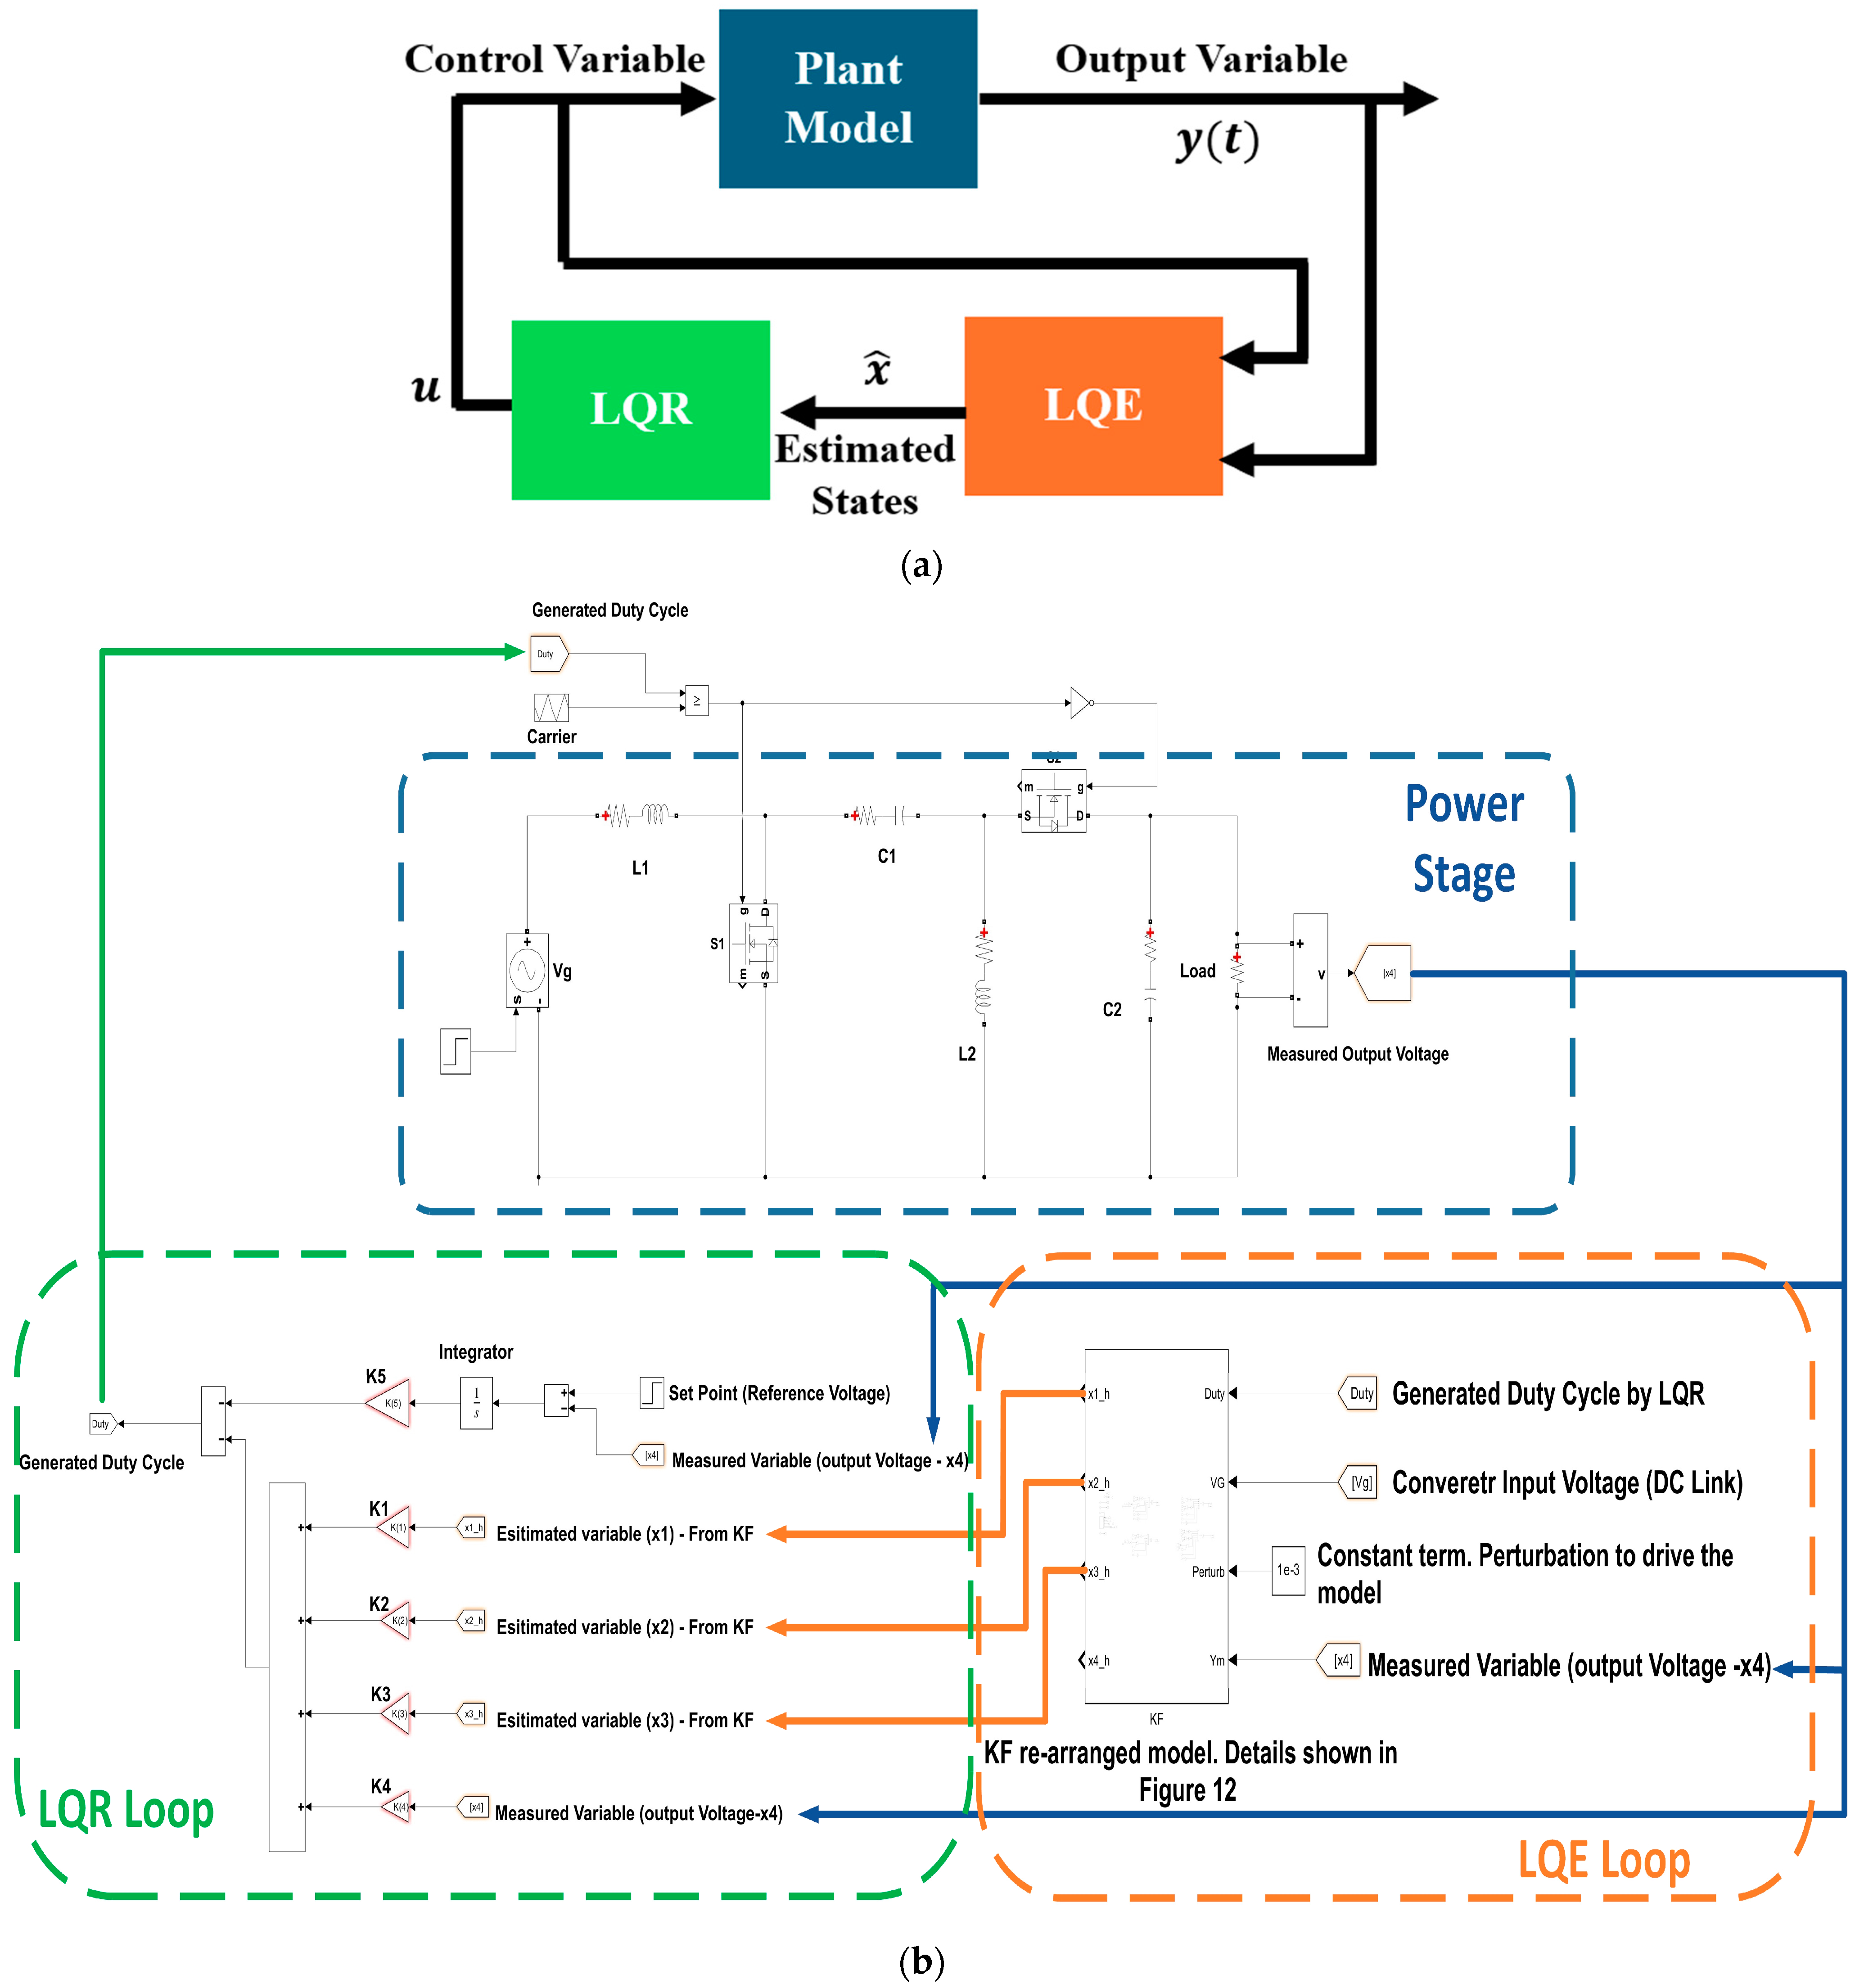
It should be noted that the main advantage of the LQG system is that it ensures that by combining the LQE and LQR the designed dynamics are preserved. Hence, the LQG system can be defined as a linear controller that is based on optimizing the quadratic cost function with Gaussian disturbances and noise. Figure 13 depicts the block diagram of merging the LQR and the LQG for a linear system [53,54,55,56,57,58,59,60,61,62,63,64,65,66,67,68,69,70].
The dynamical model of the LQG system can be derived as given in Equation (27):
d d t x E = A B · K r B · K r 0 A K f · C x E + I 0 I K f W d W n
The main result from Equation (27) is that the system follows a separation principle, which implies that the LQR controller and the LQE estimator can be designed separately and then they can be combined together without impacting the system dynamics [53,54,55,56,57,58,59,60,61,62,63,64,65,66,67,68,69,70].

7. Results

7.1. Estimated States vs. Measured Variables

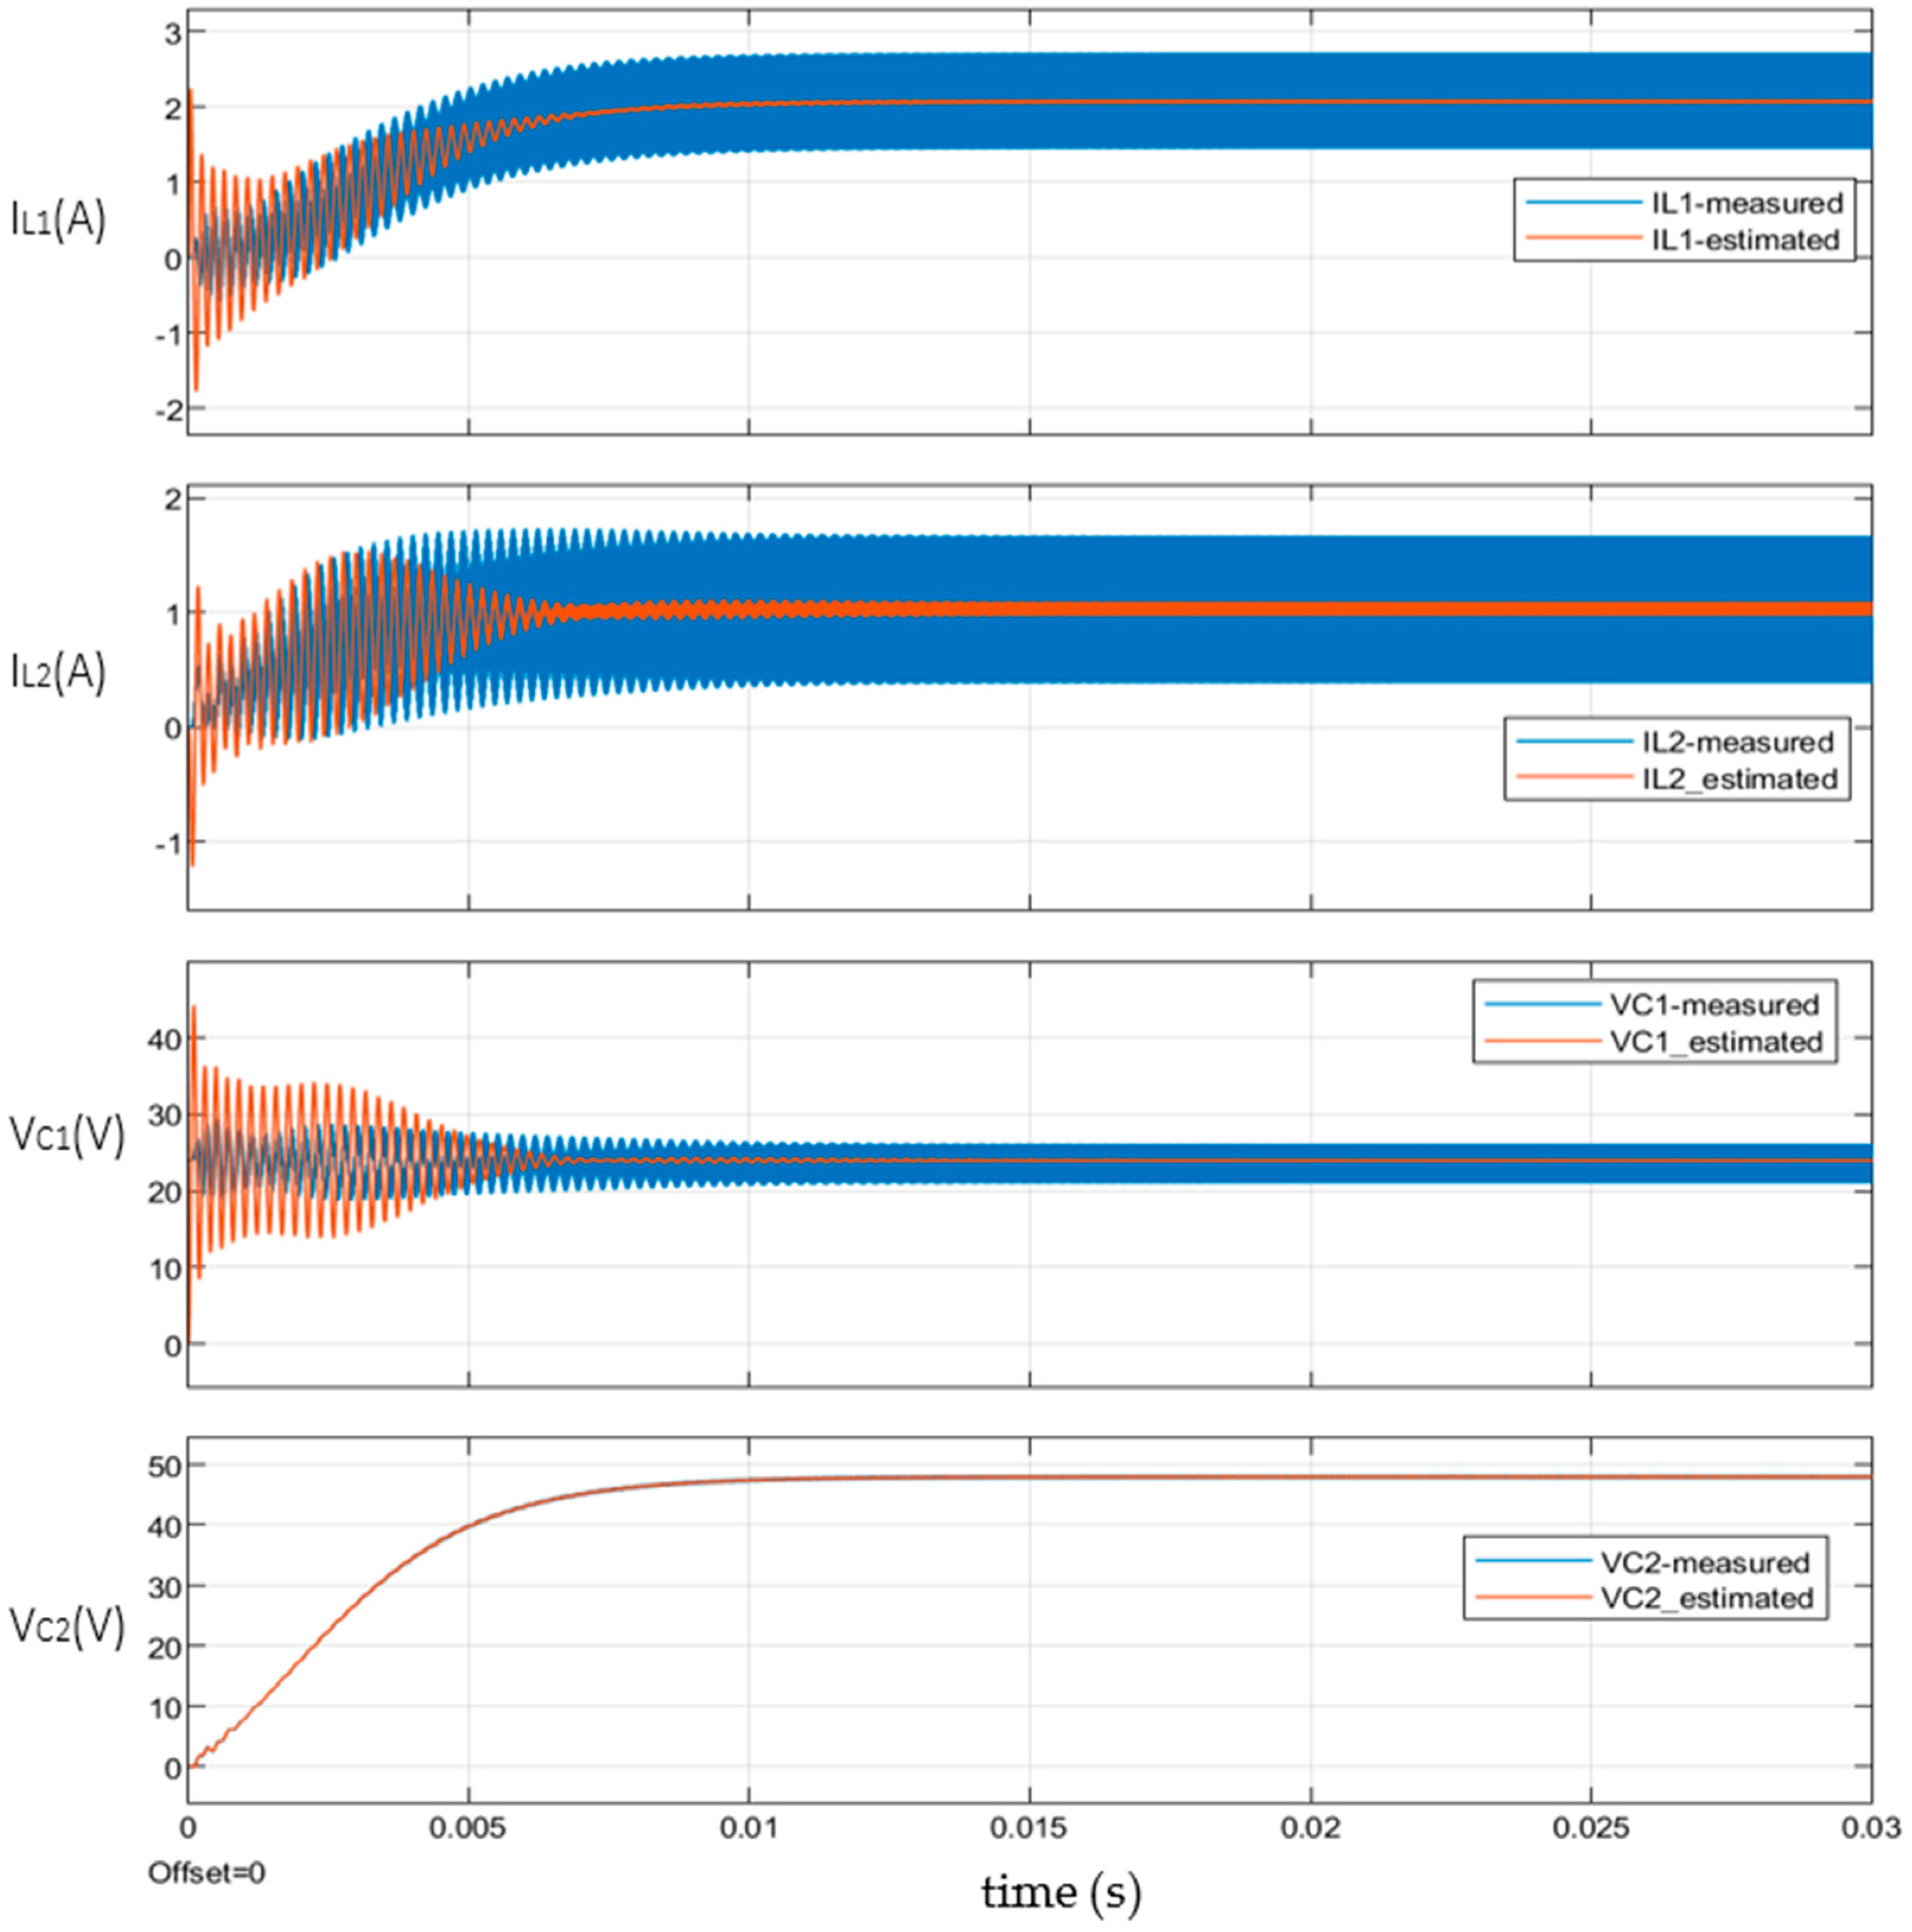
The first step in the design verification phase is to compare the estimated states generated using the Kalman Filter versus the actual measured ones. As shown in Figure 14, following the designed system in previous sections, the simulation results show that the Kalman Filter has superior performance in estimating the converter states. The results show a precise estimation for the converter output voltage (the objective of the controller is to control the output voltage). Furthermore, the other estimated states converged to the effective true value where the actual states witness ripple. In other words, the Kalman Filter is offering an accurate filtered estimation for the converter variables. It shall be noted that the estimation required less than 5 ms to converge. These results provide validation that the design is successful, and the design is ready to be compared to other controller structures (the Type-II compensator).

7.2. Test Metrics and Comparison

After validating the ability of the LQG system to converge to the estimated state to the actual states and drive the system to perform the tracking task, the LQG system is compared in this section with a benchmark Type-II compensator. The comparison process involves three main tests: cold start, input voltage disturbance and load disturbance. It should be noted that the LQG system uses one measured variable (output voltage state), just like the Type-II compensator, where no additional state sensors are needed due to the estimator block in the LQG design. The only additional measurement that the Kalman Filter needs is the converter input voltage. Typically, this value is monitored for safety purposes and for the State-of-Charge (SOC) algorithm; hence, this work will use this available information in the design.

7.2.1. Cold Start Test

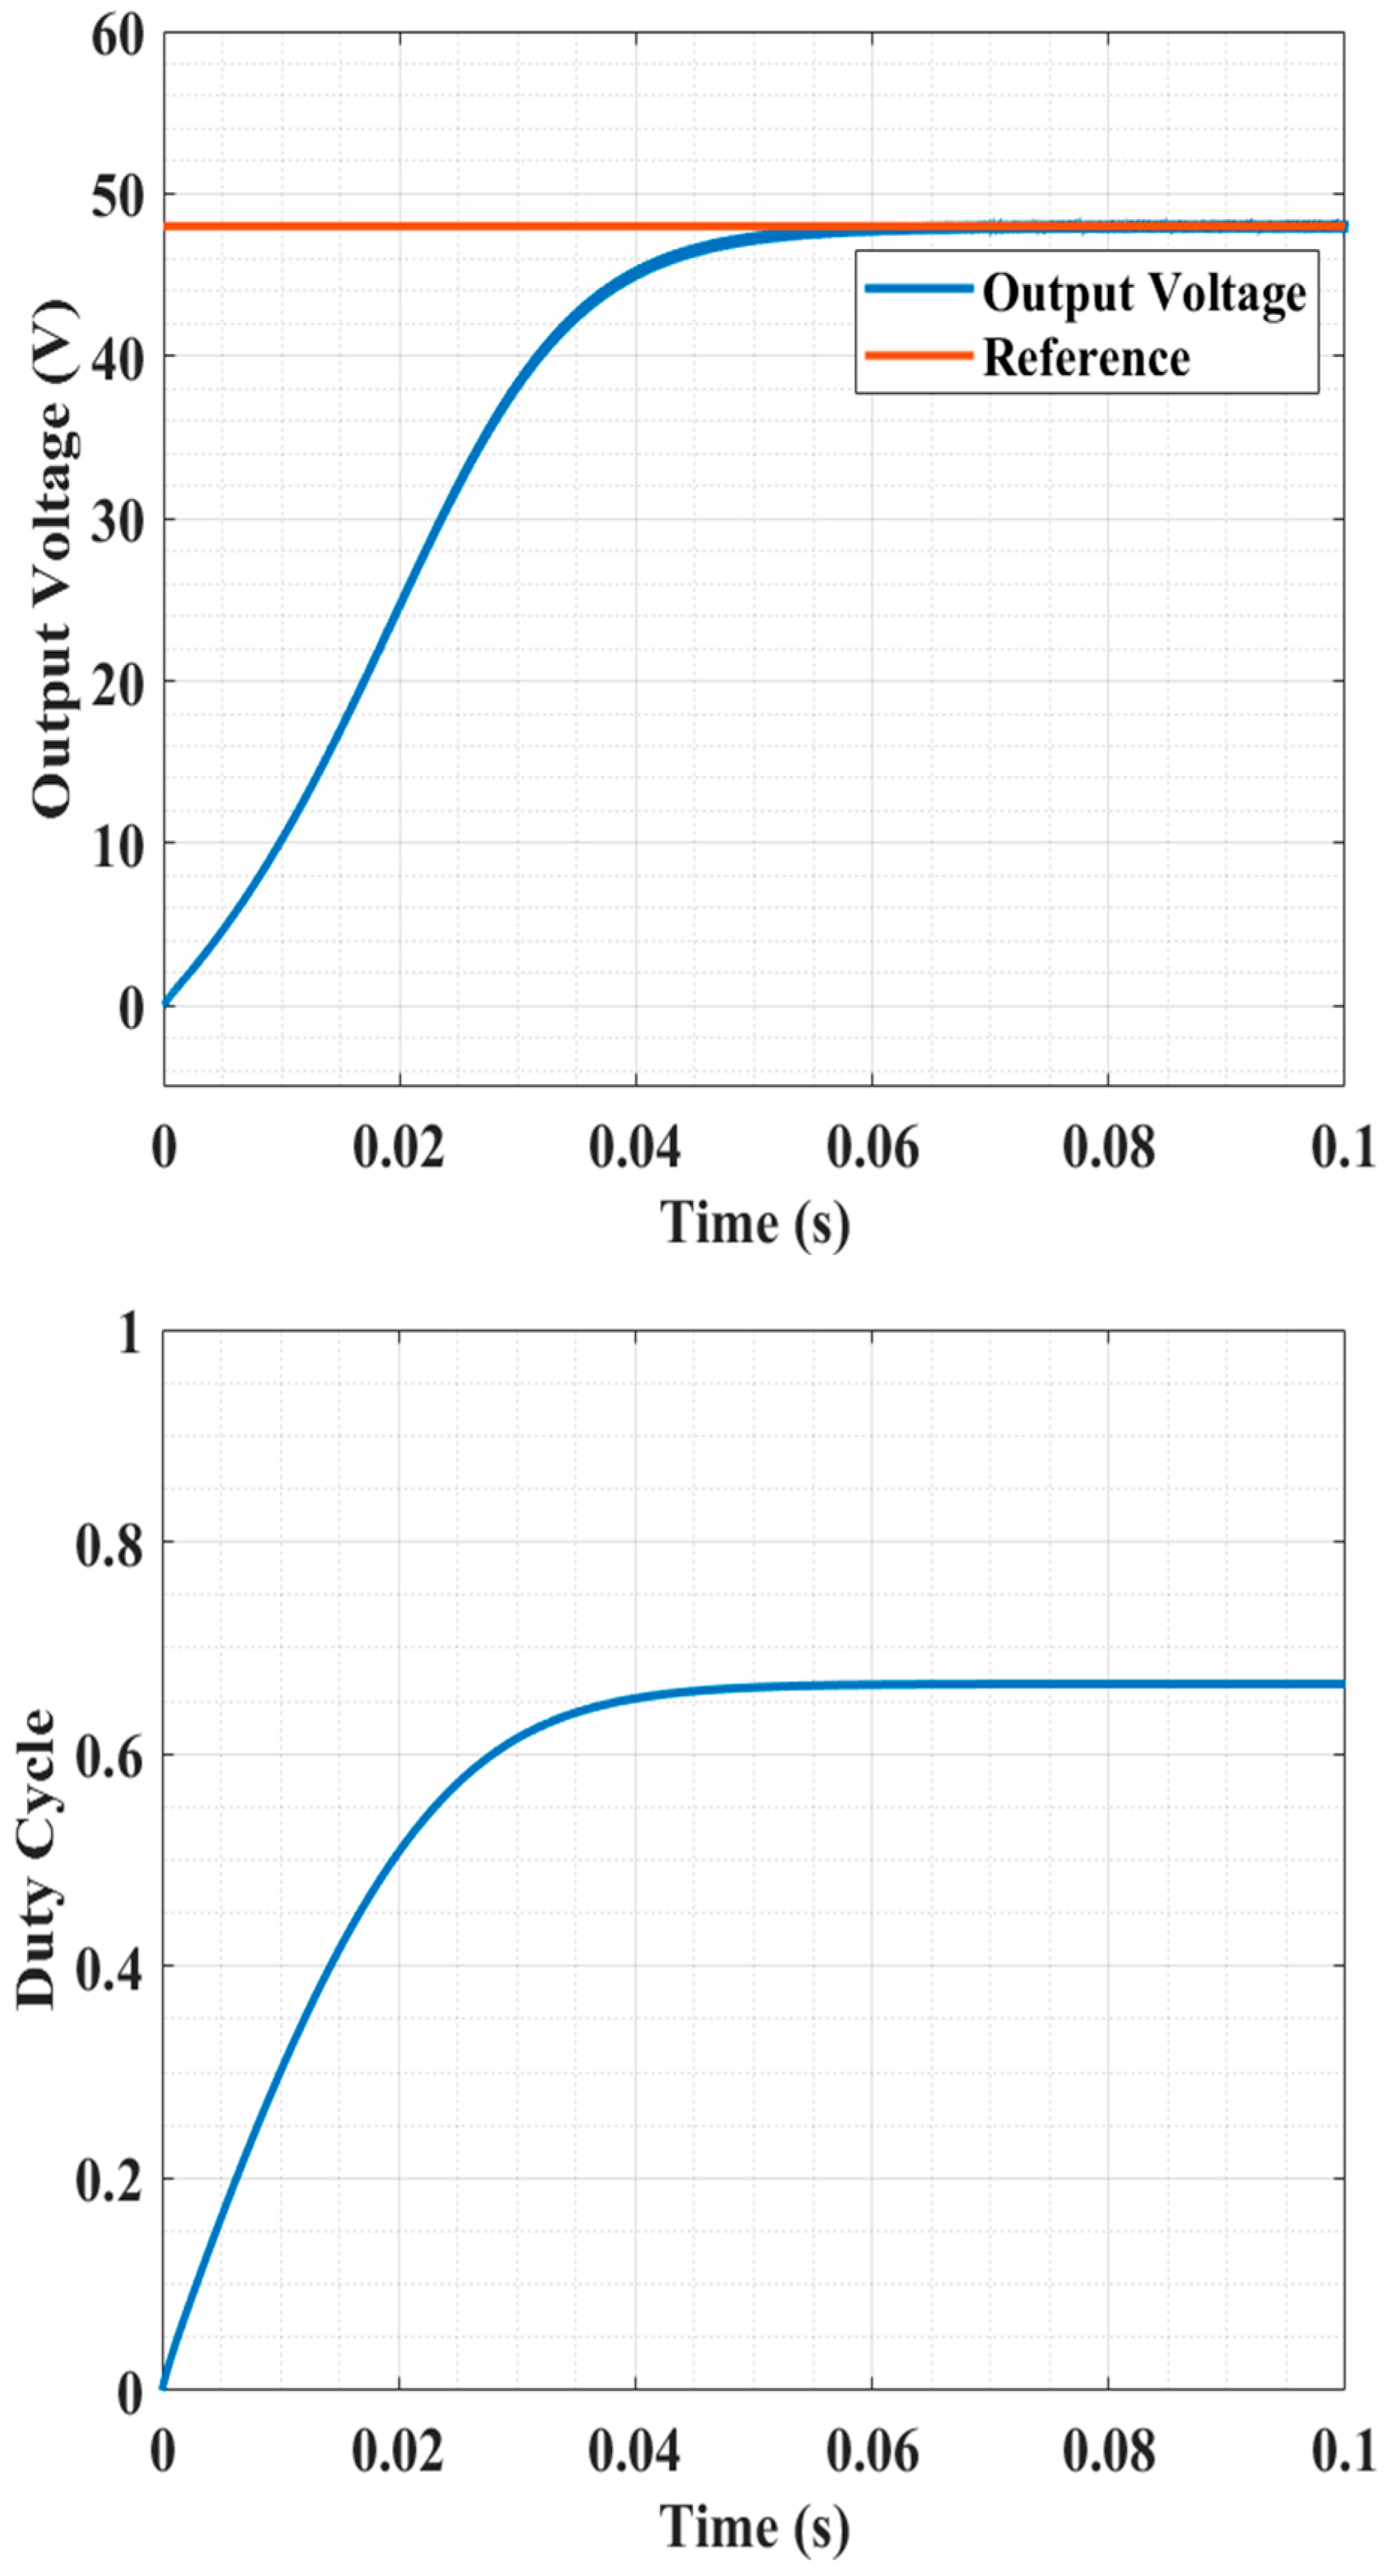
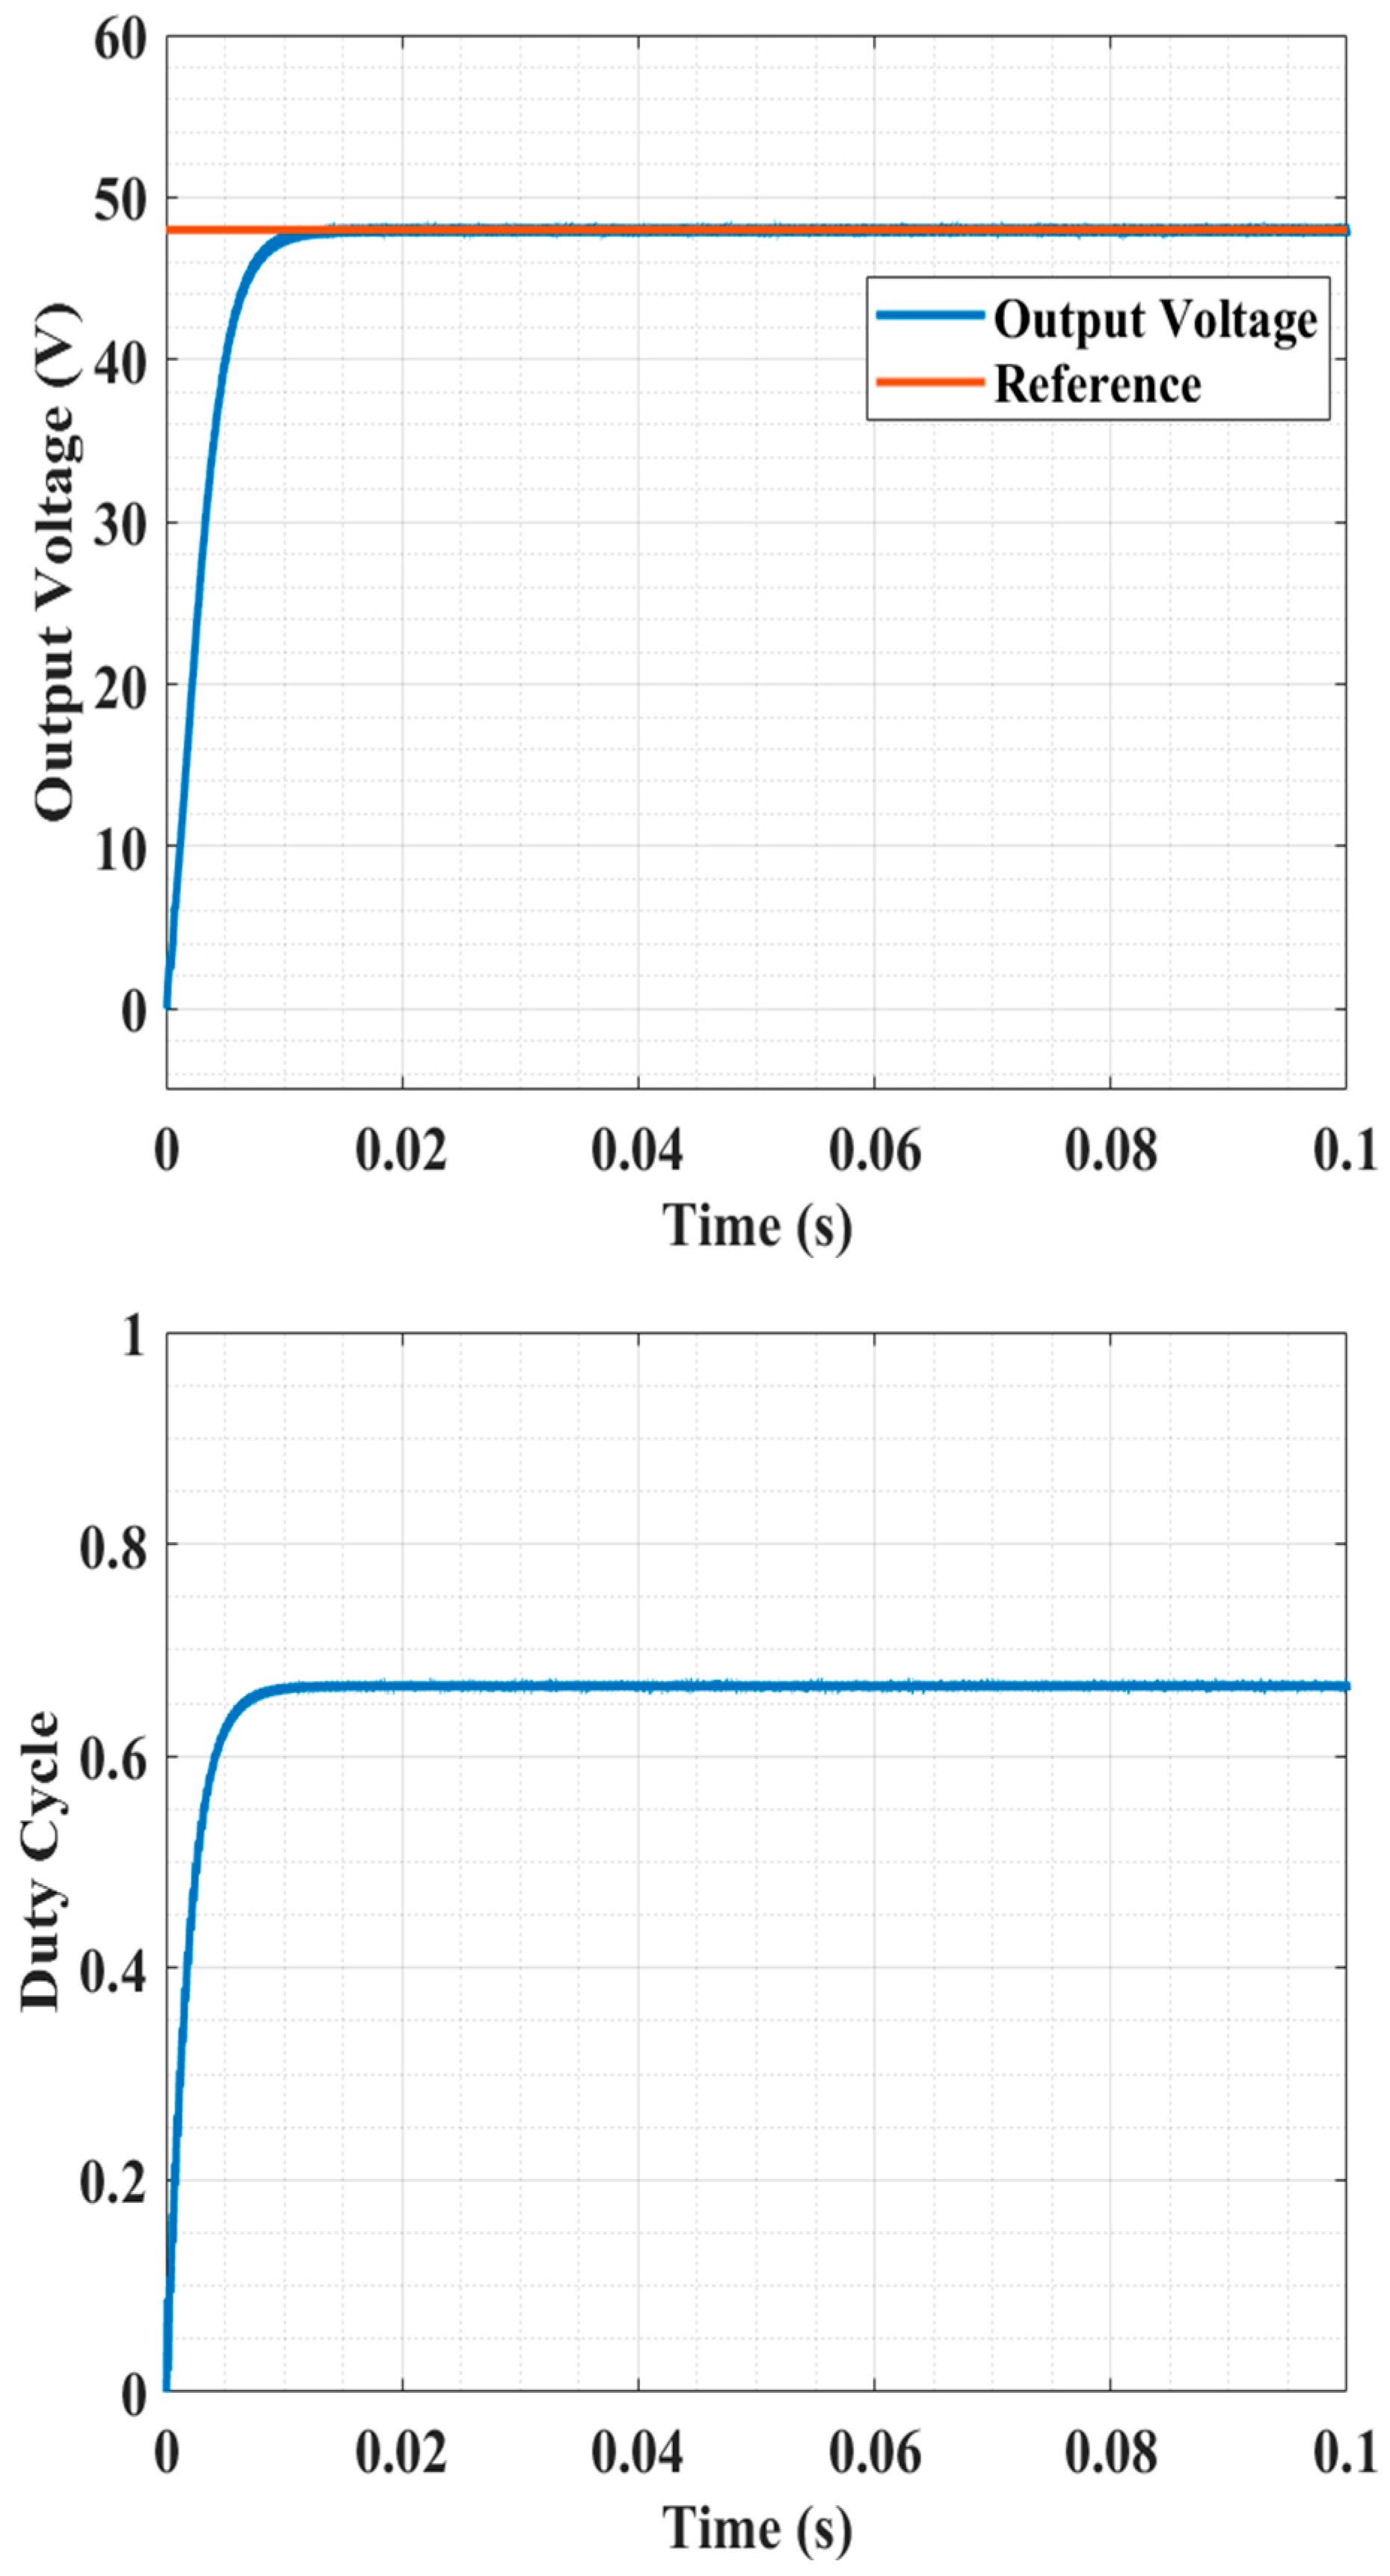
In this test, the converter was started from a zero initial condition. The objective of this test is to assess the dynamic response and the required settling time to reach the desired output voltage (perform the tracking task). The results in Figure 15 and Figure 16 summarize the test outcomes. The results in Figure 15 show the converter-simulated output voltage and the controller duty cycle (D); the response is overdamped, and it required 0.05 s to reach the steady state. Nevertheless, as in Figure 16, the LQG system required 0.01 s to reach the desired output voltage at 48 V while maintaining the overdamped response. In other words, the LQG system offers a response that is 5 times better than the benchmark Type-II compensator. Also, the duty cycle, as per Figure 16, has a very low ripple, which confirms the success of the design approach.

7.2.2. Disturbance Test at Input Voltage

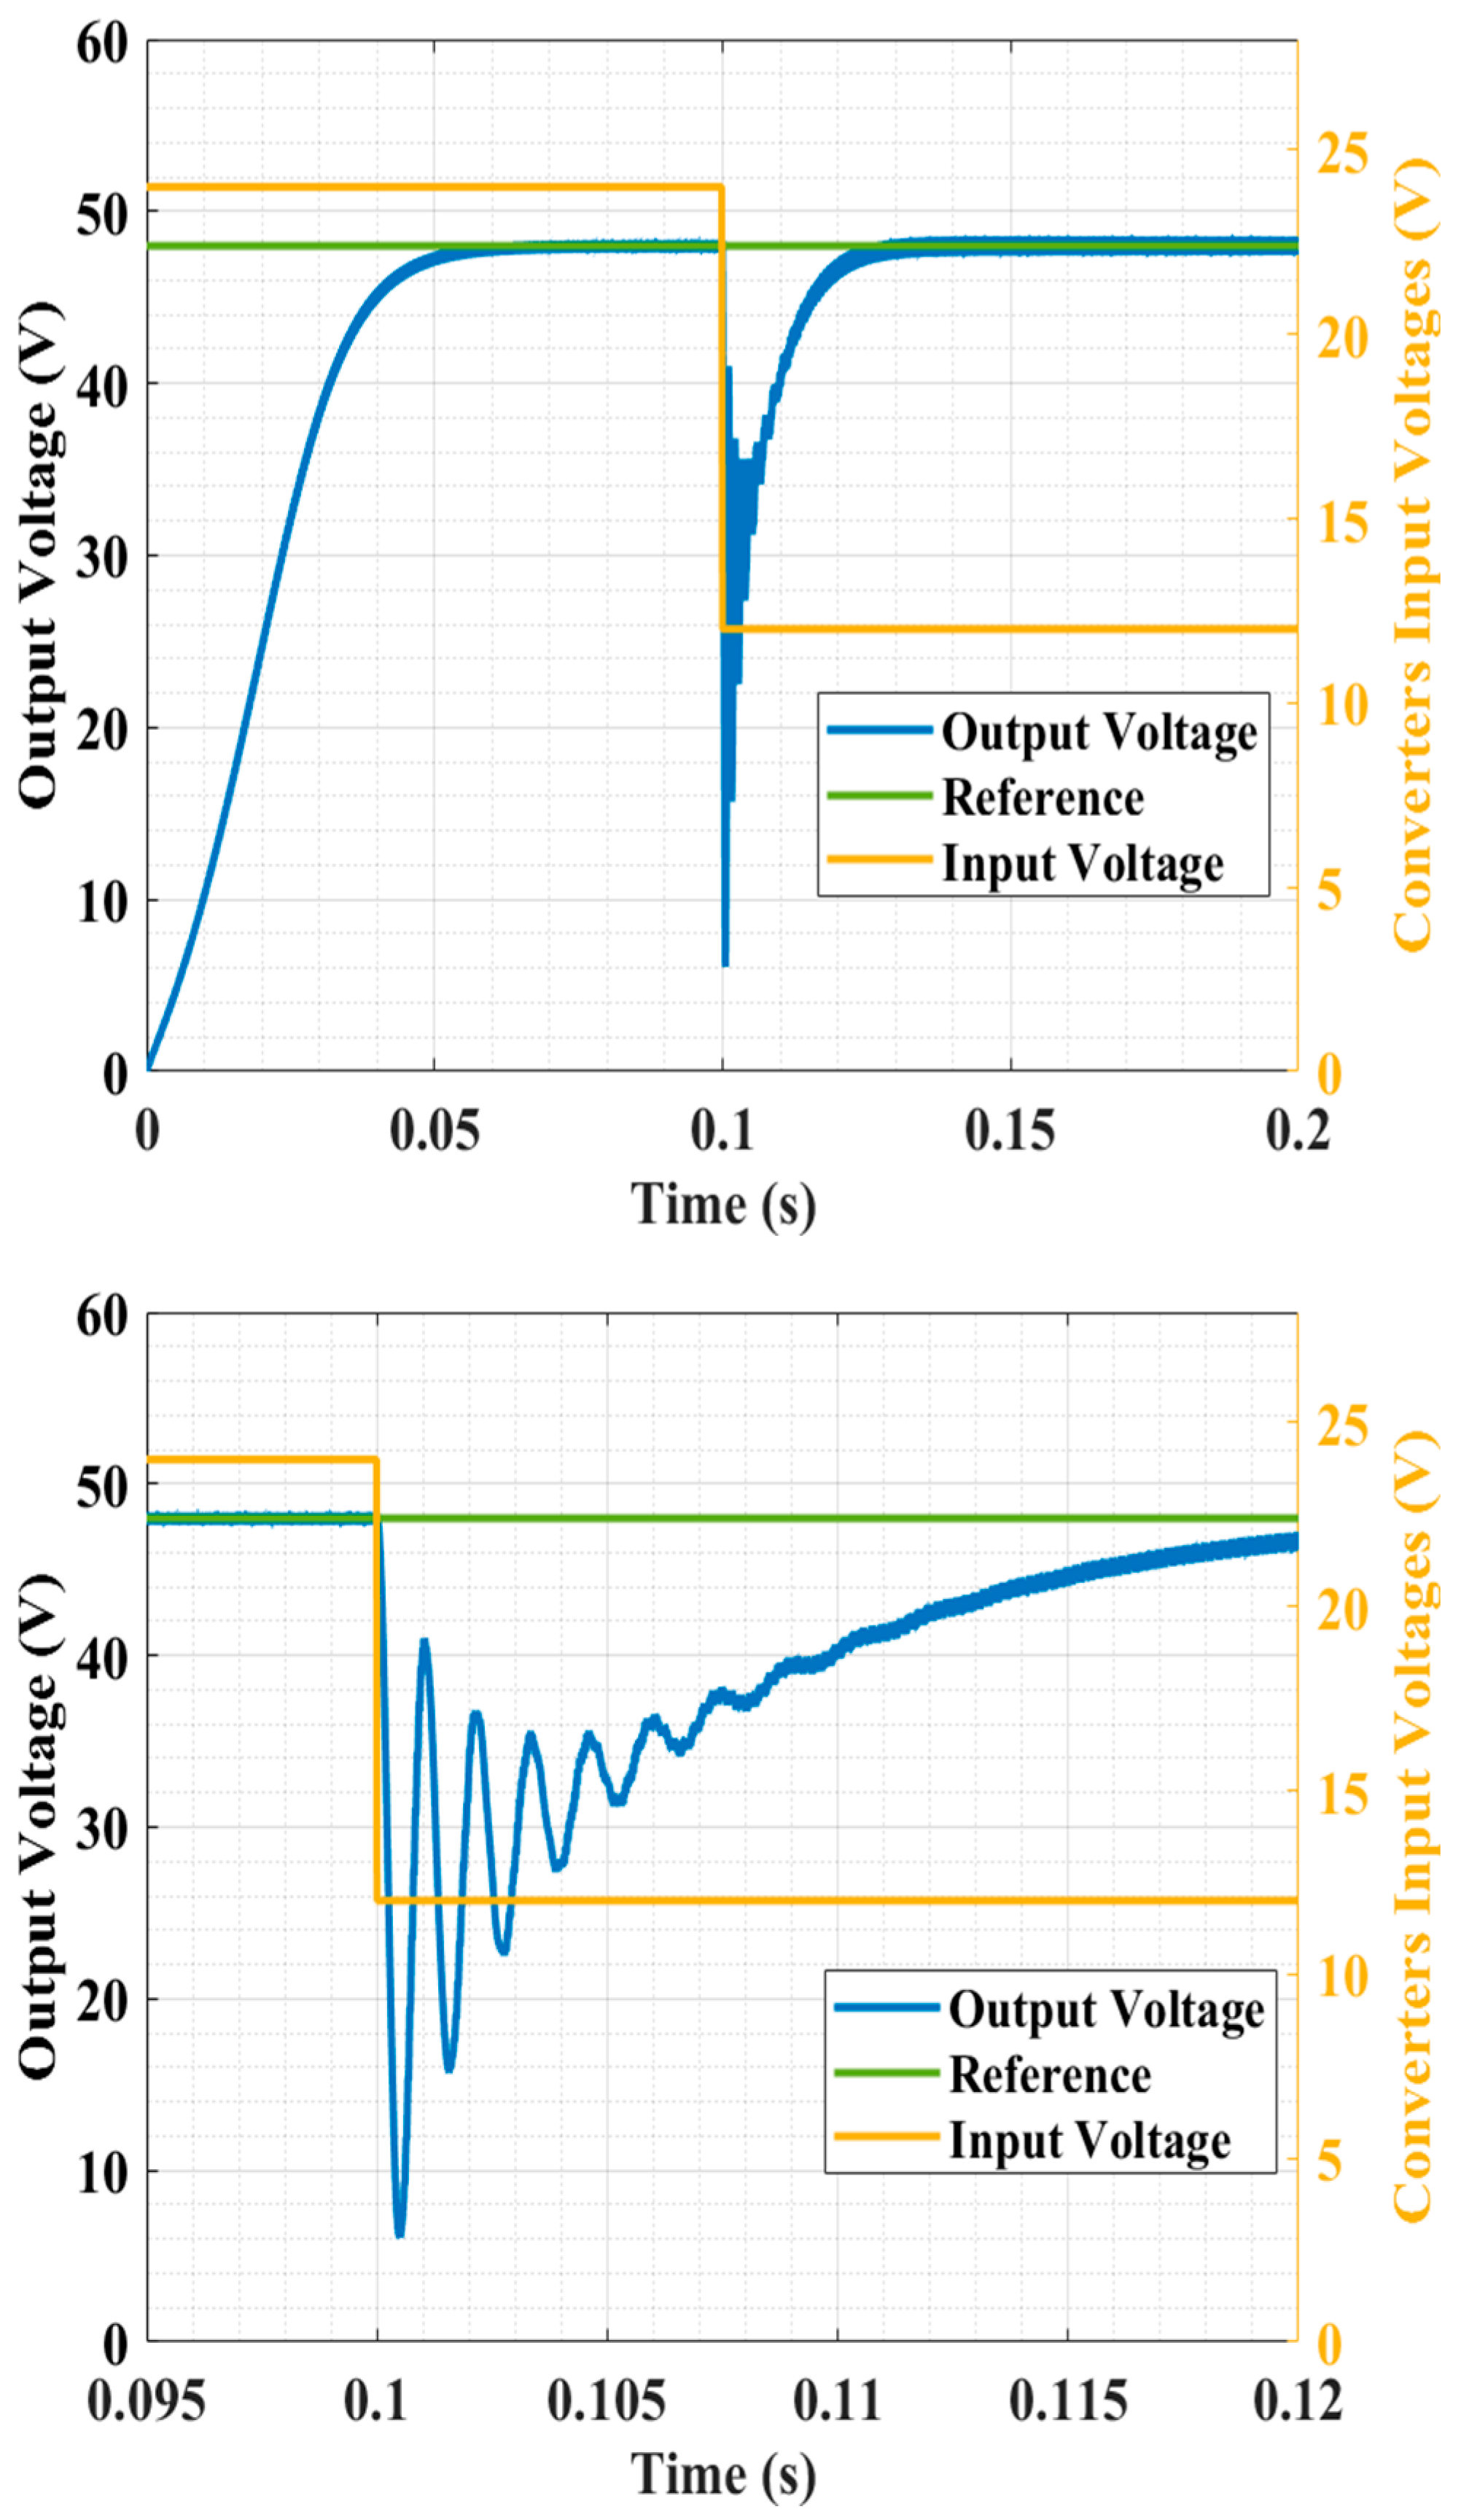
In this test, the converter is tested with a disturbance in the DC link rail (i.e., input voltage). The test is performed by running the converter until it reaches the steady state. After that, at 0.1 s, the input voltage is reduced by 50% in a stepped response, i.e., the DC link rail is stepped down from 24 V to 12 V. Although this disturbance is severe, it is essential to assess the performance of the tested system under extreme conditions. Figure 17 shows the output voltage response using the Type-II compensator along with a zoomed portion. The response has severe oscillations and undershoot that reached 6 V. The system required 0.025 s to recover from the disturbance. LQG system results are depicted in Figure 18, where the system recovered in an overdamped response (no oscillations) while the undershoot reached 34 V. The results show that the LQG required 0.006 s to recover from the input voltage disturbance. Comparing the LQG system to the Type-II compensator, the LQG system is at least 4 times faster, with a smoother and oscillation-free response. Moreover, the output voltage ripple increased in the Type-II compensator after the disturbance, unlike in the case of the LQG system, where the ripple almost remained the same.

7.2.3. Load Disturbance Test

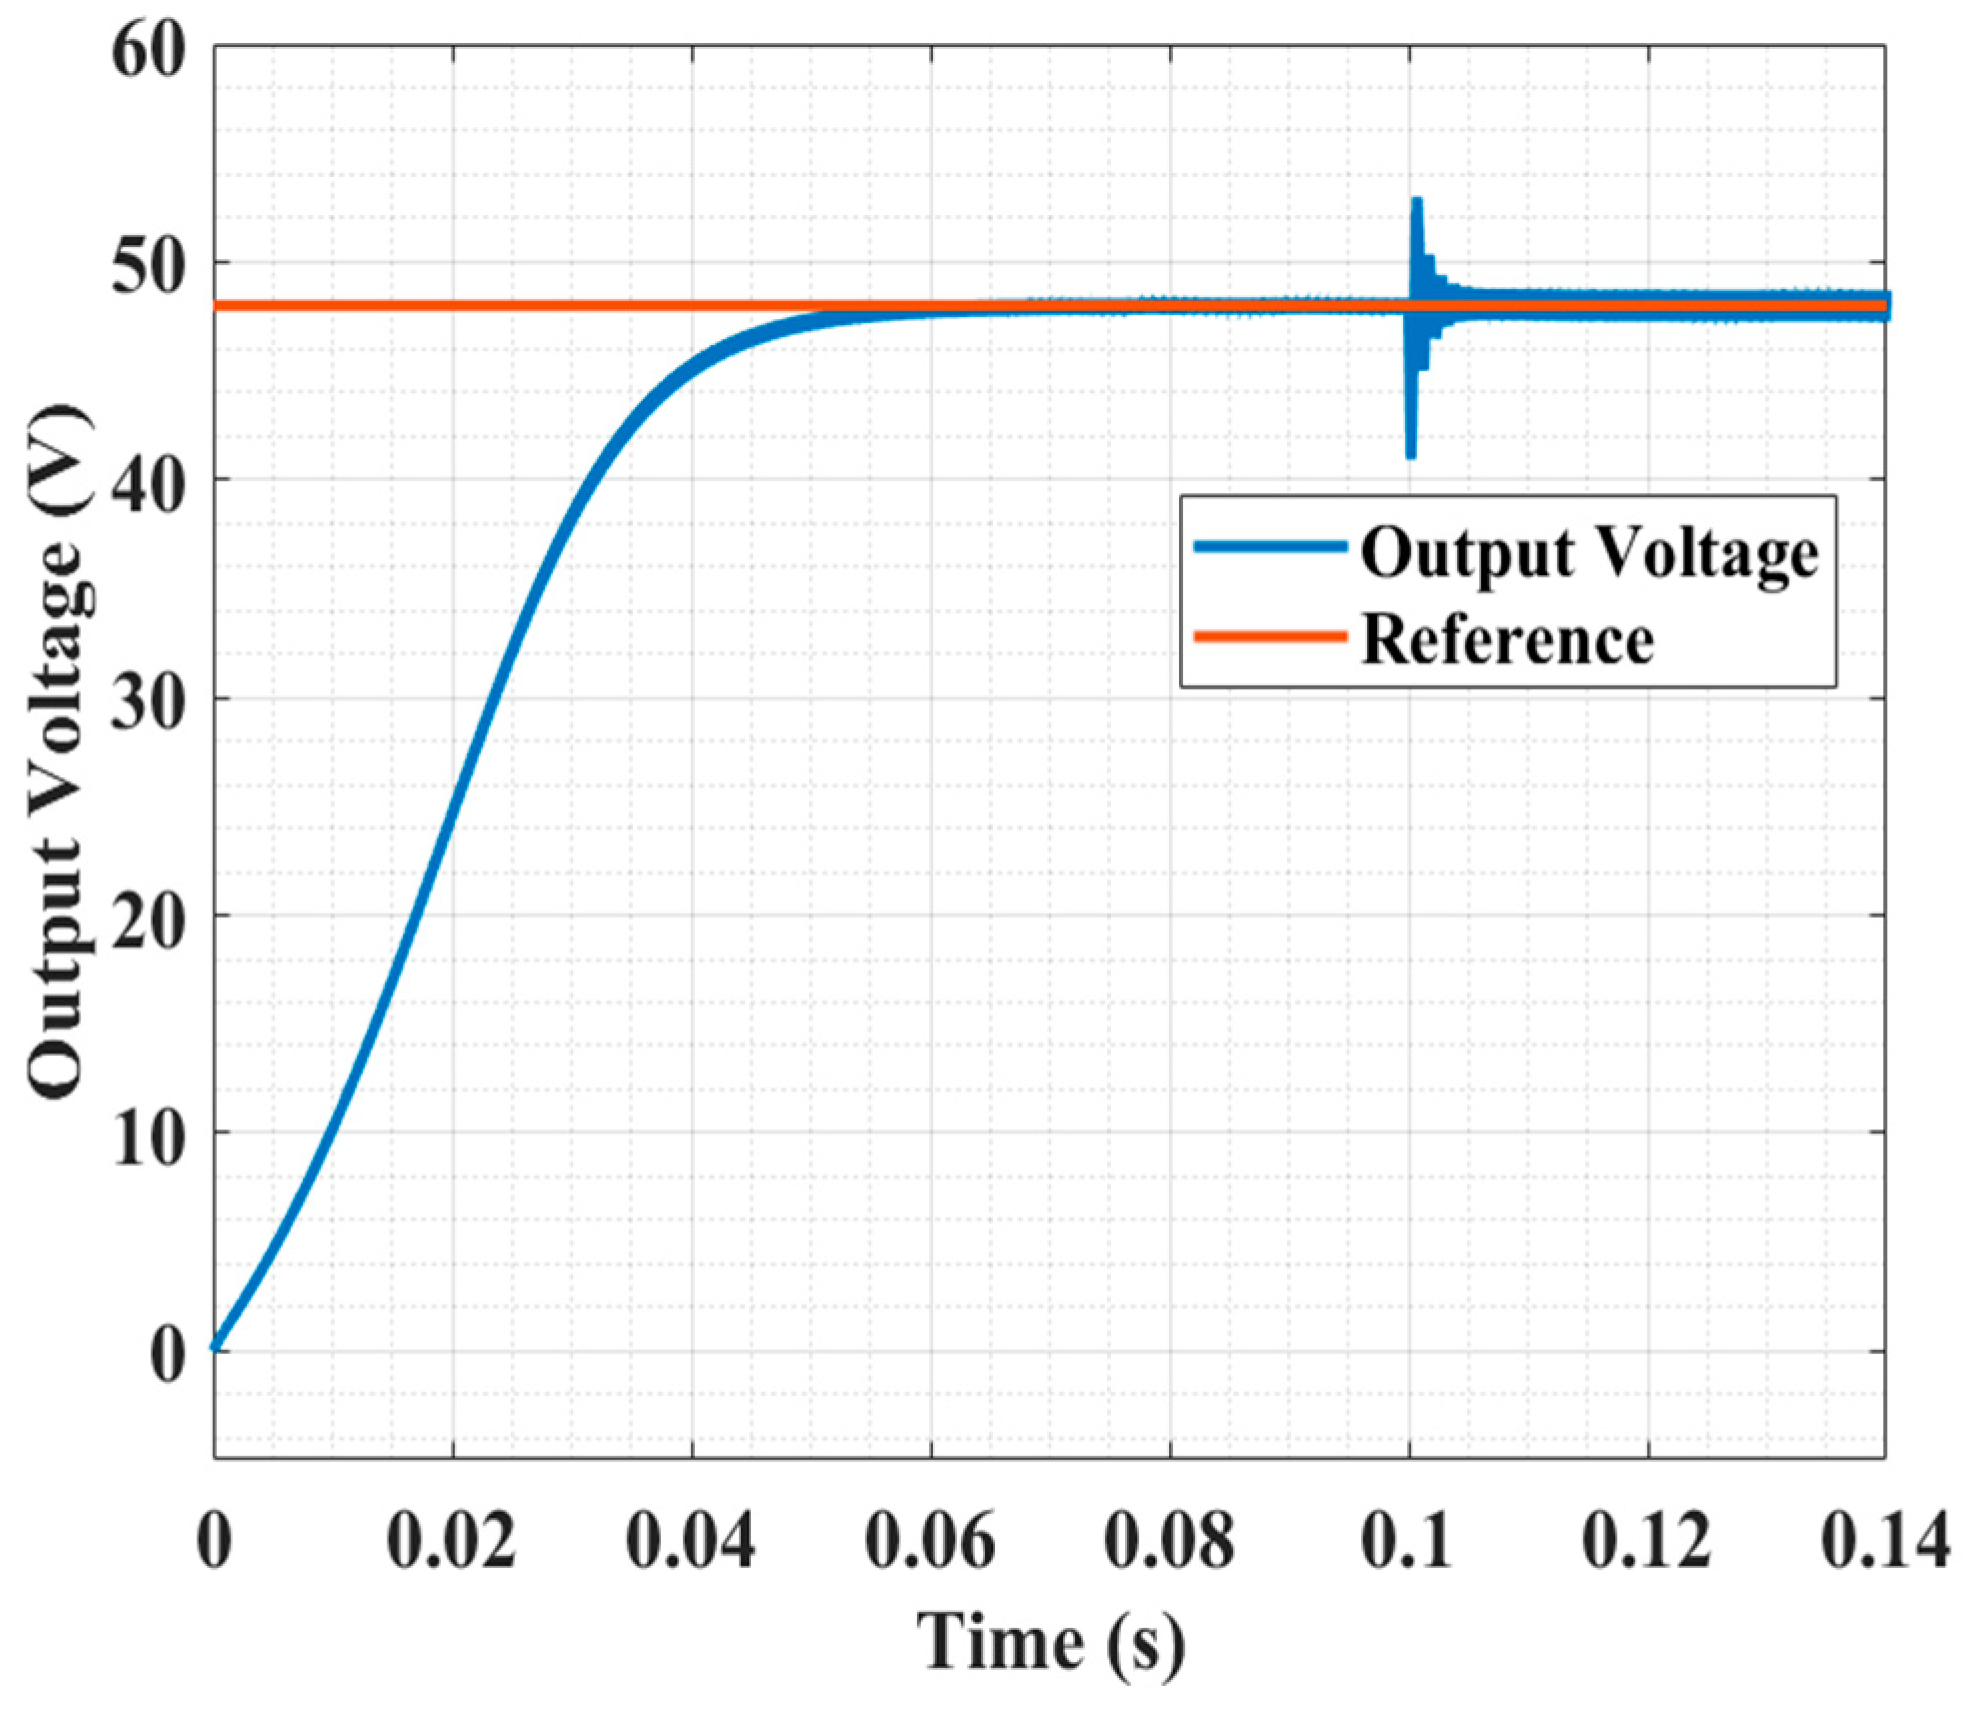
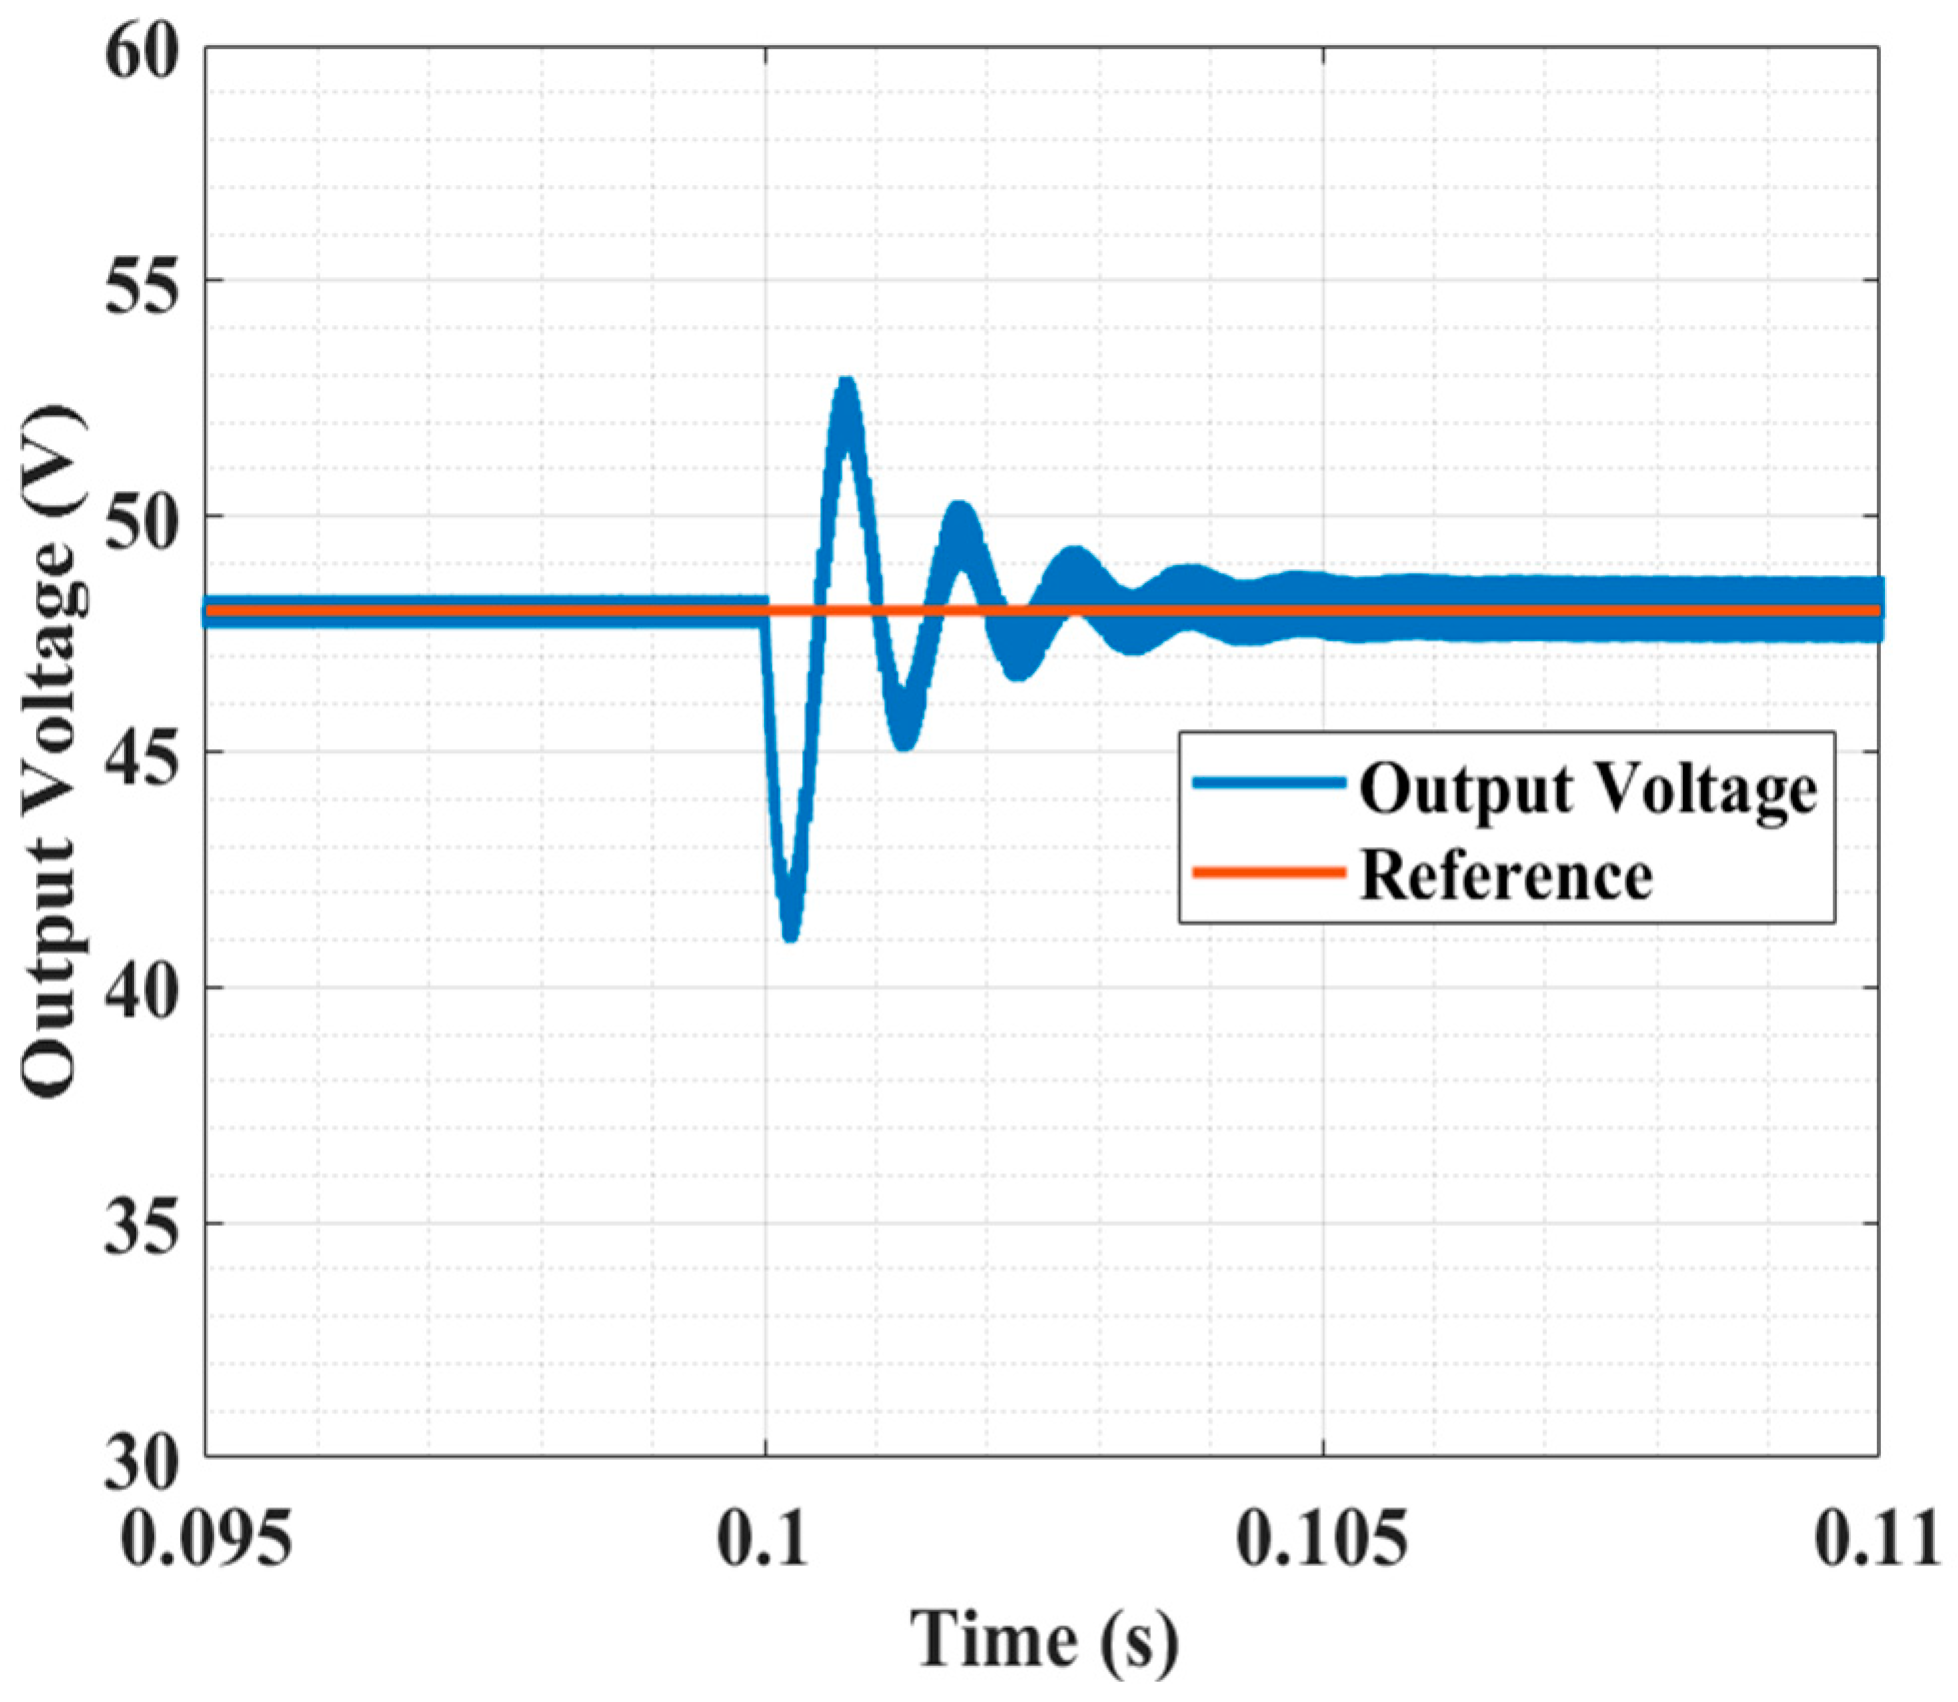
This test aimed to study the load variation’s consequences for the converter’s performance. The test was performed by starting the system from rest until it reached a steady state. At 0.1 s, a step change in the load was introduced. The load variation was 100% (i.e., the load required double the current). Although this disturbance is severe, it is essential to evaluate the performance of the tested system. Figure 19 shows the results (output voltage) of the load disturbance test using the Type-II compensator. The response suffers from oscillations, and the system required around 0.004 s to recover from the disturbance. The oscillation in the response peaked at 41 V and then at 53 V as the undershoot and then the overshoot cascaded with oscillations until the response was damped. The results using LQG, as in Figure 20, show a smoother output voltage under same test. The results show an undershoot (peaks at 42.5 V), and then the output voltage signal recovered in an overdamped pattern in 0.003 s.
Comparing the results from the three tests shows the superiority of the proposed system of LQG compared to the benchmark Type-II compensator. In all tests, the LQG system offers a faster response and an oscillation-free response. Furthermore, in all tests, the peak drop in the output voltage using LQG was significantly less than that of the Type-II compensator, especially for the input voltage disturbance test. A summary of all of the conducted tests is presented in Table 6.

8. Conclusions

Full-state feedback controllers are one of the robust controllers for linear systems, especially once they are optimized through an LQR structure and augmented with an integral action. Nevertheless, as the name implies, the full states must be measurable, which makes this approach challenging for high-order linear systems (i.e., with a high number of state variables). To overcome this limitation, this work proposed a Linear Quadratic Gaussian (LQG) approach for fourth-order SEPIC.
The work proposes the design procedure for an offline Kalman Filter (typically referred to as LQE) and how it can be merged with an optimized integral LQR controller. The results show the convergence of the observed states to the actual state values and the precision of the offline Kalman Filter.
The discussed LQG system was compared to a benchmark Type-II compensator that was designed based on an industrial-level design guide (the K-factor method). The results of this work show the superiority of the LQG system compared to the Type-II compensator. It is highlighted that the LQG system used only one measurable state variable (i.e., the output voltage state), just like a Type-II compensator, and no additional state sensors were needed due to the estimator block in the proposed design.

Author Contributions

Conceptualization, V.K.S.; Methodology, Y.E.H. and V.K.S.; Validation, Y.E.H.; Investigation, Y.E.H. and V.K.S.; Resources, V.K.S.; Writing—original draft, Y.E.H.; Writing—review & editing, V.K.S.; Supervision, V.K.S.; Project administration, V.K.S.; Funding acquisition, V.K.S. All authors have read and agreed to the published version of the manuscript.

Funding

This research was funded by [NSERC] grant number [RGPIN-2022-04011].

Data Availability Statement

The original contributions presented in the study are included in the article, further inquiries can be directed to the corresponding author.

Conflicts of Interest

The authors declare no conflict of interest.

References

  1. Mohan, N. Power Electronics: Converters, Applications, and Design, 3rd ed.; John Wiley & Sons: Hoboken, NJ, USA, 2003. [Google Scholar]
  2. Mohan, N. Power Electronics: A First Course; Wiley: Hoboken, NJ, USA, 2012. [Google Scholar]
  3. Basso, C. Switch-Mode Power Supplies, Second Edition: SPICE Simulations and Practical Designs, 2nd ed.; McGraw Hill: New York, NY, USA, 2014. [Google Scholar]
  4. Basso, C.P. Transfer Functions of Switching Converters; Faraday Press: Apache Junction, AZ, USA, 2021. [Google Scholar]
  5. Rashid, M.H. Power Electronics: Circuits, Devices, and Applications, 3rd ed.; Pearson/Prentice Hall: Upper Saddle River, NJ, USA, 2004. [Google Scholar]
  6. Erickson, R.W.; Maksimovic, D. Fundamentals of Power Electronics, 2nd ed.; Kluwer Boston, Inc.: Norwell, MA, USA, 2020. [Google Scholar]
  7. Gorji, S.A.; Sahebi, H.G.; Ektesabi, M.; Rad, A.B. Topologies and Control Schemes of Bidirectional DC–DC Power Converters: An Overview. IEEE Access 2019, 7, 117997–118019. [Google Scholar] [CrossRef]
  8. Bhaskar, M.S.; Ramachandaramurthy, V.K.; Padmanaban, S.; Blaabjerg, F.; Ionel, D.M.; Mitolo, M.; Almakhles, D. Survey of DC-DC Non-Isolated Topologies for Unidirectional Power Flow in Fuel Cell Vehicles. IEEE Access 2020, 8, 178130–178166. [Google Scholar] [CrossRef]
  9. Forouzesh, M.; Siwakoti, Y.P.; Gorji, S.A.; Blaabjerg, F.; Lehman, B. Step-Up DC–DC Converters: A Comprehensive Review of Voltage-Boosting Techniques, Topologies, and Applications. IEEE Trans. Power Electron. 2017, 32, 9143–9178. [Google Scholar] [CrossRef]
  10. Tofoli, F.L.; Pereira, D.d.C.; de Paula, W.J.; Júnior, D.d.S.O. Survey on non-isolated high-voltage step-up dc–dc topologies based on the boost converter. IET Power Electron. 2015, 8, 2044–2057. [Google Scholar] [CrossRef]
  11. Revathi, B.S.; Prabhakar, M. Non isolated high gain DC-DC converter topologies for PV applications—A comprehensive review. Renew. Sustain. Energy Rev. 2016, 66, 920–933. [Google Scholar] [CrossRef]
  12. Bryant, B.; Kazimierczuk, M. Derivation of the Cuk PWM DC-DC converter circuit topology. In Proceedings of the ISCAS 2003, International Symposium on Circuits and Systems, Bangkok, Thailand, 26–29 May 2003. [Google Scholar]
  13. Bryant, B.; Kazimierezuk, M. Derivation of the buck-boost PWM DC-DC converter circuit topology. In Proceedings of the 2002 IEEE International Symposium on Circuits and Systems, Scottsdale, AZ, USA, 26–29 May 2002. [Google Scholar]
  14. Wilson, T. The evolution of power electronics. IEEE Trans. Power Electron. 2000, 15, 439–446. [Google Scholar] [CrossRef]
  15. Bhaskar Ranjana, M.; Pandav, K.; Draxe, K. Novel Topological Derivations for DC-DC Converters. Int. J. Comput. Eng. Manag. 2013, 16, 49–53. [Google Scholar]
  16. Pragallapati, N.; Agarwal, V. Distributed PV Power Extraction Based on a Modified Interleaved SEPIC for Nonuniform Irradiation Conditions. IEEE J. Photovolt. 2015, 5, 1442–1453. [Google Scholar] [CrossRef]
  17. Killi, M.; Samanta, S. An Adaptive Voltage-Sensor-Based MPPT for Photovoltaic Systems with SEPIC Converter Including Steady-State and Drift Analysis. IEEE Trans. Ind. Electron. 2015, 62, 7609–7619. [Google Scholar] [CrossRef]
  18. Chiang, S.J.; Shieh, H.-J.; Chen, M.-C. Modeling and Control of PV Charger System with SEPIC Converter. IEEE Trans. Ind. Electron. 2008, 56, 4344–4353. [Google Scholar] [CrossRef]
  19. Abdel-Rahim, O.; Alghaythi, M.L.; Alshammari, M.S.; Osheba, D.S. Enhancing Photovoltaic Conversion Efficiency with Model Predictive Control-Based Sensor-Reduced Maximum Power Point Tracking in Modified SEPIC Converters. IEEE J. Mag. 2023, 11, 100769–100780. Available online: https://ieeexplore.ieee.org/document/10250777 (accessed on 3 May 2024). [CrossRef]
  20. Tey, K.S.; Mekhilef, S.; Seyedmahmoudian, M.; Horan, B.; Oo, A.T.; Stojcevski, A. Improved Differential Evolution-Based MPPT Algorithm Using SEPIC for PV Systems under Partial Shading Conditions and Load Variation. IEEE J. Mag. 2018, 14, 4322–4333. Available online: https://ieeexplore-ieee-org.uproxy.library.dc-uoit.ca/abstract/document/8258969 (accessed on 4 May 2024). [CrossRef]
  21. Elkhateb, A.; Rahim, N.A.; Selvaraj, J.; Uddin, M.N. Fuzzy-Logic-Controller-Based SEPIC Converter for Maximum Power Point Tracking. IEEE Trans. Ind. Appl. 2014, 50, 2349–2358. [Google Scholar] [CrossRef]
  22. Prabhakaran, P.; Agarwal, V. Novel Boost-SEPIC Type Interleaved DC–DC Converter for Mitigation of Voltage Imbalance in a Low-Voltage Bipolar DC Microgrid. IEEE Trans. Ind. Electron. 2019, 67, 6494–6504. [Google Scholar] [CrossRef]
  23. Veerachary, M. Power tracking for nonlinear pv sources with coupled inductor SEPTIC converter. IEEE Trans. Aerosp. Electron. Syst. 2005, 41, 1019–1029. [Google Scholar] [CrossRef]
  24. Singh, A.K.; Badoni, M.; Tatte, Y.N. A Multifunctional Solar PV and Grid Based On-Board Converter for Electric Vehicles. IEEE Trans. Veh. Technol. 2020, 69, 3717–3727. [Google Scholar] [CrossRef]
  25. Kapat, S.; Krein, P.T. A Tutorial and Review Discussion of Modulation, Control and Tuning of High-Performance DC-DC Converters Based on Small-Signal and Large-Signal Approaches. IEEE Open J. Power Electron. 2020, 1, 339–371. [Google Scholar] [CrossRef]
  26. Lee, S. Demystifying Type II and Type III Compensators Using Op-Amp and OTA for DC/DC Co. Application Report SLVA662-July 2014. Available online: https://www.ti.com/lit/an/slva662/slva662.pdf?ts=1720297046762&ref_url=https%253A%252F%252Fwww.google.com%252F (accessed on 4 May 2024).
  27. Mitchell, D.M. DC-DC Switching Regulator Analysis; McGraw-Hill: New York, NY, USA, 1988. [Google Scholar]
  28. Tang, W.; Lee, F.; Ridley, R.; Cohen, I. Charge control: Modeling, analysis, and design. IEEE Trans. Power Electron. 1993, 8, 396–403. [Google Scholar] [CrossRef]
  29. Ogata, K. Modern Control Engineering, 5th ed.; Upper Saddle River: Prentice Hall, NJ, USA, 2010. [Google Scholar]
  30. Dorf, R.C. Modern Control Systems, 13th ed.; Pearson: Hoboken, NJ, USA, 2017. [Google Scholar]
  31. Nise, N.S. Control Systems Engineering, 8th ed.; John Wiley & Sons, Inc.: Hoboken, NJ, USA, 2019. [Google Scholar]
  32. Sheehan, R.; Diana, L. Switch-Mode Power Converter Compensation Made Easy; Texas Instrument: Dallas, TX, USA, 2016. [Google Scholar]
  33. Rahimi, A.M.; Parto, P.; Asadi, P. Compensator Design Procedure for Buck Converter with Voltage-Mode Error-Amplifier. International Rectifier. 2012. Available online: https://www.infineon.com/dgdl/an-1162.pdf?fileId=5546d462533600a40153559a8e17111a (accessed on 4 May 2024).
  34. OnSemi-AN-and90138-D. Available online: https://www.onsemi.com/pub/collateral/and90138-d.pdf (accessed on 30 May 2023).
  35. Xu, Q.; Vafamand, N.; Chen, L.; Dragicevic, T.; Xie, L.; Blaabjerg, F. Review on Advanced Control Technologies for Bidirectional DC/DC Converters in DC Microgrids. IEEE J. Emerg. Sel. Top. Power Electron. 2020, 9, 1205–1221. [Google Scholar] [CrossRef]
  36. Pirooz, A.; Noroozian, R. Model predictive control of classic bidirectional DC-DC converter for battery applications. In Proceedings of the 2016 7th Power Electronics and Drive Systems Technologies Conference (PEDSTC), Tehran, Iran, 6–18 February 2016; pp. 517–522. [Google Scholar]
  37. Ebad, M.; Song, B.-M. Accurate model predictive control of bidirectional DC-DC converters for DC distributed power systems. In Proceedings of the 2012 IEEE Power & Energy Society General Meeting. New Energy Horizons—Opportunities and Challenges, San Diego, CA, USA, 22–26 July 2012; pp. 1–8. [Google Scholar]
  38. Hartley, E.N.; Trodden, P.A.; Richards, A.G.; Maciejowski, J.M. Model predictive control system design and implementation for spacecraft rendezvous. Control Eng. Pract. 2012, 20, 695–713. [Google Scholar] [CrossRef]
  39. Beccuti, A.G.; Mariethoz, S.; Cliquennois, S.; Wang, S.; Morari, M. Explicit Model Predictive Control of DC–DC Switched-Mode Power Supplies with Extended Kalman Filtering. IEEE Trans. Ind. Electron. 2009, 56, 1864–1874. [Google Scholar] [CrossRef]
  40. Mumtaz, F.; Yahaya, N.Z.; Meraj, S.T.; Singh, B.; Kannan, R.; Ibrahim, O. Review on non-isolated DC-DC converters and their control techniques for renewable energy applications. Ain Shams Eng. J. 2021, 12, 3747–3763. [Google Scholar] [CrossRef]
  41. Zhou, J. Adaptive backstepping control of uncertain systems nonsmooth nonlinearities, interactions, or time-variations. In Lecture Notes in Control and Information Sciences; Springer: Berlin/Heidelberg, Germany, 2008. [Google Scholar]
  42. Xu, Q.; Jiang, W.; Blaabjerg, F.; Zhang, C.; Zhang, X.; Fernando, T. Backstepping Control for Large Signal Stability of High Boost Ratio Interleaved Converter Interfaced DC Microgrids with Constant Power Loads. IEEE Trans. Power Electron. 2020, 35, 5397–5407. [Google Scholar] [CrossRef]
  43. Utkin, V.; Guldner, J.; Shi, J. Sliding Mode Control in Electro-Mechanical Systems; Taylor & Francis Group: New York, NY, USA, 2009. [Google Scholar] [CrossRef]
  44. Ciccarelli, F.; Lauria, D. Sliding-mode control of bidirectional dc-dc converter for supercapacitor energy storage applications. In Proceedings of the SPEEDAM 2010, Pisa, Italy, 14–16 June 2010; pp. 1119–1122. [Google Scholar] [CrossRef]
  45. Liu, J.; Laghrouche, S.; Wack, M. Observer-based higher order sliding mode control of power factor in three-phase AC/DC converter for hybrid electric vehicle applications. Int. J. Control 2014, 87, 1117–1130. [Google Scholar] [CrossRef]
  46. Utkin, V.; Poznyak, A.; Orlov, Y.; Polyakov, A. Conventional and high order sliding mode control. J. Frankl. Inst. 2020, 357, 10244–10261. [Google Scholar] [CrossRef]
  47. Fatoorehchi, H.; Ghorbanian, S.A. Sliding Mode Control for Heartbeat Electrocardiogram Tracking Problem. J. Chem. Pet. Eng. 2019, 53, 265–272. [Google Scholar] [CrossRef]
  48. Zhu, X.; Wang, Y.; Liu, S.; Cai, J.; Dou, L. A sliding mode control based maximum power point tracking method of PV arrays under partially shaded conditions. In Proceedings of the International Conference on Renewable Power Generation (RPG 2015), Beijing, China, 17–18 October 2015. [Google Scholar]
  49. Ortega, R.; van der Schaft, A.; Maschke, B.; Escobar, G. Interconnection and damping assignment passivity-based control of port-controlled Hamiltonian systems. Automatica 2002, 38, 585–596. [Google Scholar] [CrossRef]
  50. Chen, W.-H.; Yang, J.; Guo, L.; Li, S. Disturbance-Observer-Based Control and Related Methods—An Overview. IEEE Trans. Ind. Electron. 2015, 63, 1083–1095. [Google Scholar] [CrossRef]
  51. Li, S.; Yang, J.; Chen, W.-H.; Chen, X. Disturbance Observer-Based Control; Informa UK Limited: London, UK, 2016. [Google Scholar]
  52. Huangfu, Y.; Guo, L.; Ma, R.; Gao, F. An Advanced Robust Noise Suppression Control of Bidirectional DC–DC Converter for Fuel Cell Electric Vehicle. IEEE Trans. Transp. Electrif. 2019, 5, 1268–1278. [Google Scholar] [CrossRef]
  53. Degrees of Controllability and Gramians [Control Bootcamp]. Available online: https://www.youtube.com/watch?v=ZNHx62HbKNA (accessed on 4 May 2024).
  54. Engr210a Lecture 9: Controllability and Observability. Available online: https://lall.stanford.edu/engr210a/lectures/lecture9_2001_10_30_01.pdf (accessed on 4 May 2024).
  55. Brunton and Kutz—2017—Data Driven Science & Engineering.pdf. Available online: https://databookuw.com/databook.pdf (accessed on 4 May 2024).
  56. Controllability Tests, (25 February 2021). [Online Video]. Available online: https://www.youtube.com/watch?v=KZr9wga7l2U (accessed on 4 May 2024).
  57. Chapter 2 CONTROLLABILITY-University of Toronto. Available online: https://www.control.utoronto.ca/people/profs/kwong/ece410/2008/notes/chap2.pdf (accessed on 4 May 2024).
  58. ECE 5550-Applied Kalman Filtering. Available online: http://mocha-java.uccs.edu/ECE5550/ECE5550-Notes01.pdf (accessed on 4 May 2024).
  59. Lecture 9-The Extended Kalman Filter. Available online: https://stanford.edu/class/ee363/lectures/ekf.pdf (accessed on 4 May 2024).
  60. Lect25 and 26 Notes Theory of Kalman Filter.pdf. Available online: https://atmos.uw.edu/~breth/classes/AM582/lect/lect25-notes.pdf (accessed on 4 May 2024).
  61. Lecture 5—Observibility and State Estimation. Available online: https://stanford.edu/class/ee363/lectures/observ.pdf (accessed on 4 May 2024).
  62. EE363 Review Session 2: Invariant Subspaces, Sylvester Equation, PBH. Available online: https://web.stanford.edu/class/ee363/sessions/s2notes.pdf (accessed on 4 May 2024).
  63. Lecture 6: Invariant Subspaces. Available online: https://stanford.edu/class/ee363/lectures/inv-sub.pdf (accessed on 4 May 2024).
  64. Lecture 21: Filtering, State Space Models, Kalman Filter. Available online: https://ocw.mit.edu/courses/14-384-time-series-analysis-fall-2013/3dcb917d20ece78852cd398a3f7b5e64_MIT14_384F13_lec21.pdf (accessed on 4 May 2024).
  65. Welch, G.; Bishop, G. An Introduction to the Kalman Filter, Course 8; University of North Carolina at Chael Hill: Chapel Hill, NC, USA, 2001. [Google Scholar]
  66. Motivation for Full-State Estimation [Control Bootcamp], (6 February 2017). Available online: https://www.youtube.com/watch?v=LTNMf8X21cY (accessed on 4 April 2024).
  67. Control Bootcamp: Observability. (6 February 2017). Available online: https://www.youtube.com/watch?v=iRZmJBcg1ZA (accessed on 4 April 2024).
  68. Control Bootcamp: Full-State Estimation. (6 February 2017). Available online: https://www.youtube.com/watch?v=MZJMi-6_4UU (accessed on 4 April 2024).
  69. The Kalman Filter [Control Bootcamp]. (6 February 2017). Available online: https://www.youtube.com/watch?v=s_9InuQAx-g (accessed on 4 April 2024).
  70. Control Bootcamp: Linear Quadratic Gaussian (LQG). (6 February 2017). Available online: https://www.youtube.com/watch?v=H4_hFazBGxU (accessed on 4 April 2024).
  71. Sel, A.; Gunes, U.; Elbir, O.; Kasnakoglu, C. Comparative analysis of performance of the SEPIC converter using LQR and PID controllers. In Proceedings of the 2017 21st International Conference on System Theory, Control and Computing (ICSTCC), Sinaia, Romania, 19–21 October 2017; pp. 839–844. [Google Scholar]
  72. Meghnous, A.R.; Pham, M.T.; Lin-Shi, X. Nonlinear Observer and Lyapunov-Based Control for SEPIC Converter: Design and Experimental Results. In Proceedings of the 2013 American Control Conference, Washington, DC, USA, 17–19 June 2013; pp. 5833–5838. [Google Scholar] [CrossRef]
  73. Sousa, S.M.; Leite, V.J.S.; Fernandes, S.W.; Oliveira, I.R.H. SEPIC DC/DC converter control by observed-state feedback. In Proceedings of the 2019 IEEE 15th Brazilian Power Electronics Conference and 5th IEEE Southern Power Electronics Conference (COBEP/SPEC), Santos, Brazil, 1–4 December 2019; pp. 1–6. [Google Scholar]
  74. Biricik, S.; Ngo, T.; Komurcugil, H.; Basu, M. Nonlinear control methods for single-ended primary-inductor power converters. In Proceedings of the IECON 2017—43rd Annual Conference of the IEEE Industrial Electronics Society, Beijing, China, 29 October–1 November 2017; pp. 1337–1340. [Google Scholar]
  75. Meghnous, A.R.; Pham, M.T.; Lin-Shi, X. A hybrid observer for a class of DC-DC power converters. In Proceedings of the 2013 American Control Conference (ACC), Washington, DC, USA, 17–19 June 2013; pp. 6225–6230. [Google Scholar]
  76. Jaafar, A.; Godoy, E.; Lefranc, P.; Shi, X.L.; Fayaz, A.; Li, N. Nonlinear sliding mode observer and control of high order DC-DC converters. In Proceedings of the IECON 2010—36th Annual Conference of IEEE Industrial Electronics, Glendale, AZ, USA, 7–10 November 2010; pp. 180–186. [Google Scholar]
  77. SEPIC Converter Analysis and Design. Semiconductor Components Industries, LLC, 2021, Novenber 2021. Available online: https://www.onsemi.com/pub/collateral/and90136-d.pdf (accessed on 4 May 2024).
  78. Ridley, R. Analyzing the Sepic Converter. Power Syst. Des. Eur. 2006, 14–18. Available online: https://e2e.ti.com/cfs-file/__key/communityserver-discussions-components-files/234/Sepic-Analysis.pdf. (accessed on 4 May 2024).
  79. Ridley Engineering|—[002] Sepic Converter Analysis. Available online: https://ridleyengineering.com/design-center-ridley-engineering/38-control/44-002-sepic-converter-analysis.html (accessed on 19 February 2024).
  80. Basso, C.P. Designing Control Loops for Linear and Switching Power Supplies: A Tutorial Guide; Artech House: Boston, MA, USA, 2012. [Google Scholar]
  81. Ullah, M.; Ulasyar, A.; Zad, H.S.; Khattak, A. Design of Linear Quadratic Regulator Controller for Sepic Con-verter. In Proceedings of the 2019 15th International Conference on Emerging Technologies (ICET), Peshawar, Pakistan, 2–3 December 2019; pp. 1–6. [Google Scholar] [CrossRef]
  82. Erickson, R.W. Synthesis of switched-mode converters. In Proceedings of the 1983 IEEE Power Electronics Specialists Conference, Albuquerque, NM, USA, 6–9 June 1983; pp. 9–22. [Google Scholar]
  83. Venable, H.D.; Industries, V. The K Factor: A New Mathematical Tool for Stability Analysis and Synthesis. In Proceedings of the Powercon 10, San Diego, CA, USA, 22–24 March 1983. [Google Scholar]
  84. Venable, H.D.; Venable Instruments. Optimum Feedback Amplifier Design. Venable Instruments Technical White Paper, Number 3. pp. 1–14. Available online: https://www.venableinstruments.com/optimum-feedback-amplifier-design-wp (accessed on 4 May 2024).
  85. Venable, H.D.; Venable Instruments. Current Mode Control, Venable Instruments Technical White Paper, Number 5. pp. 1–12. Available online: https://www.venableinstruments.com/current-mode-control-wp (accessed on 4 May 2024).
  86. Slotine, J.-J.E.; Li, W. Applied Nonlinear Control; Prentice Hall International Inc.: Upper Saddle, NJ, USA, 1991. [Google Scholar]
Figure 1. SEPIC schematic.
Energies 17 03385 g001
Figure 2. Categories of linear controllers.
Energies 17 03385 g002
Figure 3. Categories of nonlinear (or advanced) controllers.
Energies 17 03385 g003
Figure 4. Block diagram representing LQG composed of Kalman Filter (LQE) merged with Full-State Controller (Integral LQR).
Energies 17 03385 g004
Figure 5. (a). SEPIC when the switch is “on”. (b). SEPIC when the switch is “off”.
Energies 17 03385 g005
Figure 7. An example of Gain and Phase plots (Bode plot) of Type-II compensator.
Energies 17 03385 g007
Figure 8. Bode plots of open-loop, loop gain, and closed-loop plots for the SEPIC.
Energies 17 03385 g008
Figure 9. Integral LQR controller block diagram.
Energies 17 03385 g009
Figure 10. Block diagram of merged state estimator with plant controller.
Energies 17 03385 g010
Figure 11. Kalman Filter block diagram merged with Full-State Controller.
Energies 17 03385 g011
Figure 12. Modeling of offline KF dynamics after re-arranging the Simulink model. (a) Dynamic KF with its inputs. (b) Duty cycle and its complementary assignment. (c) Estimating state variable x1. (d) Estimating state variable x2. (e) Estimating state variable x3. (f) Estimating state variable x4 (output voltage). (g) Perturbation assignments for the input vector in the KF model. (h) Dynamic calculation for DC terms in KF model—input inductor. (i) Dynamic calculation for DC terms in KF model—intermediate inductor and capacitor. (j) Dynamic calculation for DC terms in KF model—output capacitor. (k) Dynamic calculation for the input vector terms—first and second components. (l) Dynamic calculation for the input vector terms—third and fourth components.
Energies 17 03385 g012aEnergies 17 03385 g012bEnergies 17 03385 g012cEnergies 17 03385 g012dEnergies 17 03385 g012e
Figure 13. (a). LQG block diagram: results of merging LQR and LQE structures. (b) Detailed Simulink model/block diagram: results of merging LQR and LQE structures.
Energies 17 03385 g013
Figure 14. The estimated and the actual state measurement for the designed LQG system.
Energies 17 03385 g014
Figure 15. Cold start test: Type-II compensator–converter output voltage and controller duty cycle.
Energies 17 03385 g015
Figure 16. Cold start test: LQG system–converter output voltage and controller duty cycle.
Energies 17 03385 g016
Figure 17. Input voltage disturbance test: Type-II compensator–output voltage and zoomed view.
Energies 17 03385 g017
Figure 18. Input voltage disturbance test: LQG system–output voltage and zoomed view.
Energies 17 03385 g018aEnergies 17 03385 g018b
Figure 19. Load disturbance test: Type-II compensator–output voltage and zoomed view.
Energies 17 03385 g019aEnergies 17 03385 g019b
Figure 20. Load disturbance test: LQG system–output voltage and zoomed view.
Energies 17 03385 g020
Table 1. SEPIC specifications and designs values.
Required SpecificationsLoad RInput Voltage VgOutput Voltage VoSwitching Frequency fsw
Value 46.08   Ω 24 V48 V50 kHz
Designed SEPIC
Components
Inductor   L 1 Inductor   L 2 Capacitor   C 1 Capacitor   C 2
Value0.25 mH0.25 mH2.78 μF23.15 μF
Table 3. Designed state–feedback gains for Integral LQR controller.
State–Feedback Gain K 1 K 2 K 3 K 4 K 5
Value0.006590.00375−1.603610.000385−3.87298
Table 4. Gramian study for the designed SEPIC.
State Variable x 1 x 2 x 3 x 4
Determinant of observability Gramian 2.59 × 10 14 2.6 × 10 14 2.86 × 10 9 9.51 × 10 13
Table 5. Dynamical state–space model of offline Kalman Filter.
Matrix TitleSystem Matrix
A K f
Input Matrix
B K f
Output Matrix
C K f
Feedforward Matrix
D K f
Expression A K f C B B u K f I ( n × n ) 0 B K f
Table 6. Comparative summary between Type-II compensator and proposed LQG performances.
Cold StartInput Voltage DisturbanceLoad Disturbance
ResponseSettling TimeResponseSettling TimeDrop in o/p Voltage RailResponseSettling TimeDrop in o/p Voltage Rail
Type-IIOver-
damped
0.05 sSevere
Oscillation
0.025 s42 VSevere
Oscillation
0.004 s7 V
LQG systemOver-
damped
0.01 sOverdamped0.006 s14 VOverdamped0.003 s5.5 V
Disclaimer/Publisher’s Note: The statements, opinions and data contained in all publications are solely those of the individual author(s) and contributor(s) and not of MDPI and/or the editor(s). MDPI and/or the editor(s) disclaim responsibility for any injury to people or property resulting from any ideas, methods, instructions or products referred to in the content.