Article

An Economic Performance Improving and Analysis for Offshore Wind Farm-Based Islanded Green Hydrogen System

by
Wei Feng
1,*,
Liu Yang
2,
Kai Sun
1,*,
Yuebin Zhou
2 and
Zhiyong Yuan
2
1
State Key Lab of Power Systems, Department of Electrical Engineering, Tsinghua University, Beijing 100084, China
2
State Key Laboratory of HVDC, Electric Power Research Institute (EPRI), China Southern Power Grid (CSG), Guangzhou 510663, China
*
Authors to whom correspondence should be addressed.
Energies 2024, 17(14), 3460; https://doi.org/10.3390/en17143460
Submission received: 11 April 2024 / Revised: 22 June 2024 / Accepted: 4 July 2024 / Published: 14 July 2024

Abstract

:
When offshore wind farms are connected to a hydrogen plant with dedicated transmission lines, for example, high-voltage direct current, the fluctuation of wind speed will influence the efficiency of the alkaline electrolyzer and deteriorate the techno-economic performance. To overcome this issue, firstly, an additional heating process is adopted to achieve insulation for the alkaline solution when power generated by wind farms is below the alkaline electrolyzer minimum power threshold, while the alkaline electrolyzer overload feature is used to generate hydrogen when wind power is at its peak. Then, a simplified piecewise model-based alkaline electrolyzer techno-economic analysis model is proposed. The improved economic performance of the islanded green hydrogen system with the proposed operation strategy is verified based on the wind speed data set simulation generated by the Weibull distribution. Lastly, the sensitivity of the total return on investment to wind speed parameters was investigated, and an islanded green hydrogen system capacity allocation based on the proposed analysis model was conducted. The simulation result shows the total energy utilization increased from 62.0768% to 72.5419%, and the return on investment increased from 5.1303%/month to 5.9581%/month when the proposed control strategy is adopted.

1. Introduction

PtX is seen as a key technology in contributing to reaching climate targets and unleashing the great potential for wind energy [1,2]. The global PtX market could be as large as 20,000 TWh by 2050 [3]. Nowadays, exceeding 800 GW of renewable energy, including wind and solar power, is installed in China; the total capacity will reach 1000 GW by the end of 2050 according to China’s long-term plans for the wind power industry [4]. However, curtailment and grid limitations have remained significant challenges for increasing the penetration rate of renewable energy. A promising approach to addressing this challenge is producing hydrogen with wind power, as it enables large-scale, long-term storage of renewable energy through hydrogen storage [5]. Moreover, the stored hydrogen can be used for seasonal peak demand management in the power system [6], and it can also be transported over long distances using pipelines, trailers, ships, and other means to support sectors such as transportation, the chemical industry, and metallurgy, which are difficult to decarbonize.
Currently, ALE is the most mature and cost-effective technology for hydrogen production, making it the only suitable option for large-scale applications. However, operational flexibility and dynamic adaptability limit its application in some working conditions [7]. Wind power is inherently random and intermittent, and the coupling of wind power with ALS electrolysis poses challenges to the safe and efficient operation of the electrolysis cells. Researchers from around the world have mainly focused on improving the performance of ALE under wide power fluctuations through equipment design and control strategies. It has been proven that enhancing certain equipment structures and control strategies is an effective way to improve the power regulation performance and efficiency of ALE. Moreover, to clearly understand the influence of wind speed and WTs on the coupling system, probabilistic approaches for wind speed and WT modeling are discussed by researchers. A mixture probability distribution function is proposed to imitate the probabilistic nature of wind speed, in which a decision-making multiple-objective formulation is used to optimally optimize parameters [8], and an adaptive multi-variable non-parametric kernel density estimation approach was discussed and applied to the joint probability density function modeling for multiple wind farms [9]. In this way, the accuracy of the wind speed and WT profile imitation is improved. As a cost-sensitive feature, site matching will affect the techno-economic performance of ALE and WT coupling systems. A capacity factor probabilistic approach is investigated to optimize the WT site matching [10].
Green hydrogen is an efficient way to increase renewable energy utilization; nevertheless, the unpredictability, variability, and irregularity of both wind and solar power generation pose difficulties for ensuring the secure and reliable operation of the system. A two-stage optimal allocation model for an integrated wind-solar-hydrogen-storage system is developed using a time-sequence production simulation approach in [11], and a case study including a 23 MW wind farm, 17 MW PV, and 39.9 MW ALE is presented. As the fluctuation of wind speed has a significant negative impact on ALE, coordinated control is discussed in [12] to supply stable power to the power system while hydrogen is produced by using some part of the wind generator output. This problem will become even worse when the system works in islanded mode. Therefore, a control method for the operation of a stand-alone wind farm with a hydrogen generator is investigated in [13,14]. On the other hand, as economic performance will play a key role in the application of the green hydrogen system, it was discussed in [15,16] when the system works in grid-connected mode.
Techno-economic performance is a critical factor in the green hydrogen system. An islanded green hydrogen system consisting of a hydrogen electrolyzer and multiple wind generators connected in parallel through power converters is discussed in [17], and the economic analysis for the islanded system is conducted based on the net present cost, in which a high ESS capacity is required when the wind power output is lower than the minimum power input of the electrolyzer [18]. Financial metrics such as LCOE, LCOH, CRF, and IRR for a PV/wind-powered hydrogen production plant are investigated in [19]. However, all research mentioned above does not consider the influence of ALS temperature change on hydrogen production in islanded mode.
Therefore, this paper introduces a heating process to provide insulation for the ALS when the power generated by wind farms falls below the ALE minimum power threshold. This approach helps to maintain the temperature of the electrolytes close to the ALE’s minimum threshold, reducing the preheating time required and improving energy efficiency. Furthermore, this paper takes advantage of the ALE overload feature to generate hydrogen when wind power is at its peak, which occurs frequently in islanded systems. Subsequently, an ALE techno-economic analysis model is proposed, using the simplified piecewise model of ALS and the power output from the wind farm to estimate the ALE’s temperature. The enhanced economic performance of the integrated islanded green hydrogen system with the proposed operation strategy is validated by wind speed data generated by the Weibull distribution. Finally, the study investigates the sensitivity of the total ROI to wind speed parameters, and an islanded green hydrogen system capacity allocation based on the proposed analysis model was conducted.
This work is organized as follows. Section 2 presents the description of the islanded wind-hydrogen system with the insulation control strategy. Section 3 describes the simplified ALE thermal model-based techno-economic analysis model. Section 4 presents the simulation and economic analysis results of the proposed system, as well as parameter sensitivity analysis. Section 5 concludes the paper.

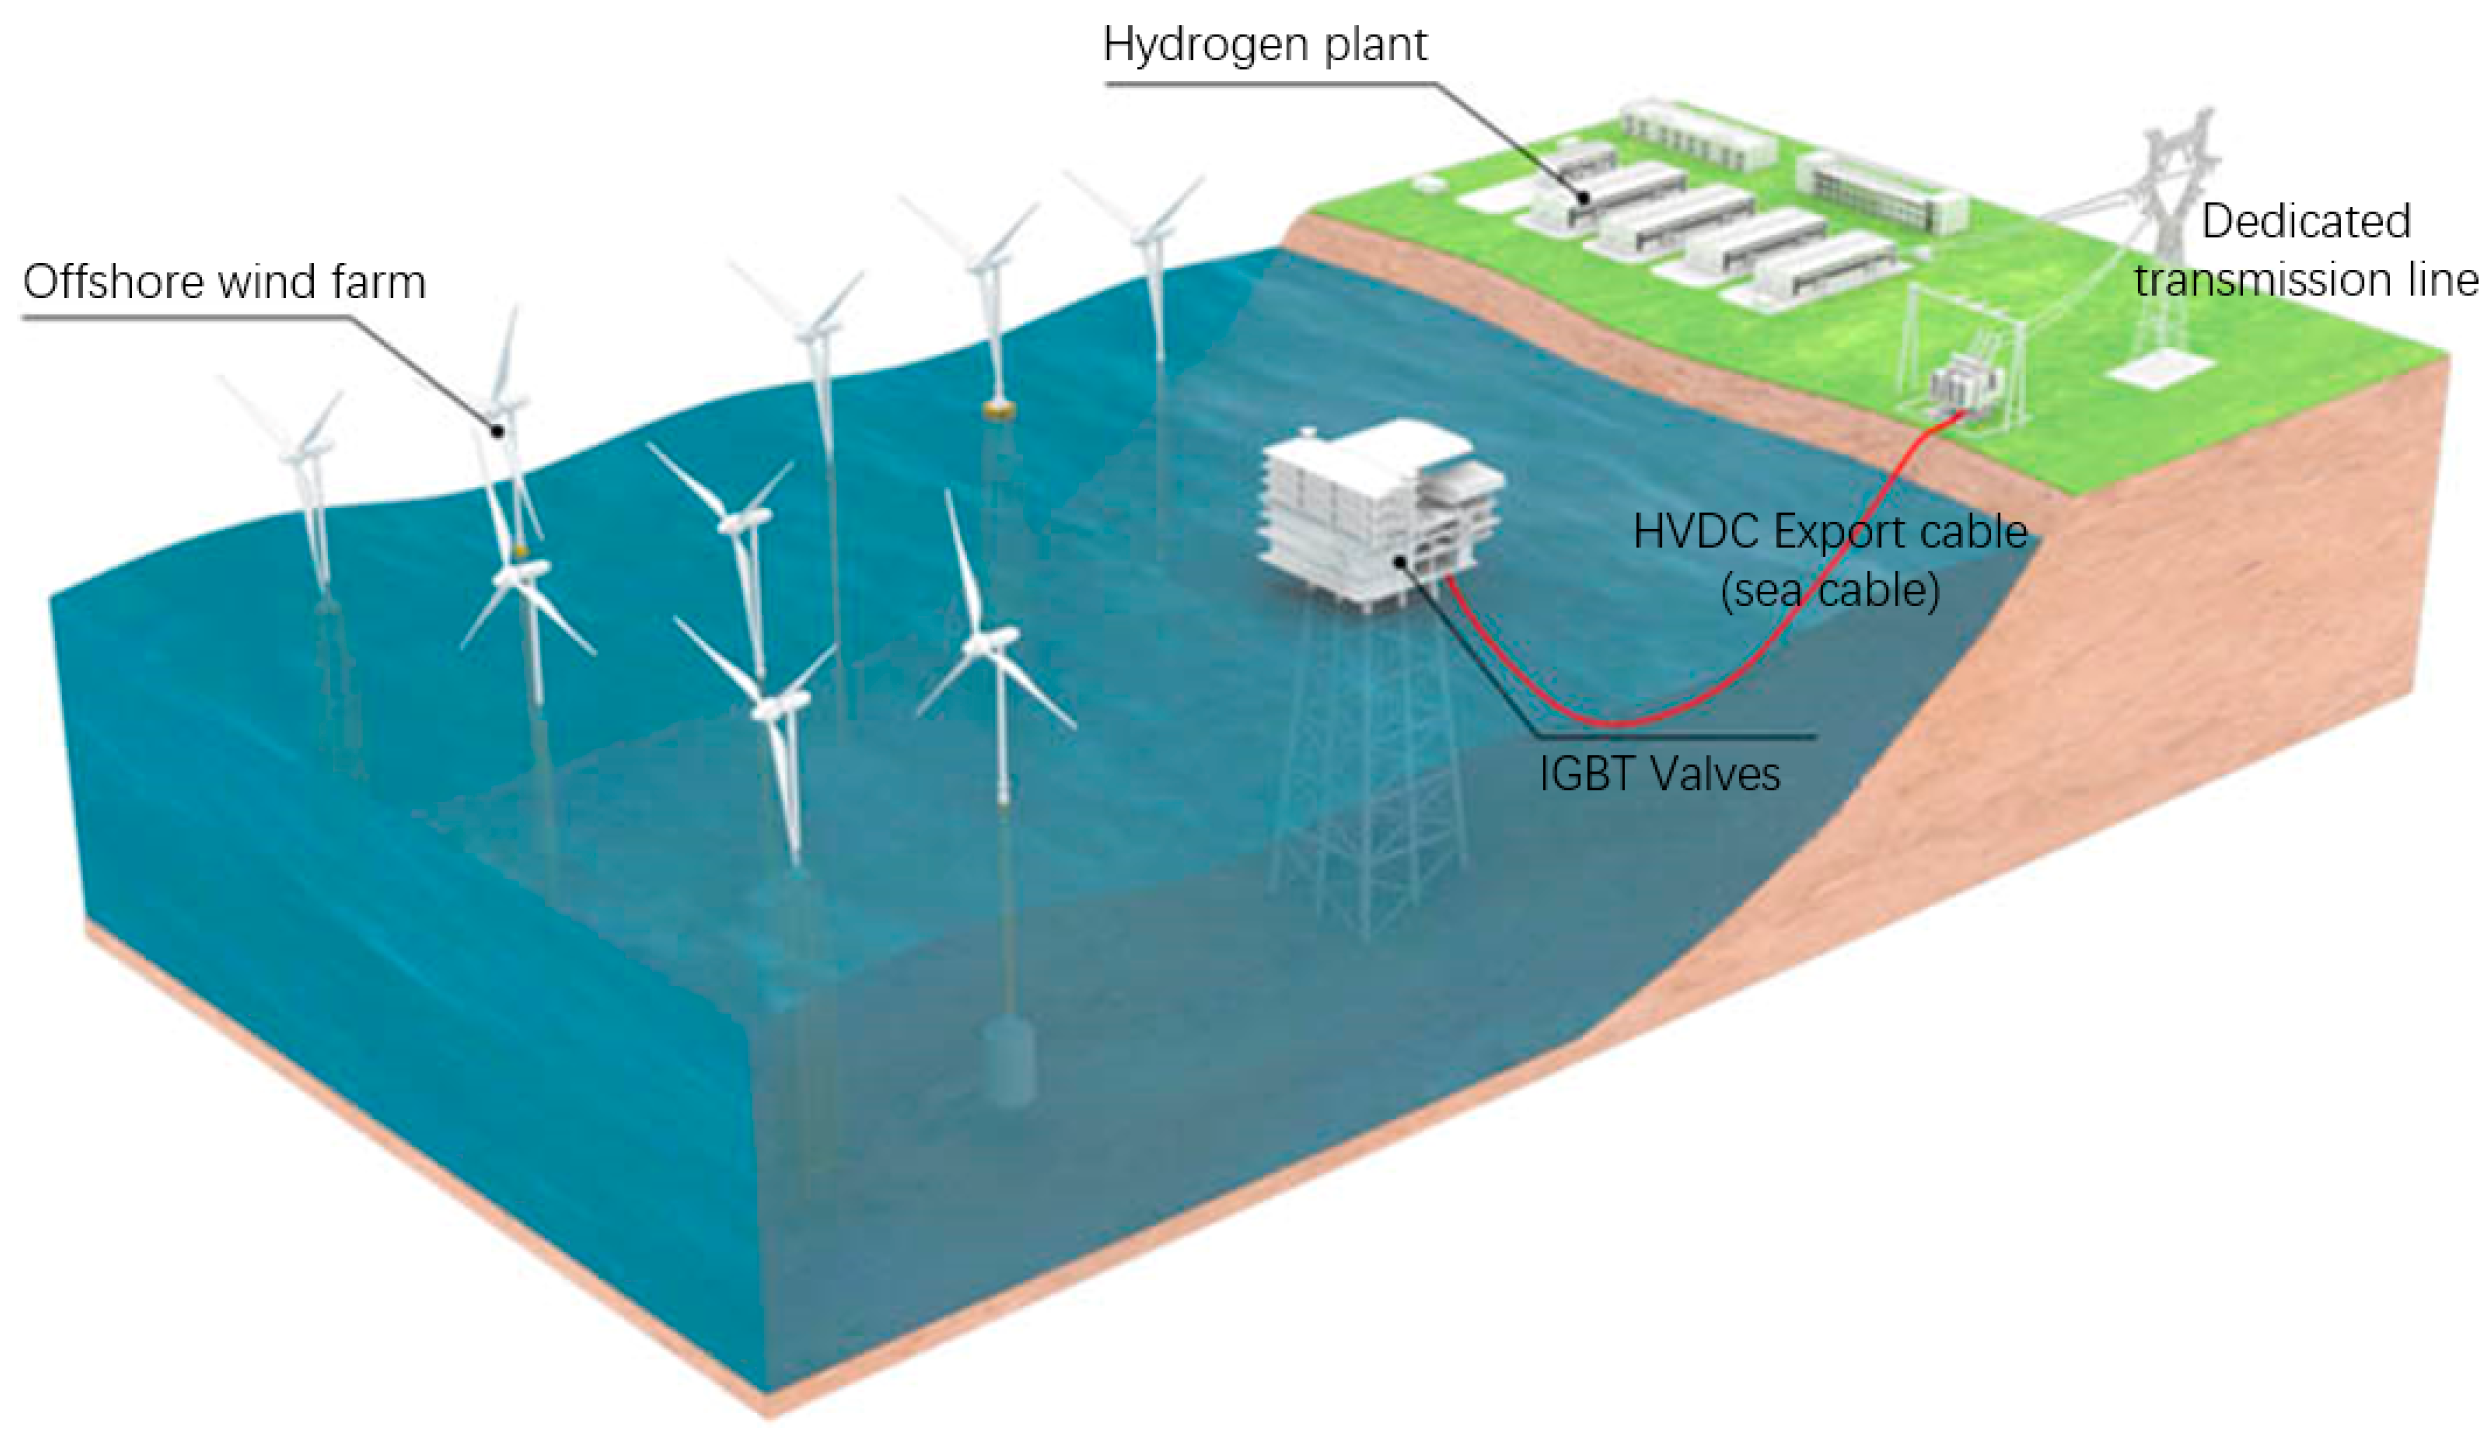
2. Islanded Wind-Hydrogen System

The scheme of the offshore wind farm and onshore hydrogen plant system investigated in this paper is shown in Figure 1. The system works islanded from the grid. The offshore wind farm is connected to the onshore hydrogen production via a dedicated physical connection, for example, HVDC. The high-voltage electricity is stepped down to a typical 10 kV by the onshore substation. As the transmission system is not the focus of this paper, for simplicity, the IGBT valves and transmission line are equivalent to an efficiency coefficient k H V D C .

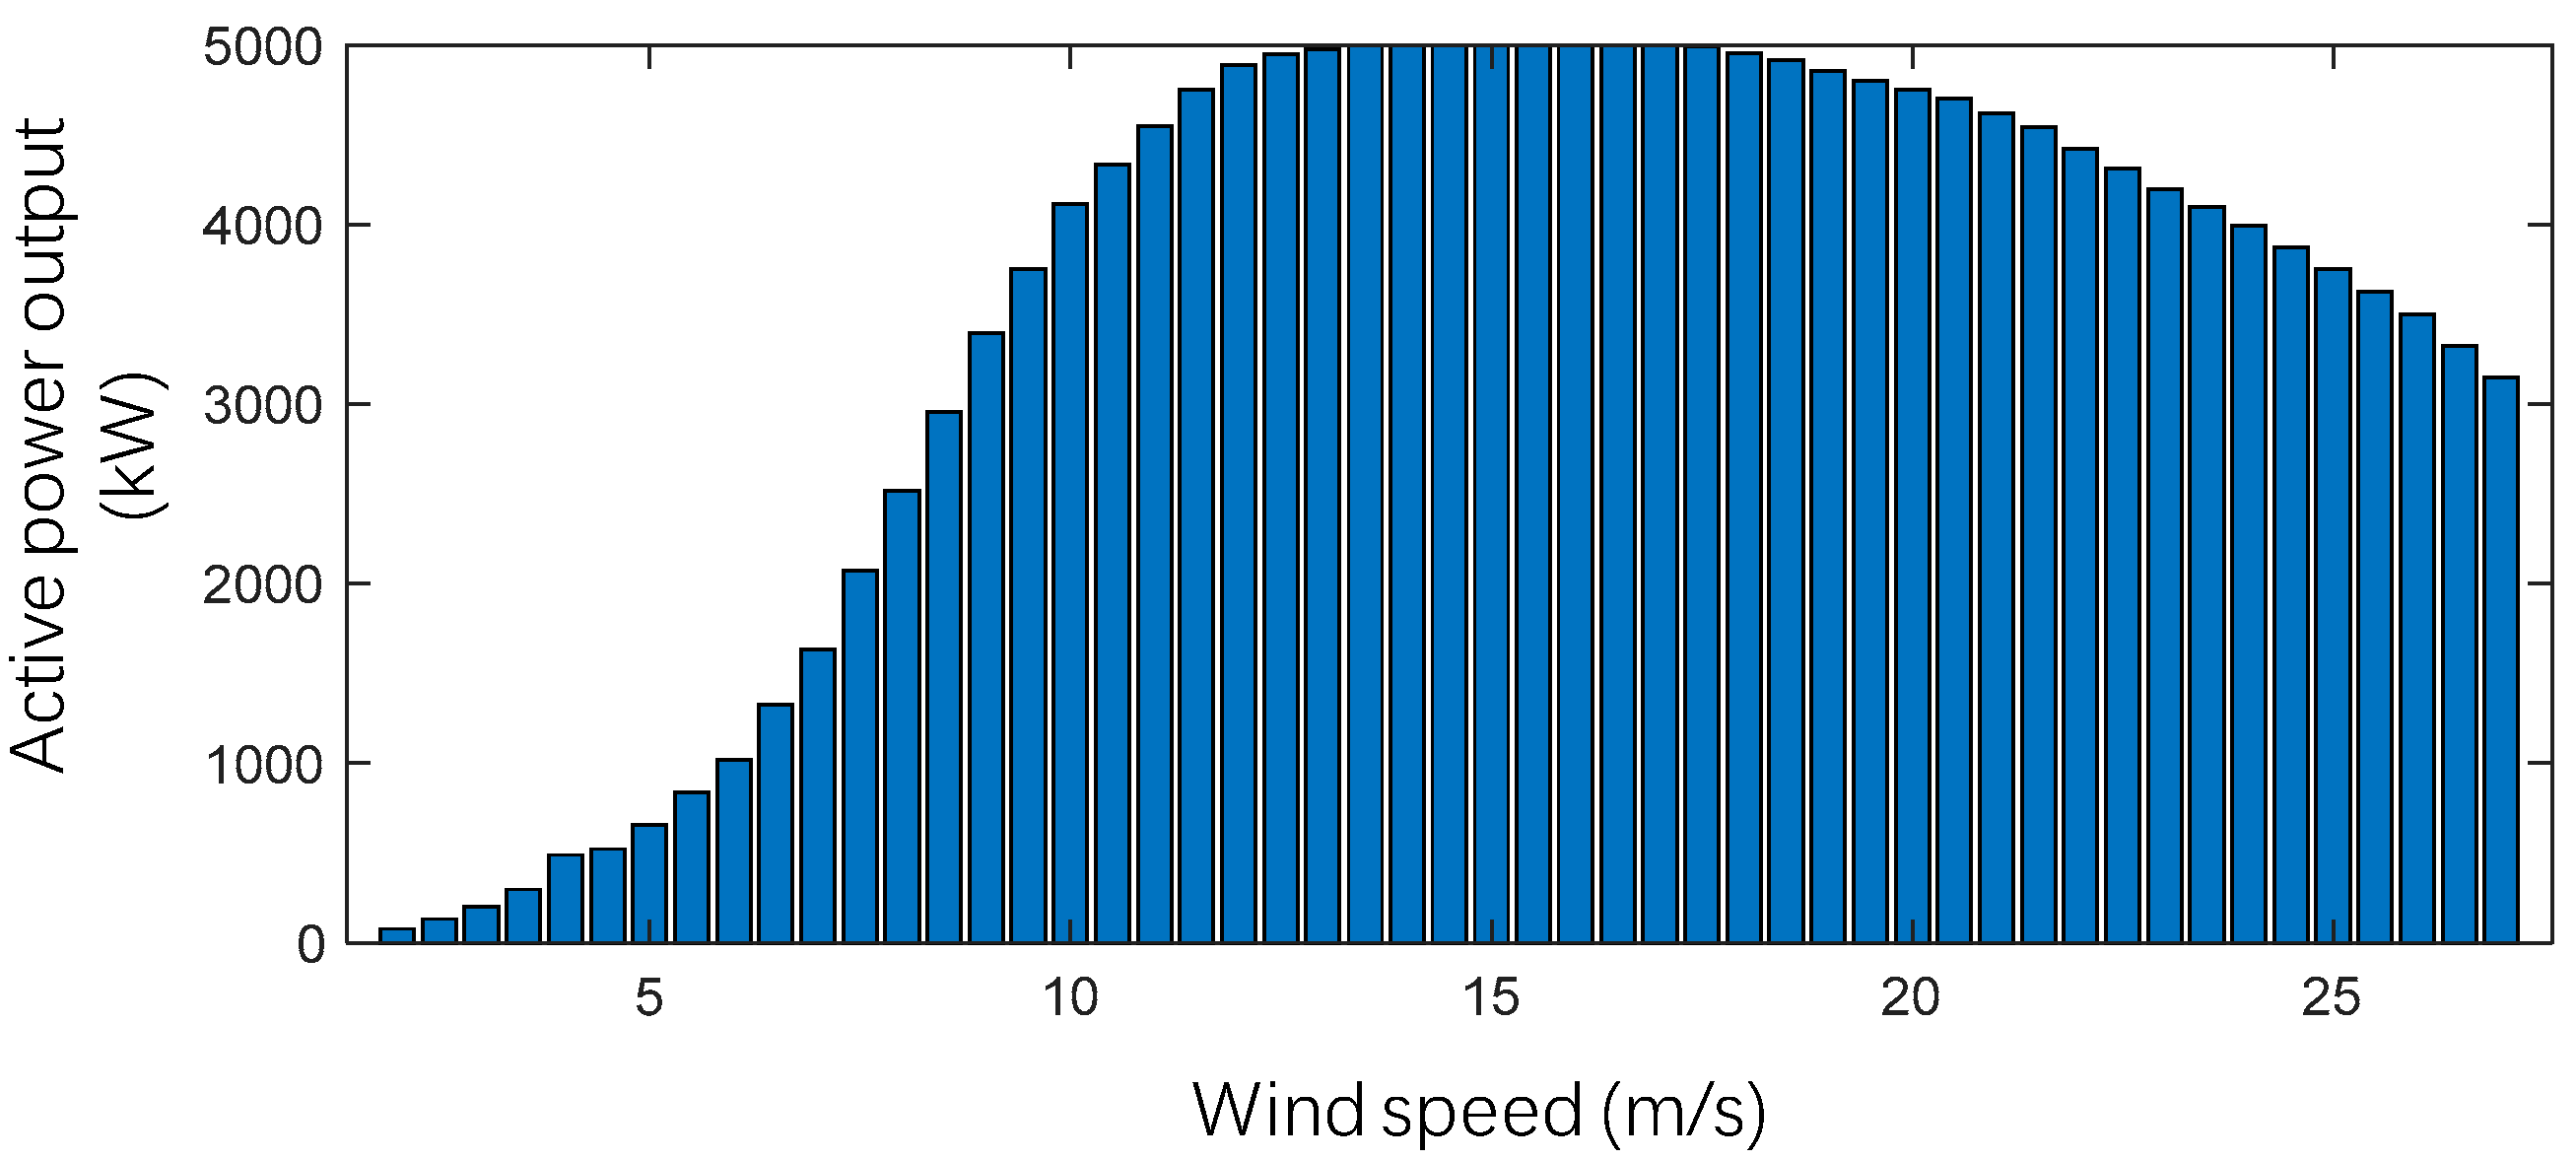
2.1. Offshore Wind Farm
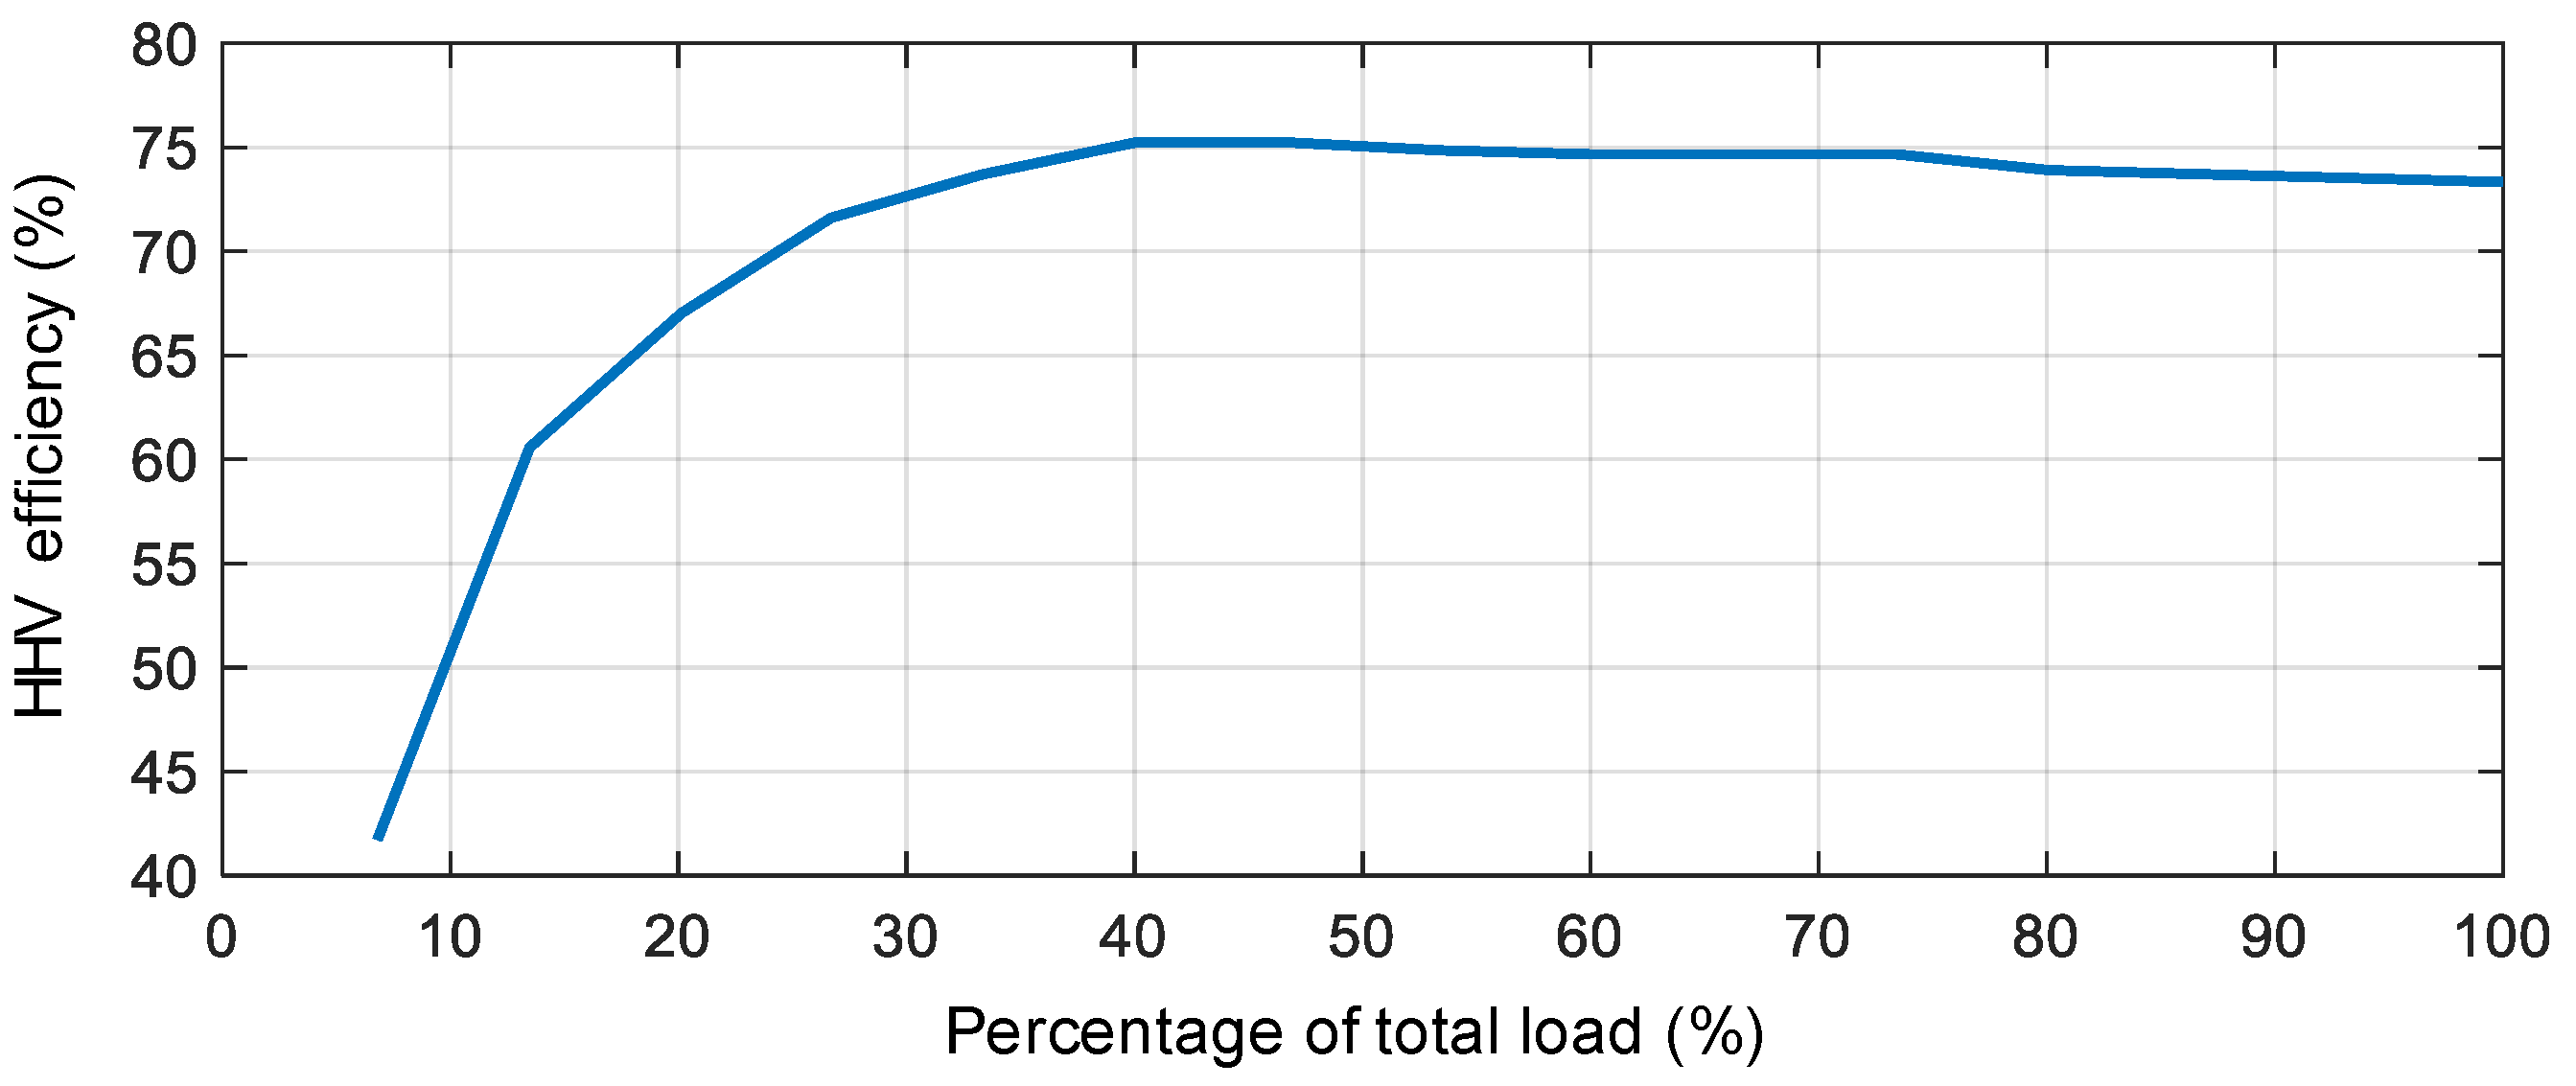
The offshore wind farm in this research consists of 20 WTs. The wind energy captured by the blades can be estimated as follows:
P = 1 2 ρ A v 3 C p
where P is the mechanical power (W), ρ is the air density (kg/m3), A is the area covered by the blades (m2), v is the wind speed (m/s), and C p is the wind energy utilization coefficient, which is nonlinear and is related to different wind speeds, blade angles, and working conditions; the estimation of it has been widely published.
A 5 MW doubly fed wind turbine model of Siemens GAMESA’s SG 5.0-132 (Siemens-Gamesa, Hamburg, Germany) is adopted in the simulation model proposed in this research according to the manufacturer’s datasheet; different WT models can be adopted by replacing the power curve. Moreover, the wake effect of the wind turbines is ignored; however, the accurate power loss coefficient resulting from the wake effect can be calculated according to the published paper [20]. The cut-in wind speed, the rated wind speed, and the cut-out wind speed of the model are 2 m/s, 13.5 m/s, and 27 m/s, respectively. The rated power curve of the model is shown in Figure 2.
Linear interpolation is used to transfer wind speed v [ t ] to output active power P W T [ t ] at timestamp t in the economic evaluation model as follows:
P W T [ t ] = η W T p i + ( v [ t ] v i ) ( p j p i ) v j v i v [ t ] v i , v j
where v i , p i and v j , p j are data from the WT power curve, η w t and is the efficiency coefficient of WT.

2.2. Hydrogen Plant

Among the available electrolysis technologies, AEC is the most well-established technology. PEMEC is also available commercially and has better start-stop characteristics than AEC and SOEC. Compared with AEC and PEMEC, SOEC has higher electrical efficiency, lower material cost, and the ability to operate in reverse as a fuel cell [22].
As ALE has superior economic performance when compared to others, it is used as the hydrogen production model in this paper. The anode and cathode electrodes are completely immersed in 20–40% ALS electrolyte (usually NaOH or KOH), and the anode and cathode are separated by a microporous separator. When DC voltage is applied to an ALC, the reactions at the cathode and anode are as follows:
Cathode :   2 H 2 O + 2 e H 2 + 2 OH
Anode :   2 OH 1 / 2 O 2 + H 2 O + 2 e
Water molecules are decomposed into hydrogen and hydroxide at the cathode. The hydroxide ions move through the separator to the anode, where an oxidation reaction occurs to generate oxygen and water. During the operation of the ALC, the water in the electrolyte is continuously consumed and needs to be replenished. The HHV efficiency e A E S of ALE adopted in this paper is shown in Figure 3 [23].
Linear interpolation is used to transfer input power v [ t ] to output active power P W T [ t ] at timestamp t in the economic evaluation model as follows:
P h y d r o g e n [ t ] = η A L E C h y d r o g e n e A E S i + ( P A L E [ t ] P i ) ( e A E S j e A E S i ) P j P i P A L E [ t ] P i , P j
where P i , e A E S i and P j , e A E S j are data from the ALE efficiency curves, η A L E is the efficiency coefficient of ALE, P A L E [ t ] and is the electric power consumed by ALE.

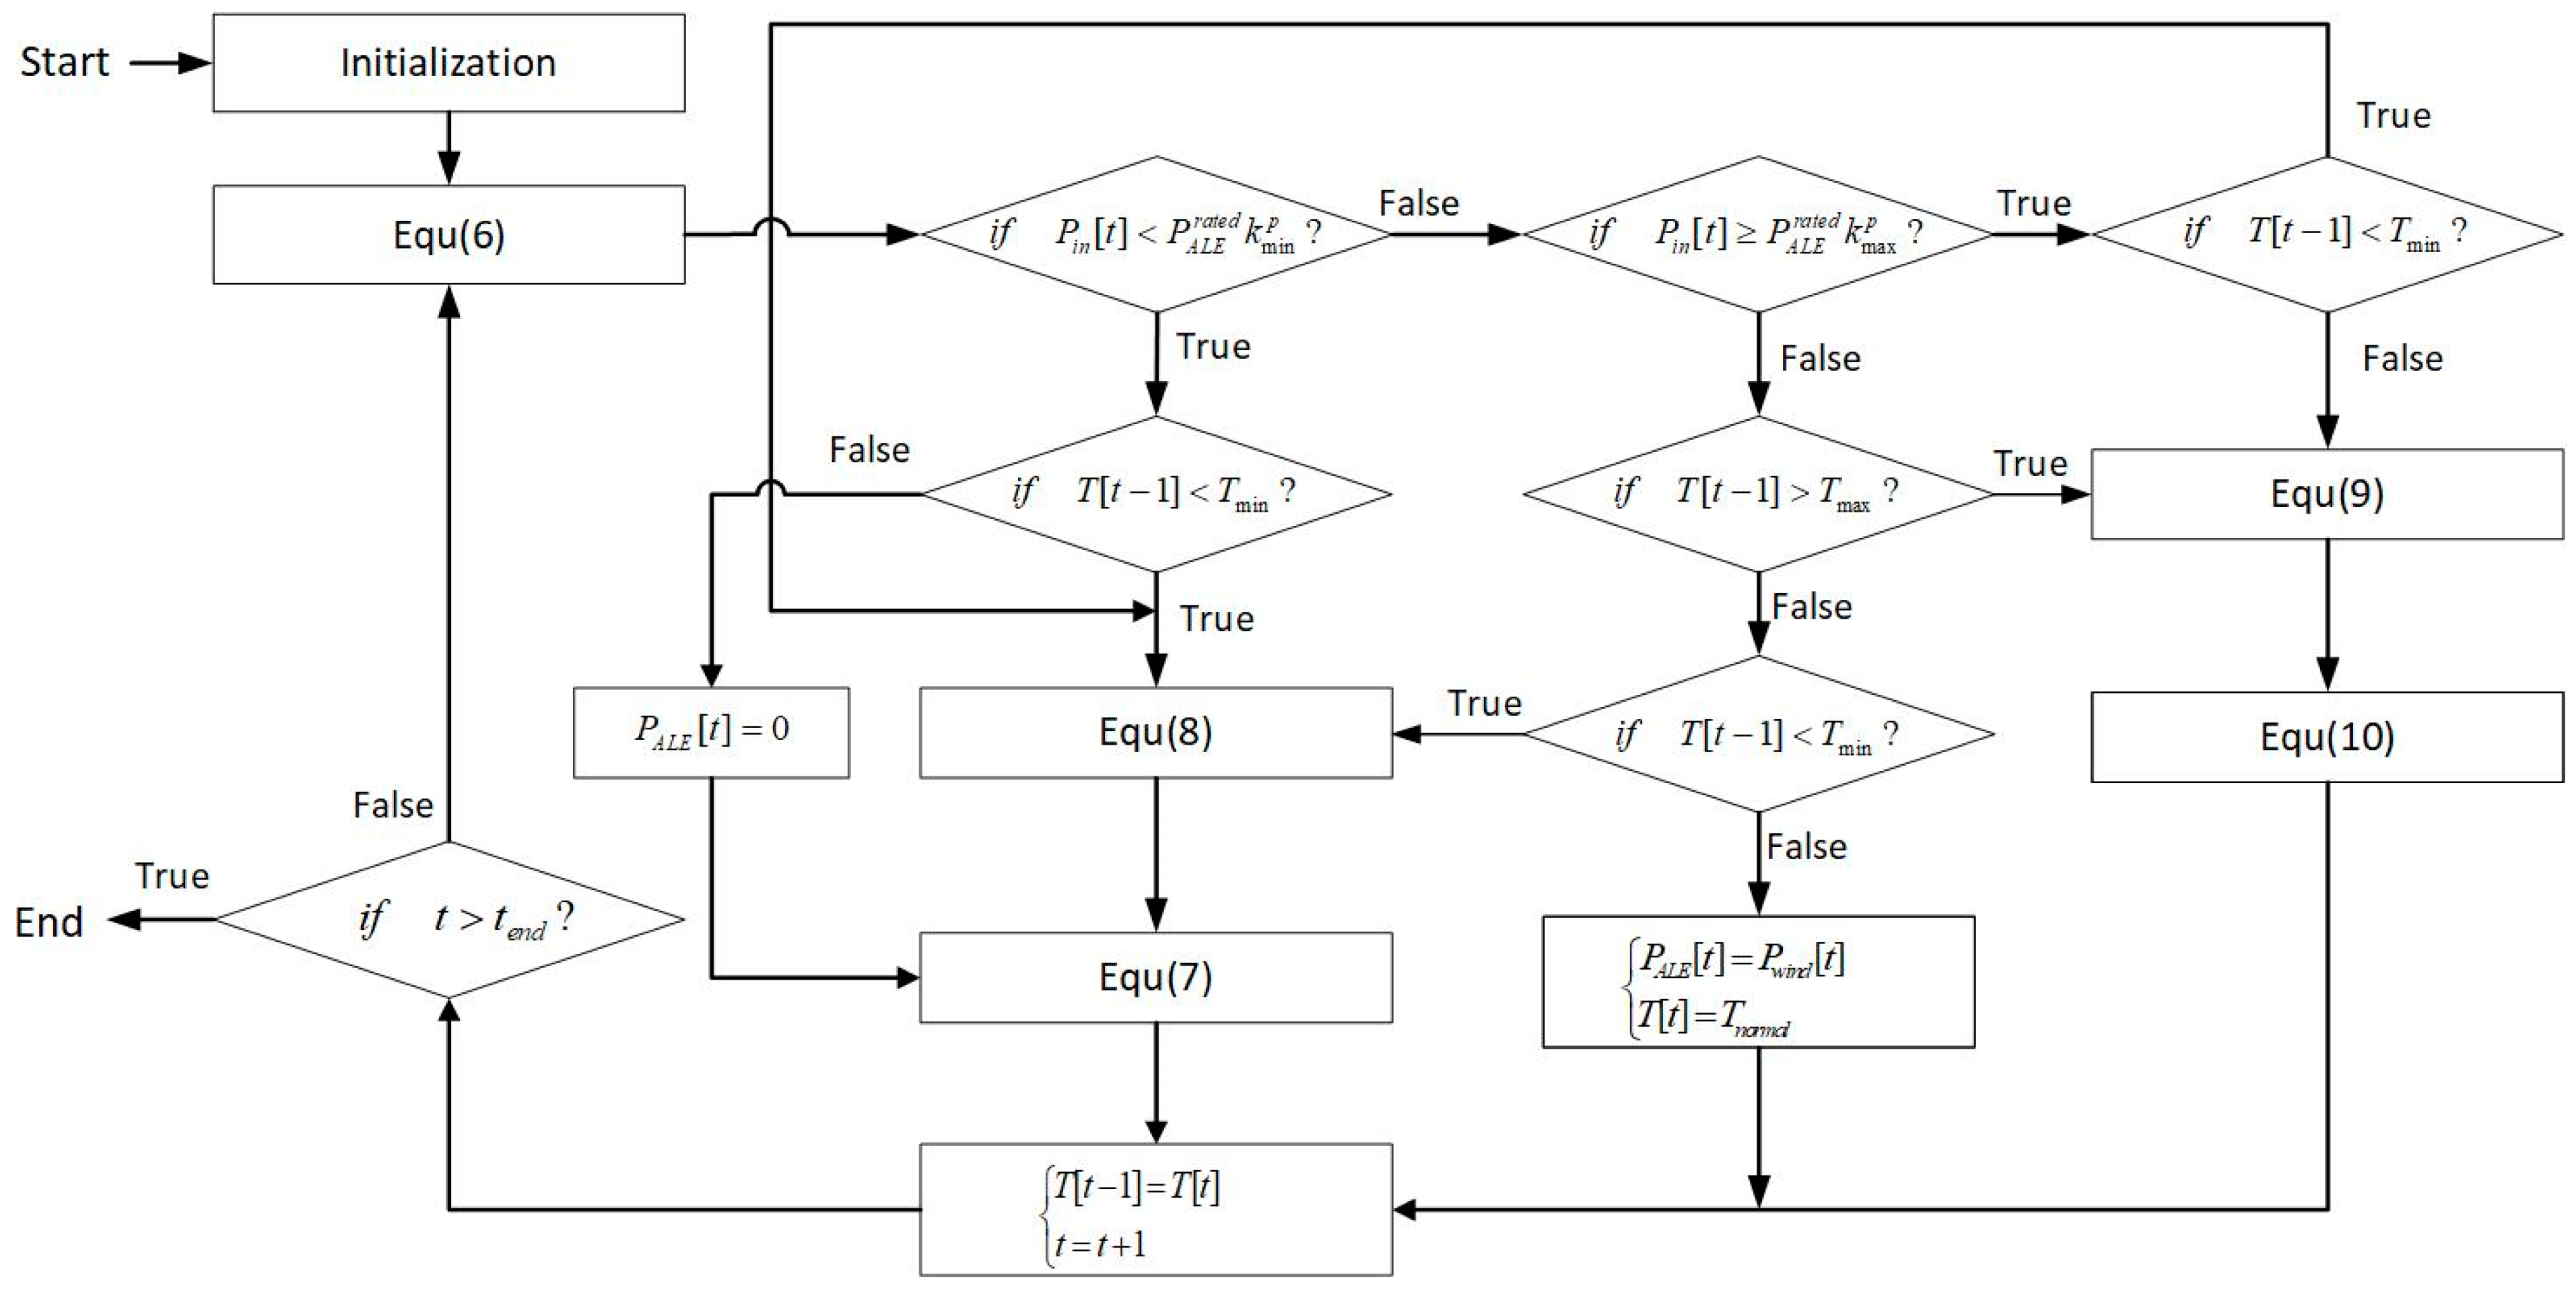
3. Proposed Operation Strategy and Simplified Techno-Economic Analysis Model

The simplified thermal model of ALE proposed in this paper is based on the following basic assumptions: (1) The ambient temperature T a m b i e n t of ALE is constant. (2) The power consumed by the temperature controller used to maintain ALS temperature when ALE works normally is ignored. (3) The upper-level EMS will control the wind farm to reduce power generation when power cannot be consumed by the ALE plant. (4) The excessive input power will result in the inability of the ALE temperature control system to dissipate the additional heat generated by the chemical reaction. (5) The ALS temperature will linearly change according to the excessive input power.
The proposed model shown in Figure 4 is divided into three parts according to the relation of P i n [ t ] and P A L E r a t e d , which are the input power of a single ALE at timestamp t and the rated electrical power capacity of ALE, respectively. Firstly, in the analysis model, the input power of a single ALE can be calculated as follows:
P i n [ t ] = η trans × N W T × P W T [ t ] N ASE
where the number of offshore WTs, the dedicated transmission line efficiency, and the number of onshore ALE s are set to N W T , η trans , and N ASE , respectively.
When P i n [ t ] in per unit is smaller than the ALE minimum power threshold k min p resulting from wind power fluctuation in islanded mode, the ALE stops producing hydrogen due to safety reasons. As the electrolysis reaction stops, the ALS begins to cool down naturally. To decrease the preheating time for ALE after electric power is restored to normal, the ALE temperature controller is set to work after the temperature drops below the threshold T min . In this case, the temperature of ALS at timestamp t can be calculated as follows:
T [ t ] = T [ t 1 ] k c o o l i n g T + t s t e p C A E S P A E S [ t ]
where T [ t ] and T [ t 1 ] are ALS temperatures at the current and last timestamps, respectively. k c o o l i n g T is the cooling coefficient of ALS with the unit of degrees Celsius per timestamp, and C A E S is the amount of heat required for a 1 °C change in ALS. In this situation, P A L E [ t ] only consists of power consumed by the ALE temperature controller, which can be calculated as follows:
P A L E [ t ] = min P i n [ t ] , P T E M P r a t e d
where P T E M P r a t e d is the rated power capacity of the ALE temperature controller.
After the electric power P i n [ t ] in per unit increases in the range of [ k min p , 1 ) and the ALS temperature is heated in the range of T min , T max , ALE will start to produce hydrogen again. The consumed electric power P A L E [ t ] in this operating condition is equal to P i n [ t ] .
When P i n [ t ] in per unit is bigger than [ 1 , k max p ) , it is reasonable to take advantage of the ALE overload capability to increase the energy usage rate when the system works in islanded mode. However, ALE should be constrained within the absolute maximum overload time t o v e r l o a d and the ALS absolute maximum temperature T o v e r l o a d . Therefore, the consumed power of ALE can be calculated as follows:
P A L E [ t ] = min P i n [ t ] , C A E S T o v e r l o a d T [ t 1 ] t s t e p ( 1 e A E S T [ t 1 ] ) + P A L E r a t e d i t < t o v e r l o a d P A L E r a t e d o t h e r
where e A E S T [ t 1 ] is the HHV efficiency of ALE at temperature at timestamp t − 1, and t s t e p is the step time in the simulation.
The ALE temperature in this situation can be estimated as follows:
T [ t ] = T [ t 1 ] + ( 1 e A E S T [ t 1 ] ) t s t e p C A E S ( P A L E P A L E r a t e d )
In this way, the total electric power consumed by ALE can be calculated, and the hydrogen production can be estimated through the efficiency feature of ALE.

4. Simulation Verification

The proposed techno-economic analysis model of the islanded hydrogen-wind system is verified based on scenario testing. In the simulation, the power transmission system of the islanded green hydrogen system is simplified to the efficiency factor kHVDC. The Weibull distribution is used as the wind speed probability density function to generate a random sequence of wind speed data based on the average and maximum wind speed.
f ( x ; k , c ) = k c ( x c ) k 1 e ( x / c ) k
where x is the random wind speed variable, k is the shape parameter, and c is the scale parameter. These two parameters govern the shape and scale of the distribution. The shape parameters and scale parameters can be estimated through the maximum and average wind speeds [24].
The parameters used in the model are shown in Table 1.

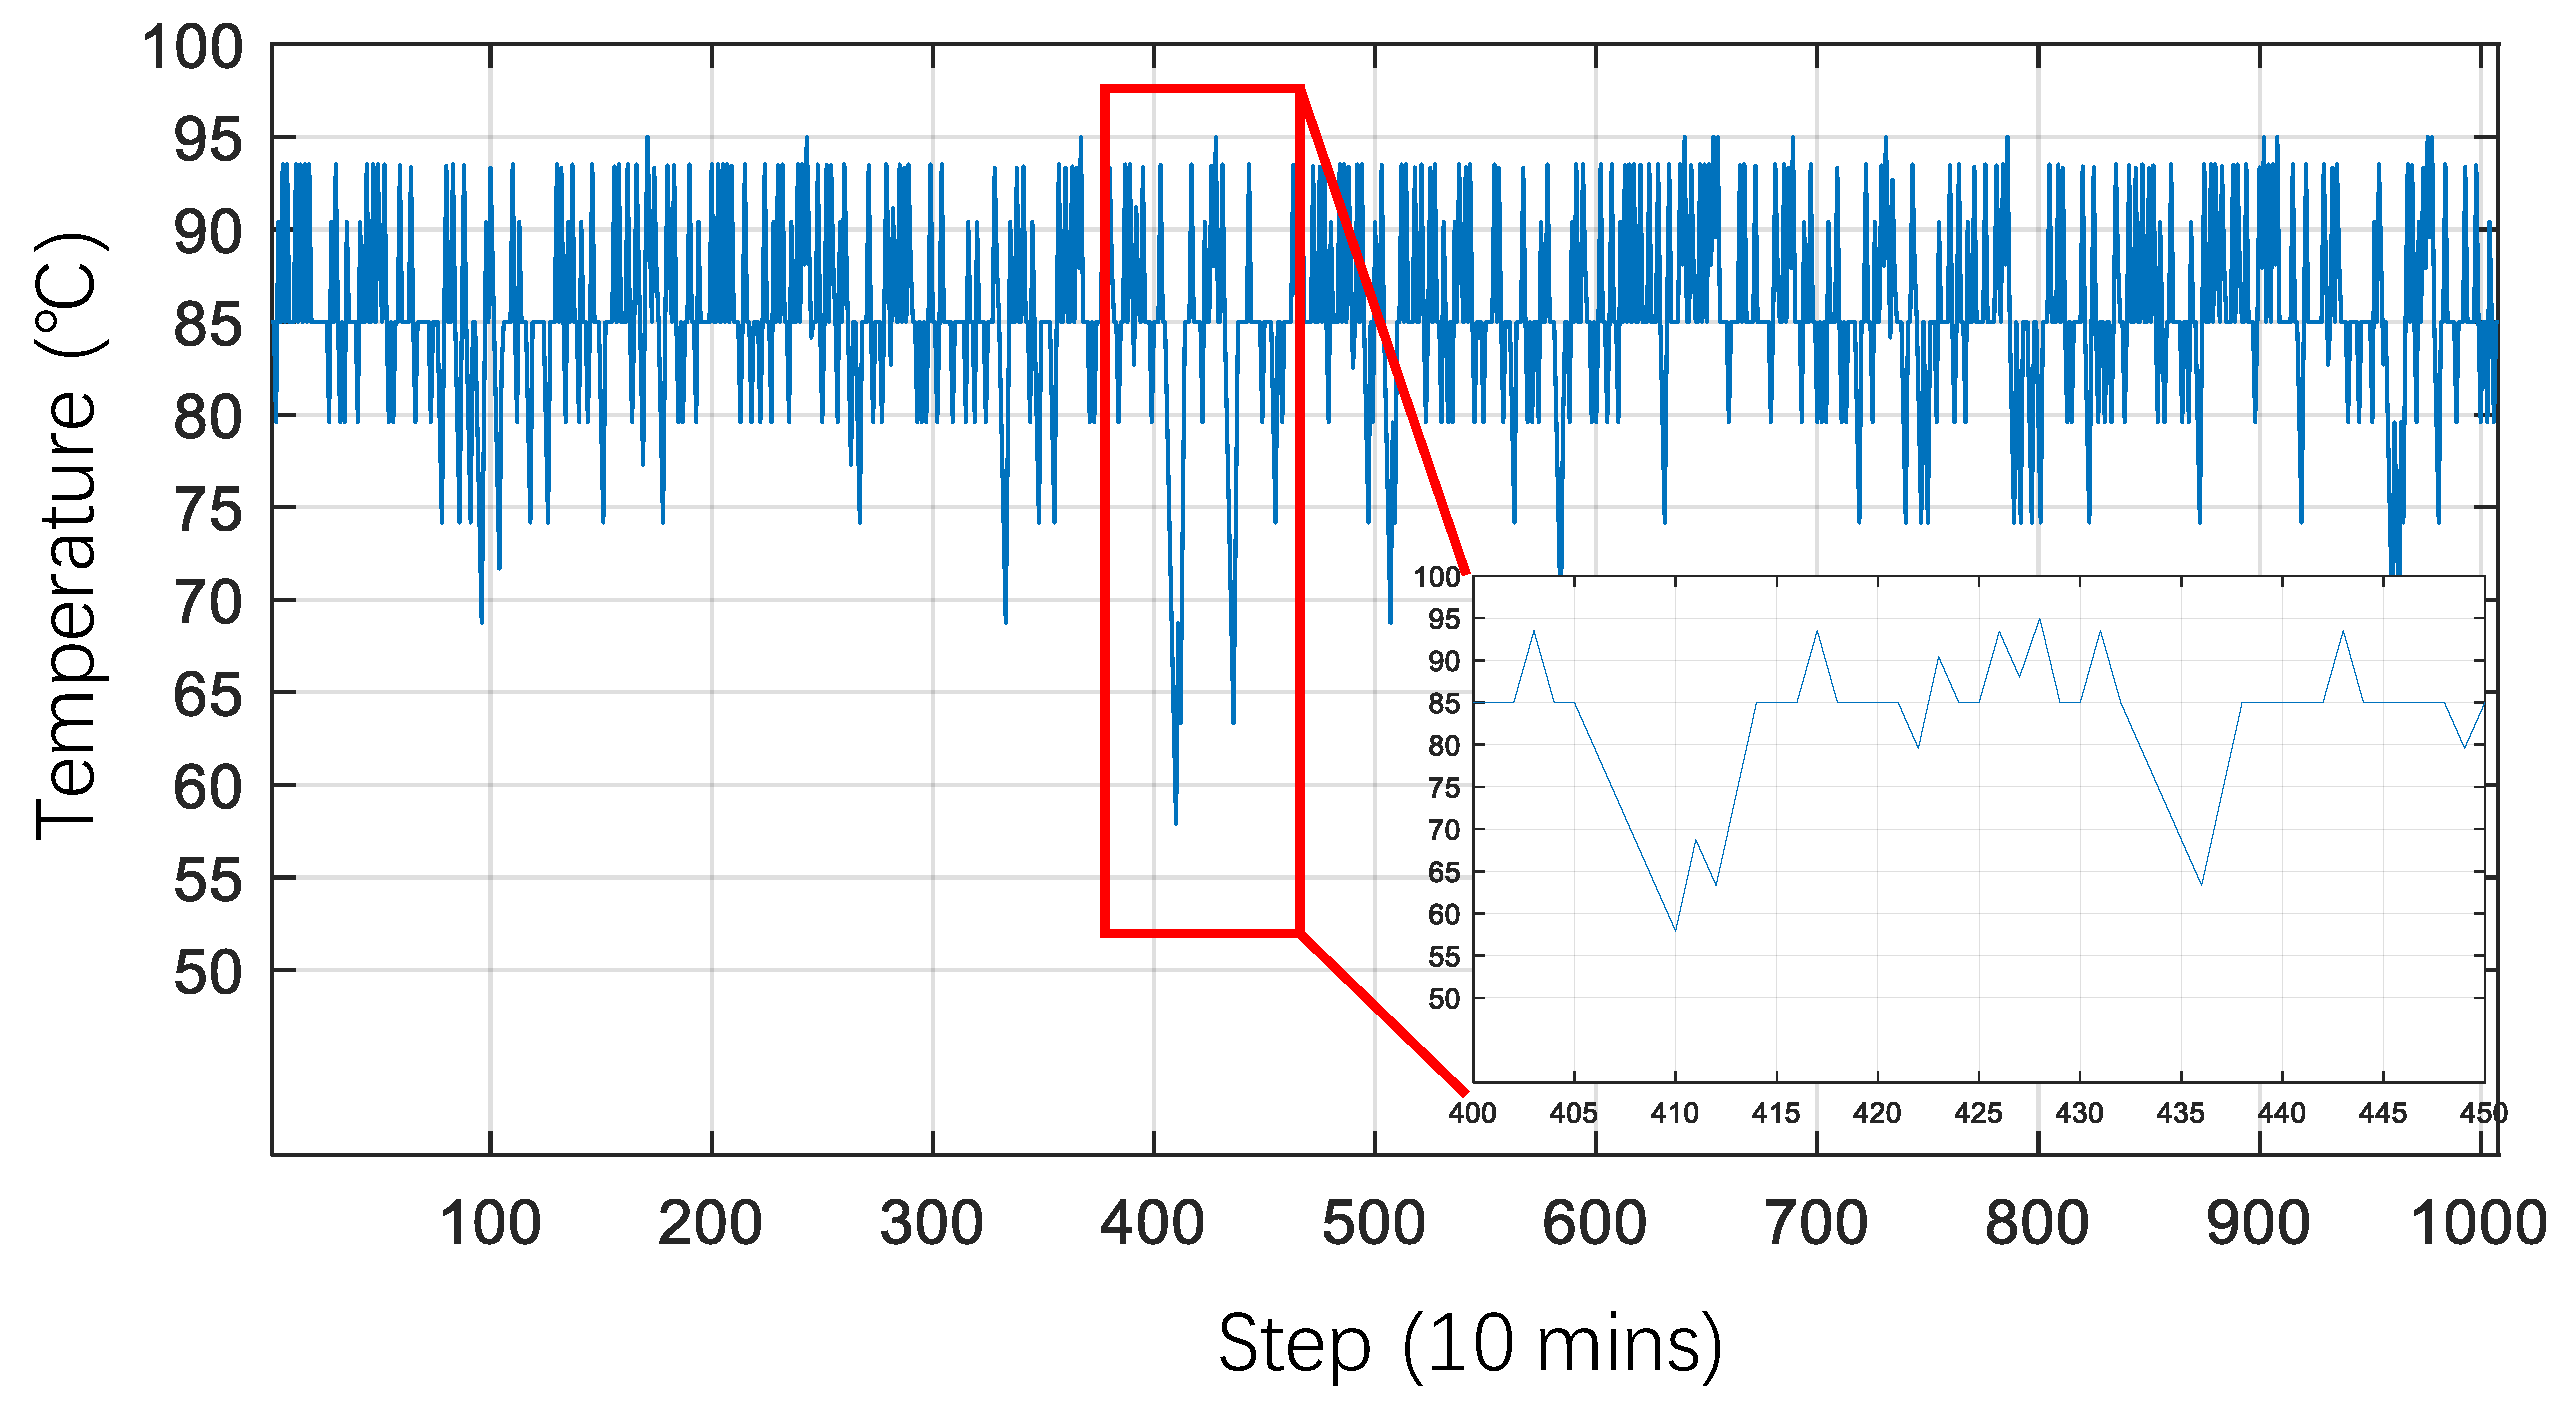
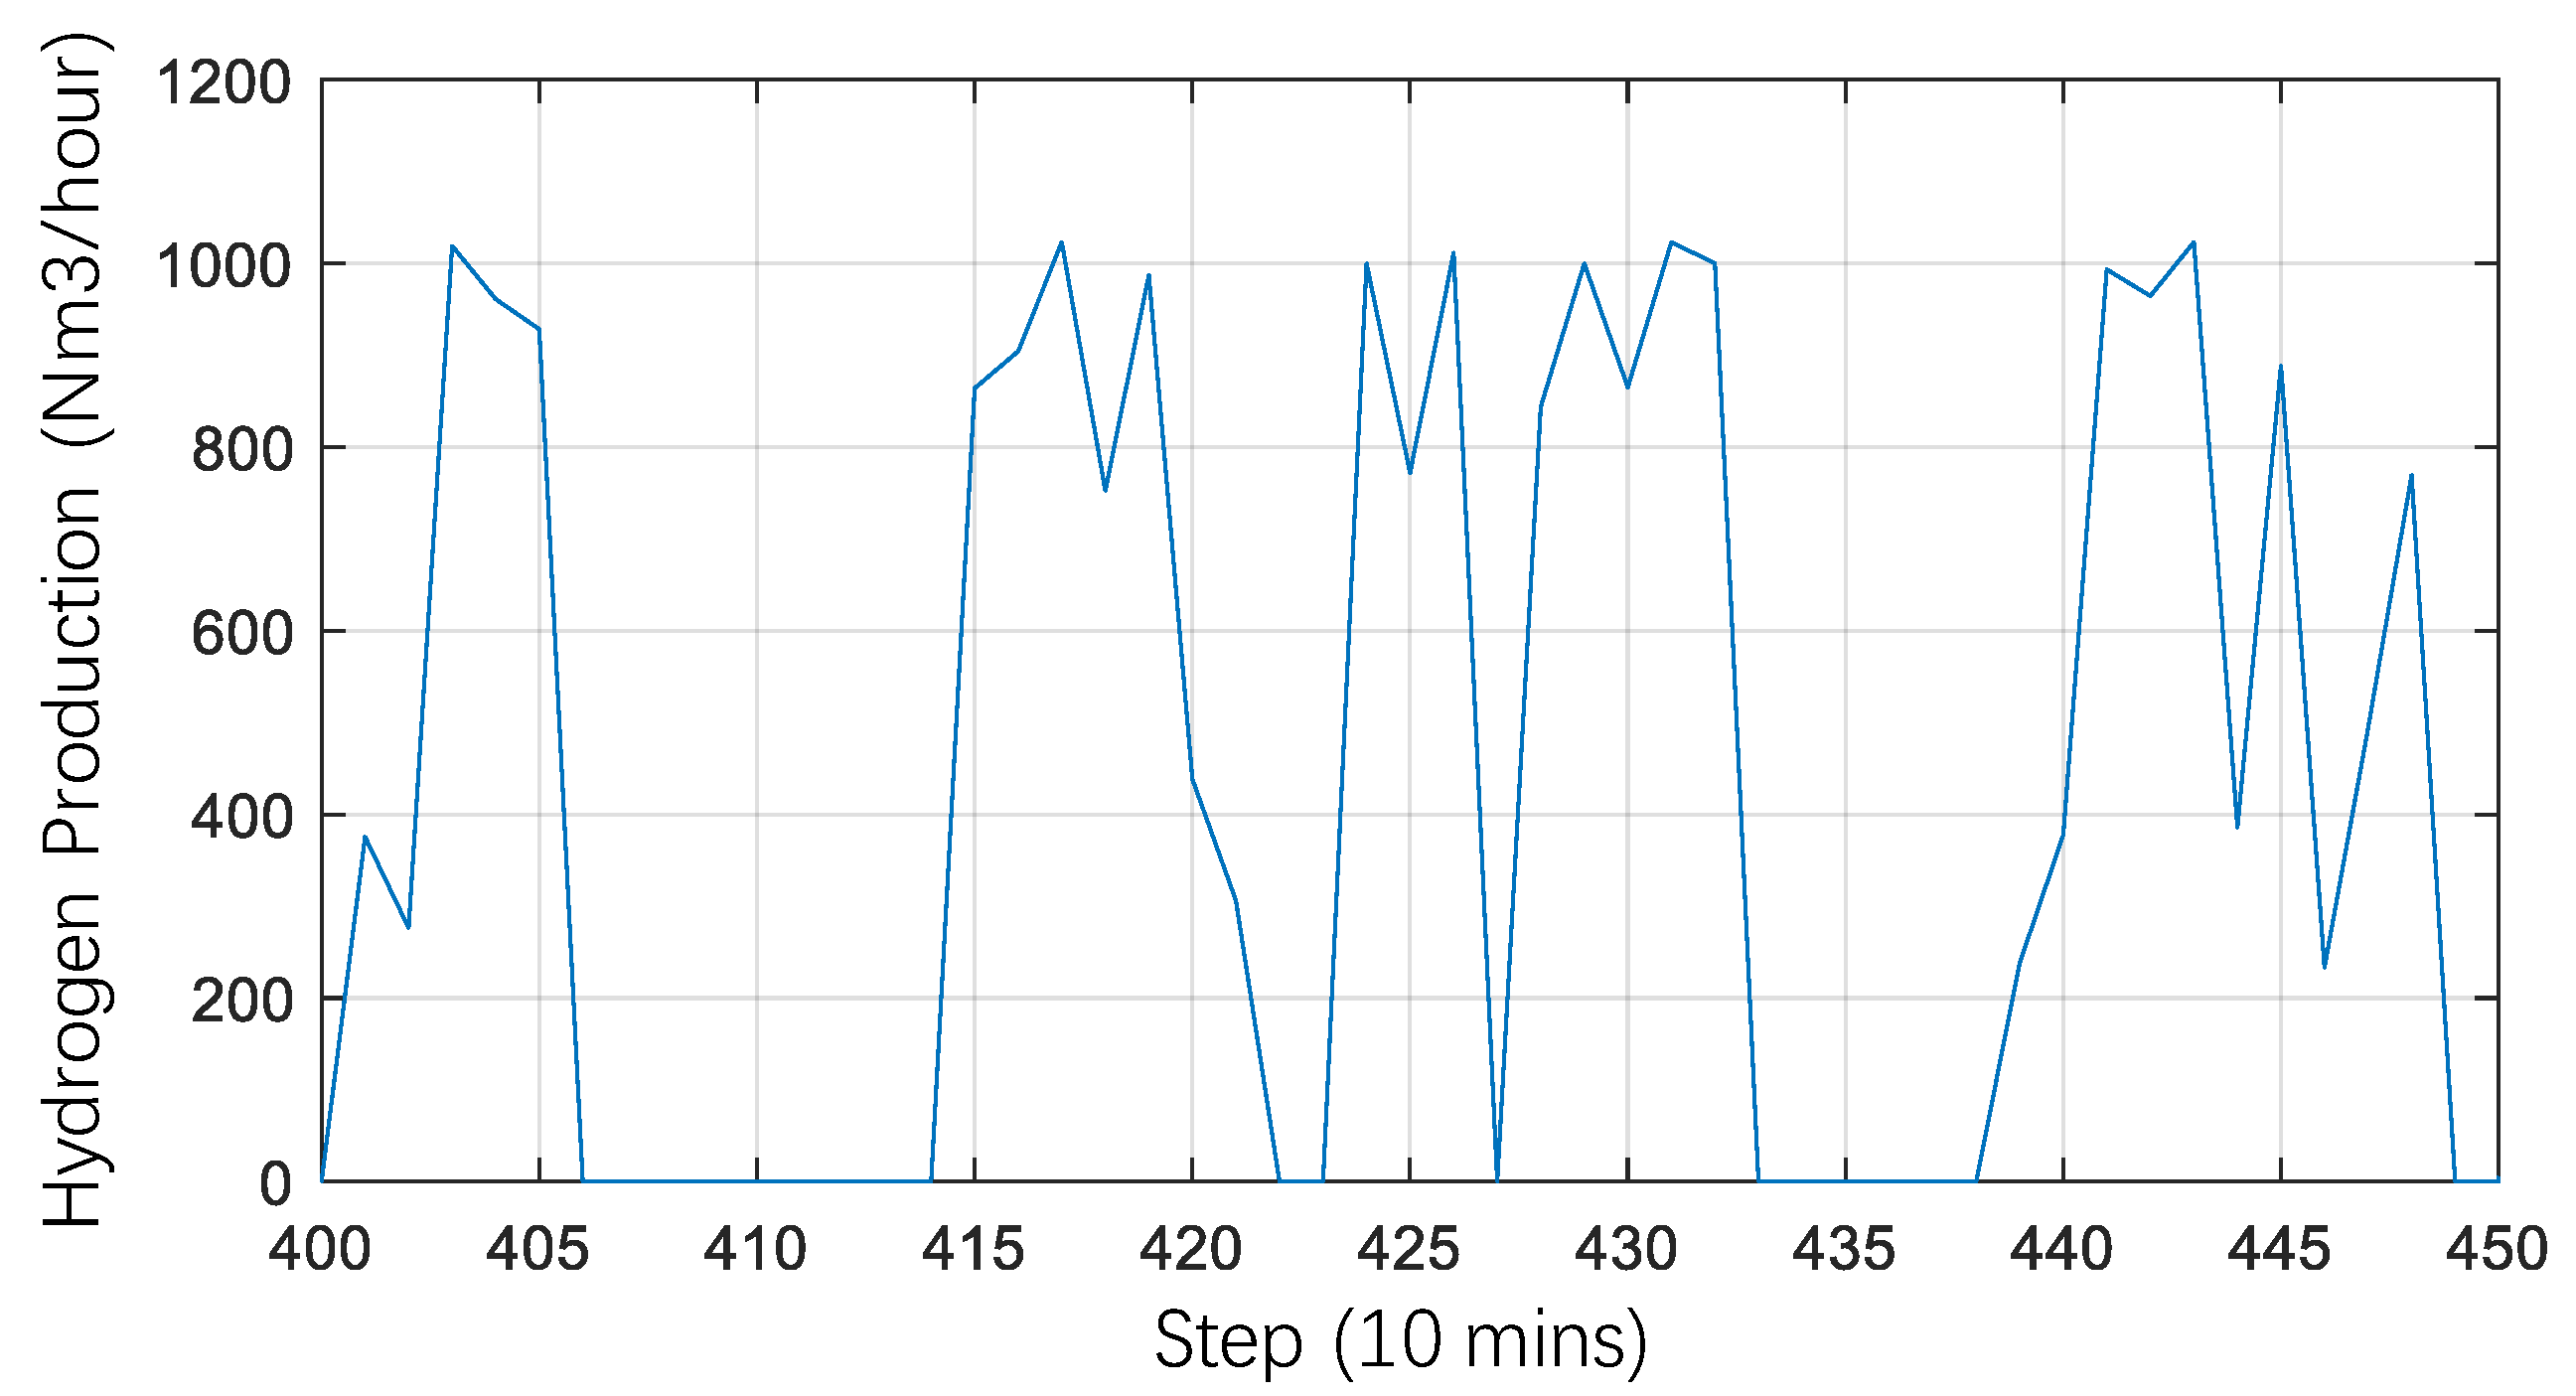
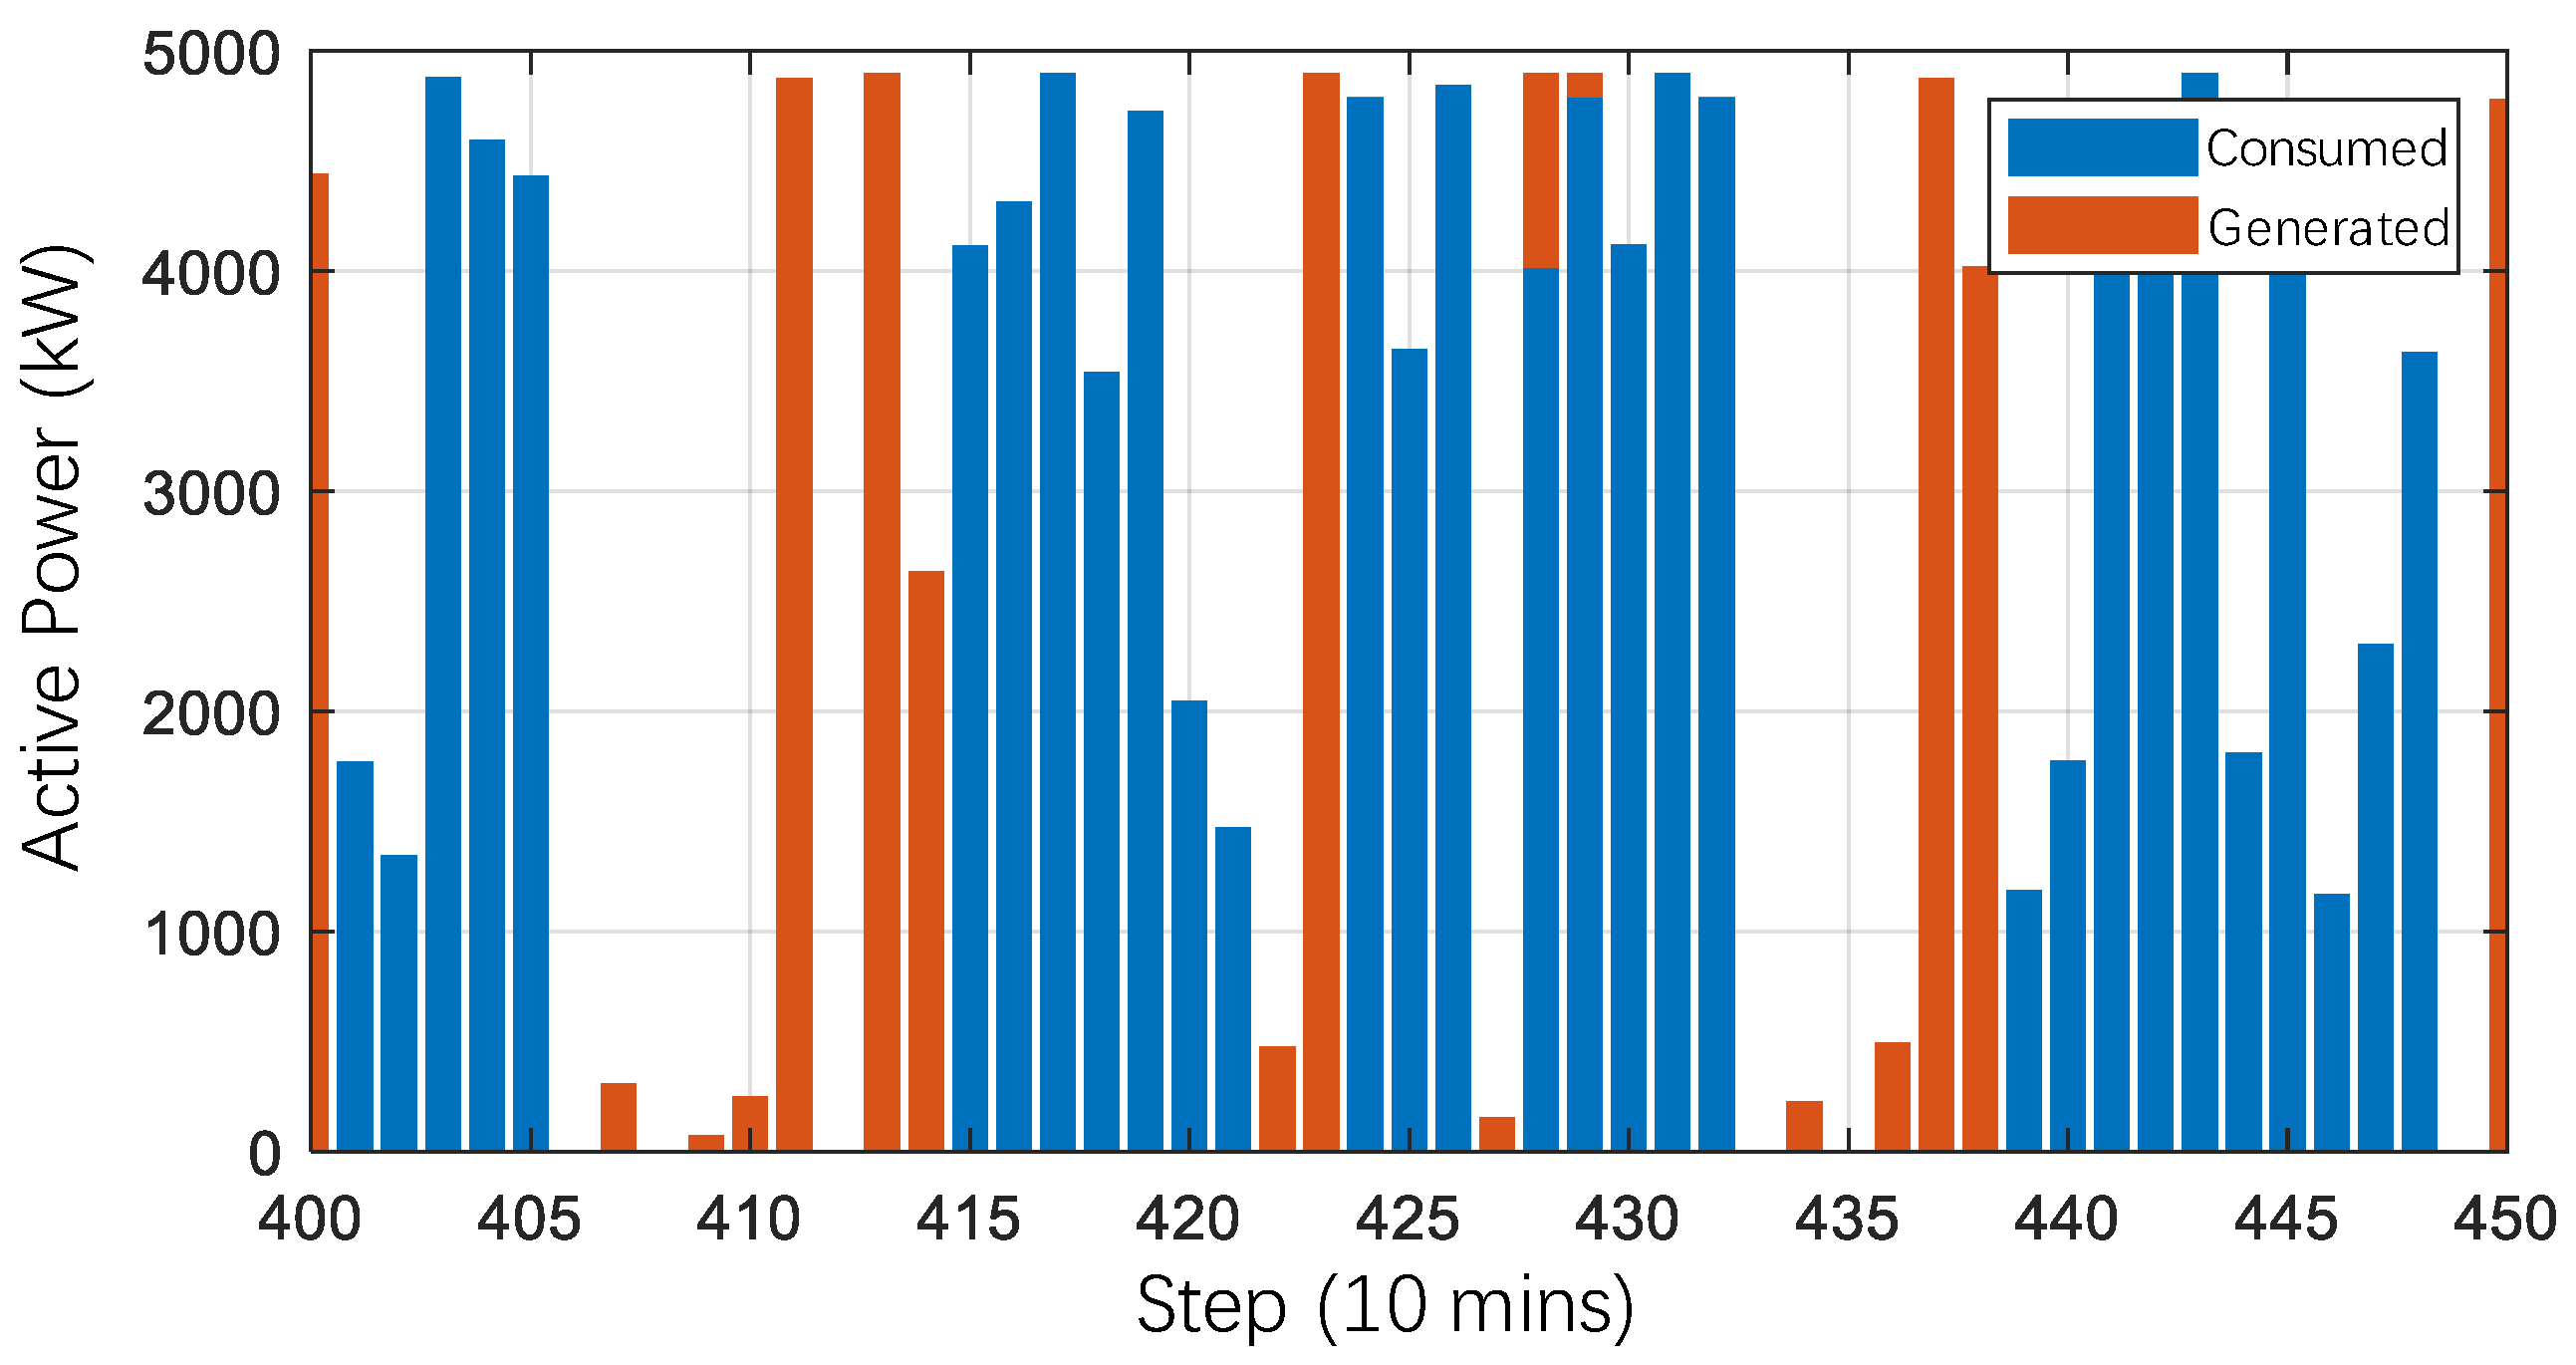
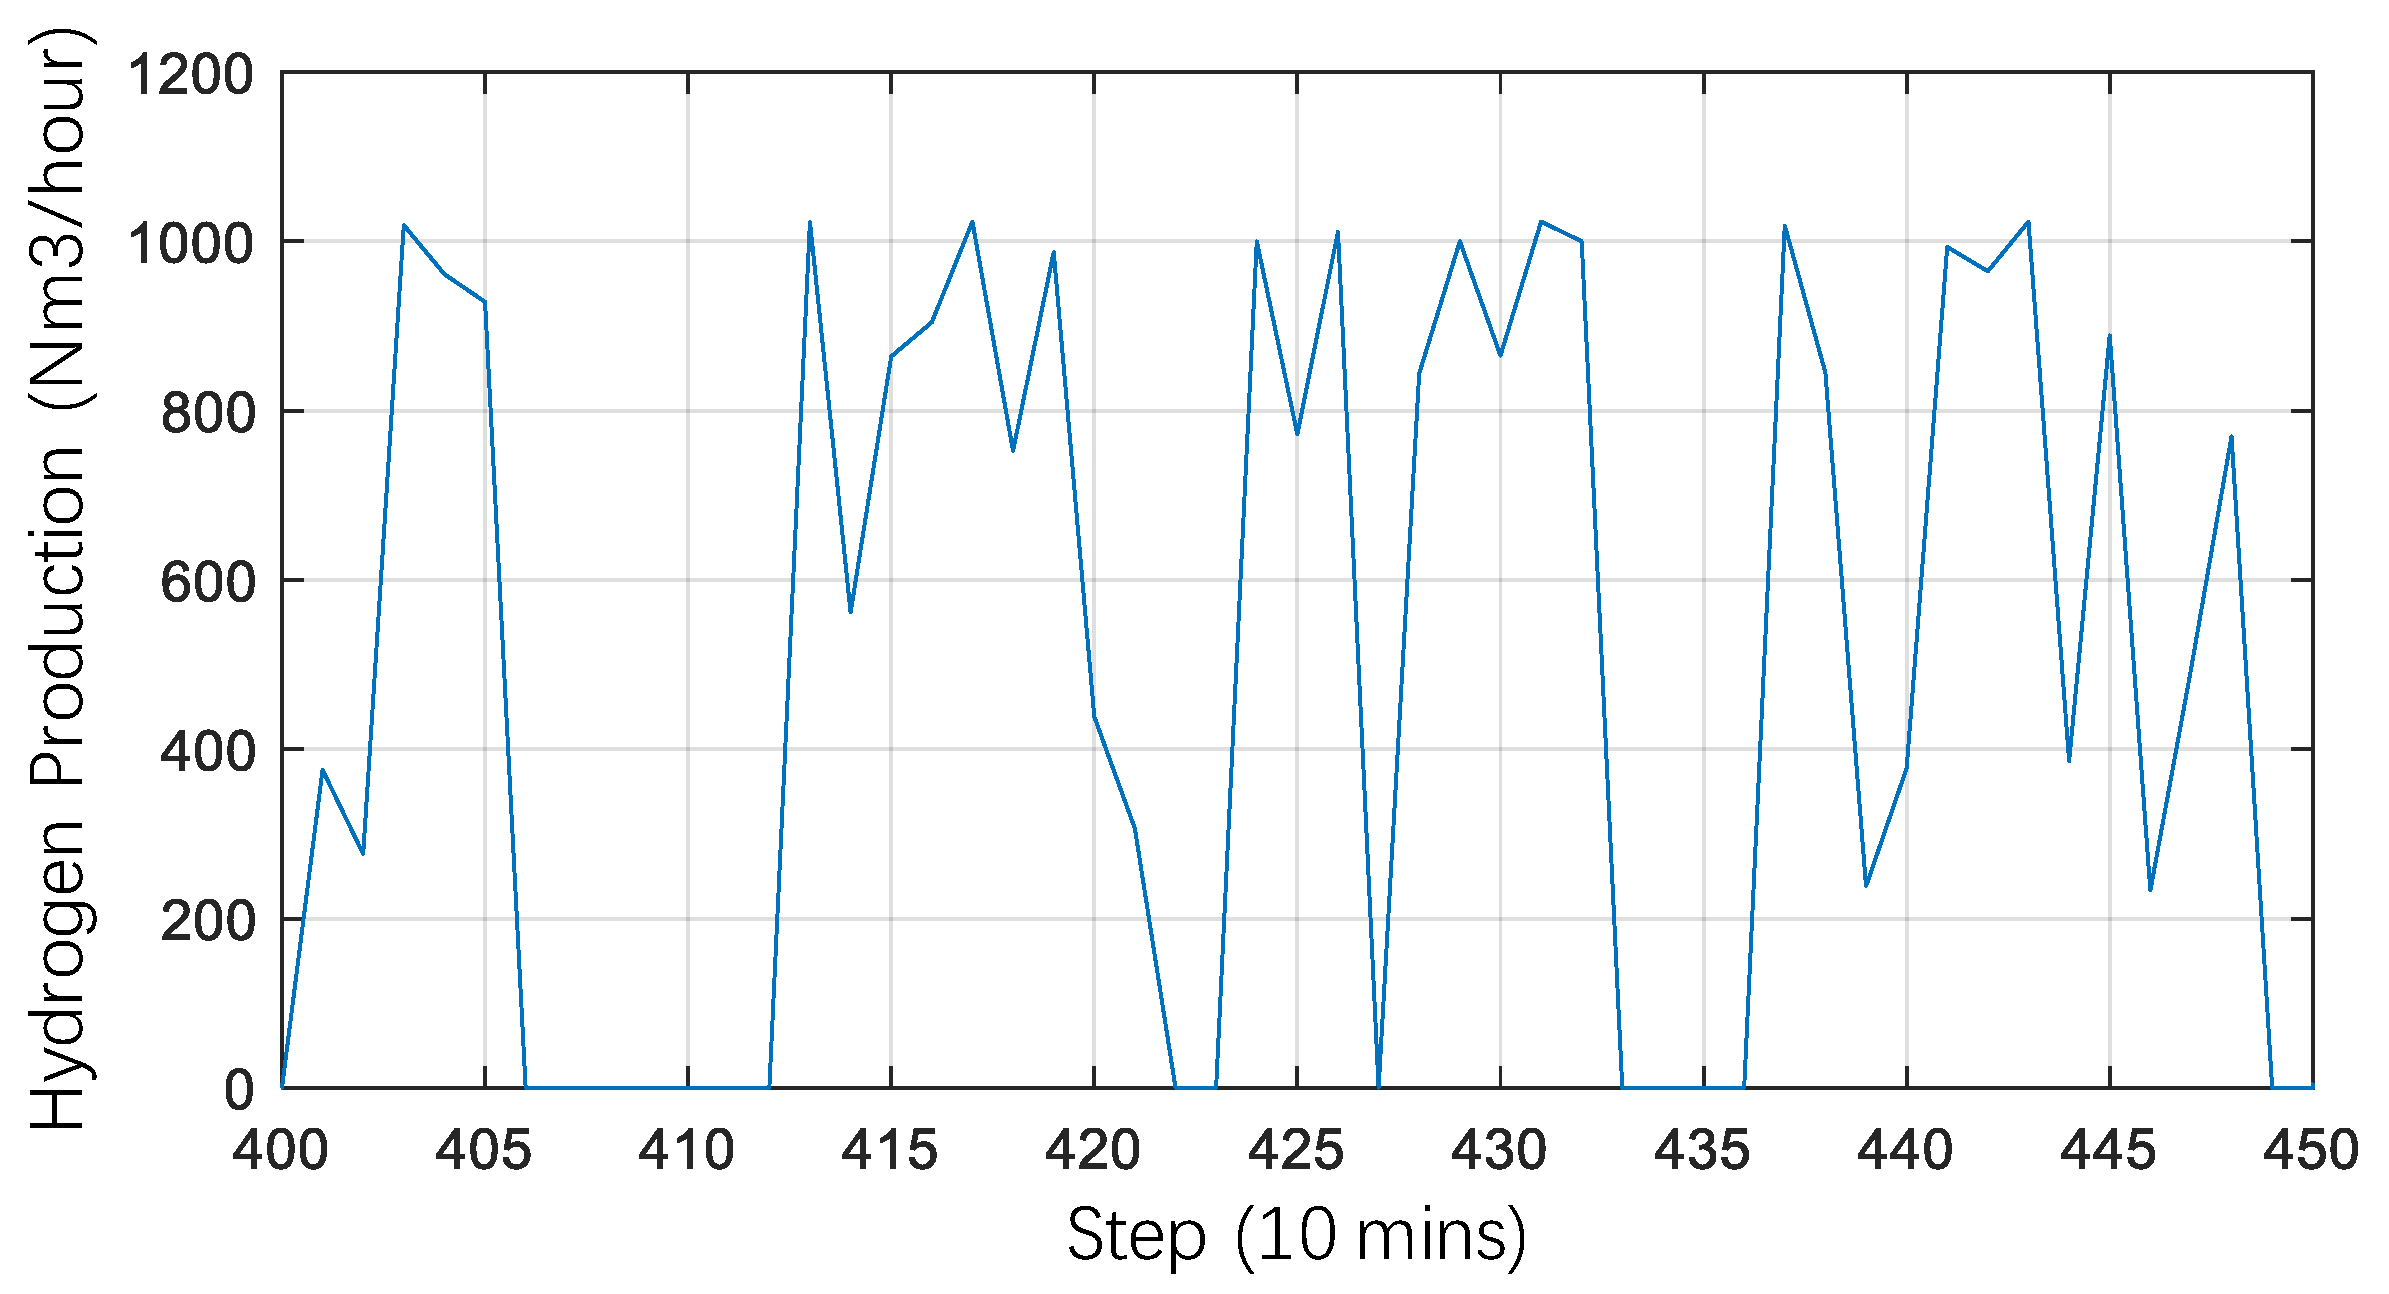
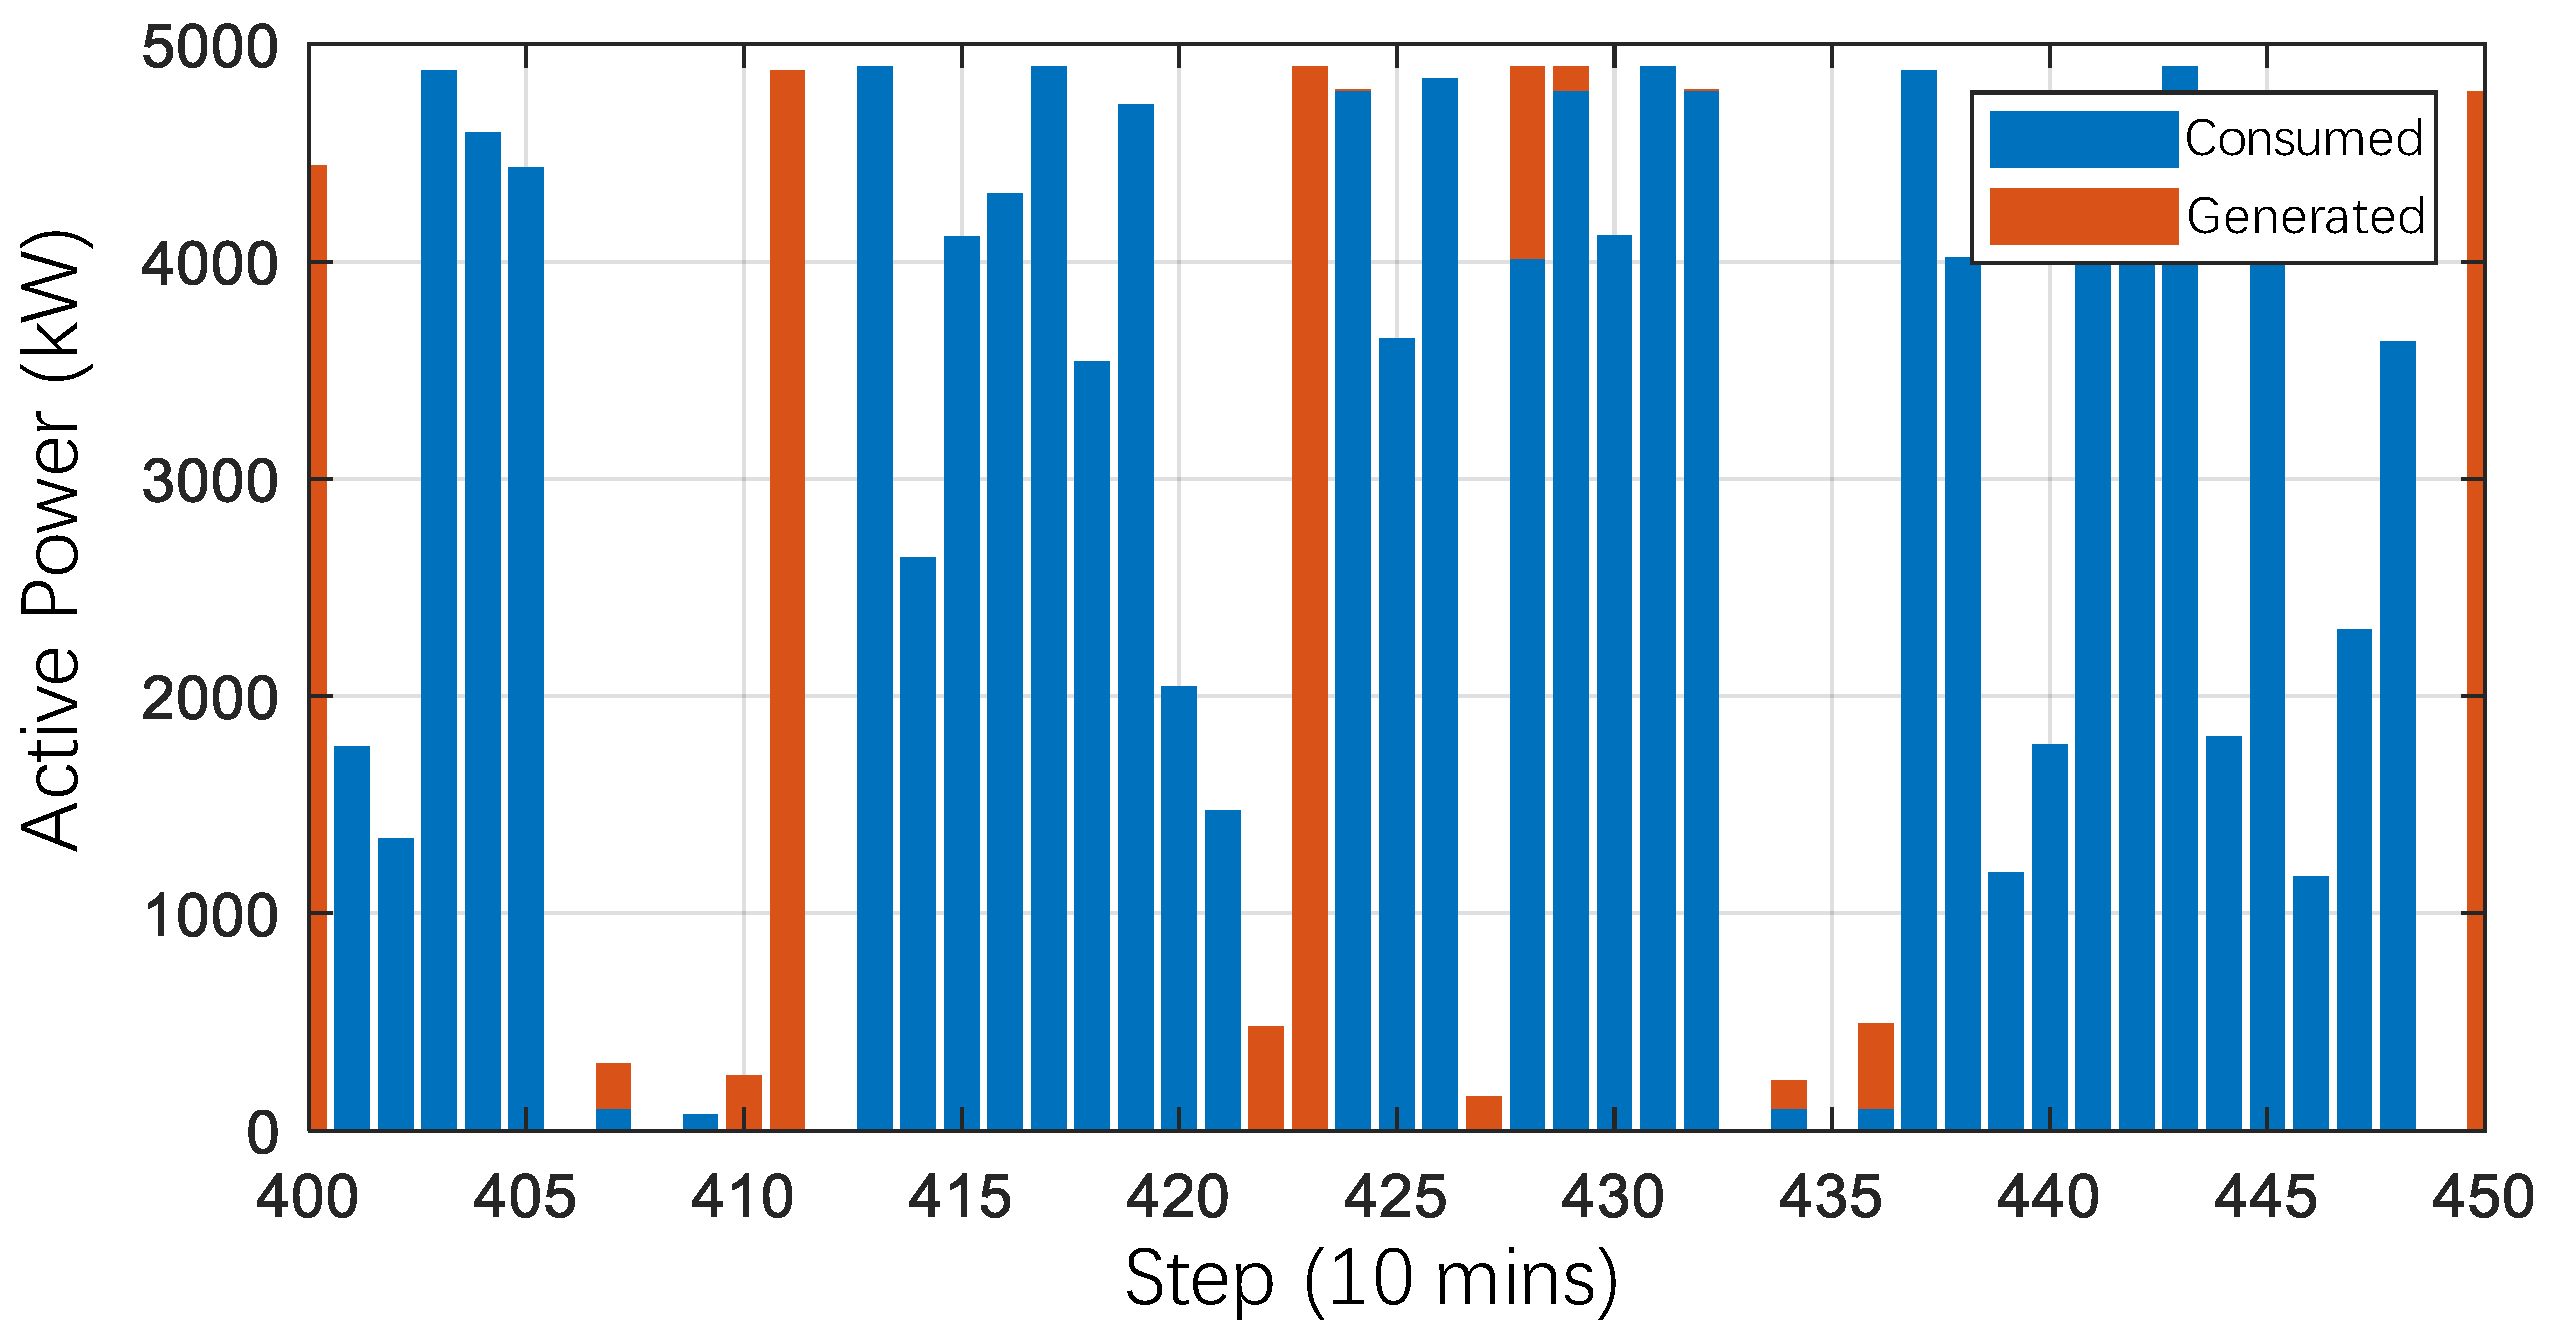
4.1. Testing Scenario 1

In this simulation test scenario, the average wind speed of the wind power test data used is 12 m/s, the maximum wind speed is 30 m/s, the morphological parameter is 0.486, and the wind speed probability density and wind speed waveform are in Figure 5 as follows.
In this scenario, no auxiliary insulation control is adopted to keep the ALE temperature when the input power of ALE is less than the minimum threshold. That is, when the input power of ALE is less than the minimum threshold, ALE will shut down and cool down naturally. The temperature curve of ALE is shown in Figure 6.
Due to the low input power caused by the wind power fluctuation, it can be seen that the temperature of ALE dropped below 80 °C at the 406th and 434th simulation steps, respectively, which caused ALE to shut down. As the input power is greater than the minimum threshold at the 410th and 436th simulation steps, the heater begins to heat ALE before starting to work, and the duration of the heating is related to the lowest temperature of ALE. The hydrogen production of ALE is shown in Figure 7.
The wind speed fluctuation influences hydrogen production, and the hydrogen production of ALE drops to 0 at the 406th and 434th simulation steps. Moreover, the system was still in the shutdown state before the solution was heated to 80 °C. Therefore, the cooling and heating process of the ALS reduced hydrogen production.
The energy utilization in this scenario is shown in Figure 8. It can be seen that wind energy is not effectively utilized between the 406th and 414th steps and between the 435th and 438th steps, respectively when insulation is not adopted, which results in the deviation between the power generated by the WT and consumed by ALE. Therefore, in this case, the output power of the offshore wind power plant needs to be reduced by the EMS to achieve energy balance. The statistics and analysis for a hydrogen plant composed of 20 ALEs are performed based on 30 days of wind speed test data; the results are shown in Table 2.

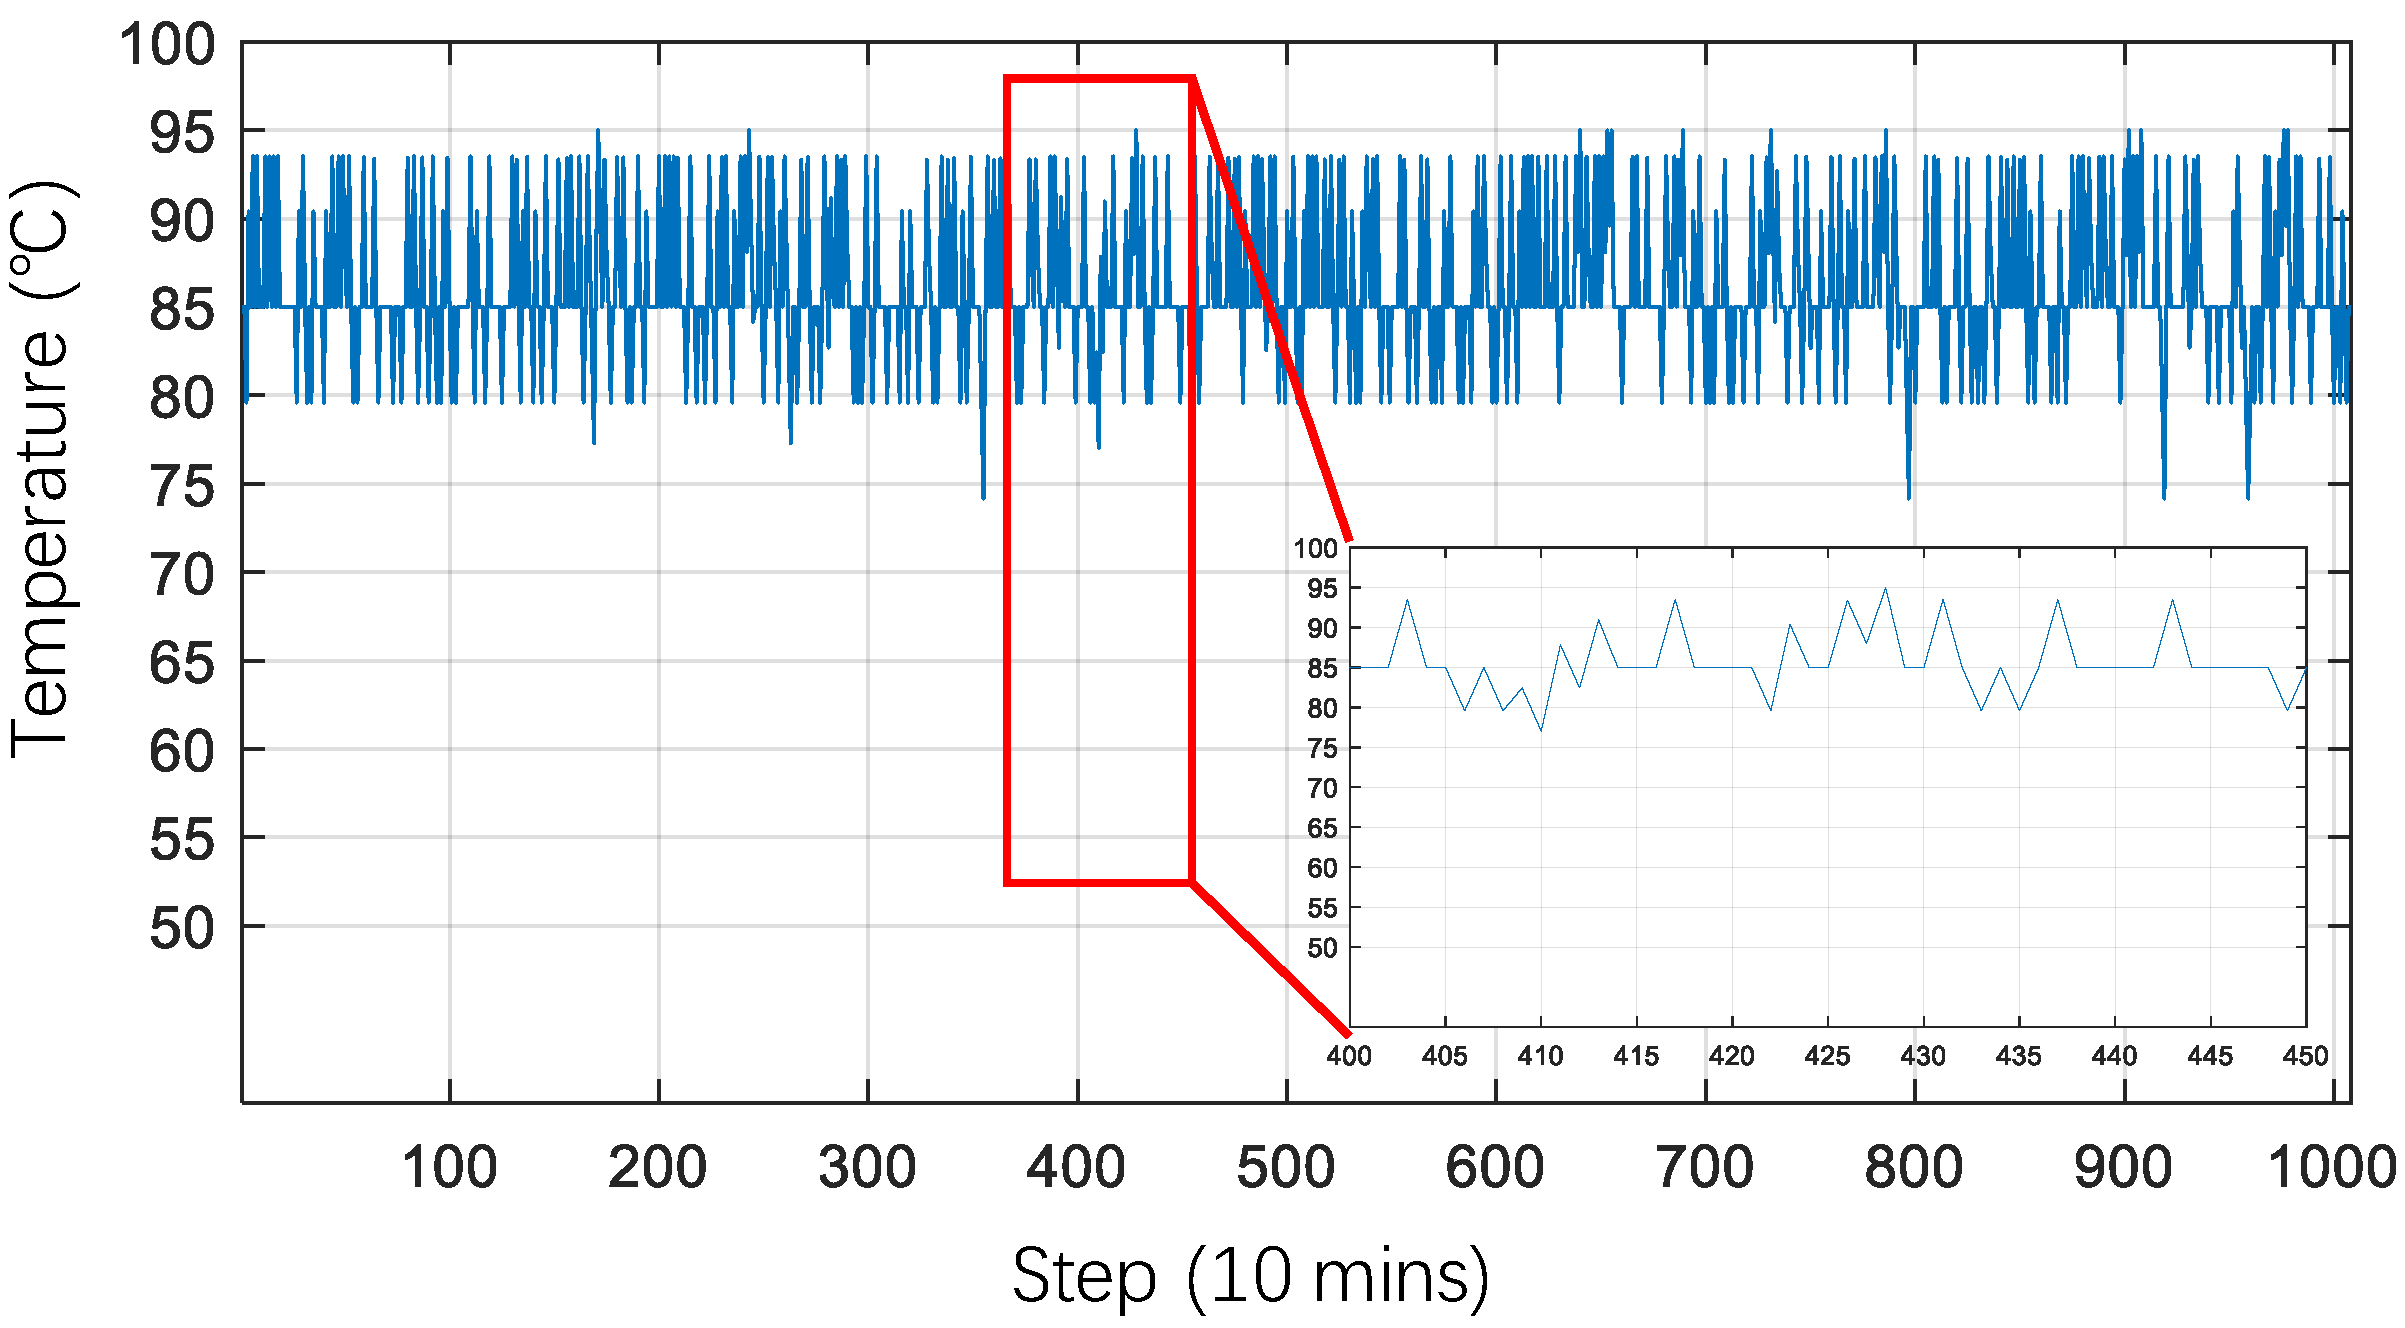
4.2. Testing Scenario 2

The parameters of this scenario are kept the same as in scenario 1, but auxiliary insulation control is adopted when the input power of ALE is less than the minimum power threshold; energy utilization is improved by reducing the fluctuation of the ALE temperature, as shown as follows.
It can be seen that the temperature of ALE can be maintained within the normal operating range after the power input drops below the minimum threshold by adopting insulation control as shown in Figure 9 when comparing with Figure 6. The hydrogen production curve of ALE is shown in Figure 10.
It can be seen that although hydrogen production still fluctuates with changes in wind speed, the interval where hydrogen production is 0 is reduced near the 410th and 435th steps when comparing Figure 7 with Figure 10. The improved wind energy utilization curve is shown in Figure 11.
The techno-economic analysis is performed in Table 3 as follows:
The relation between ROI and the efficiency coefficient of ALS ( η A L E ) and WT ( η W T ) is shown in Figure 12. It can be seen from the figure that ROI increases quasi-linearly as η W T rises from 0.8 to 1.2 in the simulation model. This is because the WT rarely works at rated capacity due to the random feature of wind speed; however, the average power generated by WT will increase when η W T is raised. On the other hand, ROI changes linearly with η A L E from 0.8 to 1.2; that is because hydrogen production increases without any additional cost when the efficiency of ALS is improved.
To estimate the simplified LCOH of the proposed system, some assumptions are made: (1) The project lifetime is set to 25 years. (2) The project discount rate is set to 0%. (3) Fixed electricity price (0% annual increase) (4) Constant annual profile. (5) O&M cost of ALE is set to 5% of CAPEX [25,26]. The simplified LCOH is calculated as follows:
LCOH = 8760 T T s × ( I + O ) + t = 1 T F t t = 1 T H t ϕ h y d r o g e n
The symbols in Equation (12) are listed in Table 4. A similar LCOH result is reported as 3.42 USD/kg [26].

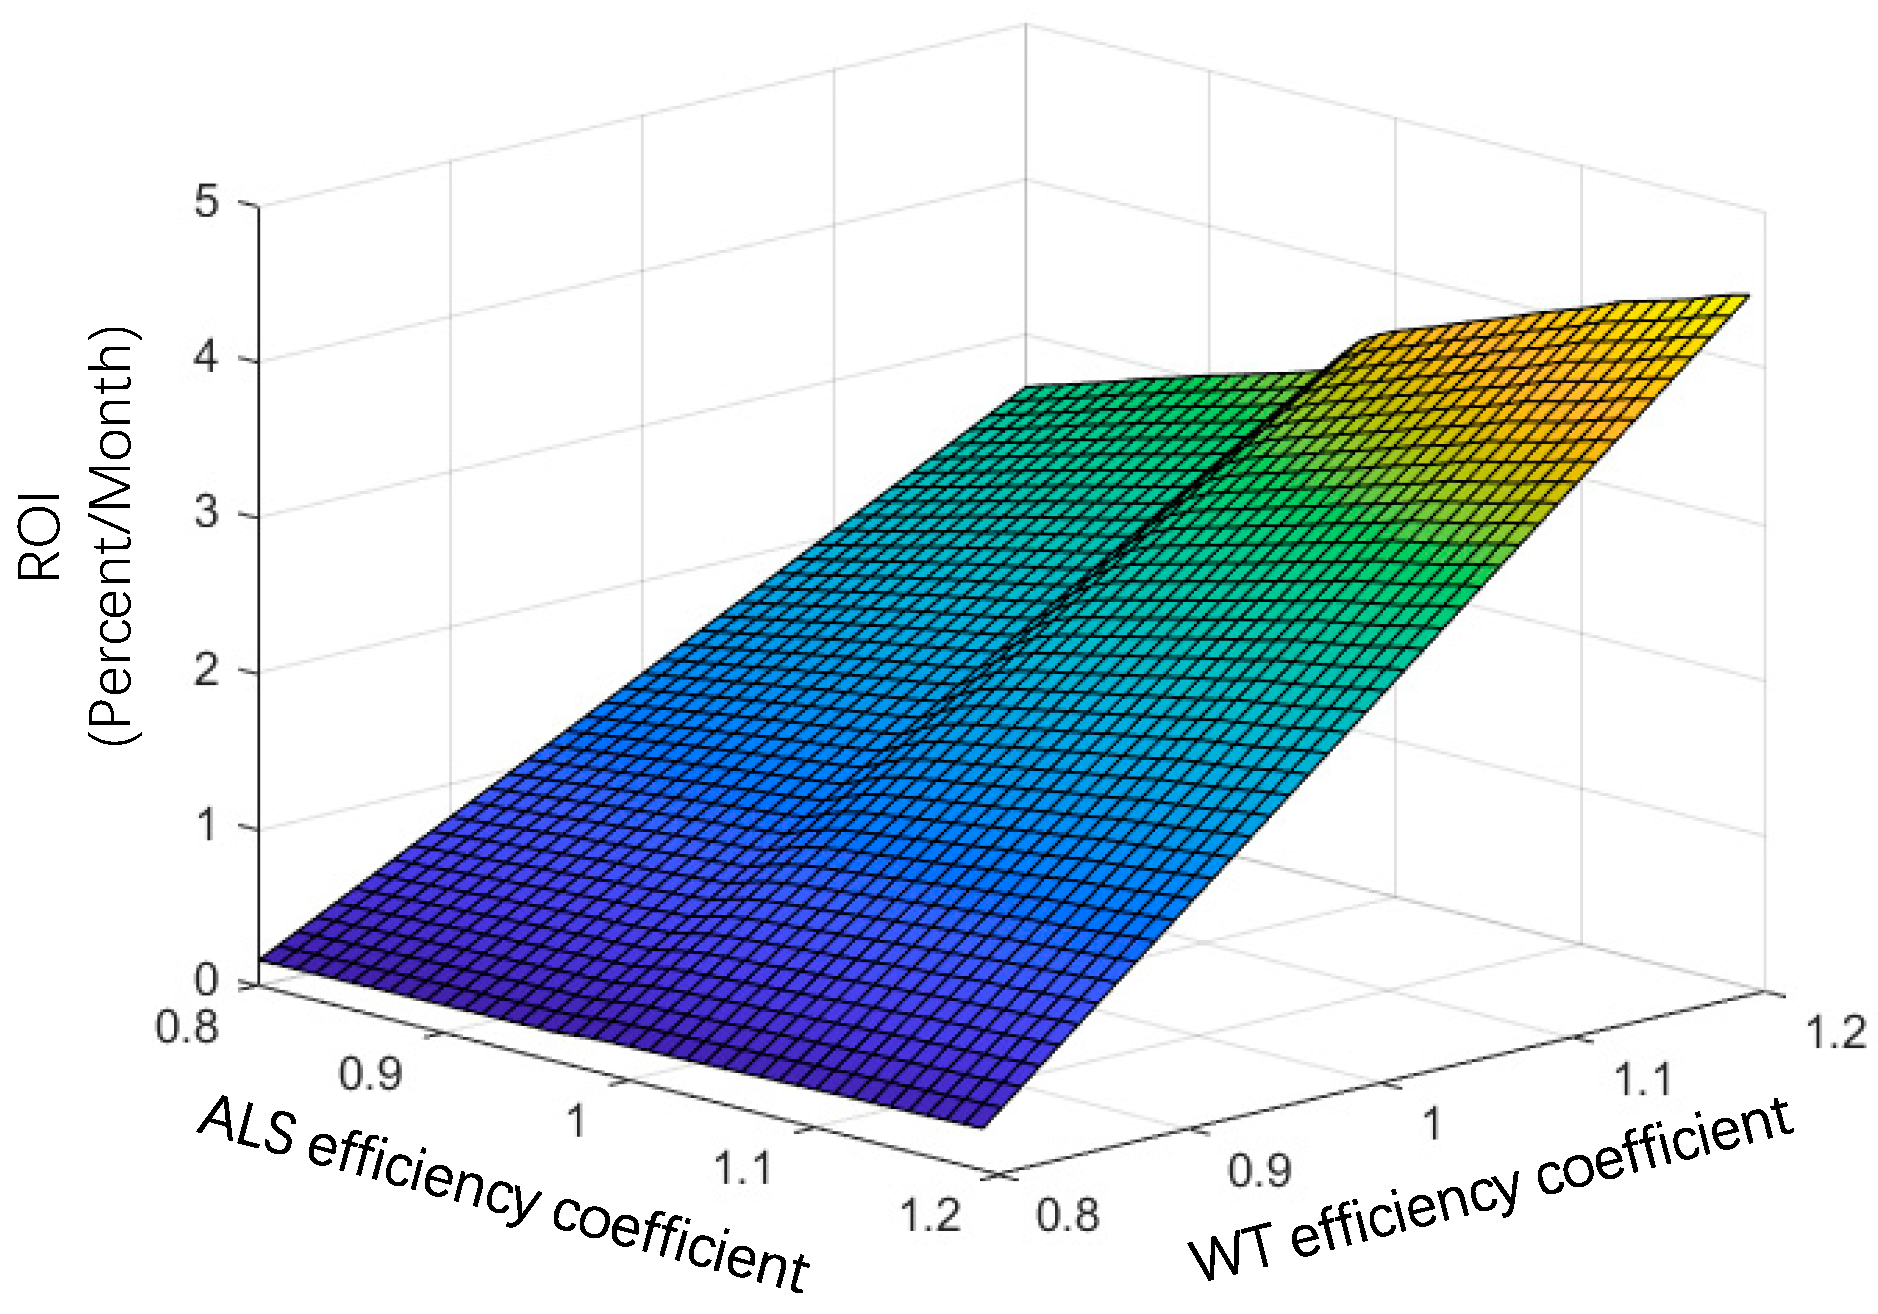
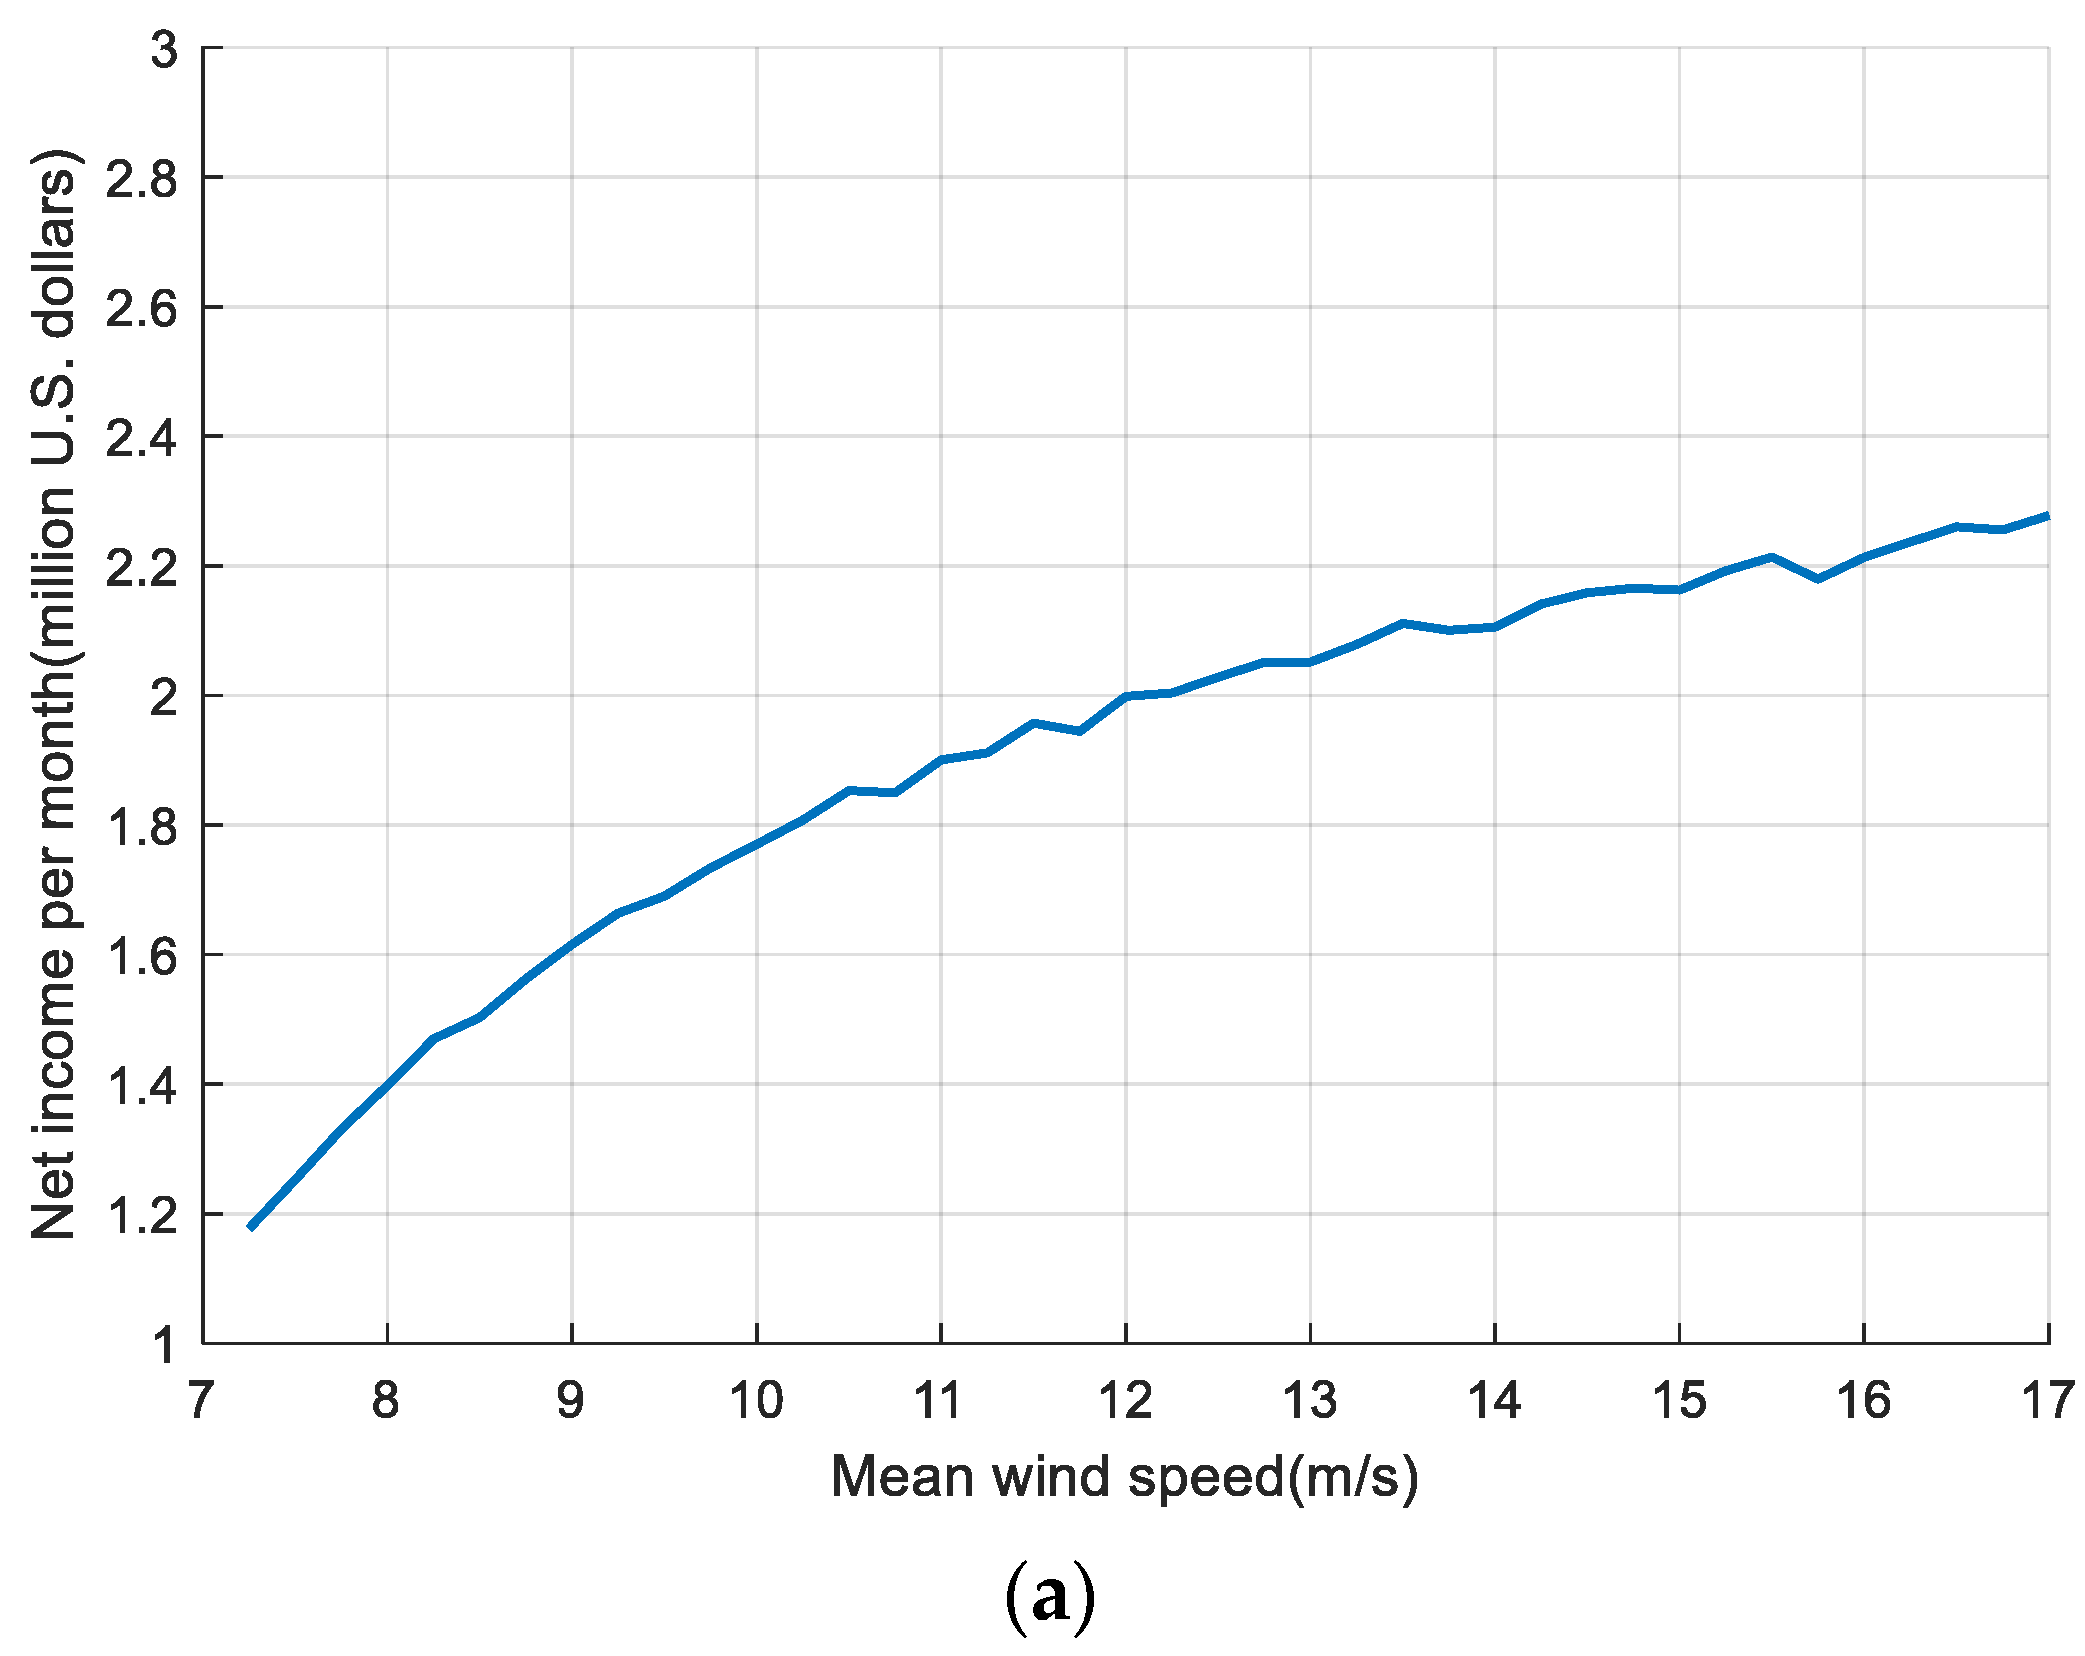
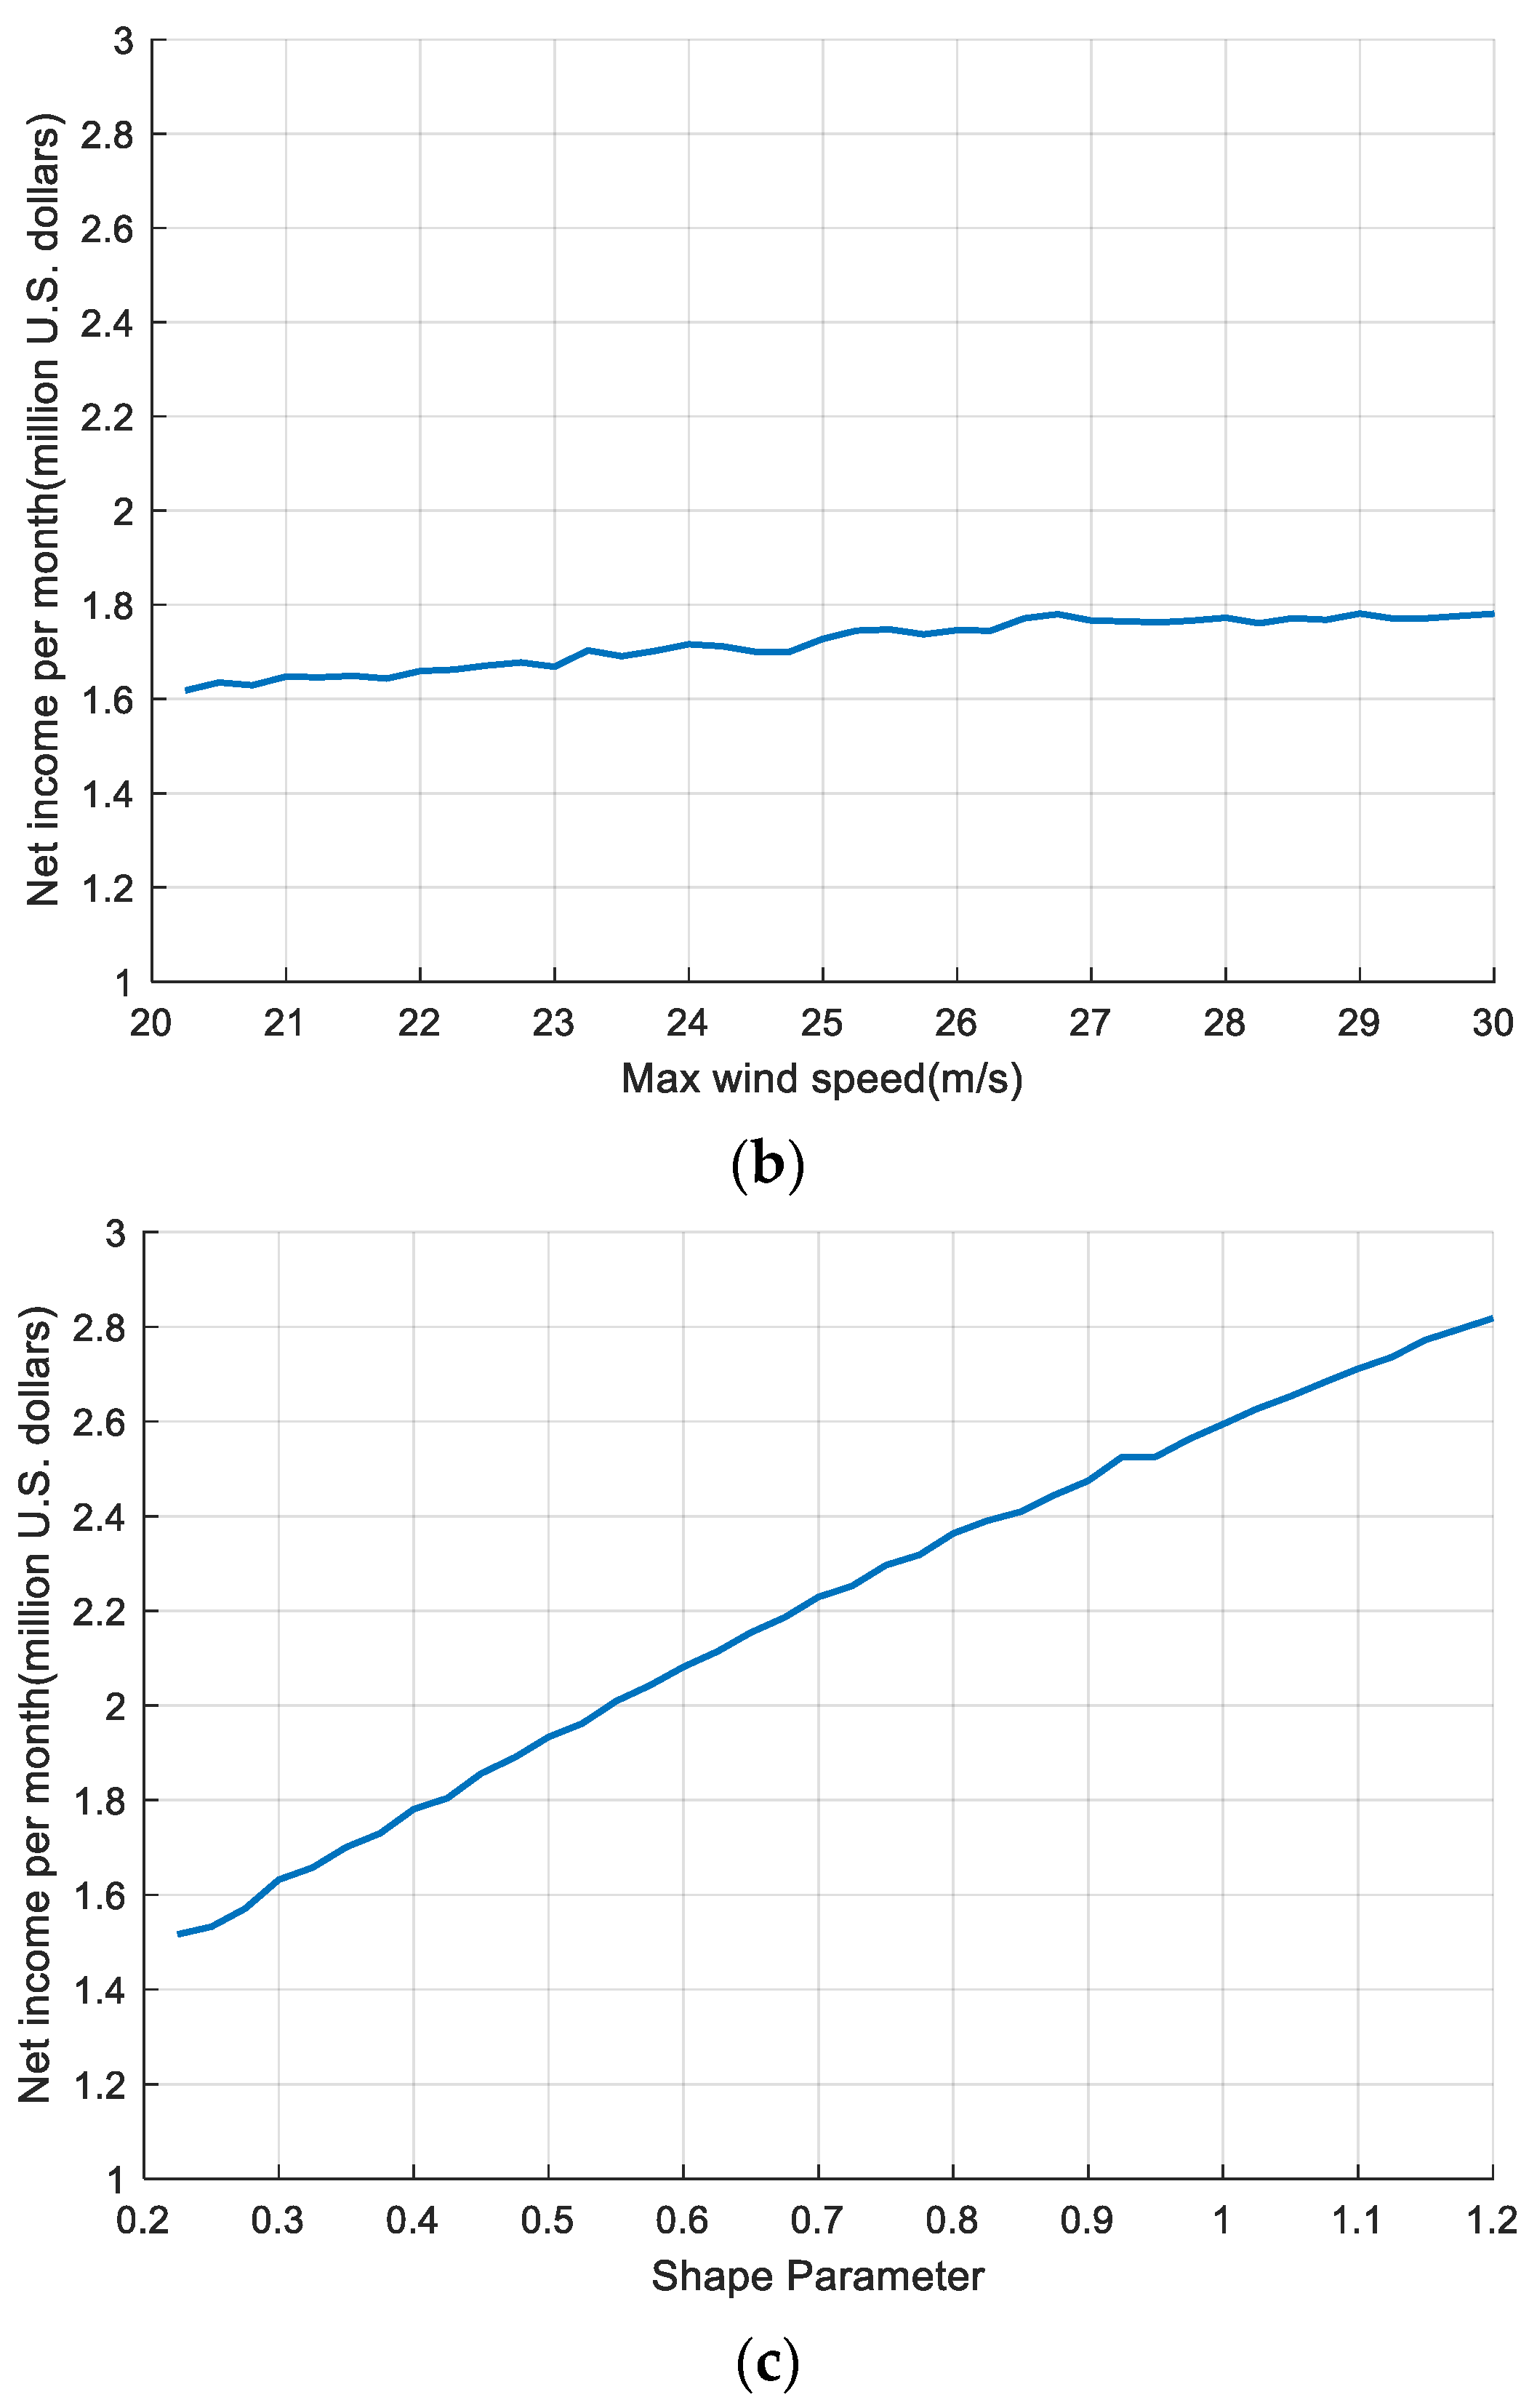
4.3. Sensitivity Analysis

In this scenario, the sensitivity of the hydrogen plant’s net revenue to parameters such as average wind speed, maximum wind speed, and shape coefficient of wind power data will be analyzed. The initial value of the average wind speed is set to 7.25 m/s, the step is set to 0.25 m/s, and the final value is set to 17 m/s. Through simulation, the monthly net income of an electrolytic hydrogen plant composed of 20 ALEs is obtained, as shown in Figure 13a. Changes in the average wind speed have a greater impact on the net income of the hydrogen plant. When the average wind speed reaches 17 m/s, the net income is approximately 190% of that at an average wind speed of 7.25 m/s. When evaluating the influence of the maximum wind speed on net revenue, the initial value of the maximum wind speed is set to 20.25 m/s, the step is set to 0.25 m/s, and the final value is set to 30 m/s. Through simulation, the monthly net income of an electrolytic hydrogen plant composed of 20 ALEs is obtained, as shown in Figure 13b. It can be seen from the figure that changes in the maximum wind speed barely have an impact on the net income of the hydrogen plant. When the maximum wind speed increases to 30 m/s, the net income is approximately 110% of that at a maximum wind speed of 20.25 m/s. For the shape parameter analysis of wind speed, the initial value and step of the shape parameters are set to 0.225 and 0.025, respectively. Through simulation, the monthly net income of an electrolytic hydrogen plant composed of 20 ALEs is obtained, as shown in Figure 13c. Changes in the shape parameters have the greatest impact on the net income of the hydrogen plant. When the shape parameter reaches 1.2, the net income is approximately 188% of that at a shape parameter of 0.25.

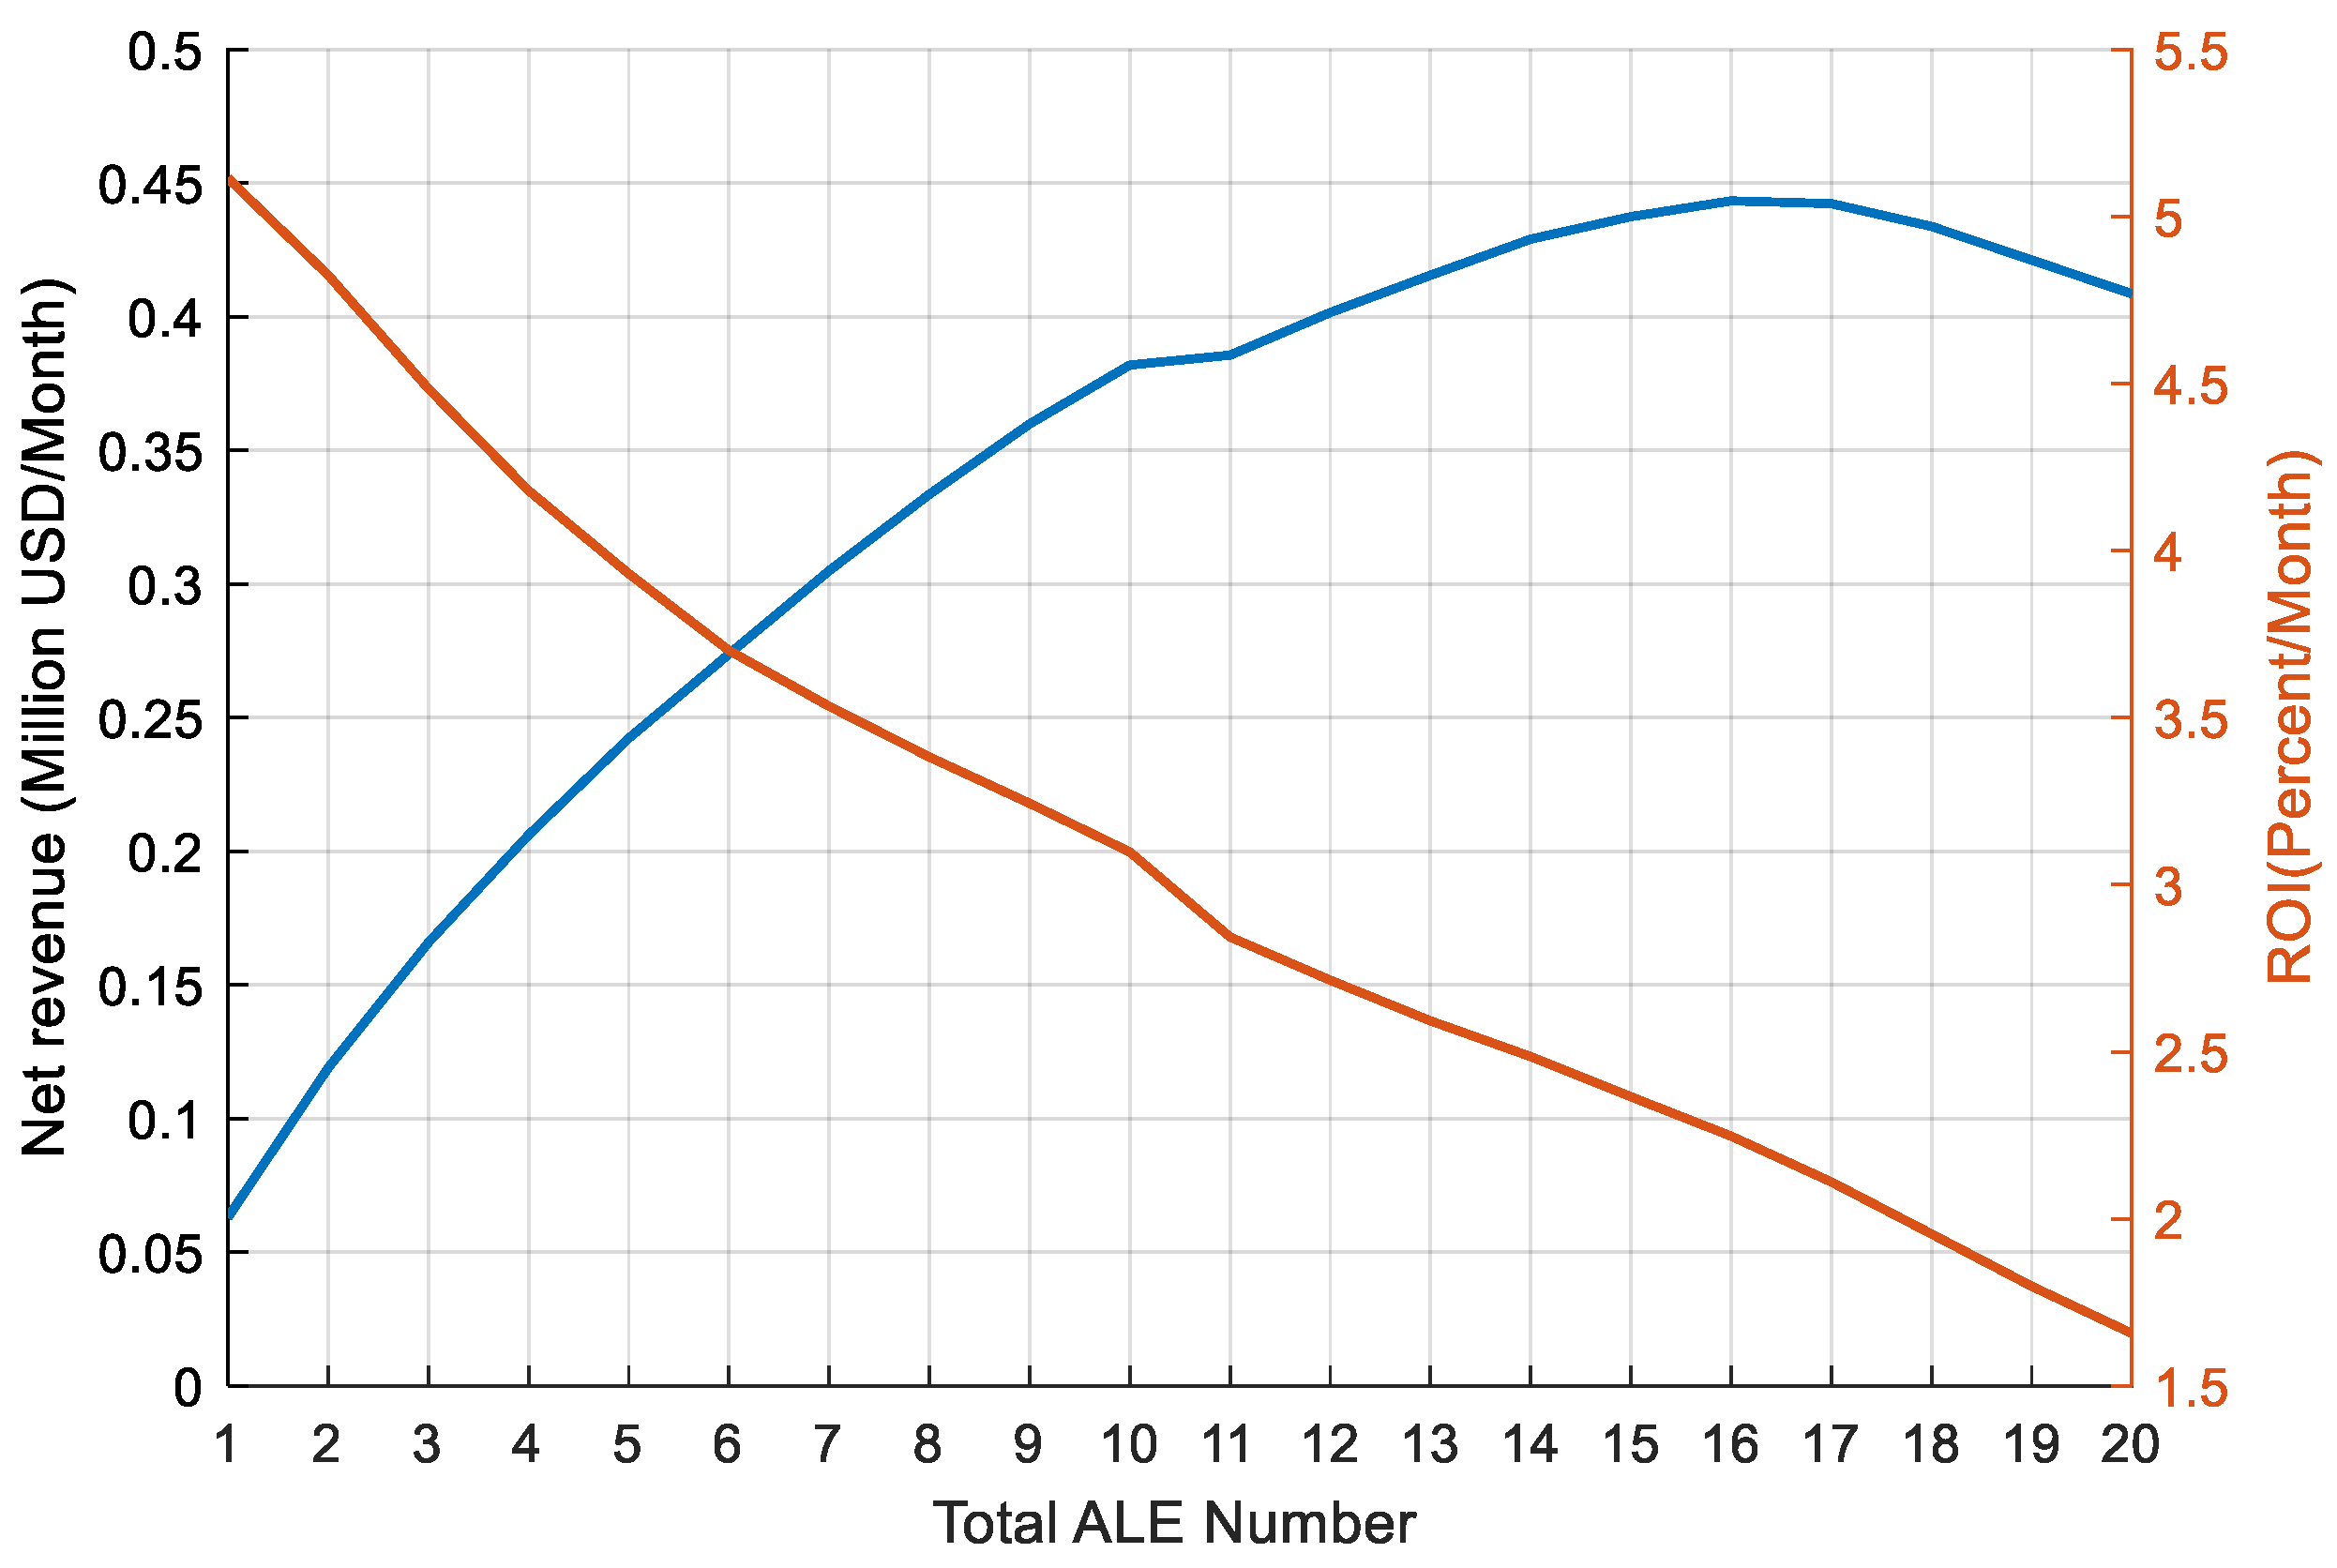
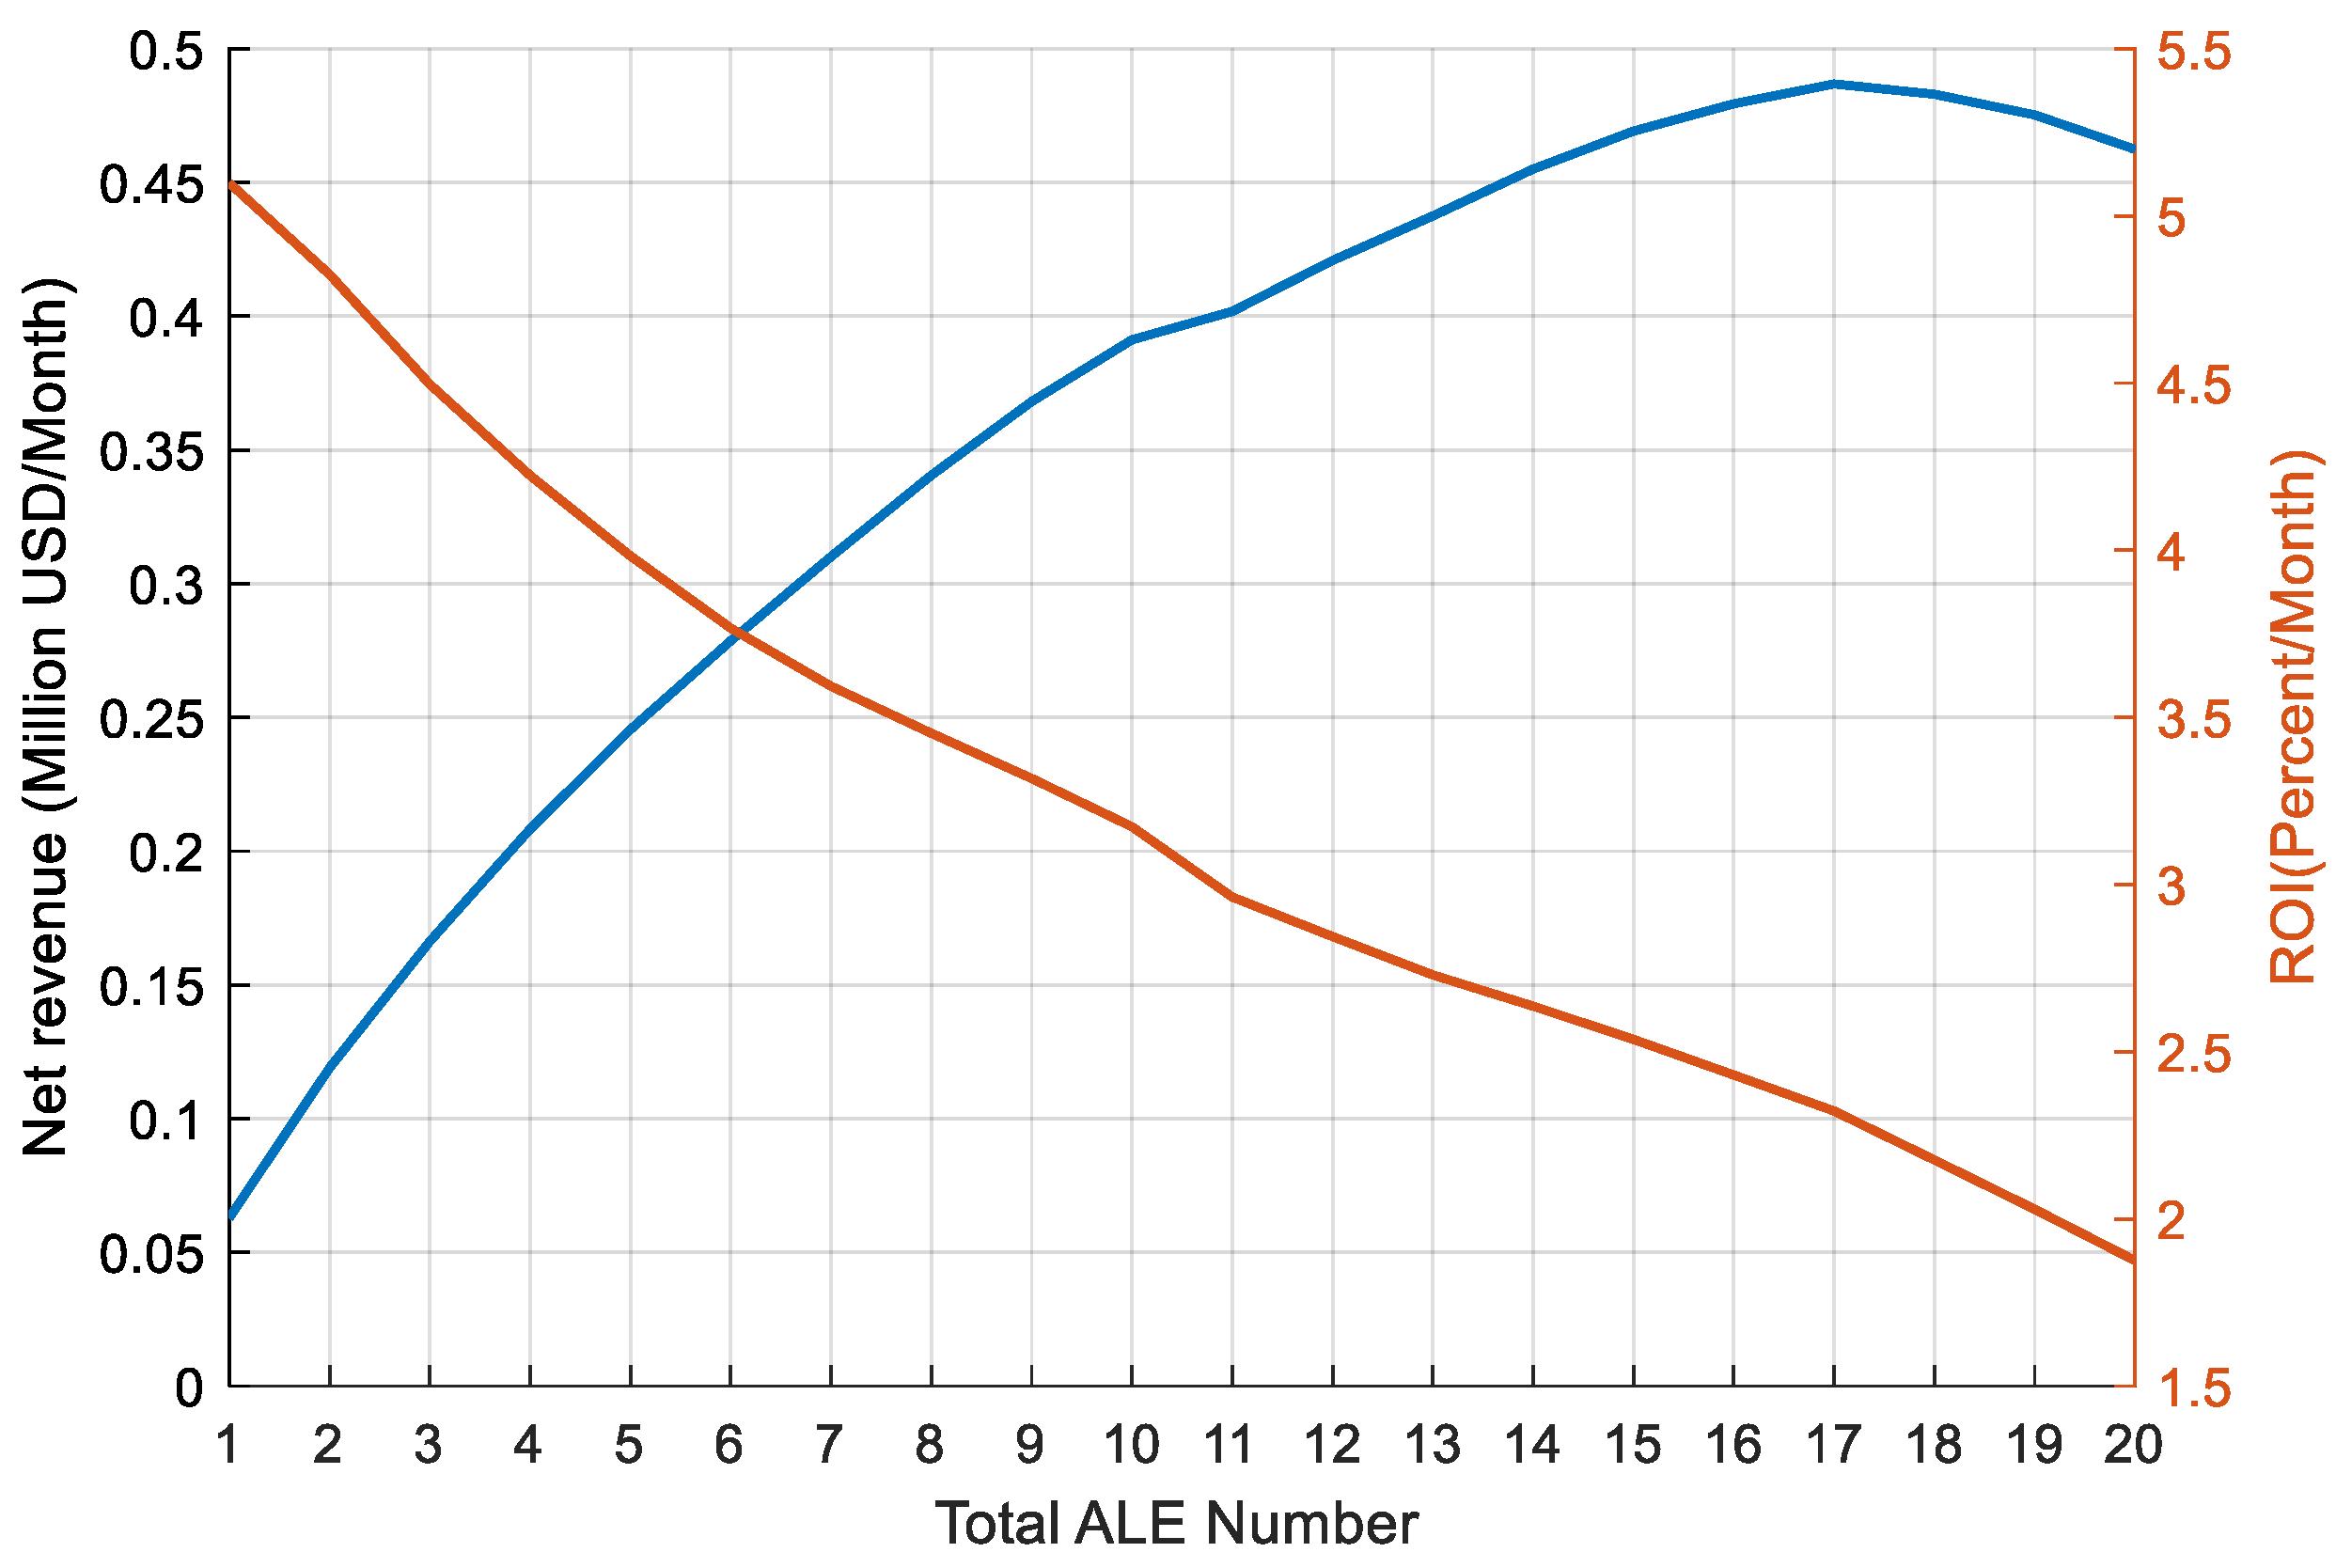
4.4. Capacity Allocation

In this scenario, the number of ALEs in the hydrogen plant is analyzed based on the two dimensions: net income and ROI. The average wind speed is set to 10 m/s, the maximum wind speed is set to 30 m/s, the shape parameter is set to 0.4. In the islanded green hydrogen system without the proposed new operation strategy, the monthly net income and ROI with the number of ALEs from 1 to 20 are shown in Figure 14. It can be seen from the figure that when there is only one ALE in the plant, the monthly ROI is at its maximum value, while the monthly net income is at its minimum value. However, the monthly net income reaches the peak value of 0.44 million USD/Month and the ROI is approximately 1.67%/month when the installed ALE number is set to 17. If more ALEs are installed, the shared power by each ALE decreases, and the occurrence of insufficient input electric power in ALE becomes more frequent. Therefore, the total income decreases.
When the proposed operation strategy is adopted by the islanded green hydrogen system, the monthly net income and ROI with the number of ALEs from 1 to 20 are shown in Figure 15. Similarly, the monthly net income value reaches a peak of approximately 0.48 million USD/month, and the total return on investment at this time is approximately 2.3%/year when the installed ALE number is set to 17.

5. Conclusions

Firstly, this work introduces a control strategy aimed at enhancing economic performance for the islanded hydrogen-wind islanded green hydrogen system. An auxiliary heating process is adopted to insulate ALS when wind power is below the threshold of ALE, and the overload feature of ALE is used to generate hydrogen when wind speed is at its peak. As a result, energy efficiency is improved. Then, an economic analysis and evaluation model of the islanded green hydrogen system is developed based on a simplified piecewise model. The simulation results show that the total energy utilization increased from 62.0768% to 72.5419%, and the return on investment increased from 5.1303%/month to 5.9581%/month. Lastly, the capacity allocation results show that the monthly net income reaches a peak value of 0.48 million USD/Month and the ROI is approximately 2.3%/Month when the installed ALE number is set to 17 and the proposed strategy is adopted.

Author Contributions

Conceptualization, L.Y. and Y.Z.; writing—original draft preparation, W.F.; project administration, K.S.; funding acquisition, Z.Y. All authors have read and agreed to the published version of the manuscript.

Funding

This research was funded by the State Key Laboratory of HVDC, Electric Power Research Institute (EPRI), China Southern Power Grid (CSG) with grant number SKLHVDC-2022-KF-12.

Data Availability Statement

The original contributions presented in the study are included in the article, further inquiries can be directed to the corresponding author.

Conflicts of Interest

The authors declare no conflict of interest.

Nomenclature

AECAlkaline Electrolyser Cell
ALEAlkaline electrolyzer
ALSAlkaline solution
CAPEXCapital expenditure
EMSEnergy management system
ESSEnergy storage system
HHVHigher Heating Value
HVDCHigh-voltage direct current
IGBTInsulated Gate Bipolar Transistor
LCOELevelized Cost of Electricity
LCOHLevelized Cost of Hydrogen
PEMECProton exchange membrane electrolysis cells
PtXPower-to-X
ROIReturn on investment
SOECSolid oxide electrolyzer cell
WTWind turbine

References

  1. PtX i Danmark før 2030; Report 18/07002-7; Energinet: Fredericia, Denmark, 2019.
  2. Nye Vinde til Brint—PtX Strategisk Handlingsplan; Report 19/07995-21; Energinet: Fredericia, Denmark, 2020.
  3. Perner, J.; Bothe, D. International Aspects of a Power-to-X Roadmap. Front. Econ. 2018, 156. [Google Scholar]
  4. Wang, Z.; Shi, J.; Zhao, Y.; Gao, H.; Tao, Y.; Kat, C.; Qin, H.; Liu, M.; Zhao, J.; Cao, B.; et al. China Wind Power Development Roadmap 2050; Energy Research Institute, China National Development and Reform Commission: Beijing, China, 2014. [Google Scholar]
  5. Recalde Melo, D.F.; Chang-Chien, L.-R. Synergistic Control Between Hydrogen Storage System and Offshore Wind Farm for Grid Operation. IEEE Trans. Sustain. Energy 2014, 5, 18–27. [Google Scholar] [CrossRef]
  6. Senjyu, T.; Nakaji, T.; Uezato, K.; Funabashi, T. A hybrid power system using alternative energy facilities in isolated island. IEEE Trans. Energy Convers. 2005, 20, 406–414. [Google Scholar] [CrossRef]
  7. Ursua, A.; Gandia, L.M.; Sanchis, P. Hydrogen Production From Water Electrolysis: Current Status and Future Trends. Proc. IEEE 2012, 100, 410–426. [Google Scholar] [CrossRef]
  8. Diaaeldin, I.M.; Attia, M.A.; Khamees, A.K.; Omar, O.A.M.; Badr, A.O. A Novel Multiobjective Formulation for Optimal Wind Speed Modeling via a Mixture Probability Density Function. Mathematics 2023, 11, 1463. [Google Scholar] [CrossRef]
  9. Yang, N.; Huang, Y.; Hou, D.; Liu, S.; Ye, D.; Dong, B.; Fan, Y. Adaptive Nonparametric Kernel Density Estimation Approach for Joint Probability Density Function Modeling of Multiple Wind Farms. Energies 2019, 12, 1356. [Google Scholar] [CrossRef]
  10. Omar, O.A.M.; Ahmed, H.M.; Elbarkouky, R.A. Wind turbines new criteria optimal site matching under new capacity factor probabilistic approaches. Energy Syst. 2023, 14, 419–444. [Google Scholar] [CrossRef]
  11. Tahara, S.; Koiwa, K.; Umemura, A.; Takahashi, R.; Tamura, J. A new method to control frequency fluctuation of power system with wind farm by using hydrogen generating system. In Proceedings of the 3rd Renewable Power Generation Conference (RPG 2014), Naples, Italy, 24–25 September 2014; pp. 1–6. [Google Scholar] [CrossRef]
  12. Zhai, D.; Yao, L.; Liao, S.; Xu, J.; Mao, B.; Xie, B. A Coordinated Control Strategy of Wind Power/Hydrogen Integrated System. In Proceedings of the 2022 7th International Conference on Power and Renewable Energy (ICPRE), Shanghai, China, 23–26 September 2022; pp. 838–843. [Google Scholar] [CrossRef]
  13. Koiwa, K.; Takahashi, R.; Tamura, J. A study of hydrogen production in stand-alone wind farm. In Proceedings of the 2012 International Conference on Renewable Energy Research and Applications (ICRERA), Nagasaki, Japan, 11–14 November 2012; pp. 1–6. [Google Scholar] [CrossRef]
  14. Nistor, S.; Carr, S.; Sooriyabandara, M. The Island Hydrogen Project: Electrolytic Generated Hydrogen for Automotive and Maritime Applications. IEEE Electrif. Mag. 2018, 6, 55–60. [Google Scholar] [CrossRef]
  15. Chu, W.; Zhang, Y. The Efficiency and Economic Feasibility Study on Wind-Hydrogen System. In Proceedings of the 2020 IEEE Sustainable Power and Energy Conference (iSPEC), Chengdu, China, 23–25 November 2020; pp. 1198–1203. [Google Scholar] [CrossRef]
  16. Ioannou, A.; Brennan, F. A preliminary techno-economic comparison between a grid-connected and non-grid connected offshore floating wind farm. In Proceedings of the Offshore Energy and Storage Summit (OSES), BREST, France, 10–12 July 2019; pp. 1–6. [Google Scholar] [CrossRef]
  17. Koiwa, K.; Umemura, A.; Takahashi, R.; Tamura, J. Stand-alone hydrogen production system composed of wind generators and electrolyzer. In Proceedings of the IECON 2013—39th Annual Conference of the IEEE Industrial Electronics Society, Vienna, Austria, 10–13 November 2013; pp. 1873–1879. [Google Scholar] [CrossRef]
  18. Tebibel, H. Wind Turbine Power System for Hydrogen Production and Storage: Techno-economic Analysis. In Proceedings of the 2018 International Conference on Wind Energy and Applications in Algeria (ICWEAA), Algiers, Algeria, 6–7 November 2018; pp. 1–6. [Google Scholar] [CrossRef]
  19. Sayed, K.; Khamies, M.; Abokhalil, A.G.; Aref, M.; Mossa, M.A.; Almalki, M.M.; Alghamdi, T.A. Feasibility Study and Economic Analysis of PV/Wind-Powered Hydrogen Production Plant. IEEE Access 2024, 12, 76304–76318. [Google Scholar] [CrossRef]
  20. González-Longatt, F.; Wall, P.; Terzija, V. Wake effect in wind farm performance: Steady-state and dynamic behavior. Renew. Energy 2012, 39, 329–338. [Google Scholar] [CrossRef]
  21. The Wind Power. The Wind Power Database. Available online: https://www.thewindpower.net/ (accessed on 10 April 2024).
  22. Schmidt, O.; Gambhir, A.; Staffell, I.; Hawkes, A.; Nelson, J.; Few, S. Future cost and performance of water electrolysis: An expert elicitation study. Int. J. Hydrogen Energy 2017, 42, 30470–30492. [Google Scholar] [CrossRef]
  23. Bartholomy, O. A Technical, Economic, and Environmental Assessment of the Production of Renewable Hydrogen from Wind in California. Master’s Thesis, California Polytechnic State University, San Luis Obispo, CA, USA, 2002. [Google Scholar]
  24. Ozay, C.; Celiktas, M.S. Statistical analysis of wind speed using two-parameter Weibull distribution in Alaçatı region. Energy Convers. Manag. 2016, 121, 49–54. [Google Scholar] [CrossRef]
  25. Abdelsalam, R.A.; Abdallah, Y.S.; Shabar, N.M.; Afifi, O.A.; Fouda, M.H.; El-Deib, A.A. Energy Management and Techno-Economic Optimization of an Isolated Hybrid AC/DC Microgrid with Green Hydrogen Storage System. In Proceedings of the 2023 IEEE Conference on Power Electronics and Renewable Energy (CPERE), Luxor, Egypt, 19–21 February 2023; pp. 1–7. [Google Scholar]
  26. Fueling the Future of Mobility: Hydrogen Electrolyzers. Monitor Deloitte. 2021. Available online: https://www2.deloitte.com/content/dam/Deloitte/fr/Documents/energie-et-ressources/Publications/fueling-the-future-of-mobility-hydrogen-electrolyzers.pdf (accessed on 25 April 2024).
Figure 1. Islanded wind-hydrogen system scheme.
Energies 17 03460 g001
Figure 2. Wind speed-output power curve (model SG 5.0-132) [21].
Energies 17 03460 g002
Figure 3. Modeled efficiency curves for ALE.
Energies 17 03460 g003
Figure 4. Simplified ALE temperature and power consumption evaluation model.
Energies 17 03460 g004
Figure 5. Wind speed data generation. (a) Probability density; (b) wind speed waveform.
Energies 17 03460 g005
Figure 6. The temperature of ALE between the 400th and 450th steps without the proposed strategy.
Energies 17 03460 g006
Figure 7. Hydrogen production between the 400th and 450th steps without the proposed strategy.
Energies 17 03460 g007
Figure 8. Power generated by WT and power consumed by ALE between the 400th and 450th steps without the proposed strategy.
Energies 17 03460 g008
Figure 9. The temperature of ALE between the 400th and 450th steps with the proposed strategy.
Energies 17 03460 g009
Figure 10. Hydrogen production between the 400th and 450th steps with the proposed strategy.
Energies 17 03460 g010
Figure 11. Power generated by WT and power consumed by ALE between the 400th and 450th steps with the proposed strategy.
Energies 17 03460 g011
Figure 12. ROI changes with the efficiency coefficient of ALE and WT.
Energies 17 03460 g012
Figure 13. Wind speed data sensitivity analysis. (a) Mean wind speed change from 7.25 m/s to 17 m/s; (b) maximum wind speed change from 20.25 to 30 m/s; (c) shape parameter change from 0.225 to 1.2.
Energies 17 03460 g013aEnergies 17 03460 g013b
Figure 14. Net income and ROI of the system without the proposed operation strategy.
Energies 17 03460 g014
Figure 15. Net income and ROI of the system with the proposed operation strategy.
Energies 17 03460 g015
Table 1. Simulation Parameters.
SymbolDescriptionValueUnit
t s t e p Simulation step10min/step
P A L E r a t e d Rated capacity of ALE4788.8kW
C h y d r o g e n Rated hydrogen production of a single ALE1000Nm3/h
D A L E Cost of total ALE1,230,079$
D e l e c t r i c i t y Electricity price (Dedicated source)0.027$/kWh
D h y d r o g e n Hydrogen price4.67$/kg
ϕ h y d r o g e n Volume factor11.2Nm3/kg
C W T The rated capacity of WT5000kW
N W T Number of WT20n.a.
η t r a n s Efficiency factor of cons and transmission line 0.98n.a.
η W T Efficiency coefficient of WT1n.a.
η A L E Efficiency coefficient of ALE1n.a.
k min p Minimum power coefficient0.2n.a.
k max p Maximum power coefficient1.3n.a.
T min Minimum temperature of ALE80°C
T max Maximum temperature of ALE90
T o v e r l o a d Overload temperature of ALE95
T n o r m a l The normal temperature of ALE85
T a m b i e n t Ambient temperature25
k c o o l T Cooling factor5.4167°C/step
t max o v e r l o a d Maximum simulation steps of overload ALE2n.a.
C i n s u l a t i o n The capacity of the additional heating system100kW
C A E S Amount of heat required for a 1 °C change in ALS4.1 × 106J
Table 2. Techno-Economic Analysis without the proposed strategy.
ItemValue
Total hydrogen production220,218.2182 Nm3
Total electricity consumption1,049,678.2675 kWh
Total energy utilization62.0768%
Total hydrogen sales revenueUSD 1.83 million
Total electricity costUSD 0.57 million
CAPEXUSD 24.6 million
ROI5.1303%/Month
Table 3. Techno-Economic Analysis with the proposed strategy.
ItemValue
Total hydrogen production256,247.0256 Nm3
Total electricity consumption1,226,636.3042 kWh
Total energy utilization72.5419%
Total hydrogen sales revenueUSD 2.13 million
Total electricity costUSD 0.67 million
CAPEXUSD 24.6 million
ROI5.9581%/Month
Table 4. LCOH Calculation.
SymbolItemValue
TTotal lifetime25 year
TsStack lifetime75,000 h
HtTotal hydrogen production3,074,964.3 Nm3/year
FtTotal electricity cost8.04 million USD/year
OO&M cost5% of CAPEX
ICAPEXUSD 24.6 million
LCOHTotal electricity cost2.01 USD/kg
Disclaimer/Publisher’s Note: The statements, opinions and data contained in all publications are solely those of the individual author(s) and contributor(s) and not of MDPI and/or the editor(s). MDPI and/or the editor(s) disclaim responsibility for any injury to people or property resulting from any ideas, methods, instructions or products referred to in the content.

