Abstract
The design and integration of intelligent energy management systems in hybrid electric vehicle (EV) charging stations, leveraging industry 4.0 and renewable energy sources, is crucial for advancing sustainability, efficiency, and technological development. The innovative hybrid EV charging station described in this study uses a combination of fuel cells, batteries, and solar panels that run at 14 amps a piece at 240 volts. The system consists of five essential components that work together to transfer power wirelessly: an EV battery bank, a boost converter, an HF inverter, transfer coils, and a power supply. Two crucial phases make up the optimization process. In phase 1, the boost converter’s maximum power point is tracked and optimized to generate the most power possible by varying the duty cycle between 10% and 90%. In phase 2, the HF uses a class ϕ2 inverter at 30 MHz to synchronize with the resonant frequency of wireless power transfer coils. Zero-voltage switching is used by a digital signal processor card to carry out control for effective operations. By utilizing hybrid sources to optimize power transmission, this design improves the sustainability of EV charging options.
1. Introduction
Currently, there is an urgent demand to incorporate numerous renewable energy sources to address issues such as greenhouse gas emissions, voltage quality problems, power supply reliability, network extensions, underserved remote areas, and power losses prevalent in conventional power plants [1,2,3]. In Tunisia, the predominant electrical energy source is crude oil, except for certain countries relying on renewable sources [4]. Investing in renewables, specifically solar power, reduces reliance on fossil fuels, like oil, and enhances the country’s energy independence [5,6,7,8]. Furthermore, embracing renewable energies, particularly solar power, contributes to mitigating CO2 emissions, offering both economic and environmental advantages [9,10,11]. The adoption of renewable energies also directly benefits the environment by curbing CO2 emissions and limiting pollution in the air, water, and soil [12,13,14,15,16]. However, the majority of these sources are sporadic, creating gaps in both space and time between energy availability and end users’ consumption. It is essential to provide appropriate energy storage devices for the power grid to address these problems [17]. As the world shifts towards sustainable and efficient transportation, electric vehicles (EVs) emerge as a key solution to combat environmental challenges posed by traditional fossil-fuel-based vehicles [18,19,20,21]. This transition necessitates the development of a robust and eco-friendly charging infrastructure [22,23,24,25]. Integrating renewable energy sources, like photovoltaic (PV) systems, and advanced technologies, such as fuel cells, becomes crucial. By combining the sun power through PV sources with the reliability of fuel cells, EV charging stations have the potential to operate independently of traditional energy grids, minimizing their carbon footprint [26,27]. One significant challenge in the widespread adoption of EVs is the demand for fast, efficient charging facilities with the aim of meeting the growing need. Implementing optimized algorithms, specifically perturb and observe (P&O), emerges as a noteworthy solution [16,28,29,30,31]. The P&O algorithm, known for its effectiveness in maximizing solar energy system efficiency, shows promise when applied to the dynamic complexities of EV charging stations powered by both PV and fuel cell systems [32,33,34,35].
This comprehensive case study focuses on Tunisia’s efforts to adopt sustainable energy practices and meet modern transportation needs. Leveraging Tunisia’s abundant sunshine, the study explores integrating PV sources into EV charging stations. By examining the intricacies of integrating PV systems, fuel cell technology, and P&O optimization algorithms, the study aims to analyze the challenges, opportunities, and outcomes of maximizing charging efficiency in Tunisia’s EV infrastructure. Through empirical data, simulation, and theoretical frameworks, the analysis aims to provide a detailed blueprint addressing technical complexities, economic viability, and environmental impact. This exploration holds the potential to revolutionize the sustainable transport infrastructure in Tunisia, serving as a model for other regions facing similar challenges.
Wireless energy transfer (WET) represents a recent technological breakthrough with significant advances in research and manufacturing [36,37,38]. Applicable across various fields, including everyday life optimization, Tesla’s work in the early 1900s brought WET to fruition. Subsequent research focused on integrating the wireless power transfer (WPT) technology into EVs, exploring prototypes for testing and marketing [39]. Wireless transmission methods, categorized as near-field and far-field, offer advantages such as safe charging and easy integration into automated systems. While near-field technologies use inductive or capacitive coupling for short distances, far-field technologies employ electromagnetic radiation for longer distances. However, existing wireless transfer systems face efficiency challenges, particularly in the inductive coupling, which has a limited transfer range and efficiency drop with increased separation distance. The proposed magnetic resonance WPT (RWPT) seeks to address these challenges while modeling for EV charging a wireless solar transfer chain [40,41]. The latter incorporates PV generators, hydrogen fuel cells, and the national grid, optimizing efficiency through class-ϕ2 inverters and circular spiral coils. Concerning magnetic resonance transfer, the separation distance, or air gap, emerges as a critical factor influencing the overall system efficiency and performance. The paper aims to propose a model applicable to EV charging, aligning with the global trend towards renewable energy. The RWPT system requires an MHz resonant supply signal, utilizing a class-ϕ2 HF resonant inverter with GaN transistors for reduced switching losses and high efficiency [13,25,42,43]. The article also acknowledges the challenges faced by PV systems, emphasizing the importance of advanced energy storage technologies and high-efficiency solar cells.
Our suggested solution combines PV systems, hydrogen fuel cells, WPT, and energy storage for the creation of a more effective microgrid system. This approach aims to overcome the limitations associated with traditional PV systems and offers a comprehensive solution for EV charging stations. The project focuses on optimizing the PV source, the hydrogen fuel cell, and the national grid using the MPPT algorithm, creating a resonance structure for 30-MHz signals, and analyzing the electromagnetic properties of the transfer core through the use of spiral coils.
2. Approach
The proposed approach consists of designing a battery charging station powered by a PV source.
Figure 1 shows a synoptic diagram of the proposed approach. A PVP is used to charge the EV battery and to produce hydrogen. PVPs can also be used to produce hydrogen by water electrolysis. We can store hydrogen and use it in a fuel cell to produce electricity during periods when the sun is not shining.
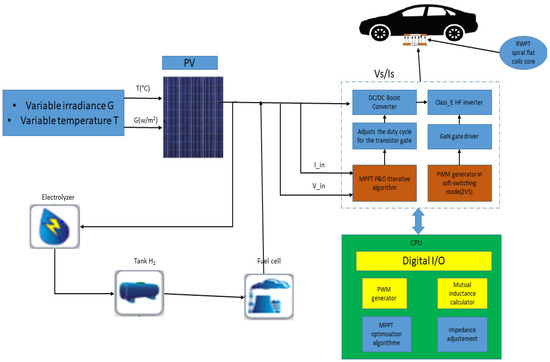
Figure 1.
Illustration of a hybrid-powered wireless charging station for EVs.
The mutual inductance calculator facilitates the calculation of the mutual inductance between booth coils with the goal of obtaining the optimum M12 ratio for the maximum transfer point of the RWPT system. The adjustment impedance is represented by the optimized class-ϕ2 inverter’s input and output impedance. This step is used to adjust the input and output impedance to obtain maximal efficiency from the inverter. The inverter is powered by a PV panel (PVP) and a fuel cell, which is optimized by applying the MPPT algorithm to the boost converter. This pulse-width modulation generator is used to produce the control signals for the entire system (boost converter + ϕ2 class inverter). This stage is represented by the DSP card, which delivers the control signals.
The energy management system can also decide how best to use the hydrogen produced, whether to feed it directly or store it for later use. This hybrid configuration enables a more sustainable use of energy resources by taking advantage of different renewable energy sources. It can also offer a degree of energy autonomy, reducing the total dependence on the electricity grid. The integration of an intelligent energy management system is essential to maximize the efficiency and optimization of available energy resources.
3. Mathematical Study and Electric Model Optimization for Advanced Energy Transfer Systems
The wireless charging system designed for EVs comprises three main components. The initial block integrates the solar generator, the hydrogen fuel cell, and the Tunisian electricity grid, comprising a PVP, a fuel cell, and the grid station, and utilizing a boost converter to enhance performance. In addition to that, the subsequent block concerns the resonance structure, as symbolized by one class-ϕ2 inverter. Ultimately, employing flat spiral coils, the wireless transformer is included in the last block.
The literature indicates that this energy storage unit has a maximum dischargeable state-of-charge value of about 30% [44]. It should be noted that the battery is initially assumed to be charged to 100% of its capacity. Meanwhile, the charger is precisely engineered in order to provide a maximal power of 3.3 kW. This should be conducted at 230 V with a current rate of 15 A. According to the literature, the maximum dischargeable state-of-charge value of this energy storage unit is around 30%, thus guaranteeing the battery’s longevity. Various studies have also emphasized ensuring that the depth of discharge remains below 70% of the battery’s maximum capacity in order to preserve its health and ensure optimum service life, as demonstrated in several references [30,31,32].
3.1. PV Model
The equation representing the maximum energy generated by solar PVPs (PV-max) can be formulated as follows:
In the given formula, GSR denotes the overall solar radiation, TP signifies the temperature of the PVPs, FR represents the irradiance flux, and P is a variable influenced by Joule effects, cleanliness, and the stability of the PV panels. Moreover, Pt is the temperature coefficient, while Tpref and PG-sdc correspond to the ambient temperature (25 °C) and the rated power of the PV array in a standard test environment (1000 W/m2), respectively.
The ambient temperature Tp is determined by the intensity of the global solar radiation (GSR) and, the ambient temperature Ta, which is set at 25 °C. The calculation can be expressed as follows:
In this equation, SCOT represents the operating temperature under standard conditions. These conditions include an average 1 m/s wind, an ambient 20 °C temperature, and 800 W/m2 irradiance. The ambient temperature Tp can be calculated using the relevant formula or a method applicable to your specific context or model [25,26]. Based on solar cells’ physical structure and output characteristics, as illustrated in Figure 2, it is possible to electrically and equivalently represent an ideal solar cell consisting actually of one current source with a diode in parallel.
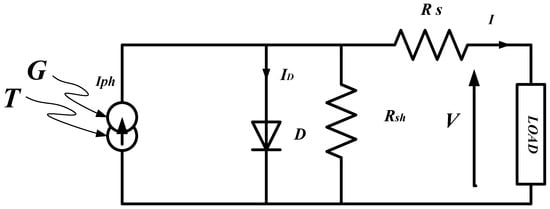
Figure 2.
Equivalent electrical circuit of solar panel cell.
Photocurrent Iph is a function of the cell temperature T and the solar radiation Gs, as described in Equation (3). We can express the mathematical relationship between voltage (V) and current (I) in an equivalent diode circuit by the following diode equation:
The dependence of the solar cell’s reverse saturation current (I) on temperature (T) is expressed through the following relationship:
When PV arrays are constructed by connecting solar cells in both series and parallel configurations, a common assumption is that these cells share identical characteristics. Figure 3 shows the electrical equivalent circuit of a PV array.
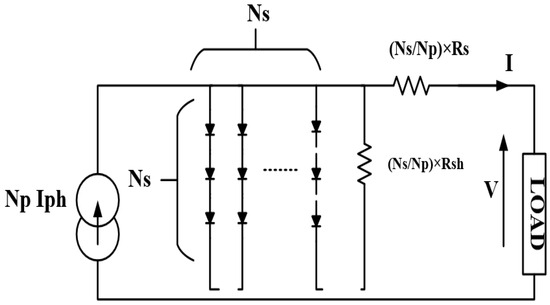
Figure 3.
Electrical circuit representation corresponding to a single solar panel cell.
In fact, the relationship in the PV grid between the voltage and the current, as well as the power produced, can be articulated in an equivalent circuit as follows:
where the temperature coefficient (δ) is defined as −3.7 × 10⁻³ (1 °C), Gs-ref represents solar irradiance under 25 °C reference temperature (Tref) and standard (1000 W/m2) reference conditions, Gs is the solar irradiance, Pr represents rated power under reference conditions, and PPV(t) represents the PV output.
The challenge encountered by MPPT techniques lies in the automated determination of the optimal voltage (Vmax) or current (Imax) at which a PV array should operate. As illustrated in Figure 4 and Figure 5, the attaining objective of this optimization is maximal output power (Pmax) under specific temperature and solar radiation conditions depicted.
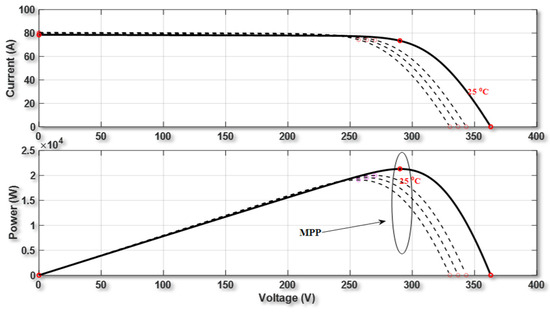
Figure 4.
I- (current-voltage) and P-V (power-voltage) characteristics of the array presented under conditions of 1000 W/m2 irradiance and specific temperature.
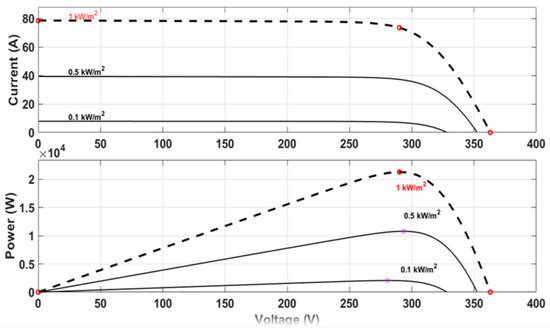
Figure 5.
I-V (current-voltage) and P-V (power-voltage) characteristics of the array graphically illustrated at a temperature of 25 °C and variable solar radiation.
Figure 4 depicts the tracking of maximum power (Pmax) for a constant solar radiation level (Gs), with a variation in Tref. On the other hand, Figure 5 shows the opposite situation, with a fixed Tref and a variation in Gs. We notice that the maximum power varies slightly in the opposite direction with temperature. It is very significantly proportional to the variation in solar radiation.
3.2. Fuel Cell
The fuel cell represents an electrochemical device that is designed for directly converting chemical energy into electricity. The mathematical formula governing the fuel cell operations is expressed in terms of electrochemical potential, electric current, and voltage. The chemical reaction within a fuel cell is generally represented as follows, taking a hydrogen fuel cell as an example:
2H2 + O2 → 2H2O
The general formula for the power (P) generated by a fuel cell is given as follows:
where
P =V·I
- ▪
- I is the electric current.
- ▪
- V is voltage.
- ▪
- P is the power.
The voltage V of a fuel cell is contingent upon various factors, including the reactants used in nature, the cell’s specific design, the pressure, and the temperature. The precise formula for the voltage can be derived from fuel-cell-specific thermodynamic and chemical kinetic equations.
It is crucial to highlight that the power generated by a fuel cell is additionally influenced by the efficiency of the electrochemical process, which can vary depending on the operating conditions of the cell. More detailed equations are often used in fuel cell models to take these specific factors into account.
A fuel cell is an electrochemical device used for the direct conversion of chemical energy into electricity. This can be conducted using an electrochemical reaction between a fuel and an oxidant. It is frequently regarded as a clean and efficient energy source, as the main reaction produces electricity, water, and heat as by-products. Here is a general explanation of how a fuel cell works: The chemical reaction at the heart of a fuel cell depends on the cell type. For example, in a hydrogen–oxygen fuel cell, specifically the proton exchange membrane fuel cell (PEMFC), the reaction produces water H2O and releases electricity.
Main components:
- ▪
- Anode: the place where the fuel (e.g., hydrogen) is oxidized and releases electrons.
- ▪
- Cathode: where the oxidizing agent (e.g., oxygen from the air) reacts with the electrons and hydrogen ions (protons) to form water.
- ▪
- Electrolyte: ion-conducting material that allows ions to pass between the anode and the cathode.
Electricity generation: When we supply hydrogen to the anode of the fuel cell, it splits the process while separating water molecules into protons (H+ ions) and electrons (e−). As a matter of fact, protons migrate through an electrolyte towards a cathode, and at the same time, electrons travel through an external circuit, as electricity is generated in the process.
Meeting of ions and electrons at the cathode: The convergence of ions and electrons occurs at the cathode, where protons and electrons combine with oxygen from the air to produce water H2O.
Applications: We use fuel cells in various applications, including EVs (hydrogen fuel cells for cars), backup power systems, industrial applications, and even space applications.
Fuel cell types: There exist different kinds of fuel cells, mainly PEMFCs, solid oxide fuel cells (SOFC), alkaline fuel cells, and more. Each type has its own advantages and disadvantages, tailored to specific applications. Fuel cells are good alternatives to traditional energy sources, particularly as we move towards a cleaner, more sustainable economy.
3.3. Boost Converter
Figure 6 shows a boost converter is an electronic circuit utilized for increasing the DC voltage of a power source to a higher value. It is commonly used in power supply applications to raise the voltage of a battery or renewable energy source to a level required to power other devices. The boost-converter operation is based on the principle of storing energy in an inductor (L) and subsequently transferring it to an output capacitor (C), which is achieved through the use of a switch, typically a transistor. Upon closing the switch, an electric current goes across the inductor, accumulating magnetic energy within it. When the switch opens, the energy stored within the inductor can be transposed into the output capacitor, increasing the voltage across it. As the switch is closed, the relationship between the switch duty cycle D, the output voltage (Vout), and the input voltage (Vint) can be expressed by the following formula:
where D is the fraction of time. This equation illustrates the correlation between the switch’s duty cycle and the output voltage. To enhance the output voltage, the duty cycle should be adjusted, accordingly.
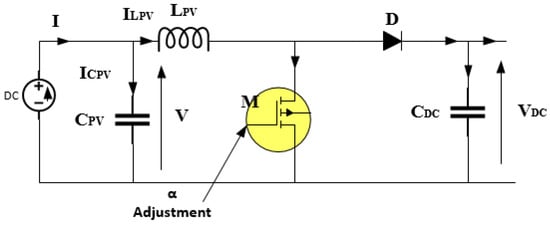
Figure 6.
Circuit representation corresponding to boost converter.
The efficiency (η) of the boost converter is assessed by determining the output power ratio in order to input the power. Efficiency is calculated utilizing the following formula:
where Iout and Iin are the output and input currents, respectively. Understanding these mathematical aspects is essential for designing and optimizing efficient boost converters in various electronic applications.
To enhance a solar PV system’s efficiency, the integration of one boost converter between the load and the generator is implemented. The voltage delivered to the load is regulated by the (DC–DC) converter. Indeed, this latter is controlled by an MPPT algorithm, through the use of a duty cycle(α). This algorithm directs the PV generator’s operating point towards the maximum power point (Pmax) as detected by the control system.
The boost converter’s derived equation can be based on its continuous operating model and is calculated as follows:
3.4. VHF Inverter
A very-high-frequency (VHF) inverter is an electrical device utilized to convert high-frequency AC voltage into direct current DC voltage. This inverter is often used in long-distance power transmission applications. The operation of an HF inverter is generally based on the principle of pulse-width modulation PWM, a common technique in power conversion.
The heart of the VHF inverter is a set of power transistors that switch rapidly between conducting and blocking states. The duty cycle of this switching, generally named D, determines the width of the pulses generated by the output waveform. The output AC voltage (Vout) is defined using the following pulse-width modulation formula:
where Vdc is the input VDC voltage. Through the adjustment of the duty cycle, the inverter effectively controls any output voltage.
Vout = Vdc·D
To obtain an HF output voltage, HF inverters often use LC (inductor–capacitor) circuits that act as filters and limit unwanted harmonics. The switching frequency (fsw) is an important parameter in an inverter design and relates to the duty cycle by the following formula:
where Tsw is the switching period, and .
VHF inverter efficiency is often evaluated by the efficiency (η), which represents the power ratio between the input and output powers. Efficiency is calculated using the following formula:
where Iint and Iout are, respectively, the input and output currents. Understanding these mathematical concepts is essential for designing efficient and reliable HF inverters in high-voltage power transmission systems.
3.5. RWPT System Modelization
In 2008, MIT researchers developed RWPT, a WPT system that incorporates compensation capacitors within both the transmitter and the receiver. They function at their individual resonant frequencies. In general, adding these compensation capacitors represents a significant advancement for WPT, eliminating the imaginary impedance component perceived by the source. Thanks to this improvement, RWPT achieves higher levels of output power and efficiency compared to conventional WPT.
This magnitude is observed at short and medium distances, relative to the size and shape of the coil. Not surprisingly, RWPT has found wide applications in recent years in a variety of technologies involving WET. Concrete examples include the integration of RWPT in several fields such as cellular phones and EV chargers, including those used in the innovative concept of road charging.
Equation (19) defines the coupling coefficient k. Generally, when the coupling constant k is higher, it means that there is an increased transfer of magnetic flux to the receiver coil from the transmitter. Hence, it is clear that efficiency is linked to the coupling coefficient in a direct way.
When the coils are loosely coupled, the inductance becomes significant. To counteract or nullify the influence of this leakage inductance, a capacitor can be inserted in series. Let us examine two coils that are magnetically linked, as represented in Figure 7a. In one system with loose coupling, the leakage inductance can surpass the mutual inductance. As a result, the leakage reactance (LLI) impedes the current flow to the output, particularly at elevated operating frequencies (where f = ω/2π). By introducing a series capacitor and tuning it to the LC resonator frequency (f0), as depicted in Figure 7b, the leakage reactance can be compensated for while effectively reducing the impedance along the energy path from the source into the circuit.
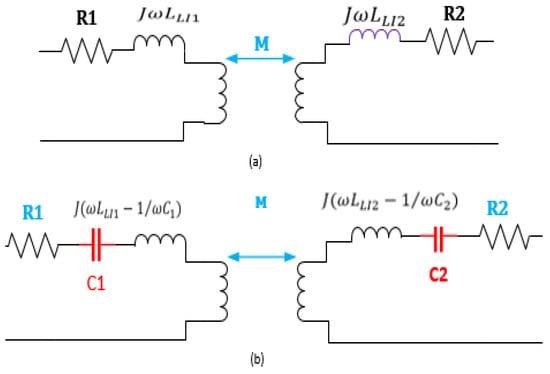
Figure 7.
Equivalent circuit depicting magnetic coupling of two coils, with capacitors in series (a) and without capacitors (b).
The operating frequency f0 is defined as follows:
Here, C represents the capacitance of the resonant capacitor. Leveraging its negative reactance to offset the leakage inductance’s positive reactance represents one technique known as “impedance matching”, which aims at minimizing the reactance along the energy flow path. Moreover, addressing the interoperability of wireless charging systems for EVs is crucial. It ensures that different transmitter and receiver devices can effectively meet specified performance indicators [45,46].
Figure 7 and Figure 8 illustrate the link between the distance separating both coils and the k coupling factor k and the M mutual inductance, as outlined by Equation (20). The relationship between M, k, and the distance between the coils is clearly one of inverse proportionality. Furthermore, when employing the mutual inductance M, the commonly adopted closed-form solution, this inverse relationship exhibits a cubic nature. Thus, to achieve a sufficient coupling factor, it is advisable to position the coils as closely together as feasible, taking into account the desired degree of coupling.
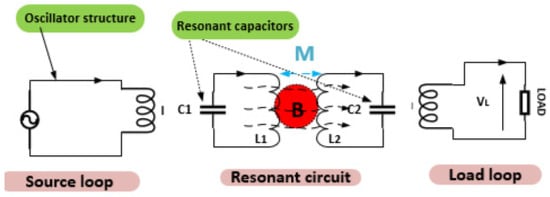
Figure 8.
Circuit representation equivalent to RWPT system.
As depicted in Figure 9, terms N1 and N2 represent the number of rotations made by both coils, while R2 and R4 designate the external dimensions of the coils, and R1 and R3 correspond to the coils’ inner radii.
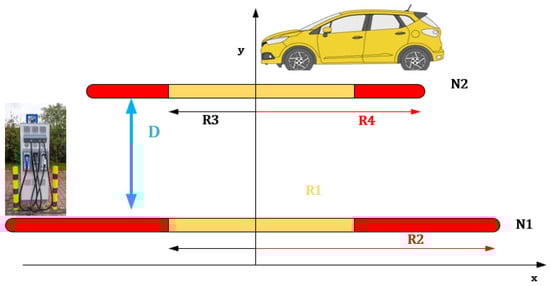
Figure 9.
Centralized parallel positioning of two flat spiral coils.
The efficiency of the system can be determined by employing the subsequent formula:
3.6. Size of Batteries
Sizing the battery for an EV is a crucial aspect of its propulsion system design. Figure 10 illustrates several factors that must be considered to determine the appropriate battery capacity to meet specific vehicle requirements. Key considerations include the following:
Figure 10.
Battery.
- Range requirement: The distance the vehicle needs to cover between charges necessitates battery capacity. Factors such as driving habits, typical routes, and user needs should be taken into account to meet the required range.
- Vehicle weight: Heavy vehicles require more energy to move, directly impacting the required battery capacity to maintain an adequate range.
- System efficiency: The overall efficiency of the electric propulsion system [47,48,49], encompassing components, like the motor, the transmission, and the controller, affects energy consumption per distance. Higher-efficiency systems may enable longer ranges with smaller battery capacities.
- Environmental conditions: Factors such as extreme temperatures can affect battery performance, potentially reducing capacity in cold weather. It is essential to consider these conditions when sizing the battery.
- Battery life: Long-lasting batteries are typically supported by charge and discharge cycles. However, higher-capacity batteries tend to be more expensive.
- Cost: Balancing battery capacity with costs is crucial in the EV design. Finding the optimal capacity that meets range requirements without inflating overall costs is key.
- Charging infrastructure: The availability and accessibility of charging stations influence battery size considerations. A well-established charging network can support smaller battery capacities, allowing more frequent recharges.
This comprehensive evaluation ensures that the EV battery size aligns with performance expectations, cost constraints, and practical considerations related to charging infrastructure and environmental factors.
The arrangement and construction of the battery cells within a battery pack ultimately dictate the physical dimensions of an EV battery. The particular mathematical calculations that are applied rely on the battery pack’s selected shape. The following are important things to remember:
Battery Volume: Volume V of the battery, assuming a rectangular shape, is calculated using the following:
where is the length, is the width, and is the height of the battery pack.
Energy Capacity: Energy capacity C of the battery, typically measured in kilowatt-hours (kWh), depends on the energy density of the cells and the number of cells in the battery pack:
where is the number of cells, and is the energy capacity of each cell in kilowatt-hours (kWh).
Battery Voltage: The total battery voltage for a series-connected battery with cells is the sum of the voltages of the individual cells:
where is the voltage of a single cell.
Battery Weight: The weight P of the battery is determined by the battery’s density and the volume it occupies:
where Density is the density of the battery.
P = Density × V
4. Integrated System Modeling and Optimization Algorithms: Enhancing Efficiency and Performance
As Figure 11 shows, the evolution of the research work in this paper began with the modeling of the different parts of our wireless charging system, starting with the modeling of the photovoltaic panel matrix under predefined conditions, and similarly for the fuel cell. Then we move on to the voltage junction stage, through the modeling of boost converters and their control. In the third place, we find the modeling of the high-frequency inverter, which will ensure the modeling of the signal at the resonance frequency of the coils, representing the last part of the system (the RWPT part). In this section, we proceed to the design and optimization of our system by refining the high-frequency inverter architecture. This involves adjusting both the inverter input and output impedances to achieve maximum power at the inverter output.
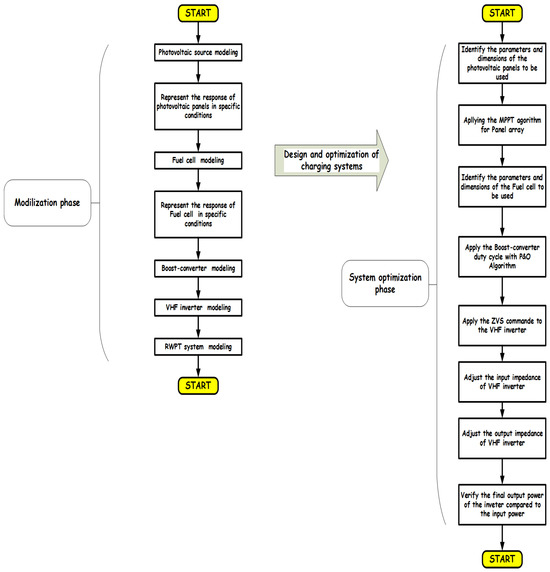
Figure 11.
System simulation model diagram.
The selected panel model for system modeling in Simulink is the SunPower SPR-315E–WHT-U. The electrical specifications of this model are outlined in Table 1.

Table 1.
SunPower SPR-315E-WHT-U.
Figure 12 and Figure 13 illustrate the outcomes derived from simulating the model with an optimal parameterization aimed at achieving maximum output power, particularly at T = 25 °C and G = 1000 w/m2.
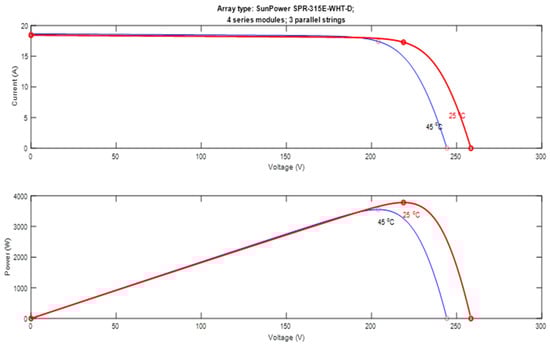
Figure 12.
W = 1000 and specified temperature.
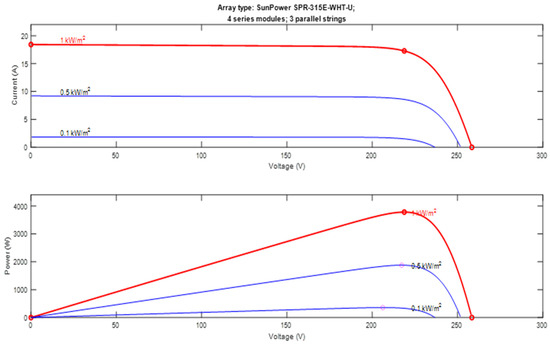
Figure 13.
T = 25 deg and specified irradiances.
Table 2 provides a comprehensive overview of electrical parameters linked to the hydrogen fuel cell utilized in the simulation conducted on Simulink. The table encompasses crucial details, such as the voltage, the current, and other key electrical characteristics, offering a detailed insight into the behavior and performance of the hydrogen fuel cell within the simulation framework. This information serves as a valuable reference to understand the intricacies of the fuel cell’s electrical properties, aiding in the analysis and interpretation of simulation results on Simulink.
Table 2.
SOFC-3 KW-100 Vcd.
Figure 14 shows the current and power characteristics of a single photovoltaic module for different solar irradiation values. The red curve represents the shape of the current and power for standard solar irradiation (1000 W/m2).
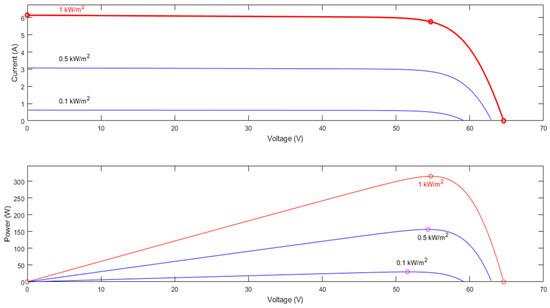
Figure 14.
One module production.
Figure 15 shows the results obtained from simulating the model under optimal parameterization, which achieves a maximal power output of the fuel cell generator.
Figure 15.
Fuel cell production.
To improve the capacity and performance of a PV array, a power converter can be actually introduced between the E-class inverter and the PV array, which acts as a resonant structure. Added to that, this “boost” DC–DC converter, which is basically governed by the iterative MPPT P&O algorithm nominally, controlled by the duty cycle signal α shown in Figure 16. Because of this fact, the MPPT algorithm achieves the maximum power, which is denoted as Pmax, from the PV array. This is accomplished through a control system that monitors both Vpv and Ipv. In this context, parameter α varies within the interval [10%; 90%], as illustrated in Figure 15.
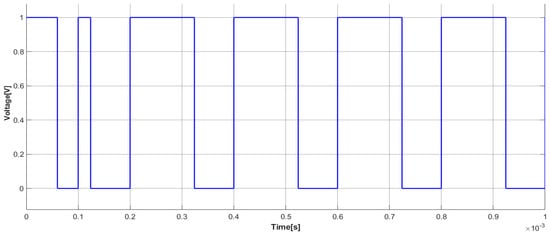
Figure 16.
Boost-converter duty cycle with P&O algorithm.
To provide comprehensive guidelines for designing the resonant characteristics of class-Ф2 conducted on the resonant parameters of the inverters undertaken to investigate the modeling techniques specific to this class and to minimize the resonant current for analyzing the magnitude and conduction losses in resonant power converters, we have developed one analytic modeling approach for class-Ф2 inverters. Indeed such a method involves altering the inverter’s input impedance, while simultaneously overly employing one variable impedance (Zeq) with the purpose of tailoring and adjusting the resonance parameters and considering key factors like the control signal emanating from the transistor response, the network signal quality, and the DSP or driver module, as illustrated in Figure 17 and Figure 18. The capacitance at the output of the gallium nitride (GaN) transistor, often denoted as (Ct), is proportionally related to the condition Ct < Coss, relative to the operating frequency of the inverter. The operational duration and manufacturing deviations of the transistor impact the (Coss) internal capacitance and, as a consequence, the overall system, necessitating careful consideration in the Ct selection. Figure 18 outlines the algorithm for optimizing the class-Ф2 inverters’ operating mode using a capacitor array with the target of adjusting Ct optimally for Pout_max. Additionally, optimization trials between the RWPT system and the class-Ф2 inverters involve adjusting optimal operations achieved by balancing the input capacitance of RWPT (Cin) and the output capacitance of the inverter (Cz) for attaining the maximum power at the secondary coil terminal (Pout_max) while minimizing losses (Ploss_min).
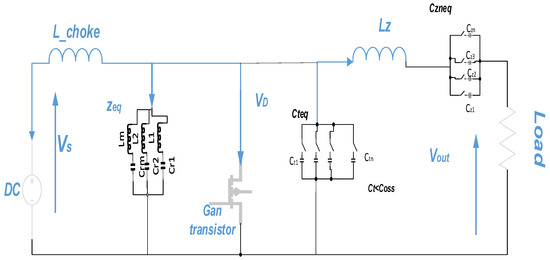
Figure 17.
Optimized VHF inverter equivalent model.
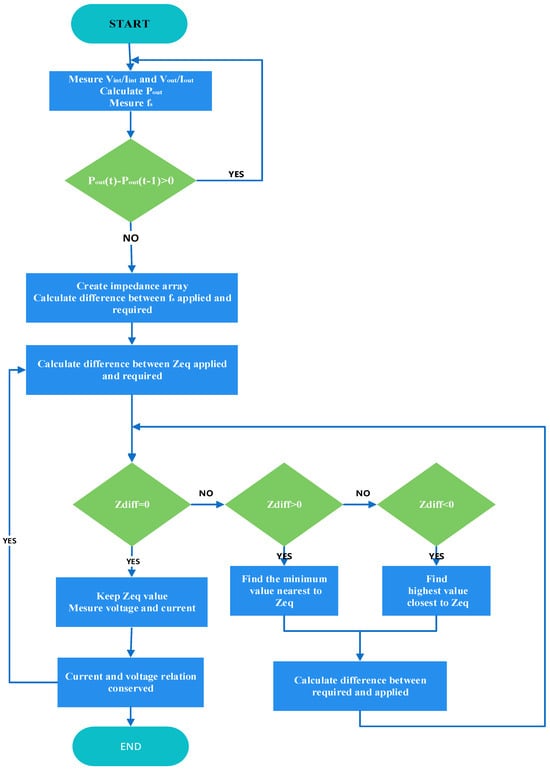
Figure 18.
Suggested approach for creating an equivalent model of Zeq impedance layout.
An optimization algorithm can be applied in this resonance impedance fine-tuning, which will enhance the performance and efficiency of the Class-Φ2 inverters. The process of fine-tuning endeavors to maximize the output power, Pout, is accessible through a wise change in the resonant impedance of the structure. For various reasons, this variation is directly relevant to the second harmonic of the output signal delivered by an inverter. Firstly, the algorithm reduces conduction losses by targeting the second harmonic component. Since the resistive elements in the circuit are responsible for conduction losses, minimizing these losses is a significant criterion for enhancing the global efficiency of the power converter. The next most important advantage of this optimization process is that it reduces the magnitude of the resonant current. Resonant currents will further increase power losses and thermal stresses in the components, influencing lifetime and reliability. To illustrate these current voltage patterns at the resistive load terminal, some typical examples are reproduced in Figure 19 and Figure 20. These examples prove how well-suited the optimization approach is for practical applications and how fine-tuning the resonance impedance is reached so that better performance can be obtained. The current–voltage curves allow the energy transfer to be more stable and efficient. It shows a decrease in the losses and an increase in the power output. Figure 18 contains currents and voltages before any optimization; supposedly, variations and inefficiencies existed. Figure 19 shows the optimized currents and voltages after the application of the optimization algorithm. The comparison between the two figures emphasizes that an excellent impedance-tuning strategy is necessary for inverter optimization. This optimization technique will take the performance of the inverter to an operating point wherein both stability and efficiency are preserved as the load is varied. The system continuously adjusts the resonant impedance and adapts to changes to keep the optimum power output for enhancing the whole performance and reliability of the Class-Φ2 inverters in practical applications.
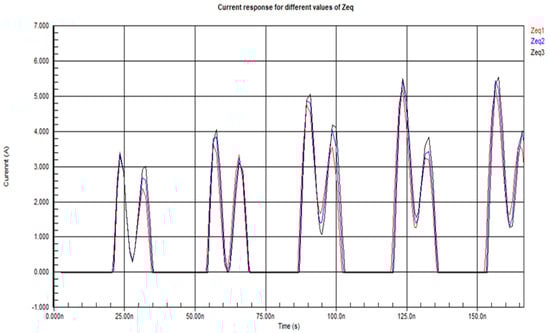
Figure 19.
Influence of resonance impedance variation in inverter on output current curve.
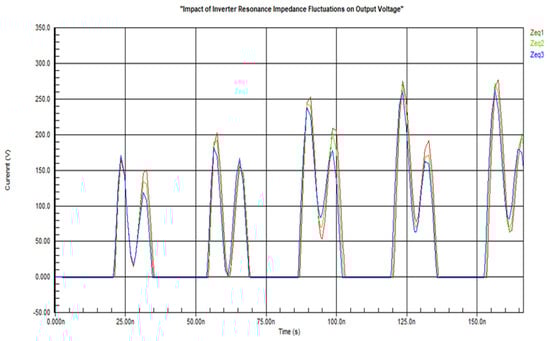
Figure 20.
Influence of resonance impedance variation in inverter on output voltage.
The capacitance value attributed to the output of the transistor (Ct) should be directly corresponding to the inverter’s operating frequency (Fs). Ct must adhere to the Ct < Coss condition, considering the influence of the operating time and manufacturing errors on the internal capacitance (Coss) of the transistor, as well as the frequency of the entire system. Consequently, selecting Ct should carefully consider these factors. The optimization process is outlined by the algorithm depicted in Figure 21 for the operating mode of class-Φ2, utilizing one capacitor array with the objective of fine-tuning the optimal Ct value regarding Pout_max. Simultaneously, optimizing the system across a class-Φ2 inverter and the RWPT system necessitates adjustments to the inverter’s output capacitance (Cz), as well as to the input capacitance of RWPT (Cin). This guarantees the optimal operational structure range, aiming at achieving maximal power at the secondary coil’s terminal (Pout_max) while minimizing losses (Ploss_min).
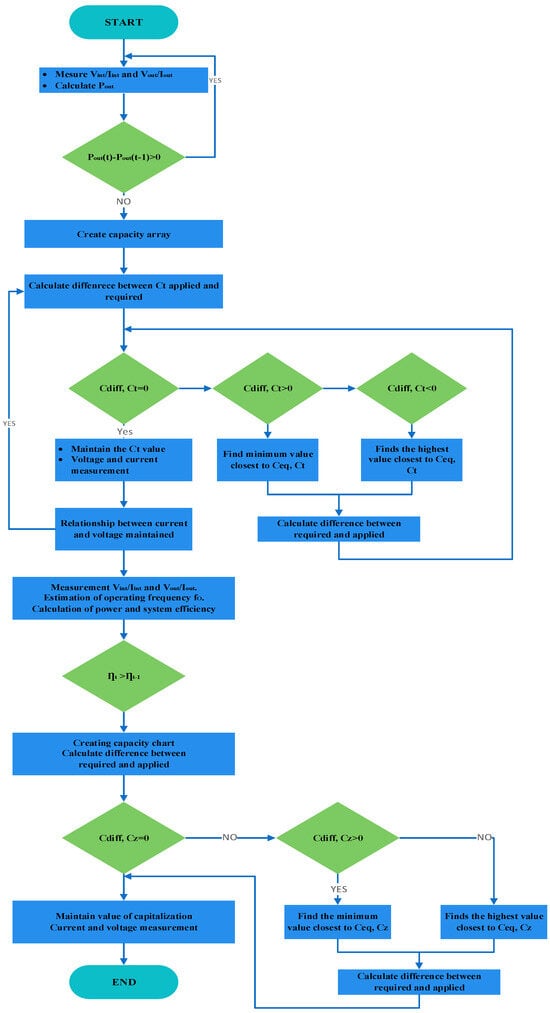
Figure 21.
Suggested algorithm for an equivalent model of output inverter impedance layout.
Figure 22 and Figure 23 show the dependency of the inverter power with both capacitances and . The statistics relating the ratio of the capacitance values existing within the inverter to the output power are tabulated, showing how the alteration of these parameters affects the general performance. Estimations of the optimal values of and lead to the maximum achievable power output that can be obtained based on the optimization algorithm described above. The algorithm tunes up the capacitances systematically to fine-tune the resonance characteristics of the inverter toward a more efficient delivery of power. The algorithm operates by targeting the capacitance adjustments to ensure that the inverter is at its working optimal point to deliver the highest power without incurring instability and low efficiency. The visual representation of how vital fine-tuning the capacitances is in the design of an inverter can be seen in the representation of Figure 22 and Figure 23. Both and can be properly enhanced by realizing where the inverter does its best at various operational conditions. After careful analysis using these figures, the optimization algorithm can be applied to improve the performance and reliability of the inverter to give a maximum power output in practical applications.
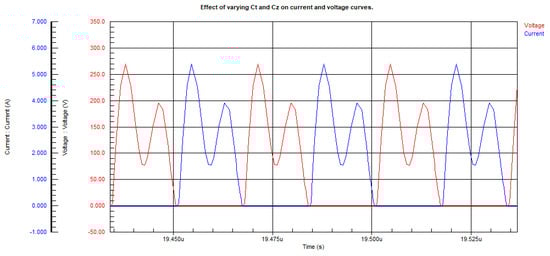
Figure 22.
Effect of varying Ct and Cz on current and voltage curves.
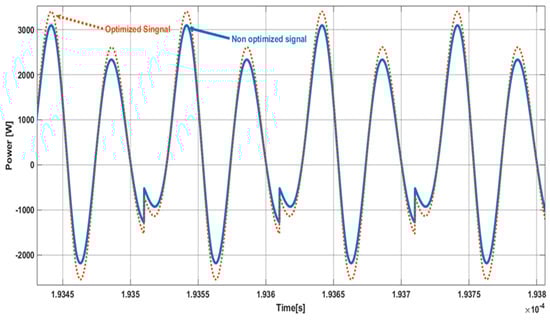
Figure 23.
Effect of Ct and Cz variations into output power.
Figure 24 represents the system resonant frequency in an optimal work mode.
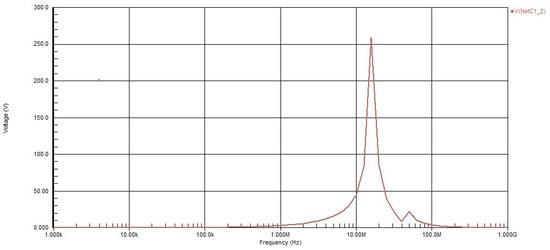
Figure 24.
VHF inverter resonance frequency.
The VHF inverter model adheres to the following hypotheses:
- The transistor can function like one switch with negligible switching times, an off-interval resistance approaching infinity, and a finite on-interval resistance (Rinv).
- The shunt capacitance (Ct) remains unaffected by such switching voltage, including the transistor’s output capacitance.
- We consider all passive elements as perfect and unchanging over time. In addition to that, the switch operates at any duty cycle (D) and any frequency (fs). In this case, we define the duty cycle as the switch-on time. We divide this later by (T = 1/fs), the switching period.
To achieve an optimal operation, the inverter structure necessitates soft switching, called ZVS, to minimize losses. Figure 25 illustrates the control signal of class-Φ2 for specific parameters, including a duty cycle (D) of 45%, a fall time of 0.002 us, a time delay of 0.001 us, and a rise time of 0.002 us.
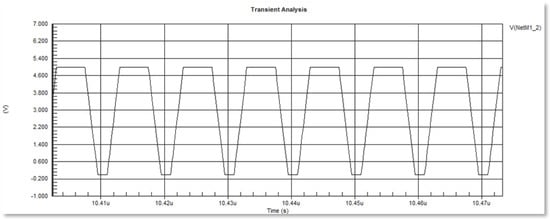
Figure 25.
Command signal in ZVS mode.
5. Conclusions
In conclusion, the novel hybrid EV charging station has a hybrid power source joined between fuel cells and PVPs. It has five major components, employs WPT technology, and operates at 240 V and 14 A. The optimization process has been conducted in two stages: working with an inverter of class υ2 during the high-frequency (HF) step, which is at 30 MHz, and accomplishing MPPT within the boost converter to ensure maximum power generation. An ZVS-controlled DSP card, synchronized at the resonant frequency of coils involved in RWPT, is pursued for operation at its optimal state. This creative design with hybrid sources and maximizing power transmission adds to the sustainability of EV charging options. Consequently, there is an opportunity for the infrastructure that may be used to support hybrid EV charging shortly. To increase the performance of such systems, future research will address the incorporation of technologies such as artificial intelligence and machine learning to discover new materials for improving the durability and efficiency of the components in such systems and develop scalable solutions for more universal applications. Long-term survivability is also very much associated with environmental issues and sustainability, including material life-cycle analysis and conformance to ecologically friendly practices. Interdisciplinary collaboration and field testing will become essential for such technologies to be applicable and mature in real-life scenarios. This will result in more sophisticated, effective, and sustainable hybrid EV charging systems.
Author Contributions
Conceptualization, C.B.S. and G.B.; methodology, C.B.S., G.B. and M.H.C.; software, G.B.; validation, C.B.S., G.B. and M.H.C.; formal analysis, C.B.S., G.B. and M.H.C.; investigation, C.B.S., G.B. and M.H.C.; resources, C.B.S., G.B. and M.T.; data curation, G.B. and C.B.S.; writing—original draft preparation, G.B. and C.B.S.; writing—review and editing, C.B.S., G.B. and M.T.; visualization, C.B.S., G.B. and M.H.C.; supervision, C.B.S. and M.H.C.; project administration, C.B.S. and A.R. All authors have read and agreed to the published version of the manuscript.
Funding
This research was funded by King Saud University through Researchers Supporting Project number (RSPD2024R685), King Saud University, Riyadh, Saudi Arabia.
Institutional Review Board Statement
Not applicable.
Informed Consent Statement
Not applicable.
Data Availability Statement
Data is contained within the article.
Acknowledgments
The authors acknowledge “Researchers Supporting Project number (RSPD2024R685), King Saud University, Riyadh, Saudi Arabia”.
Conflicts of Interest
The authors declare no conflicts of interest.
References
- Agyeman, S.D.; Lin, B. Nonrenewable and Renewable Energy Substitution, and Low–Carbon Energy Transition: Evidence from North African Countries. Renew. Energy 2022, 194, 378–395. [Google Scholar] [CrossRef]
- Mahesh, A.; Chokkalingam, B.; Mihet-Popa, L. Inductive Wireless Power Transfer Charging for Electric Vehicles—A Review. IEEE Access 2021, 9, 137667–137713. [Google Scholar] [CrossRef]
- Huda, S.M.A.; Arafat, M.Y.; Moh, S. Wireless Power Transfer in Wirelessly Powered Sensor Networks: A Review of Recent Progress. Sensors 2022, 22, 2952. [Google Scholar] [CrossRef]
- Lu, Y.; Khan, Z.A.; Alvarez-Alvarado, M.S.; Zhang, Y.; Huang, Z.; Imran, M. A Critical Review of Sustainable Energy Policies for the Promotion of Renewable Energy Sources. Sustainability 2020, 12, 5078. [Google Scholar] [CrossRef]
- Khatun, E.; Hossain, M.M.; Ali, M.S.; Halim, M.A. A Review on Microgrids for Remote Areas Electrification-Technical and Economical Perspective. Int. J. Robot. Control Syst. 2023, 3, 627–642. [Google Scholar] [CrossRef]
- Rahim, S.; Wang, Z.; Ju, P. Overview and Applications of Robust Optimization in the Avant-Garde Energy Grid Infrastructure: A Systematic Review. Appl. Energy 2022, 319, 119140. [Google Scholar] [CrossRef]
- Sarkar, M.; Majumder, A.; Bhattacharya, S.; Sarkar, B. Optimization of Energy Cycle under a Sustainable Supply Chain Management. RAIRO-Oper. Res. 2023, 57, 2177–2196. [Google Scholar] [CrossRef]
- Chehab, M.H.; Ben Salah, C.; Falama, R.Z.; Tlija, M.; Rabhi, A. Comparative Analysis of Energy Storage Technologies for Microgrids. Int. Trans. Electr. Energy Syst. 2023, 2023, 1–24. [Google Scholar] [CrossRef]
- Gervet, C.; Atef, M. Optimal Allocation of Renewable Energy Parks: A Two–Stage Optimization Model. RAIRO-Oper. Res. 2013, 47, 125–150. [Google Scholar] [CrossRef][Green Version]
- Abramov, E.; Peretz, M.M. Adaptive Self-Tuned Controller IC for Resonant-Based Wireless Power Transfer Transmitters. IEEE Trans. Power Electron. 2021, 36, 12413–12431. [Google Scholar] [CrossRef]
- Alshareef, M.J. An Effective Falcon Optimization Algorithm Based MPPT Under Partial Shaded Photovoltaic Systems. IEEE Access 2022, 10, 131345–131360. [Google Scholar] [CrossRef]
- Radhakrishnan, R.K.G.; Marimuthu, U.; Balachandran, P.K.; Shukry, A.M.M.; Senjyu, T. An Intensified Marine Predator Algorithm (MPA) for Designing a Solar-Powered BLDC Motor Used in EV Systems. Sustainability 2022, 14, 14120. [Google Scholar] [CrossRef]
- Chen, X.H.; Tee, K.; Elnahass, M.; Ahmed, R. Assessing the Environmental Impacts of Renewable Energy Sources: A Case Study on Air Pollution and Carbon Emissions in China. J. Environ. Manag. 2023, 345, 118525. [Google Scholar] [CrossRef] [PubMed]
- Bhattacharyya, D.; Pradhan, S. Shabbiruddin Barriers in Replacement of Conventional Vehicles by Electric Vehicles in India. Int. J. Decis. Support Syst. Technol. 2023, 15, 1–20. [Google Scholar] [CrossRef]
- Sundararaj, V.; Anoop, V.; Dixit, P.; Arjaria, A.; Chourasia, U.; Bhambri, P.; MR, R.; Sundararaj, R. CCGPA-MPPT: Cauchy Preferential Crossover-based Global Pollination Algorithm for MPPT in Photovoltaic System. Prog. Photovolt. Res. Appl. 2020, 28, 1128–1145. [Google Scholar] [CrossRef]
- Falama, R.Z.; Dumbrava, V.; Saidi, A.S.; Houdji, E.T.; Salah, C.B.; Doka, S.Y. A Comparative-Analysis-Based Multi-Criteria Assessment of On/Off-Grid-Connected Renewable Energy Systems: A Case Study. Energies 2023, 16, 1540. [Google Scholar] [CrossRef]
- Sun, C.; Negro, E.; Vezzù, K.; Pagot, G.; Cavinato, G.; Nale, A.; Herve Bang, Y.; Di Noto, V. Hybrid Inorganic-Organic Proton-Conducting Membranes Based on SPEEK Doped with WO3 Nanoparticles for Application in Vanadium Redox Flow Batteries. Electrochim. Acta 2019, 309, 311–325. [Google Scholar] [CrossRef]
- Panov, Y.; Huber, L.; Jovanovic, M.M. Design Optimization and Performance Evaluation of Class Φ 2 VHF DC/DC Converter. In Proceedings of the 2020 IEEE Applied Power Electronics Conference and Exposition (APEC), New Orleans, LA, USA, 15–19 March 2020; pp. 2170–2177. [Google Scholar]
- Khare, V.; Chaturvedi, P. Design, Control, Reliability, Economic and Energy Management of Microgrid: A Review. e-Prime-Adv. Electr. Eng. Electron. Energy 2023, 5, 100239. [Google Scholar] [CrossRef]
- Jansen, I.; Petrova, S. Driving Towards Sustainability: Electric Vehicles’ Contribution to Environmental and Public Health. J. Sustain. Technol. Infrastruct. Plan. 2023, 7, 25–45. [Google Scholar]
- Ampah, J.D.; Afrane, S.; Agyekum, E.B.; Adun, H.; Yusuf, A.A.; Bamisile, O. Electric Vehicles Development in Sub-Saharan Africa: Performance Assessment of Standalone Renewable Energy Systems for Hydrogen Refuelling and Electricity Charging Stations (HRECS). J. Clean. Prod. 2022, 376, 134238. [Google Scholar] [CrossRef]
- Aijaz, I.; Ahmad, A. Electric Vehicles for Environmental Sustainability. In Smart Technologies for Energy and Environmental Sustainability. Green Energy and Technology; Agarwal, P., Mittal, M., Ahmed, J., Idrees, S.M., Eds.; Springer International Publishing: Cham, Switzerland, 2022; pp. 131–145. ISBN 978-3-030-80702-3. [Google Scholar]
- Mohsan, S.A.H.; Khan, M.A.; Mazinani, A.; Alsharif, M.H.; Cho, H.-S. Enabling Underwater Wireless Power Transfer towards Sixth Generation (6G) Wireless Networks: Opportunities, Recent Advances, and Technical Challenges. J. Mar. Sci. Eng. 2022, 10, 1282. [Google Scholar] [CrossRef]
- Pan, Z.; Quynh, N.V.; Ali, Z.M.; Dadfar, S.; Kashiwagi, T. Enhancement of Maximum Power Point Tracking Technique Based on PV-Battery System Using Hybrid BAT Algorithm and Fuzzy Controller. J. Clean. Prod. 2020, 274, 123719. [Google Scholar] [CrossRef]
- Yahia, I.; Salah, C.B.; Saidi, A.S.; Mimouni, M.F.; Alshahrani, A. Contribution to Energy Management of Fuel Cell/Battery Hybrid Electric Vehicles. Proc. Inst. Mech. Eng. Part E J. Process Mech. Eng. 2023, 237, 388–398. [Google Scholar] [CrossRef]
- Ye, Z.; Yang, M.; Chen, P.-Y. Multi-Band Parity-Time-Symmetric Wireless Power Transfer Systems for ISM-Band Bio-Implantable Applications. IEEE J. Electromagn. RF Microw. Med. Biol. 2022, 6, 196–203. [Google Scholar] [CrossRef]
- Vanegas Cantarero, M.M. Of Renewable Energy, Energy Democracy, and Sustainable Development: A Roadmap to Accelerate the Energy Transition in Developing Countries. Energy Res. Soc. Sci. 2020, 70, 101716. [Google Scholar] [CrossRef]
- Gupta, R.S.; Tyagi, A.; Anand, S. Optimal Allocation of Electric Vehicles Charging Infrastructure, Policies and Future Trends. J. Energy Storage 2021, 43, 103291. [Google Scholar] [CrossRef]
- Ram, J.P.; Pillai, D.S.; Ghias, A.M.Y.M.; Rajasekar, N. Performance Enhancement of Solar PV Systems Applying P&O Assisted Flower Pollination Algorithm (FPA). Sol. Energy 2020, 199, 214–229. [Google Scholar] [CrossRef]
- Imanaka, M.; Toyoda, S.; Sugimoto, S.; Kato, T. Coordinated Control of Demand Response for Large Installation of Renewable Energy Sources in Isolated Islands. Int. J. Electr. Electron. Eng. Telecommun. 2022, 11, 325–332. [Google Scholar] [CrossRef]
- Manoj, V. Towards Efficient Energy Solutions: MCDA-Driven Selection of Hybrid Renewable Energy Systems. Int. J. Electr. Electron. Eng. Telecommun. 2024, 13, 98–111. [Google Scholar] [CrossRef]
- Wong, J.; Lim, Y.S. Experimental Validation for Dynamic Fuzzy-Controlled Energy Storage System to Maximize Renewable Energy Integration. Int. J. Electr. Electron. Eng. Telecommun. 2018, 7, 83–89. [Google Scholar] [CrossRef]
- Suman, A. Role of Renewable Energy Technologies in Climate Change Adaptation and Mitigation: A Brief Review from Nepal. Renew. Sustain. Energy Rev. 2021, 151, 111524. [Google Scholar] [CrossRef]
- Hao, D.; Qi, L.; Tairab, A.M.; Ahmed, A.; Azam, A.; Luo, D.; Pan, Y.; Zhang, Z.; Yan, J. Solar Energy Harvesting Technologies for PV Self-Powered Applications: A Comprehensive Review. Renew. Energy 2022, 188, 678–697. [Google Scholar] [CrossRef]
- Yap, K.Y.; Chin, H.H.; Klemeš, J.J. Solar Energy-Powered Battery Electric Vehicle Charging Stations: Current Development and Future Prospect Review. Renew. Sustain. Energy Rev. 2022, 169, 112862. [Google Scholar] [CrossRef]
- Chehab, M.H.; Khelil, M.; Salah, C.B.; Tlija, M.; Rabhi, A. Photovoltaic Class-E Inverter for Resonance Wireless Power Transfer for Electric Vehicle Charging Applications with Optimization Algorithms. Energy Technol. 2023, 11, 2300304. [Google Scholar] [CrossRef]
- Aguila-Leon, J.; Vargas-Salgado, C.; Chiñas-Palacios, C.; Díaz-Bello, D. Solar Photovoltaic Maximum Power Point Tracking Controller Optimization Using Grey Wolf Optimizer: A Performance Comparison between Bio-Inspired and Traditional Algorithms. Expert Syst. Appl. 2023, 211, 118700. [Google Scholar] [CrossRef]
- Serra, P.M.D.; Espírito-Santo, A. Sourcing Power with Microbial Fuel Cells: A Timeline. J. Power Sources 2021, 482, 228921. [Google Scholar] [CrossRef]
- Sun, Y. The Achievement, Significance and Future Prospect of China’s Renewable Energy Initiative. Int. J. Energy Res. 2020, 44, 12209–12244. [Google Scholar] [CrossRef]
- Asghar, R.; Sulaiman, M.H.; Mustaffa, Z.; Ullah, N.; Hassan, W. The Important Contribution of Renewable Energy Technologies in Overcoming Pakistan’s Energy Crisis: Present Challenges and Potential Opportunities. Energy Environ. 2023, 34, 3450–3494. [Google Scholar] [CrossRef]
- Eltoumi, F.M.; Becherif, M.; Djerdir, A.; Ramadan, H.S. The Key Issues of Electric Vehicle Charging via Hybrid Power Sources: Techno-Economic Viability, Analysis, and Recommendations. Renew. Sustain. Energy Rev. 2021, 138, 110534. [Google Scholar] [CrossRef]
- Nezamuddin, O.N.; Nicholas, C.L.; Santos, E.C. dos The Problem of Electric Vehicle Charging: State-of-the-Art and an Innovative Solution. IEEE Trans. Intell. Transp. Syst. 2022, 23, 4663–4673. [Google Scholar] [CrossRef]
- Parvez, M.; Pereira, A.T.; Ertugrul, N.; Weste, N.H.E.; Abbott, D.; Al-Sarawi, S.F. Wide Bandgap DC–DC Converter Topologies for Power Applications. Proc. IEEE 2021, 109, 1253–1275. [Google Scholar] [CrossRef]
- Yang, R.; Xiong, R.; He, H.; Mu, H.; Wang, C. A Novel Method on Estimating the Degradation and State of Charge of Lithium-Ion Batteries Used for Electrical Vehicles. Appl. Energy 2017, 207, 336–345. [Google Scholar] [CrossRef]
- Song, K.; Lan, Y.; Zhang, X.; Jiang, J.; Sun, C.; Yang, G.; Yang, F.; Lan, H. A Review on Interoperability of Wireless Charging Systems for Electric Vehicles. Energies 2023, 16, 1653. [Google Scholar] [CrossRef]
- Palani, G.; Sengamalai, U.; Vishnuram, P.; Nastasi, B. Challenges and Barriers of Wireless Charging Technologies for Electric Vehicles. Energies 2023, 16, 2138. [Google Scholar] [CrossRef]
- Yang, L.; Li, X.; Sun, M.; Sun, C. Hybrid Policy-Based Reinforcement Learning of Adaptive Energy Management for the Energy Transmission-Constrained Island Group. IEEE Trans. Ind. Inform. 2023, 19, 10751–10762. [Google Scholar] [CrossRef]
- Xu, D.; Zhou, B.; Wu, Q.; Chung, C.Y.; Li, C.; Huang, S.; Chen, S. Integrated Modelling and Enhanced Utilization of Power-to-Ammonia for High Renewable Penetrated Multi-Energy Systems. IEEE Trans. Power Syst. 2020, 35, 4769–4780. [Google Scholar] [CrossRef]
- Zhang, N.; Sun, Q.; Yang, L.; Li, Y. Event-Triggered Distributed Hybrid Control Scheme for the Integrated Energy System. IEEE Trans. Ind. Inform. 2022, 18, 835–846. [Google Scholar] [CrossRef]


Disclaimer/Publisher’s Note: The statements, opinions and data contained in all publications are solely those of the individual author(s) and contributor(s) and not of MDPI and/or the editor(s). MDPI and/or the editor(s) disclaim responsibility for any injury to people or property resulting from any ideas, methods, instructions or products referred to in the content. |
© 2024 by the authors. Licensee MDPI, Basel, Switzerland. This article is an open access article distributed under the terms and conditions of the Creative Commons Attribution (CC BY) license (https://creativecommons.org/licenses/by/4.0/).