Article

A Novel Voltage-Abnormal Cell Detection Method for Lithium-Ion Battery Mass Production Based on Data-Driven Model with Multi-Source Time Series Data

The School of Automation, Central South University, Changsha 410038, China
*
Author to whom correspondence should be addressed.
Energies 2024, 17(14), 3472; https://doi.org/10.3390/en17143472
Submission received: 20 May 2024 / Revised: 6 July 2024 / Accepted: 8 July 2024 / Published: 15 July 2024

Abstract

:
Before leaving the factory, lithium-ion battery (LIB) cells are screened to exclude voltage-abnormal cells, which can increase the fault rate, troubleshooting difficulty, and degrade pack performance. However, the time interval to obtain the detection results through the existing voltage-abnormal cell method is too long, which can seriously affect production efficiency and delay shipment, especially in the mass production of LIBs when facing a large number of time-critical orders. In this paper, we propose a data-driven voltage-abnormal cell detection method, using a fast model with simple architecture, which can detect voltage-abnormal cells based on the multi-source time series data of the LIB without a time interval. Firstly, our method transforms the different source data of a cell into a multi-source time series data representation and utilizes a recurrent-based data embedding to model the relation within it. Then, a simplified MobileNet is used to extract hidden feature from the embedded data. Finally, we detect the voltage-abnormal cells according to the hidden feature with a cell classification head. The experiment results show that the accuracy and average running time of our model on the voltage-abnormal cell detection task is 95.42% and 0.0509 ms per sample, which is a considerable improvement over existing methods.

1. Introduction

As a high-performance energy storage device, the lithium-ion battery has attracted wide attention and is widely used in many applications, such as electric vehicles, unmanned system, and portable devices [1,2,3,4]. The manufacturing of LIBs is a long-process production chain, with discrete-continuous mixing and multiple materials involved [5]. The high complexity of LIB production and the variation in raw materials inevitably leads to the presence of abnormal cells, such as internal-resistance-abnormal cells and discharge-abnormal cells. At the end of LIB production, the cells are formed, tested, and aged at room temperature for several days to fully test and verify the function and performance of the LIB.
Before the cells leave the factory, there is an essential detection procedure that needs to be performed, which is to detect the current open circuit voltage (OCV) of the cell and compare it with the OCV before aging to estimate whether there are abnormalities, such as voltage anomalies, etc. However, the time interval between these two OCV detections is too long and at least five days are needed to wait for the cell voltage to change, and then, obtain the detection results in our case. This problem can seriously affect the efficiency of production and delay shipment. Especially in the mass production of LIBs, the traditional detection methods cannot quickly, accurately, and efficiently detect voltage-abnormal cells, which leads to a reduction in the overall production efficiency of LIBs and delays shipments. This problem is particularly prominent as a large number of orders are time-critical.
In recent years, data-driven methods have achieved significant success in different engineering areas [6], such as medical data analysis [7], traffic prediction [8], state diagnosis [9], and so on. These methods can learn hidden features from data with multiple levels of abstraction and are better than other methods based on hand-crafted features [10]. On the other hand, the management and manufacturing of LIBs have become more and more intelligent with the development of technology. Many sensors are deployed to monitor the environment and variation in LIBs during production and usage, making it no longer difficult to obtain the process data of cells. These process data of LIBs have been used by various data-driven methods to improve productivity, manageability, and feasibility. For battery production, Li et al. [11] proposed a new battery management method based on a deep learning model for feature extraction to enhance the reliability of electric vehicle batteries. Haider et al. [12] use battery operating data and a clustering algorithm to detect anomalies in batteries, which can improve the maintenance efficiency and lower the risks of battery operation. Duquesnoy et al. [13] used a data-driven assessment on experimental results for the electrode calendaring process to optimize the production parameters for safer, high-performing, and cheap LIB production. Jin et al. [14] proposed a fault diagnosis method for a single LIB and battery pack based on a combined model and data-driven method. Ma et al. [15] utilize statistical analysis to detect connecting faults in lithium-ion power batteries for electric vehicles, which can reduce the risk of LIB fire or explosion accidents. Wu et al. [16] combine a deep belief network and ensemble empirical mode decomposition to predict the remaining useful life of LIBs. For abnormal-battery detection, Wang et al. [17] proposed a new diagnosis method for networked battery systems based on a data-driven statistical analysis to estimate reliability and diagnose accuracy. Li et al. [18] focused on the diagnosis of electric vehicle battery faults, and proposed an abnormal detection method based on the long short-term memory neural network LSTM to improve the robustness and reliability of electric vehicle batteries. Li et al. [19] use an unscented Kalman filter algorithm to predict changes in the LIB core temperature and design an adaptive threshold method for rapid fault diagnosis that considers the change rates of the voltage and temperature for four different fault conditions. Wang et al. [20] proposed a model-based insulation fault diagnosis method for the LIB pack to ensure the safety of electric vehicles. Sun et al. [21] study a transfer-learning-optimized residual network to diagnose internal short circuit faults of LIBs with unknown parameters to ensure battery safety. Tian et al. [22] try to detect and localize thermal faults in LIBs based on Mask R–CNN [23] to protect LIBs and avoid thermal failure. Zhang et al. [24] combine Gaussian process regression with electrochemical impedance spectroscopy to forecast the remaining useful life of LIBs. He et al. [25] proposed a Dempster–Shafer theory and a Bayesian Monte Carlo-based method to estimate the state of health of LIBs. Zhang et al. [26] fuse a deep learning model and feature analysis methods to predict the remaining useful life and state of health of LIBs. Currently, these data-driven methods are mainly applied to manufacturing optimization and fault diagnosis in the use of LIBs, and only a few data-driven methods have been directly used for anomaly detection in the manufacturing process of LIBs. However, these applications of data-driven methods in the field of LIBs demonstrate their effectiveness, capability, and huge potential for the voltage-abnormal cell detection task.
To detect voltage-abnormal cells without a time interval based on a data-driven model, we can utilize the process data of cells during formation and testing, which are charge and discharge curves of cells with different profiles, and these curves are usually formed as time series data. These time series data of LIBs contain the variation and performance information of the cell, and can be used to predict cell quality and detect cell state [27,28]. To better utilize these process data to detect voltage-abnormal cells in a timely fashion, a high-performance and accurate data-driven model for time series data is important. There are many time series-based data-driven models for different applications, such as classification, forecasting, etc., and they can be divided into two categories: traditional machine learning-based methods and deep learning-based methods. For the traditional machine learning-based methods, Hu et al. [29] refine support vector machine for short-term wind speed forecasting. Davis et al. [30] study random forest for nonlinear time series modeling. Shiraishi et al. [31] applied the generalized random forest for the quantile regression for time series data. Silva et al. [32] extend the traditional C4.5 decision tree method for regression and forecasting of multivariate time series. Qiu et al. [33] study the oblique random forest for time series forecasting. Ilic et al. [34] proposed an explainable boosted linear regression for time series forecasting, which enabled the incorporation of nonlinear features by explanation of the residuals. The traditional machine learning-based methods are simple and have good performance on many time series problems, but their performance depends on manual feature extraction and selection to some extent [35]. For deep learning-based methods, Wang et al. [36] proposed a lightweight multi-layer perceptron (MLP) neural network for high-performance time series forecasting. Zhang et al. [37] extend localized stochastic sensitivity to robust recurrent neural networks (RNNs) for time series forecasting. Sak et al. [38] study a novel LSTM which makes more effective use of model parameters for large-vocabulary speech recognition. Bai et al. [39] proposed a temporal convolutional network to emphasize the regression capacity of a convolutional neural network (CNN) used for time series forecasting with arbitrary length. Phandoidaen et al. [40] investigate the capacity of Transformer [41] to forecast high-dimensional time series. Zhou et al. [42] proposed the Informer for long-sequence time series forecasting with high efficiency. Bloemheuvel et al. [43] investigate sequential information of time series data with graph neural networks and apply it to seismic data. The deep learning-based methods can extract data features without manual feature selection and achieve better performance. Chen et al. [44] proposed an aircraft engine remaining useful life prediction model based on Transformer with position-sensitive attention and a gated hierarchical LSTM. Li et al. [45] study generative adversarial networks for multivariate anomaly detection based on time series data. Kieu et al. [46] present a time series outlier detection method based on recurrent autoencoder ensembles to reduce the effects of the model being overfitted to outliers.
Nevertheless, there are several challenges that limit the application of data-driven models in voltage-abnormal cell detection for the mass production of LIBs. First, it is hard to obtain satisfactory detection performance using only a single time series of cells, such as a charge–voltage curve, because the voltage abnormality may be caused by multiple factors during production. Thus, the data-driven models for voltage-abnormal cell detection should be able to efficiently extract features from time series of different sources, i.e., multi-source time series data, to find the abnormal cells. Second, the sequential order information in the time series of a cell is important for the voltage-abnormal cell detection task and we need to model the relations of various sources in the multi-source time series data to improve the quality of the extracted features. Finally, the voltage-abnormal cell detection model needs to have a simple structure, fast speed, and high computational efficiency to meet the needs of mass production of LIBs.
In this paper, we propose a data-driven voltage-abnormal cell detection method with multi-source time series data for mass production of LIBs. The proposed method can obtain voltage-abnormal cell detection results immediately after the processes of cell formation and testing without waiting for the cell’s voltage variation, which is time-consuming and inefficient. Firstly, the different source data of a cell during production are transformed into a unified multi-source time series data representation and we use a recurrent-based data embedding to model the relationship within the multi-source time series data. Then, we use the simplified MobileNet to extract hidden features of the embedded data, which is a convolutional-based lightweight neural network that is modified from MobileNetV2 [47]. Finally, a cell classification head is designed to detect the voltage-abnormal cell according to the hidden features of the multi-source time series data. The experimental results show that the accuracy of our model on the voltage-abnormal cell detection task can reach 95.42%, which is better than other data-driven models, and the average running time can reach 0.0509 ms per sample, which is a considerable improvement. The main contributions of this paper are as follows:
  • A data-driven voltage-abnormal cell detection method is proposed which utilizes the multi-source time series data of the cell to detect voltage-abnormal cells quickly and accurately without a long time wait before detection.
  • The abnormal detection model takes the order of different source data into account and adopts a recurrent-based data embedding method to utilize order information for better detection performance.
  • We modified and simplified the structure of MobileNet to improve the computational efficiency and reduce the model redundancy to adapt it to the mass production of LIBs.
The organization of the paper is as follows. In Section 2, we introduce the data representation, model architecture, component detail, and implementation. In Section 3, the details of the experiments are discussed including the data preparation, dataset allocation, experimental setting, and discussion of the results. Finally, we conclude this paper and discuss some future directions in Section 4.

2. Proposed Method

This paper proposed a data-driven abnormal detection model with multi-source time series data to detect voltage-abnormal cells for mass production of LIBs. The proposed model contains several components: recurrent data embedding, simplified MobileNet, and a cell classification head. The architecture of our model is shown in Figure 1. In the following sections, we demonstrate the data representation of multi-source time series data used in our method. We also describe the details of the model architecture and components.

2.1. Data Representation

For each cell, its different types and sources of time series data are collected during manufacturing. These data are obtained to monitor the variation in production, verify battery function, and model the quality of a cell. However, these time series data are not always aligned, i.e., the time series data are different lengths and the scale of each data source varies. To utilize different data sources, we integrate these data to obtain a multi-source time series data representation for better detection performance.
The process to form the multi-source time series data representation is shown in Figure 2. For a cell with N different data source, each data source x i , 1 i N , is first normalized to [ 0 , 1 ] . This can reduce the influence of the scales of different sources on the model performance. Then, the data sources with length less than T are padded with zeros for alignment, where T is the length of the longest source data. Finally, we concatenate these source data along the vertical direction to form the input multi-source time series data X R N × T for the voltage-abnormal cell detection task.

2.2. Model Architecture

The overall structure of our abnormal detection model is shown in Figure 1; it contains recurrent data embedding, simplified MobileNet, and a cell classification head. The details of each component are demonstrated in the following section.

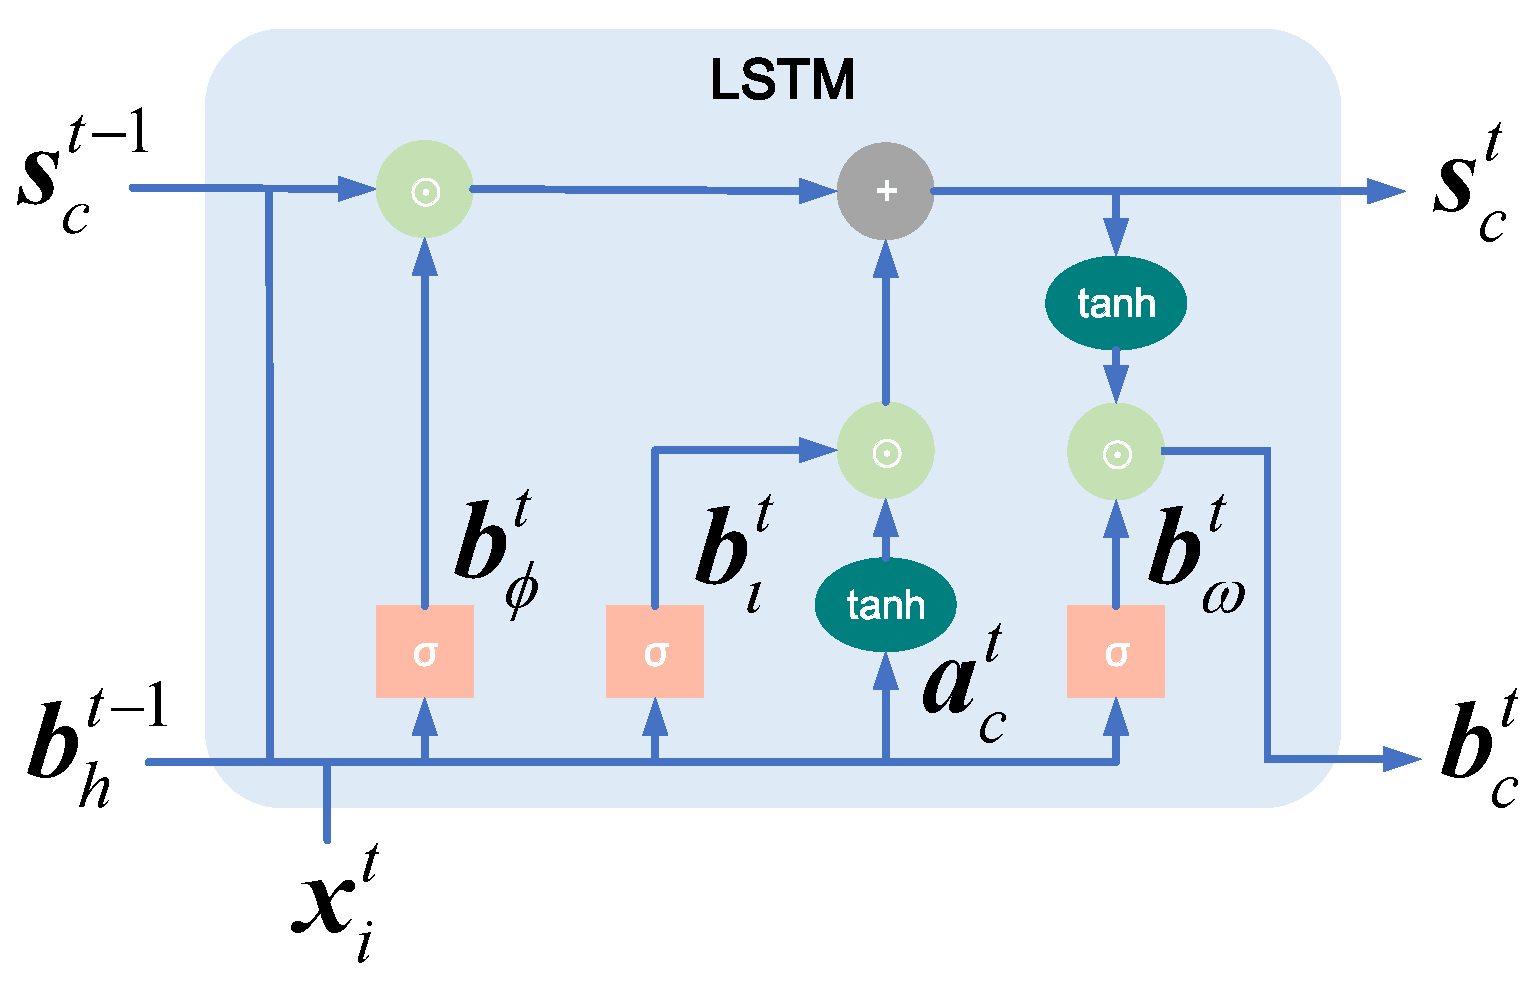
2.2.1. Recurrent Data Embedding

The relative acquisition order of various source data during LIB production in the multi-source time series data is important for the model to obtain data dependency and achieve better detection performance [48]. To utilize and avoid the loss of this information in subsequent processing, we use a recurrent-based data embedding to model the data relationships within X . Specifically, we input each x i = x 1 , x 2 , , x T R T , where x p R , and 1 p T , into the recurrent data embedding module, which models the data relationship as the hidden state, sequentially, and fuse it with the input data.
The recurrent data embedding module in our method is stacked with L LSTM [38,49,50] cells, as shown in Figure 1. The LSTM is a recurrent-based neural network which can handle long-term dependency in the sequence and is more efficient than RNN for time series data. There are many variants of LSTM for different applications. In this paper, we adopted the model structure from [38] for the voltage-abnormal cell detection task, which is easy to train and less complex. The details of the LSTM cell are shown in Figure 3. The calculation of the LSTM cell is as follows:
b ι t = σ w i ι x i t + w h ι b h t 1 + w c ι s c t 1
b ϕ t = σ w i ϕ x i t + w h ϕ b h t 1 + w c ϕ s c t 1
a c t = w i c x i t + w h c b h t 1
s c t = b ϕ t s c t 1 + b ι t σ a c t
b ω t = σ w i ω x i t + w h ω b h t 1 + w c ω s c t
b c t = b ω t tanh s c t
where x i t is the input data of the LSTM at time step t. b h t 1 and b c t are the hidden state at time steps t 1 and t. s c t 1 and s c t are the cell states at time steps t 1 and t. The subscripts ι , ϕ , and ω refer to the input gate, forget gate, and output gate of the LSTM cell, respectively. b ι t , b ϕ t , and b ω t are the output of the input gate, forget gate, and output gate, respectively. σ ( . ) is the sigmoid activation function. tanh ( . ) is the hyperbolic tangent activation function. ⊙ is the Hadamard product. The w terms are the learnable weight matrices for each gate. After all the x i are processed by the recurrent data embedding module, we concatenate the output of each x i as the embedded data X e m b e d R N × d r , where d r is the number of hidden units in the LSTM cell.

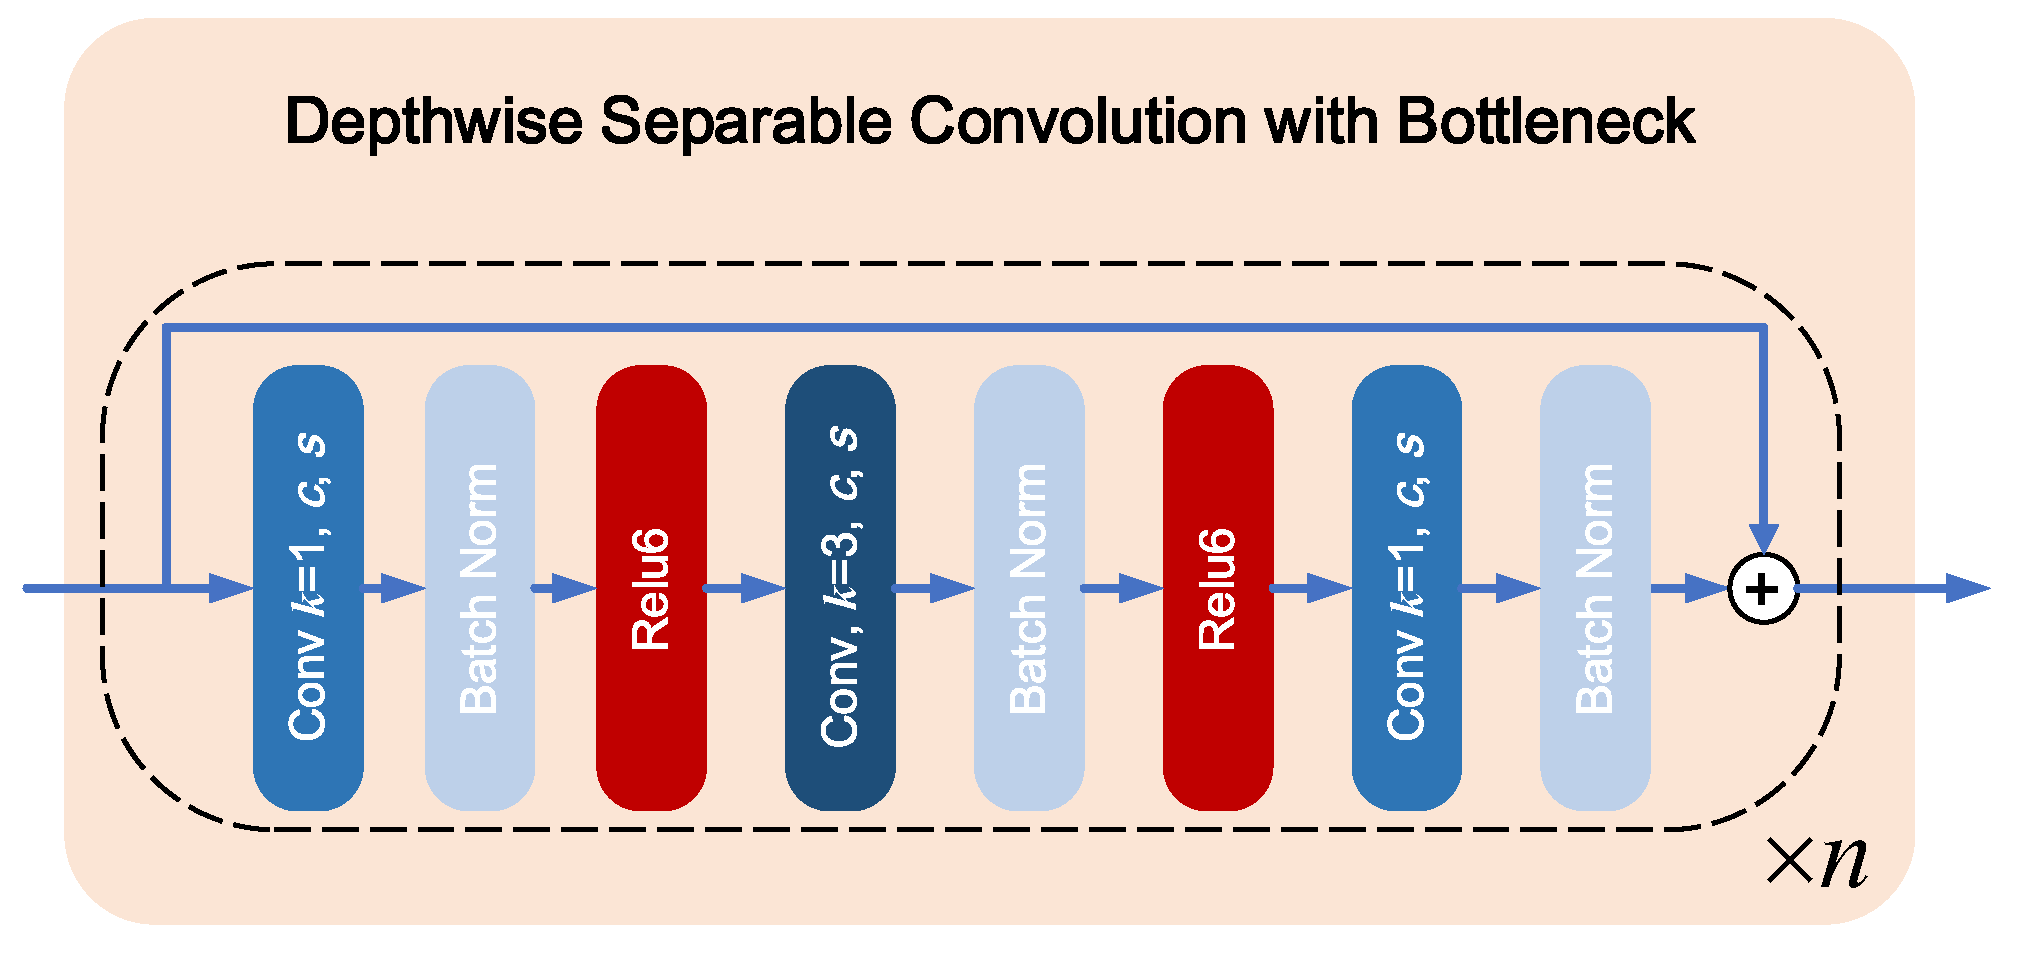
2.2.2. Simplified MobileNet

In the context of the mass production of LIBs, the voltage-abnormal cell detection method should be fast, efficient, and accurate to meet the needs of cell production. The number of cells to be tested is huge while the detection time and efficiency are strictly limited.
In general, tens of thousands of cells need to be tested to meet the requirements of the production quality with the time limitation. However, the model complexity and computational efficiency of traditional neural network architectures, such as naïve CNN and MLP neural network, are highly correlated with the scale and dimension of the data. It is hard to balance accuracy performance and time cost when dealing with large-scale and high-dimension data, such as a large batch of multi-source time series data.
In this paper, we utilize the advantage of the depthwise separable convolution [51] on computational efficiency and simplify the architecture of MobileNetV2, removing redundant structures for the voltage-abnormal cell detection task to achieve high efficiency and accurate feature extraction performance. Our simplified MobileNet is stacked with H depthwise separable convolutions with bottleneck, as shown in Figure 1. The embedded data X e m b e d are input into the simplified MobileNet which extracts the data dependency between different sources in X e m b e d with high-efficiency convolution kernels and transforms it into high-dimension hidden features X h i d . The details of the depthwise separable convolution with bottleneck (DSCB) are shown in Figure 4; it contains multiple convolution layers with different parameters to acquire the relations within the multi-source time series data at different scales.
As shown in Figure 4, ReLU6 and batch norm are the activation function and batch normalization layer [52]. There is also a residual connection [53] in the DSCB to improve the learning efficiency. Several parameters control the structure of the DSCB: the expansion factor q, number of output channels c, number of repeats n, and stride s. The configuration of the simplified MobileNet is shown in Table 1. Compared with the original MobileNetV2, the structure of the simplified MobileNet has been optimized with only a few DSCBs, our model can obtain considerable anomaly detection performance and computational efficiency.

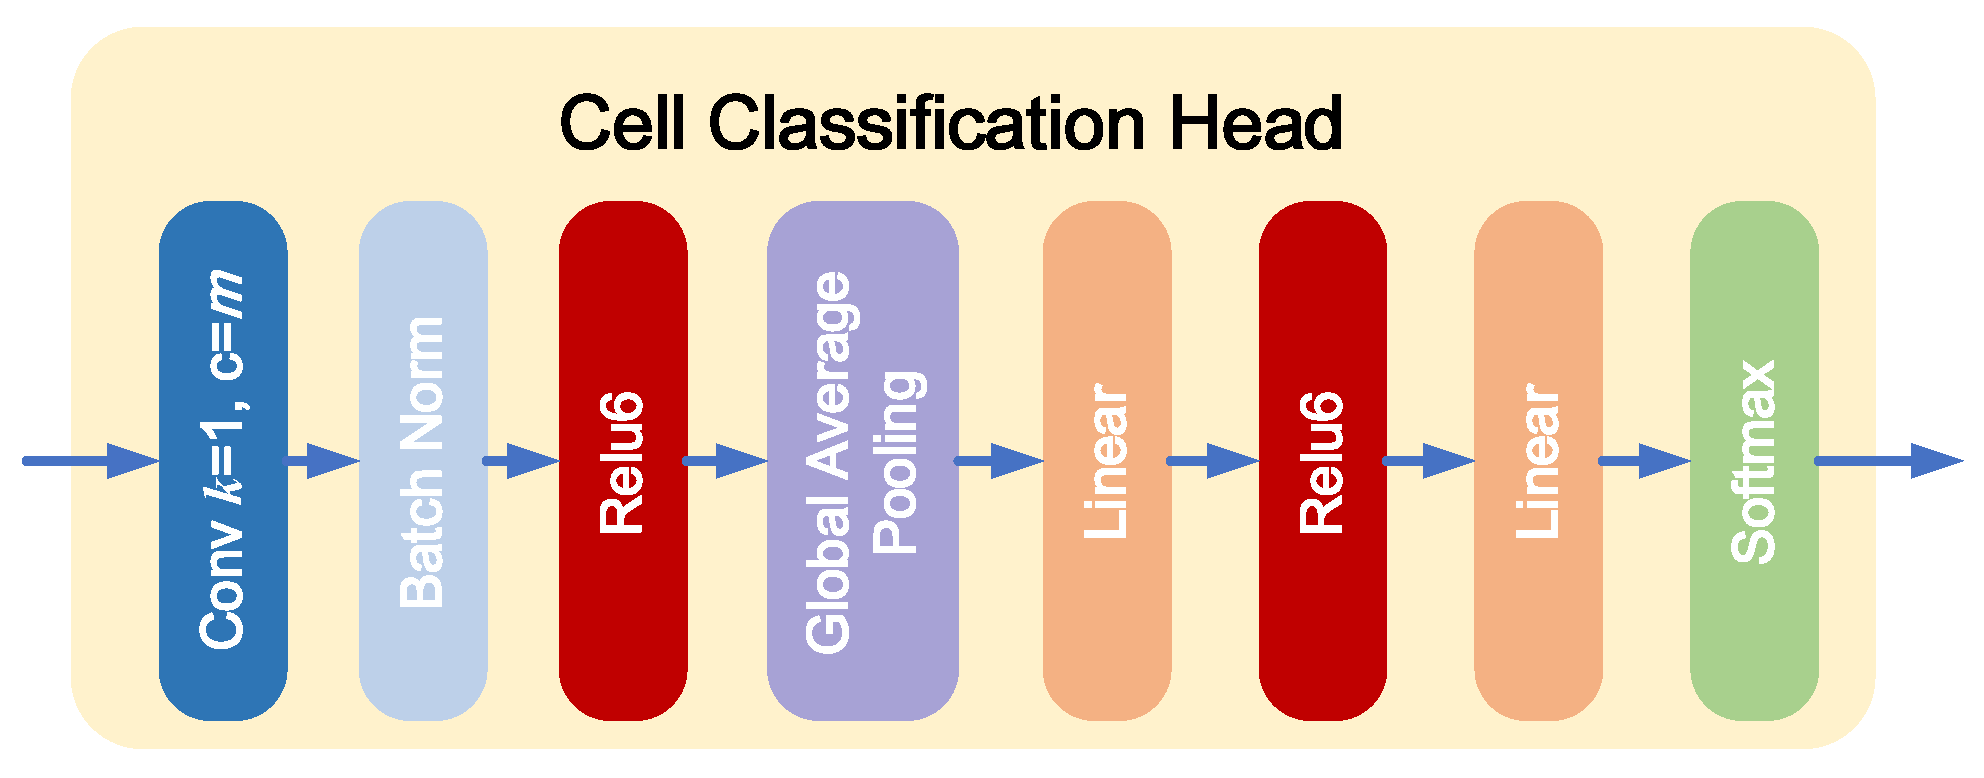
2.2.3. Cell Classification Head

To obtain the detection result from the hidden feature X h i d , we design a cell classification head (CCH) to compress and transform the input hidden feature X h i d into the decision space, i.e., normal or abnormal cell. The details of the cell classification head are shown in Figure 5. The cell classification head first utilizes the convolution layer with m channels to spread the information in X h i d along the channel dimension. Then, the global average pooling [54] is utilized to compress the information of each channel and reduce redundancy. Finally, an MLP with softmax layer, where the number of hidden units is d C C H , is used to map the feature into the detection result for the voltage-abnormal cell detection task, as shown in Figure 1.

2.3. Voltage-Abnormal Cell Detection

The voltage-abnormal cell detection model is trained with backpropagation. The loss function in this task is the cross-entropy loss function. The gradient of loss passes through the model from output to input and updates the model parameters. After the model is well trained, we deploy it to detect voltage-abnormal cells.
The cells are detected after being formed and tested. We integrate the different source data of a cell into a holistic data representation, i.e., multi-source time series data. Then, the multi-source time series data are embedded by the LSTM-based recurrent neural network to fuse the relationship information into the data. Next, the simplified MobileNet extracts different-scale features and relationships in the multi-source time series data with high computational efficiency and a simple architecture. Finally, the cell classification head compresses and transforms the hidden features to obtain the detection results. Our method can achieve considerable abnormal detection performance while maintaining a simple model structure and high computational efficiency to meet the needs of mass production of LIBs.

3. Experiments

Several experiments were conducted to compare the capacity of our method with other data-driven models and to investigate the influence of parameters on our model’s performance. In addition, ablation experiments were conducted to validate the effectiveness of the model components.

3.1. Data Preparation

The cell data for the experiments were collected from the formation and test processes of the real-world production of the type 18650 LIB. These charge and discharge stages are performed after the cells have been assembled to activate the electrochemical properties and test the function of the battery. Specifically, the assembled cells are placed in a specific charging cabinet with hundreds of channels and each channel contains several sensors, such as a current sensor, voltage sensor, and temperature sensor, to monitor and collect the status of cells during formation and testing periodically. The collected data of each cell are transferred to the data platform for storage via the network and organized as time series data for different applications.
For the voltage-abnormal cell detection task, we obtain three types of charging voltage curves from the process of constant current charge and constant current constant voltage charge, one type of discharge voltage curve from the process of constant current discharge, one type of charge current curve from the process of constant current constant voltage charge, and the corresponding voltage-abnormal label for 42,687 cells as the raw dataset. These data curves are obtained during the formation and test process, and can be used to indicate the electrochemical performance of cells [27]. First, the raw dataset is screened, aligned, and resampled to reduce the impact of the imbalanced dataset on model performance [27,55]. Then, we divide the resampled data into three datasets, which are train, validation, and test datasets. The details of the data allocation are shown in Table 2. Finally, we standardize all the data according to the train dataset.

3.2. Experimental Details

Several data-driven models are adopted as baseline models to compare with the proposed method on the voltage-abnormal cell detection task; these are recurrent neural network (RNN), LSTM [38], gated recurrent unit network (GRU) [56], MLP, fully convolutional network (FCN), ResNet, and Transformer. The number of layers in RNN, LSTM, and GRU is one. The model structures of MLP, FCN, and ResNet are adopted from [57]. The model structure of Transformer is adopted from [41]. Due to the voltage-abnormal cell detection task being a binary classification rather than a sequence-to-sequence problem, we use a Transformer with three encoder layers and a simple classification head as the decoder, which consists of a linear layer and a softmax layer.
Due to the voltage-abnormal cell detection task being a binary classification task, we adopt the accuracy, G-mean [58], F1 value, precision, recall [59], and average running time to evaluate the model performance. The details of the evaluation indices are shown in Table 3, where P is the number of positive samples, N is the number of negative samples, T P is the number of true positive predictions, T N is the number of true negative predictions, F P is the number of false positive predictions, and F N is the number of false negative predictions.
The default version of our model uses the number of LSTM layers L = 1 , the number of LSTM hidden units d r = 64 , the number of DSCB blocks H = 3 , the number of channels in the CCH m = 512 , and the number of CCH hidden units d C C H = 256 . All the experiments are performed on a desktop platform with Intel Core i7-7920HQ, 32 GB RAM, and GTX 1060 6 GB version. The Adam [60] optimizer with default batch size 128 was used to optimize and train the model. The parameters of Adam were β 1 = 0.9 , β 2 = 0.98 , and ε = 10 9 .

3.3. Results and Discussion

In this section, the results of several experiments, which compare the different data-driven models and the influence of parameters on model performance for voltage-abnormal cell detection, are analyzed and discussed to demonstrate the capacity and efficiency of the proposed method.

3.3.1. Comparison of Different Models for Voltage-Abnormal Cell Detection

In this section, our method is compared with several data-driven baseline models for the voltage-abnormal cell detection task. The experimental result is shown in Table 4. The best result of each evaluation index is bold. As shown in Table 4, our method achieved the best result on most of the evaluation indicators except for precision, which was 1.49% lower than ResNet. Among RNN, LSTM, and GRU, GRU achieves the best result, where the accuracy index is 2.92% lower than our method. For the precision index, the performance of RNN, LSTM, and GRU are close, which means these models can detect the voltage-abnormal cell accurately. For the recall index, there are gaps between RNN, LSTM, and GRU, which means the ability of these models to deal with hard samples is varied. Although the performance of ResNet is better than LSTM, the overall performance of the recurrent-based models is better than MLP, FCN, and ResNet. The performance of Transformer is close to our method and its accuracy is only 1.23% lower than our method, which is considerable. For the average running time, the fastest model is MLP, for which the running time is 0.0034 ms per sample. However, the accuracy of MLP is not satisfactory. Although our method is slower than Transformer, the average running time of our method can reach 0.0509 ms per sample, which is 95.68% and 91.75% lower than the average running times of ResNet and FCN, while achieving the best accuracy. Overall, our method can detect voltage-abnormal cells accurately and effectively, which can meet the needs of the mass production of LIBs.

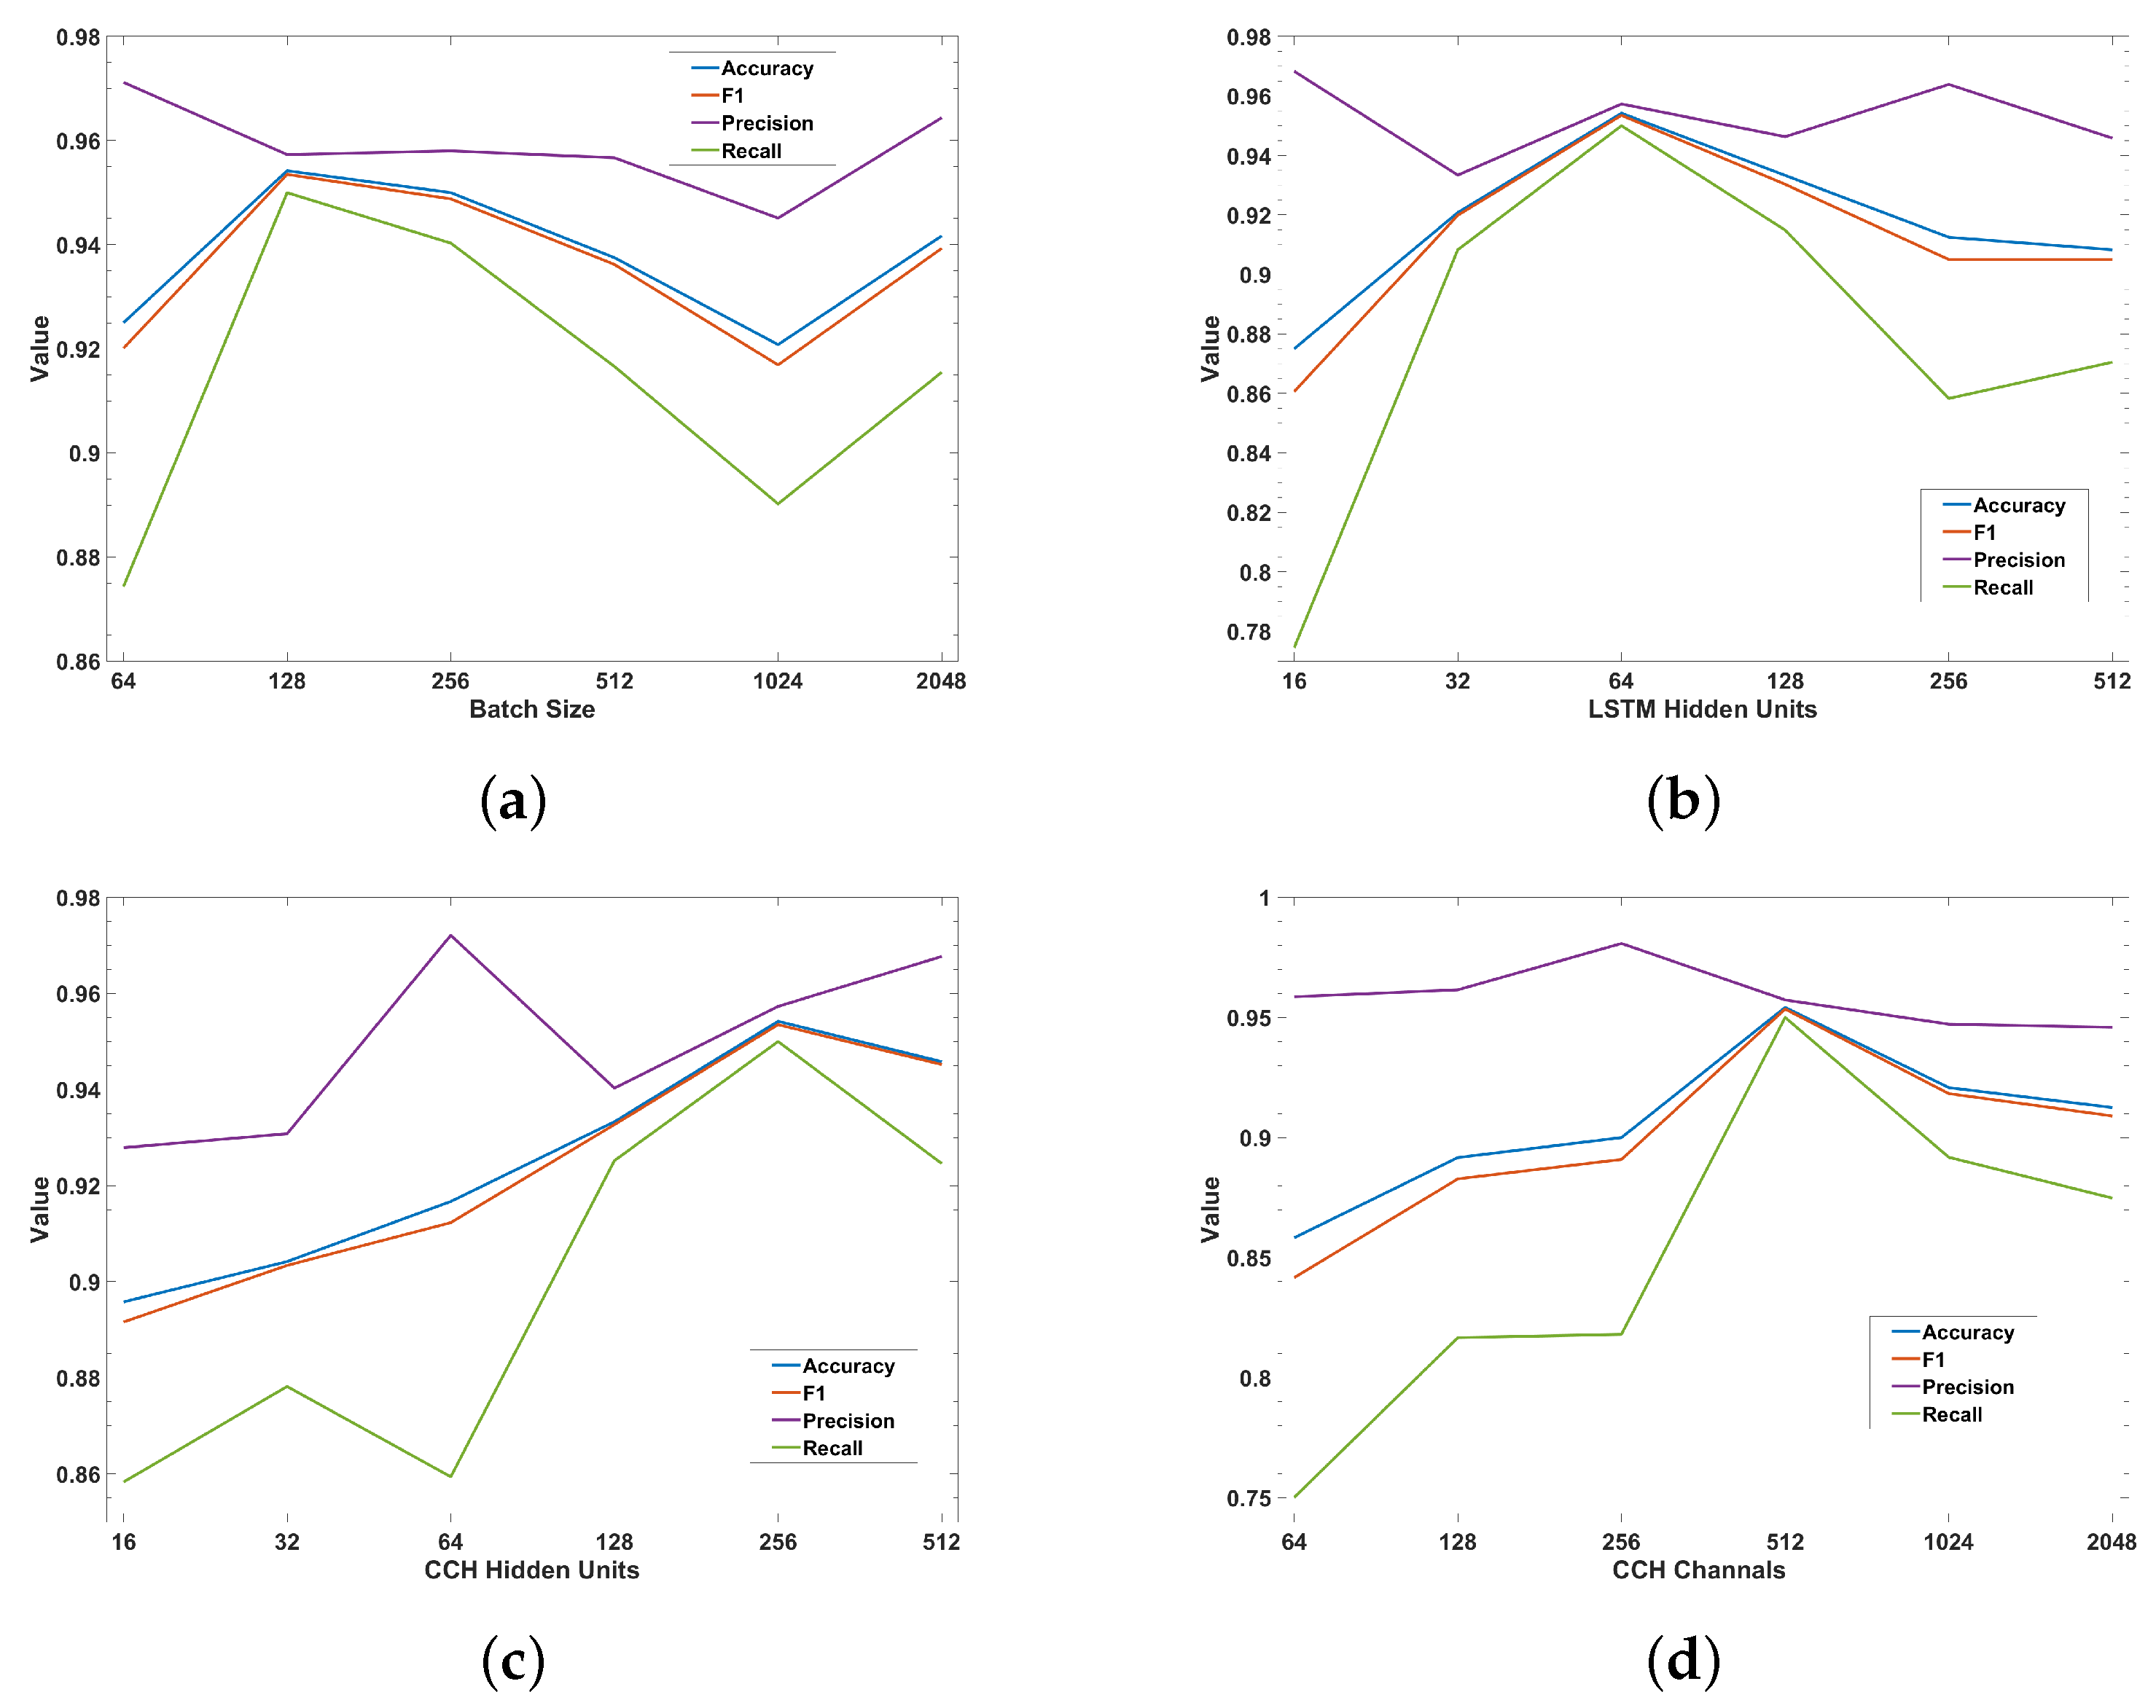
3.3.2. Influence of the Different Parameters on Voltage-Abnormal Cell Detection

In this section, we investigate the impact of different parameters of our method on the voltage-abnormal cell detection task: the batch size, the number of CCH hidden units, the number of LSTM hidden units, and the number of channels in the CCH. For each parameter experiment, we fixed the other parameters as default while changing a certain parameter and observing its impact on model capacity. The experimental results are shown in Figure 6. For the batch size, the influence of it on our model for the voltage-abnormal cell detection task is shown in Figure 6a, where the optimal result is achieved when the batch size is 128. The results of batch size 256 have a similar performance to the optimal batch size. The model performance declines as the batch size increases from 512 to 2048. For the number of LSTM hidden units d r , the influence of it on our model for the voltage-abnormal cell detection task is shown in Figure 6b, where the optimal result is achieved when d r = 64 . The model with small d r is unable to capture the data dependency in the multi-source time series data, while a large d r can cause overfitting and lead to model degradation. For the number of CCH hidden units d C C H , the influence of it on our model for the voltage-abnormal cell detection task is shown in Figure 6c, where the optimal result is achieved when d C C H = 256 . The model performance is undesirable when d C C H changes from 16 to 128, and there is an obvious performance variation at d C C H = 64 . This means a small d C C H can cause model underfitting and cannot obtain model convergence for the voltage-abnormal cell detection task. For the number of channels in the CCH m, the influence of it on our model for the voltage-abnormal cell detection task is shown in Figure 6d, where the optimal result is achieved when m = 512 . The performance at m = 1024 and 2048 is not significantly different from m = 512 . The model performance of m from 64 to 256 advances gradually, indicating that an increase in the number of channels in the CCH improves the capability of the CCH to classify abnormal cells and achieves better performance.

3.4. Ablation

In this section, we perform an ablation study on the proposed method to survey the influence of the model components for the voltage-abnormal cell detection task. Specifically, we replace or disable a certain component while keeping the other setup of our model as default to investigate the impact of different model components. The ablation results are shown in Table 5, where ‘Ours’ means our model with default setup, ‘w/o RDE’ means that we replaced the recurrent data embedding in our model with a simple MLP, ‘w/o MobileNet’ means that we replaced the simplified MobileNet in our model with a simple MLP. The experimental result of ‘w/o RDE’ demonstrates the effectiveness of recurrent data embedding for the voltage-abnormal cell detection task, where all of the accuracy, F1, and G-mean are significantly reduced compared to ‘Ours’. The result of ‘w/o MobileNet’ dropping a lot means the model capacity cannot handle hard samples with a simple MLP, which illustrates the validity of the simplified MobileNet in our model.

4. Conclusions

This paper proposed a voltage-abnormal cell detection method for mass production of LIBs based on a data-driven model with multi-source time series data. The proposed method can obtain voltage-abnormal cell detection results immediately after the cell is formed and tested without long waiting. Our method combines the different source data into a multi-source time series data representation and captures the data dependency between source data with the recurrent-based data embedding. In addition, we utilize the simplified MobileNet to extract the hidden features from the embedded multi-source time series data for better detection accuracy and speed to meet the requirements of LIB mass production. Experiments based on real-world production data show that the accuracy of our model on the voltage-abnormal cell detection task can reach 95.42%, which is better than other data-driven models. The average running time of the proposed method can reach 0.0509 ms per sample, which is a considerable improvement compared with ResNet and FCN. Overall, the proposed method can detect voltage-abnormal cells with high computational efficiency and accuracy without a detection time interval, thus improving the efficiency of LIB production and avoiding shipment delays.
In future work, we will attempt to further optimize the model structure to reduce the average running time and approach the average running time of MLP. In addition, we will study the voltage-abnormal cell detection method based on unsupervised or pre-training methods for better training performance. We will also consider using more advanced optimizers, such as Bayesian optimizers, to further optimize the parameters of the model and improve the model performance.

Author Contributions

X.W.: conceptualization, investigation, methodology, software, visualization, writing—original draft, writing—review and editing. J.H.: funding acquisition, project administration, supervision. F.H.: data curation, investigation, writing—review and editing. Z.L.: data curation, investigation. A.D.: data curation, investigation. R.L.: data curation, investigation. All authors have read and agreed to the published version of the manuscript.

Funding

This research was funded by the National Natural Science Foundation of China (General Program) under Grant 62373377.

Data Availability Statement

The data that have been used are confidential.

Acknowledgments

This work was supported in part by the High Performance Computing Center of Central South University.

Conflicts of Interest

The authors declare that they have no known competing financial interests or personal relationships that could have appeared to influence the work reported in this paper.

References

  1. Shen, N.; Wang, Y.; Peng, H.; Hou, Z. Renewable Energy Green Innovation, Fossil Energy Consumption, and Air Pollution—Spatial Empirical Analysis Based on China. Sustainability 2020, 12, 6397. [Google Scholar] [CrossRef]
  2. Fang, X.; Xie, L.; Li, X. Distributed localization in dynamic networks via complex laplacian. Automatica 2023, 151, 110915. [Google Scholar] [CrossRef]
  3. Coester, A.; Hofkes, M.W.; Papyrakis, E. Economic analysis of batteries: Impact on security of electricity supply and renewable energy expansion in Germany. Appl. Energy 2020, 275, 115364. [Google Scholar] [CrossRef]
  4. Fang, X.; Xie, L.; Li, X. Integrated relative-measurement-based network localization and formation maneuver control. IEEE Trans. Autom. Control. 2023, 69, 906–1913. [Google Scholar] [CrossRef]
  5. Schnell, J.; Nentwich, C.; Endres, F.; Kollenda, A.; Distel, F.; Knoche, T.; Reinhart, G. Data mining in lithium-ion battery cell production. J. Power Sources 2019, 413, 360–366. [Google Scholar] [CrossRef]
  6. Sarker, I.H. Machine Learning: Algorithms, Real-World Applications and Research Directions. SN Comput. Sci. 2021, 2, 160. [Google Scholar] [CrossRef] [PubMed]
  7. Mall, P.K.; Singh, P.K.; Yadav, D. GLCM Based Feature Extraction and Medical X-RAY Image Classification using Machine Learning Techniques. In Proceedings of the 2019 IEEE Conference on Information and Communication Technology, Jeju, Republic of Korea, 16–18 October 2019; pp. 1–6. [Google Scholar] [CrossRef]
  8. Peng, Y.; Guo, Y.; Hao, R.; Xu, C. Network traffic prediction with Attention-based Spatial–Temporal Graph Network. Comput. Netw. 2024, 243, 110296. [Google Scholar] [CrossRef]
  9. Xiao, R.; Zhang, Z.; Dan, Y.; Yang, Y.; Pan, Z.; Deng, J. Multifeature Extraction and Semi-Supervised Deep Learning Scheme for State Diagnosis of Converter Transformer. IEEE Trans. Instrum. Meas. 2022, 71, 1–12. [Google Scholar] [CrossRef]
  10. LeCun, Y.; Bengio, Y.; Hinton, G. Deep learning. Nature 2015, 521, 436–444. [Google Scholar] [CrossRef]
  11. Li, S.; Zhao, P. Big data driven vehicle battery management method: A novel cyber-physical system perspective. J. Energy Storage 2021, 33, 102064. [Google Scholar] [CrossRef]
  12. Haider, S.N.; Zhao, Q.; Li, X. Data driven battery anomaly detection based on shape based clustering for the data centers class. J. Energy Storage 2020, 29, 101479. [Google Scholar] [CrossRef]
  13. Duquesnoy, M.; Lombardo, T.; Chouchane, M.; Primo, E.N.; Franco, A.A. Data-driven assessment of electrode calendering process by combining experimental results, in silico mesostructures generation and machine learning. J. Power Sources 2020, 480, 229103. [Google Scholar] [CrossRef]
  14. Jin, H.; Gao, Z.; Zuo, Z.; Zhang, Z.; Wang, Y.; Zhang, A. A Combined Model-Based and Data-Driven Fault Diagnosis Scheme for Lithium-Ion Batteries. IEEE Trans. Ind. Electron. 2024, 71, 6274–6284. [Google Scholar] [CrossRef]
  15. Ma, M.; Wang, Y.; Duan, Q.; Wu, T.; Sun, J.; Wang, Q. Fault detection of the connection of lithium-ion power batteries in series for electric vehicles based on statistical analysis. Energy 2018, 164, 745–756. [Google Scholar] [CrossRef]
  16. Wu, T.; Cheng, K.; Kang, J.; Liu, R. Remaining Useful Life Prediction of Lithium-Ion Batteries Based on a Combination of Ensemble Empirical Mode Decomposition and Deep Belief Network–Long Short-Term Memory. Energy Technol. 2024, 12, 2301033. [Google Scholar] [CrossRef]
  17. Wang, L.Y.; Chen, W.; Lin, F.; Yin, G. Data-Driven Statistical Analysis and Diagnosis of Networked Battery Systems. IEEE Trans. Sustain. Energy 2017, 8, 1177–1186. [Google Scholar] [CrossRef]
  18. Li, D.; Zhang, Z.; Liu, P.; Wang, Z.; Zhang, L. Battery Fault Diagnosis for Electric Vehicles Based on Voltage Abnormality by Combining the Long Short-Term Memory Neural Network and the Equivalent Circuit Model. IEEE Trans. Power Electron. 2021, 36, 1303–1315. [Google Scholar] [CrossRef]
  19. Li, X.; Lyu, M.; Gao, X.; Yuan, C.; Zhen, D. An adaptive threshold method for multi-faults diagnosis of lithium-ion batteries based on electro-thermal model. Measurement 2023, 222, 113671. [Google Scholar] [CrossRef]
  20. Wang, Y.; Tian, J.; Chen, Z.; Liu, X. Model based insulation fault diagnosis for lithium-ion battery pack in electric vehicles. Measurement 2019, 131, 443–451. [Google Scholar] [CrossRef]
  21. Sun, T.; Zhu, H.; Xu, Y.; Jin, C.; Zhu, G.; Han, X.; Lai, X.; Zheng, Y. Internal short circuit fault diagnosis for the lithium-ion batteries with unknown parameters based on transfer learning optimized residual network by multi-label data processing. J. Clean. Prod. 2024, 444, 141224. [Google Scholar] [CrossRef]
  22. Tian, L.; Dong, C.; Mu, Y.; Yu, X.; Jia, H. Online lithium-ion battery intelligent perception for thermal fault detection and localization. Heliyon 2024, 10, e25298. [Google Scholar] [CrossRef]
  23. He, K.; Gkioxari, G.; Dollár, P.; Girshick, R. Mask R-CNN. In Proceedings of the 2017 IEEE International Conference on Computer Vision (ICCV), Venice, Italy, 22–29 October 2017; pp. 2980–2988. [Google Scholar] [CrossRef]
  24. Zhang, Y.; Tang, Q.; Zhang, Y.; Wang, J.; Stimming, U.; Lee, A.A. Identifying degradation patterns of lithium ion batteries from impedance spectroscopy using machine learning. Nat. Commun. 2020, 11, 1706. [Google Scholar] [CrossRef]
  25. He, W.; Williard, N.; Osterman, M.; Pecht, M. Prognostics of lithium-ion batteries based on Dempster–Shafer theory and the Bayesian Monte Carlo method. J. Power Sources 2011, 196, 10314–10321. [Google Scholar] [CrossRef]
  26. Zhang, L.; Wang, W.; Yu, H.; Zhang, Z.; Yang, X.; Liang, F.; Li, S.; Yang, S.; Liu, X. Remaining useful life and state of health prediction for lithium batteries based on differential thermal voltammetry and a deep learning model. iScience 2022, 25, 105638. [Google Scholar] [CrossRef]
  27. Liu, C.; Tan, J.; Wang, X. A data-driven decision-making optimization approach for inconsistent lithium-ion cell screening. J. Intell. Manuf. 2020, 31, 833–845. [Google Scholar] [CrossRef]
  28. How, D.N.T.; Hannan, M.A.; Hossain Lipu, M.S.; Ker, P.J. State of Charge Estimation for Lithium-Ion Batteries Using Model-Based and Data-Driven Methods: A Review. IEEE Access 2019, 7, 136116–136136. [Google Scholar] [CrossRef]
  29. Hu, Q.; Zhang, S.; Xie, Z.; Mi, J.; Wan, J. Noise model based v-support vector regression with its application to short-term wind speed forecasting. Neural Netw. 2014, 57, 1–11. [Google Scholar] [CrossRef]
  30. Davis, R.A.; Nielsen, M.S. Modeling of time series using random forests: Theoretical developments. arXiv 2020, arXiv:2008.02479. [Google Scholar] [CrossRef]
  31. Shiraishi, H.; Nakamura, T.; Shibuki, R. Time Series Quantile Regression Using Random Forests. J. Time Ser. Anal. 2024, 45, 639–659. [Google Scholar] [CrossRef]
  32. Silva, R.R.C.; Caminhas, W.M.; de Lima e Silva, P.C.; Guimarães, F.G. A C4.5 Fuzzy Decision Tree Method for Multivariate Time Series Forecasting. In Proceedings of the 2021 IEEE International Conference on Fuzzy Systems (FUZZ-IEEE), Luxembourg, 11–14 July 2021; pp. 1–6. [Google Scholar] [CrossRef]
  33. Qiu, X.; Zhang, L.; Nagaratnam Suganthan, P.; Amaratunga, G.A. Oblique random forest ensemble via Least Square Estimation for time series forecasting. Inf. Sci. 2017, 420, 249–262. [Google Scholar] [CrossRef]
  34. Ilic, I.; Gorgulu, B.; Cevik, M.; Baydogan, M.G. Explainable boosted linear regression for time series forecasting. Pattern Recognit. 2021, 120, 108144. [Google Scholar] [CrossRef]
  35. He, X. A Survey on Time Series Forecasting. In 3D Imaging—Multidimensional Signal Processing and Deep Learning; Patnaik, S., Kountchev, R., Tai, Y., Kountcheva, R., Eds.; Springer Nature Singapore: Singapore, 2023; Volume 348, pp. 13–23. [Google Scholar] [CrossRef]
  36. Wang, Z.; Ruan, S.; Huang, T.; Zhou, H.; Zhang, S.; Wang, Y.; Wang, L.; Huang, Z.; Liu, Y. A lightweight multi-layer perceptron for efficient multivariate time series forecasting. Knowl.-Based Syst. 2024, 288, 111463. [Google Scholar] [CrossRef]
  37. Zhang, X.; Zhong, C.; Zhang, J.; Wang, T.; Ng, W.W. Robust recurrent neural networks for time series forecasting. Neurocomputing 2023, 526, 143–157. [Google Scholar] [CrossRef]
  38. Sak, H.; Senior, A.W.; Beaufays, F. Long Short-Term Memory Based Recurrent Neural Network Architectures for Large Vocabulary Speech Recognition. arXiv 2014, arXiv:1402.1128. [Google Scholar]
  39. Bai, S.; Kolter, J.Z.; Koltun, V. An Empirical Evaluation of Generic Convolutional and Recurrent Networks for Sequence Modeling. arXiv 2018, arXiv:1803.01271. [Google Scholar]
  40. Phandoidaen, N.; Richter, S. Forecasting time series with encoder-decoder neural networks. arXiv 2020, arXiv:2009.08848. [Google Scholar] [CrossRef]
  41. Vaswani, A.; Shazeer, N.M.; Parmar, N.; Uszkoreit, J.; Jones, L.; Gomez, A.N.; Kaiser, L.; Polosukhin, I. Attention is All you Need. In Proceedings of the Neural Information Processing Systems, Long Beach, CA, USA, 4–9 December 2017. [Google Scholar]
  42. Zhou, H.; Zhang, S.; Peng, J.; Zhang, S.; Li, J.; Xiong, H.; Zhang, W. Informer: Beyond Efficient Transformer for Long Sequence Time-Series Forecasting. In Proceedings of the AAAI Conference on Artificial Intelligence, New York, NY, USA, 7–12 February 2020. [Google Scholar]
  43. Bloemheuvel, S.; van den Hoogen, J.; Jozinović, D.; Michelini, A.; Atzmueller, M. Graph neural networks for multivariate time series regression with application to seismic data. Int. J. Data Sci. Anal. 2022, 16, 317–332. [Google Scholar] [CrossRef]
  44. Chen, X. A novel transformer-based DL model enhanced by position-sensitive attention and gated hierarchical LSTM for aero-engine RUL prediction. Sci. Rep. 2024, 14, 10061. [Google Scholar] [CrossRef]
  45. Li, D.; Chen, D.; Shi, L.; Jin, B.; Goh, J.; Ng, S.K. MAD-GAN: Multivariate Anomaly Detection for Time Series Data with Generative Adversarial Networks. In Proceedings of the International Conference on Artificial Neural Networks, Munich, Germany, 17–19 September 2019. [Google Scholar]
  46. Kieu, T.; Yang, B.; Guo, C.; Jensen, C.S. Outlier Detection for Time Series with Recurrent Autoencoder Ensembles. In Proceedings of the Twenty-Eighth International Joint Conference on Artificial Intelligence, IJCAI-19. International Joint Conferences on Artificial Intelligence Organization, Macao, China, 10–16 August 2019; pp. 2725–2732. [Google Scholar] [CrossRef]
  47. Sandler, M.; Howard, A.; Zhu, M.; Zhmoginov, A.; Chen, L.C. MobileNetV2: Inverted Residuals and Linear Bottlenecks. In Proceedings of the 2018 IEEE/CVF Conference on Computer Vision and Pattern Recognition, Salt Lake City, UT, USA, 18–23 June 2018; pp. 4510–4520. [Google Scholar] [CrossRef]
  48. Wang, X.; He, J.; Shen, S.; Liu, Z. A cell screening method for lithium-ion battery grouping based on pre-trained data-driven model with multi-source time series data. J. Energy Storage 2024, 85, 110902. [Google Scholar] [CrossRef]
  49. Hochreiter, S.; Schmidhuber, J. Long Short-Term Memory. Neural Comput. 1997, 9, 1735–1780. [Google Scholar] [CrossRef] [PubMed]
  50. Graves, A. Long Short-Term Memory. In Supervised Sequence Labelling with Recurrent Neural Networks; Springer: Berlin/Heidelberg, Germany, 2012; pp. 37–45. [Google Scholar] [CrossRef]
  51. Howard, A.G.; Zhu, M.; Chen, B.; Kalenichenko, D.; Wang, W.; Weyand, T.; Andreetto, M.; Adam, H. MobileNets: Efficient Convolutional Neural Networks for Mobile Vision Applications. arXiv 2017, arXiv:1704.04861. [Google Scholar]
  52. Ioffe, S.; Szegedy, C. Batch Normalization: Accelerating Deep Network Training by Reducing Internal Covariate Shift. arXiv 2015, arXiv:1502.03167. [Google Scholar]
  53. He, K.; Zhang, X.; Ren, S.; Sun, J. Deep Residual Learning for Image Recognition. In Proceedings of the 2016 IEEE Conference on Computer Vision and Pattern Recognition (CVPR), Las Vegas, NV, USA, 27–30 June 2016; pp. 770–778. [Google Scholar] [CrossRef]
  54. Lin, M.; Chen, Q.; Yan, S. Network In Network. arXiv 2014, arXiv:1312.4400. [Google Scholar] [CrossRef]
  55. Liu, C.; Tan, J.; Shi, H.; Wang, X. Lithium-Ion Cell Screening with Convolutional Neural Networks Based on Two-Step Time-Series Clustering and Hybrid Resampling for Imbalanced Data. IEEE Access 2018, 6, 59001–59014. [Google Scholar] [CrossRef]
  56. Cho, K.; van Merriënboer, B.; Gulcehre, C.; Bahdanau, D.; Bougares, F.; Schwenk, H.; Bengio, Y. Learning Phrase Representations using RNN Encoder–Decoder for Statistical Machine Translation. In Proceedings of the 2014 Conference on Empirical Methods in Natural Language Processing (EMNLP), Doha, Qatar, 25–29 October 2014; pp. 1724–1734. [Google Scholar] [CrossRef]
  57. Wang, Z.; Yan, W.; Oates, T. Time series classification from scratch with deep neural networks: A strong baseline. In Proceedings of the 2017 International Joint Conference on Neural Networks (IJCNN), Anchorage, AL, USA, 14–19 May 2017; pp. 1578–1585. [Google Scholar] [CrossRef]
  58. Branco, P.; Torgo, L.; Ribeiro, R. A Survey of Predictive Modelling under Imbalanced Distributions. arXiv 2015, arXiv:1505.01658. [Google Scholar]
  59. Grandini, M.; Bagli, E.; Visani, G. Metrics for Multi-Class Classification: An Overview. arXiv 2020, arXiv:2008.05756. [Google Scholar]
  60. Kingma, D.P.; Ba, J. Adam: A Method for Stochastic Optimization. arXiv 2014, arXiv:1412.6980. [Google Scholar]
Figure 1. The architecture of the proposed method.
Energies 17 03472 g001
Figure 2. The details of the multi-source time series data representation.
Energies 17 03472 g002
Figure 3. The structure of LSTM cell.
Energies 17 03472 g003
Figure 4. The structure of the depthwise separable convolution with bottleneck.
Energies 17 03472 g004
Figure 5. The structure of the cell classification head.
Energies 17 03472 g005
Figure 6. The influence of the parameters on the voltage-abnormal cell detection task. (a) The influence of the batch size; (b) the influence of the number of LSTM hidden units; (c) the influence of the number of CCH hidden units; (d) the influence of the number of channels in the CCH.
Energies 17 03472 g006
Table 1. The configuration details of the simplified MobileNet.
Block Index 1qcns
111611
266422
3625611
1 The sequence number of H DSCBs in the simplified MobileNet.
Table 2. The details of the dataset allocation.
DatasetRatio of Normal CellRatio of Abnormal CellNumber of Samples
Train50%50%2400
Validation50%50%240
Test50%50%240
Total50%50%2880
Table 3. The details of the evaluation indices.
Evaluation IndexFormulationRangeBest Value
Accuracy T P + T N P + N [ 0 , 1 ] 1.0
Precision T P T P + F P [ 0 , 1 ] 1.0
Recall T P T P + F N [ 0 , 1 ] 1.0
F1 2 × P r e c i s i o n × R e c a l l P r e c i s i o n + R e c a l l [ 0 , 1 ] 1.0
G-mean P r e c i s i o n × R e c a l l [ 0 , 1 ] 1.0
Table 4. The experimental result of different data-driven models for voltage-abnormal cell detection.
ModelEvaluation Index
Accuracy F1 G-Mean Precision Recall Time (ms)
MLP0.84580.82750.83420.94650.73550.0034
RNN0.87920.86820.87110.94130.80670.0036
LSTM0.90420.89710.89820.94240.85600.0056
GRU0.92500.92270.92320.95570.89020.0038
FCN0.88750.88200.88440.92870.84500.6171
ResNet0.91250.90230.90350.97220.84181.1777
Transformer0.94170.94030.94030.95720.92460.0207
Ours0.95420.95350.95360.95730.95000.0509
Table 5. The experimental results of ablation study.
Modelw/o RDEw/o MobileNetOurs
ComponentRecurrent Data Embedding×
Simplified MobileNet ×
Evaluation IndexAccuracy0.91250.89580.9542
F10.90950.88790.9535
G-mean0.91020.89070.9536
Precision0.94660.96170.9573
Recall0.87510.82540.9500
Disclaimer/Publisher’s Note: The statements, opinions and data contained in all publications are solely those of the individual author(s) and contributor(s) and not of MDPI and/or the editor(s). MDPI and/or the editor(s) disclaim responsibility for any injury to people or property resulting from any ideas, methods, instructions or products referred to in the content.

