Article

Gas Free Dissipation Characteristics Analysis and Safety Repair Time Determination of Buried Pipeline Leakage Based on CFD

1
Key Laboratory for Enhanced Oil & Gas Recovery of the Ministry of Education, Northeast Petroleum University, Daqing 163318, China
2
Daqing Petrochemical Engineering Co., Ltd., Daqing 163711, China
*
Author to whom correspondence should be addressed.
Energies 2024, 17(14), 3507; https://doi.org/10.3390/en17143507
Submission received: 7 June 2024 / Revised: 12 July 2024 / Accepted: 13 July 2024 / Published: 17 July 2024
(This article belongs to the Section H: Geo-Energy)

Abstract

:
Buried pipelines, as the most common method of natural gas transportation, are prone to pipeline leakage accidents and are difficult to detect due to their harsh and concealed environment. This paper focused on the problem regarding the free dissipation of residual gas in buried gas pipelines and soil after closing the gas supply end valve after a period of leakage by numerical simulation. A multiple non-linear regression model was established based on the least squares method and multiple regression theory, and MATLAB 2016b mathematical calculation software was used to solve the problem. The research results indicated that compared to the gas leakage diffusion stage, the pressure and velocity distribution during the free dissipation stage were significantly reduced. The increase in leakage time, pipeline pressure, leakage size, and pipeline burial depth led to a large accumulation of natural gas, which increased the concentration and distribution range of gas on the same free dissipation stage monitoring line. A prediction model for natural gas concentration in the free dissipation stage was established with an average error of 7.88%. A calculation model for the safety repair time of buried gas pipeline leakage accidents was further derived to determine the safety repair time of leakage accidents.

1. Introduction

Currently, the energy use structure of countries around the world is still dominated by fossil energy like oil and natural gas. The dependence of human society on fossil energy is contradictory to the decreasing fossil energy reserves year by year. However, the continuous exploration of submarine natural gas hydrate reserves and breakthroughs in extraction technology have restored confidence in the entire society [1,2]. Meanwhile, natural gas has greater potential for huge reserves and cleaner burning than other fossil energy sources. In the process of exploring new energy paths and gradually transforming the energy structure in the future, natural gas will inevitably become the “main force” of fossil energy in the modern era.
Pipelines have always been the primary mode of oil and gas transportation. Compared with oil, natural gas has advantages such as good flowability and high compressibility, making it better suited for pipeline transportation [3,4,5]. Over the last several years, the coverage area by the natural gas pipeline network has been increasing year by year, gradually moving from large and medium-sized cities to small and medium-sized towns. The laying of natural gas pipelines into households has to some extent improved the quality of residents’ life, but accidents caused by explosions and combustion after natural gas pipeline leaks are common, bringing a painful cost to natural gas users [6,7,8]. In August 2004, a natural gas pipeline leak and explosion accident in Asuncion, Paraguay directly resulted in 250 deaths [9]. On 31 July 2014, in the Qianzhen District of Kaohsiung City, Taiwan, an natural gas leak from a pipeline occurred, triggering successive explosions. This event resulted in 32 fatalities and 321 injuries [10]. Incidents of natural gas pipeline leakage and explosion continuously serve as critical reminders to the government, society, natural gas companies, and natural gas users.
Natural gas transmission pipelines are mainly divided into above-ground pipelines, pipelines in comprehensive pipe galleries, and buried pipelines [11,12]. A lot of research has been conducted on natural gas pipeline leaks, and a series of positive results have been achieved. In terms of leakage from above-ground pipelines, Olvera and Choudhuri [13] conducted a study on the diffusion of natural gas when obstructed by obstacles through numerical simulations, analyzing the influence of factors like leakage direction and obstacles on the gas diffusion process [13]. Barros et al. carried out numerical simulations by altering the direction of natural gas jets in obstructed spaces, analyzing the influence of the orientation of the natural gas jet direction for the size of the leaked gas masses [14]. Mishra conducted numerical simulations of natural gas leaks on flat terrain, proposed a model for predicting gas diffusion distance based on the results, and validated it based on on-site investigation results of leakage accidents [15]. Dasgotra et al. analyzed the range of influence of natural gas clouds based on the simulation results of natural gas leaks and provided relevant suggestions for the setting scheme of detection devices [16]. Agarwal et al. conducted numerical simulations on the diffusion process of natural gas in an unobstructed space and determined the operational safety distances for emergency response based on the distribution of the gas plumes [17].
The integration of pipeline corridors is a common feature in large and medium-sized cities, typically accommodating natural gas pipelines as well as other infrastructure for supply and distribution, such as electricity and sewage. Lu et al. [18] conducted numerical simulations on the flow of gas within a comprehensive pipeline gallery following a natural gas pipeline leak, investigating the effects of leak position, leak size, pipeline operating pressure, leak hole orientation, and fan arrangement on the gas diffusion process [18]. Wang et al. analyzed the occurrence and dispersion of natural gas pipeline leakage accidents in the pipeline gallery through numerical simulation and proposed a ventilation frequency scheme for each leakage aperture and ventilation condition, providing a reference for the operational safety plan for the pipeline gallery [19]. Bu et al. compared the effects of natural and mechanical ventilation on the distribution of natural gas within pipe galleries through numerical simulations, proposed a predictive model for the natural gas diffusion distance under conditions of natural ventilation, and provided a ventilation frequency reference to ensure safe operation in pipe galleries [20]. Yuan et al. developed a method to invert gas leakage rates and predict the distribution for leaking natural gas based on numerical simulation results and the integrated Kalman filter method [21]. Wu et al. used numerical simulation results and Bayesian inference methods to obtain a model that can estimate the distribution of leaked gas in the pipeline gallery [22]. Wang et al. utilized computational fluid dynamics to investigate the fire propagation characteristics of leaks in natural gas pipelines in a comprehensive pipeline gallery under diverse fire scenarios and obtained the distribution of temperature and visibility inside the comprehensive pipeline gallery [23]. Zhang et al. compared the explosion processes of pure methane gas and methane–hydrogen mixtures within a comprehensive pipeline gallery through numerical simulation, analyzing the risks associated with explosion accidents [24].
Addressing the issue of leakage in buried natural gas pipelines, Wang et al. conducted a comprehensive study using numerical simulations to investigate the leakage size, leakage pressure, and soil properties of underground pipelines, analyzing the distribution of gas in the soil under diverse influencing factors [25]. Wakoh and Hirano proposed an equation for predicting natural gas leakage concentration and validated it by conducting experimental concentration measurements using propane. The accuracy of the prediction equation was confirmed for different leakage locations, leakage durations, and leak volume [26]. Bonnaud et al. conducted small-scale experiments on buried natural gas pipeline leaks to analyze the effects of conditions such as soil water freezing and gas-induced changes in porosity on the distribution and diffusion process of natural gas in the soil [27]. Chamindu et al. carried out wind tunnel experiments on underground gas distribution pipeline leakage to investigate the effects of soil moisture and anisotropic properties on the diffusion process of natural gas leakage at diverse saturated soil textures and atmospheric conditions [28]. Bezaatpour et al. considered the gravitational impact of the upper layer of soil overlaying the lower layer of soil and provided different characteristics, such as porosity and water content, for layered soil [29]. They also investigated the impact of changes in inertial resistance caused by changes in the properties of the soil on the distribution of natural gas components and provided leakage conditions that can ignore layering phenomena [29]. Ebrahimi-Moghadam et al. subsequently proposed two-dimensional and three-dimensional accurate calculation models for leaks of underground medium-pressure gas pipelines above ground and under certain soil properties, and the reasons for calculation errors caused by one-dimensional and two-dimensional models for buried pipelines were analyzed as well as the suitability of three-dimensional calculation models [30,31]. Bu et al. considered the characteristics of the soil and ground characteristic in the buried environment of pipelines, divided the ground into hardened and unhardened ground, defined different soil characteristics using characteristic parameters such as soil resistance, saturation, and porosity, and established natural gas leakage rate calculation models and natural gas invasion distance calculation models under different buried environment conditions of pipelines, forming a systematic calculation method [32,33]. Zhu et al. [34] carried out a full-size buried hydrogen-doped natural gas pipeline leakage experiment to investigate the effects of the hydrogen-doped gas ratio, pipeline pressure, and direction of the leakage hole on the diffusion distribution of the leaked gas in the soil [34].
Currently, buried pipelines are the primary means of transporting natural gas. Compared to natural gas pipelines above ground and in comprehensive pipe galleries, buried pipelines are buried underground and come into contact with moisture and air in the soil, increasing the likelihood of incidents involving leakage and the concealment and danger of accidents. Meanwhile, the obstruction and accumulation effect of soil on leaked gases prevent natural gas from quickly dissipating into soil pores, prolonging the dangerous time of accidents and increasing safety hazards during pipeline excavation and maintenance. Underground gas pipeline leakage can be categorized into two stages: the stage of leakage diffusion and the stage of the free dissipation of residual gas in the pipeline and soil after closing the supply end valve, as shown in Figure 1. Although there is extensive research on the diffusion stage of natural gas in soil, there has been limited investigation into the free dissipation process of residual natural gas in both the pipeline and soil after the discovery and subsequent closure of the supply end valve following a leakage accident. The free dissipation of residual gases in soil and the diffusion of gases during the leakage stage are both dangerous hazards of pipeline leakage accidents. Understanding the free dissipation characteristics of residual gases in buried natural gas pipelines and soil after valve closure is of paramount importance for ensuring the safety of subsequent pipeline leakage accident maintenance.
The study investigates the free dissipation process of leaked natural gas in an underground gas pipeline after a certain period of time by using the numerical simulation method when the supply end valve is closed. Based on the pressure, dissipation velocity magnitude, streamline distribution, and gas concentration in the soil during the free dissipation stage, we analyzed the distribution characteristics of gas during the free dissipation stage. According to numerical simulation results, we examined the natural gas concentration in the soil during the free dissipation stage. Based on the least square method and multiple regression theory, a multivariate non-linear regression model was established by MATLAB mathematics. The model can predict the concentration of natural gas in the soil in the free dissipation stage and further determine the safe repair time of the buried gas pipeline leakage accident. This study aims to offer a new method for determining the safety repair time for underground gas pipeline leakage accidents and provides suggestions for ensuring the stable operation and daily maintenance of gas pipelines.

2. Research Methods

2.1. Physical Model

This paper mainly focused on the problem of gas free dissipation after discovering leaks in buried gas pipelines and closing the supply end valve. Upon closure of the supply end valve, the upstream natural gas supply to the pipeline ceases. This stage is characterized by the leakage of residual gas from the pipeline and the free dissipation of residual gas into the surrounding soil. In real scenarios, following a leakage in an underground natural gas pipeline, the diffusion of gas in the soil is influenced by resistance in the soil along the x, y, and z directions [30,31]. Therefore, a physical model in three dimensions was established. Unlike previous studies, this study focused on analyzing the free dissipation process of the residual gas once the valve at the upstream supply end has been closed for a period of time after the gas leakage. This process primarily involved the free dissipation of gas into the soil after it leaks into the ground. The diffusion of gas into the soil beneath the pipeline needed to be considered. Therefore, when modeling, the soil area 1 m below the pipeline was considered, and the soil area above the pipeline was the burial depth H, which will change with the pipeline burial depth data of different cases. According to existing research, the impact of the pipeline diameter regarding the phenomenon of the diffusion process of natural gas leakage was relatively small. Taking into account the overall size of the pipeline diameter, it was set to 150 mm. In order to enhance the research accuracy, considering pipeline modeling, a cylindrical soil physical model with a base diameter of 10 m was established. A three-dimensional Cartesian coordinate system was established with the center of the leakage point as the origin, and the specific physical model is shown in Figure 2.

2.2. Mathematical Model

2.2.1. Flow Governing Equation

Natural gas leaks from underground pipelines follow the basic conservation equations in terms of seepage and diffusion. Unlike open-air pipelines above ground, natural gas undergoes seepage and diffusion in soil porous media after leakage from buried pipelines. The characteristics of soil porous media, such as its porosity, inertial and viscous resistance coefficient, have a serious impact on the rate of natural gas leakage and diffusion in the soil during the leakage process [32]. Therefore, the gas diffusion control equation needs to consider soil porosity, and the soil resistance source term should be incorporated into the motion equation [25].
(1)
Continuity equation
The system can exchange active power and heat with the outside world, but there is no transfer of matter. The control volume can exchange active power and heat with the outside world as well as transfer matter. While considering soil porosity, the mass conservation law applicable to the system is rewritten as a continuity equation applicable to the control volume. The flow representation in the Eulerian coordinate system is expressed as follows: [25,35,36].
ϕ ρ t + x i ρ u i = 0
where ϕ is the porosity of soil, ρ is gas density (kg/m3), and u i is velocity (m/s).
(2)
Equation of motion
When considering gas flow in soil, it is imperative to account for the resistance terms arising from both viscous and inertial forces exerted by the soil [25,35,36].
ϕ ρ u i t + x j ϕ ρ u i u j = ϕ p x i + ϕ τ i j ¯ ¯ x j + ϕ ρ g i + S i
where τ ¯ ¯ i j is a second-order stress tensor (Pa), g i is gravitational acceleration (m/s2), and S i is the resistance source term of the soil. Due to the fact that the pressure in the gas state equation is absolute pressure (Pa), it remains consistent here.
Viscosity and inertial resistance are the source terms of soil resistance. This study considers soil as an isotropic porous medium, which means that resistance is constant throughout the soil at all points. The soil resistance source term consists of viscous resistance and inertial resistance. The calculation method is as follows [25,37].
S i = 1 α μ u i + C 2 1 2 ρ u u i
1 α = 150 D p 2 1 ϕ 2 ϕ 3
C 2 = 3.5 D p 1 ϕ ϕ 3
where μ is viscosity (kg/ms), D p is the soil mean diameter (mm), 1 / α is the soil viscous resistance coefficient (1/m2), and C 2 is the soil inertial resistance coefficient (1/m).
(3)
Component transport equation
Due to the involvement of two or more gas flows in natural gas pipeline leaks, it is necessary to consider component transport models [25,37].
t ϕ ρ J m + x j ρ u j J m = x j ρ D J m x j
where J m is the mass fraction of m, and D is the dissipation coefficient, m2/s.
(4)
PVT equation
The medium-pressure pipelines have lower pressure and can be considered as an adiabatic flow of ideal gases [38,39]. Unlike liquids, gases have stronger compressibility. According to the standard of GB 50028-2006 [40], when the operating pressure of the underground natural gas pipeline is 0.4 MPa, the gas compressibility factor is assumed to be 1.
p υ = R T
where υ is the gas specific volume (m3/kg), R is the gas constant of natural gas (J/kg·K), and T is temperature (K).

2.2.2. Turbulence Equation

The turbulence equation used in this study is the κ - ε standard model [37,41]. The κ - ε standard model is the most commonly used model for predicting the effects of turbulence, and it has the characteristics of robustness, economy, and accurate results for a consistent amount of flows. The κ - ε standard model utilizes two transport equations to describe the characteristics of turbulence, including turbulent kinetic energy κ and turbulent dissipation rate ε [42,43,44]. It is worth noting that during the process of natural gas leakage from pipelines into soil, the flow of gas inside the pipeline is turbulent flow, which is calculated using the turbulence equation. Once gas enters the soil, there is a diffusion and seepage of gas in the soil without the need for turbulence models. Therefore, turbulence models are only used within pipelines.
t ρ κ + x i ρ κ u i = x j μ + μ t σ κ κ x j + G κ + G b Y M ρ ε + S κ
t ρ ε + x i ρ ε u i = x j μ + μ t σ ε ε x j + C 1 ε ε κ G κ C 2 ε ρ ε 2 κ + S ε
where κ is the turbulence kinetic energy (J/kg), ε is the energy dissipation rate (J/kgs), G κ is the laminar velocity gradient produced energy, G b is the buoyancy produced energy, Y M is the fluctuation, μ t is the eddy viscosity, S κ is the energy source term, and S ε is the dissipation rate source term. C 1 ε , C 2 ε , σ κ , and σ ε are constant with values of 1.44, 1.92, 1.0, and 1.3, respectively [19,45].

2.3. Boundary Conditions

First, we will define the leakage diffusion stage and free dissipation stage of underground gas pipeline leakage accidents. The leakage diffusion stage is the phase following the leakage of an underground gas pipeline that remains undetected in a timely manner, during which gas continues to leak from the upstream supply end valve. Following the discovery of a leak in an underground gas pipeline, the free dissipation stage occurs when the upstream supply end valve is closed. It involves the free dissipation of residual gas in both the pipeline and soil. To accurately characterize the complete process of underground gas pipeline leakage diffusion, the overall accident is divided into three stages, and the corresponding boundary conditions are determined based on the characteristics of each stage:
(1)
Stable operation stage: The phase before the leakage of the underground gas pipeline, during which the pipeline is filled with natural gas at the operating pressure of the pipeline. The soil porous medium pores are filled with air at atmospheric pressure. This stage serves as the initial condition for the gas leakage diffusion stage.
(2)
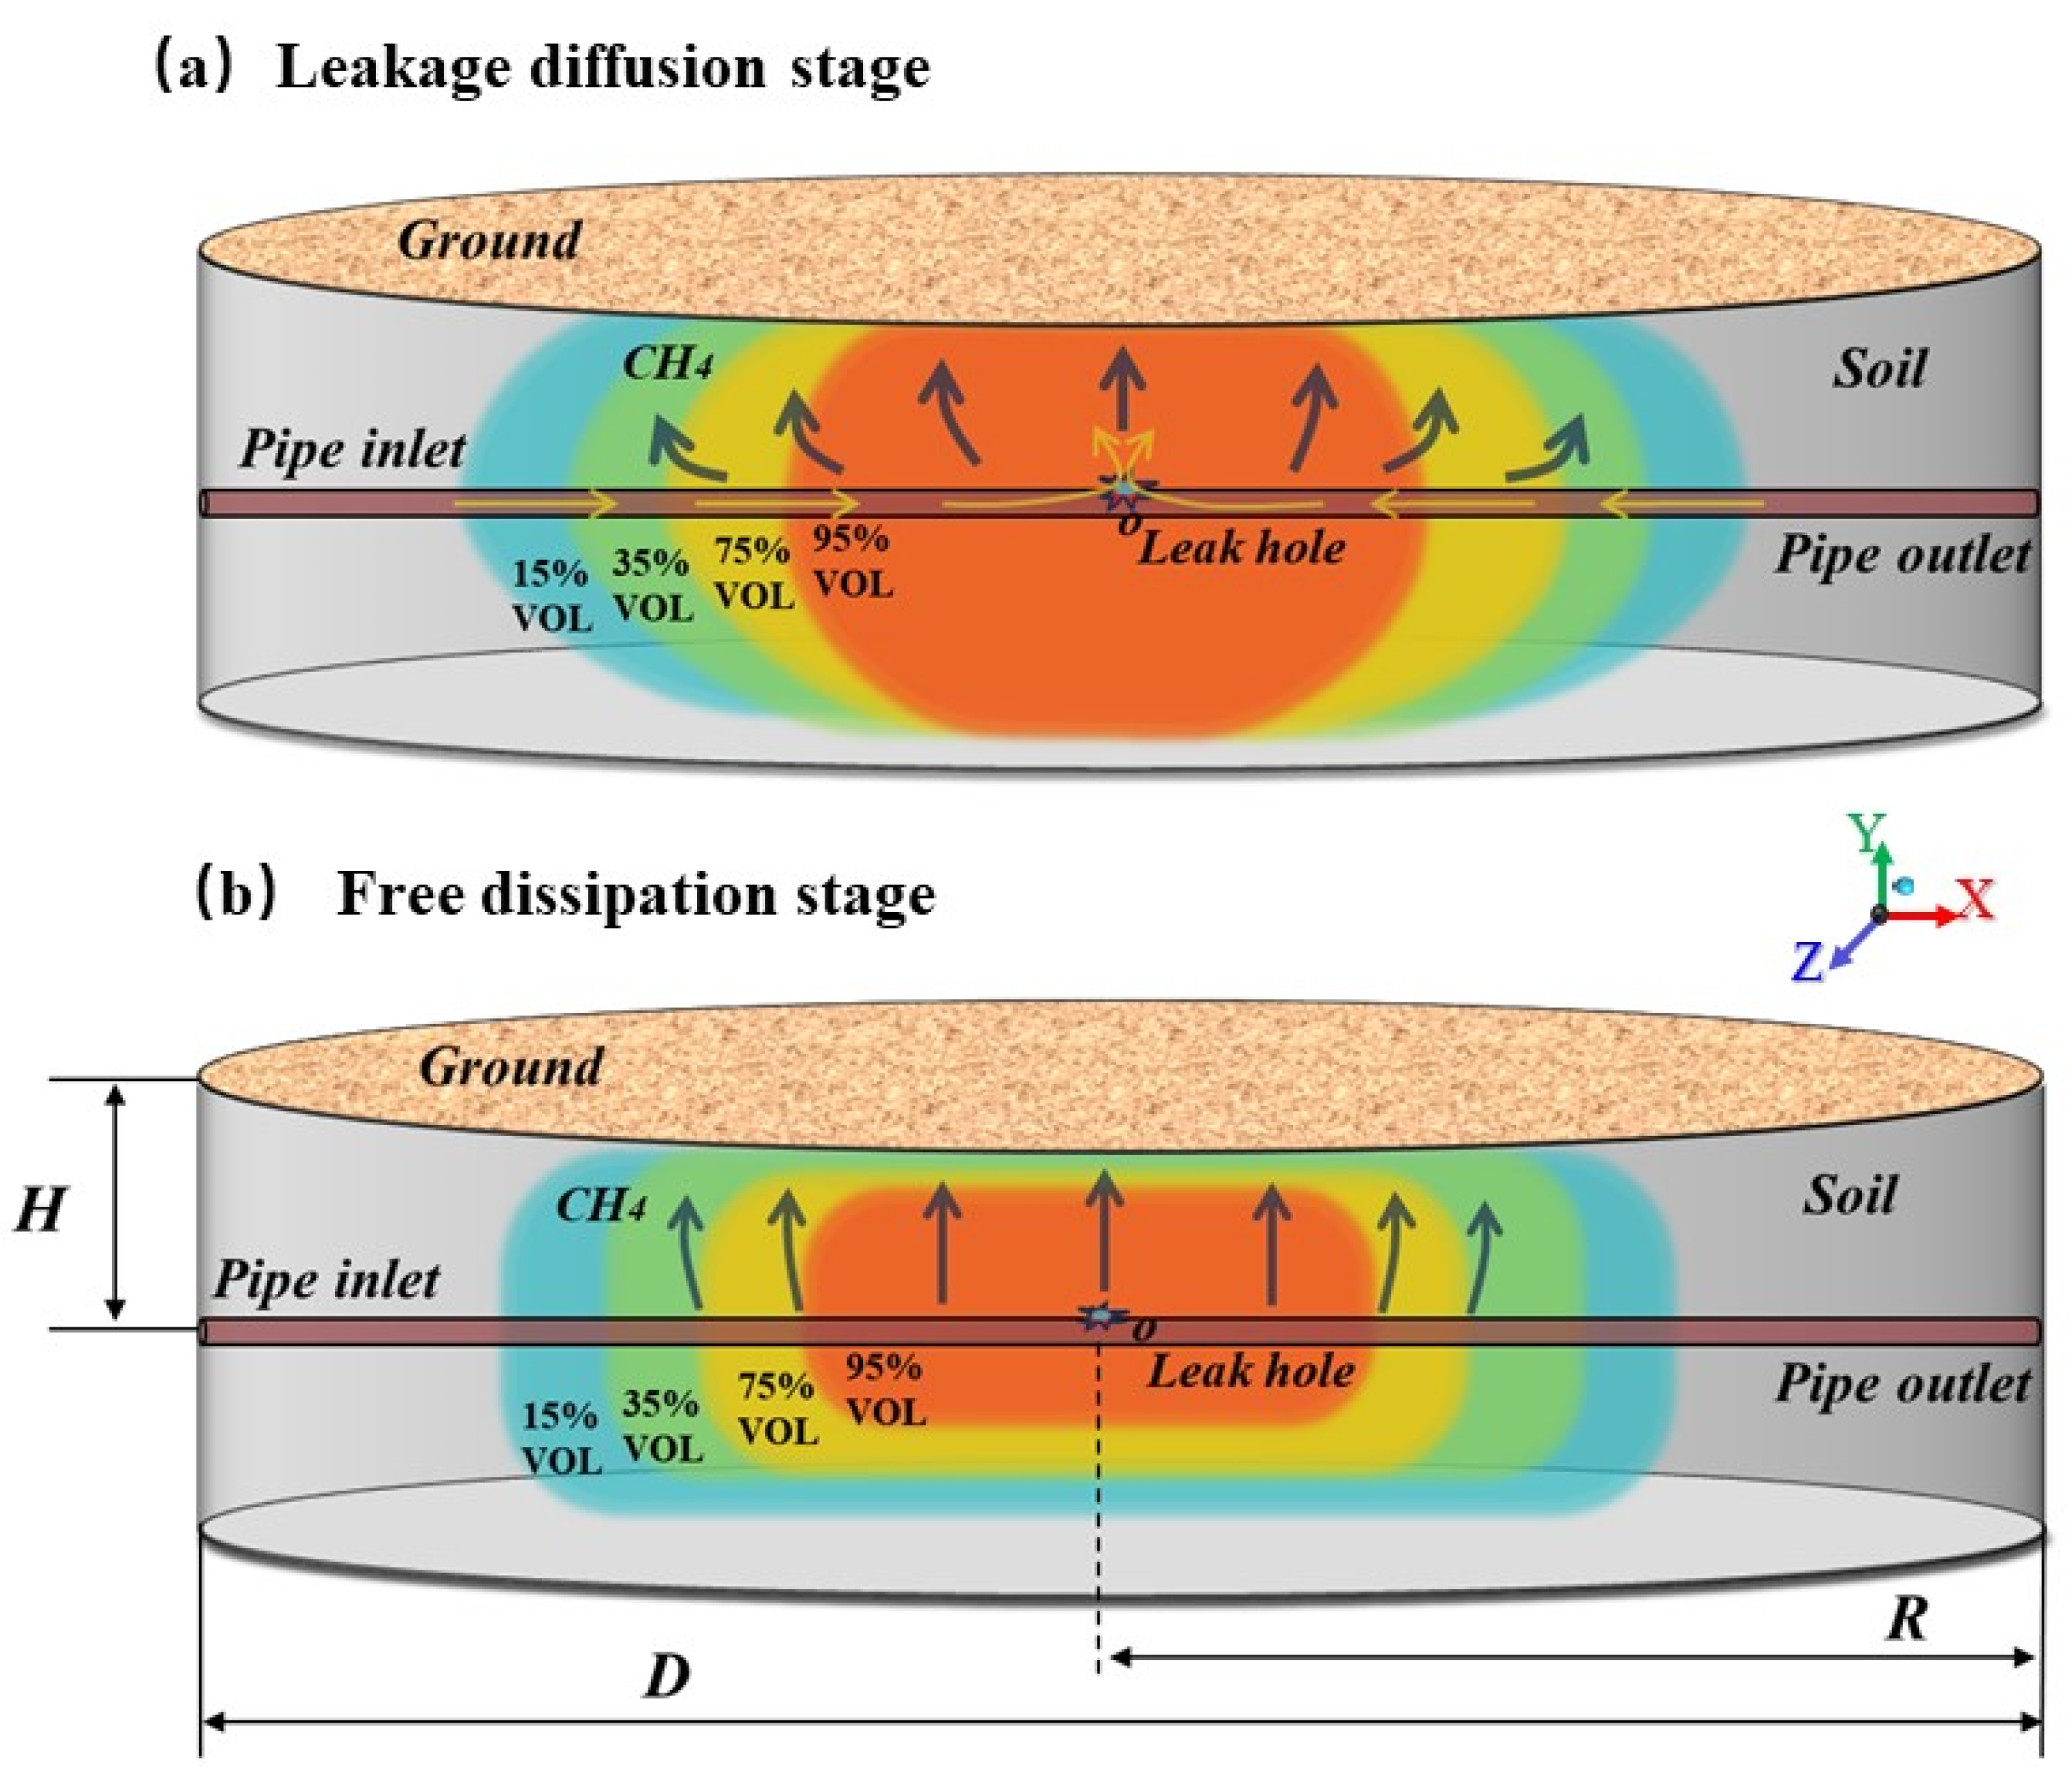
Leakage diffusion stage: After the undetected leakage of the underground gas pipeline in a timely manner, the natural gas on the inlet side of the pipeline will continue to be supplied, and the natural gas will continue to spray into the soil from the leakage port. At this point, the entrance of pressure is set as the underground pipeline inlet, while its exit is designated as the pipeline outlet, and the leakage outlet is at the interior boundary. This stage is the initial condition for the free dissipation of gas.
(3)
Free dissipation stage: Upon discovery of the leakage in the underground gas pipeline, the upstream valve of the pipeline is closed, halting the supply of natural gas. At this point, there is a leakage of residual subterranean natural gas inside the pipeline, and the free dissipation process of residual natural gas into the soil and the pipeline inlet is specified as the wall boundary.
The natural gas leakage diffusion stage and free dissipation stage before and after closing the gas supply valve will cause the natural gas to dispersed from the leakage port and diffuse in all directions of the soil, eventually permeating through the ground and entering the atmosphere, thus affecting the atmospheric environment. Therefore, the boundaries around the soil and the ground are both pressure outlets with the pressure equivalent to atmospheric. For specific boundary conditions, please refer to Table 1.
This study primarily focuses on the investigation of the free dissipation process of residual natural gas in both the pipeline and soil after the discovery of leakage in underground gas pipelines and the subsequent closure of the supply end valve. The analysis involves examining the migration characteristics of natural gas during the free dissipation stage and the distribution patterns of residual concentration. Additionally, it investigates the impact of the leakage diffusion stage on the subsequent free dissipation stage.

2.4. Simulation Scenarios

There are differences between urban gas pipelines and long-distance pipelines, and they also have their own inherent characteristics in design, construction, and management. Urban gas pipelines are mostly in the form of networks and branches, with valves, tees, and other fittings densely distributed. The diameter variation of pipelines is common, and there are significant differences in pressure levels, making it difficult to carry out internal and external inspections of pipelines. Meanwhile, pipelines are mostly located in densely populated areas, and pipeline management is relatively passive. Leakage repairs are often carried out only after receiving a leak alarm, which is a post-maintenance process [12]. Therefore, compared with long-distance pipelines, urban gas pipeline leaks have higher uncertainty, probability of secondary explosions, and accident hazards.
This paper focused on urban medium-pressure buried gas pipelines and analyzed the gas free dissipation process after the gas supply end valve was closed in case of pipeline leakage accidents. Firstly, the duration of the gas leakage during the diffusion stage is a critical factor affecting the free dissipation stage. A longer leakage duration results in higher residual natural gas concentrations and a wider distribution range within the soil. Meanwhile, the operating pressure of the pipeline, the leakage hole diameter, and the soil type significantly influence the gas leakage diffusion stage, which in turn affects the free dissipation stage of the gas. At the same time, the internal pressure of the pipeline, leakage aperture and soil type of the pipeline have a significant impact on the diffusion stage of gas leakage, which further affects the free dissipation stage of gas. The depth of pipeline soil cover not only influences the diffusion process of natural gas but also has a certain effect on the residual natural gas reserves that can be found in the soil. In addition, to ensure the research’s universality, the impact of the leakage direction from leakage points was considered and divided into upward, downward, and lateral directions. According to GB 50028-2006 [40], the pressure for urban medium-pressure pipelines was selected as 0.2–0.4 MPa, and the burial depth of the pipelines was 0.3–1.5 m. There were various types of soil, and common loam, sand, and clay samples were chosen for the research. Case 3 was used as the base condition, and its specific condition settings are shown in Table 2.
Using the basic Case 3, the characteristics of the leakage diffusion stage and free dissipation stage of buried pipeline leakage gas were studied, focusing on the analysis of the free dissipation process of residual natural gas in the pipeline and soil after the valve was closed in a leakage accident. Based on the flow field distribution characteristics such as pressure, velocity, and streamline concentration during the free dissipation stage of natural gas, we studied the gas migration and distribution law during the free dissipation stage of natural gas and achieved hazard assessment.
The first excavation site for repairing leakage accidents in an underground gas pipeline is the soil above the pipeline. The surface of the leakage port is the location with the highest gas concentration distribution and the widest range distribution. Therefore, gaining insight into the natural gas concentration in the soil above the leakage point is of crucial importance for enhancing the safety of repairing leakage accidents in underground gas pipelines. We set up a monitoring line on the surface of the leakage port to analyze the distribution of natural gas concentration on the free dissipation process monitoring line, as shown in Figure 2. By studying the effects of various factors such as leakage time during the free dissipation stage, leakage pressure, aperture size, pipeline burial depth, leakage hole direction, and soil type on monitoring gas concentration along the detection line, the hazardous range and time of ground maintenance work were summarized, and the danger of later maintenance work was evaluated.

2.5. Grid Generation

Grid generation is the process of discretizing the computational domain into a finite number of small elements, which significantly impacts both the accuracy and speed of calculations. Insufficient grid quantity may increase the calculation errors or result in non-convergence, while an excessive quantity will increase the computational workload and time [46,47]. To ensure computational precision and minimize computational time, a tetrahedral unstructured grid was used to divide five grid levels for grid independence testing. The damaged surface of the pipeline leakage port was the interface connecting the internal fluid domain and the porous domain of the pipeline. It was set using an interior interface and the direction of natural gas leakage encrypted at the local level with a mesh, as shown in Figure 3.

2.6. Numerical Method

This study simulates the methane leakage process using ANSYS Fluent 2022R1. For the velocity pressure coupling problem in the N-S equation, the PISO algorithm was adopted and the pressure was corrected twice through iterative correction [48,49]. Due to the fact that the leakage and diffusion process of gas in soil after the failure of buried gas pipelines involves energy, composition, and turbulent flow state changes, it was necessary to solve the energy equation and set the natural gas and air mixed components in the component transportation equation. To ensure the stability of numerical calculations, the convection term adopts a second-order upwind discretization scheme, and the turbulence correction equation adopts the standard model. This study adopted transient numerical simulation, with a simulation time step of 0.1 s and a time step of 18,000 for the leakage diffusion stage, and a maximum iteration of 80 steps. On the basis of the set numerical simulation scheme, we simulated the natural gas leakage and diffusion in the soil within 30 min after a leakage occurs in buried gas pipelines. The free dissipation stage was similar to the leakage diffusion stage, with a simulation time step of 0.1 s and a maximum iteration of 80 steps; the total number of time steps was 36,000, and the simulation duration was 1 h. The number of time steps was determined based on the simulated free dissipation time. Due to the lower density of natural gas compared to air, gravity and buoyancy have a significant impact on the diffusion process. Therefore, considering the effects of gravity and total buoyancy, the natural gas component was considered as methane with a concentration of 100% [49].

3. Results and Discussion

3.1. Grid Independence

To reduce the impact of grid quantity on numerical simulation results and improve the accuracy of numerical simulation, grid quantity independence verification was carried out at five grid levels: 598,862, 980,641, 1,423,010, 1,799,113, and 2,231,005. The leakage rate of the underground gas pipeline was a crucial factor influencing the severity of accidents. Therefore, the gas leakage rate at the leakage point was selected as the evaluation criterion for grid independence verification. The gas leakage rate at the leakage point gradually decreased as the number of grid cells increased. The calculation error due to the number of grids gradually decreased with respective calculation errors of 5.06%, 2.56%, 1.13%, and 0.80% for five different grid levels. As the number of grids increased from 1,799,113 to 2,231,005, the calculation error attributed to grid quantity was merely 0.80%, as shown in Table 3. Therefore, this study selected the 1,799,113 grid level for numerical simulation calculations to improve computational accuracy while reducing computational errors.

3.2. Validation of Numerical Model

To ensure numerical simulation results accuracy, experimental results need to be used for verification. This paper studied the release of gas from underground pipelines, covering two stages of gas leakage diffusion and free dissipation, which were in accordance with the experimental findings research content of Yan et al. [50]. Therefore, its experimental results were compared with the numerical simulation results of this article. First, we rebuilt the physical model of the experimental pit according to the experimental method and ensured that the size of the experimental pit (5 × 3 × 3 m) was consistent with the experimental design. The buried pipeline had a diameter of 0.2 m and a length of 1 m. The upper surface of the pipeline was buried 0.8 m deep from the ground. The experimental gas used was a mixture gas of methane and air with a 5% lower explosive limit. The molar volume of methane was 2.5%, and air accounts for 97.5%. A high flow rate gas with a volume flow rate of 24 L/min was selected for validation. The boundaries in the numerical simulation were set exactly the same as the experiment, and the soil characteristic parameters were determined based on the measurement results of the experimental soil characteristic parameters. The average porosity of the soil was 0.1335. The monitoring points of numerical simulation were set at the positions of experimental sensor 3 (−1.5, 0, 0.8 m) and sensor 14 (0, −0.8, 0.3 m), and the calculation results were compared with the experimental data.
After the leakage of the buried pipeline, the methane concentration at the monitoring position gradually increased with the extension of the leakage diffusion stage time, and the methane concentration gradually decreased during the free dissipation stage after closing the valve. Through data comparison and analysis, the average error analysis of the gas concentration observed at monitoring points 3 and 14 was 1.87% and 3.06%, indicating the precision of numerical simulation outcomes for the gas leakage diffusion stage and free dissipation stage in this study, as shown in Figure 4.

3.3. Analysis of the Characteristics of Free Dissipation Stage of Natural Gas in Soil

Currently, numerous existing studies have analyzed the leakage and diffusion process from underground gas pipelines, but the free dissipation process of residual natural gas in the pipeline and soil after closing of the valve at the supply end has not yet been studied. This article takes the leakage diffusion stage as the initial state of the free dissipation stage and studies the free dissipation process of natural gas after closing the supply end valve after a period of leakage diffusion in underground gas pipelines. We analyzed the distribution of pressure, velocity, streamline, and concentration during the free dissipation stage using basic operating conditions (Case 3), studied the transport characteristics of natural gas during the free dissipation stage, analyzed the accident hazards during the free dissipation stage, and provided reference and suggestions for later pipeline maintenance operations.

3.3.1. Concentration Distribution during the Gas Leakage Diffusion Stage

During the leakage diffusion stage of underground gas pipelines, the natural gas concentration in the soil gradually increases, and its distribution range expands as the leakage duration increases. When the leakage time increases from 10 to 50 min, the lower explosive limit range of methane increases from 1.49 to 2.59 m, as shown in Figure 5. This article studies the free dissipation process of residual gases in buried gas pipelines and soil after closing the gas supply end valve with the leakage diffusion result as the initial condition for the free dissipation stage.
The flow field distribution during the free dissipation stage was analyzed using Case 3. The state at 30 min into the leakage diffusion stage of the underground gas pipeline was used as the initial condition for the free dissipation stage at time 0. The velocity, streamline, and concentration distribution during the free dissipation stage were studied.

3.3.2. Pressure Distribution during the Free Dissipation Stage of Natural Gas

During the early of free dissipation stage, the pressure inside the pipeline drops sharply and basically drops to atmospheric pressure within one minute. After a period of time, when the pipeline pressure reaches atmospheric pressure, the negative pressure zone formed due to leakage is located in the surrounding soil environment of the leak. As the free dissipation time increases, the formation of a zone characterized by negative pressure from the soil environment around the leakage port gradually decreases and gradually recovers to atmospheric pressure, as shown in Figure 6. After the valve at the supply end of the natural gas pipeline is closed, the residual natural gas in the pipeline and soil begins to enter the free dissipation stage. In the initial stage of free dissipation, the internal pressure of the pipeline drops sharply and basically drops to atmospheric pressure within one minute. After natural gas leakage, it accumulates in the soil area around the leakage port and rapidly spreads to the surrounding areas affected by pressure difference, concentration difference, and density difference. The gas around the leakage port is mainly natural gas. After a period of free dissipation and reaching equilibrium, the natural gas with lower density around the leakage port will continue to diffuse toward the surrounding area. If there is a lack of natural gas supply and the surrounding air cannot enter, a negative pressure zone will appear at this stage. As the natural gas in the soil around the leakage outlet dissipates freely, the air in the distant soil gradually migrates and replenishes, and the negative pressure value gradually decreases.

3.3.3. Velocity Distribution during the Gas Free Dissipation Stage

Compared to the leakage diffusion stage, the velocity distribution in the gas free dissipation stage is significantly reduced, and as the gas free dissipation time increases, the gas velocity distribution in the soil further decreases. The velocity in the soil shows a symmetrical distribution during both the leakage diffusion stage and the free dissipation stage of buried gas pipelines, as shown in Figure 7. During the leakage diffusion stage of gas, the upstream gas supply end continues to supply gas, and the pipeline pressure distribution is stable. Under the difference of pressure, the continuous gas leakage speed distribution is relatively large. The free dissipation stage is the diffusion process of residual gases in the pipeline and soil with no continuous gas supply. The pressure gradient between the interior and exterior of the pipeline gradually diminishes, and the velocity distribution in the soil is relatively small. This study assumes that the soil is a porous medium with isotropic properties, so the velocity during the leakage diffusion stage and the free dissipation stage shows a symmetric distribution state.

3.3.4. Streamline Distribution during the Gas Free Dissipation Stage

During the leakage diffusion stage of gas, the flow line is radially distributed outward with the leakage hole as the center. After entering the free dissipation stage, it can be inferred from the distribution of the gas leakage streamlining at the leak hole that the leakage is significantly weakened. The streamline distribution during the free dissipation stage is accompanied by reflux, and the reflux intensifies with the expansion of the free dissipation stage time. Similar to the distribution of velocity, the streamline distribution also exhibits a symmetrical distribution, as shown in Figure 8. According to Figure 8, during the leakage diffusion stage, the gas supply end continues to provide gas, resulting in a significant increase in leakage due to the large pressure difference inside and outside of the pipeline. When natural gas enters the soil, it diffuses toward the low-concentration areas around it under the combined driving force of pressure difference and gas concentration difference, and the streamline shows a radial distribution state. Entering the stage of free dissipation, the pressure gradient between the gas supply end and surrounding environment in the gas supply pipeline rapidly diminishes, the leakage rate sharply decreases, the diffusion trend weakens, and the radial state of the streamline gradually disappears. With the outward diffusion of high concentration natural gas emitted from the leakage port and the decrease in leakage volume, the high concentration area at the leakage port is reduced, which is accompanied by the addition of external air. The streamline shows a trend of reflux, and the reflux phenomenon is significantly intensified with the extension of free dissipation time. This phenomenon corresponds to the characteristics of pressure distribution and is consistent with the trend of pressure distribution characteristics. Due to the presence of a negative pressure zone, there is a phenomenon of air backflow in the soil around the leakage port. The assumption of soil isotropy in this article determines the symmetry of the horizontal flow field distribution of gas leakage and diffusion.

3.3.5. Concentration Distribution during the Free Dissipation Stage of Natural Gas

When the free dissipation stage of natural gas is longer, the range of high-concentration areas in the soil gradually decreases, while the range of low-concentration areas gradually increases. Furthermore, the concentration of gas within the pipeline changes very slowly, and after one hour of free dissipation, the concentration remains basically unchanged, as shown in Figure 9. After the free dissipation stage begins, the gas supply end of the pipeline stops supplying gas. As the free dissipation time increases, the pressure difference inside and outside of the pipeline decreases, and the gas leakage capacity rapidly decreases. Therefore, the high concentration area near the leakage port gradually decreases. In the free dissipation stage, the internal pressure of the pipeline decreases rapidly, and natural gas is transformed from relying on the pressure difference, concentration difference, and density difference in the leakage diffusion stage to relying on the difference in the concentration and density in the free dissipation stage. After the pressure difference disappears, the diffusion process of gas slows down, leading to an increase in the low-concentration area of natural gas in the outer circle. In addition, after the pressure difference inside and outside of the pipeline disappears, natural gas only relies on the concentration difference and density difference to flow out from the smaller leakage port, and it is also affected by soil resistance, resulting in a basically unchanged concentration of natural gas inside the pipeline.
Through the analysis of the characteristics of the free dissipation stage in the soil within this section, it is found that the distribution of pressure, velocity, streamline, and concentration fields exhibits significant disparities between the free dissipation stage and the leakage diffusion stage of natural gas. In order to further study the gas transport characteristics during the free dissipation stage of natural gas, we next conducted an analysis of the influence of alterations in multiple factors on the concentration distribution during the free dissipation stage of natural gas.

3.4. Analysis of Influencing Factors during the Free Dissipation Stage of Natural Gas

The gas leaked from the buried gas pipeline is influenced by similar factors during the dispersion and free dissipation stages, including the pipeline operating pressure, leak aperture, soil type, leak direction, and burial depth of the pipeline. As the leakage time increases, soil’s natural gas content also increases, which affects the subsequent free dissipation stage of the gas. Therefore, the analysis of the influencing factor of leakage time has been added. Using the lower explosive limit of 5% VOL of methane as the hazard assessment indicator, we conducted a comprehensive analysis of the impact of the changes in diverse factors based on the natural gas concentration distribution on the monitoring line, and we also analyzed the hazard distribution range (HDR) of natural gas.

3.4.1. Leakage Time

The longer the leakage diffusion stage time (T), the wider the range of gas hazard distribution on the monitoring line at different times during the free dissipation time (t). With the extension of the free dissipation stage time, the distribution of gas concentration on the monitoring line decreases, while the range of hazardous distribution increases. When the leakage diffusion stage time is extended from 10 to 50 min, the natural gas hazard distribution range at the monitoring line increases from 3.11 to 5.16 m after 1 min of free dissipation, and from 4.04 to 5.68 m after 60 min of free dissipation, as shown in Figure 10. The leakage time refers to the duration of continuous gas supply at the pipeline supply end during the leakage diffusion stage. The long leakage time results in a large gas diffusion range and a high residual natural gas content. Therefore, the longer the leakage diffusion stage, the larger the range of hazardous distribution of natural gas at the monitoring line during the free dissipation stage. As the free dissipation time prolongs, residual methane in the soil gradually diffuses through the soil and enters the atmosphere, and the methane concentration at the monitoring line stage by stage decreases. However, due to the lack of gas supply after the free dissipation stage, methane diffusion only occurs under the influence of thickness and density differences, and it is extremely slow under soil resistance. Compared to the low thickness area at the outer edge of the leakage port, the concentration difference is small and the diffusion velocity is small. The free dissipation of internal gas to this location leads to an increase in the range of methane hazard distribution at that location.

3.4.2. Pipeline Operating Pressure

The increase in pipeline operating pressure leads to an expansion of the hazardous distribution range of gas, and the stage of leakage diffusion in natural gas is similar to the free dissipation stage. In addition, with the extension of free dissipation time, the concentration of natural gas at the monitoring line gradually decreases, but the dangerous distribution range of natural gas shows an increasing trend.
When the pipeline’s operational pressure increases from 20 to 40 KPa, the hazard distribution range of natural gas with free dissipation for 1 min is 4.12 m and 4.52 m, respectively. The hazard distribution range of natural gas with free dissipation for 60 min is 4.84 m and 5.38 m, respectively, as shown in Figure 11. During the leakage diffusion stage, the leakage of natural gas into the soil is accelerated due to an increase in pipeline operating pressure, resulting in an expansion of the accumulation of natural gas in the soil and a wider distribution range of gas hazards at monitoring lines. As the duration of the free dissipation stage time increases, the distribution range of natural gas hazards at the monitoring line increases, and the reason for this phenomenon is the same as the factor of leakage time.

3.4.3. Leakage Diameter

The augmentation in the diameter of leakage will further enhance the leakage rate of gas in the soil, resulting in a large accumulation of natural gas in the soil, and at the same time, due to an increase in natural gas content in the soil, there will also be a corresponding increase in both the gas concentration and hazardous range at monitoring lines. As the free dissipation time increases, the concentration distribution of natural gas at the monitoring line gradually decreases, and the range of hazardous distribution of natural gas also exhibits a building inclination. When the diameter of the leakage increases from 10 to 80 mm, the hazard distribution range of natural gas for free dissipation for 1 min is 2.78 m and 5.01 m, respectively, and the hazard distribution range of natural gas for free dissipation for 60 min is 3.36 m and 5.86 m, respectively, as shown in Figure 12.

3.4.4. Pipeline Burial Depth

The increase in pipeline burial depth leads to a higher thickness and expanded distribution range of natural gas at monitoring lines during both the diffusion and free dispersion stages of gas leakage. When the depth at which the pipeline is buried increases from 0.3 to 1.5 m, the hazard distribution range of natural gas with free dissipation for 1 min is 3.61 m and 4.66 m, respectively, and the hazard distribution range of natural gas with free dissipation for 60 min is 2.84 m and 5.56 m, respectively, as shown in Figure 13. An increase in pipeline burial depth will increase the accretion of natural gas in the soil, while the rate of gas release from the soil during the free dissipation stage is slow, resulting in an elevation of natural gas concentration along the monitoring line. Similar to other factors, as the free dissipation time prolongs, the spatial distribution of natural gas dispersion along the monitoring line gradually expands.

3.4.5. Leakage Direction

After analysis, we found that the direction of underground gas pipeline leakage has a certain influence on the concentration distribution of natural gas along the monitoring line. However, under different leakage orientations, the range of dangerous natural gas distribution remains basically unchanged (as illustrated in Figure 14). The diffusion stage of underground gas pipeline leakage is primarily driven by the pressure gradient between the interior and exterior of the pipeline. Due to equal pressure differences under several different leakage direction conditions, the thickness distribution of natural gas along the monitoring line is generally similar. As the free dissipation stage begins, the diffusion caused by the pressure difference transitions to propagation relying on the concentration difference and density difference. With prolonged duration in this free dissipation stage, some differences may appear in the thickness distribution of natural gas along the monitoring line, but overall, the changes are small.

3.4.6. Soil Type

The soil type has a serious influence on the distribution of gas thickness on the monitoring line during the diffusion and free dissipation stages of natural gas leakage. In cases where the soil composition predominantly consists of clay, the alteration in the thickness of natural gas on the monitoring line is the smallest. When the soil types are sand, loam, and clay, the natural gas hazard distribution ranges on the monitoring line during the free dissipation stage of 1 min and 60 min are 6.44 m, 4.38 m, 1.56 m, and 7.58 m, 5.14 m, and 0.56 m, respectively, as shown in Figure 15. Among the three types of soil, sandy soil has the smallest resistance to the gas leakage diffusion stage and free dissipation stage, resulting in the largest hazard distribution range of natural gas on the monitoring line. The resistance of clay to gas leakage and diffusion is unparalleled, resulting in the narrowest distribution range of natural gas hazards along the monitoring line. The resistance of loam soil to gas leakage and diffusion is between sand and clay, and the hazard distribution range of natural gas on the monitoring line is also between the two. Due to the significant influence of the coefficients of viscosity resistance and inertia resistance in clay on gas leakage diffusion, natural gas exhibits a relatively slow process during the stages of leakage diffusion and free dissipation. As the monitoring time prolongs, the thickness of natural gas remains relatively stable on the monitoring line.

3.5. Determination of Safety Repair Time for Buried Gas Pipeline Leakage Accidents

3.5.1. Natural Gas Concentration Prediction Model

The distribution of natural gas concentration along the monitoring line and the changes in various influencing factors were used to establish a multivariate non-linear regression model using MATLAB mathematical computing software, which was solved using the least squares method and multiple regression theory. The leakage diffusion time (T), the operating pressure of the pipeline (p), and the leakage diameter (d) determine the amount of natural gas leakage in the soil during the leakage diffusion stage. The accumulation of natural gas in the soil varies under different pipeline burial depths (H), all of which will affect the natural gas thickness along the monitoring line. Meanwhile, two factors, the distance (L) from a certain point on the monitoring line to the leakage port and the free dissipation time (t), were added to analyze the natural gas concentration at different times and locations during the free dissipation stage on the monitoring line. Through simulation, it is known that the leakage direction has a minimal impact on the natural gas thickness on the monitoring line, and it is not considered here. In this paper, we selected common soil as the research object and established a predictive model for natural gas concentration in the surface soil at points of leakage from buried gas pipelines, which is specifically shown in Equation (10).
C = 21.69 + 18.26 p d 1 / 4 + 41.88 d 1 / 8 + 39.47 H 25.46 t T 1 / 4 34.72 L
s . t . 0.2 p 0.4 MPa d 90 mm i f : C 100 , C = 100 i f : C 0 , C = 0
where H is the pipeline buried depth (m), d is the leakage diameter (mm), p is the pipeline operating pressure (MPa), C is the volume fraction of natural gas (%), T is the time of the leakage diffusion stage (min), t is the time of the free dissipation stage (min), and L is the distance from the leakage hole (m). Equation (10) is applied to predict the thickness of natural gas in the soil at the leakage level of urban medium-pressure buried gas pipelines with specific constraints as shown in Equation (11). When the calculation result is greater than or equal to 100, the natural gas concentration is outputted as 100. When the calculation result is less than or equal to 0, the natural gas concentration is outputted as 0.
The regression coefficient quantifies the extent of influence of the independent variable on the response variable. The estimated values and confidence intervals of the regression coefficient are shown in Table 4. The validity of the regression coefficients is tested using the coefficient of determination R2 and the p-value of statistical observational data F. The R2 value and p value are both 0.93 and 0.001, respectively, indicating the efficacy of the regression model was evaluated. The specific regression coefficient significance test results can be found in Table 4.
To ensure the accuracy of the model for predicting natural gas concentration, the prediction model was randomly validated using conditions 5 and 9 corresponding to the maximum leakage diffusion time and pipeline operating pressure, and it was also validated for conditions 10 and 14 corresponding to the minimum leakage diameter and burial depth. The free dissipation time of the four working conditions corresponds to different times of 60 min, 30 min, 10 min, and 1 min, and the calculation results of the prediction model are compared with the numerically simulated results. The calculated natural gas concentration in the prediction model exhibits a consistent trend with the numerically simulated results, as illustrated in Figure 16.
The error of the prediction model is calculated in Figure 17. The calculation results of the natural gas concentration prediction model are relatively accurate throughout the entire range, and the error is relatively large at a distance from the leak location. The prediction model demonstrates a high level of accuracy in calculating natural gas concentration, as evidenced by an average error rate of 7.88% across the entire interval. The natural gas concentration distribution near the leakage port is relatively high, which is the main danger area for the maintenance of buried gas pipeline leakage accidents. This area is a key area for predicting the concentration of natural gas distribution, providing a reference and suggestions for the safe repair time of subsequent maintenance work of buried gas pipeline leakage accidents.

3.5.2. Calculation Model for Safety Repair Time of Buried Gas Pipeline Leakage Accidents

The repair work for buried gas pipeline leakage accidents requires an excavation of the soil above the leakage port. During the excavation process, collisions generate sparks, which lead to explosion accidents when the natural gas concentration is within the explosion range. In theory, as the free dissipation time of natural gas increases, the gas concentration gradually decreases, and the risk of secondary explosion accidents during repair operations decreases.
According to simulation, it is found that the process of free diffusion of remaining natural gas in underground gas pipelines and soil after leakage is slow and lasts for a long time. At this time, we observed that the rate of decrease in natural gas concentration in the soil is slow. In particular, the natural gas inside the pipeline, due to the difficulty of external air entering, remains at a relatively high level. Based on the predictive model for natural gas concentration on the monitoring line, a calculation model for the safety repair time of underground gas pipeline leakage under corresponding concentration conditions is derived, as shown in Equation (12).
t = T 21.69 + 18.26 p d 1 / 4 + 41.88 d 1 / 8 + 39.47 H 34.72 L C 25.46 4
The meanings and units of the variables in Equation (12) are consistent with those in Equation (10). By setting the expected safe concentration of natural gas, the time for natural gas to reach the corresponding concentration is calculated to determine the safe repair time for buried gas pipeline leakage accidents. This calculation model provides a method for calculating the free dissipation time when the corresponding leakage conditions reach the corresponding safe concentration in addition to improving the safety of underground gas pipeline leakage accident repair operations.

4. Conclusions

This paper focuses on the free dissipation stage of residual gas in the pipeline and soil after the gas supply end valve is closed due to the buried pipeline leakage. The flow field distribution during the gas free dissipation stage is studied, and the gas concentration distribution during the free dissipation stage is analyzed. The following conclusions have been drawn from this study.
(1)
After the gas supply valve is closed, the residual natural gas in the buried pipeline and soil begins to enter the free dissipation stage, and the internal pressure of the pipeline drops sharply, basically dropping to atmospheric pressure within one minute. Compared to the gas leakage diffusion stage, the velocity and pressure distribution in the pipeline and soil are significantly reduced due to the cessation of gas supply at the gas supply end during the free dissipation stage; the pressure in the tube dropped from 300,000 to 0 Pa within one minute of the leak. Meanwhile, during the preliminary phase of free dissipation, natural gas with lower density continues to rapidly spread to the surrounding areas. There is a lack of natural gas supply in the rear and the surrounding air enters slowly, forming a negative pressure zone in the soil near the leakage port; with the increase in leakage time, the negative pressure area near the pipeline increases from −50 to −25 Pa.
(2)
Unlike the diffusion stage of leakage, the gas free dissipation stage after closing the supply end valve of a buried gas pipeline leakage is a very slow process, and the concentration of gas inside the pipeline remains basically unchanged. The natural gas concentration on the monitoring line for 60 min of free dissipation within the research scope is still mostly above the lower explosive limit. In contrast, the concentration of natural gas at the ground surface decreases at a faster rate.
(3)
The increase in leakage time, pressure, diameter, and pipeline burial depth leads to a large accumulation of gas in the soil, which increases the spatial distribution range and concentration of gas on the same free dissipation time monitoring line. In the initial stage of free dissipation, with the extension of time, the hazard spatial distribution range of natural gas at the lower explosive limit of 5% VOL of methane at the monitoring line increases.
(4)
Based on various factors influencing the gas concentration above the monitoring line, we have developed a predictive model for forecasting the gas concentration during the free dissipation stage after closing the gas supply end valve. Furthermore, a calculation model for the safety repair time of buried gas pipeline leakage accidents was derived, which can determine the safety repair time of accidents under corresponding leakage conditions.
(5)
The free dissipation process of natural gas in soil has a slow concentration reduction rate, which prolongs the safety repair time of pipelines and is not conducive to the rapid repair of buried gas pipeline leakage accidents. To shorten the security repair time, a method of layer-by-layer excavation and layer-by-layer dissipation can be adopted. By excavating the upper layer of soil with low natural gas concentration, we can achieve the rapid diffusion of natural gas between the lower soil and the air, thereby shortening the time required for safety repairs.

Author Contributions

F.B.: Conceptualization, Data curation, Formal analysis, Methodology, Writing—Original draft, Writing—Review and editing. Y.H.: Software. M.L.: Visualization. Z.L.: Investigation. J.B.: Validation. C.L.: Project administration. Z.W.: Resources, Supervision, Funding acquisition. The whole work was supervised by Z.W. All authors have read and agreed to the published version of the manuscript.

Funding

This work presented in this paper was financially supported by the National Natural Science Foundation of China (52074090) and the Key Research & Development Program of Heilongjiang Province (Grant No. JD22A004).

Data Availability Statement

No data, models, or code were generated or used during the study.

Acknowledgments

The authors gratefully acknowledge the support from the National Natural Science Foundation of China, the Postdoctoral Scientific Foundation of Heilongjiang Province in China, and the Heilongjiang Touyan Innovation Team Program.

Conflicts of Interest

Author Ming Liu was employed by the company Daqing Petrochemical Engineering Co., Ltd. The remaining authors declare that the research was conducted in the absence of any commercial or financial relationships that could be construed as a potential conflict of interest.

Nomenclature

ϕ Porosity
ρ Density (kg/m3)
t Time (s)
x Displacement (m)
u Velocity (m/s)
p Absolute pressure (Pa)
τ ¯ ¯ Stress tensor (Pa)
g Gravitational acceleration (m/s2)
μ Viscosity (kg/ms)
α Permeability (m2)
1 / α Viscous resistance coefficient (1/m2)
C 2 Inertial resistance coefficient (1/m)
D p Particle diameter mean (mm)
J m Mass fraction of component (%)
D Diffusion coefficient (m2/s)
υ Specific volume (m3/kg)
R Gas constant (J/kgK)
T Temperature (K)
κ Turbulence kinetic energy (J/kg)
ε Turbulence dissipation rate (J/kgs)
μ t Turbulent viscosity
G κ Turbulence kinetic energy generation due to the mean velocity gradient
G b Turbulence kinetic energy generation due to buoyancy
Y M Effect of fluctuating expansion on total dissipation rate in compressible turbulence
S κ Source term for turbulent kinetic energy
σ κ Prandtl number corresponding to turbulent kinetic energy
σ ε Prandtl number corresponding to turbulent dissipation rate
C 1 ε Empirical constant
C 2 ε Empirical constant

References

  1. Li, J.F.; Ye, J.L.; Qin, X.W.; Qiu, H.J.; Wu, N.Y.; Lu, H.L.; Xie, W.W.; Lu, J.A.; Peng, F.; Xu, Z.Q.; et al. The first offshore natural gas hydrate production test in South China Sea. China Geol. 2018, 1, 5–16. [Google Scholar] [CrossRef]
  2. Ye, J.L.; Qin, X.W.; Xie, W.W.; Lu, H.L.; Ma, B.J.; Qiu, H.J.; Liang, J.Q.; Lu, J.A.; Kuang, Z.G.; Lu, C.; et al. The second natural gas hydrate production test in the South China Sea. China Geol. 2020, 3, 197–209. [Google Scholar] [CrossRef]
  3. Li, N.; Wang, J.L.; Liu, R.; Tang, X. Multi-scenario conception on the development of natural gas industry under the goal of carbon neutrality. Nat. Gas Ind. 2021, 41, 183–192. [Google Scholar]
  4. Bu, F.X.; Liu, Y.; Chen, S.Q.; Wu, J.; Guan, B.; Zhang, N.; Lin, X.Q.; Liu, L.; Cheng, T.C.; Shi, Z.C.; et al. Real scenario analysis of buried natural gas pipeline leakage based on soil-atmosphere coupling. Int. J. Press. Vessel. Pip. 2022, 199, 104713. [Google Scholar]
  5. Guo, Y.B.; Liu, C.C.; Wang, D.G.; He, R.Y. Numerical study and safety spacing of buried parallel gas pipelines: A study based on TNT equivalent method. Int. J. Press. Vessel. Pip. 2018, 168, 246–257. [Google Scholar] [CrossRef]
  6. Li, S.Y.; Wen, Y.M.; Li, P.; Yang, J.; Dong, X.X.; Mu, Y.H. Leak location in gas pipelines using cross-time-frequency spectrum of leakage-induced acoustic vibrations. J. Sound Vib. 2014, 333, 3889–3903. [Google Scholar] [CrossRef]
  7. Jo, Y.D.; Ahn, B.J. A method of quantitative risk assessment for transmission pipeline carrying natural gas. J. Hazard. Mater. 2005, 123, 1–12. [Google Scholar] [CrossRef]
  8. Ramírez-Camacho, J.G.; Carbone, F.; Pastor, E.; Bubbico, R.; Casal, J. Assessing the consequences of pipeline accidents to support land-use planning. Saf. Sci. 2017, 97, 34–42. [Google Scholar] [CrossRef]
  9. Han, Z.; Weng, W. Comparison study on qualitative and quantitative risk assessment methods for urban natural gas pipeline network. J. Hazard. Mater. 2011, 189, 509–518. [Google Scholar] [CrossRef]
  10. Wang, K.; Shi, T.T.; He, Y.R.; Li, M.Z.; Qian, X.M. Case analysis and CFD numerical study on gas explosion and damage processing caused by aging urban subsurface pipeline failures. Eng. Fail. Anal. 2019, 97, 201–219. [Google Scholar] [CrossRef]
  11. Liu, C.W.; Wang, Y.Z.; Li, X.H.; Li, Y.X.; Khan, F.; Cai, B.P. Quantitative assessment of leakage orifices within gas pipelines using a Bayesian network. Reliab. Eng. Syst. Safe 2021, 209, 107438. [Google Scholar] [CrossRef]
  12. Ma, L.; Cheng, L.; Li, M. Quantitative risk analysis of urban natural gas pipeline networks using geographical information systems. J. Loss Prev. Process Ind. 2013, 26, 1183–1192. [Google Scholar] [CrossRef]
  13. Olvera, H.A.; Choudhuri, A.R. Numerical simulation of hydrogen dispersion in the vicinity of a cubical building in stable stratified atmospheres. Int. J. Hydrog. Energy 2006, 31, 2356–2369. [Google Scholar] [CrossRef]
  14. Barros, P.L.; Luiz, A.M.; Nascimento, C.A.; Neto, A.T.P.; Alves, J.J.N. On the non-monotonic wind influence on flammable gas cloud from CFD simulations for hazardous area classification. J. Loss Prev. Process Ind. 2020, 68, 104278. [Google Scholar] [CrossRef]
  15. Mishra, K.B. CFD model for large hazardous dense cloud spread predictions, with particular reference to Bhopal disaster. Atmos. Environ. 2015, 117, 74–91. [Google Scholar] [CrossRef]
  16. Dasgotra, A.; Teja, V.G.; Sharma, A.; Mishra, K. CFD modeling of large-scale flammable cloud dispersion using FLACS. J. Loss Prev. Process Ind. 2018, 56, 531–536. [Google Scholar] [CrossRef]
  17. Agarwal, A.; Molwane, O.B.; Pitso, I. Analytical investigation of the influence of natural gas leakage & safety zone in a pipeline flow. Mater. Today Proc. 2021, 39, 547–552. [Google Scholar]
  18. Lu, H.F.; Huang, K.; Fu, L.D.; Zhang, Z.H.; Wu, S.J.; Lyu, Y.; Zhang, X.L. Study on leakage and ventilation scheme of gas pipeline in tunnel. J. Nat. Gas Sci. Eng. 2018, 53, 347–358. [Google Scholar] [CrossRef]
  19. Wang, X.M.; Tan, Y.F.; Zhang, T.T.; Zhang, J.; Yu, K. Diffusion process simulation and ventilation strategy for small-hole natural gas leakage in utility tunnels. Tunn. Undergr. Space Technol. 2020, 97, 103276. [Google Scholar] [CrossRef]
  20. Bu, F.X.; Liu, Y.; Wang, Z.X.; Xu, Z.; Chen, S.Q.; Hao, G.W.; Guan, B. Analysis of natural gas leakage diffusion characteristics and prediction of invasion distance in utility tunnels. J. Nat. Gas Sci. Eng. 2021, 96, 104270. [Google Scholar] [CrossRef]
  21. Yuan, S.Q.; Wu, J.S.; Zhang, X.L.; Liu, W.Y. EnKF-based estimation of natural gas release and dispersion in an underground tunnel. J. Loss Prev. Process Ind. 2019, 62, 103931. [Google Scholar] [CrossRef]
  22. Wu, J.S.; Liu, Z.; Yuan, S.Q.; Cai, J.T.; Hu, X.F. Source term estimation of natural gas leakage in utility tunnel by combining CFD and Bayesian inference method. J. Loss Prev. Process Ind. 2020, 62, 104328. [Google Scholar] [CrossRef]
  23. Wang, W.H.; Zhu, Z.X.; Jiao, Z.R.; Mi, H.F.; Wang, Q.S. Characteristics of fire and smoke in the natural gas cabin of urban underground utility tunnels based on CFD simulations. Tunn. Undergr. Space Technol. 2021, 109, 103748. [Google Scholar] [CrossRef]
  24. Zhang, S.H.; Ma, H.T.; Huang, X.M.; Peng, S.N. Numerical simulation on methane-hydrogen explosion in gas compartment in utility tunnel. Process Saf. Environ. Prot. 2020, 140, 100–110. [Google Scholar] [CrossRef]
  25. Wang, X.M.; Tan, Y.F.; Zhang, T.T.; Xiao, R.; Yu, K.C.; Zhang, J.D. Numerical study on the diffusion process of pinhole leakage of natural gas from underground pipelines to the soil. J. Nat. Gas Sci. Eng. 2021, 87, 103792. [Google Scholar] [CrossRef]
  26. Wakoh, H.; Hirano, T. Diffusion of leaked flammable-gas in soil. J. Loss Prev. Process Ind. 2011, 4, 260–264. [Google Scholar] [CrossRef]
  27. Bonnaud, C.; Cluzel, V.; Corcoles, P.; Dubois, J.P.; Louvet, V.; Maury, M.; Narbonne, A.; Oréfice, H.; Perez, A.; Ranty, J.; et al. Experimental study and modelling of the consequences of small leaks on buried transmission gas pipeline. J. Loss Prev. Process Ind. 2018, 55, 303–312. [Google Scholar] [CrossRef]
  28. Chamindu, K.; Smits, K.M.; Oldenburg, C.M. Effect of subsurface soil moisture variability and atmospheric conditions on methane gas migration in shallow subsurface. Int. J. Greenh. Gas Control 2016, 55, 105–117. [Google Scholar] [CrossRef]
  29. Bezaatpour, J.; Fatehifar, E.; Rasoulzadeh, A. CFD investigation of natural gas leakage and propagation from buried pipeline for anisotropic and partially saturated multi-layer soil. J. Clean. Prod. 2020, 277, 123940. [Google Scholar] [CrossRef]
  30. Ebrahimi-Moghadam, A.; Farzaneh-Gord, M.; Deymi-Dashtebayaz, M. Correlations for estimating natural gas leakage from above-ground and buried urban distribution pipelines. J. Nat. Gas Sci. Eng. 2016, 34, 185–196. [Google Scholar] [CrossRef]
  31. Ebrahimi-Moghadam, A.; Farzaneh-Gord, M.; Arabkoohsar, A.; Moghadam, A.J. CFD analysis of natural gas emission from damaged pipelines: Correlation development for leakage estimation. J. Clean. Prod. 2018, 199, 257–271. [Google Scholar] [CrossRef]
  32. Bu, F.X.; Chen, S.Q.; Liu, Y.; Guan, B.; Wang, X.W.; Shi, Z.C.; Hao, G.W. CFD analysis and calculation models establishment of leakage of natural gas pipeline considering real buried environment. Energy Rep. 2022, 8, 3789–3808. [Google Scholar] [CrossRef]
  33. Bu, F.X.; Liu, Y.; Chen, S.Q.; Xu, Z.; Liu, Y.B.; Jiang, M.H.; Guan, B. Analysis and prediction of methane invasion distance considering real ground boundary. ACS Omega 2021, 6, 29111–29125. [Google Scholar] [CrossRef] [PubMed]
  34. Zhu, J.L.; Pan, J.; Zhang, Y.X.; Li, Y.X.; Li, H.; Feng, H.; Chen, D.S.; Kou, Y.M.; Yang, R. Leakage and diffusion behavior of a buried pipeline of hydrogen-blended natural gas. Int. J. Hydrog. Energy 2023, 48, 11592–11610. [Google Scholar] [CrossRef]
  35. Fu, H.; Yang, L.; Liang, H.R.; Wang, S.; Ling, K.G. Diagnosis of the single leakage in the fluid pipeline through experimental study and CFD simulation. J. Pet. Sci. Eng. 2020, 193, 107437. [Google Scholar] [CrossRef]
  36. Deng, Y.J.; Hu, H.B.; Yu, B.; Sun, D.L.; Hou, L.; Liang, Y.T. A method for simulating the release of natural gas from the rupture of high-pressure pipelines in any terrain. J. Hazard. Mater. 2018, 342, 418–428. [Google Scholar] [CrossRef] [PubMed]
  37. Bu, F.X.; Liu, Y.; Liu, Y.B.; Xu, Z.; Chen, S.Q.; Jiang, M.H.; Guan, B. Leakage diffusion characteristics and harmful boundary analysis of buried natural gas pipeline under multiple working conditions. J. Nat. Gas Sci. Eng. 2021, 94, 104047. [Google Scholar] [CrossRef]
  38. Montiel, H.; Vílchez, J.A.; Casal, J.; Arnaldos, J. Mathematical modelling of accidental gas releases. J. Hazard. Mater. 1998, 59, 211–233. [Google Scholar] [CrossRef]
  39. Luo, J.H.; Zheng, M.; Zhao, X.W.; Huo, C.Y.; Yang, L. Simplified expression for estimating release rate of hazardous gas from a hole on high-pressure pipelines. J. Loss Prev. Process Ind. 2006, 19, 362–366. [Google Scholar] [CrossRef]
  40. GB 50028-2006; Code for Design of City Gas Engineering. Ministry of Construction of the People’s Republic of China: Beijing, China, 2006.
  41. Su, Y.; Li, J.F.; Yu, B.; Zhao, Y.L.; Han, D.X.; Sun, D.L. Modeling of Hydrogen Blending on the Leakage and Diffusion of Urban Buried Hydrogen-Enriched Natural Gas Pipeline. CMES-Comput. Model. Eng. Sci. 2023, 136, 1315–1337. [Google Scholar] [CrossRef]
  42. Launder, B.E. Current capabilities for modeling turbulence in industrial flows. Appl. Sci. Res. 1991, 48, 247–269. [Google Scholar] [CrossRef]
  43. Choi, S.K.; Kim, S.O. Turbulence modeling of natural convection in enclosures: A review. J. Mech. Sci. Technol. 2012, 26, 283–297. [Google Scholar] [CrossRef]
  44. Launder, B.E.; Spalding, D.B. The numerical computation of turbulent flows. Comput. Methods Appl. Math. 1974, 3, 269–289. [Google Scholar] [CrossRef]
  45. Zhang, J.W.; Yin, X.X.; Xin, Y.A.; Zhang, J.; Zheng, X.P.; Jiang, C.M. Numerical investigation on three-dimensional dispersion and conversion behaviors of silicon tetrachloride release in the atmosphere. J. Hazard. Mater. 2015, 288, 1–16. [Google Scholar]
  46. Wei, N.; Qiao, Y.; Liu, A.Q.; Zhao, J.Z.; Zhang, L.H.; Xue, J. Study on structure optimization and applicability of hydrocyclone in natural gas hydrate exploitation. Front. Earth Sci. 2022, 10, 991208. [Google Scholar] [CrossRef]
  47. Liu, Y.; Bu, F.X.; Chen, S.Q.; Jiang, M.H. Investigating effect of polymer concentrations on separation performance of hydrocyclone by sensitivity analysis. Energy Sci. Eng. 2021, 9, 1202–1215. [Google Scholar] [CrossRef]
  48. Nordlund, M.; Stanic, M.; Kuczaj, A.K.; Frederix, E.M.A.; Geurts, B.J. Improved PISO algorithms for modeling density varying flow in conjugate fluid-porous domains. J. Comput. Phys. 2016, 306, 199–215. [Google Scholar] [CrossRef]
  49. Jarrahian, A.; Heidaryan, E. A new cubic equation of state for sweet and sour natural gases even when composition is unknown. Fuel 2014, 134, 333–342. [Google Scholar] [CrossRef]
  50. Yan, Y.T.; Dong, X.Q.; Li, J.M. Experimental study of methane diffusion in soil for an underground gas pipe leak. J. Nat. Gas Sci. Eng. 2015, 27, 82–89. [Google Scholar] [CrossRef]
Figure 1. Comparison diagram of gas leakage diffusion stage and free dissipation stage.
Energies 17 03507 g001
Figure 2. Schematic diagram of the physical model.
Energies 17 03507 g002
Figure 3. Detailed information of grid generation.
Energies 17 03507 g003
Figure 4. (a) CH4 concentration comparison at sensor 3. (b) CH4 concentration comparison at sensor 14.
Energies 17 03507 g004
Figure 5. Cloud map of natural gas concentration distribution during leakage diffusion stage.
Energies 17 03507 g005
Figure 6. Cloud map of pressure distribution during free dissipation stage.
Energies 17 03507 g006
Figure 7. Cloud map of velocity distribution during free dissipation stage.
Energies 17 03507 g007
Figure 8. Streamline distribution during free dissipation stage.
Energies 17 03507 g008
Figure 9. Cloud map of concentration distribution during free dissipation stage.
Energies 17 03507 g009
Figure 10. Influence of leakage diffusion stage time on CH4 concentration distribution on monitoring line. (a) t = 1 min. (b) t = 10 min. (c) t = 30 min. (d) t = 60 min.
Energies 17 03507 g010
Figure 11. Impact of the pipeline’s pressure on the distribution concentration along the monitoring line. (a) t = 1 min. (b) t = 10 min. (c) t = 30 min. (d) t = 60 min.
Energies 17 03507 g011
Figure 12. Impact of leakage diameter on the CH4 concentration distribution along the monitoring line. (a) t = 1 min. (b) t = 10 min. (c) t = 30 min. (d) t = 60 min.
Energies 17 03507 g012
Figure 13. Impact of burial depth on CH4 concentration distribution along the monitoring line. (a) t = 1 min. (b) t = 10 min. (c) t = 30 min. (d) t = 60 min.
Energies 17 03507 g013
Figure 14. The impact of leakage direction on the spatial distribution of CH4 concentration on the monitoring line. (a) t = 1 min. (b) t = 10 min. (c) t = 30 min. (d) t = 60 min.
Energies 17 03507 g014
Figure 15. Impact of soil type on the spatial distribution of CH4 concentration along the monitoring transect. (a) t = 1 min. (b) t = 10 min. (c) t = 30 min. (d) t = 60 min.
Energies 17 03507 g015
Figure 16. Verification of natural gas concentration prediction model. (a) Case 5. (b) Case 9. (c) Case 10. (d) Case 14.
Energies 17 03507 g016
Figure 17. Calculation error of natural gas concentration prediction model.
Energies 17 03507 g017
Table 1. Definition of boundary conditions.
BoundaryTypeSetting Parameters
Pipe inletPressure inlet/wallPipeline operation pressure
Pipe outletPressure outletPipeline operation pressure
Leak holeInterior/
Ground surfacePressure outletAtmospheric pressure
Soil boundaryPressure outletAtmospheric pressure
Pipe wallWallNo slip, wall roughness
Table 2. Working conditions.
CaseLeakage Time
(T/min)
Pressure
(p/MPa)
Leakage Diameter
(d/mm)
Buried Depth
(H/m)
Leakage
Direction
Soil
Types
1100.3500.9UpLoam
2200.3500.9UpLoam
3300.3500.9UpLoam
4400.3500.9UpLoam
5500.3500.9UpLoam
6300.2500.9UpLoam
7300.25500.9UpLoam
8300.35500.9UpLoam
9300.4500.9UpLoam
10300.3100.9UpLoam
11300.3300.9UpLoam
12300.3700.9UpLoam
13300.3900.9UpLoam
14300.3500.3UpLoam
15300.3500.6UpLoam
16300.3501.2UpLoam
17300.3501.5UpLoam
18300.3500.9DownLoam
19300.3500.9SideLoam
20300.3500.9UpSand
21300.3500.9UpClay
Table 3. Grid independence verification.
LevelNumberLeakage Rate (kg/s)Error (%)
Level 1598,8620.006112/
Level 2980,6410.0058035.06
Level 31,423,0100.0056552.56
Level 41,799,1130.0055911.13
Level 52,231,0050.0055460.80
Table 4. Statistical test.
CoefficientEstimated ValueConfidence Interval
β 0 −21.69[−43.11, −3.58]
β 1 18.26[−4.37, 41.80]
β 2 41.88[21.65, 57.92]
β 3 39.47[29.01, 52.48]
β 4 −25.46[−30.08, −19.01]
β 5 −34.72[−37.20, −32.69]
R2 = 0.93F = 1.96 × 10³p = 0.001 < 0.05
Disclaimer/Publisher’s Note: The statements, opinions and data contained in all publications are solely those of the individual author(s) and contributor(s) and not of MDPI and/or the editor(s). MDPI and/or the editor(s) disclaim responsibility for any injury to people or property resulting from any ideas, methods, instructions or products referred to in the content.

