Article

Effect of Thickness on the Breakdown Characteristics of Organic Insulation Materials under Microsecond Pulse Voltage

Institute of Electronic Engineering, China Academy of Engineering Physics, Mianyang 621999, China
*
Author to whom correspondence should be addressed.
Energies 2024, 17(14), 3538; https://doi.org/10.3390/en17143538
Submission received: 24 June 2024 / Revised: 12 July 2024 / Accepted: 15 July 2024 / Published: 18 July 2024
(This article belongs to the Section F6: High Voltage)

Abstract

:
Thickness affects the electrical breakdown strength (EBD) of insulation materials, and the variation of EBD with thickness (d) is an important basis for insulation design. In this paper, the effect of d on three kinds of organic insulation materials (OIMs), namely polymethyl methacrylate (PMMA), polyetheretherketone (PEEK), and polyethylene terephthalate (PET), on their breakdown characteristics under microsecond pulse voltage (MSPV) was studied, and a breakdown probability prediction model was established based on Weibull distribution. The breakdown mechanisms of the OIMs under MSPV were also discussed. The results showed that the EBD of all three materials decreased with increasing d. The relationship between characteristic EBD and d all satisfied the inverse power model, and their inverse power coefficients were all close to 1/2.3, which was much larger than 1/8 for that under nanosecond pulse voltage. A general breakdown probability prediction model of the OIMs was established by combining the Weibull distribution and β = 2.3 so as to guide engineering design in the absence of basic test data under MSPV. The breakdown mechanism of the OIMs under MSPV was an energy-related composite physical breakdown mechanism, which was verified by analysis of energy accumulation characteristics and experimental evidence of the little influence of pulse width on EBD under MSPV. The research results lay the foundation for the insulation design and further study on the breakdown modeling of OIM under MSPV.

1. Introduction

Pulse power technology is widely used in plasma physics, accelerator technology, strong electromagnetic pulses, high-power microwaves, and other fields, providing transient high voltage, high current, and high power [1,2,3,4]. Nowadays, pulse power technology is developing towards high integration and miniaturization, higher energy density, and stronger peak power output. As the pulse power devices need to work reliably under higher voltage and current, there are higher requirements for the insulation performance of these devices [5,6,7]. Therefore, it is of great importance in pulse power technology to study the insulation characteristics of materials under pulse voltage.
OIMs are widely used in pulse power systems because of their good electrical insulating properties, excellent mechanical properties, and ease of processing and molding [8]. According to different application scenarios, the working pulse widths of the pulse power systems vary from microseconds to nanoseconds. The breakdown characteristics of OIMs under nanosecond pulsed voltage have been reported in several publications, and various influence factors such as material size and type, electrode material and structure, and voltage parameters have been studied in detail. Meanwhile, electrical breakdown models of OIMs under nanosecond pulse voltage have been established based on the experiment results and electrical breakdown theory [8,9,10,11]. These studies provide good support for the designs of the insulation systems under nanosecond pulse voltage. However, there are few research studies on the breakdown characteristics of OIMs under MSPV. Some researchers considered the power transformer insulation design under lightning and operation impulse voltages, for which both breakdown and surface flashover characteristics of oil–paper insulation were studied [12,13]. In addition, concerning the interterm insulation design of high-frequency power electronics transformers, researchers have studied the breakdown characteristics of OIMs under repeated MSPVs with different pulse repetition frequencies [14,15]. However, the breakdown mechanism of OIMs under repeated MSPV is mainly related to the thermal effect, and the relevant research results cannot be applied to the insulation designs for equipment that outputs a single MSPV or repeated MSPVs with very low frequency.
There are many factors affecting the breakdown characteristics of OIMs under MSPV, and material thickness is one of the key factors. In the traditional design of an insulation structure, the material thickness is often excessively increased to reduce the electric field strength (E) to ensure a large insulation margin. However, facing the demand for miniaturization and the increasing voltage level of pulse power systems, conservative insulation thickness settings may not be able to meet the system requirements of integration and power density. Therefore, it is of great significance to study the thickness effect on the EBD of OIMs under MSPV. The effects of thickness on the breakdown characteristics of OIMs under AC, DC, and nanosecond pulse voltages have been studied [9,16,17]. These results, however, cannot directly guide the MSPV insulation designs, as different power supply modes usually lead to different breakdown mechanisms and consequently different breakdown characteristics of the OIMS. There are also some publications that report the effects of electrode spacing on the breakdown characteristics of liquid dielectrics such as transformer oil [18] and hexatriacontane single crystal [19] under MSPV. However, the breakdown mechanism of liquid dielectric under MSPV is closely related to the beginning and development of the streamer, which is obviously different from the breakdown mechanism of OIMs under MSPV, and these research studies also cannot guide the use of OIMs under MSPV.
In order to obtain the effect of thickness on the breakdown characteristics of OIMs under MSPV, three typical OIMs, namely PMMA, PEEK, and PET, were selected to perform breakdown experiments under MSPV in this study. The effect of thickness on breakdown voltage (UBD) and EBD of the OIMs under MSPV was analyzed, and a breakdown probability prediction model was established based on the Weibull distribution. The breakdown mechanisms of the OIMs under MSPV were also investigated based on the energy accumulation characteristics and the breakdown characteristics under MSPVs with different pulse widths. The herein results lay a foundation for the insulation system design and further study on the breakdown modeling of the OIMs under MSPV.

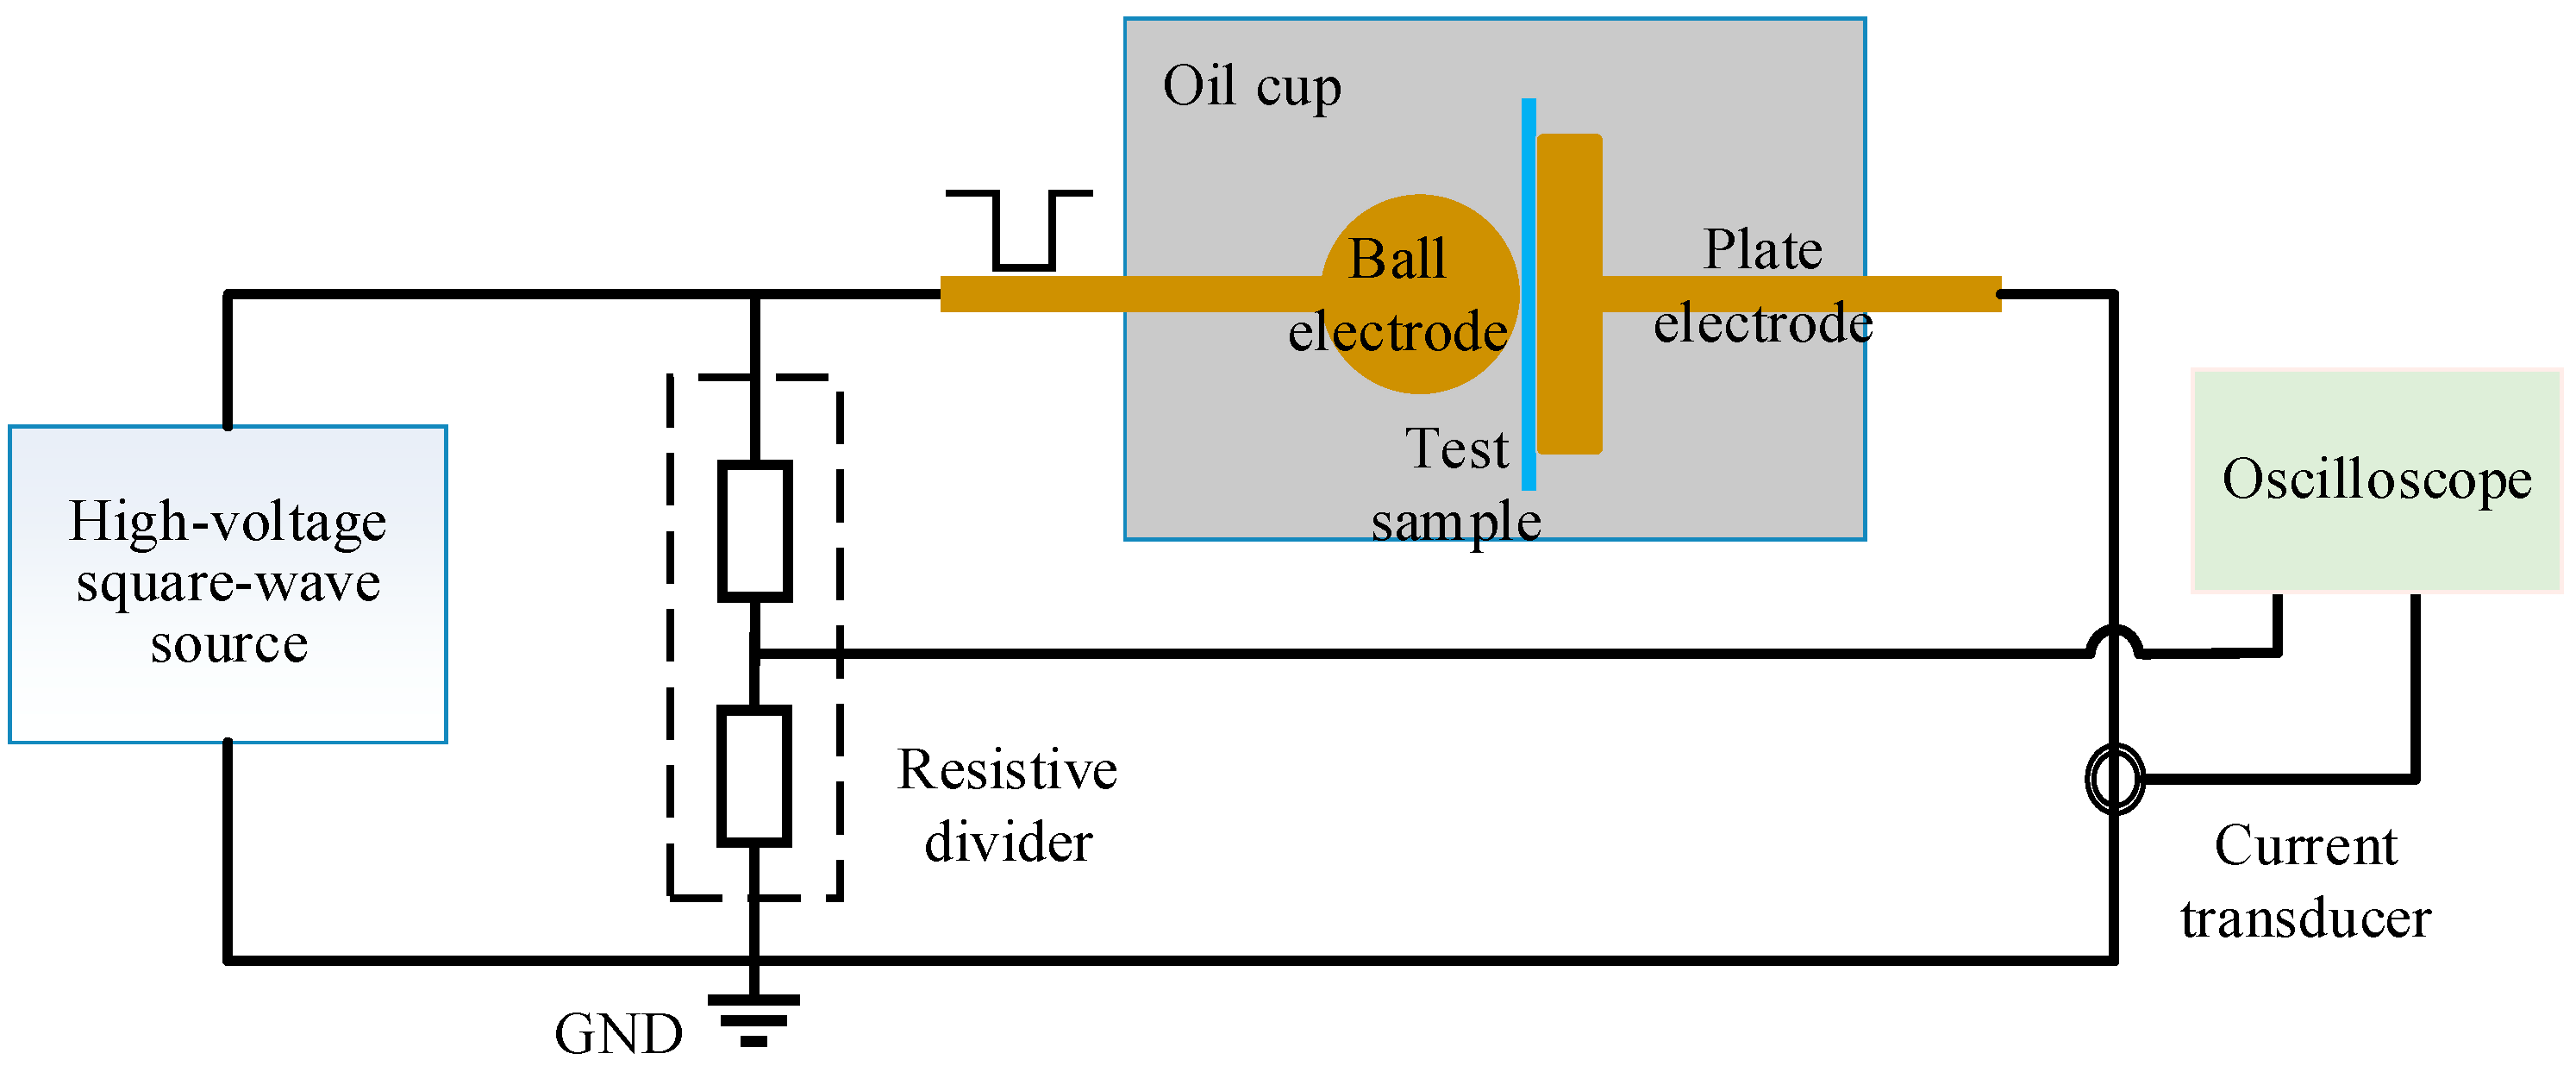
2. Experimental Setup

Each kind of insulation material was processed into circular samples with a diameter of 70 mm and with five different thicknesses, namely 0.4 mm, 0.7 mm, 1 mm, 1.3 mm, and 1.6 mm. All the materials were provided by Yihang Co., Ltd. Shenzhen, China, and the glass transition temperatures are 105 °C, 83 °C, and 143 °C for PMMA, PET, and PEEK, respectively. Before the experiment, all samples were cleaned, dried in a vacuum oven at 70 °C for 24 h, and finally stored in a drying cabinet before use. The vacuum drying temperature was set to be below the glass transition temperature to avoid undesirable changes in the chemical compositions and aggregate structures of the materials. The ball–plate electrode system was selected according to the recommendation of IEC 60243-1:2013 [20], as shown in Figure 1. The diameter of the ball electrode was 20 mm, the diameter of the plate electrode was 25 mm, and the edge chamfer radius of the plate electrode was 2.5 mm. The whole electrode system as well as the test sample were immersed in well-processed Karamay 25# transformer oil, whose MSPV EBD was 90 kV/mm and relative dielectric constant was 2.2. During the experiment, the ball electrode was connected to MSPV, and the plate electrode was grounded. The voltage and current signals were collected by a resistive divider with a ratio of 5000:1 and a current transducer with a ratio of 0.1 V/A and monitored by an oscilloscope.
During the breakdown experiment, a high-voltage square-wave source with adjustable amplitudes and pulse widths was used to output negative MSPVs. The width of the applied MSPV was 8 μs, and the rising and falling edges were 0.7 μs and 0.5 μs, respectively. Only the pulse amplitude was changed during the whole experiment. According to IEC 60243-3:2013 [21], three pulses with a one-minute interval were applied at each voltage amplitude. The amplitude of the voltage was initially set at about 70% of the predicted UBD, which was then increased by 5~10% of the initial voltage. The breakdown test was considered effective only when breakdown took place at the third or subsequent voltage level. Once there was a qualified breakdown, the amplitude of the voltage waveform was recorded as UBD, and the occurrence time of the breakdown was also recorded. Each kind of sample was tested nine times in parallel.

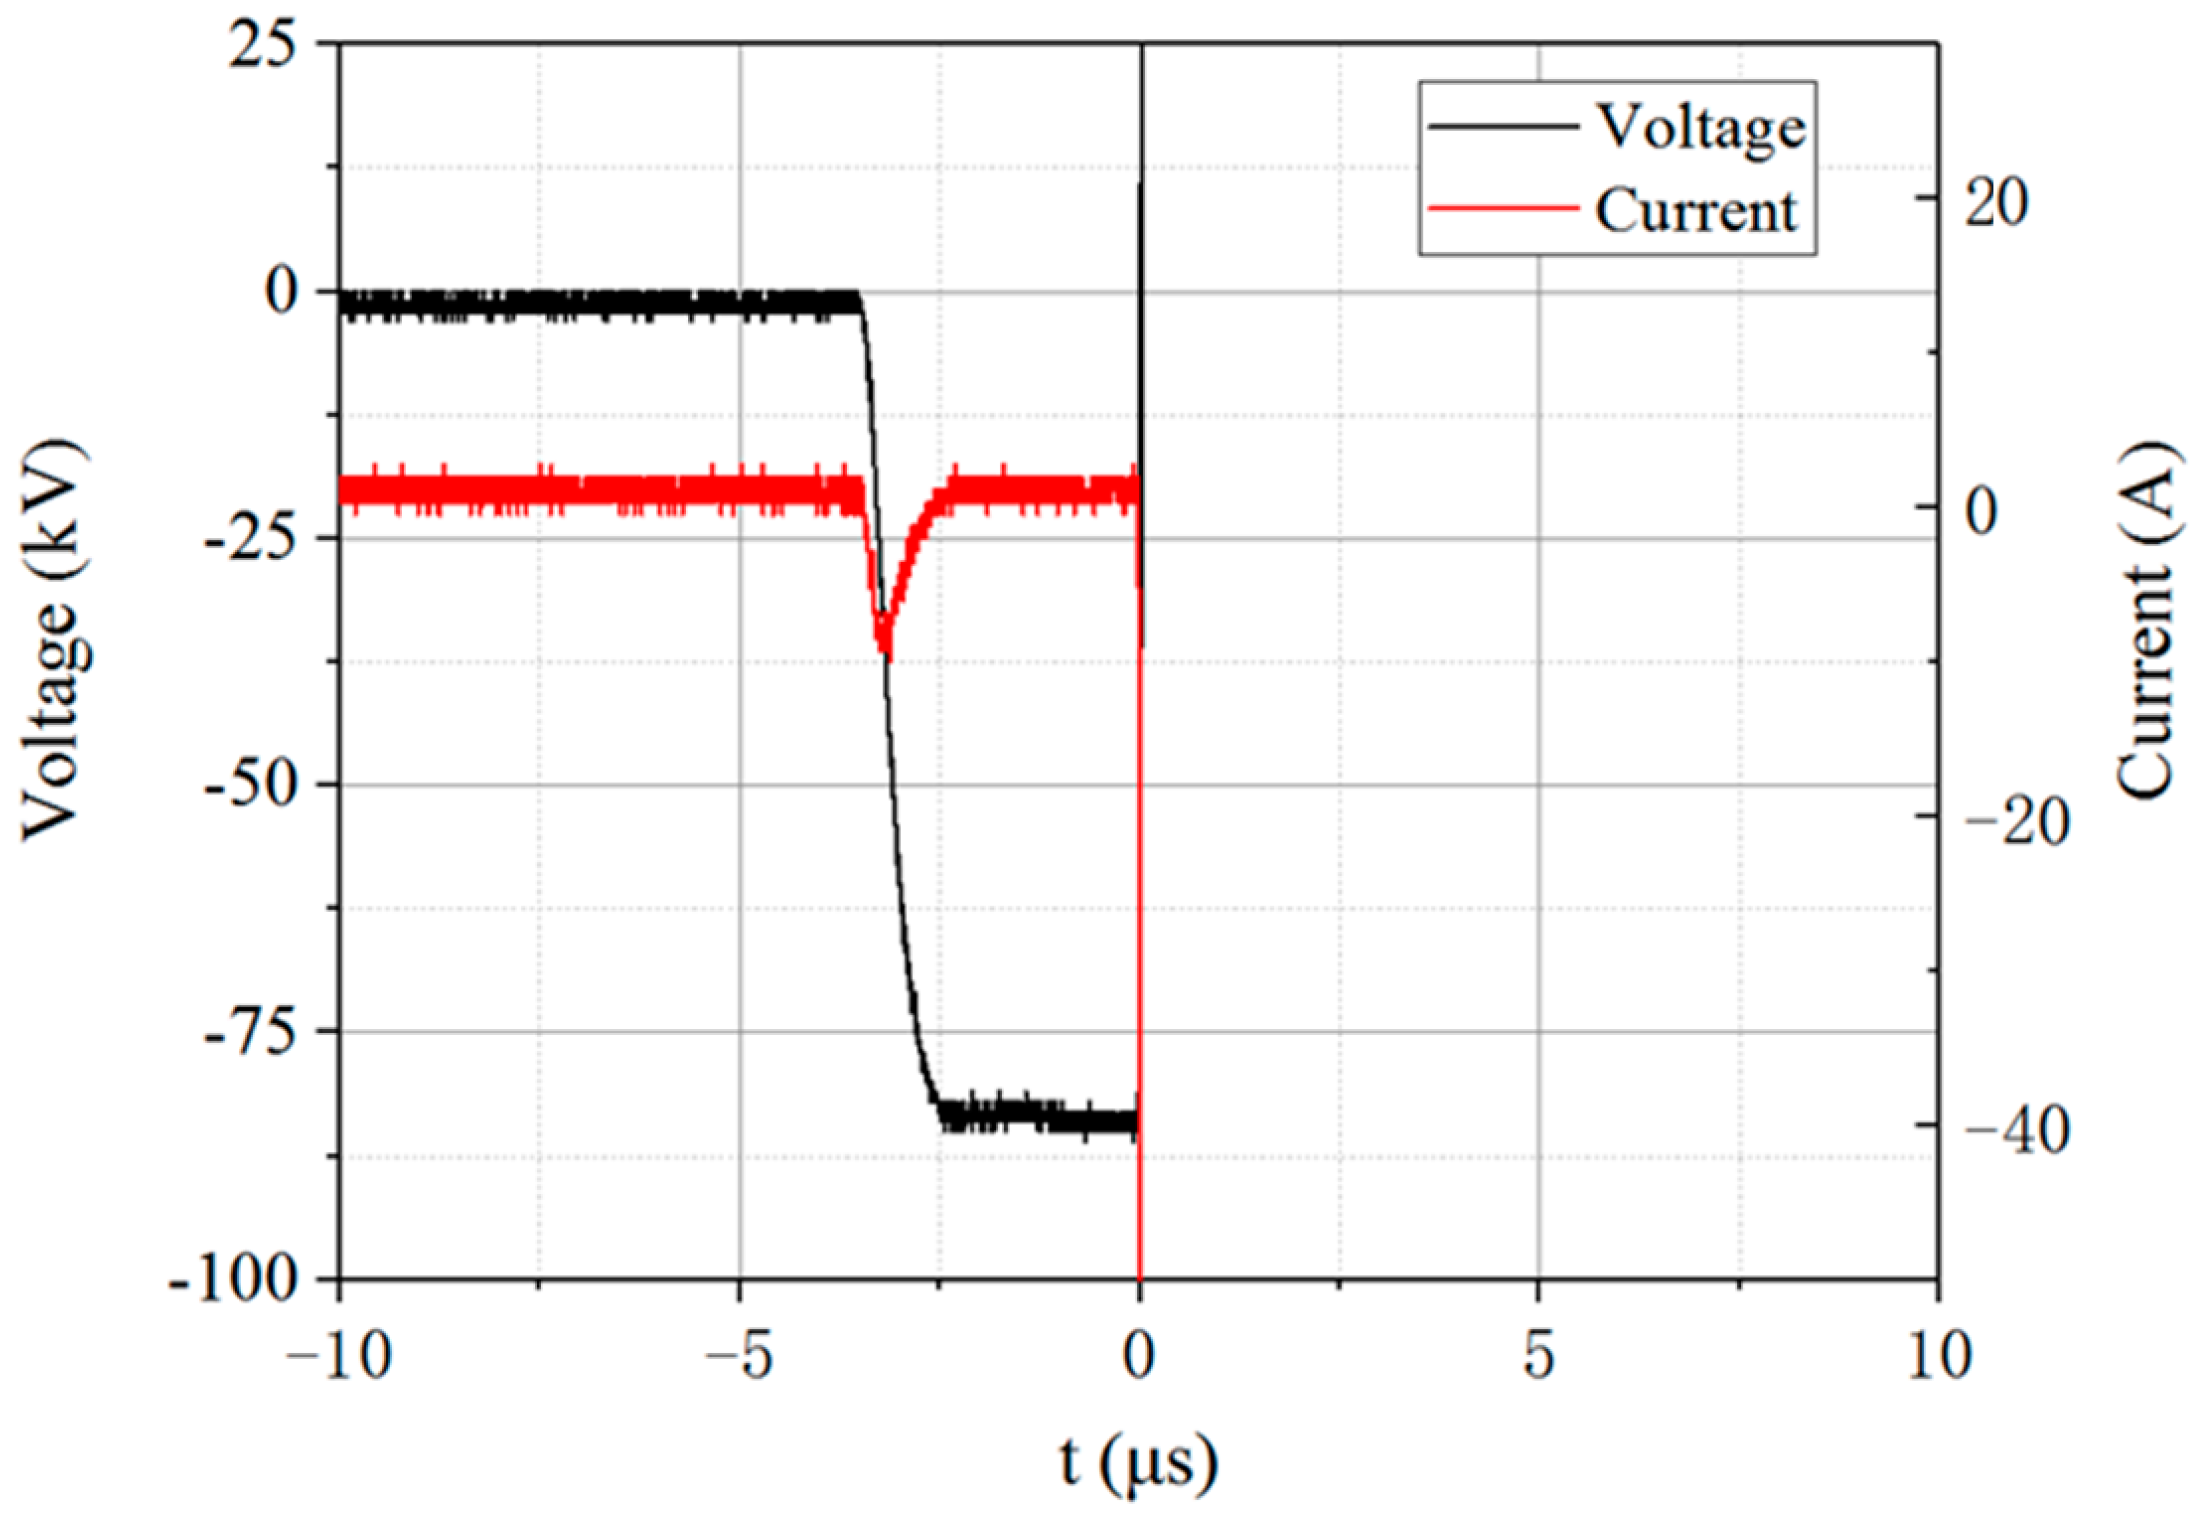
3. Experimental Results

Typical breakdown voltage and current waveforms are shown in Figure 2. For the three materials, breakdown always occurred at least 2 μs after the voltage reached the maximum value.
Figure 3 shows the evolution trends of UBD and EBD with d, where the data points are average values and the error bars are standard deviations. As the electric field distribution of the ball–plate electrode was generally uniform, EBD could be directly calculated by dividing UBD by d. It could be seen that, in general, UBD of the three materials all increased with increasing d, and UBD (PMMA) > UBD (PET) > UBD (PEEK). The EBD of the three materials decreased with the increase of d, and the decrease value of the EBD became smaller with the increase of d. In general, EBD (PMMA) > EBD (PET) > EBD (PEEK).

4. Effect of Thickness on Breakdown Characteristics

4.1. Theoretical Analysis

The breakdown data of a solid dielectric under pulse voltage usually satisfy the Weibull distribution [8], whose probability distribution function is as follows:
F ( E ) = 1 exp ( ( E α ) β )
where E is the applied electric field, α is the scale parameter and represents the E under which the breakdown probability is 63.2%, and β is the dimension parameter. The larger β is, the smaller the dispersion of the data is. At the same time, β also reflects the failure mechanism of the system. For insulation systems with the same breakdown mechanism, β should be the same or at least similar.
The insulation material with thickness d can be regarded as a composite composed of N materials with thickness d0 in series, where d = Nd0. For the material with d0, its non-breakdown probability is as follows:
R 0 ( E ) = 1 F ( E ) = exp ( ( E α ) β )
Therefore, the non-breakdown probability and breakdown probability for the sample with d can be obtained, shown as Equations (3) and (4), respectively.
R N ( E ) = R 0 ( E ) N = ( exp ( ( E α ) β ) ) N = exp ( E β α β / N ) = exp ( E α / N 1 / β ) β
F N ( E ) = 1 R N ( E ) = 1 exp ( E α / N 1 / β ) β
By comparing Equation (1) with Equation (4), the following can be obtained:
E B D N = α / N 1 / β
By substituting d = Nd0 into Equation (5), the following can be obtained:
E B D N = E B D 0 ( d 0 / d ) 1 / β
When d0 is the unit thickness (such as 1 mm), the following can be obtained:
E B D N = E B D 0 d 1 / β
According to Equation (7), the relationship between EBD and d satisfies the inverse power model. Taking a logarithmic operation on both sides of Equation (7), the following can be obtained:
log E B D = C 1 β log d
where C = logEBD0. That is, EBD and d should present a linear relationship in the logarithmic coordinates. In addition, it can be seen from Equation (7) that the larger β is, the stronger the decreasing trend of EBD with d is.

4.2. Analysis of the Relationship between EBD and d

According to the data sets of EBD for samples with different d and kinds of materials, the Weibull cumulative failure probability diagrams were drawn and shown as Figure 4. The maximum likelihood method was used to estimate the parameters of the Weibull distribution, and the values of α and β were obtained as shown in Table 1. βm was the average value of β obtained from samples with the same material and different d. It can be seen that α of all the materials decreased with increasing d, and α (PMMA) > α (PET) > α (PEEK) for the samples with the same d.
The Fitting results for the relationship between EBD and d were shown as Figure 5, and the parameters of Equation (8) were obtained, as shown in Table 2. It could be seen that all the data for the three materials had good fitting results, and the goodness of fit was all better than 0.95. Moreover, the inverse power coefficients 1/β were close to each other for three materials, the average value of which was 1/2.3. β can represent the failure mechanism of material according to its definition in the Weibull distribution. Since the β values of all three typical OIMs were highly similar, it is reasonable to consider that 1/2.3 could represent the inverse power coefficient of the relationship between EBD and d for OIMs under MSPV.
Zhao et al. studied the thickness effect on EBD of the OIMs under nanosecond pulse voltage [9] and concluded that the β value of the OIMs under nanosecond pulse voltage was about 8, which was much higher than the 2.3 obtained in this study. The testing settings in Zhao’s study were almost the same as the settings in the current study, i.e., both tests used ball–plate electrodes, and samples were immersed in transformer oil during the breakdown testing. Therefore, the two sets of test data can be compared. It can be seen that though EBD of OIM decreased with the increase of d both under MSPV and nanosecond pulse voltage, the decrease trend of EBD with the increasing d under MSPV was more significant than that under nanosecond pulse voltage. This result implied that the breakdown mechanism of the OIMs under MSPV was significantly different from that under nanosecond pulse voltage, which would be discussed in the next two sections.

4.3. Prediction of Breakdown Probability of OIM under MSPV

In the insulation design of actual high-voltage equipment, derating design is usually adopted to improve the insulation reliability of products. By substituting the derating factors η = E/α and β = 2.3 into Equation (1), the following equation can be obtained:
F ( η ) = 1 exp ( η 2.3 )
According to Equation (9), the breakdown probabilities at different η can be predicted, as shown in Figure 6. Insulation systems in different applications had different reliability requirements [22,23], and the breakdown probability was considered to be less than 1% in this paper. As could be seen from Figure 6, when η was 0.5, the breakdown probability was about 18%, which was much greater than the required value. Therefore, greater derating was needed in engineering design, according to this result. However, it should be noted that β = 2.3 was a theoretical derivation value. According to the definition of β in Weibull distribution, β could also be used to represent the material quality. The greater the material quality, the smaller the dispersion of EBD data, and the larger the β were. Therefore, β = 2.3 could be considered the minimum requirement for the quality of material used under MSPV. Table 1 showed the β obtained from the test data were all much higher than 2.3 for the three materials, indicating the good qualities of the materials. Figure 6 also showed the calculated breakdown probability of PMMA according to the corresponding βm in Table 1, which was about 1% when η is 0.7. Therefore, in order to avoid leaving too much margin in the actual engineering design, insulation designs should be conducted according to the statistical results of the actual test data. Whereas β = 2.3 can be used to guide the engineering design when there is a lack of test data.

5. Discussion on the Breakdown Mechanism of OIM under MSPV

5.1. Electric Breakdown

The electrical breakdown mechanisms of OIM are divided into intrinsic breakdown and avalanche breakdown, which were established on the basis of gas collision–ionization breakdown. The EBD of intrinsic breakdown is in the order of 1000~10,000 kV/mm, which is much higher than the EBD obtained in this study. The breakdown mechanism of the OIMs under MSPV should not be an intrinsic breakdown. Instead, the OIM breakdown may conform to the collision–ionization avalanche breakdown theory [8]. The collision–ionization avalanche breakdown process starts with the generation of seed electrons, and the atoms/molecules continuously collide with electrons and are ionized under the acceleration of the electric field. More free electrons are generated, eventually leading to electron avalanche formation, and the dielectric breaks down when the electron avalanche reaches the anode. The breakdown mechanism for OIM under nanosecond pulse voltage has been demonstrated to be electrical breakdown [8].
Usually, when the applied voltage reaches the UBD, electrical breakdown will not immediately occur, and a certain discharge development time is required, which is called discharge delay (td) [24]. td is divided into two periods, namely discharge statistical delay (ts) and formation delay (tf), as follows:
t d = t s + t f
where ts refers to the duration time from the moment when the applied voltage reaches the UBD to the moment when an effective seed electron generates, and tf refers to the time token from the seed electron generation to the completion of breakdown. For solid dielectric, a minimum electric field strength EBDmin is required for the generation of electron avalanches, and the corresponding td is the maximum formation delay tdmax. According to the mechanism of electrical breakdown, as long as the pulse width tw of the pulse voltage is greater than tdmax, EBD is theoretically independent of tw. When tw is less than tdmax, the smaller the tw is, the larger the EBD is [25]. The relationship between EBD and tw is shown in Equation (11), where r is a constant.
E B D = { E B D 1 t w r ( t w t d max ) E B D c ( t w > t d max )
In publication [24], ts and tf for intrinsic electric breakdown of solid dielectric are derived from Equations (12) and (13) respectively, where vav is the average development velocity of electron avalanche, λfp is the average free path of electrons between two adjacent ionization events, ncrit is the critical number of electrons in electron avalanche during the breakdown, and vdis,c is the cathode discharge velocity. For the OIMs, tf and ts for samples with thicknesses between 0.01 mm and 0.5 mm were calculated to be 1~50 ns and 0.65~10.5 ns [24], respectively.
t f = d / v a v
t s = 1.44 λ f p ln n c r i t / v d i s , c
According to Equation (12), tf is proportional to d, so tf of the samples with the thicknesses of 0.4 mm~1.6 mm in this paper was estimated to be 40~160 ns. According to Equation (13), ts is independent of d. Assuming ts is 10.5 ns, td is estimated to be 50.5~170.5 ns in this study. According to the experimental phenomena, the actual td for all three materials was mostly greater than 2 μs, which was much larger than the calculated values. Hence, the breakdown mechanism of the OIMs under MSPV is not pure electrical breakdown.

5.2. The Space Charge Effect

The space charge effect is an important secondary factor affecting the process of electrical breakdown. The space charge in the dielectric is formed by the electrode injection under a strong electric field, which affects EBD by changing the electric field distribution in the dielectric [26]. It takes time for the injection and accumulation of the space charge in the dielectric before the space charge can affect EBD. It was reported that the duration time for voltage application was at least 60 μs for polyethylene when there was a significant space charge effect on EBD under MSPV [27]. This time was much longer than the tw used in this study. In addition, the EBD of the OIMs in this study was much lower than that of the thin-film sample used in publication [27], so more time was expected to form a significant space charge effect in the OIMs. Therefore, although the OIMs herein studied were different from polyethylene, it is inferred that a large tw greater than 60 μs should be needed to form a significant space charge effect in these OIMs. Therefore, the space charge effect on the breakdown can be excluded.

5.3. Pulse Thermal Breakdown

Thermal breakdown refers to the breakdown process when the accumulated heat in the dielectric caused by leakage current and polarization relaxation loss is greater than a critical value, the thermal balance is disrupted, and the breakdown happens at a sharply increased temperature. Under a pulse voltage, the heat dissipation can be ignored, and the thermal breakdown in this case is called the pulse thermal breakdown. When the breakdown test is conducted at room temperature, the EBD of the pulse thermal breakdown can be approximately calculated as follows [26]:
E B D ( 3 C V T 0 2 σ 0 A t r ) 1 2 e A / 2 T 0
where T0 is the ambient temperature, σ0 is the effective conductivity, including leakage current and polarization relaxation loss, CV is the specific heat capacity, A is a constant, and tr is the rise time of pulse voltage. As can be seen from Equation (14), the EBD of pulse thermal breakdown is independent of d. However, the EBD of the three materials all increases with the increase of d in the current study, so the breakdown mechanism of the OIMs under MSPV is not a pure thermal breakdown.

5.4. Electromechanical Breakdown

When the E is large enough, the electrostatic force will cause the stress–strain change and the local stress concentration in the dielectric, which can cause micro-cracks; the micro-cracks will expand gradually under the electrostatic force as well as mechanical stress and eventually lead to dielectric breakdown. This type of breakdown mechanism is called electromechanical breakdown. EBD for electromechanical breakdown can be estimated by Equation (15) [28], where Y is Young’s modulus and ε0 and εr are the dielectric constant of air and the relative dielectric constant of dielectric, respectively.
E B D = 0.6 Y ε 0 ε r
As can be seen from Equation (15), the EBD of electromechanical breakdown is independent of thickness. In addition, the calculated EBD of electromechanical breakdown for the OIMs is usually greater than 400 kV/mm [28], which is much higher than that measured in this study. Therefore, the breakdown mechanism of the OIMs under MSPV is not a pure electromechanical breakdown.

5.5. Breakdown Mechanism Speculaiton

From the above discussion, it can be seen that a single breakdown mechanism, including electrical breakdown, space charge effect, thermal breakdown, and electromechanical breakdown, cannot explain the breakdown phenomena of the OIMs under MSPV. Therefore, the breakdown mechanism of the OIMs should be a composite physical breakdown mechanism.
Regardless of a specific physical breakdown mechanism, the breakdown of the OIMs under a strong electric field can be regarded as a process of energy accumulation and release. According to this concept, Pitike and Hong established a breakdown model based on a phase-field method to study the inception and development of electrical damage in the solid dielectric during the breakdown [29]. In this model, electrostatic energy was used as the kinetic energy for the inception and development of the discharge channel. The model also calculated the EBD of samples with different d, which showed that the relationship between EBD and d satisfied the inverse power model, with an inverse power coefficient close to 0.5. This coefficient was very close to the inverse power coefficient (1/2.3) obtained in this study, which confirmed that the breakdown of the OIMs under MSPV could be well explained by the energy-related composite physical breakdown mechanism. Therefore, it is necessary to analyze the energy accumulation characteristics of the OIMs to further understand the breakdown mechanism under MSPV, which will be discussed in the next section.

6. Analysis of Energy Accumulation Characteristics of OIM under MSPV

6.1. Theoretical Analysis of Energy Accumulation Characteristics

Heat generated by dielectric loss and electrostatic energy generated by the charging effect will accumulate in the dielectric under MSPV, and the dielectric loss can be divided into conductance loss and relaxation loss. According to the dielectric theory [26], the equivalent circuit diagram of the dielectric is shown in Figure 7. The conductivity loss mainly comes from the Joule heat generated by absorption current Ir, which forms under the applied electric field; the relaxation loss mainly comes from the energy consumed by dipole turning and interface polarization during the periodic polarization process, which can be equivalent to series connections of capacitor and resistor; and the corresponding current is absorption current Ic2. Electron displacement polarization and ion displacement polarization only take a very short time, resulting in the dielectric charging effect that generates no energy loss, which is equivalent to a pure capacitance branch, and the corresponding current is the instantaneous charging current Ic1.
When there is only a DC voltage applied, the loss is only the Joule heat loss of the resistance branch, and its power PDC can be expressed as follows:
P D C = U 2 / R 1
where R1 is the equivalent DC resistor in Figure 7. The corresponding power density PDDC can be obtained as Equation (17), where γ is the conductivity.
P D D C = γ E 2
The power corresponding to dielectric loss under a single AC component (PAC) can be expressed as follows:
P A C = V 2 ( 2 π f ) ( ε r C 0 ) tan δ
where V is the rms value of voltage, f is the voltage frequency, C0 is vacuum equivalent capacitance for dielectric, and tanδ is dielectric loss tangent. According to the Fourier transform, the pulse voltage used in this study is composed of several AC components with different frequencies, and the total PAC for AC components can be expressed as Equation (19), where the variables correspond to those under the AC component with frequency fn. The corresponding power density PDAC can be obtained from Equation (20).
P A C = n = 1 P A C n = n = 1 V n 2 ( 2 π f n ) ( ε r n C 0 ) tan δ n
P D A C = n = 1 E n 2 ( 2 π f n ) ( ε r ε 0 ) tan δ n
The energy density per unit volume wch stored in the dielectric by the charging effect is as follows:
w c h = 0.5 ε 0 ε r E 2
The corresponding power density PDch can be obtained by differentiating wch with respect to time, as follows:
P D c h = ε 0 ε r E t E
The total power density PDtotal can be obtained as follows:
P D t o t a l = P D D C + P D A C + P D c h

6.2. Analysis of Calculation Results of Energy Accumulation Characteristics

From the above analysis, it can be seen that under a fixed voltage waveform, the energy accumulation characteristics are mainly related to the γ, εr, and tanδ of the sample at different frequency voltages. Taking E in all three materials at 80 kV/mm as an example, the energy accumulation characteristics were calculated. The pulse voltage waveform was first decomposed by the Fourier transform, and the result is shown in Figure 8, where 0 Hz represents the DC component and others represent the AC component. It could be seen that when the frequency of the AC component was greater than 2.5 MHz, the amplitude was too small and could be ignored. Therefore, only the losses caused by voltage components with frequencies less than 2.5 MHz were calculated. The γ, εr, and tanδ for the three materials under different voltage frequencies were measured at room temperature by a broadband dielectric spectrometer, and the results are shown in Figure 9. According to the measured data, the calculated PDAC values were 9.1 × 10⁸ W/m3, 8.0 × 10⁸ W/m3, and 6.6 × 10⁸ W/m3 for all AC components of PMMA, PET, and PEEK, respectively. The PDDC were 1.31 W/m3, 0.89 W/m3, and 1.53 W/m3 for PMMA, PET, and PEEK, respectively. Therefore, compared with the loss generated by AC components, the conductance loss caused by DC components could be ignored for all three materials.
According to Figure 9, εr of all the three materials increases with decreasing f when f is smaller than 2.5 MHz. For the convenience of calculation, εr at 2.5 MHz was used to calculate the PDch during the whole voltage application process, and the results calculated by Equation (22) are shown in Figure 10a. It should be pointed out that εr for the voltage frequencies lower than 2.5 MHz were actually larger than those used in the calculation, so the calculation results would be slightly smaller than the actual values. As can be seen from Figure 10a, all the PDch at the voltage front edge were larger than 8.0 × 10¹⁰ W/m3 for the three materials, which were much larger than their PDAC. Furthermore, PDch and PDAC were integrated with time, respectively, and the curves of dielectric loss heating energy density wdl and charging energy density wch with time were obtained, as shown in Figure 10b. It could be seen that, for all three materials, wch increased sharply at the front edge of the voltage and hardly increased after the voltage rose to the maximum value; wdl increased slowly with time, yet far less than wch during the whole voltage loading time. Therefore, the accumulated energy in the dielectric under the MSPV used in this study was mainly determined by the charging energy at the voltage front, and the pulse width should have little influence on the total accumulated energy. According to the discussion in Section 5, the breakdown mechanism under MSPV is a composite process of energy accumulation and release. It can be inferred that the pulse width has little effect on UBD under the MSPV used in this study.
In order to verify the above speculations, the breakdown experiments of the three OIMs with a thickness of 1 mm were carried out under MSPVs with a pulse width of 4 μs and 6 μs, respectively. The results were shown in Table 3, where the EBD data under pulse voltage with a pulse width of 8 μs was also shown for comparative analysis. The average EBD for the same material under MSPVs with three different pulse widths was close to each other, demonstrating that the pulse width of the MSPV has little effect on the EBD of the OIM and preliminary verifying the above speculation. In the future, by combining the above-mentioned energy accumulation model and the breakdown simulation method, such as the phase-field method, the breakdown mechanism will be further explored, and EBD will be quantitatively calculated under MSPV.

7. Conclusions

(1)
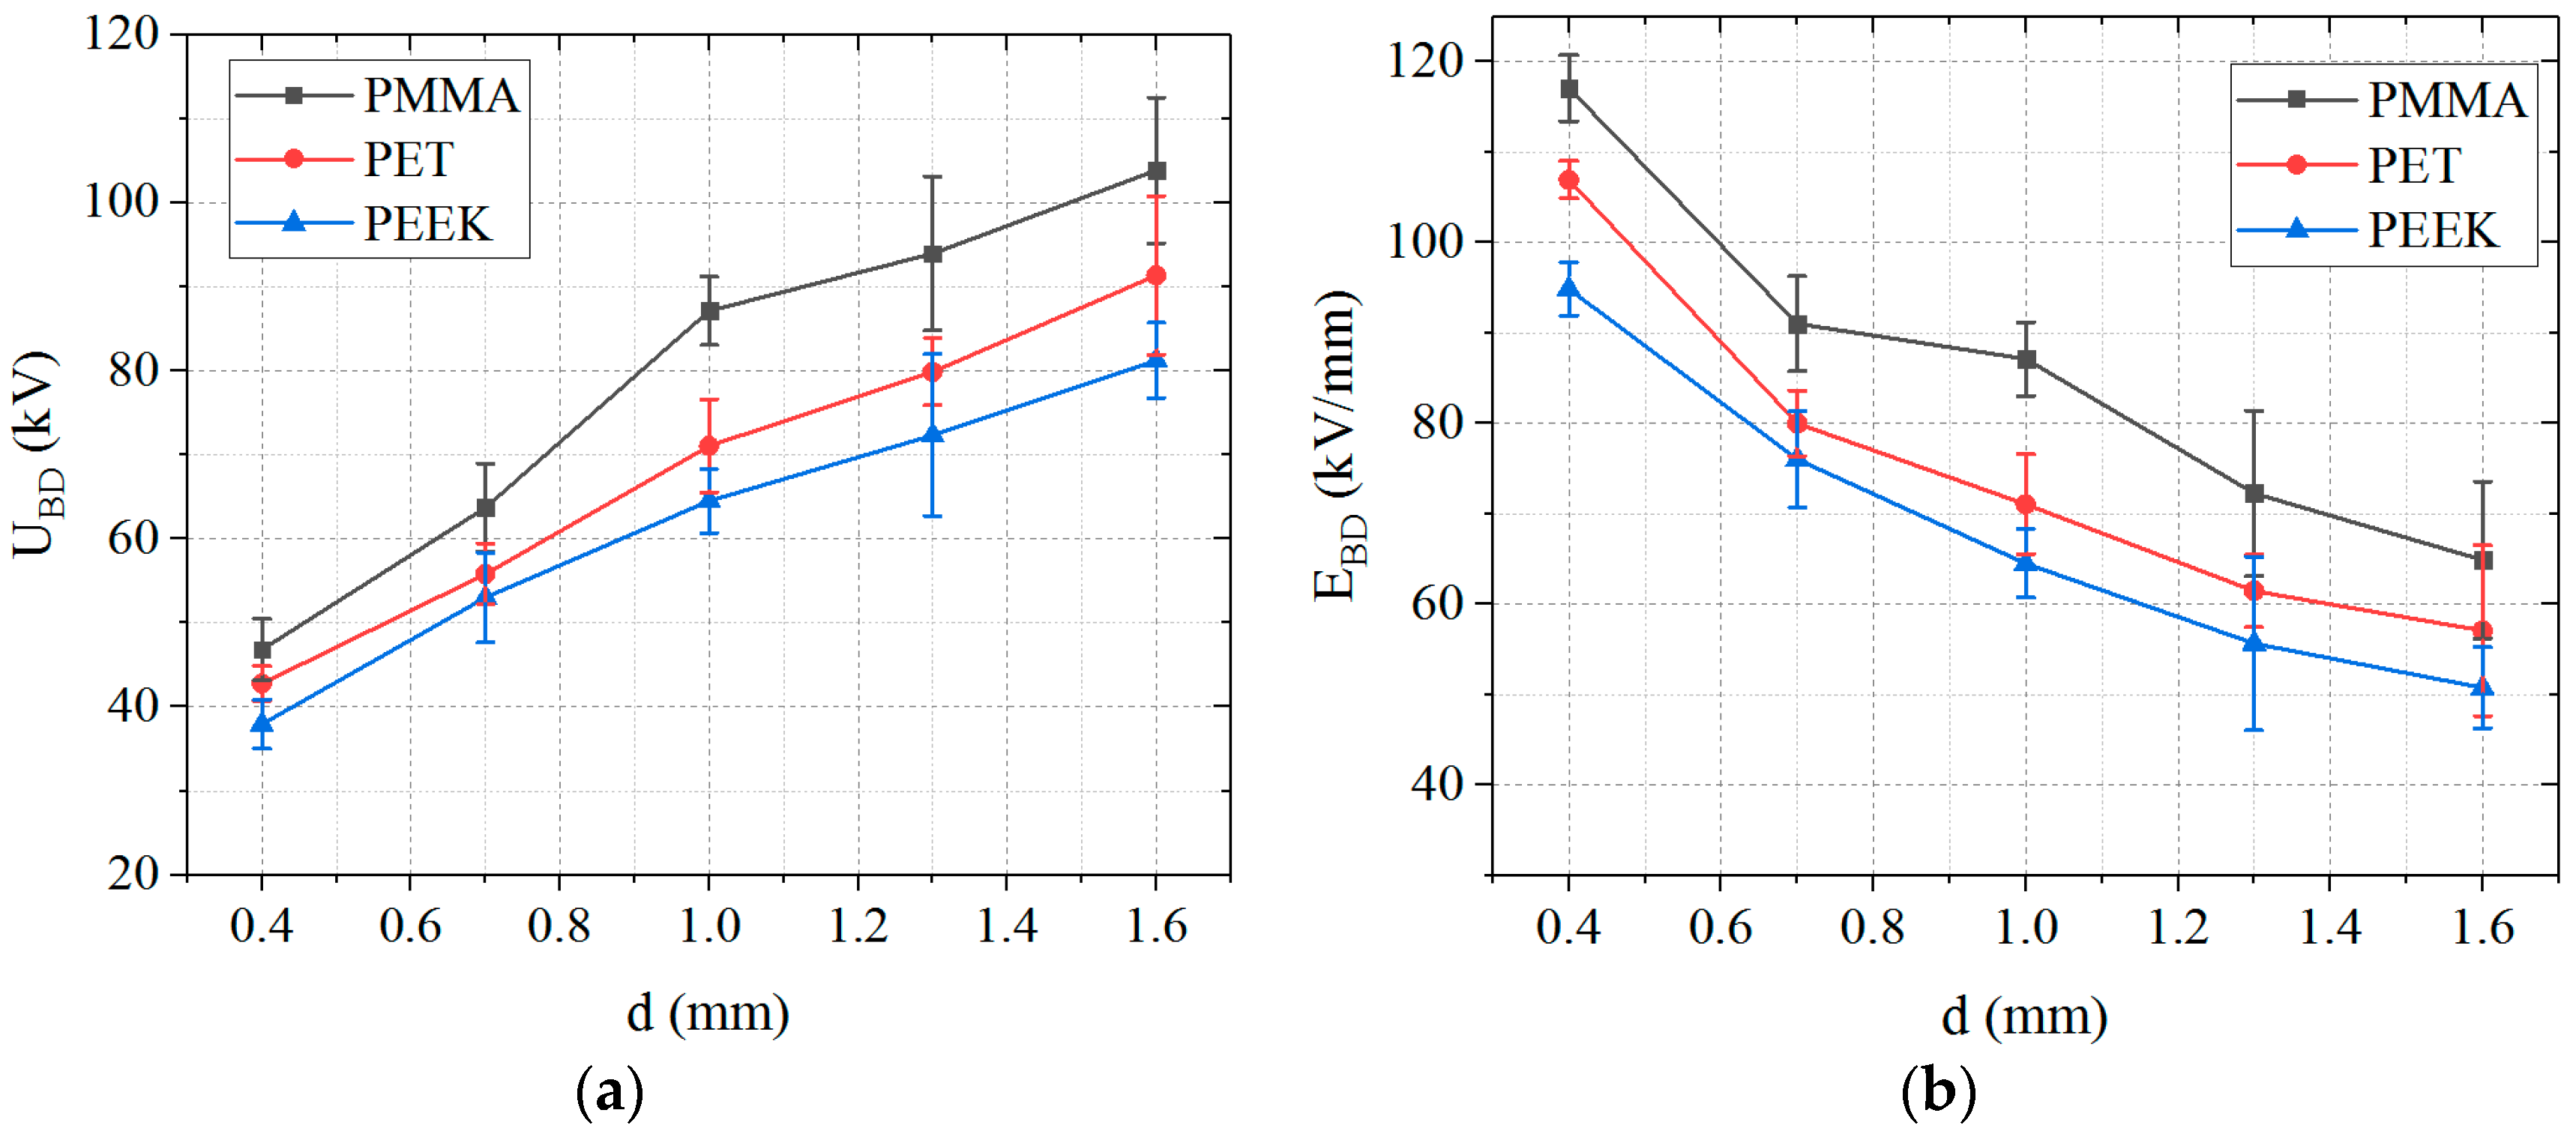
Under MSPV, the UBD of the three materials increased with the increment of d, and the corresponding EBD decreased with the increment of d. The decrease value of EBD became smaller with increasing d.
(2)
The relationship between the characteristic EBD and d satisfied the inverse power model for all the three materials under MSPV, and their inverse power coefficients were close to each other, with a value of about 1/2.3. This value was much larger than the inverse power coefficient under nanosecond pulse voltage, which meant that the decrease trend of EBD with the increase of d under MSPV was more pronounced than that under nanosecond pulse voltage, indicating a different breakdown mechanism of the OIMs under MSPV.
(3)
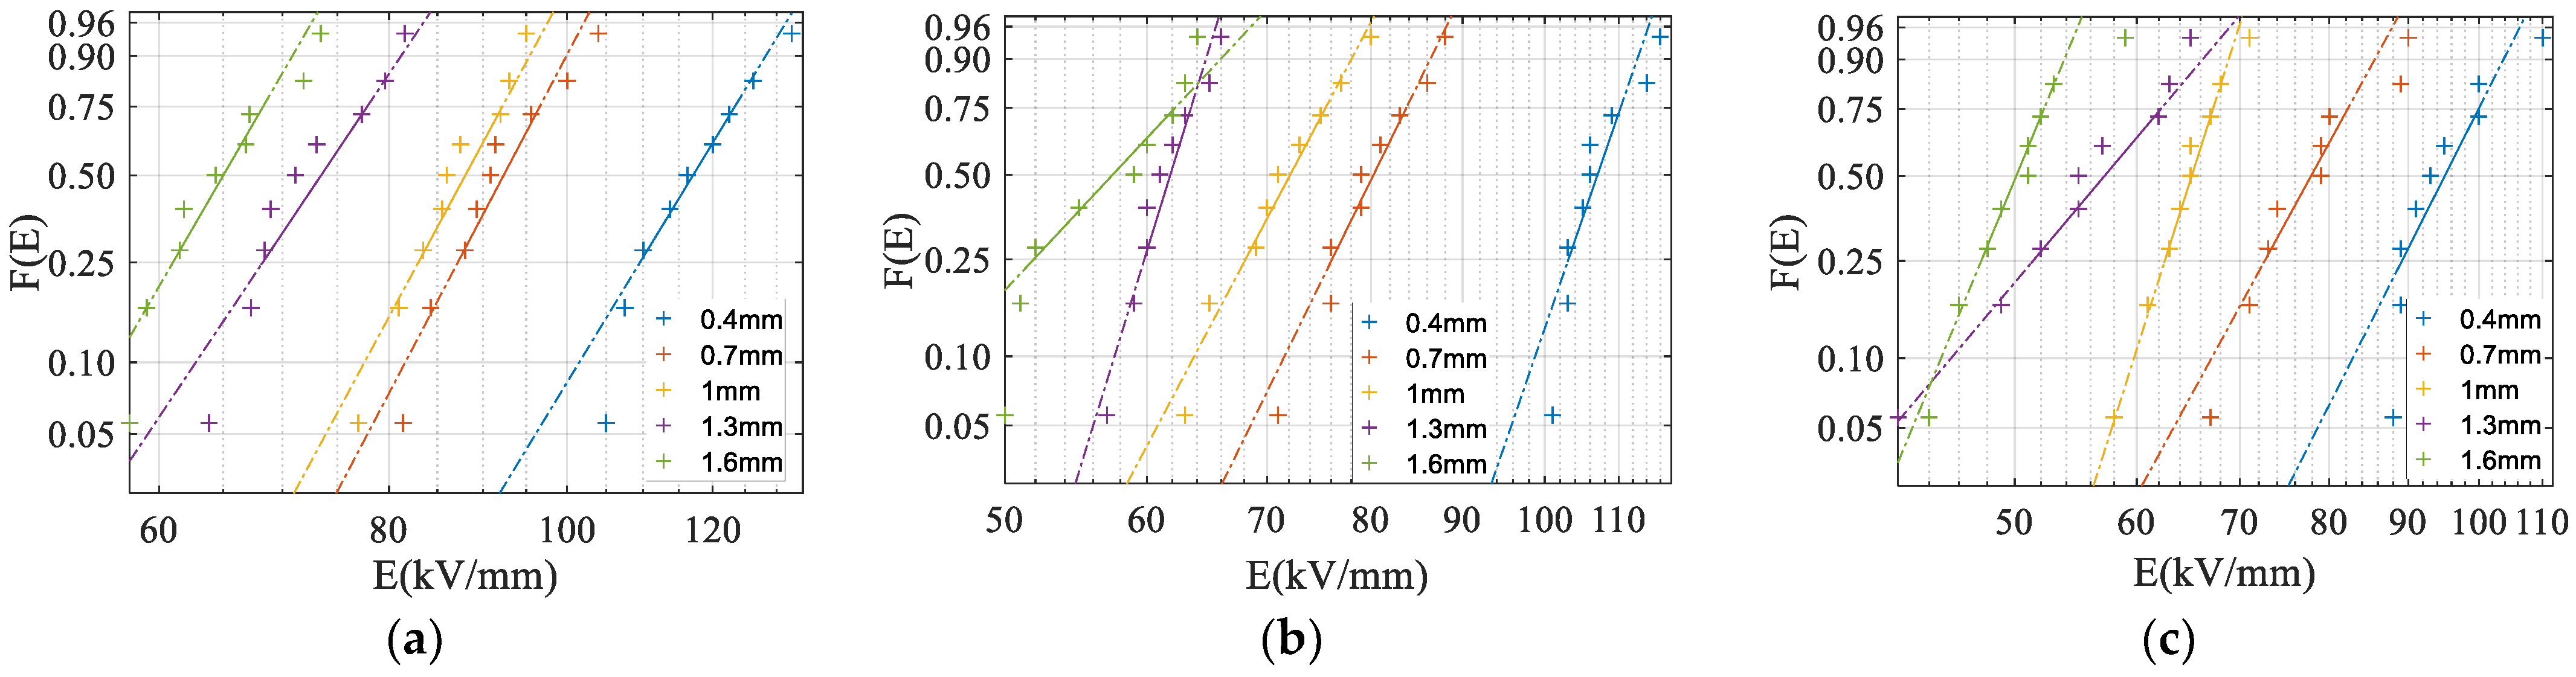
A general breakdown probability prediction model of the OIMs under MSPV was established based on the Weibull distribution and β = 2.3, which could be applied to guide engineering designs in the absence of basic test data.
(4)
The breakdown mechanism of the OIMs under MSPV was attributed to an energy-related composite physical breakdown mechanism, which was verified through analyses of the energy accumulation characteristics as well as the experimental evidence of the little influence of pulse width on EBD under MSPV.

Author Contributions

Conceptualization, X.L. (Xudong Li) and Y.L.; methodology, X.L. (Xudong Li); software, J.R. and H.B.; validation, X.L. (Xudong Li); formal analysis, X.L. (Xudong Li) and H.Z.; investigation, X.L. (Xudong Li), Y.L. and X.L. (Xin Liu); resources, X.L. (Xudong Li); data curation, X.L. (Xudong Li) and L.C.; writing—original draft preparation, X.L. (Xudong Li); writing—review and editing, X.L. (Xudong Li); visualization, Z.Z.; supervision, X.L. (Xudong Li); project administration, X.L. (Xudong Li); funding acquisition, X.L. (Xudong Li) and Y.L. All authors have read and agreed to the published version of the manuscript.

Funding

This research was funded by the National Natural Science Foundation of China, grant number 12205263, and the President’s Fund Project of the China Academy of Engineering Physics, grant number YZJJZQ2023013.

Data Availability Statement

The original contributions presented in the study are included in the article; further inquiries can be directed to the corresponding author.

Acknowledgments

The authors acknowledge Lun Tan, who provided help in doing the breakdown experiment.

Conflicts of Interest

The authors declare no conflicts of interest.

References

  1. Liu, X. High Pulsed Power Technology; National Defense Industry Press: Beijing, China, 2007; pp. 1–3. [Google Scholar]
  2. Martin, J.C. Nanosecond pulse techniques. Proc. IEEE 1992, 80, 934–945. [Google Scholar] [CrossRef]
  3. Akiyama, H.; Sakugawa, T.; Namihira, T.; Takaki, K.; Minamitani, Y.; Shimomura, N. Industrial applications of pulsed power technology. IEEE Trans. Dielectr. Electr. Insul. 2007, 14, 1051–1064. [Google Scholar] [CrossRef]
  4. Barber, P.; Balasubramanian, S.; Anguchamy, Y.; Gong, S.; Wibowo, A.; Gao, H.; Ploehn, H.J.; Zur Loye, H.C. Polymer composite and nanocomposite dielectric materials for pulse power energy storage. Materials 2009, 2, 1697–1733. [Google Scholar] [CrossRef]
  5. Jin, S.; Chen, J.; Li, Z.; Zhang, C.; Zhao, Y.; Fang, Z. Novel RDD pulse shaping method for high-power high-voltage pulse current power supply in DBD application. IEEE Trans. Ind. Electron. 2022, 69, 12653–12664. [Google Scholar] [CrossRef]
  6. Korovin, S.D.; Rostov, V.V.; Polevin, S.D.; Pegel, I.V.; Schamiloglu, E.; Fuks, M.I.; Barker, R.J. Pulsed power-driven high-power microwave sources. Proc. IEEE 2004, 92, 1082–1095. [Google Scholar] [CrossRef]
  7. Hosseinzadehtaher, M.; Khan, A.; Easley, M.; Shadmand, M.B.; Fajri, P. Self-healing predictive control of battery system in naval power system with pulsed power loads. IEEE Trans. Energy Convers. 2020, 36, 1056–1069. [Google Scholar] [CrossRef]
  8. Zhao, L.; Su, J.; Liu, C. Review of developments on polymers’ breakdown characteristics and mechanisms on a nanosecond time scale. AIP Adv. 2020, 10, 035206. [Google Scholar] [CrossRef]
  9. Zhao, L.; Liu, G.Z.; Su, J.C.; Pan, Y.F.; Zhang, X.B. Investigation of thickness effect on electric breakdown strength of polymers under nanosecond pulses. IEEE Trans. Plasma Sci. 2011, 7, 1613–1618. [Google Scholar] [CrossRef]
  10. Mankowski, J.; Dickens, J.; Kristiansen, M. A subnanosecond high voltage pulser for the investigation of dielectric breakdown. In Proceedings of the 11th IEEE International Pulsed Power Conference, Baltimore, MA, USA, 29 June–2 July 1997. [Google Scholar]
  11. Zhao, L.; Su, J.C.; Pan, Y.F.; Zhang, X.B. The effect of polymer type on electric breakdown strength on a nanosecond time scale. Chin. Phys. B 2012, 21, 033102. [Google Scholar] [CrossRef]
  12. Guo, R.; Wang, Z.; He, C.; Zhang, X.; Jin, Y.; Sun, Z.; Li, J. Experimental study on the effect of lightning impulse oscillation frequency on pressboard flashover in oil. IEEE Trans. Dielectr. Electr. Insul. 2021, 28, 431–439. [Google Scholar] [CrossRef]
  13. Ni, H.; Zhang, Q.; Guo, C.; Wen, T. Breakdown and streamer behavior in double-layer oil-paper insulation under impulses of varying front time. IEEE Trans. Dielectr. Electr. Insul. 2020, 27, 103–111. [Google Scholar] [CrossRef]
  14. Zhao, Y.; Zhang, G.; Guo, R.; Yang, F. The breakdown characteristics of thermostable insulation materials under high-frequency square waveform. IEEE Trans. Dielectr. Electr. Insul. 2019, 26, 1073–1080. [Google Scholar] [CrossRef]
  15. Zhao, Y.; Zhang, G.; Guo, R.; Wan, L.; Liu, Y.; Yang, F. Breakdown characteristics of heat-resistant inter-turn insulation materials in high-frequency transformers. High Volt. Eng. 2020, 46, 657–665. [Google Scholar]
  16. Qian, K.; Su, P.; Wu, J.D.; Yin, Y. The effect of thickness on breakdown strength in high voltage direct current cable insulation at different temperatures. Proc. CSEE 2018, 38, 7121–7130. [Google Scholar]
  17. Cygan, S.; Laghari, J.R. Dependence of the electric strength on thickness area and volume of polypropylene. IEEE Trans. Electr. Insul. 1987, 22, 835–837. [Google Scholar] [CrossRef]
  18. Primo, V.A.; García, B.; Burgos, J.C.; Pérez-Rosa, D. Investigation of the lightning impulse breakdown voltage of mineral oil based Fe3O4 nanofluids. Coatings 2019, 9, 799. [Google Scholar] [CrossRef]
  19. Yoshino, K.; Harada, S.; Kyokane, J.; Inuishi, Y. Electrical properties of hexatriacontane single crystal. J. Phys. D Appl. Phys. 1979, 12, 1535. [Google Scholar] [CrossRef]
  20. IEC 60243-1:2013; Electric Strength of Insulating Materials-Test Methods—Part 1: Test at Power Frequencies. IEC: Geneva, Switzerland, 2013.
  21. IEC 60243-3:2013; Electric Strength of Insulating Materials-Test Methods—Part 3: Additional Requirements for 1.2/50 μs Impulse Tests. IEC: Geneva, Switzerland, 2013.
  22. Mazzanti, G. Reliability evaluation of insulation subjected to harmonic voltages within the limits set by international standards. IEEE Trans. Dielectr. Electr. Insul. 2014, 21, 2037–2046. [Google Scholar] [CrossRef]
  23. Baek, S.M.; Joung, J.M.; Kim, S.H. Electrical insulation design and withstand test of model coils for 6.6 kV class HTSFCL. IEEE Trans. Appl. Supercond. 2004, 14, 843–846. [Google Scholar] [CrossRef]
  24. Rozhkov, V.M. Electrical breakdown in solid insulators: Duration of the discharge channel formation. Tech. Phys. 2003, 48, 48–51. [Google Scholar] [CrossRef]
  25. Zhao, L. Theoretical calculation on formative time lag in polymer breakdown on a nanosecond time scale. IEEE Trans. Dielectr. Electr. Insul. 2020, 27, 1051–1058. [Google Scholar] [CrossRef]
  26. Zhong, L.; Li, S.; Xu, C. Engineering Dielectric Physics and Dielectric Phenomena; Xi’an Jiaotong University Press: Xi’an, China, 2013. [Google Scholar]
  27. Watson, D.B. The impulse electric strength of polythene as a function of voltage rise time. J. Phys. D Appl. Phys. 1971, 4, L19. [Google Scholar] [CrossRef]
  28. Wang, H.; Ma, L.; Zeng, Z. Electric breakdown model for dielectric strength of 10 um level polyester foil. High Power Laser Part. Beams 2008, 20, 1749–1752. [Google Scholar]
  29. Pitike, K.C.; Hong, W. Phase-field model for dielectric breakdown in solids. J. Appl. Phys. 2014, 115, 044101. [Google Scholar] [CrossRef]
Figure 1. Setup of breakdown tests under MSPV.
Energies 17 03538 g001
Figure 2. Typical breakdown voltage and current waveforms.
Energies 17 03538 g002
Figure 3. Change trends of UBD and EBD with d. (a) UBD; (b) EBD.
Energies 17 03538 g003
Figure 4. Weibull probability distribution diagrams. (a) PMMA; (b) PET; and (c) PEEK.
Energies 17 03538 g004
Figure 5. Fitting results for the relationship between EBD and d.
Energies 17 03538 g005
Figure 6. Failure probability distribution related to η.
Energies 17 03538 g006
Figure 7. Equivalent circuit of a dielectric.
Energies 17 03538 g007
Figure 8. Results of the Fourier transform of the pulse voltage.
Energies 17 03538 g008
Figure 9. εr and tanδ for the three materials with different voltage frequencies.
Energies 17 03538 g009
Figure 10. Calculation results for energy accumulation characteristics. (a) The change of PDch with time. (b) The change of wch and wdl with time.
Energies 17 03538 g010
Table 1. Characteristic parameters of the Weibull distribution.
Materiald (mm)α (kV/mm)ββm
PMMA0.4121.1514.4114.69
0.794.9013.97
189.3017.89
1.375.0613.71
1.667.3213.47
PET0.4109.4321.6218.43
0.782.2417.64
173.8515.39
1.362.7723.98
1.659.6513.49
PEEK0.498.3712.9713.11
0.781.4211.22
166.3719.55
1.358.539.79
1.652.2912.00
Table 2. Parameter fitting for the relationship between EBD and d.
Material1/βGoodness of Fit (R2)
PMMA1/2.450.97
PET1/2.270.99
PEEK1/2.170.99
Table 3. Average EBD for samples under MSPVs with the three pulse widths.
MaterialAverage EBD (kV/mm)
4 μs6 μs8 μs
PMMA86.5787.9487.11
PET72.3170.3371.06
PEEK63.6565.8764.50
Disclaimer/Publisher’s Note: The statements, opinions and data contained in all publications are solely those of the individual author(s) and contributor(s) and not of MDPI and/or the editor(s). MDPI and/or the editor(s) disclaim responsibility for any injury to people or property resulting from any ideas, methods, instructions or products referred to in the content.

