
Fuel Cell-Based Inductive Power Transfer System for Supercapacitor Constant Current Charging
 , , , and
Abstract
:1. Introduction
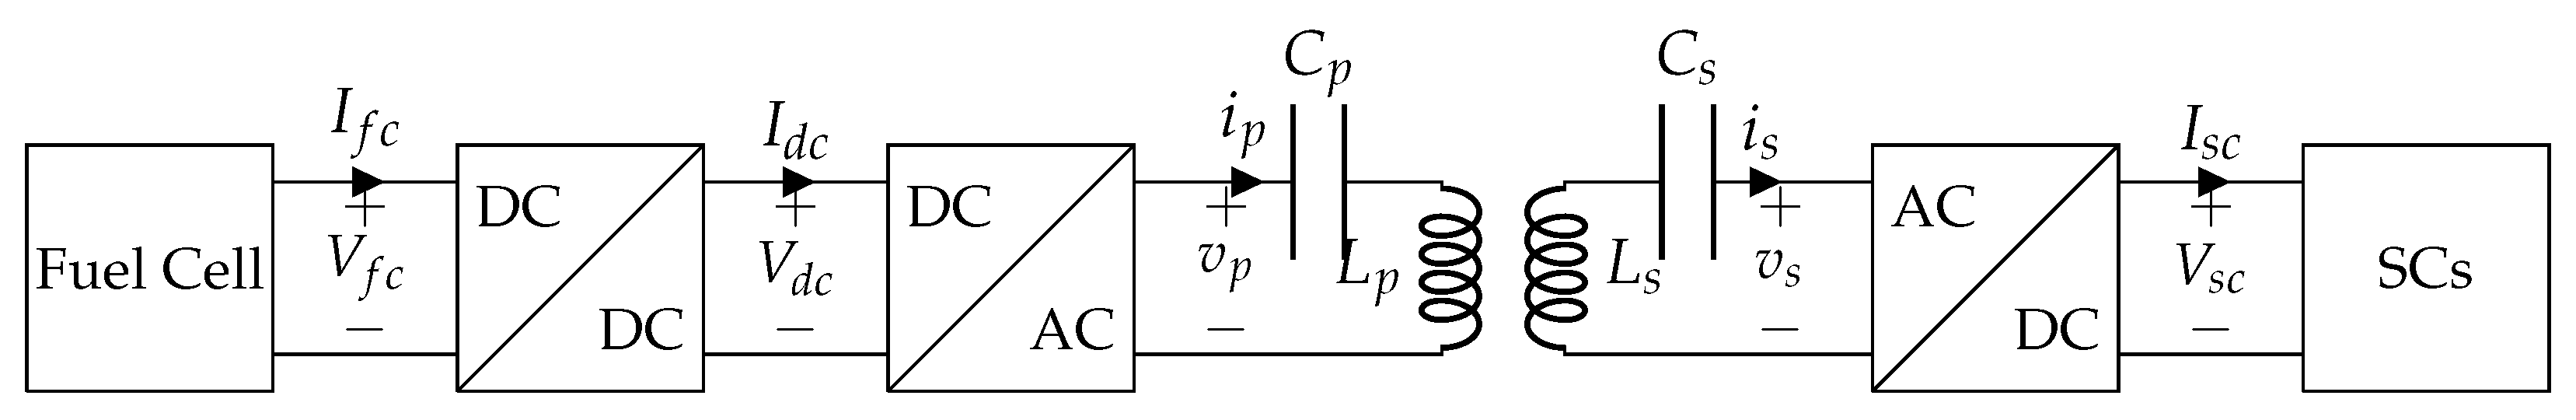
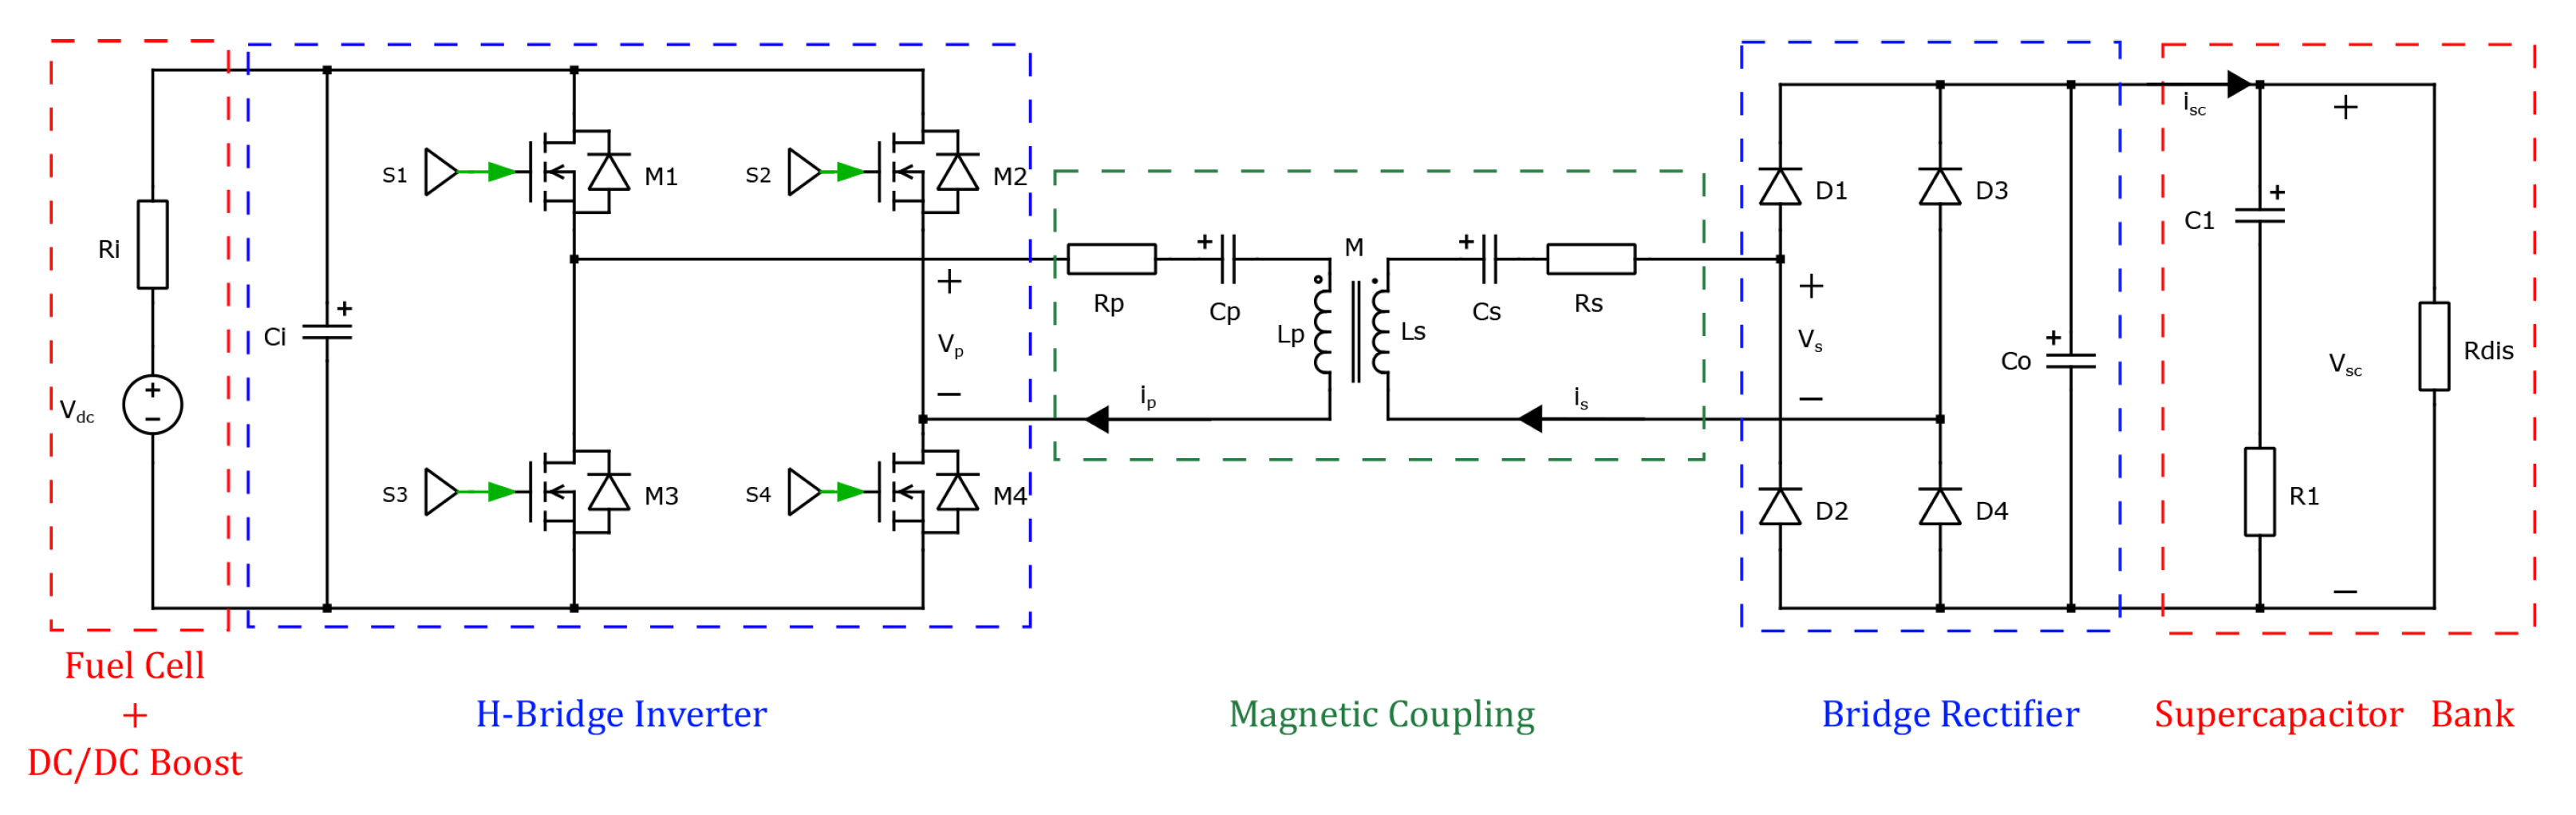
2. System Description
- Each bus line must always have at least two charging station terminals on its route;
- A charging station must be shared by at least two bus lines.
2.1. Vehicle Power and Energy Demand
2.2. System Design
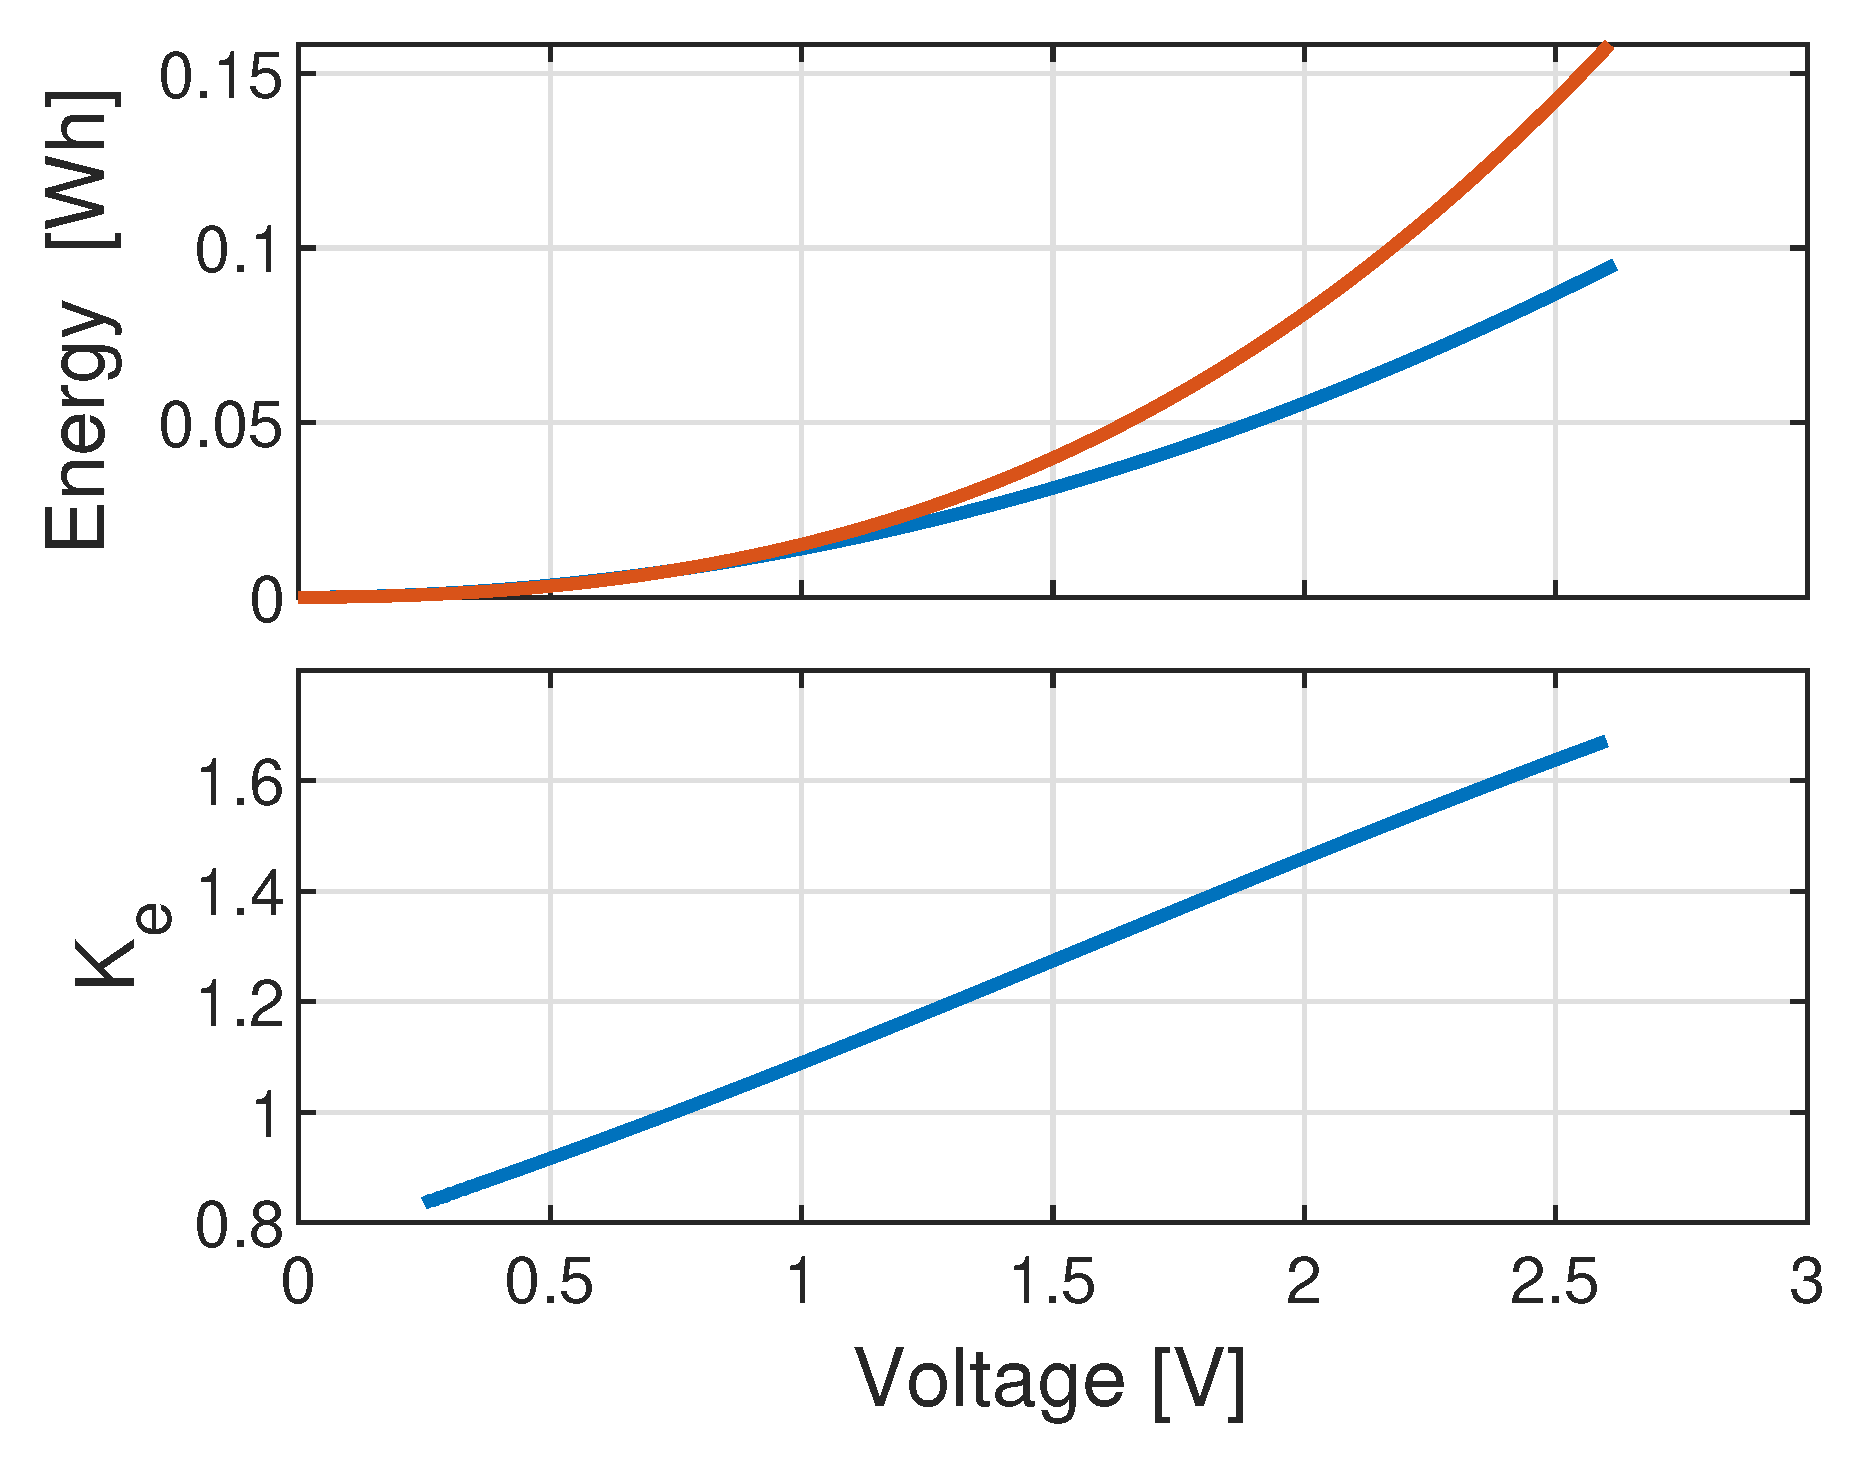
2.2.1. SC Design
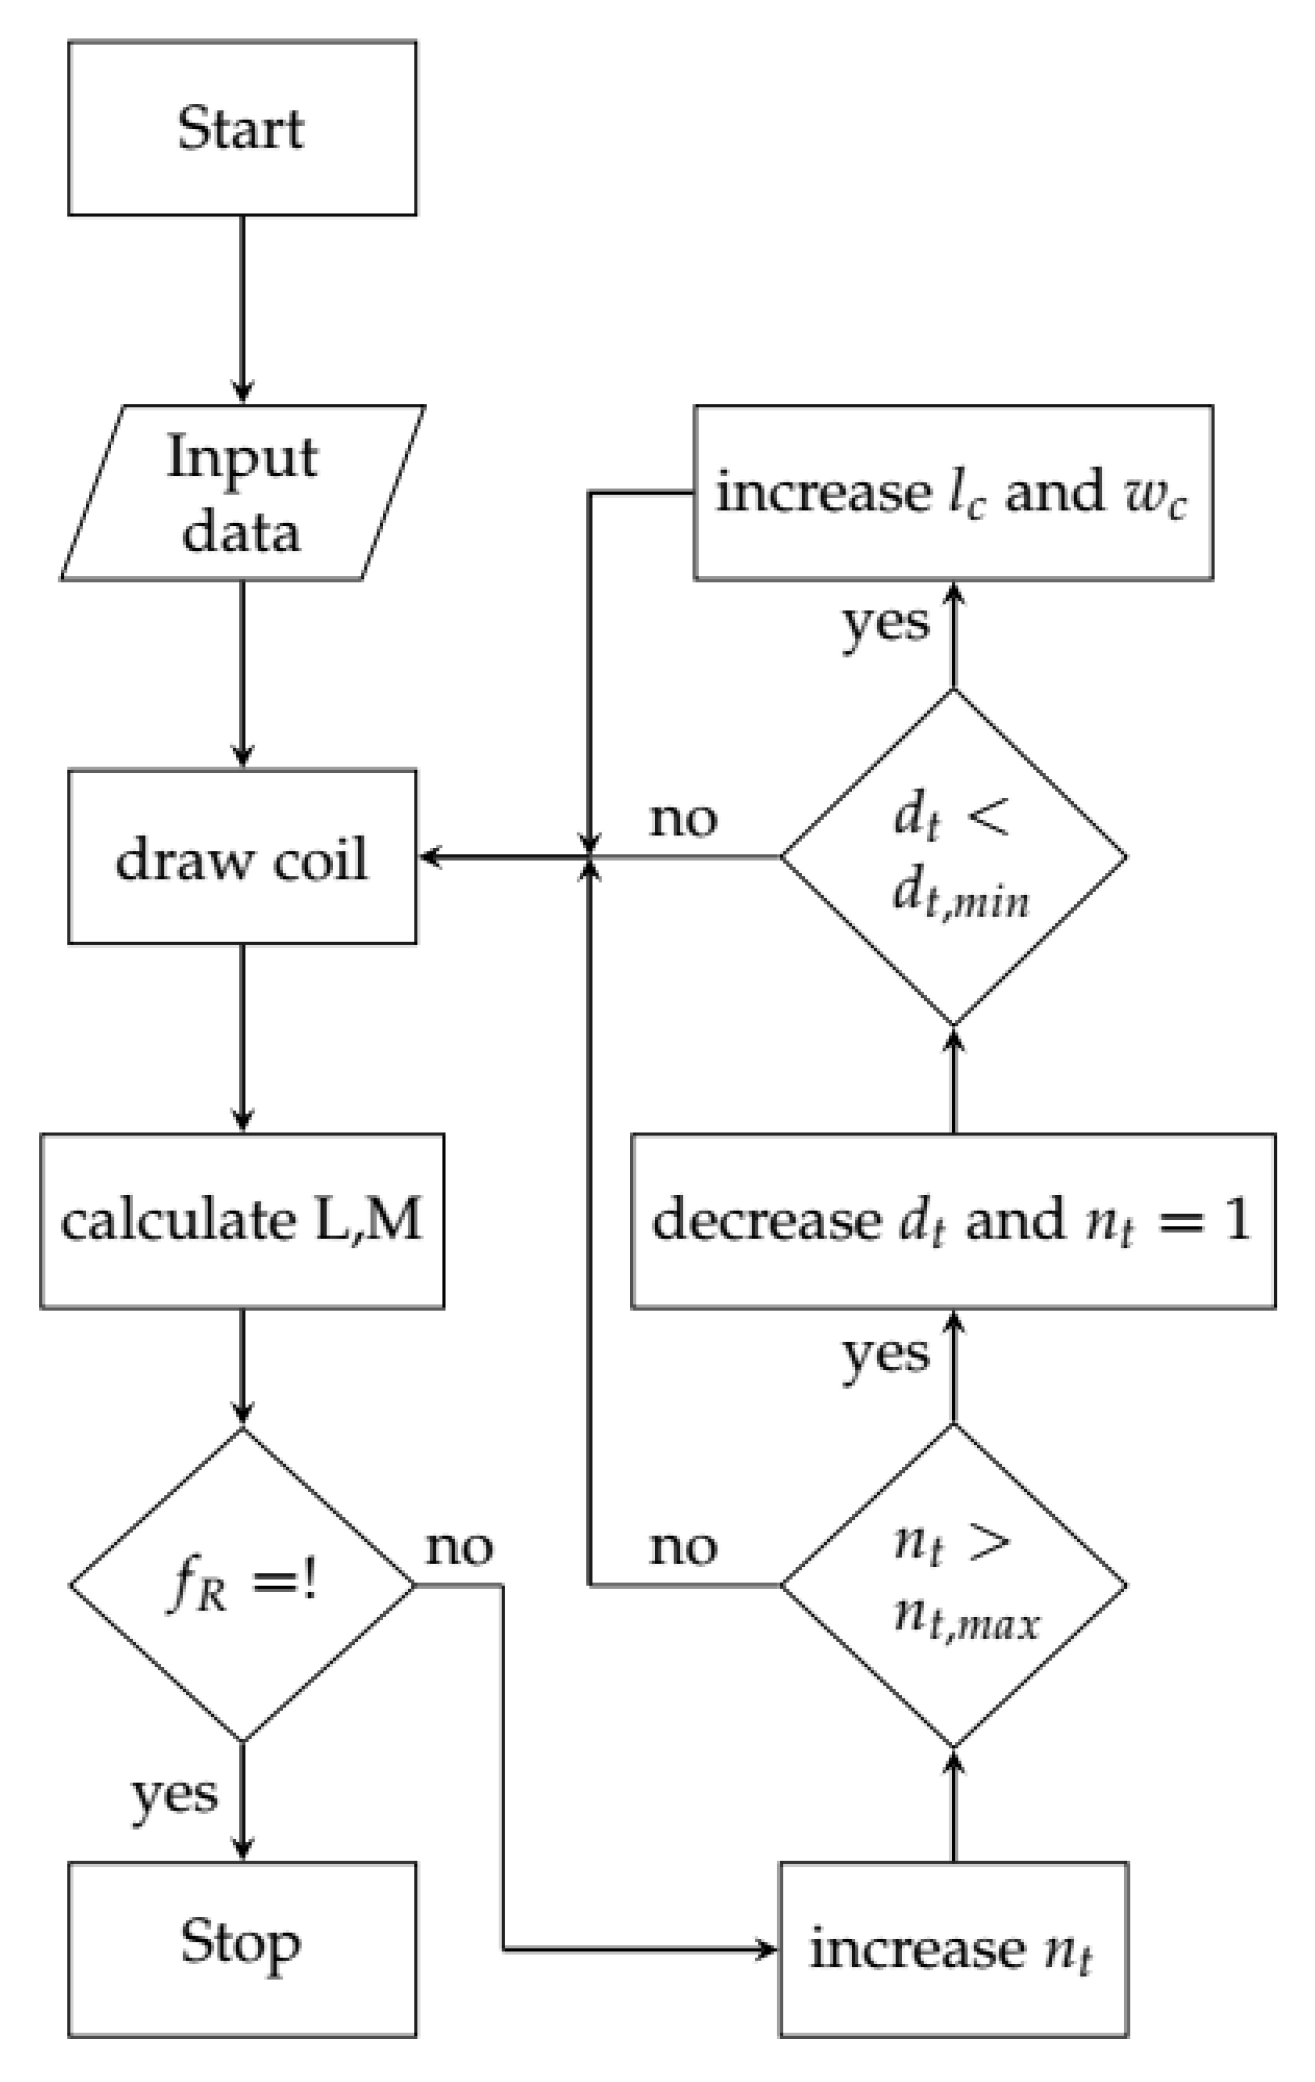
2.2.2. WPT System Design
3. Simulations
3.1. System-Level Simulation
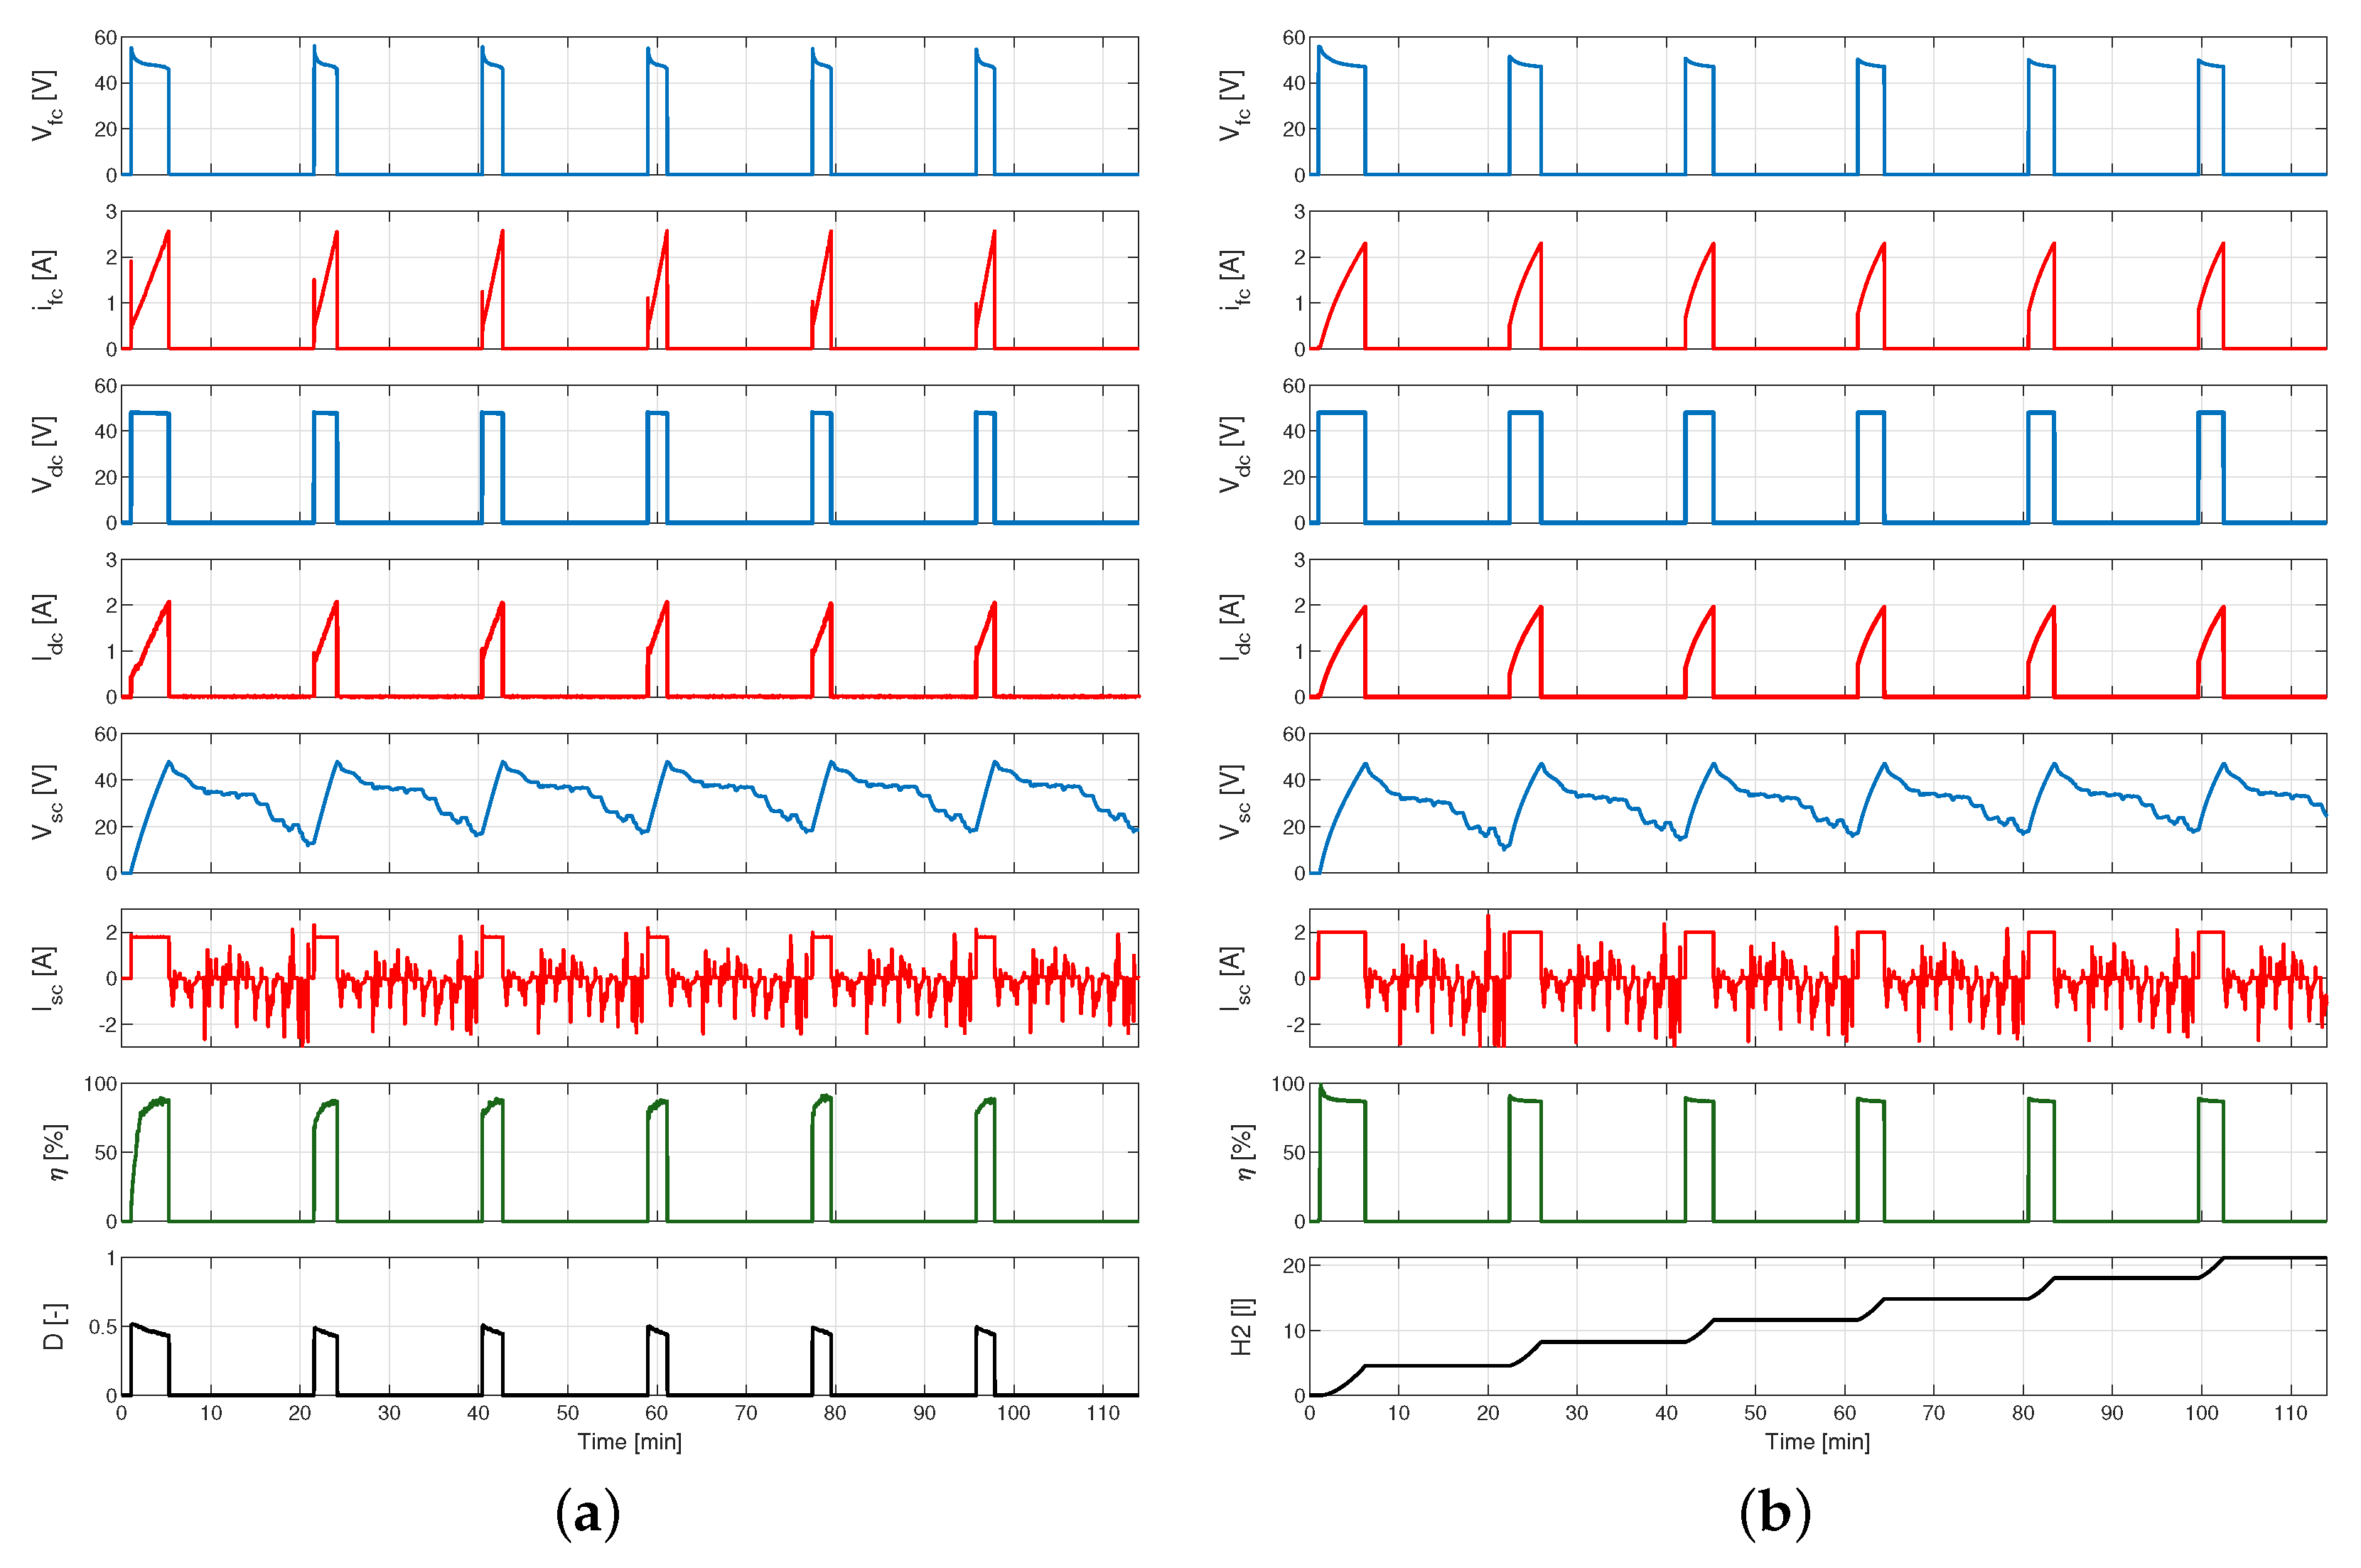
- Stage 1: Constant Current Charging. The SC bank is initially charged by the FC through the IPT system with a constant current of 2 A until it reaches its maximum voltage of 48 V. This stage emulate the vehicle charging at the main bus terminal.
- Stage 2: Discharge. Once the maximum voltage is achieved, the charging system is deactivated. The SC bank is then connected to the load, represented by the vehicle power demand profile. This configuration emulates a scaled-down power profile that the SC bank would experience in real-world operation.
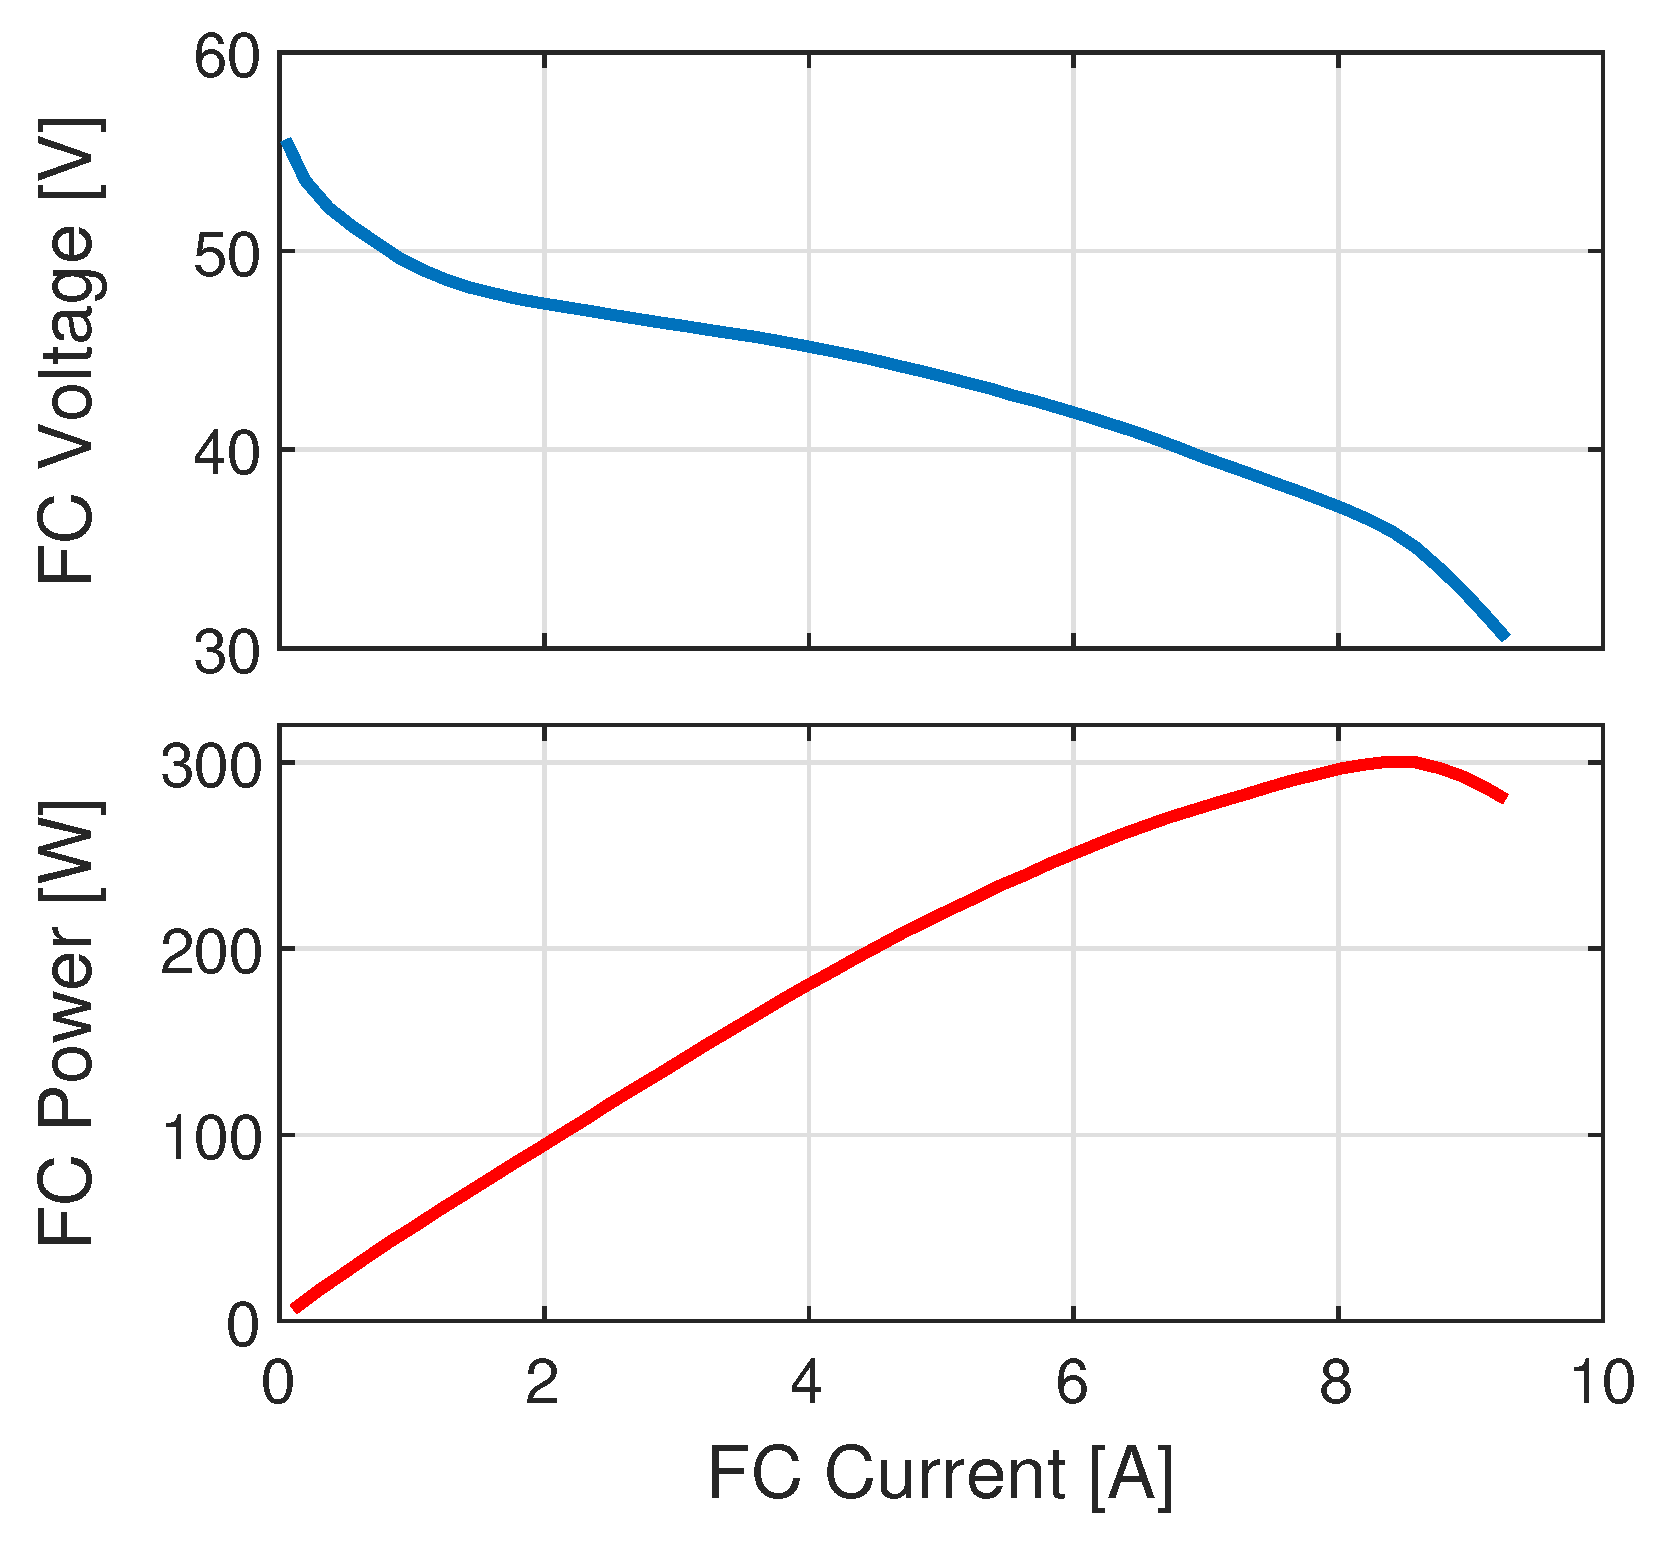
3.1.1. Fuel Cell
3.1.2. IPT
3.1.3. Supercapacitor
3.1.4. Discharge Profile
3.2. Hardware-Level Simulation
3.2.1. Fuel Cell
3.2.2. IPT
3.2.3. Supercapacitor
3.2.4. Power Electronics and Control
4. Experimental Validation
5. Technical–Economical Analysis
6. Conclusions
- Fuel cells and the use of hydrogen offer an excellent solution for powering the charging system. This is because the charging occurs at constant power, so, even though the fuel cell is a low-dynamic system, it is well suited for this application. Additionally, fuel cells can help compensate for the variability in renewable energy sources.
- Employing a wireless charging system offers several advantages, primarily due to the absence of physical connections. In particular, it is crucial to consider the bifurcation phenomenon during the design of such systems. Additionally, implementing a series–series compensation scheme ensures that the mutual inductance remains independent of the load, thereby achieving resonance conditions regardless of any misalignment or capacitor charge state.
- While supercapacitors may not be suitable for vehicles requiring long ranges, they prove particularly advantageous in applications involving shorter routes, such as public transportation buses. This aligns with the growing recognition of supercapacitor viability for such applications.
Author Contributions
Funding
Data Availability Statement
Conflicts of Interest
References
- IEA. CO2 Emissions in 2022, 2022 Highlights. International Energy Agency Report. 2023. Available online: https://www.iea.org.
- Khaligh, A.; Li, Z. Battery, Ultracapacitor, Fuel Cell, and Hybrid Energy Storage Systems for Electric, Hybrid Electric, Fuel Cell, and Plug-In Hybrid Electric Vehicles: State of the Art. IEEE Trans. Veh. Technol. 2010, 59, 2806–2814. [Google Scholar] [CrossRef]
- Gu, Y.; Liu, M. Fair and Privacy-Aware EV Discharging Strategy Using Decentralized Whale Optimization Algorithm for Minimizing Cost of EVs and the EV Aggregator. IEEE Syst. J. 2021, 15, 5571–5582. [Google Scholar] [CrossRef]
- Chau, M.L.Y.; Koutsompina, D.; Gkiotsalitis, K. The Electric Vehicle Scheduling Problem for Buses in Networks with Multi-Port Charging Stations. Sustainability 2024, 16, 1305. [Google Scholar] [CrossRef]
- Berrueta, A.; Ursua, A.; Martin, I.S.; Eftekhari, A.; Sanchis, P. Supercapacitors: Electrical Characteristics, Modeling, Applications, and Future Trends. IEEE Access 2019, 7, 50869–50896. [Google Scholar] [CrossRef]
- Wei, L.; Wu, M.; Yan, M.; Liu, S.; Cao, Q.; Wang, H. A Review on Electrothermal Modeling of Supercapacitors for Energy Storage Applications. IEEE J. Emerg. Sel. Top. Power Electron. 2019, 7, 1677–1690. [Google Scholar] [CrossRef]
- Zhou, J.; Zhao, J.; Wang, L. Cost-Based Research on Energy Management Strategy of Electric Vehicles Using Hybird Energy Storage System. Tsinghua Sci. Technol. 2024, 29, 684–697. [Google Scholar] [CrossRef]
- Sidharthan, V.P.; Kashyap, Y.; Kosmopoulos, P. Adaptive-Energy-Sharing-Based Energy Management Strategy of Hybrid Sources in Electric Vehicles. Energies 2023, 16, 1214. [Google Scholar] [CrossRef]
- Zhang, Y.; Liu, J.; Cui, S.; Zhou, M. Parameter Matching Methods for Li Battery–Supercapacitor Hybrid Energy Storage Systems in Electric Buses. Machines 2022, 10, 85. [Google Scholar] [CrossRef]
- Muralidharan, V.; Narayanan, R.; Nithish, J.; Febin daya, J.L. A Novel Supercapacitor Assisted Regenerative Braking Scheme for Electric Vehicle. In Proceedings of the 2022 International Virtual Conference on Power Engineering Computing and Control: Developments in Electric Vehicles and Energy Sector for Sustainable Future (PECCON), Chennai, India, 5–6 May 2022; pp. 1–7. [Google Scholar] [CrossRef]
- Yilmaz, M.; Krein, P.T. Review of Battery Charger Topologies, Charging Power Levels, and Infrastructure for Plug-In Electric and Hybrid Vehicles. IEEE Trans. Power Electron. 2013, 28, 2151–2169. [Google Scholar] [CrossRef]
- Zhang, Z.; Pang, H.; Georgiadis, A.; Cecati, C. Wireless Power Transfer—An Overview. IEEE Trans. Ind. Electron. 2019, 66, 1044–1058. [Google Scholar] [CrossRef]
- Ramakrishnan, V.; Dominic, S.A.; Balaji, C.; Rajamanickam, N.; Kotb, H.; Elrashidi, A.; Nureldeen, W. A Comprehensive Review on Efficiency Enhancement of Wireless Charging System for the Electric Vehicles Applications. IEEE Access 2024, 12, 46967–46994. [Google Scholar] [CrossRef]
- Mahesh, A.; Chokkalingam, B.; Mihet-Popa, L. Inductive Wireless Power Transfer Charging for Electric Vehicles—A Review. IEEE Access 2021, 9, 137667–137713. [Google Scholar] [CrossRef]
- Shevchenko, V.; Pakhaliuk, B.; Husev, O.; Vinnikov, D.; Strzelecki, R. Wireless Charging Station Design for Electric Scooters: Case Study Analysis. Energies 2024, 17, 2472. [Google Scholar] [CrossRef]
- ElGhanam, E.; Sharf, H.; Odeh, Y.; Hassan, M.S.; Osman, A.H. On the Coordination of Charging Demand of Electric Vehicles in a Network of Dynamic Wireless Charging Systems. IEEE Access 2022, 10, 62879–62892. [Google Scholar] [CrossRef]
- Bensetti, M.; Kadem, K.; Pei, Y.; Le Bihan, Y.; Labouré, E.; Pichon, L. Parametric Optimization of Ferrite Structure Used for Dynamic Wireless Power Transfer for 3 kW Electric Vehicle. Energies 2023, 16, 5439. [Google Scholar] [CrossRef]
- Shi, W.; Dong, J.; Soeiro, T.B.; Bauer, P. Integrated Solution for Electric Vehicle and Foreign Object Detection in the Application of Dynamic Inductive Power Transfer. IEEE Trans. Veh. Technol. 2021, 70, 11365–11377. [Google Scholar] [CrossRef]
- Shi, W.; Grazian, F.; Dong, J.; Soeiro, T.B.; Bauer, P. Detection of Metallic Foreign Objects and Electric Vehicles Using Auxiliary Coil Sets for Dynamic Inductive Power Transfer Systems. In Proceedings of the 2020 IEEE 29th International Symposium on Industrial Electronics (ISIE), Delft, The Netherlands, 17–19 June 2020; pp. 1599–1604. [Google Scholar] [CrossRef]
- Bertoluzzo, M.; Di Barba, P.; Forzan, M.; Mognaschi, M.E.; Sieni, E. A Deep Learning Approach to Improve the Control of Dynamic Wireless Power Transfer Systems. Energies 2023, 16, 7865. [Google Scholar] [CrossRef]
- Feng, C.; Shao, C.; Xiao, Y.; Dong, Z.; Wang, X. Day-Ahead Strategic Operation of Hydrogen Energy Service Providers. IEEE Trans. Smart Grid 2022, 13, 3493–3507. [Google Scholar] [CrossRef]
- Tavakoli, S.D.; Dozein, M.G.; Lacerda, V.A.; Mañe, M.C.; Prieto-Araujo, E.; Mancarella, P.; Gomis-Bellmunt, O. Grid-Forming Services From Hydrogen Electrolyzers. IEEE Trans. Sustain. Energy 2023, 14, 2205–2219. [Google Scholar] [CrossRef]
- Bima, M.E.; Bhattacharya, I.; Adepoju, W.O.; Banik, T. Effect of Coil Parameters on Layered DD Coil for Efficient Wireless Power Transfer. IEEE Lett. Electromagn. Compat. Pract. Appl. 2021, 3, 56–60. [Google Scholar] [CrossRef]
- Wu, M.; Yang, X.; Cui, H.; Chen, W.; Wang, L.; Zhu, L.; Yu, X.; Yan, Z. Modeling of Litz-Wire DD Coil With Ferrite Core for Wireless Power Transfer System. IEEE Trans. Power Electron. 2023, 38, 6653–6669. [Google Scholar] [CrossRef]
- Bima, M.E.; Bhattacharya, I.; Neste, C.W.V. Experimental Evaluation of Layered DD Coil Structure in a Wireless Power Transfer System. IEEE Trans. Electromagn. Compat. 2020, 62, 1477–1484. [Google Scholar] [CrossRef]
- Nguyen, H.T.; Alsawalhi, J.Y.; Hosani, K.A.; Al-Sumaiti, A.S.; Jaafari, K.A.A.; Byon, Y.J.; Moursi, M.S.E. Review Map of Comparative Designs for Wireless High-Power Transfer Systems in EV Applications: Maximum Efficiency, ZPA, and CC/CV Modes at Fixed Resonance Frequency Independent from Coupling Coefficient. IEEE Trans. Power Electron. 2022, 37, 4857–4876. [Google Scholar] [CrossRef]
- Tiwari, P.; Ronanki, D. Bifurcation Free Coil Design for Multi Power Level Wireless Charging of Electric Vehicles. In Proceedings of the 2022 IEEE International Conference on Power Electronics, Drives and Energy Systems (PEDES), Jaipur, India, 14–17 December 2022; pp. 1–6. [Google Scholar] [CrossRef]
- Zucca, M.; Hassanzadeh, M.; Conti, O.; Pogliano, U. Accurate Parameters Identification of a Supercapacitor Three-Branch Model. IEEE Access 2023, 11, 122387–122398. [Google Scholar] [CrossRef]
- Castiglia, V.; Campagna, N.; Tommaso, A.O.D.; Miceli, R.; Nevoloso, C.; Pellitteri, F.; Puccio, C.; Viola, F. Modeling, Simulation, and Characterization of a Supercapacitor in Automotive Applications. IEEE Trans. Ind. Appl. 2022, 58, 2421–2429. [Google Scholar] [CrossRef]
- Castiglia, V.; Campagna, N.; Di Tommaso, A.O.; Miceli, R.; Pellitteri, F.; Puccio, C.; Viola, F. Modelling, Simulation and Characterization of a Supercapacitor in Automotive Applications. In Proceedings of the 2020 Fifteenth International Conference on Ecological Vehicles and Renewable Energies (EVER), Monte-Carlo, Monaco, 10–12 September 2020; pp. 1–6. [Google Scholar] [CrossRef]
- PED-Board Datasheet. Available online: https://www.ped-board.com.


| 1–2 | 0.2 | km | 6–7 | 0.2 | km |
| 2–3 | 0.3 | km | 7–8 | 0.4 | km |
| 3–4 | 0.5 | km | 8–9 | 0.4 | km |
| 4–5 | 0.3 | km | 9–1 | 0.4 | km |
| 5–6 | 0.5 | km |
| Max total passengers | 22 | - |
| Passenger weight | 1540 | kg |
| Motor power | 135 | kW |
| Maximum torque | 290 | Nm |
| Li-ion battery capacity | 44 | kWh |
| Frontal area | 5.78 | m2 |
| Gross weight | 5000 | kg |
| g | A | ||||
|---|---|---|---|---|---|
| [kg] | [−] | [−] | [m2] | ||
| 6540 | 9.8 | 0.011 | 1.202 | 0.36 | 5.78 |
| Type | Proton Exchange Membrane (PEM) | |
| Brand | Horizon Fuel Cell | |
| Specification | Unit | Value |
| Number of cells | - | 72 |
| Nominal power | W | 300 |
| Rated voltage | V | 43.2 |
| Rated current | A | 7.2 |
| Voltage range | V | 39–69 |
| consumption * | L/min | 4.2 |
| Specification | Unit | Value |
|---|---|---|
| Rated voltage | V | 2.7 |
| Rated capacitance | F | 100 |
| AC impedance (1 kHz) | m | 6 |
| DC resistance | m | 10 |
| Maximum current | A | 65 |
| Leakage current | mA | 0.2 |
| Stored energy | J | 364.5 |
| (m) | () | () | (F) | (F/V) | (F) | (F) |
| L | M | ||||||
|---|---|---|---|---|---|---|---|
| [cm] | [cm] | [cm] | [cm] | [mm2] | [−] | [µH] | [µH] |
| 58 | 29 | 6 | 1 | 2.5 | 10 | 60.18 | 23 |
| Figure 17 Ref. | Component | Characteristics |
|---|---|---|
| HYDROGEN-BASED POWER SUPPLY | ||
| 1. | H2PLANET Hydrogen tank | 900 L metal hydride |
| P = 10 bar | ||
| 2. | H2PLANET PEM fuel cell | see Table 4 |
| IPT SYSTEM | ||
| 3. | Primary side H-bridge inverter | mF input capacitor |
| IRFB4115 Power MOSFET | ||
| IR2110 drivers | ||
| 4. | Compensation networks | see Section 3.2.2 |
| 5. | Coupling coils | see Table 7 |
| 6. | Bridge rectifier | MUR3020WTG diodes |
| mF output capacitor | ||
| SUPERCAPACITOR | ||
| 7. | Supercapacitor bank | see Section 3.1.3 |
| CONTROL AND ACQUISITION | ||
| 8. | PC | control panel |
| 9. | Oscilloscope | Lecroy WavePro 7200A |
| 10. | Acquisition board | NI 9215 16-Bit |
| 11. | Control system | PED Board [31] |
| 12. | Electronic load | Agilent 6060B |
| 3–60 V/0–60 A, 300 W | ||
| 13. | Power supply | Fluke PM2812 |
| 0–60 V/0–10 A, 120 W | ||
| Supercapacitors | Batteries | |
|---|---|---|
| charges/day | 20 | 1 |
| days/week | 5 | 5 |
| weeks/year | 50 | 50 |
| cycles/year | 5000 | 250 |
| [V] | 400 | 400 |
| [kWh] | 1.4 | 39.2 (*) |
| [A] | 113.75 | 113.75 |
| SC | 1 | 2 | 3 | 4 | 5 | |
|---|---|---|---|---|---|---|
| C | 500 | 360 | 500 | 800 | 3000 | F |
| 3 | 2.7 | 2.7 | 2.3 | 3 | V | |
| 3.2 | 4.5 | 4.5 | 15 | 0.26 | m | |
| 283 | 185 | 205 | 12.5 | 2200 | A | |
| 0.78 | 0.45 | 0.63 | 0.73 | 4.66 | Wh | |
| Weight | 0.08 | 0.07 | 0.096 | 0.0945 | 0.525 | kg |
| Volume | 69.2 | 59.6 | 78.9 | 69.2 | 390.19 | mL |
| Life cycles | 5 × | 1 × | 1 × | 1 × | 1 × | - |
| SC | 1 | 2 | 3 | 4 | 5 |
|---|---|---|---|---|---|
| 133 | 148 | 148 | 174 | 133 | |
| 14 | 21 | 16 | 12 | 3 | |
| 1867 | 3111 | 2370 | 2087 | 400 | |
| Max Current [A] | 4032 | 3885 | 3280 | 150 | 6600 |
| Battery | 1 | 2 | |
|---|---|---|---|
| C | 2.6 | 3.45 | Ah |
| 3.6 | 3.6 | V | |
| 100 | 96 | m | |
| 5 | 5 | A | |
| 9.36 | 12.42 | Wh | |
| Weight | 0.048 | 0.048 | kg |
| Volume | 16.54 | 16.54 | mL |
| Life cycles (*) | 1500 | 1500 | - |
| Battery | 1 | 2 |
|---|---|---|
| 111 | 111 | |
| 46 | 33 | |
| 5152 | 3696 | |
| Max current [A] | 115 | 115.5 |
| Weight | Volume | Cost | Possible Service Period | |
|---|---|---|---|---|
| [kg] | [L] | [EUR] | [Years] | |
| SC 1 | 144 | 124.71 | 14,028.67 | 100 |
| SC 2 | 216.3 | 184.17 | 21,217.78 | 20 |
| SC 3 | 213.6 | 175.54 | 23,703.70 | 20 |
| SC 4 | 181.1 | 132.61 | 20,869.57 | 20 |
| SC 5 | 157.7 | 117.20 | 22,000.00 | 200 |
| Battery 1 | 274.30 | 85.22 | 12,880.00 | 6 |
| Battery 2 | 177.41 | 61.13 | 12,566.40 | 6 |
Disclaimer/Publisher’s Note: The statements, opinions and data contained in all publications are solely those of the individual author(s) and contributor(s) and not of MDPI and/or the editor(s). MDPI and/or the editor(s) disclaim responsibility for any injury to people or property resulting from any ideas, methods, instructions or products referred to in the content. |
© 2024 by the authors. Licensee MDPI, Basel, Switzerland. This article is an open access article distributed under the terms and conditions of the Creative Commons Attribution (CC BY) license (https://creativecommons.org/licenses/by/4.0/).
Share and Cite
Campagna, N.; Castiglia, V.; Gennaro, F.; Messina, A.A.; Miceli, R. Fuel Cell-Based Inductive Power Transfer System for Supercapacitor Constant Current Charging. Energies 2024, 17, 3575. https://doi.org/10.3390/en17143575
Campagna N, Castiglia V, Gennaro F, Messina AA, Miceli R. Fuel Cell-Based Inductive Power Transfer System for Supercapacitor Constant Current Charging. Energies. 2024; 17(14):3575. https://doi.org/10.3390/en17143575
Chicago/Turabian StyleCampagna, Nicola, Vincenzo Castiglia, Francesco Gennaro, Angelo Alberto Messina, and Rosario Miceli. 2024. "Fuel Cell-Based Inductive Power Transfer System for Supercapacitor Constant Current Charging" Energies 17, no. 14: 3575. https://doi.org/10.3390/en17143575