Abstract
Ice plates, widely used in food cold chain refrigeration transportation, involve challenges such as long cold storage time and low efficiency in use. This study establishes a mathematical model for ice plate cold storage and release. It analyzes the influence of fin setting position, distribution, and size on the cold storage and release characteristics of non-uniform fins having diverse sizes and spacing on the inner and outer surfaces of the ice plate. Results show that compared to finless ice plates, plates with inner or outer fins can reduce the cold storage and release time, accelerate the charging and discharging efficiency of the cold storage equipment, and potentially save time. Cold storage and release time savings of up to 17.5% and 19.6%, respectively, were attained using outer fins. Driven by natural convection inside the finned ice plate, cold storage proceeds from top to bottom, while cold release proceeds from bottom to top. For inner fins, the distribution has a higher impact on the cold storage and release speed than the size. For outer fins, both the distribution and size equally affect the cold storage and release speed. The smaller the reference spacing between the outer fins, the faster the cooling storage, but the slower the cold release. The larger the reference area, the faster the cooling storage, but the slower the cold release. Thus, when designing ice plate products, the distribution and the size of fins should be selected based on prior consideration of storage or release speed. This study provides a theoretical basis and design guidance for the design of ice plate products, especially for refrigerated transportation applications.
1. Introduction
Perishable foods such as fruits, vegetables, and aquatic products must often be transported over long distances from their origin to consumers. To ensure food quality and extend shelf life, cold chain logistics transportation is required [1], wherein refrigeration is used to maintain a specified temperature during transportation [2]. The traditional method, using vapor compression refrigeration, requires separate installation of refrigeration equipment in transportation vehicles, which is expensive, results in high carbon emissions, and poses the risk of refrigerant leakage [3]. To conserve energy, reduce electricity costs, and reduce carbon emissions, phase change materials are used in cold chain logistics for refrigerated transportation. Cold storage is achieved by storing internal energy through the sensible heat, latent heat, chemical heat, or a combination of these, to meet the demand for cold storage and transfer over various time periods. This method has considerable advantages, such as large cold storage capacity, low refrigeration temperature [4,5], the lack of need to install a refrigeration system with the vehicle [6], high loading efficiency, easy temperature control, and controllable precooling time [7]. Phase change material (PCM) cold storage plates attached to the wall and top of the carriage are commonly used [8]. PCM cold storage plates are also used in construction engineering [9], healthcare [10,11], solar refrigeration, and other applications.
However, PCMs have relatively poor thermal conductivity compared to most metals, which limits the heat transfer rate of thermal energy storage (TES) systems and their applications, especially in large-scale deployment of PCM-based latent heat thermal storage (LHTS) systems, owing to the low charging and discharging rates of PCMs. Therefore, enhancing the heat transfer rate and thermal performance of LHTSs is critical to improving their energy storage and recovery rates. A comprehensive literature review indicated that the majority of studies focused on fin integration, owing to its simplicity, ease of manufacturing, and low cost. The use of fins attracted attention because they improve thermal storage performance.
Fin optimization is widely used in heat storage, especially in shell-and-tube units to improve heat transfer performance. Wang et al. [12] developed a topology optimization technique to explore various combinations of fin numbers and fin heights to assess their influence on melting performance while maintaining consistent fin volume. A remarkable 74% increase in melting performance compared to structures without fins was achieved. Naef et al. [13] recommended using roots-like fins with nanoparticles in the thermal storage units for reducing the PCM melting time by 56% and 91% compared to dual-radial fins and tree-like fins, respectively, so as to improve the heat transfer inside the unit to decrease the thermal resistance of the storage unit and, thus, enhance the melting process. He et al. [14] demonstrated that a topological fin (TOF) structure exhibits superior thermal performance and can achieve a more uniform heat exchange with the PCM. The heat transfer efficiency of the TOF unit is enhanced by 57.8% compared to that of a finless unit under the heat storage and release conditions of 90–60 °C. Shell-and-tube latent heat thermal energy storage (LHTES) systems are widely recognized as one of the most effective ways to store and utilize solar energy given their high energy density, constant storage/releasing temperature, structural feasibility, and reasonable price. The application of fins is an effective method to enhance heat exchange through extending the heat transfer surface area. However, strong uneven melting behavior, including melting fraction and temperature uniformity, were observed in a vertical thermal energy storage unit. Yang et al. [15] studied the effects of fin pitch and position on the thermal performance of the melting process and demonstrated that non-uniformly distributed annular fins obtained a 62.8% and 34.4% reduction in full melting time and average temperature difference, respectively, and an 84.7% increment in the melting rate uniformity in the PCM region compared to the original case with uniform fins. Nie et al. [16] explored helm-shaped fins on PCM solidification in a vertical shell-tube storage unit and found that the optimum ratio of the minimum distance between the rectangular part of a helm-shaped fin and the tube to the distance between the shell and the tube is 0.458, and the optimum thickness and height ratios are 8 and 0.473, respectively, which shortens the solidification time by 23.9%, 54.5%, and 22.1%, respectively, compared to a traditional annular fin at the same fin volume.
The triplex-tube heat exchanger (TTHX) can also be used in heat storage. Jasim et al. [17] used an arrangement of long fins at the lower half of the storage unit. Fewer and relatively shorter fins at the upper half of the unit result in significantly faster melting rates compared to the use of a fin-nanoparticles combination or nano-enhanced PCM in the same volume of the TTHX. Mahmood et al. [18] investigated the effect of longitudinal fins on the performance of a triplex TTHX equipped with a PCM under simultaneous charging and discharging.
Fin geometric parameters were also improved to enhance the thermal energy storage efficiency. Yang et al. [19] optimized the melting thermal performance of PCMs by changing the fin thickness, interval, and number under the same ratio of fin volume. R. Karami et al. [20] showed that decreasing the inclination angle of finned enclosures reduces the melting time compared to an finless vertical enclosure. The maximum melting time reduction is 72% obtained by a 0° and three-fin enclosure. Yazici et al. [21] found that the thermal performance of the fins was limited when the fin number increased beyond three, likely owing to the increased resistance to flow caused by the increased number of fins. Ji et al. [22] numerically studied the effects of fin angle using a side-wall heated LHTES with horizontal, dual fins and showed that a −15° set-up achieved the highest reduction in melt time, i.e., 23.5%, whereas the +15° and +30° set-ups lengthened the time required to achieve full melt compared to 0°. It was found that the saved melting time of PCMs with 15 fins increases 23.8% in the case of the 0 fins but decreases 45.2% and 71.4% with 15 and 30 fins, respectively.
Fin optimization also attracted the attention of researchers in the cold thermal energy storage (CTES) field. Plate, sphere, tube, and tank shapes were studied. Ali Mousazade [5] put PCMs cast in the thin plate heat exchangers with tubes inside them. The refrigerant flowed through the tubes to freeze the PCMs to the temperatures below their melting points. The PCM was discharged and provided cooling when in service. Finned tubes were used by Tong et al. [23] to embed inside the cold storage plate to cycle liquid HTF to accelerate the charging rate to improve the charging performance in order to guarantee feasible application as cold chains need high operation efficiency. The fins contribute to the heat transfer between the HTF and PCM and help to achieve a relatively short charging time, which increases the operational efficiency of the container. The system consumes less energy and produces much lower local greenhouse gas emissions. Zheng et al. [24] designed an annular-finned cold storage sphere using phase change paraffin as the cold storage medium and found that increasing fin length and reducing fin spacing inside the sphere can shorten the completion time of cold storage. Zhai et al. [25] developed a fin tube phase change cold storage unit and optimized the structural parameters, attaining a 71.2% decrement by annular fins and rectangular fins compared with the unit without fins. Lee et al. [26] numerically and experimentally examined the melting characteristics of PCM inside a CTES tank with the installation of interior fins and further proposed a novel design adopting stratified fins to enhance the melting performance.
Fins can increase heat transfer area, reduce thermal resistance, and enhance cold storage or release speed, but they can also occupy storage space and increase flow resistance. There are many types of cold storage devices, and existing research on strengthening cold storage fins mainly focuses on the surface of heat transfer tubes inside the ice storage plate (ISP), the inner surface of the refrigerator, and the surface of phase change heat transfer tubes. However, the influence of parameters, such as the setting of fins on the inner and outer surfaces of the ISP (Figure 1), fin spacing, and size on the ice storage, and melting performance of the plate storage device were not thoroughly studied. This study uses simulation methods to investigate the influences of surface fin position, distribution, and size changes on the ice storage and melting performance of vertical plate storage devices, providing theoretical support for the research and design of ISP devices.

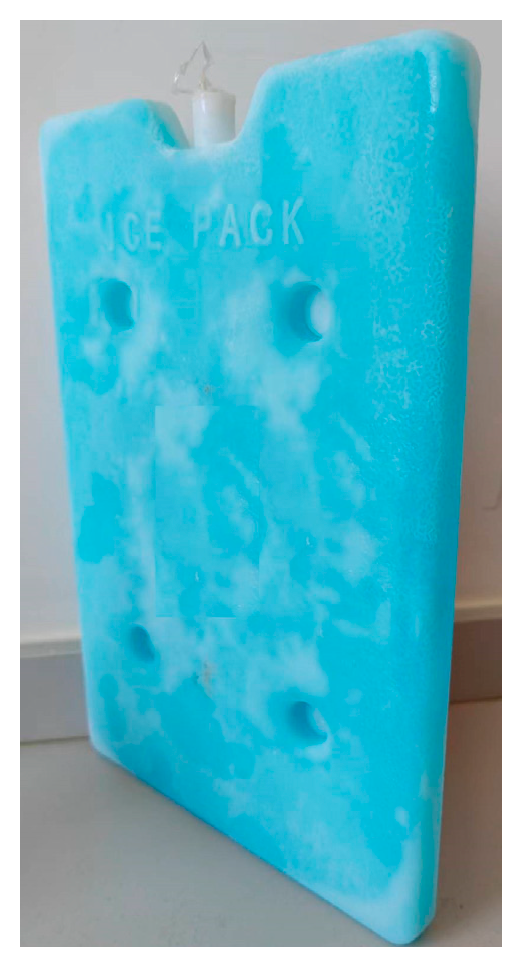
Figure 1.
Photograph of an ice storage plate.
2. Mathematical Models
2.1. Control Equations
The ISP with inner and outer fins considered in this study is visualized in Figure 2a and Figure 3a. It is a vertical thin rectangular shape, with the outer shell and fins made of polyvinyl chloride (PVC) material and water as the PCM inside. Figure 2a shows the internal fin structure, with horizontal and straight fins located on the two long inner sides of the vertical walls. The spacing between the fins from bottom to top is a non-uniform distribution of equal difference sequences, and the area of the fins distributed from bottom to top is also an equal difference sequence. The bottom fin is the reference fin, and the corresponding cross-sectional area is the reference cross-sectional area. The spacing between the bottom two fins is the reference spacing. If the spacing between the bottom two fins is a, and the increment between two adjacent fin spacing is da, then the spacing between the second and third fin from the bottom is a + da, the spacing between the third and fourth fin is a + 2da, and so on. The da can be positive or negative. If it is positive, the spacing between two adjacent fins from bottom to top is increasing, if negative, the spacing is decreasing. The same is true for cross-sectional area. If the section area of the fin in the bottom is A, and the increment between two adjacent fin section area is dA, then the section area of the second, third, and fourth fin from the bottom is A + dA, A + 2dA, and A + 3dA, respectively. The dA can also be positive or negative. If it is positive, the section area of fins from bottom to top is increasing, if negative, the section area of fins is decreasing.
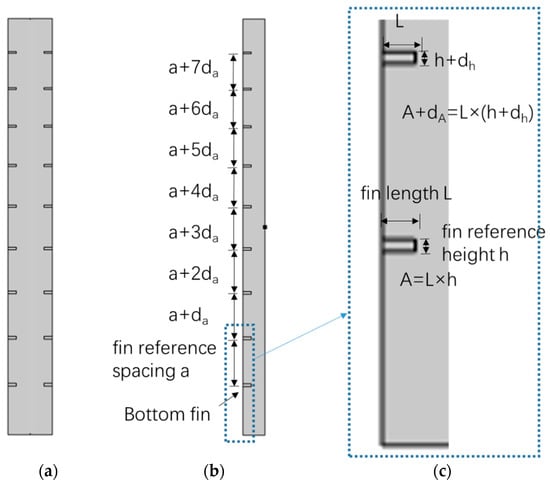
Figure 2.
Schematic diagram of inner fin cold storage ice plate ((a) inner fin cold storage ice plate, (b) fin spacing parameter, and (c) fin area parameter).
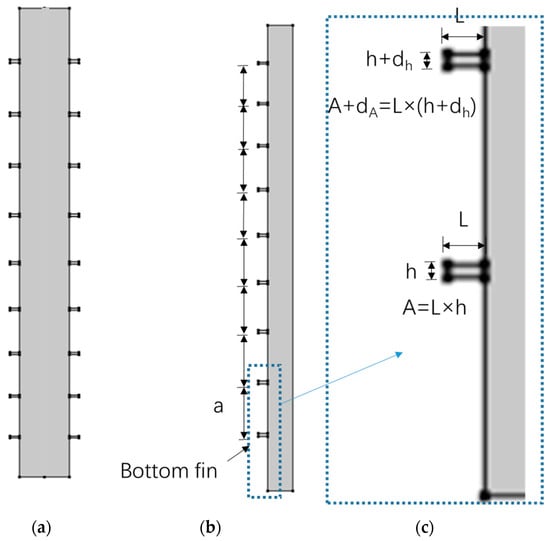
Figure 3.
Schematic diagram of external fin cold storage ice plate ((a) outer fin cold storage ice plate, (b) fin spacing parameter, and (c) fin area parameter).
Figure 3a shows the outer fin structure, with horizontal and straight fins located on the outer side of the vertical walls on both sides. As with the inner fin setting, the spacing between the fins is a non-uniform distribution of equal difference sequences, the area of the fins from bottom to top is an equal difference sequence, and the bottom fin is the reference fin. The volume of water contained in the finless ISP is the same as the finned ISP used as a comparative reference. Owing to the geometric shape of the fins being symmetrical about the central vertical axis, only half of them are taken for modeling, as shown in Figure 2b and Figure 3b. The geometric parameters of the inner and outer fins are, respectively, integrated in Figure 2c and Figure 3c.
To accelerate the convergence, it is assumed that the phase transition takes place within a temperature range of 5 K around 0 °C, during which a uniform mixture of ice and water exists and the solid fraction is a linear function of temperature. Newtonian, incompressible, laminar flow in the liquid phase and the Boussinesq approximation, and local thermodynamic equilibrium are also assumed in this study. The volume expansion in the phase change is omitted. Owing to the continuous changes in temperature and solid fraction inside the ISP over time during the cold storage and release process, a dynamic phase change multi-field coupling model is adopted, which includes the internal heat transfer equation of the ISP, the wall heat transfer equation of the plate, and the outer air model.
- (1)
- The heat transfer equation for ice (water) inside the ISP is:
For pure water or ice, (1) can be written as
Here, subscript i can be l for water, and c for ice.
The specific enthalpy H can be expressed as
Here, is the latent heat during phase change, which is specified as a function of temperature T, that is,
where represents solid fraction.
The equation for natural convection flow of ice-water mixture is
Here, p is pressure and is dynamic viscosity. The role of the source term, F, is to dampen the velocity at the phase change interface so that it becomes that of the solidified phase after the transition. The source term follows from the equation [27]
where C is a constant of 1600.
is specified as [27]
- (2)
- The heat transfer equation for the wall of the ISP is:
- (3)
- Air model
The equations include mass, momentum, and energy conservation:
Here, is the dry air density, kg/m3; denotes time in seconds (s); is the dry air flow rate, m/s; p is the relative pressure, Pa; and is the dynamic viscosity, Pa · s.
- (4)
- Initial conditions
- (5)
- Boundary conditions of box wall surface
Here, h is convective heat transfer coefficient, and tw is temperature of plate wall during the cold storage and release process.
- (6)
- Thermo-physical properties
The density, specific heat capacity, thermal conductivity, and viscosity of water can be calculated as follows (273.15 K < T < 373.15 K):
The density, specific heat capacity and thermal conductivity of ice can be calculated as follows (190 K < T < 273.15 K):
The density and thermal conductivity of the ice and water mixture between 268.15 and 278.15 K are obtained as follows:
2.2. Solution Methods
Our numerical model was developed using the finite element method, employing the apparent heat capacity method to model the phase change.
The computational fluid dynamics software COMSOL Multiphysics 6.1 was employed to conduct the numerical simulation. Using the fully coupled method to solve the coupling of temperature, pressure, and velocity field, all couplings between these variables were included in a single iteration. The damping factor was set to 0.9. The relative tolerance was set to 1 × 10⁻⁶ for time-dependent studies.
2.3. Model Verification
Test data from the existing phase change ice plate refrigerated car test bench were used to verify the above model. The layouts of the cold storage plates and the sensors are shown in Figure 4. An ISP with 30 cm × 20 cm × 3.2 cm was used for cold storage in a low-temperature refrigerator and released in a refrigerated vehicle model. The ISPs were evenly arranged on the inner wall of the refrigerated vehicle model box placed in an environmental temperature simulation box. Temperature was measured using 13 thermocouples (measuring range: −50–300 °C, accuracy: ±0.15 °C), respectively, 1 at each cold storage plate, 3 at cold storage area, and 1 at the environment.
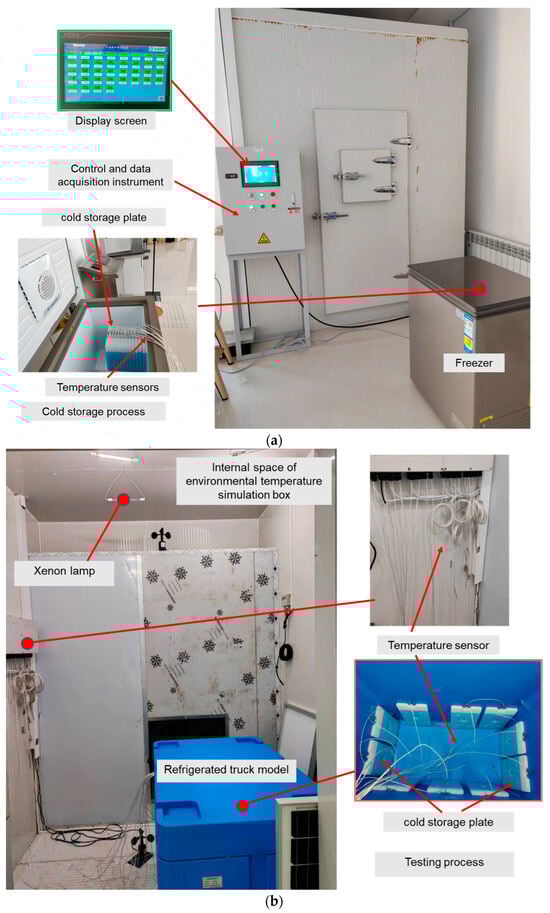
Figure 4.
Photograph of the experimental platform. (a) Experimental equipment and data acquisition and control system for cold storage; (b) experimental equipment and data collection for cold release.
For modeling, extremely coarse, extra coarse, coarse, standard, fine, and finer meshes are calculated and presented in Table 1. The PVC/PCM properties are listed in Table 2. The deviations in maximum temperature inside the plate of extremely coarse, standard, fine, and finer meshes are within 0.05 °C and 0.002, but the calculation time is longer with fine and finer meshes than normal. Therefore, the following works are performed using standard meshes to reduce computation time.

Table 1.
Model Grid Independence Test.
Table 2.
Properties of PVC/PCM.
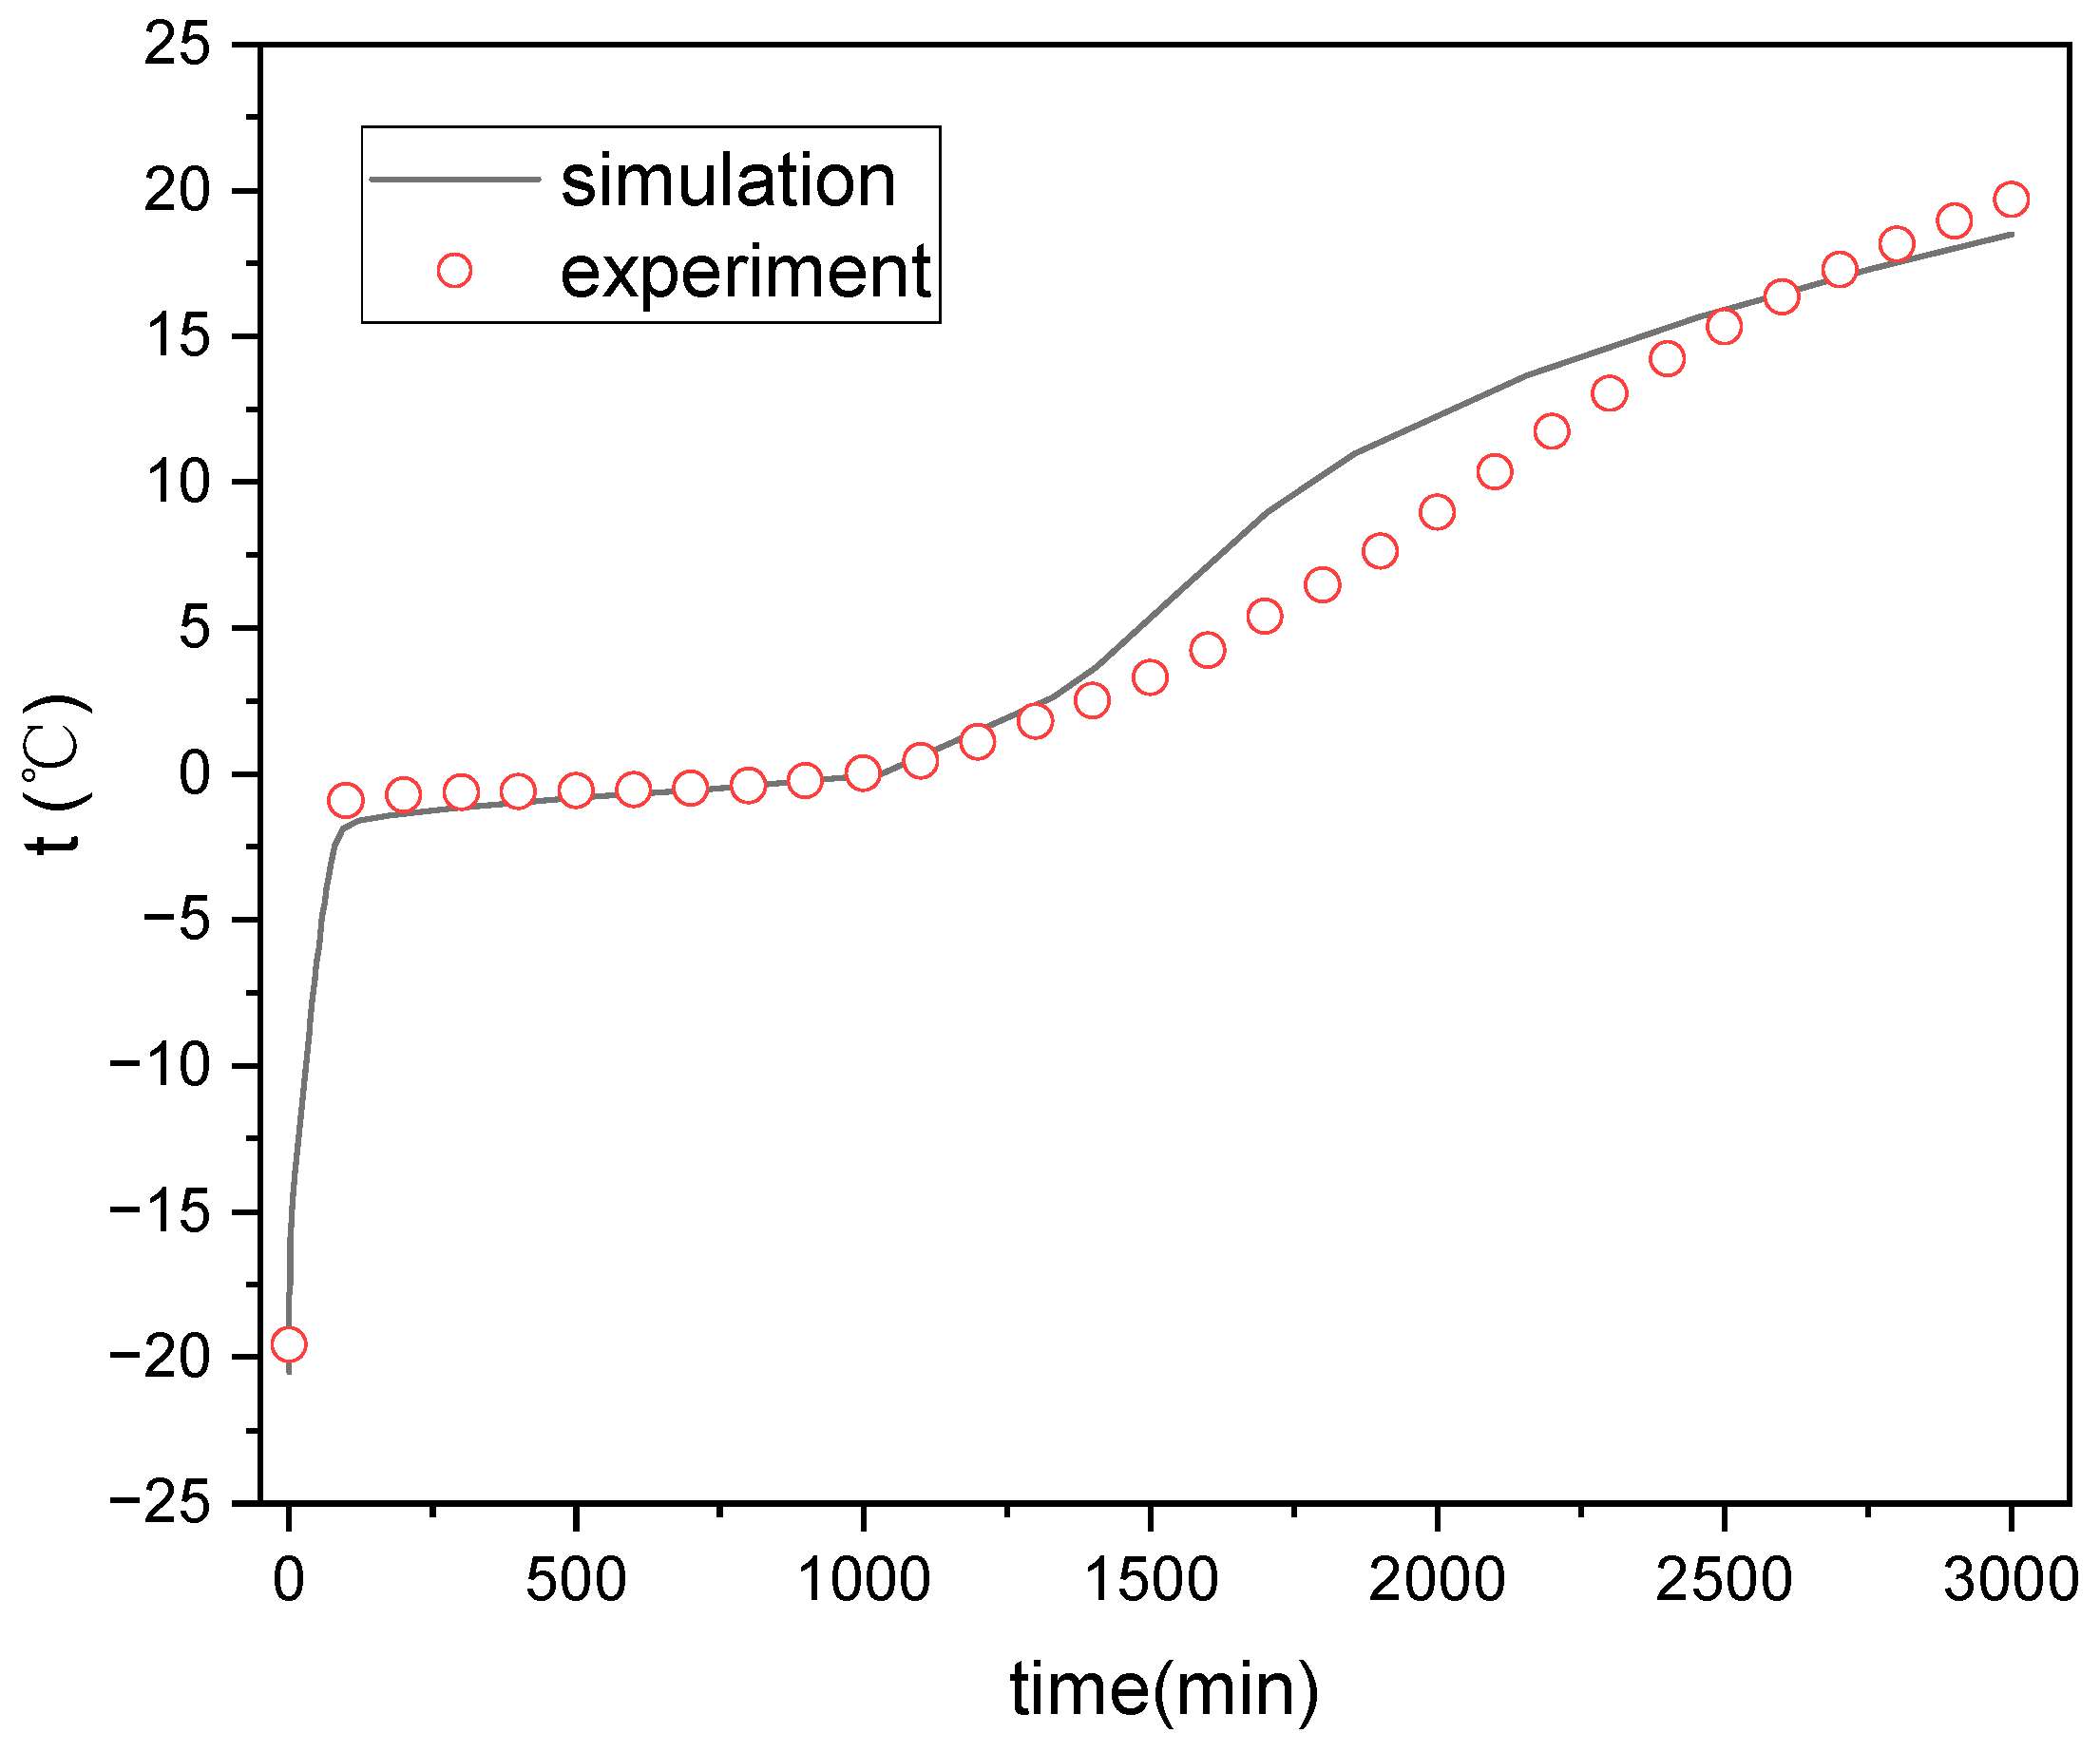
Figure 5 and Figure 6 show the comparison between simulated and test values of the internal temperature of the ice plate during the cold storage and release processes. It can be seen that the simulated values of the temperature inside the ice plate during the cold storage and refrigeration process are consistent with the experimental values. Some points have somewhat large errors, which may be due to the position deviations of the measurement points selected for the simulation and experiment.
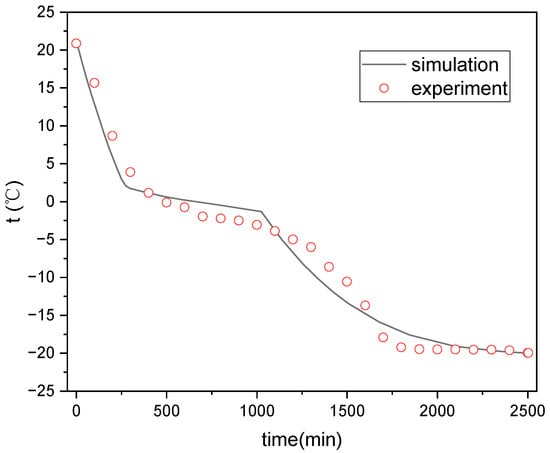
Figure 5.
Temperature variation inside the ice plate during ice storage process.
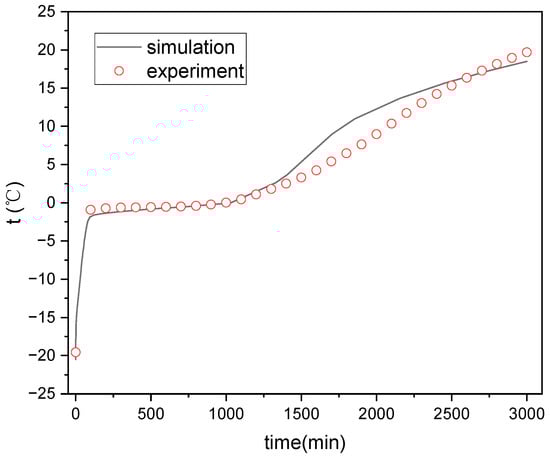
Figure 6.
Temperature variation inside the ice plate during cold release process.
3. Analysis and Discussion
Using the validated model, the cold storage and release characteristics of ice plates with inner and outer fins will be simulated. The plate is 30 cm high, 20 cm wide, 3.5 cm thick, and its wall thickness is 1 mm. The total volume and quantity of fins remain unchanged, and the values of fin spacing, fin height, and fin cross-sectional area are all presented in an equal tolerance sequence. The detailed values are presented in Table 3. The initial temperature is equal to that of fluid around the plate, that is 10 °C and −10 °C in cold storage and release simulation, respectively. The value of h is 9 W/m2·K.
Table 3.
ISP Dimensions.
3.1. Internal Fin Ice Plate Cold Storage and Release Characteristics
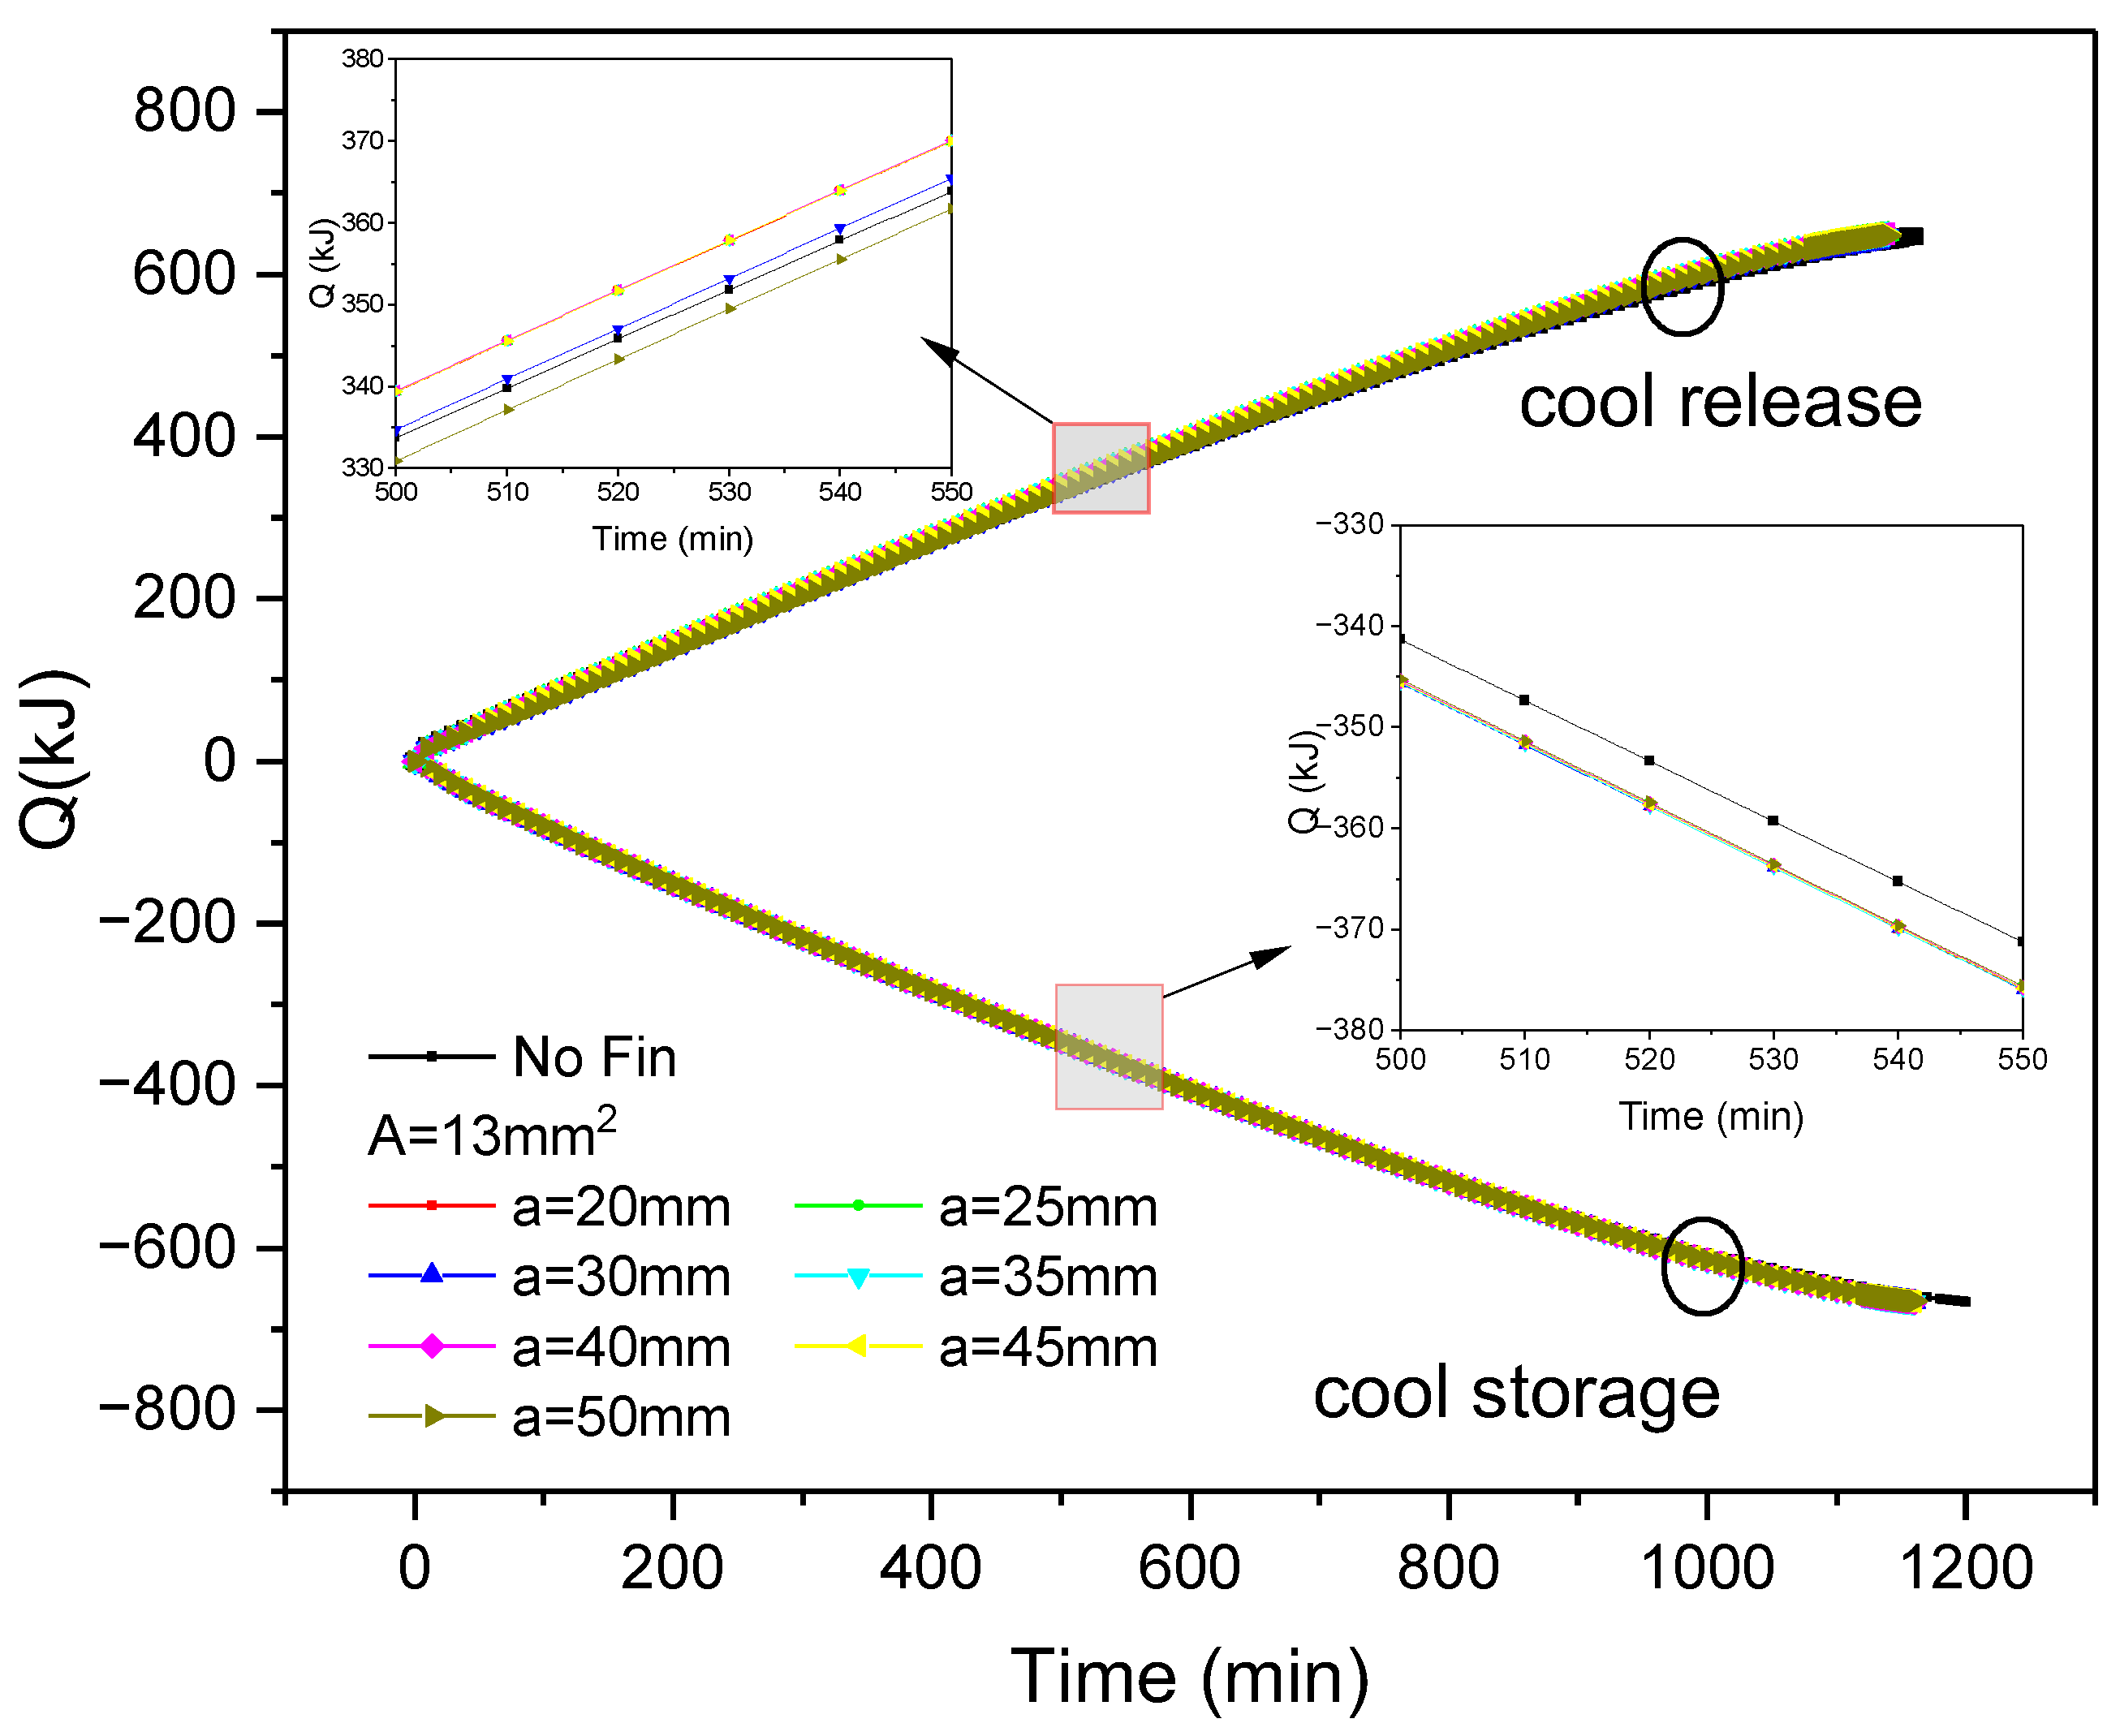
Figure 7 shows the variation in cold storage and release capacity over time during the process of internal fin ice storage and release under various fin arrangements. The cold storage and release capacity at any time can be calculated as:
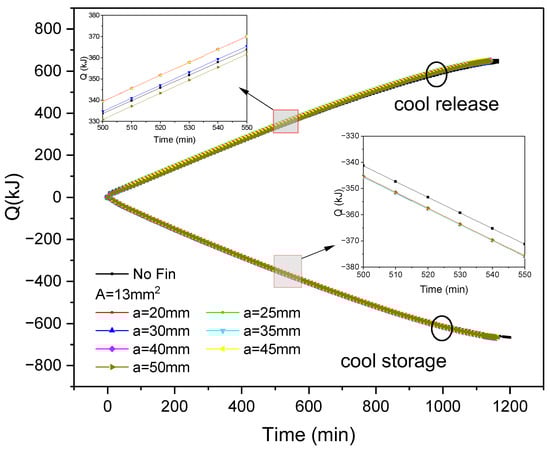
Figure 7.
Changes in cold storage and release capacity of inner finned ice plate during cold storage and release processes with fin distribution and time.
It can be seen that as the cold storage and release progress, both the cold storage and release capacity show an increasing trend. After the completion of the cold storage and release processes, the cumulative cold storage and release amounts reached 665 kJ and 646 kJ, respectively. When the cross-sectional area of the fins is constant, different fin spacing corresponds to different fin distributions, and there are differences between the corresponding ice plate cooling capacity and cold release capacity, indicating that the fin distribution has an impact on the cold storage and release speed. Taking 500–550 min as an example, the cold release of inner fin ice plates with different reference spacing varies by about 10 kJ, while the cooling storage difference is within 1 kJ. This indicates that changing the fin spacing has a lower impact on the cooling storage speed than on the cold release. From this period of time, it can also be seen that adding inner fins increases the cold storage capacity by 4.5 kJ compared to non-finned ice plates, indicating that strengthening heat transfer with inner fins will improve the cold storage speed. When the spacing between fins is less than 50 mm, the cold release speed will be faster than that of non-finned ice plates.
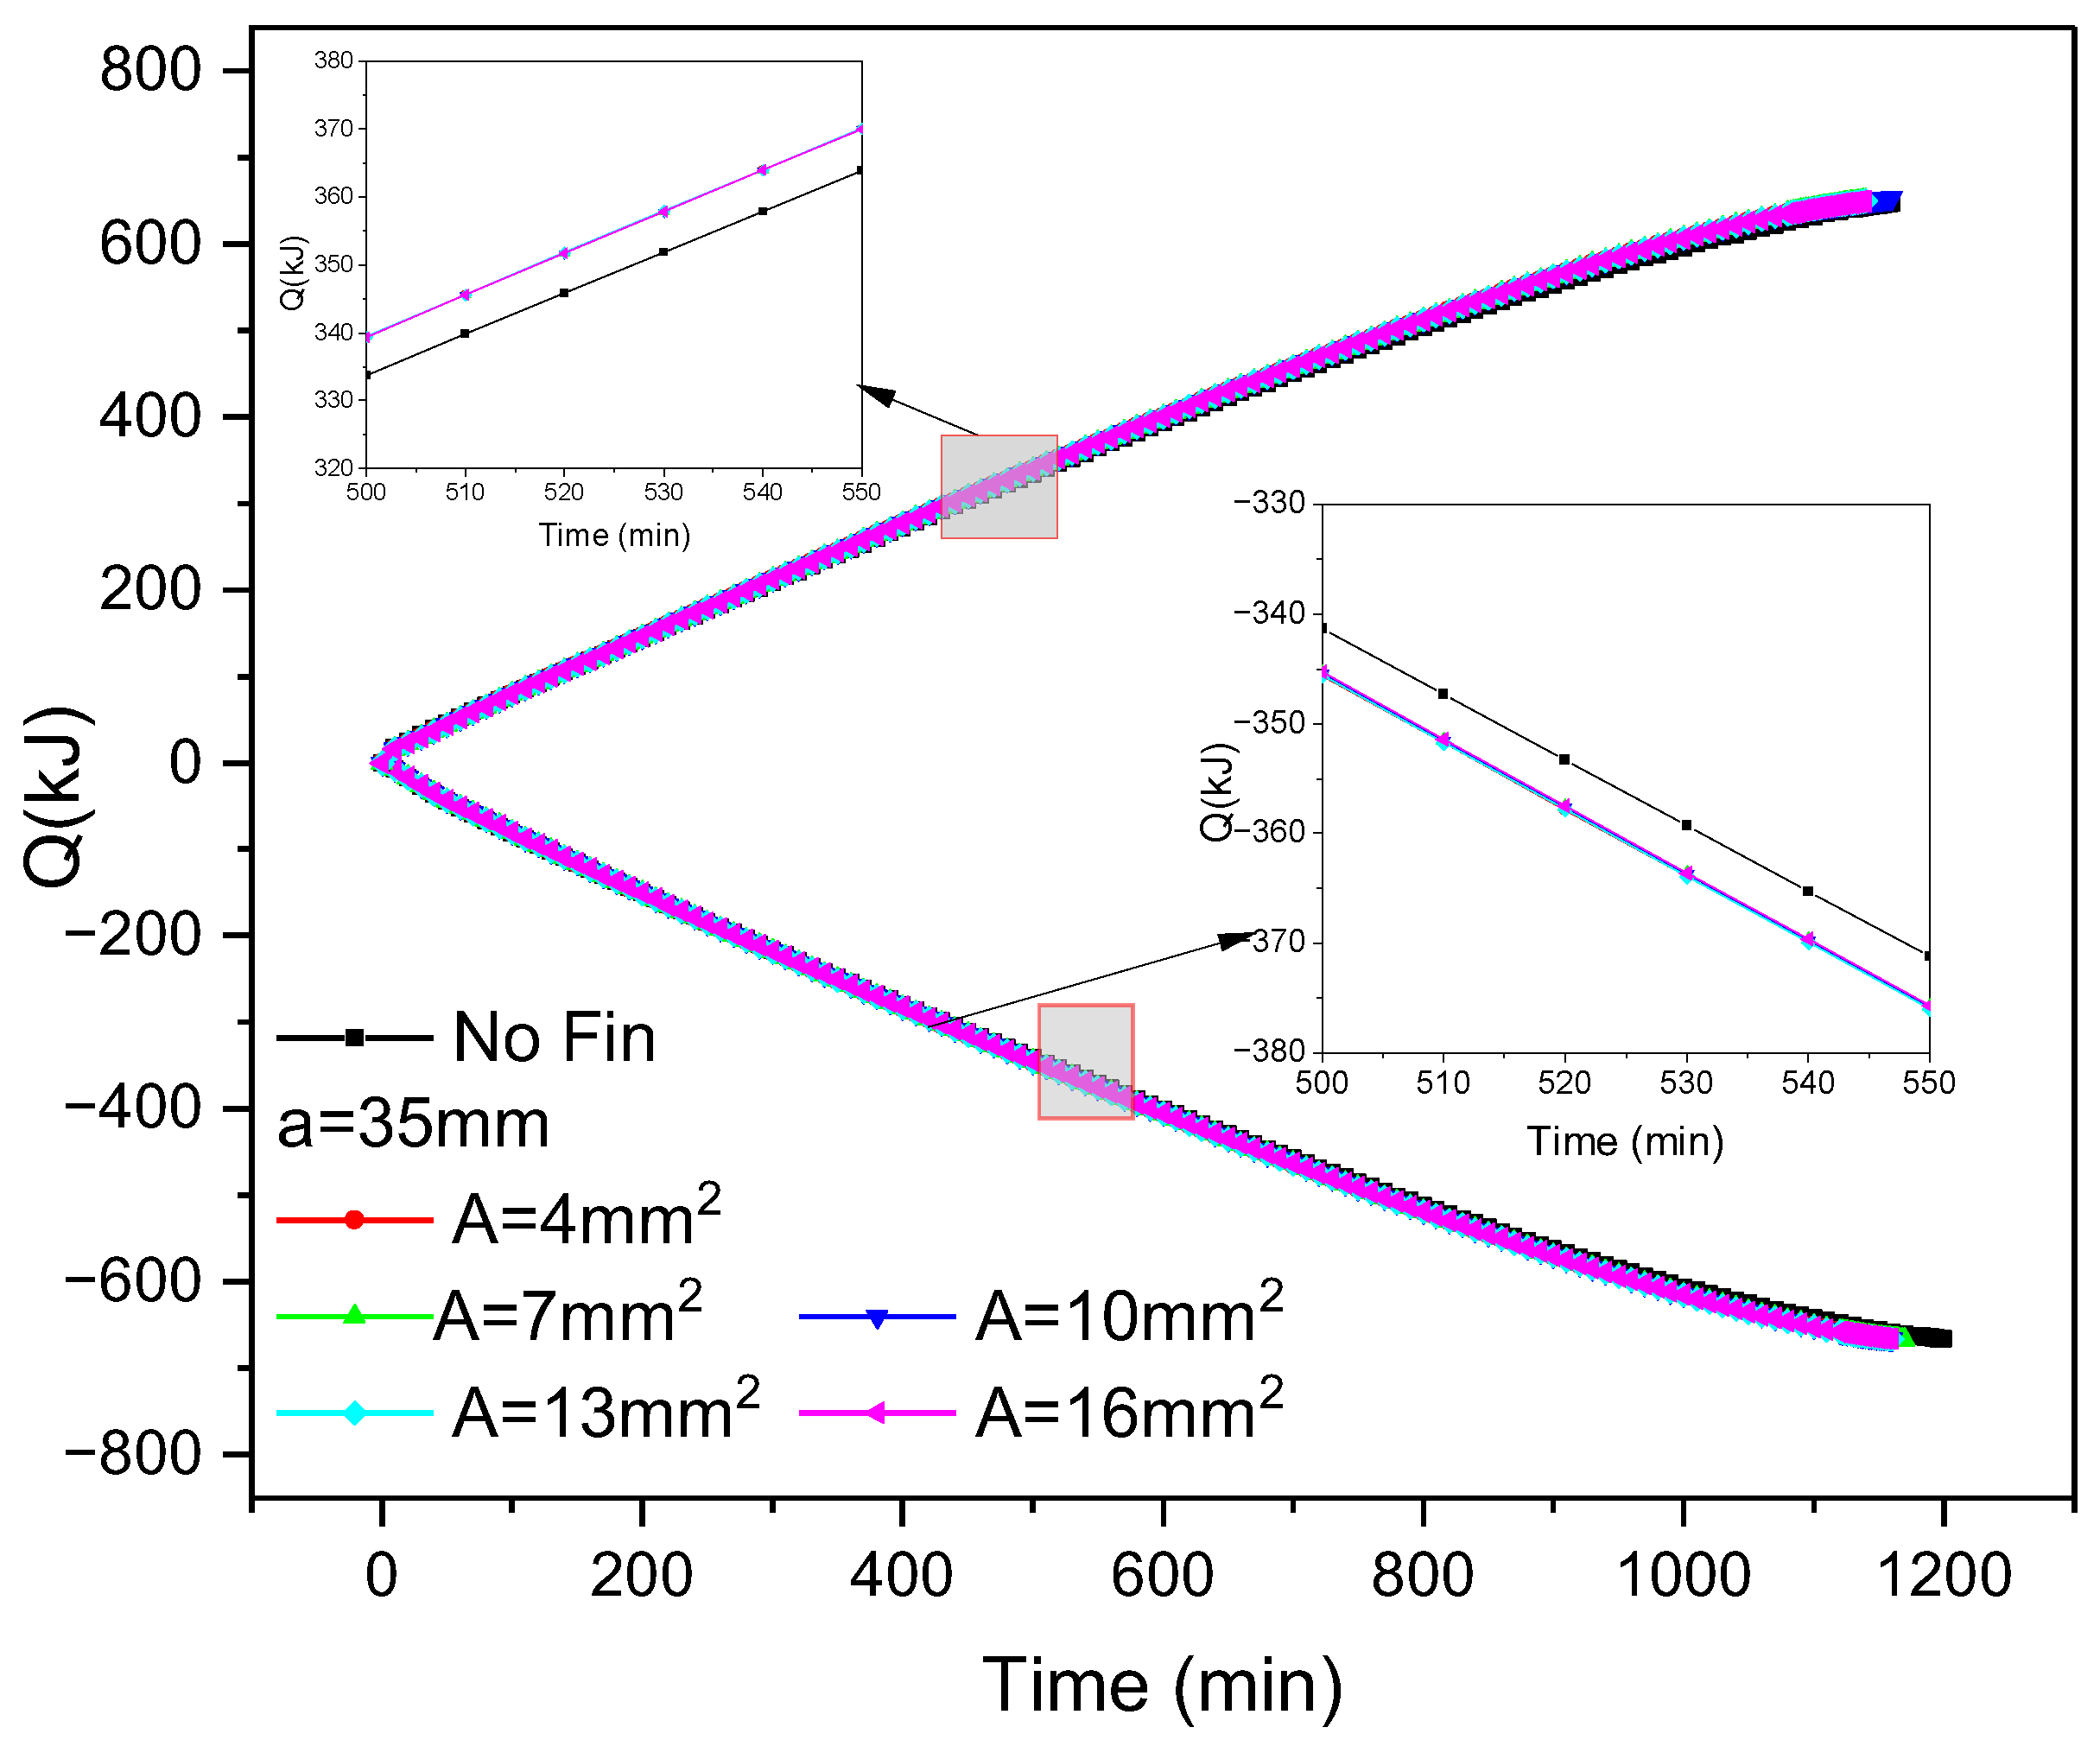
Figure 8 shows the variation in cold storage and release capacity over time during the ice storage and release process of inner fin ice plates under different cross-sectional area conditions. It can be seen that under a constant fin spacing, there is little difference between the ice plate cooling capacity and cold release capacity of different-sized fins. Taking 500–550 min as an example, the difference between cold release capacity and cold storage capacity is within 0.5 kJ. This indicates that the fin size has a relatively small impact on the cooling storage and release speed after the fin distribution is determined. Based on Figure 7, it can be inferred that the distribution of fins has a higher impact on the cold storage and release capacity than the size of the fins. From the figure, it can also be seen that when the reference fin spacing is 35 mm, the increase in cold storage and release capacity of the ice plate with inner fins is faster than that of the ice plate without fins, accelerating by 4 kJ and 5 kJ, respectively.

Figure 8.
Changes in cold storage and release capacity of inner fin ice plate during cold storage and release processes with fin size and time.
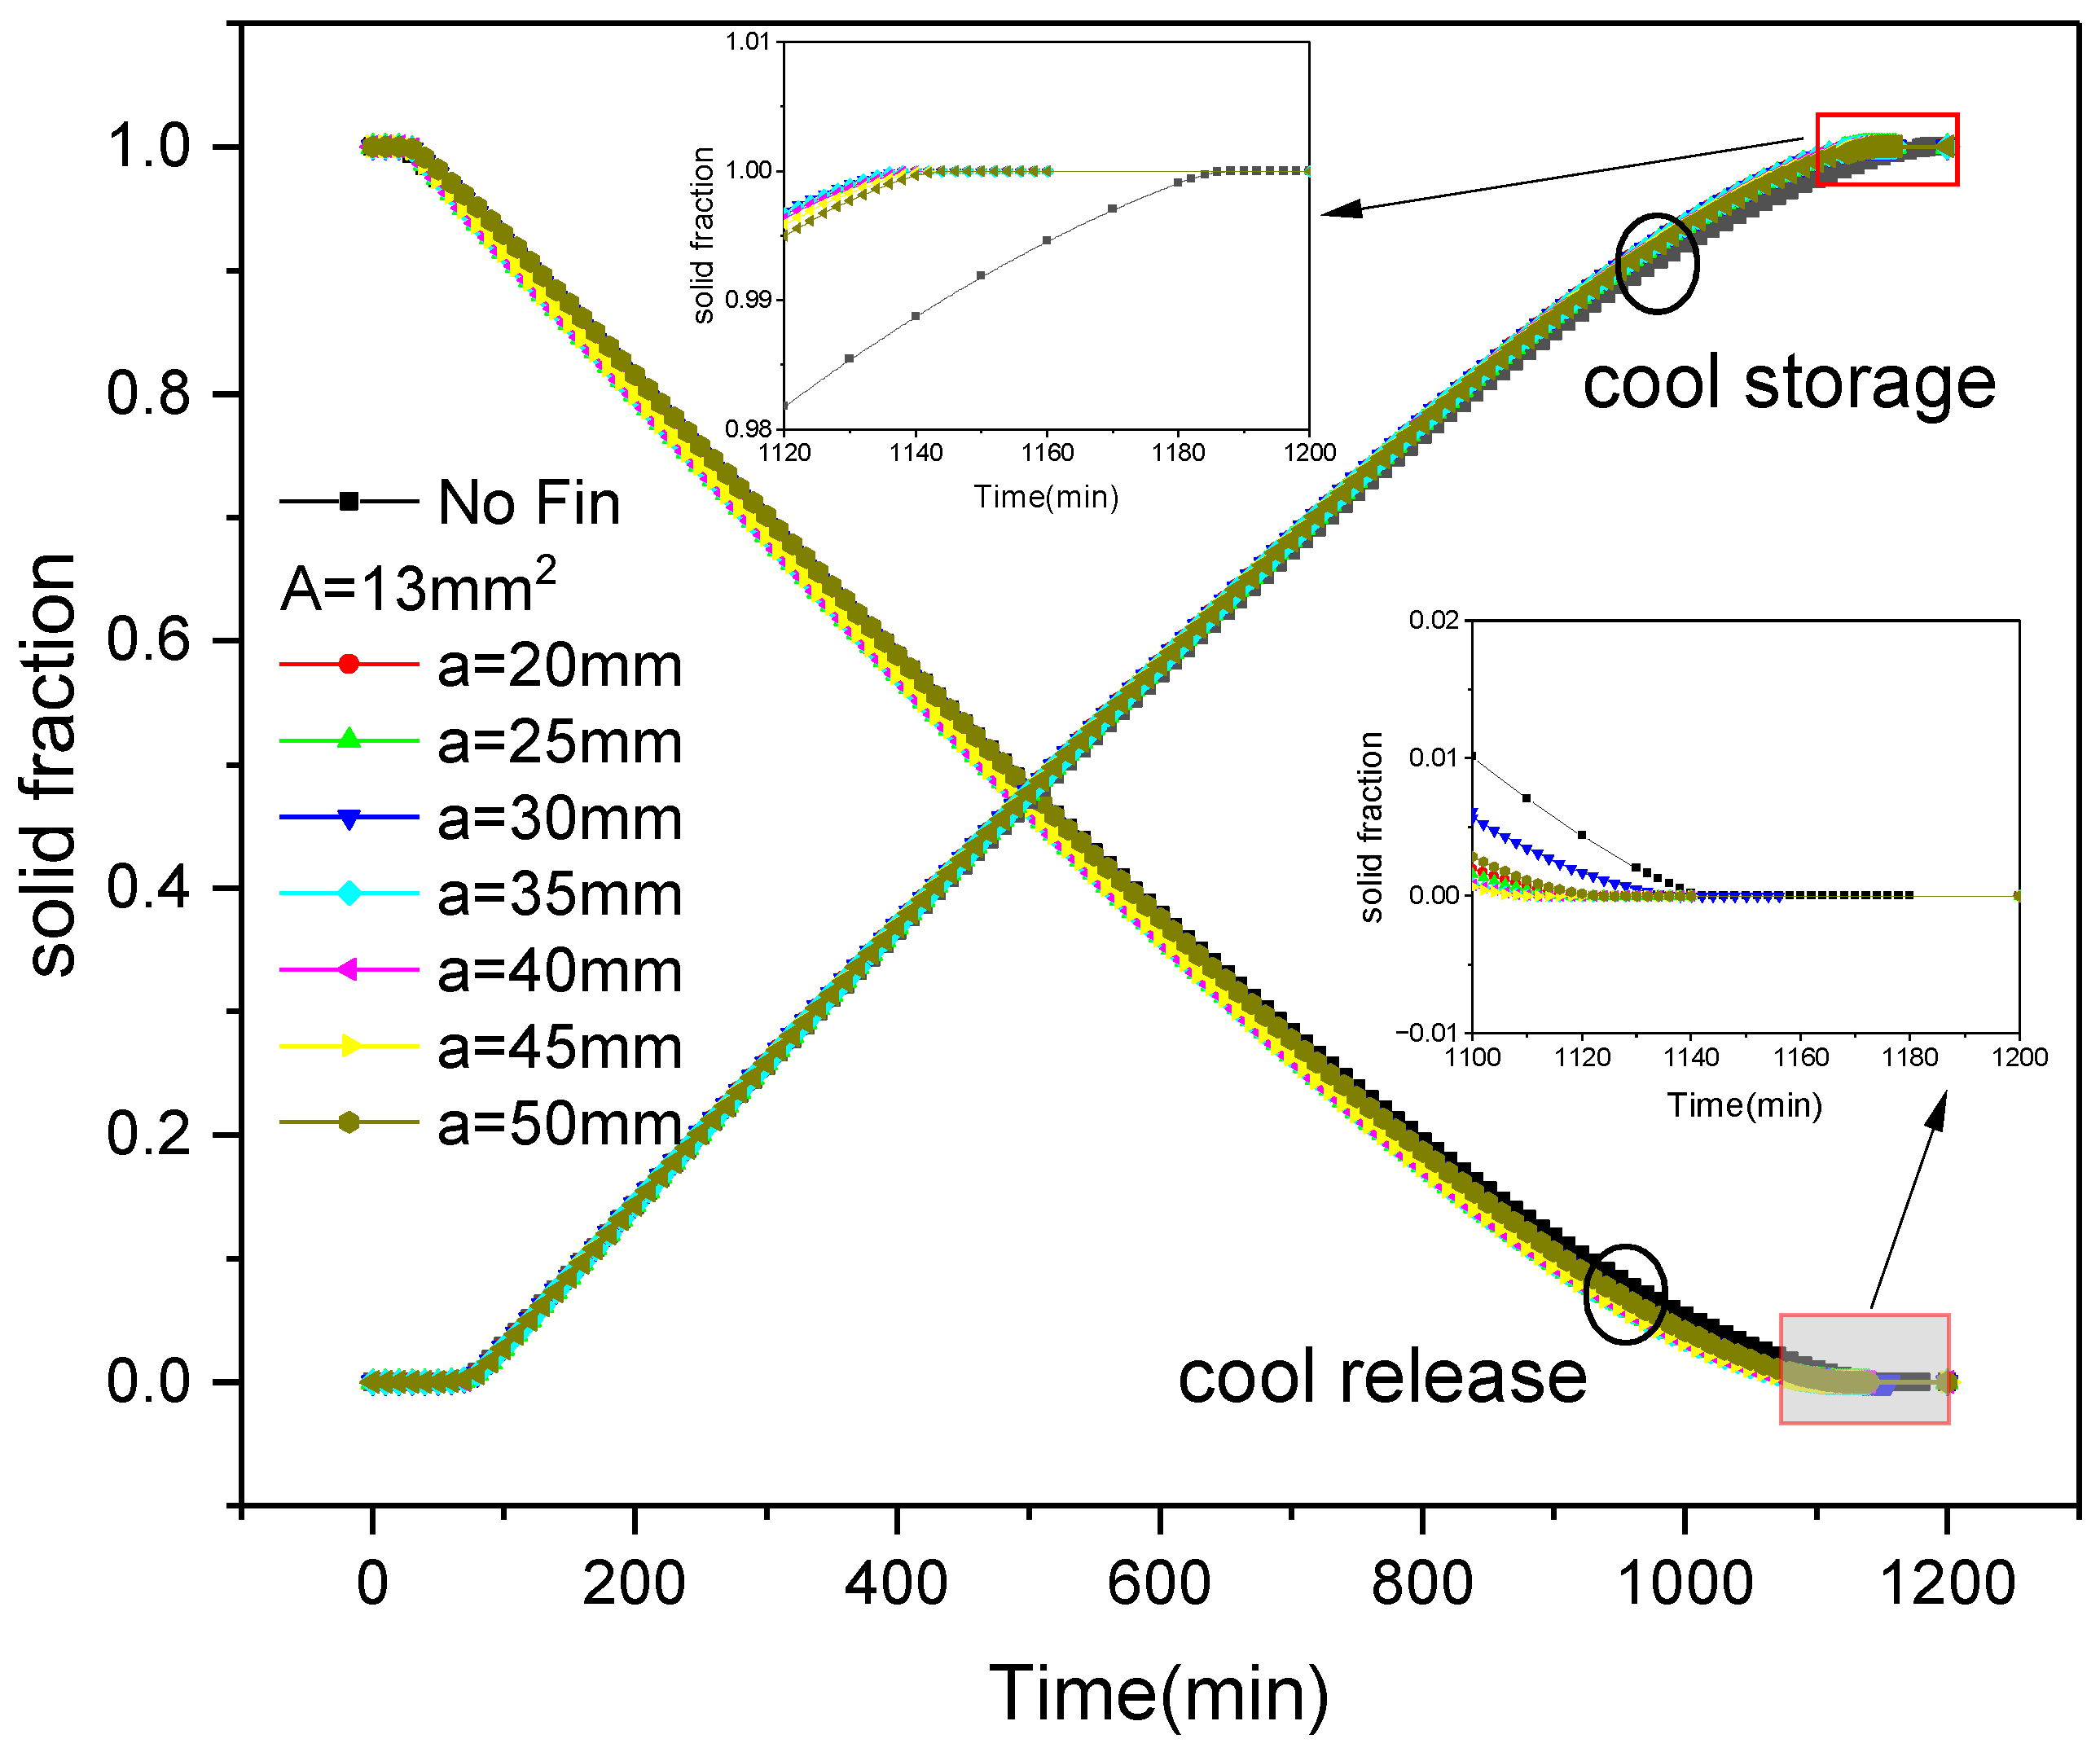
Figure 9 shows the variation in the average solid fraction over time during the process of internal fin ice storage and release under various fin arrangements. The average solid fraction is calculated as:

Figure 9.
Changes in solid fraction with fin distribution and time during the process of internal fin ice storage and release.
It can be seen that as the cold storage progresses, the water inside the ice plate cools down and freezes, and the solid fraction gradually increases. However, as the cold release progresses, the ice inside the plate absorbs heat and melts, and the solid fraction gradually decreases. From the figure, it can also be seen that the cold storage and release processes of the ice plate with fins are faster than those without fins. During the cold storage process, when the cross-sectional area of the fins is constant (A = 13 mm2) and the reference spacing between the fins is set to 20 mm, 25 mm, 30 mm, 35 mm, 40 mm, 45 mm, and 50 mm, the solid fraction of the plate reaches 1, and the time for completing the cold storage is 1140 min, 1138 min, 1138 min, 1138 min, 1140 min, 1142 min, and 1144 min, respectively, which is faster than the 1188 min taken without fins. Thus, the cold storage time is reduced by 48 min, 50 min, 50 min, 50 min, 48 min, 46 min, and 44 min, respectively, representing a saving of 4%, 4.2%, 4.2%, 4%, 3.9%, and 3.7%, respectively. Among them, the cooling storage speed is the fastest when the reference spacing between fins is between 25 mm and 35 mm. During the cooling process, when the solid fraction of the plate corresponding to the above reference spacing of the fins reaches 0, the release completion time is 1122 min, 1122 min, 1126 min, 1116 min, 1116 min, 1114 min, and 1128 min, respectively, which is faster than 1144 min without fins. The cold release time is reduced by 22 min, 22 min, 18 min, 28 min, 28 min, 30 min, and 16 min, representing a saving of 1.9%, 1.9%, 1.6%, 2.4%, 2.4%, 2.6%, and 1.4%, respectively. Among them, the discharge is the fastest when the reference spacing is between 35 mm and 45 mm.
Figure 10 shows the variation in solid fraction over time during the ice storage and release process of inner fin ice plates under diverse cross-sectional area conditions. It can be seen that the trend of solid fraction change is consistent with Figure 9; that is, it gradually increases with the cold storage process and gradually decreases during release. In the process of cold storage, when the distribution of fins is constant, with the reference cross-sectional areas of fins being 4 mm2, 7 mm2, 10 mm2, 13 mm2, and 16 mm2, the completion time of cold storage is 1144 min, 1142 min, 1140 min, 1138 min, and 1138 min, respectively, which is lower than the 1188 min required without fins. The cold storage time is reduced by 44 min, 46 min, 48 min, 50 min, and 50 min, representing a saving of 3.7%, 3.9%, 4%, 4.2%, and 4.2%, respectively. It can be seen that as the cross-sectional area of the fins increases, the cooling storage will accelerate. During cold release, the corresponding time for the ISP mentioned above was 1112 min, 1114 min, 1114 min, 1116 min, and 1118 min, which was faster than the 1144 min without fins. The cooling time was reduced by 32 min, 30 min, 30 min, 28 min, and 26 min, respectively, representing a saving of 2.8%, 2.6%, 2.6%, 2.4%, and 2.3%. It can be seen that as the cross-sectional area of the fins increases, the cooling rate will decrease.

Figure 10.
Changes in solid fraction with fin size and time during ice storage and release of internal finned plate.
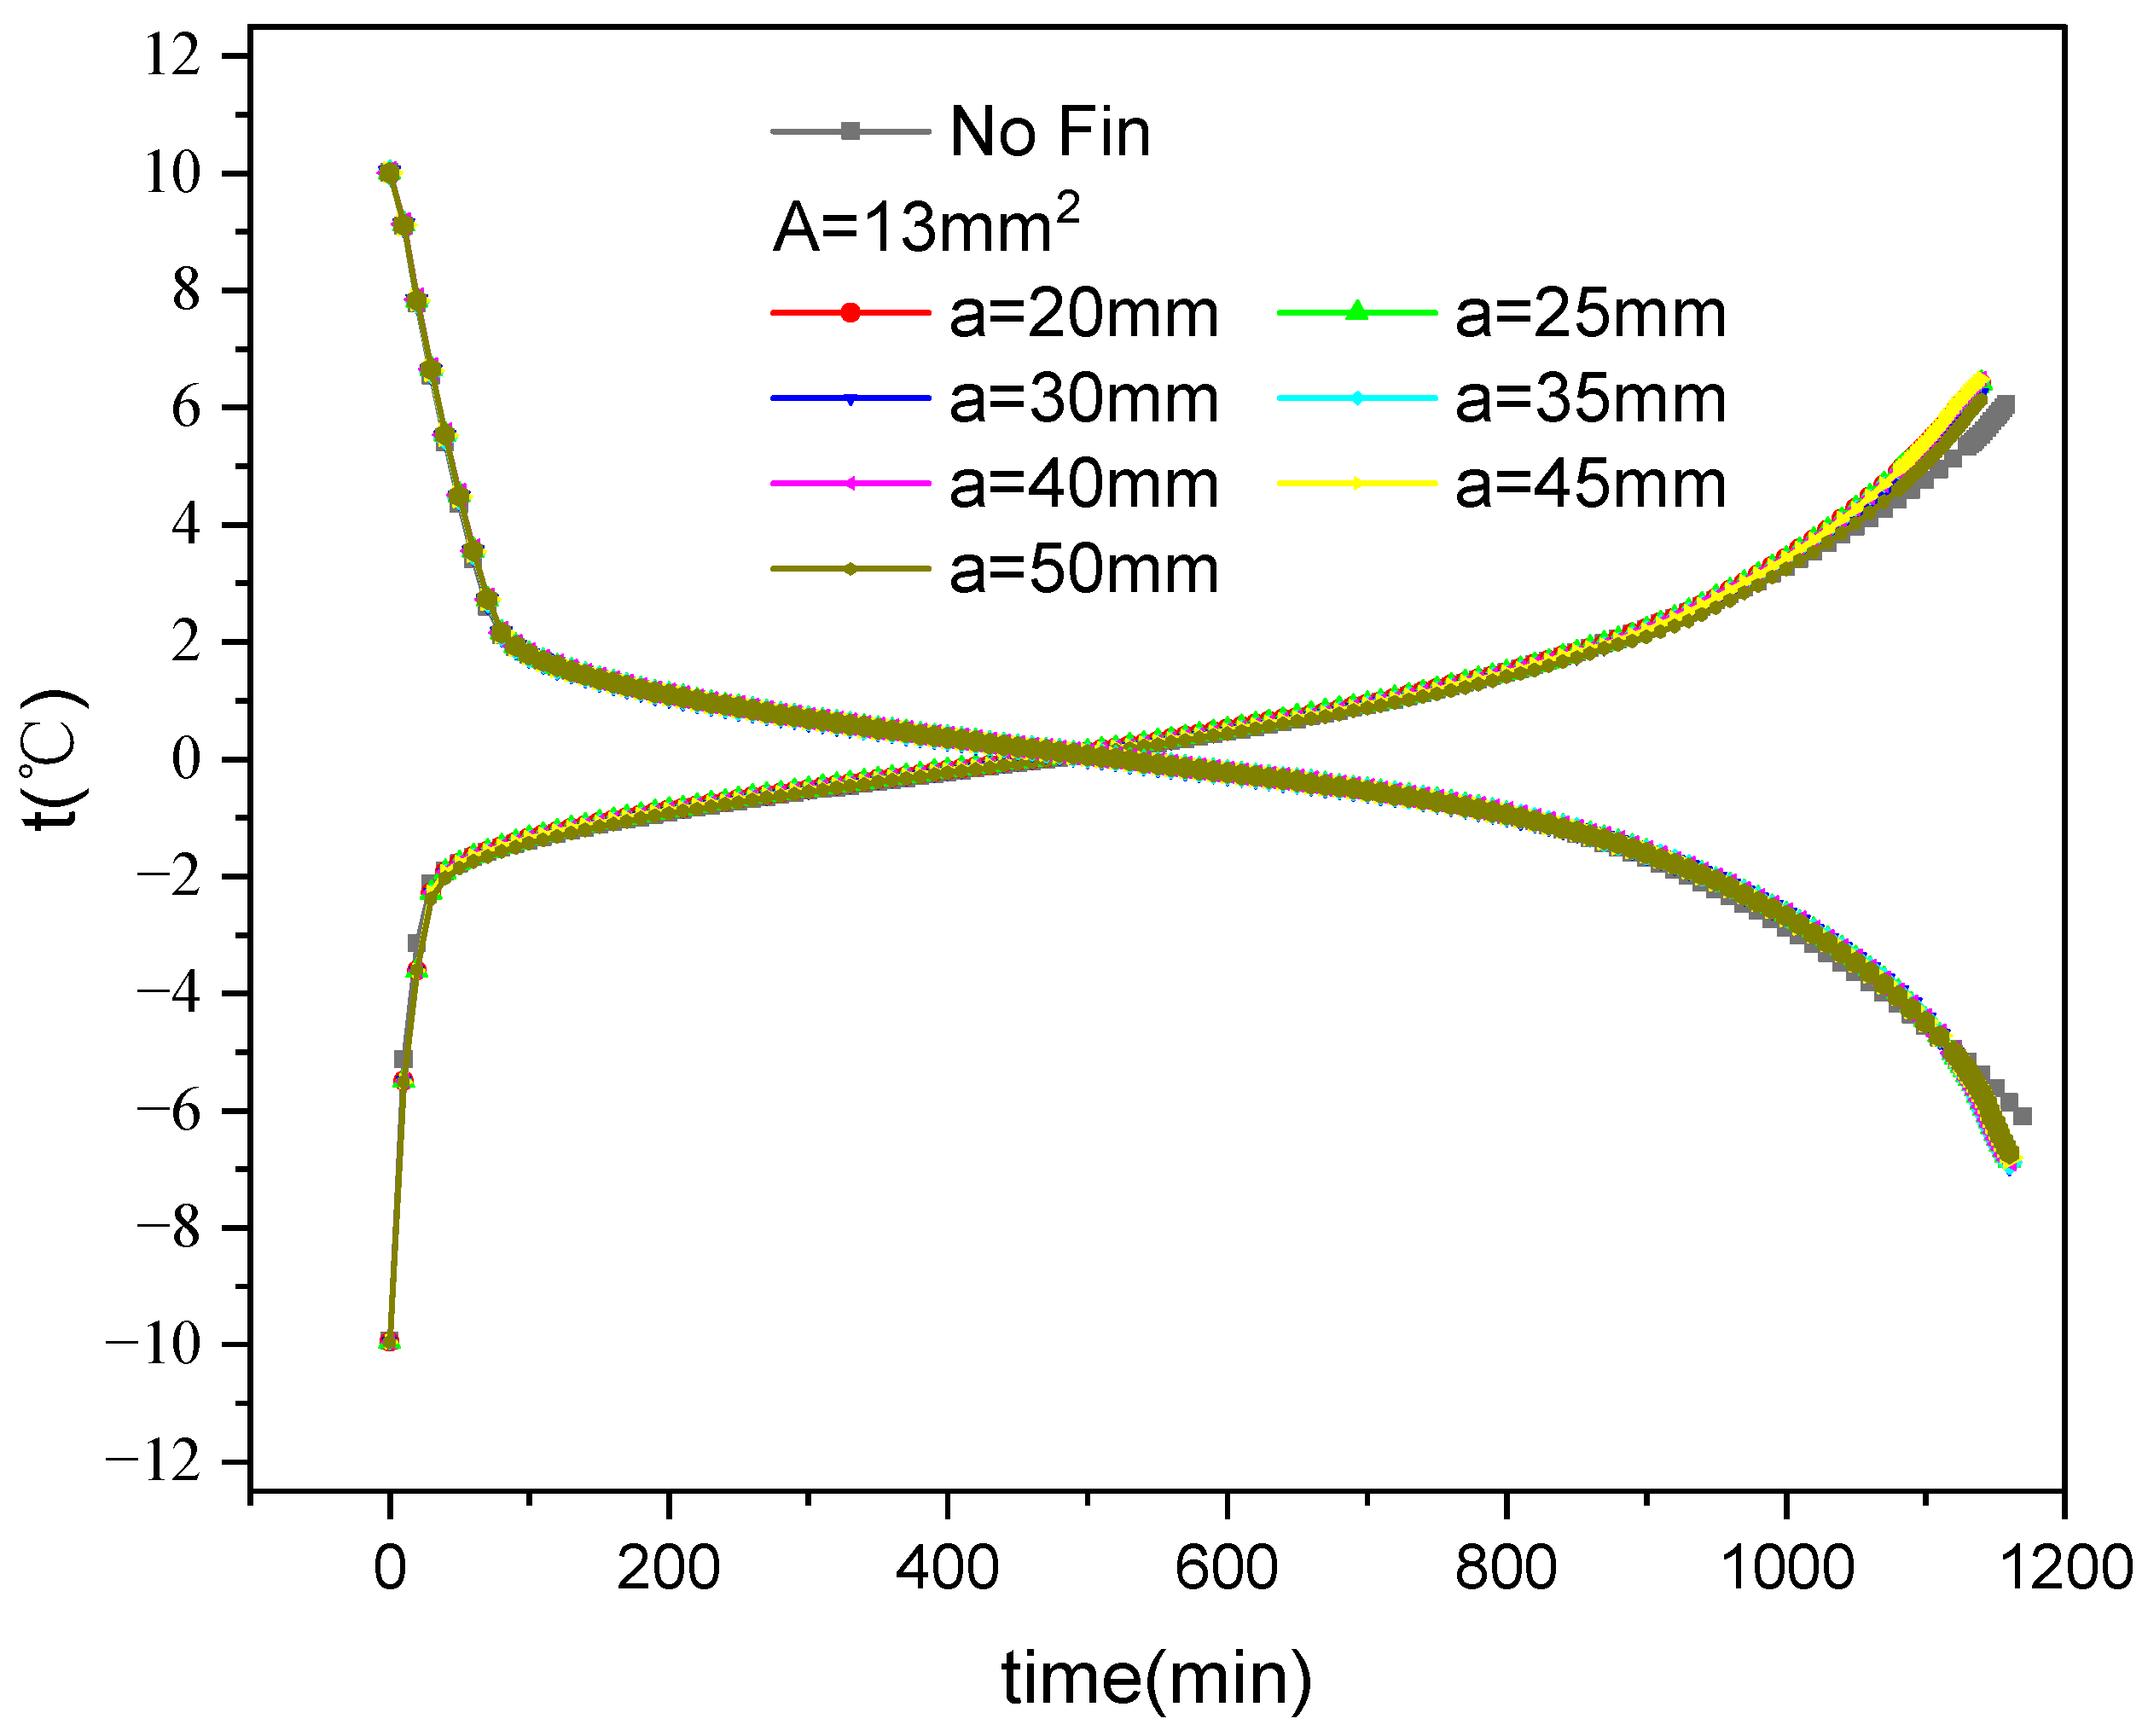
Figure 11 shows the average temperature variation over time during the ice storage and release of inner finned plates with various fin arrangements. The average temperature is calculated using
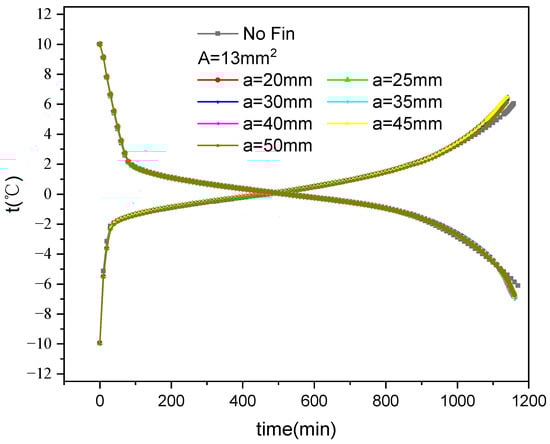
Figure 11.
Variation in average temperature with fin distribution and time during internal fin ice storage and cold release.
It can be seen that the temperature changes during the cold storage and release exhibit three distinct stages. During storage, the first stage is sensible heat storage. The water inside the plate first rapidly cools down and then enters the second stage of latent heat storage after freezing. The temperature change amplitude decreases. After the freezing is completed, it enters the third stage of sensible heat storage, and the ice temperature rapidly decreases. During the release process, the first stage is the sensible heat absorption process of the ice inside the plate. Owing to the large temperature difference in heat transfer and the low specific heat of the ice, the temperature rises rapidly. The second stage is the latent heat absorption, where the ice begins to melt and the temperature change amplitude decreases. After all the ice melts into water, it enters the third stage, which belongs to the sensible heat absorption process, and the temperature rises rapidly. From the third stage of the two processes shown in the figure, it can also be seen that the temperature of the finned ice plate decreases faster than that without fins during storage, while the temperature of the finned ice plate increases faster than that without fins during the release process.
Figure 12 shows the average temperature variation over time during the ice storage and release process of inner fin ice plates under various cross-sectional area conditions. It can be seen that the trend of the corresponding average temperature is consistent with Figure 11; that is, the cold storage and release processes also exhibit three distinct stages, and the cold storage and release speed of the third stage with finned ice plates is faster than that without fins.

Figure 12.
Variation in average temperature with fin size and time during internal fin ice storage and cold release.
3.2. External Fin Ice Plate Cold Storage and Release Characteristics
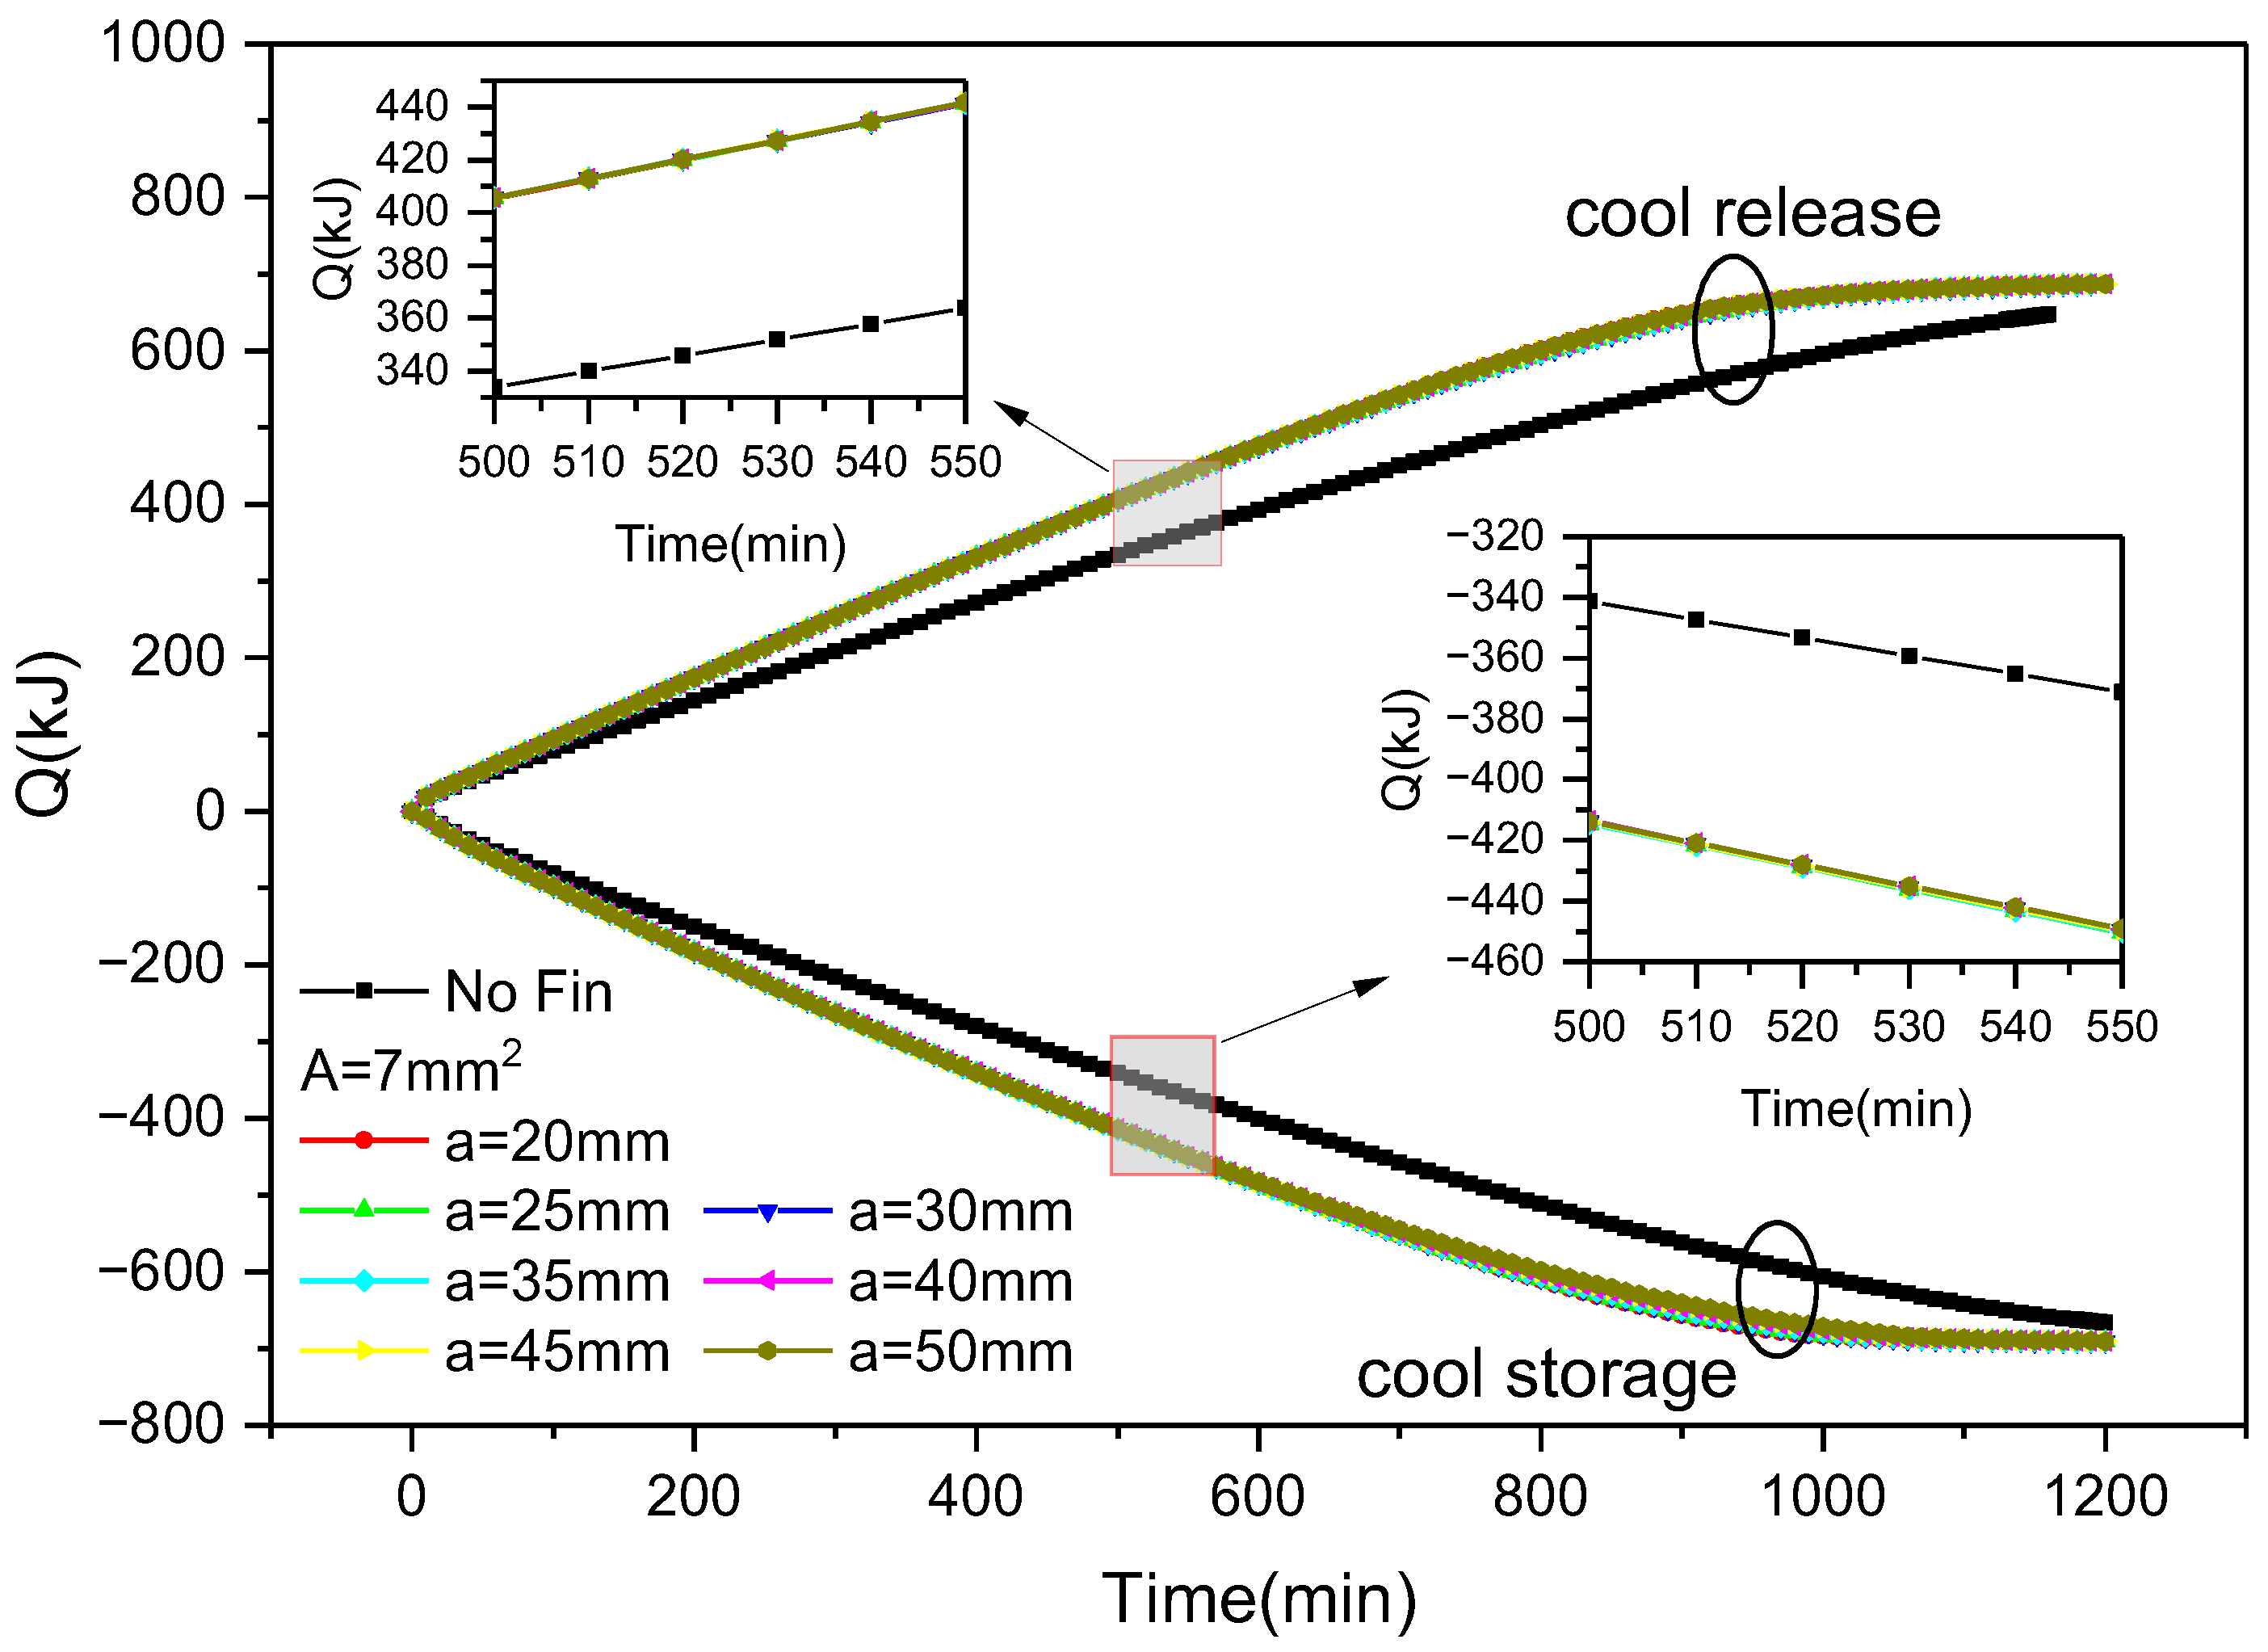
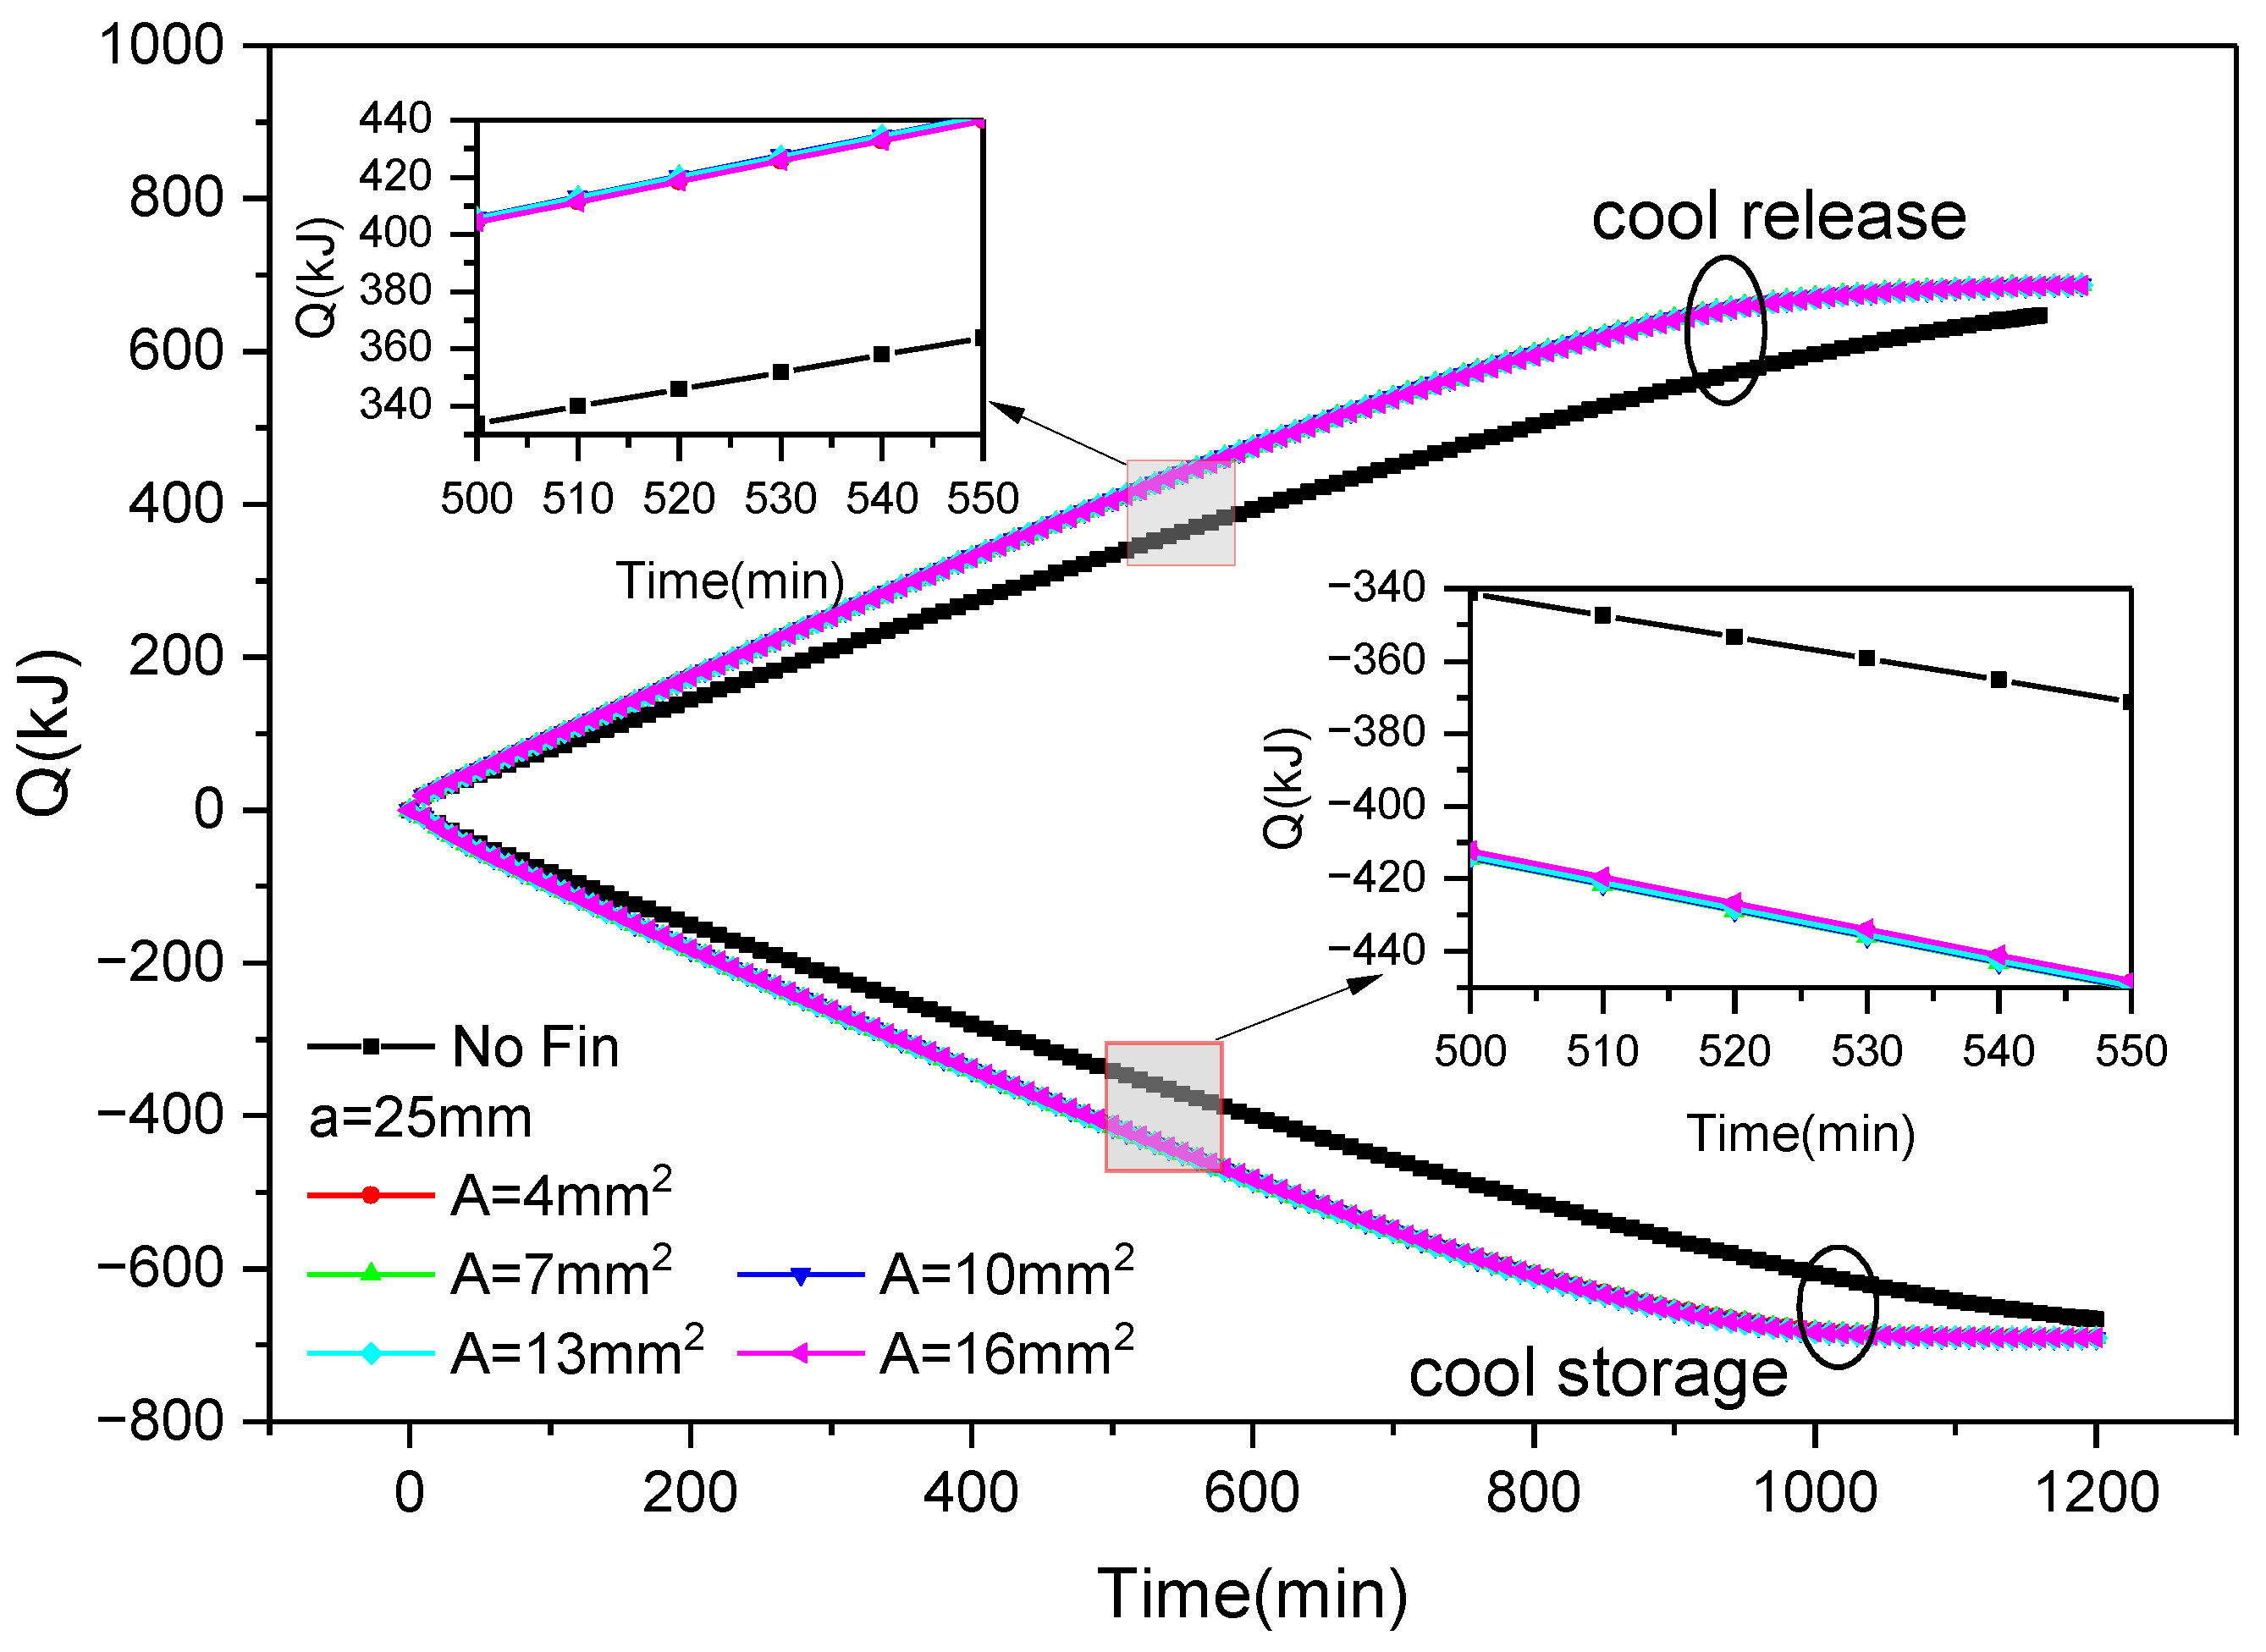
Figure 13 shows the variation in cold storage and release capacity of outer finned plates over time during the ice storage and release process with various fin arrangements. It can be seen that, similar to the inner finned ice plate, as the cold storage and release progress, both the cold storage and release capacity increase. The cold storage capacity increased from 0 to 690 kJ, while the cold release capacity increased from 0 to 689 kJ. When the cross-sectional area of the fins is constant, there is almost no difference between the cold storage and release of ice plates with non-uniform distribution fins, but they are larger than those without fins. Taking 500–550 min as an example, the difference in release capacity and storage capacity between finned ice plates having different fin spacings is within 1 kJ. This indicates that changing the spacing between outer fins has a relatively small impact on cooling capacity and storage capacity. However, during this period, the cooling capacity and storage capacity of inner and outer fins increase faster than that of non-finned ice plates, increasing by approximately 70 kJ and 75 kJ, respectively.
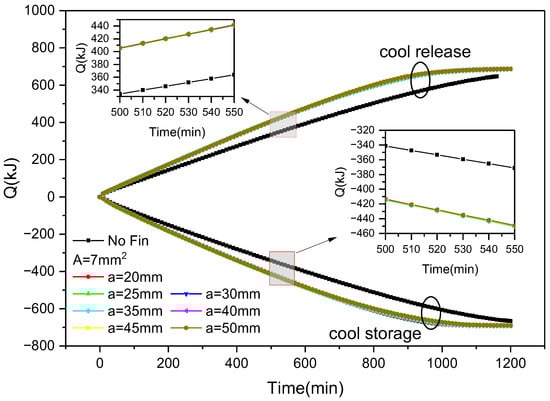
Figure 13.
Variation in cold storage and release capacity with the distribution of fins and time during the cold storage and release process of outer finned ice plates.
Figure 14 shows the variation in cold storage and release capacity of outer finned plates over time during the process of ice storage and release under diverse cross-sectional area conditions. It can be seen that under a certain distribution of fins, the size of the fins has a relatively small impact on the cold storage and release capacity of the ice plate. Taking 500–550 min as an example, the difference in cold release and storage capacity between different ice plates is within 3 kJ. Based on Figure 13, it can be inferred that the size of the fins has a slightly higher impact on the cooling and release rates than the distribution of the fins. From the figure, it can also be seen that the cold storage and release capacity of the ice plate with outer fins increase faster than that of the ice plate without fins, accelerating by about 70 kJ.
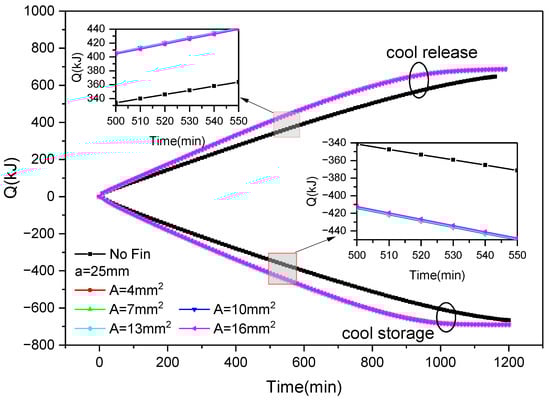
Figure 14.
Changes in cold storage and release capacity of outer fin ice plate with fin size and time during cold storage and release processes.
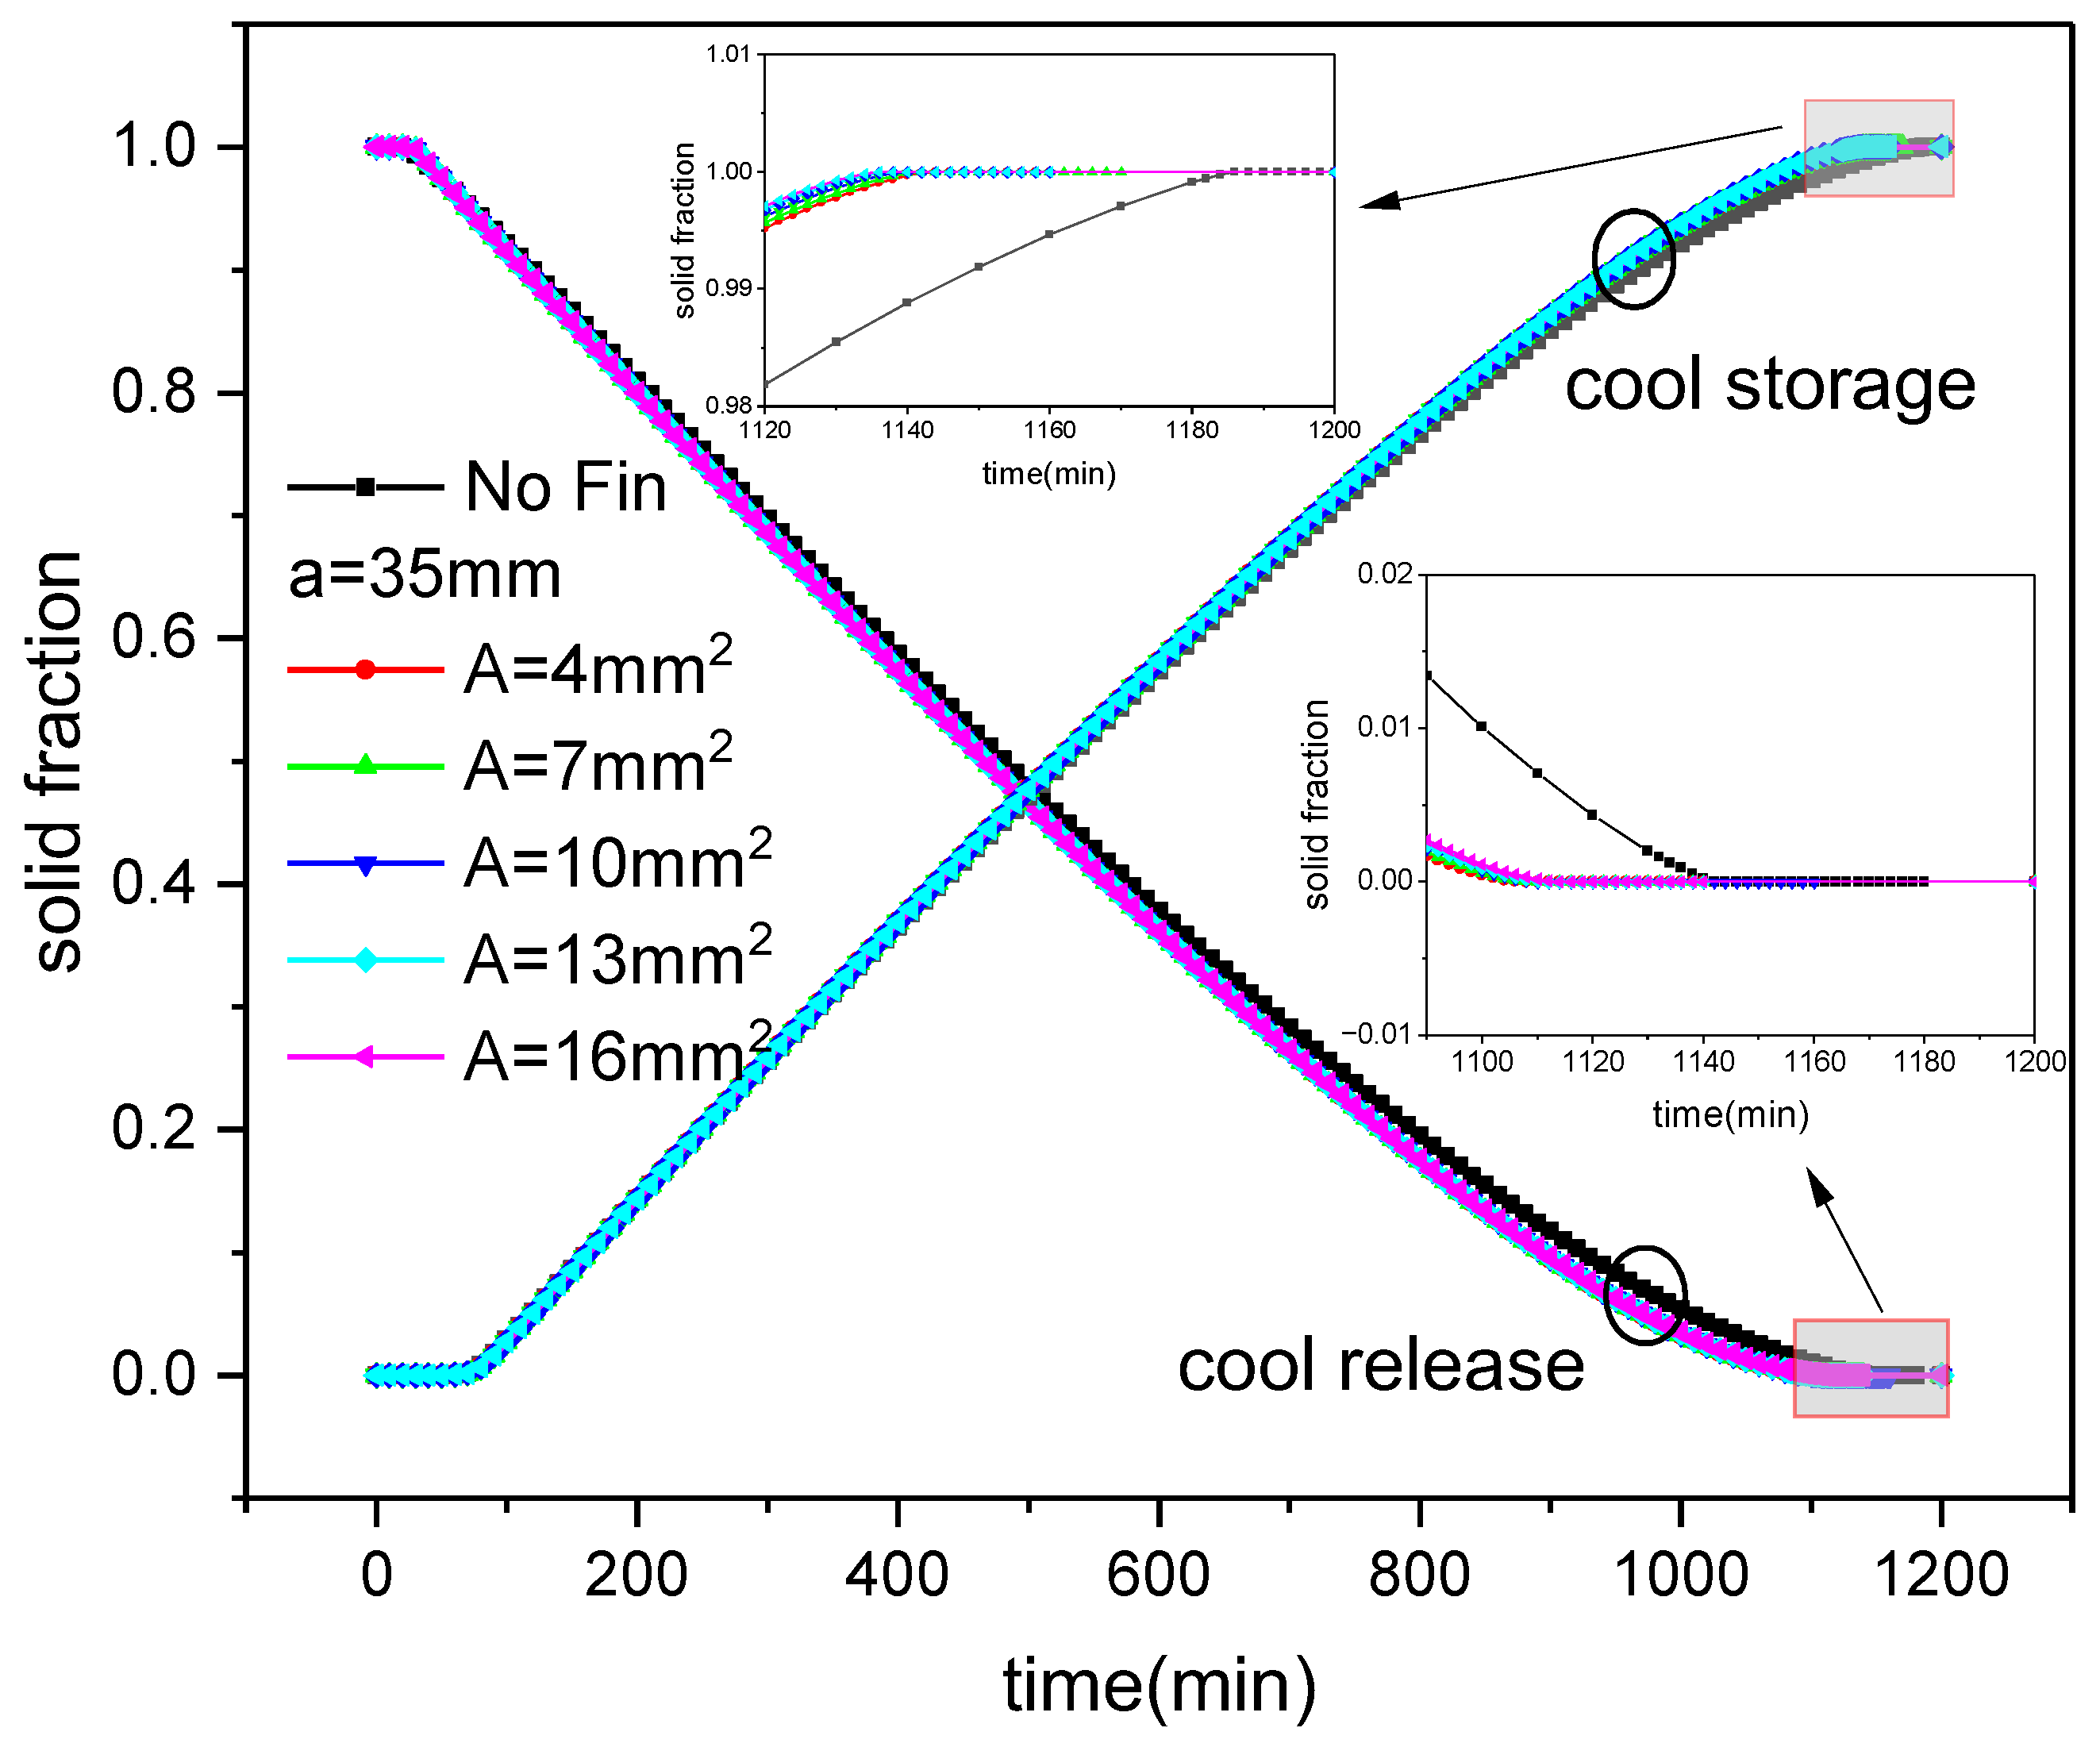
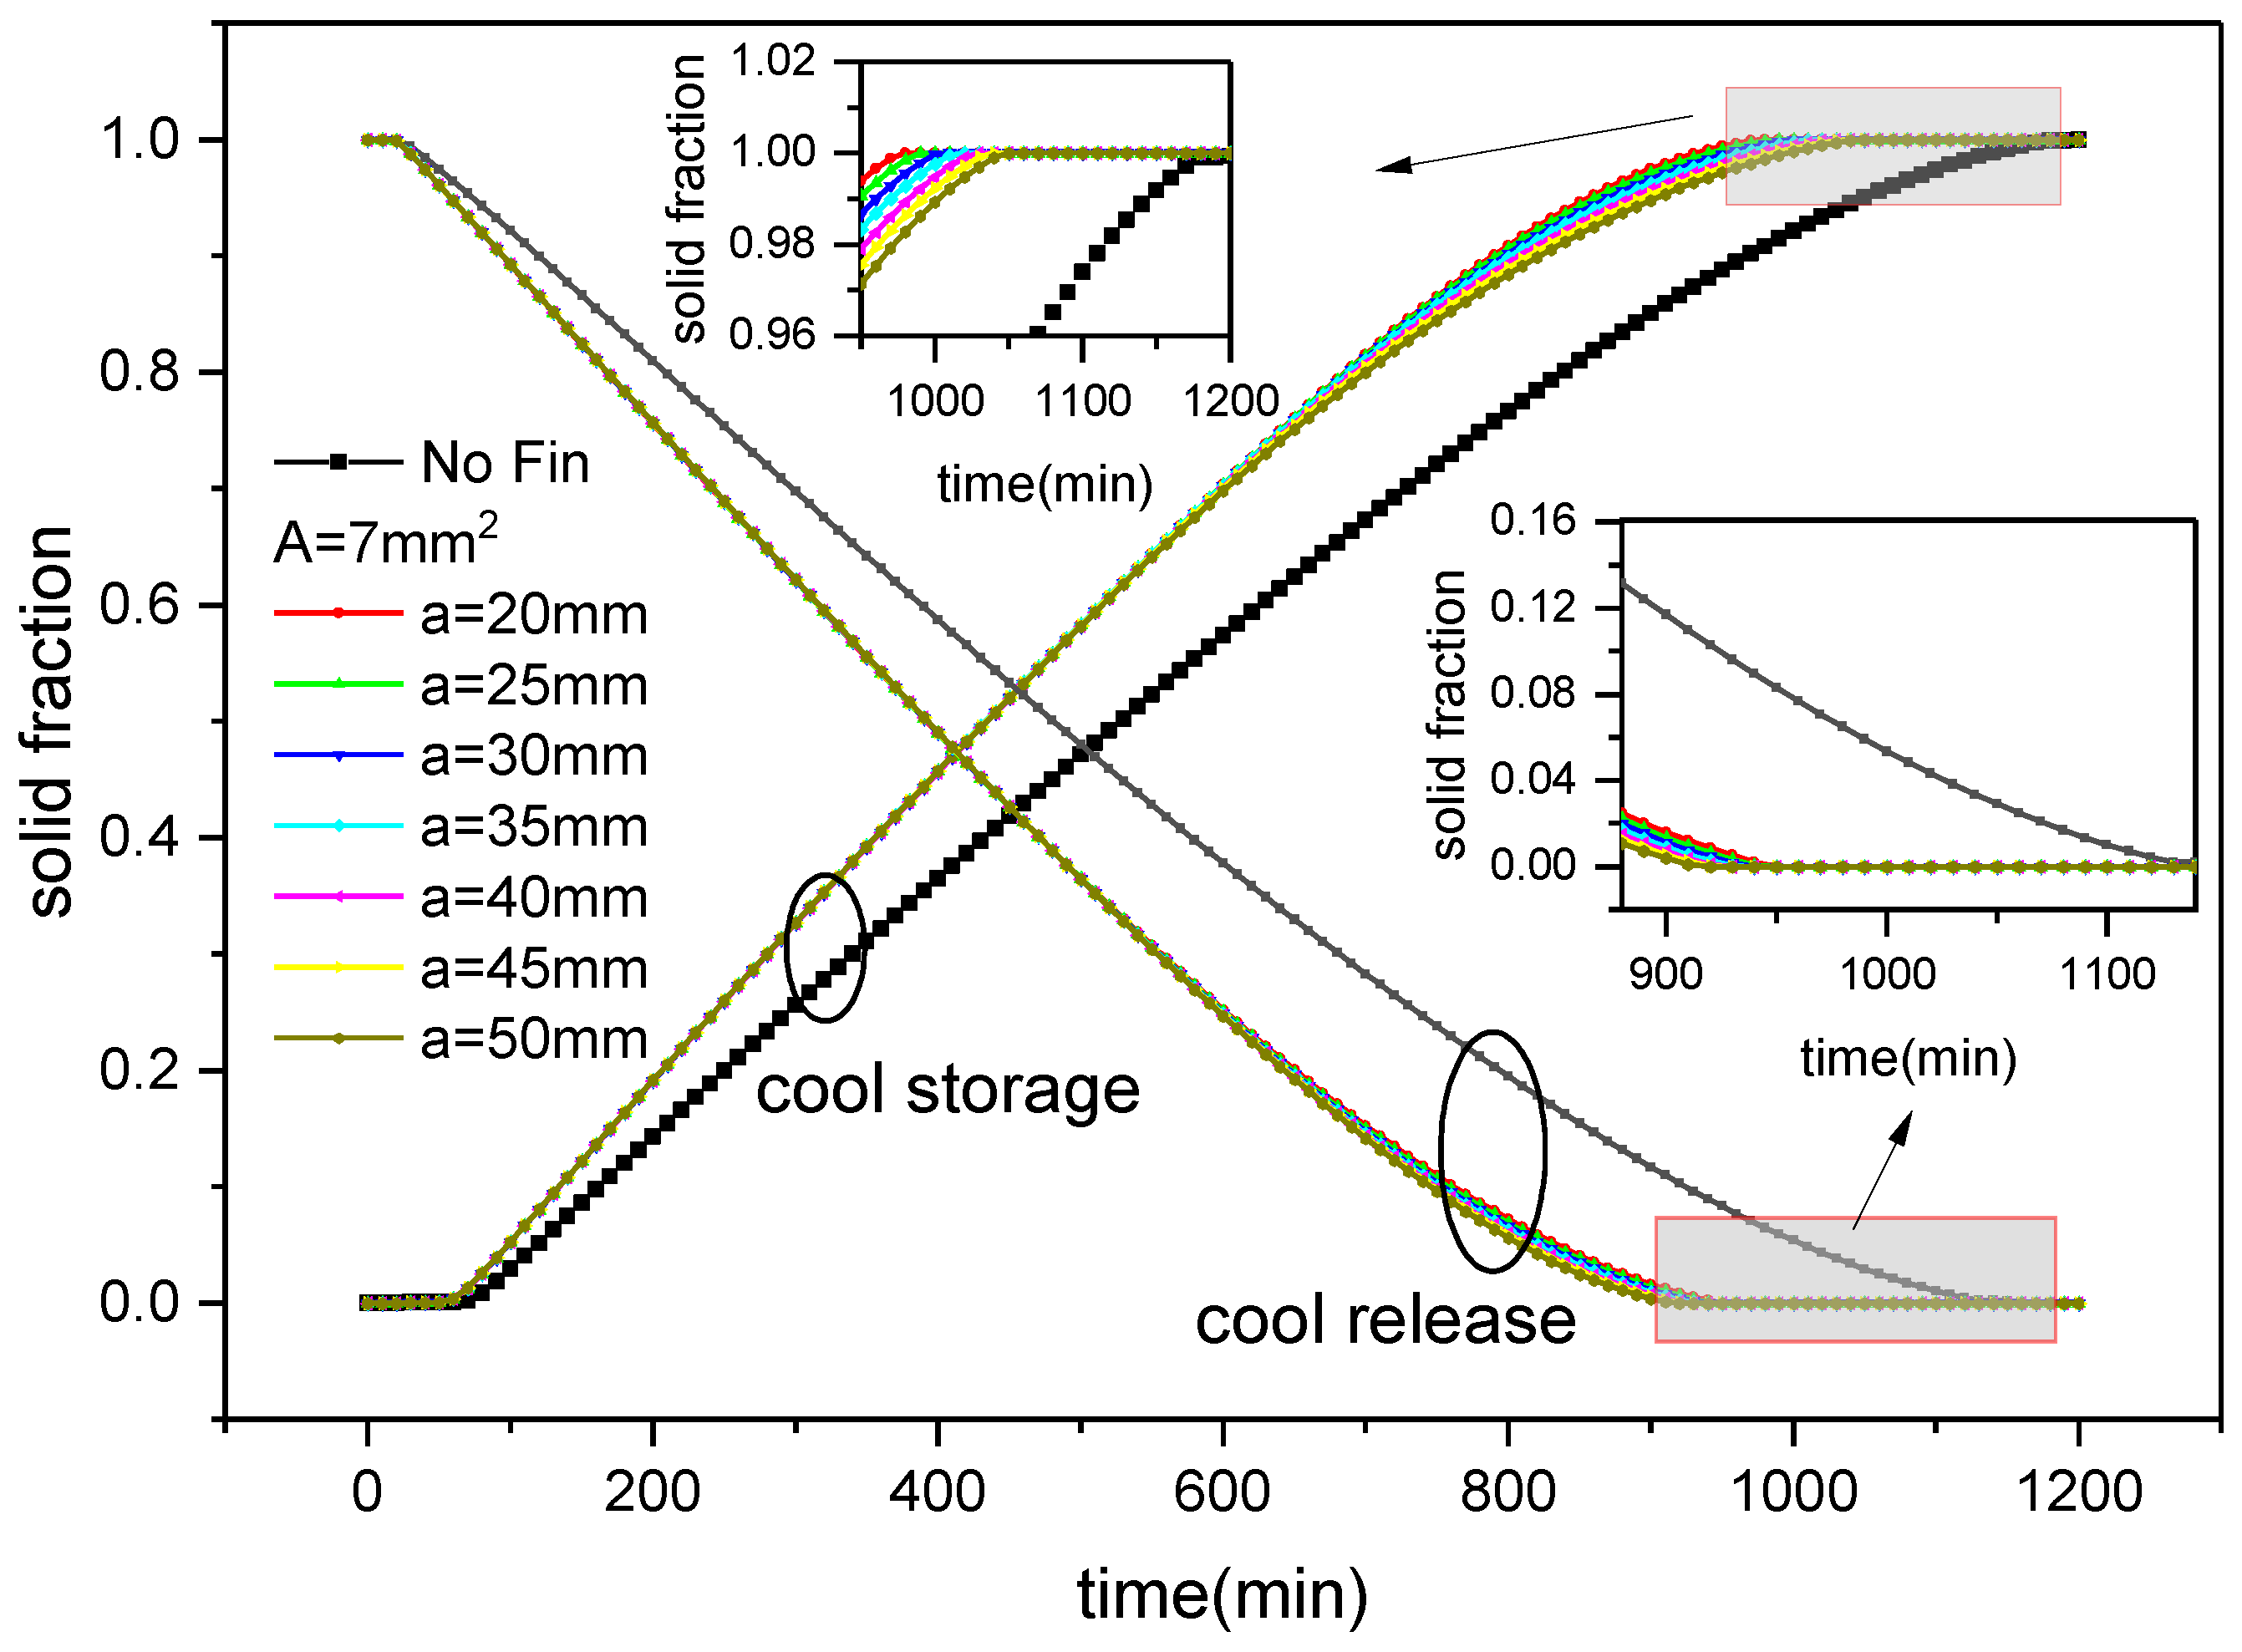
Figure 15 shows the variation in solid fraction over time during the process of ice storage and release of an external finned plate under diverse fin arrangements. It can be seen that as the cold storage progresses, the water inside the ice plate releases heat and freezes, and the solid fraction gradually increases. However, as the cold release progresses, the ice inside the ice plate absorbs heat and melts, and the solid fraction gradually decreases. Furthermore, with the addition of fins, the cold storage and release processes of the ice plate occur significantly faster than those of the finless ice plate. From the graph, it can also be seen that there is not much difference in the evolution of solid fraction in the first half (<600 min) of the phase transition process of both water freezing and ice melting corresponding to different fin distributions, but the difference in solid fraction in the second half increases. During the cold storage process, when the cross-sectional area of the fins is constant (A = 7 mm2) and the reference spacing between the fins is set to 20 mm, 25 mm, 30 mm, 35 mm, 40 mm, 45 mm, and 50 mm, the completion time of the ice plate cold storage is 980 min, 990 min, 1000 min, 1010 min, 1020 min, 1030 min, and 1050 min, respectively. Compared with the plate without fins, the cold storage time is reduced by 208 min, 190 min, 188 min, 178 min, 168 min, 158 min, and 138 min, i.e., 17.5%, 16%, 15.8%, 15%, 14%, 13.3%, and 11.6%, respectively. Compared with inner finned plates of the same fin size and distribution, this method saves 208 min, 190 min, 188 min, 178 min, 168 min, and 158 min, respectively. The cold storage time was reduced by 162 min, 152 min, 142 min, 132 min, 124 min, 116 min, and 98 min, respectively, i.e., 14.2%, 13.3%, 12.4%, 11.6%, 10.8%, 10.1%, and 8.5%. It can be seen that the smaller the reference spacing between the outer fins, the faster the cooling storage, and it is faster than in the case of inner fins and no fins. During the release process, when the cross-sectional area of the fins is constant, the cooling time of the ice plates corresponding to the reference spacing of the fins mentioned above is 960 min, 950 min, 950 min, 940 min, 930 min, 930 min, and 920 min, respectively. Compared with the cooling time without fins, it reduces 184 min, 194 min, 194 min, 204 min, 214 min, 214 min, and 224 min, i.e., 16.1%, 17%, 17%, 17.8%, 18.7%, 18.7%, and 19.6%. Compared with the same size and distribution of inner fin plates, it saves 160 min, 168 min, 156 min, 174 min, 182 min, 196 min, and 206 min, respectively, i.e., 14.3%, 15%, 13.9%, 15.6%, 16.4%, 17.4%, and 18.3%. It can be seen that the cooling rate increases with the increase in the reference spacing between fins, which is also higher than that of the structure without fins and inner fins.
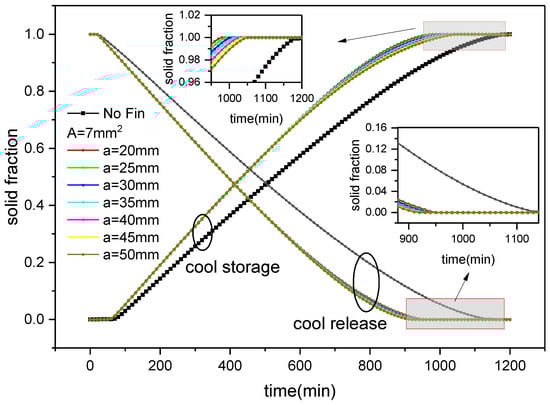
Figure 15.
Changes in solid fraction with fin distribution and time during ice storage and release of external finned plate.
Figure 16 shows the variation in solid fraction over time during the cold storage and release process of the outer finned plate under various cross-sectional area conditions. It can be seen that the trend of solid fraction change is consistent with Figure 14; that is, the solid fraction gradually increases with the cold storage progresses and gradually decreases with the progress of release. During the cold storage, with the distribution of fins being constant, when the cross-sectional areas of fins are 4 mm2, 7 mm2, 10 mm2, 13 mm2, and 16 mm2, the completion time of cold storage is 1000 min, 1000 min, 990 min, 990 min, and 990 min, respectively. Compared with plates without fins, it reduces 188 min, 188 min, 198 min, 198 min, and 198 min, representing savings of 15.8%, 15.8%, 16.7%, 16.7%, and 16.7%, respectively. It can be seen that as the cross-sectional area of the fins increases, the cooling will accelerate, but increasing from 13 to 16 mm2 saves the same amount of time. Compared with an inner finned plate with the same size, the cold storage time is saved by 144 min, 142 min, 150 min, 148 min, and 148 min, respectively, representing savings of 12.6%, 12.4%, 13.2%, 13%, and 13%.
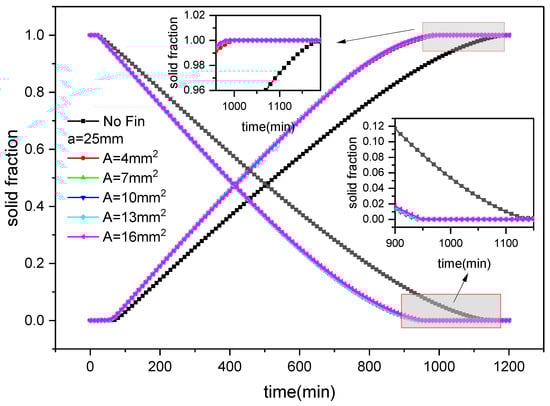
Figure 16.
Changes in solid fraction with fin size and time during the ice storage and release process of external finned plates.
During cold release, with the cross-sectional area of the fins being constant, the corresponding release completion time is 950 min, 950 min, 950 min, 950 min, and 960 min, i.e., a reduction of 94 min, 94 min, 94 min, 94 min, and 84 min compared to that without fins, representing savings of 8.2%, 8.2%, 8.2%, 8.2%, and 7.3%, respectively. It can be seen that the cold release time remains unchanged when the cross-sectional area of the fins increases from 4 mm2 to 13 mm2, but the cold release time decreases when it increases to 16 mm2. Compared with the same-sized inner fin structure, the cold release time is reduced by 174 min, 168 min, 170 min, 172 min, and 164 min, respectively, representing savings of 15.5%, 15%, 15.2%, 15.3%, and 14.6%.
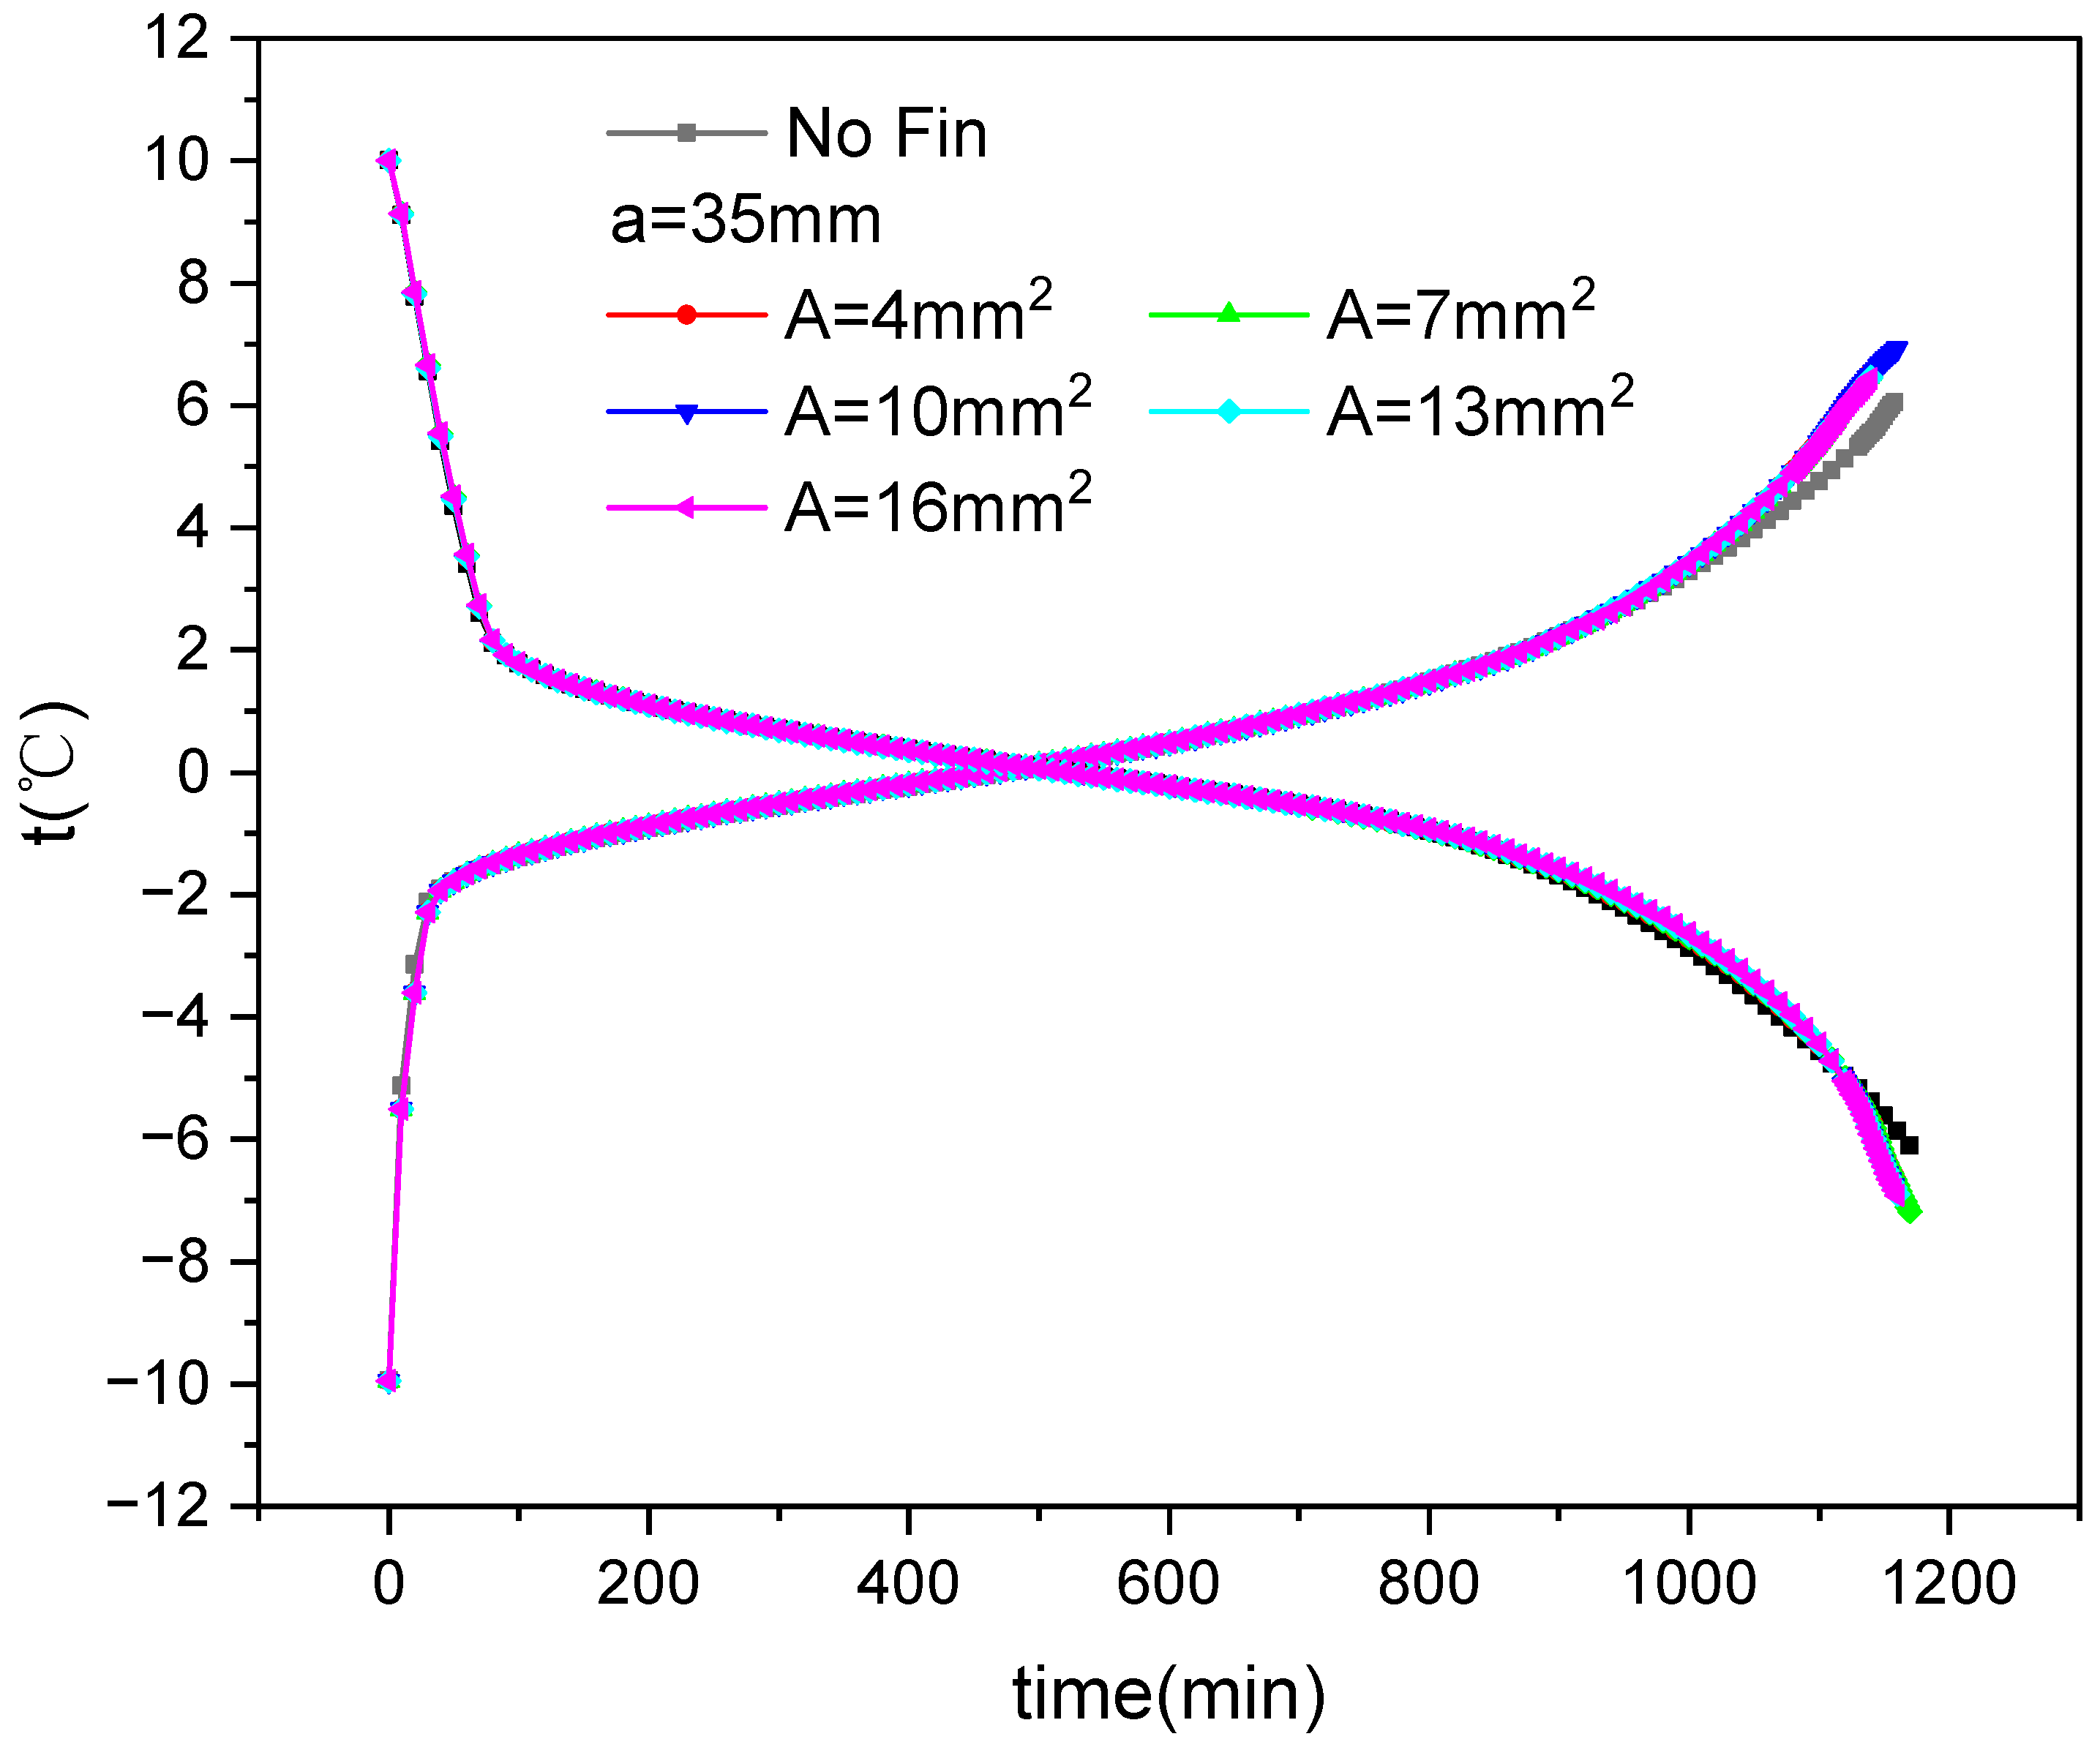
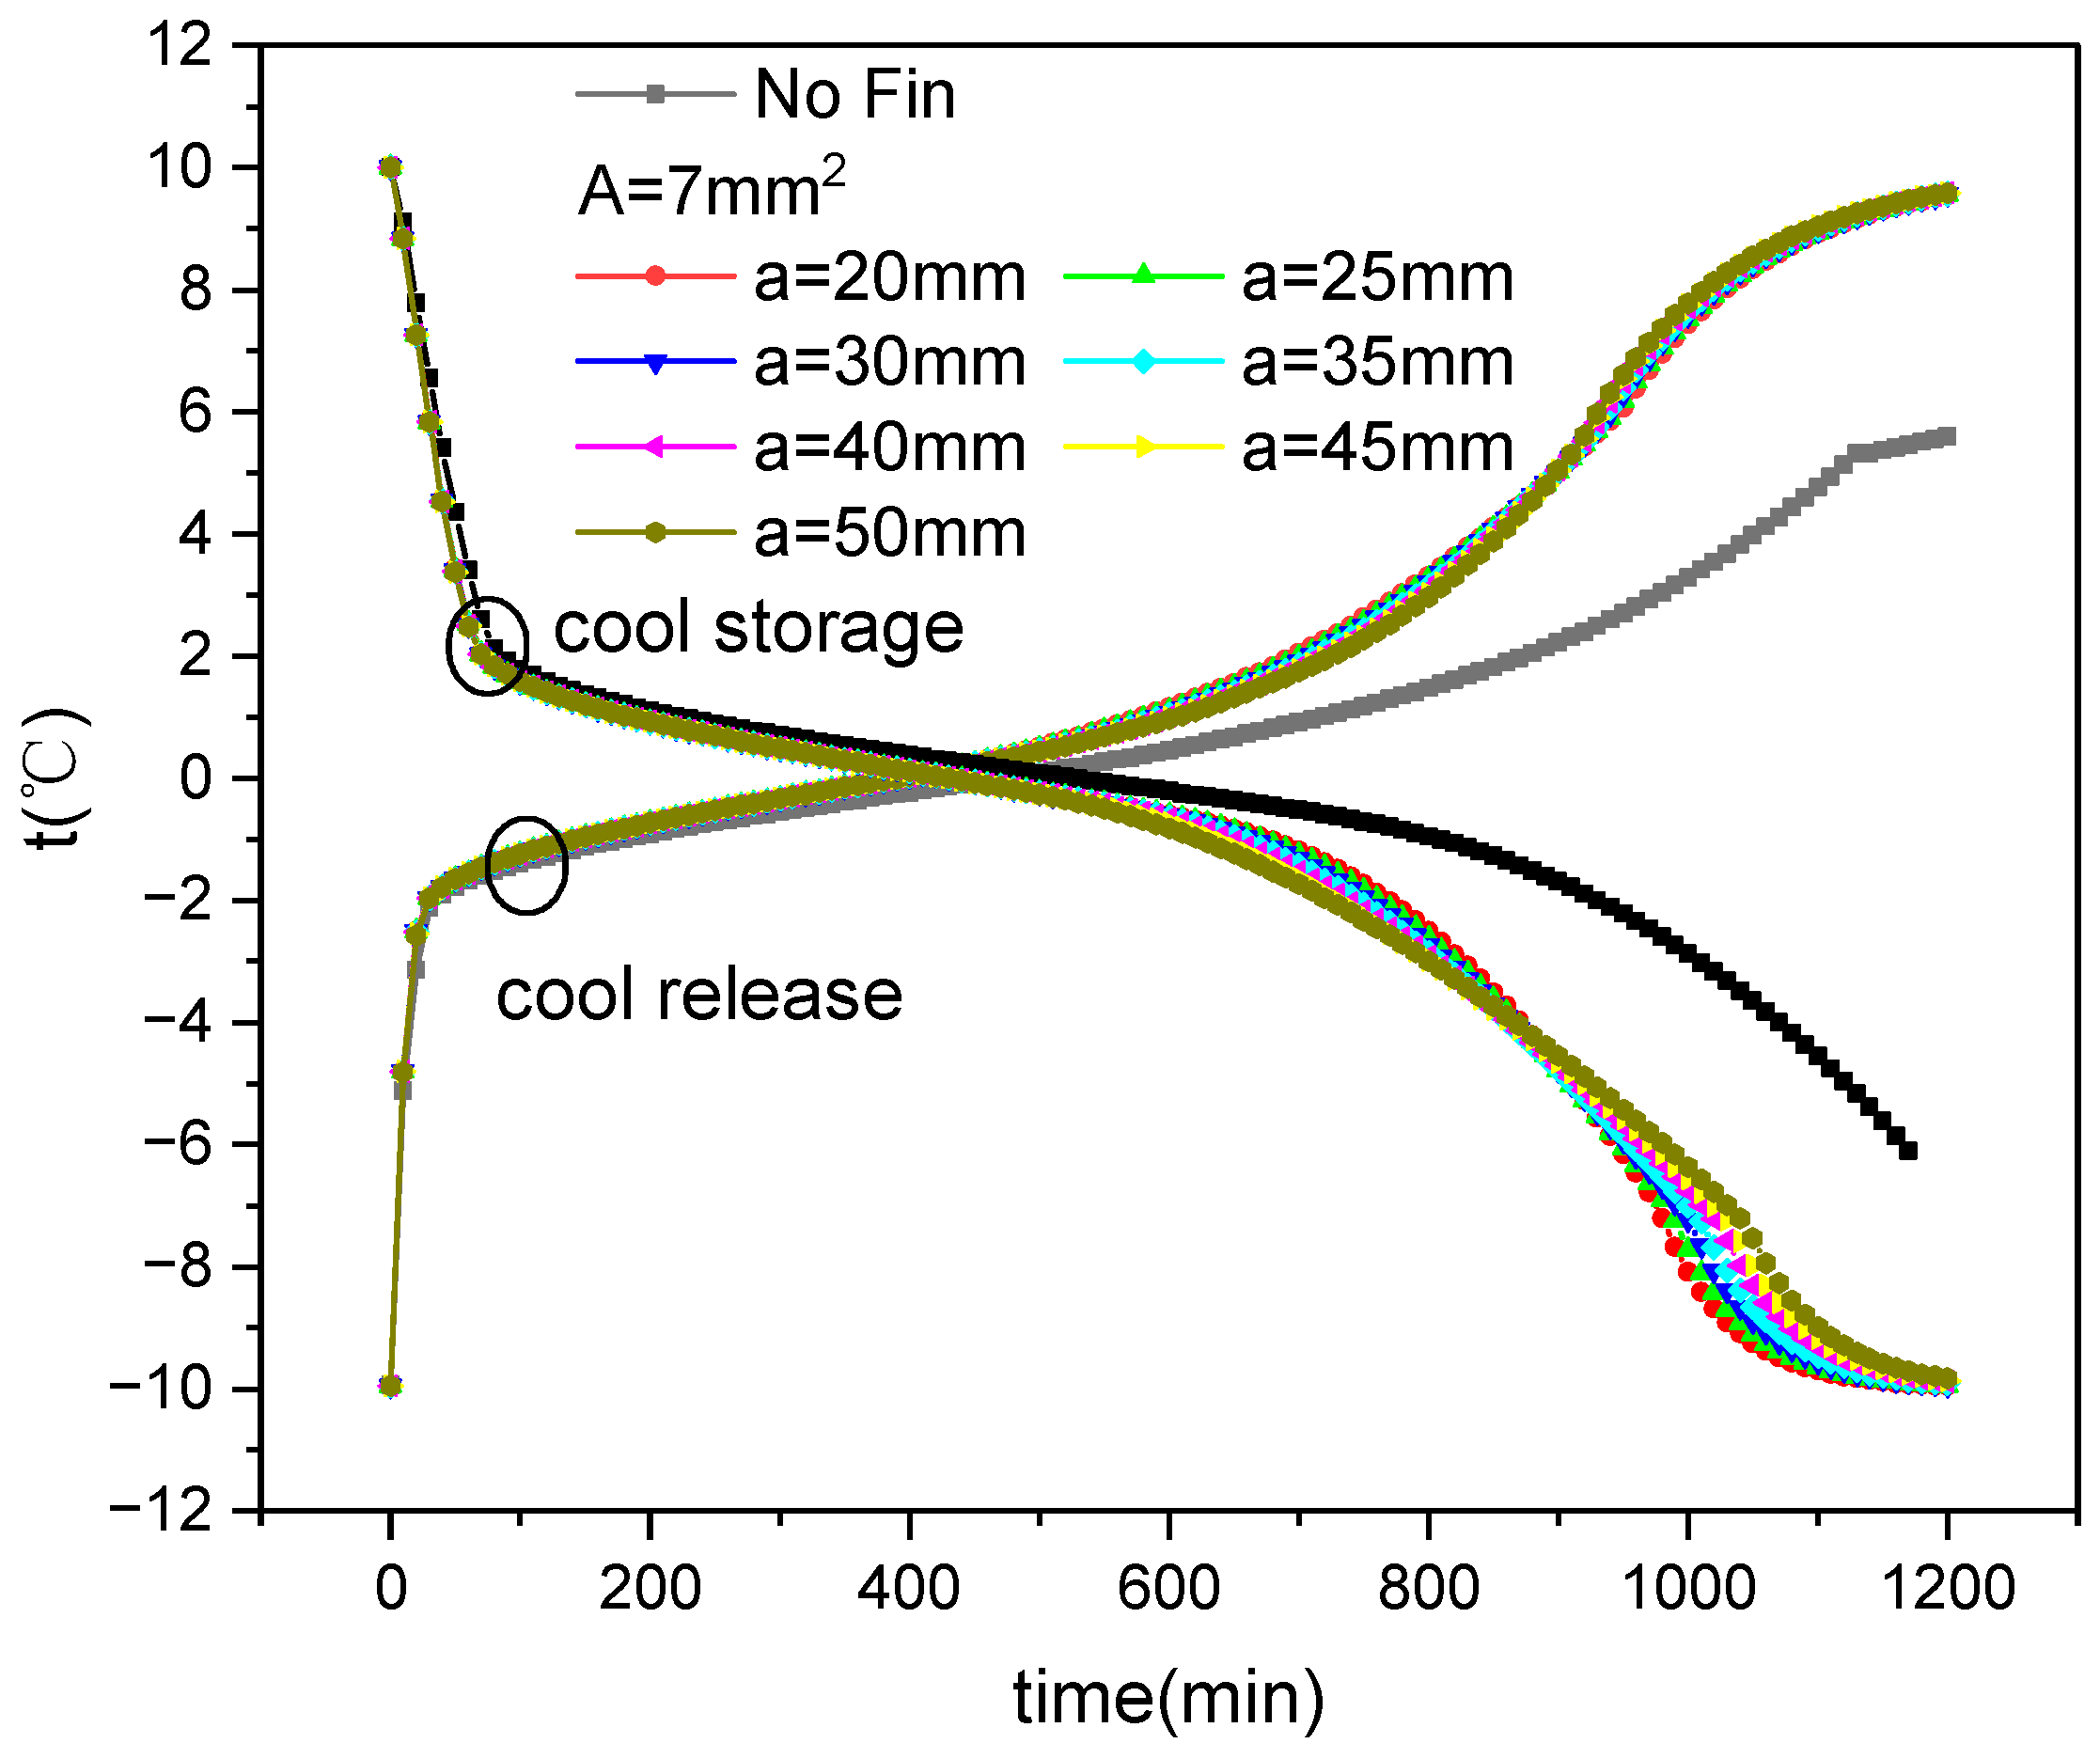
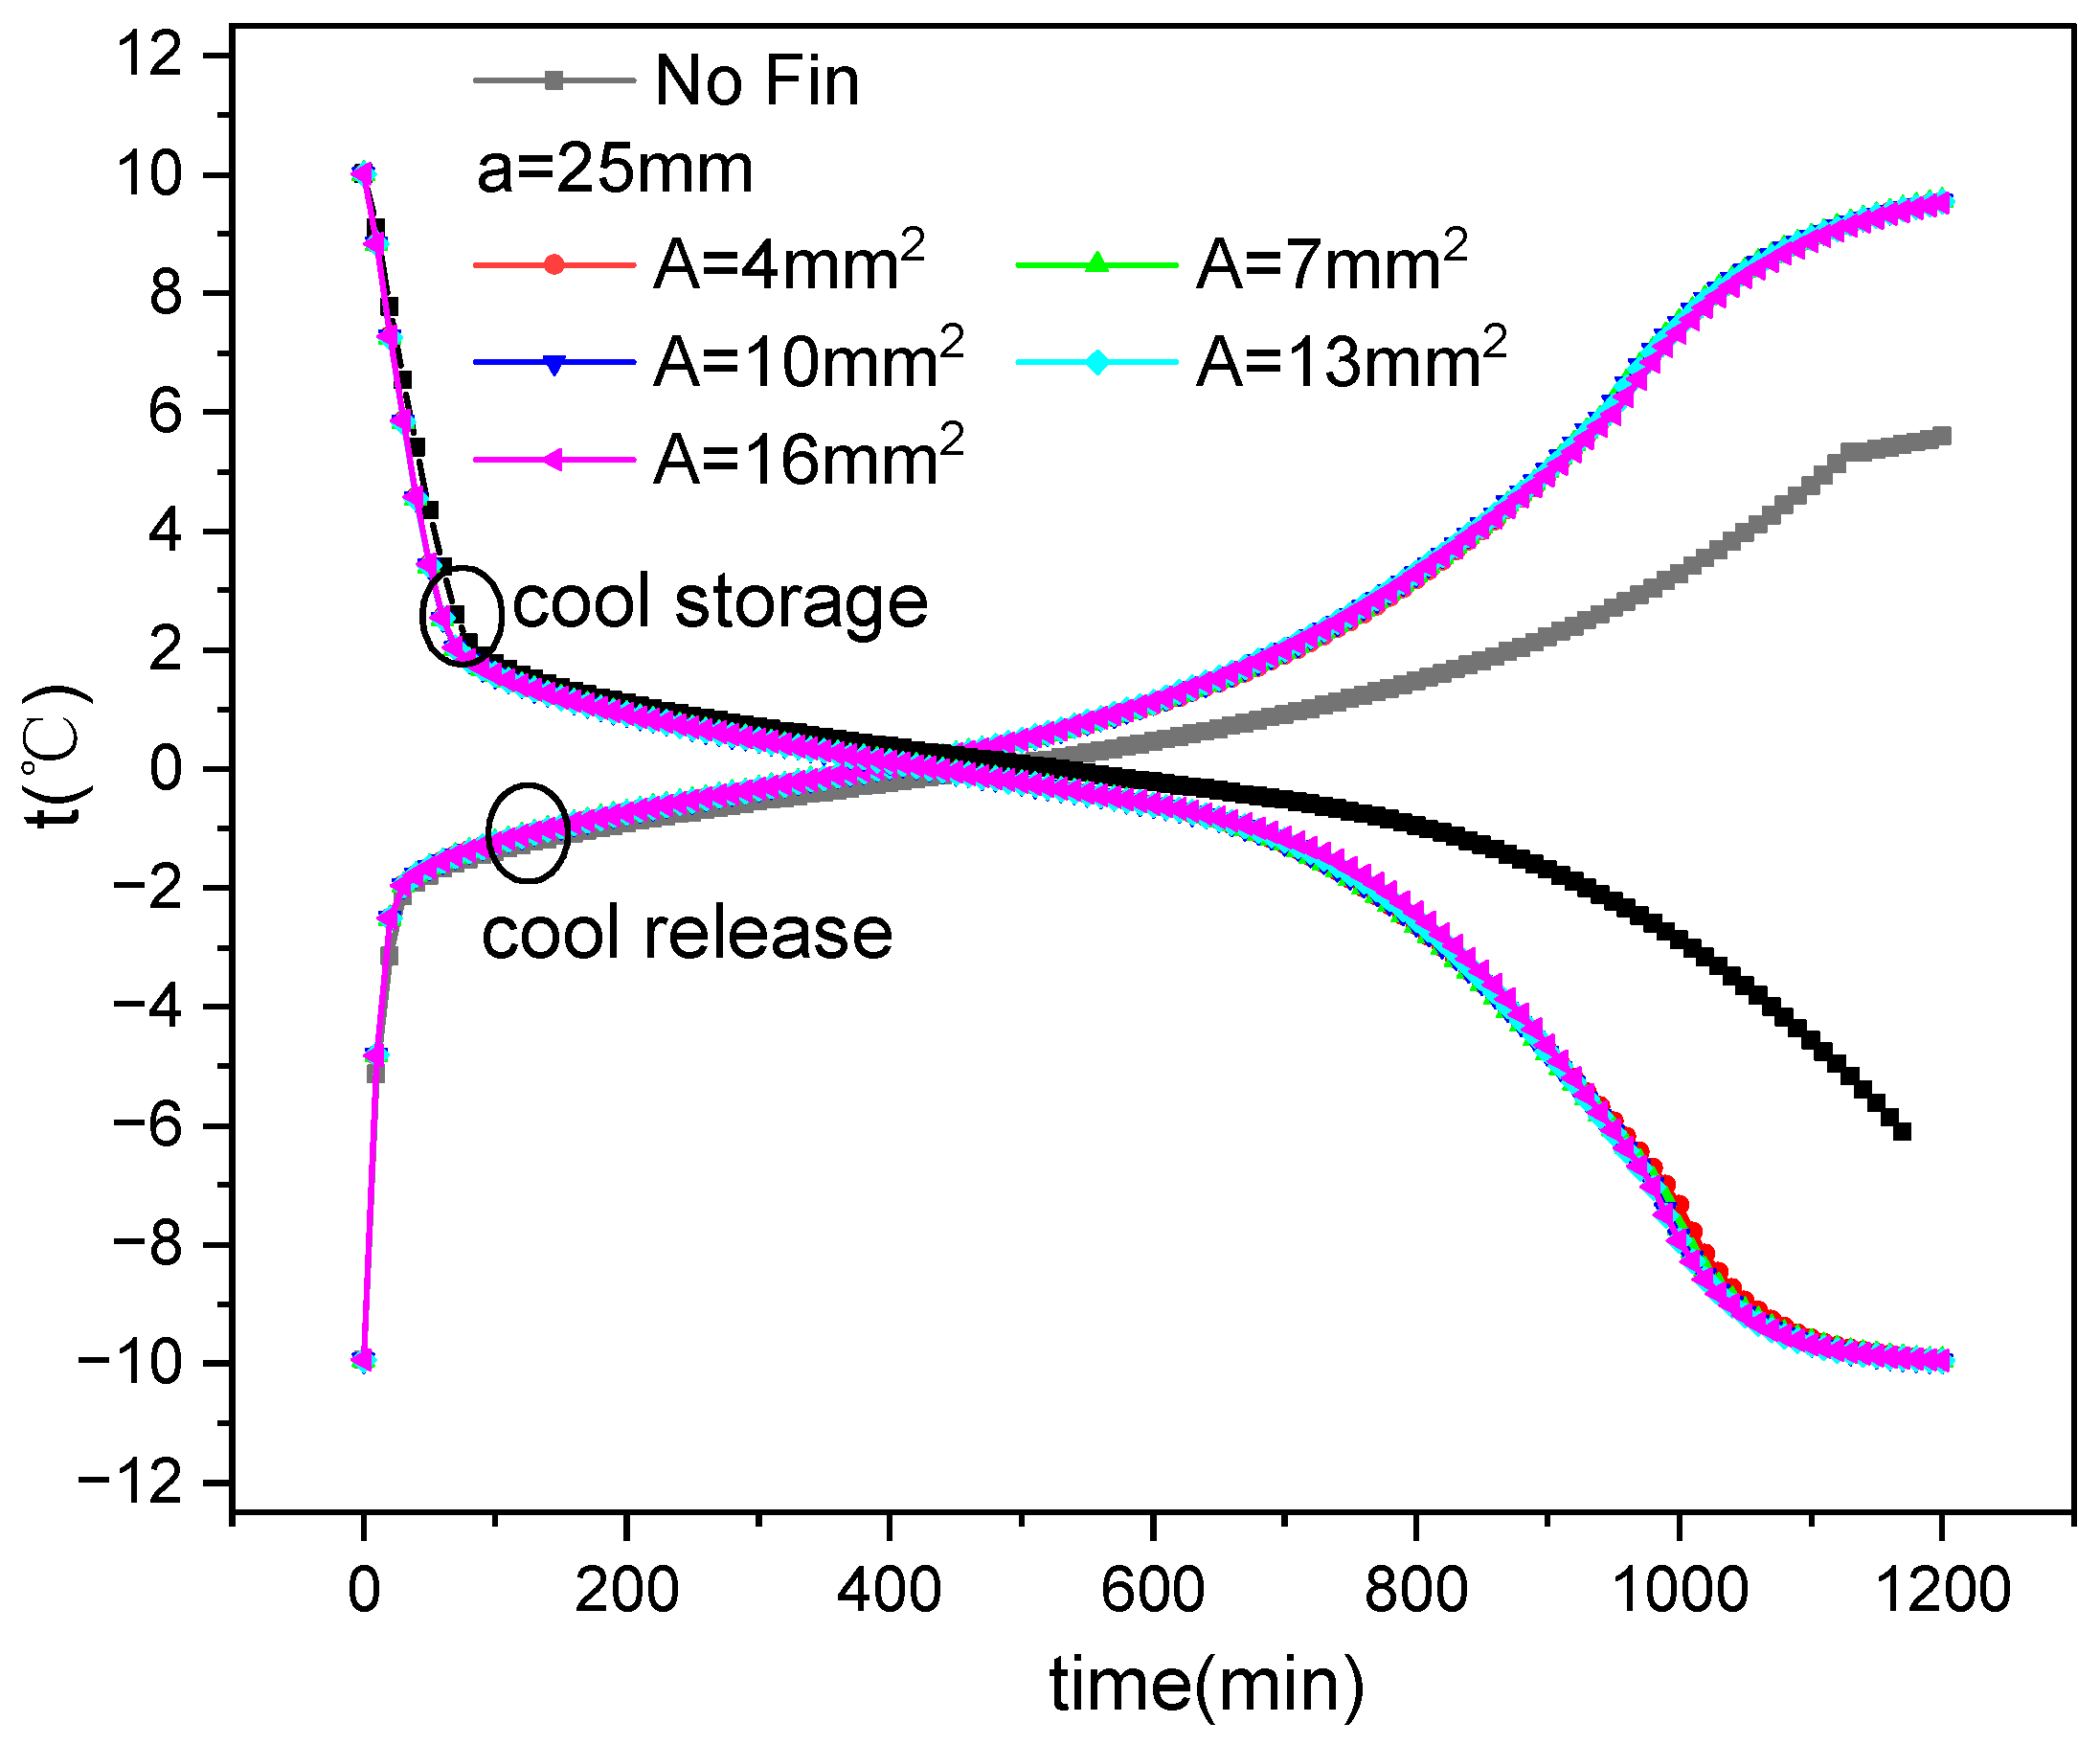
Figure 17 and Figure 18 show the average temperature variation over time during the cold storage and release process of the outer fin ice plate under various fin distribution and size conditions, respectively. It can be observed that, as with the internal fin structure, the cold storage and release processes also include three stages: sensible heat storage (release), latent heat storage (release), and sensible heat storage (release). In the third stage of cold storage, the temperature of the ice plate with fins decreases faster than that without fins, while the temperature of the ice plate with fins increases faster than that without fins during release.
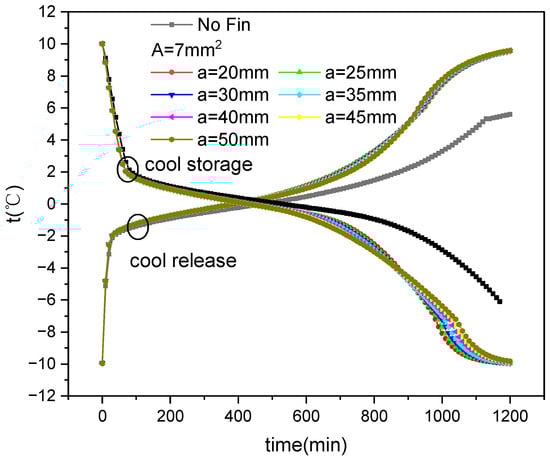
Figure 17.
Variation in average temperature with fin distribution and time during the ice storage and cold release process of external finned plate.
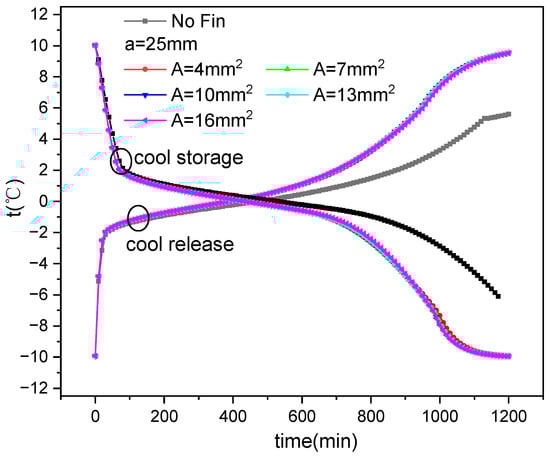
Figure 18.
Variation in average temperature with fin size and time during the ice storage and cold release process of external finned plate.
3.3. Finned Ice Plate Cold Storage and Release Time
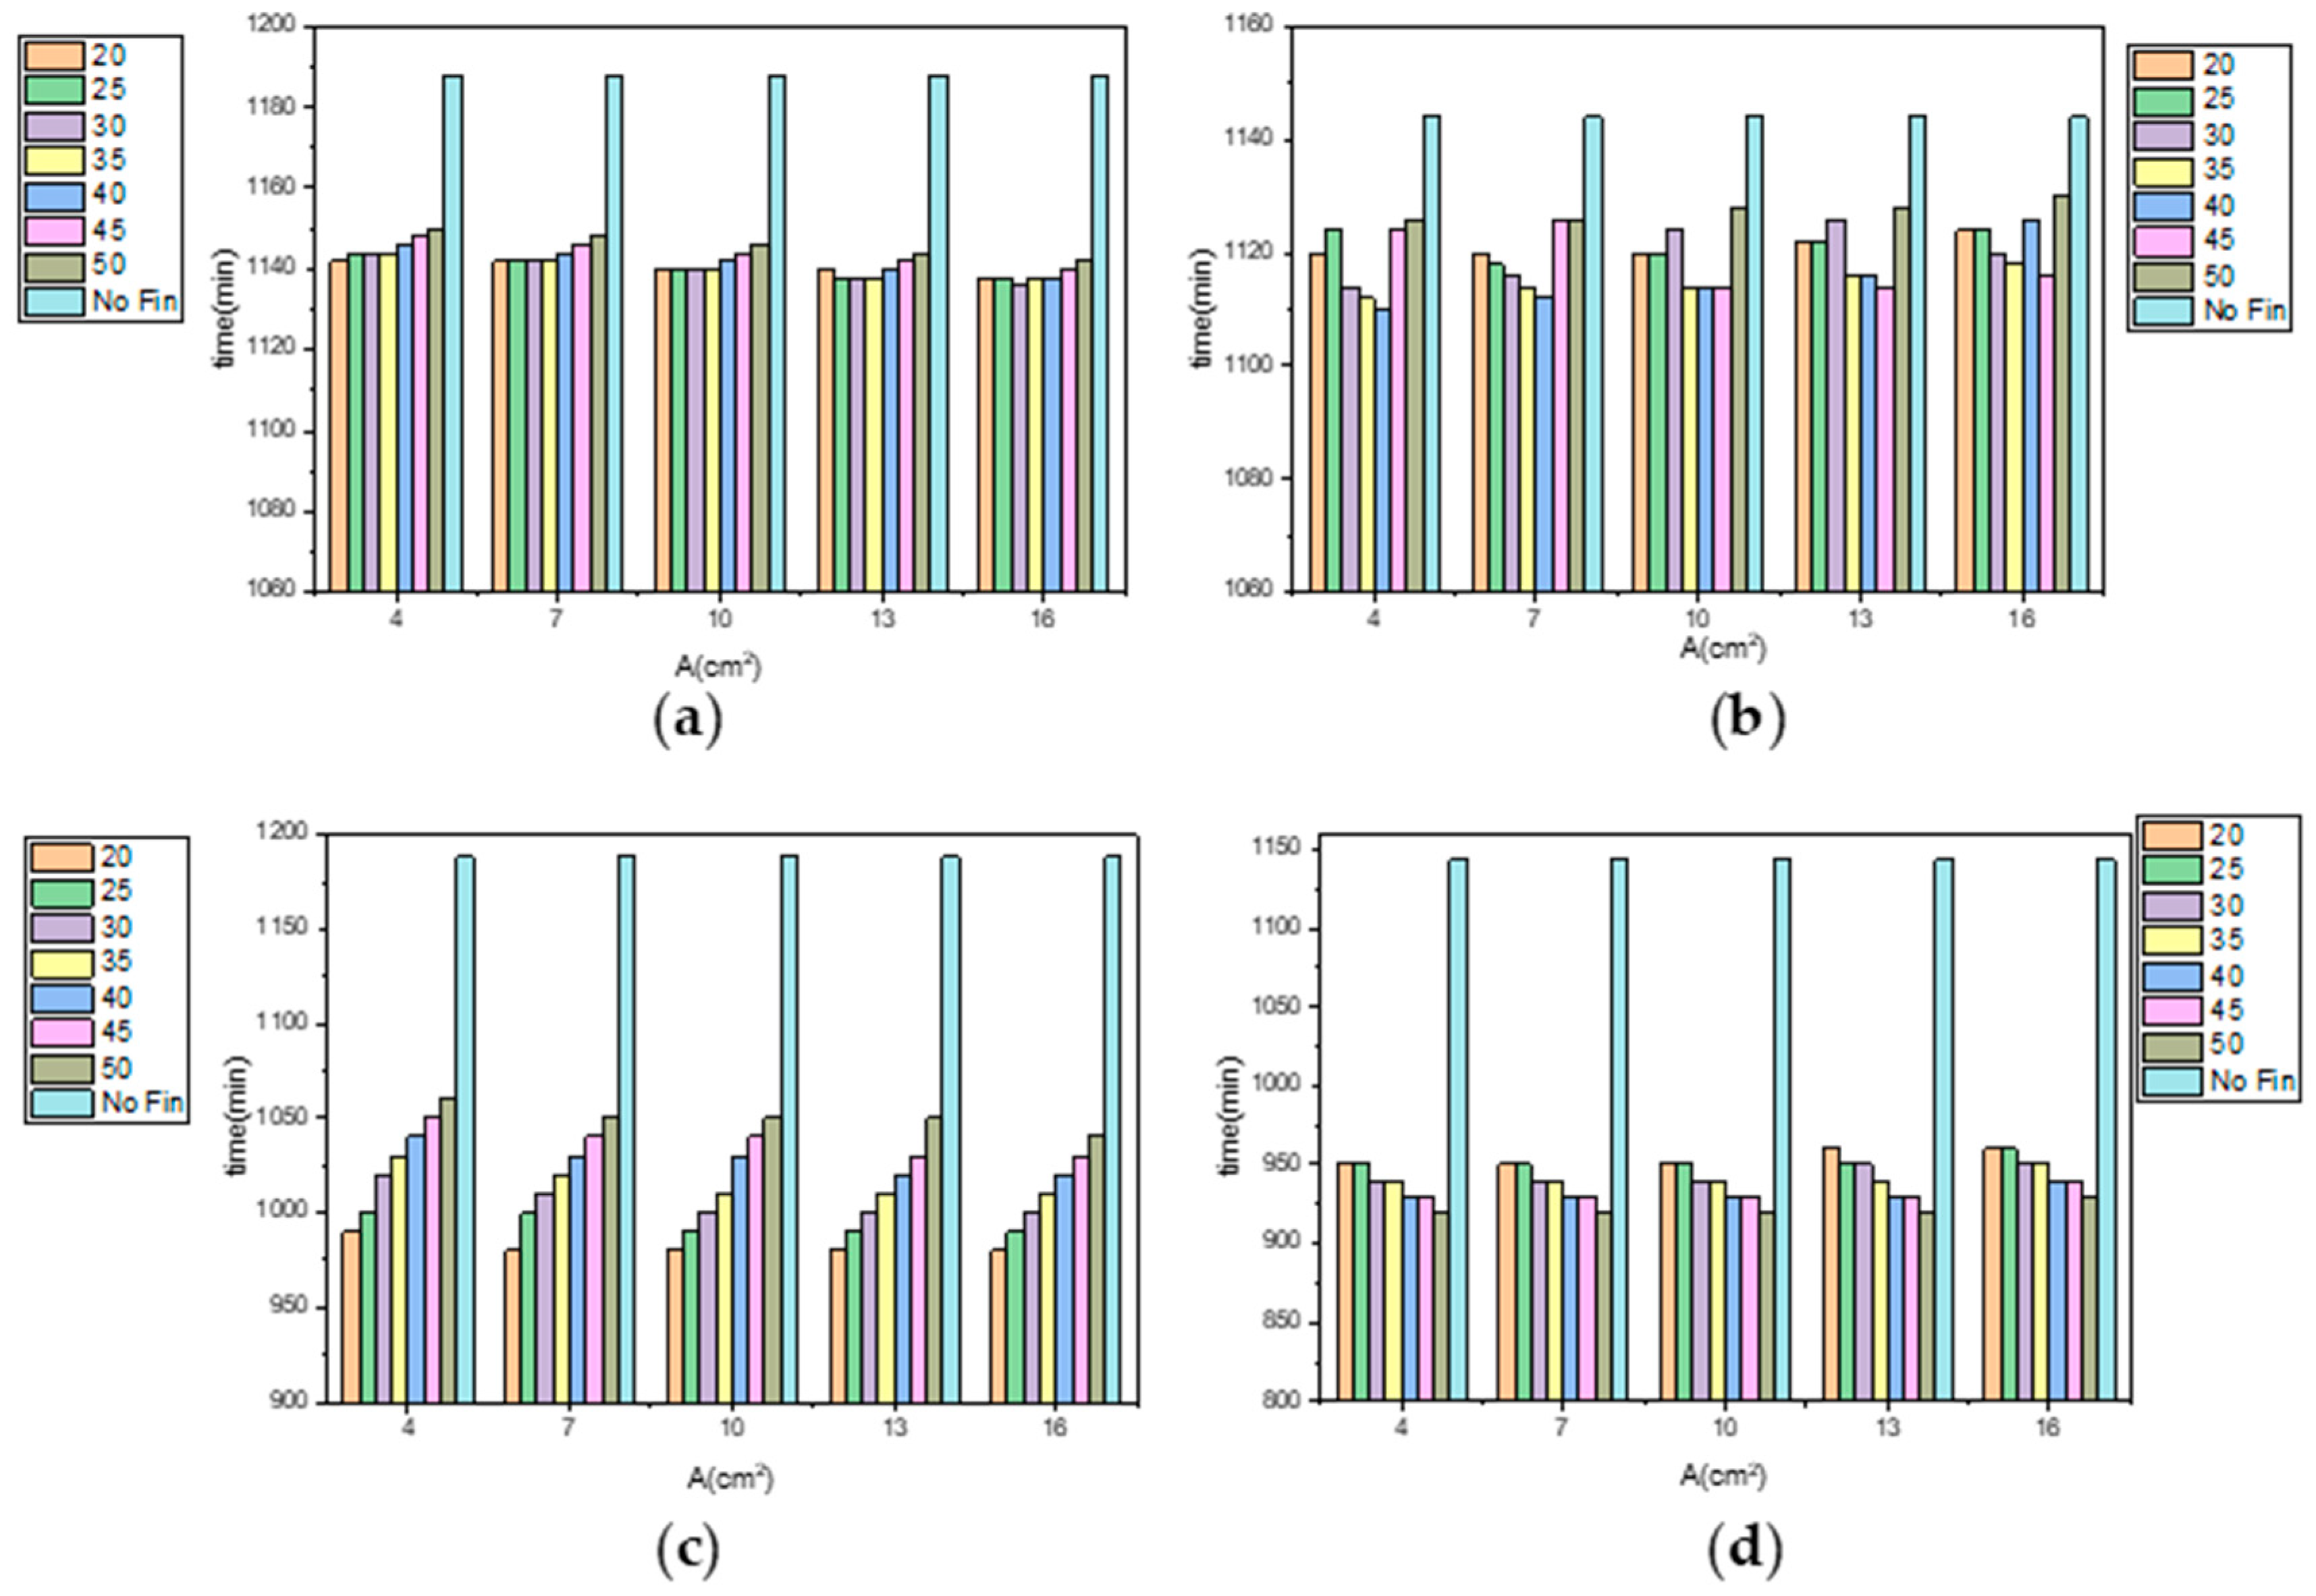
Figure 19 shows the influence of fin position, distribution, and size on the cold storage and release times. It can be seen that with the inner fin, the ice plates with a fin cross-sectional area of 13 mm2 and a reference spacing of 25–35 mm, as well as a fin cross-sectional area of 16 mm2 and a reference spacing of 20–40 mm, have shorter cooling storage times, while the ice plates with a fin cross-sectional area of 4 mm2 and a reference spacing of 30–40 mm, a fin cross-sectional area of 7 mm2 and a reference spacing of 35–40 mm, a fin cross-sectional area of 10 mm2 and a reference spacing of 35–45 mm, and a fin cross-sectional area of 13 mm2 and a reference spacing of 35–45 mm have shorter cold release times. When using the outer fin form, the smaller the reference spacing, the shorter the cold storage time of the ice plate, while the larger the reference spacing, the shorter the cold release time.
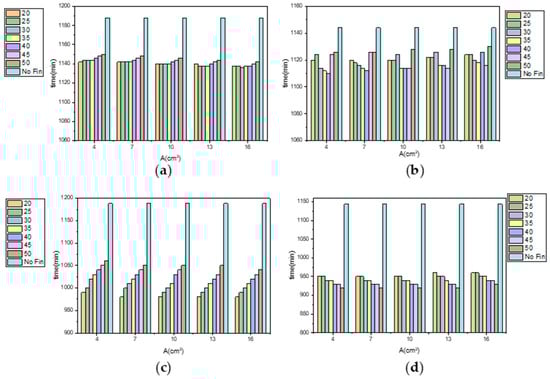
Figure 19.
Effects of fin position, distribution, and size on cold storage and release times ((a) cooling storage of inner finned plate; (b) release of inner finned plate; (c) cooling storage of outer finned plate; and (d) release of outer finned plate).
4. Discussion
In practical engineering applications, to save cooling time and improve cooling storage efficiency, the requirement for cooling storage time is higher than that for cold release time. Therefore, when designing an ISP, fins with relatively lower cold storage time can be selected. To further discuss the influence of fins on the velocity, temperature, and solid fraction fields inside the ice plate during the cold storage and release process, inner fins with A = 13 mm2 and a = 35 mm and outer fins with A = 7 mm2 and a = 25 mm were selected for the ISP.
4.1. Internal Parameter Field of Inner Finned Plate
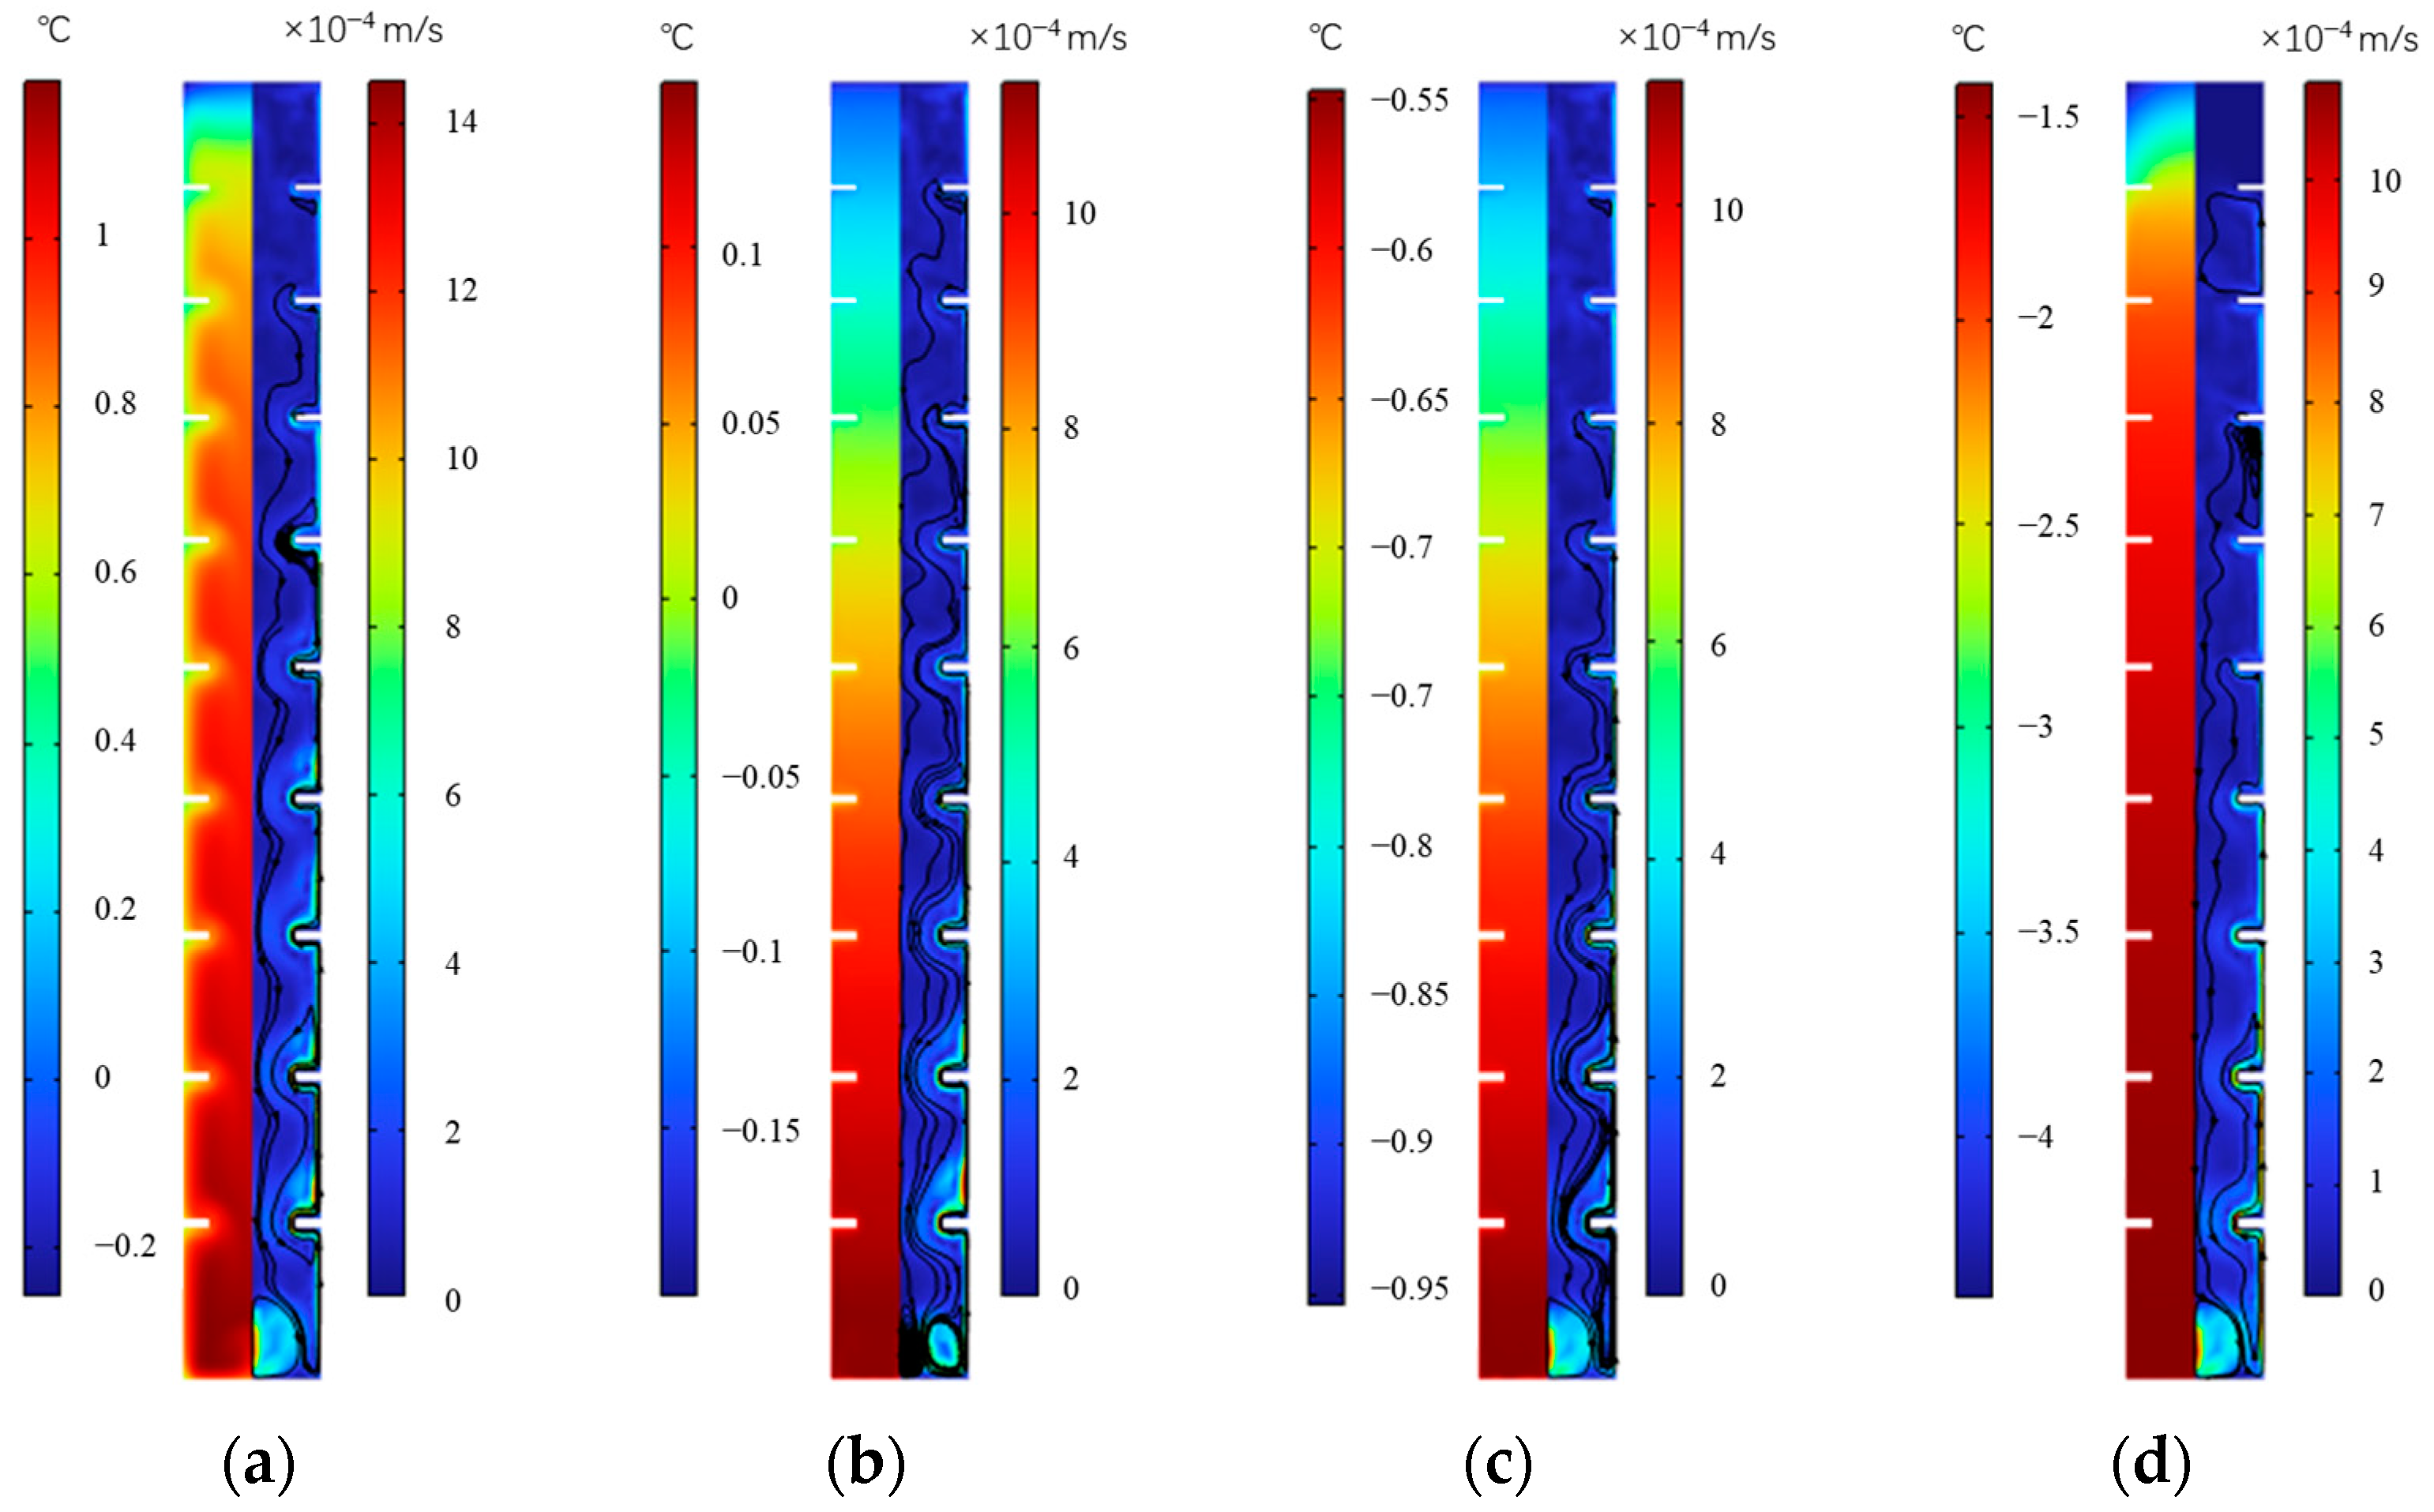
Figure 20 shows the temperature and velocity distribution at various times during cooling storage of the internal fin ice plate. It can be seen that as the cold storage progresses, the internal temperature of the ice plate shows a downward trend from 250 to 1000 min, in which the highest temperature inside the plate decreases from 1 °C to −1.5 °C. At any moment of cold storage, the temperature inside the plate gradually increases along the surface of the ice plate and the inner edge of the fins to the inside of the ice plate. Under the action of natural convection, the lower temperature water adjacent to the wall, which has a lower density, will flow upwards around the fins along the wall and continue to cool down. After entering the phase change temperature range, it will start to freeze, while the water with a relatively high temperature at the center of the board will flow downwards, ultimately causing the temperature in the lower part of the plate to be higher than that in the upper part, and eventually completing icing from top to bottom. The water in the lower part forms small vortices because of the obstruction of fins and the density difference there.
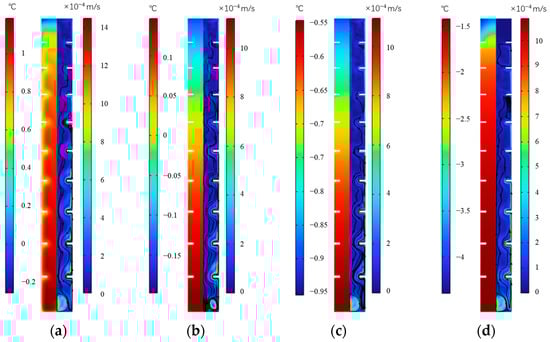
Figure 20.
Temperature and velocity distribution during ice storage process of the internal finned plate. (a) 250 min, (b) 500 min, (c) 750 min, and (d) 1000 min.
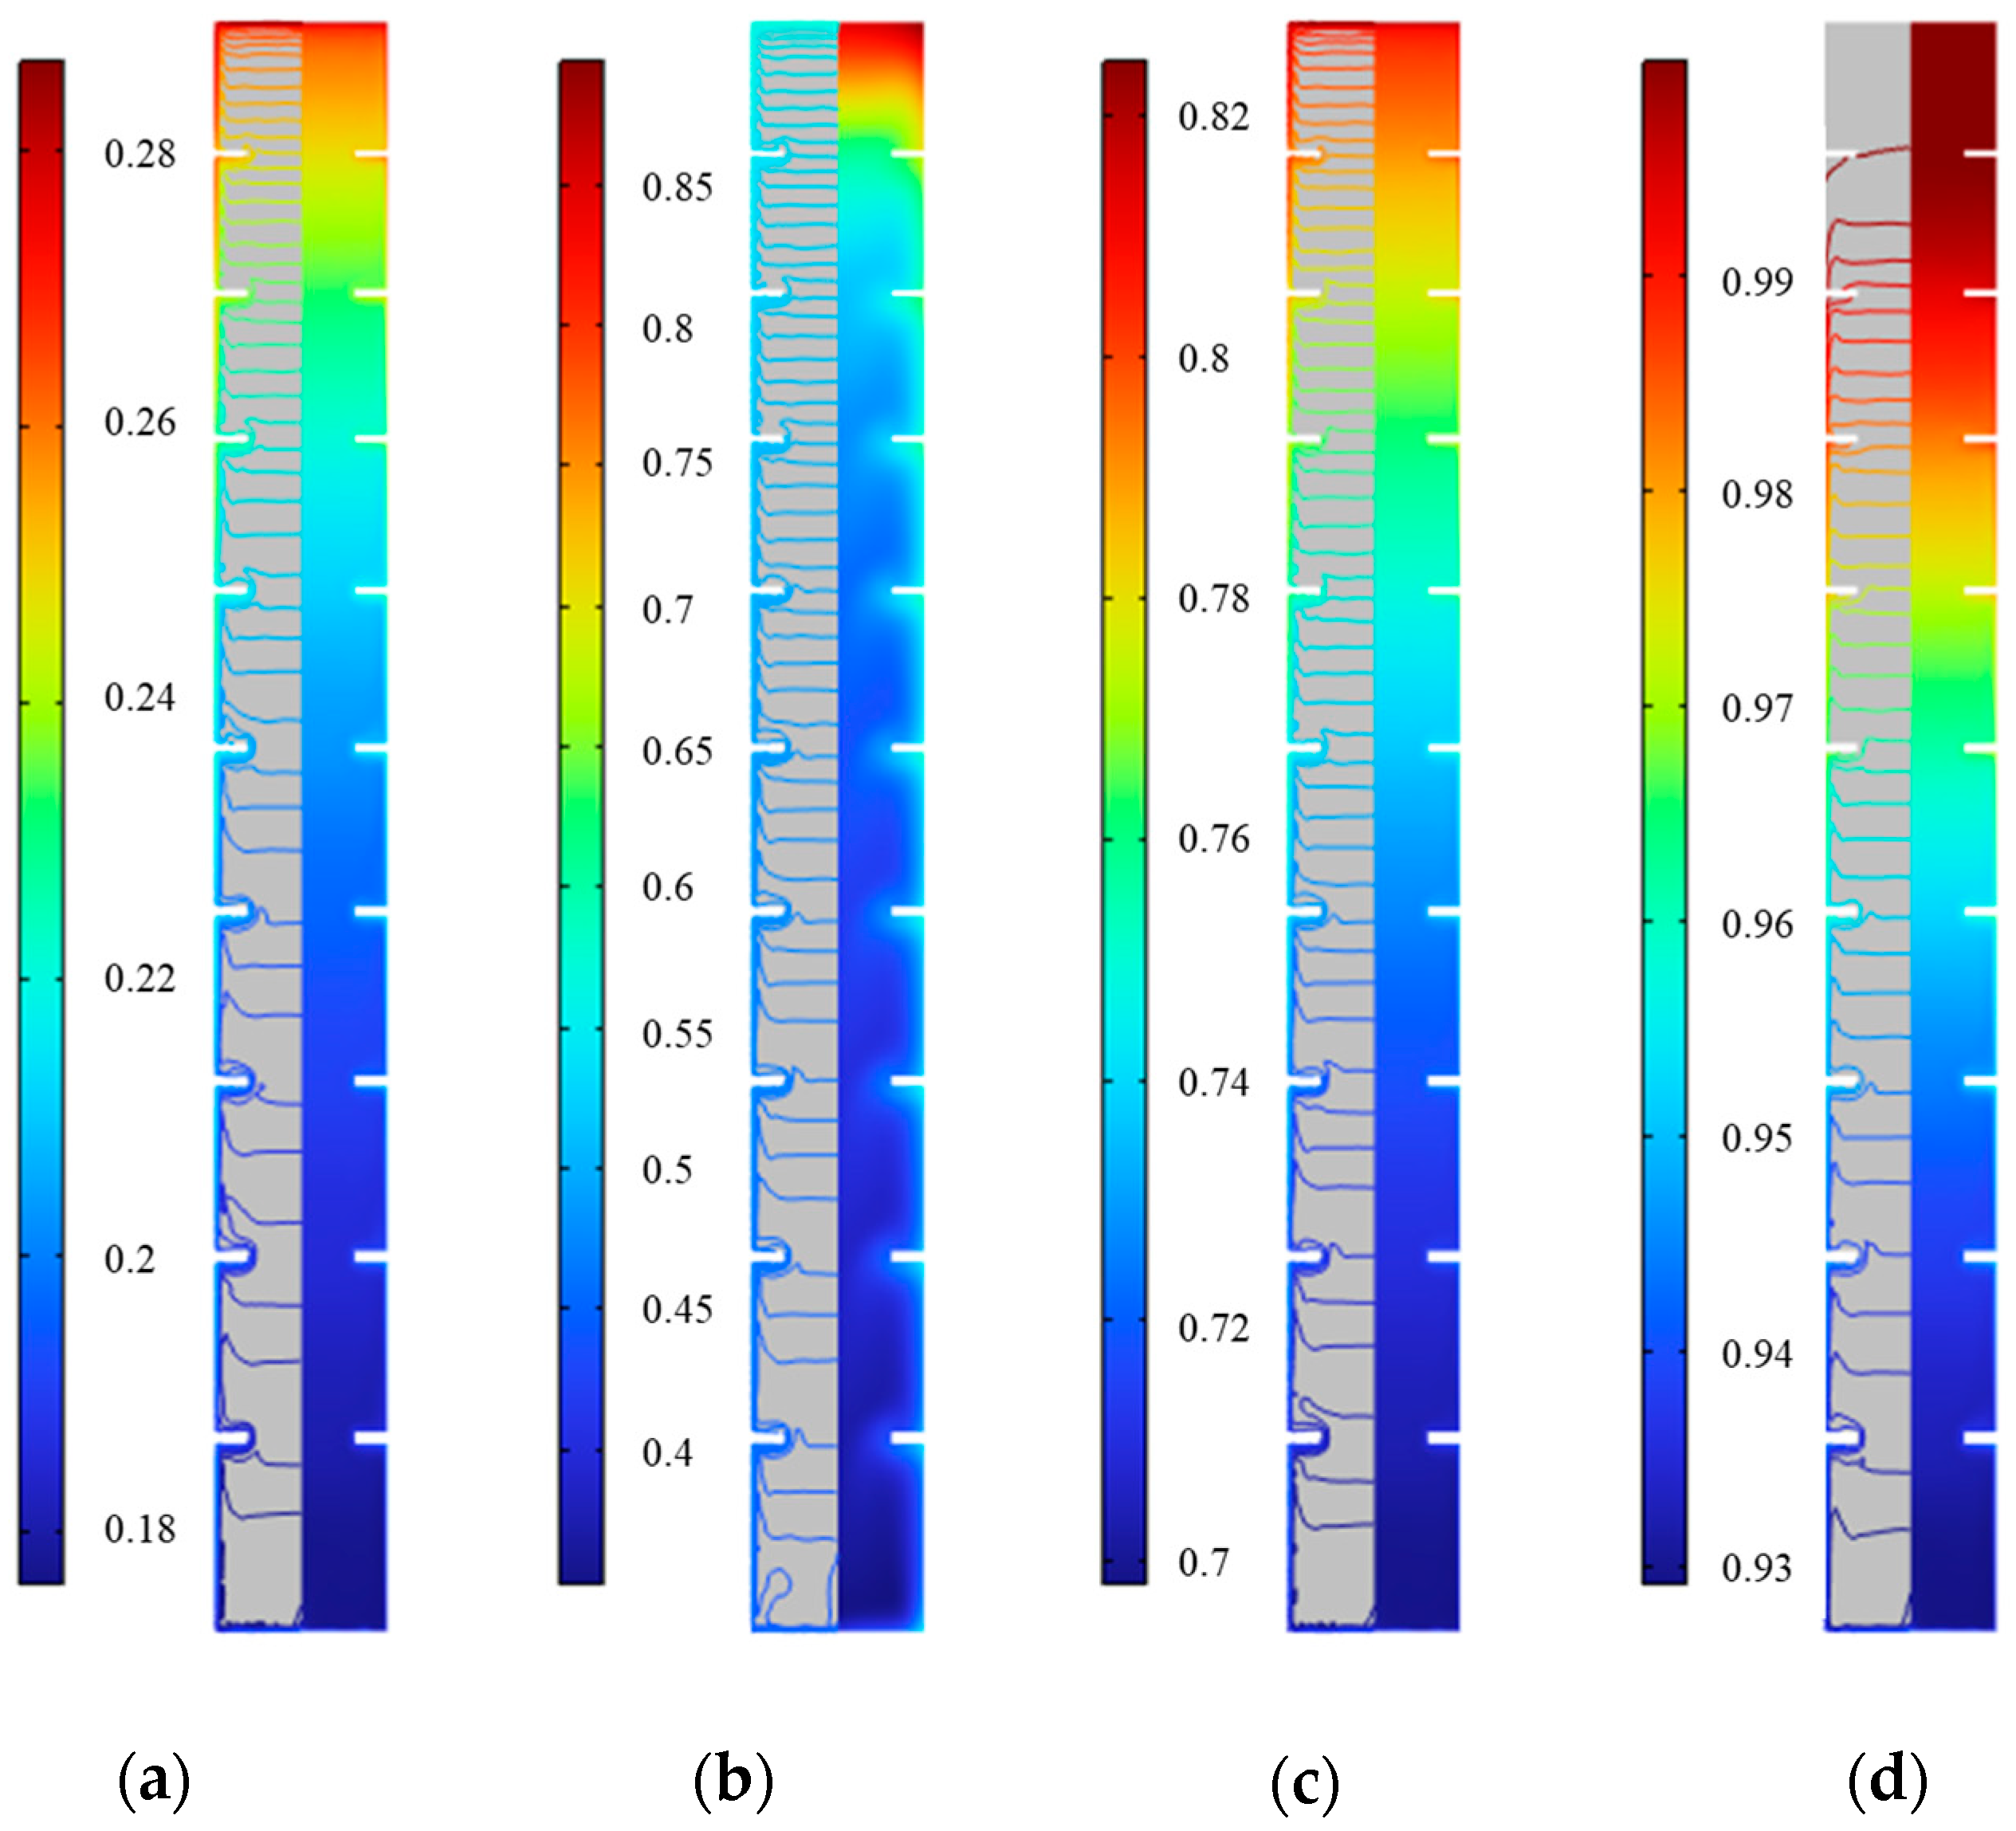
Figure 21 shows the distribution of solid fraction at various times during the internal fin ice storage process. It can be seen that at the same time, the water near the inner surface of the plate and fins in the horizontal direction first freezes, and the solid fraction gradually decreases from the outside to the inside, but the variation is small. For example, at 750 min, the difference in solid fraction at the middle height is only 0.015, and it mainly exists in the area near the plate wall, with almost no difference in solid fraction inward to the center. In the vertical direction, as the ice rises, the solid fraction inside the plate gradually decreases from top to bottom. For example, at 250 min, the solid fraction difference from top to bottom on the horizontal middle section is 0.08, while at 500 min and 750 min, it is 0.42 and 0.11, respectively. At 1000 min, the solid fraction at the top increases to 1, while at the bottom it is 0.93. Given the small difference in solid fraction in the horizontal direction, combined with the distribution of solid fraction lines in the figure, the solid fraction during the cold storage process can be considered to change only along the height. As cold storage progresses, the solid fraction in the upper part gradually increases, and the entire icing area continues to expand. This is manifested by the gradual downward movement of the iso-solid fraction line equal to 1, until all the water inside the plate freezes and the solid fraction becomes 1. The analysis of the above changes in solid fraction further proves that cold storage is gradually completed from top to bottom.
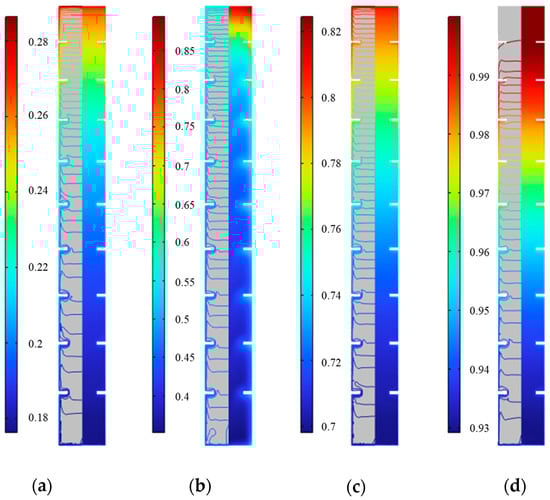
Figure 21.
Distribution of solid fraction during the internal fin ice plate storage. (a) 250 min, (b) 500 min, (c) 750 min, and (d) 1000 min.
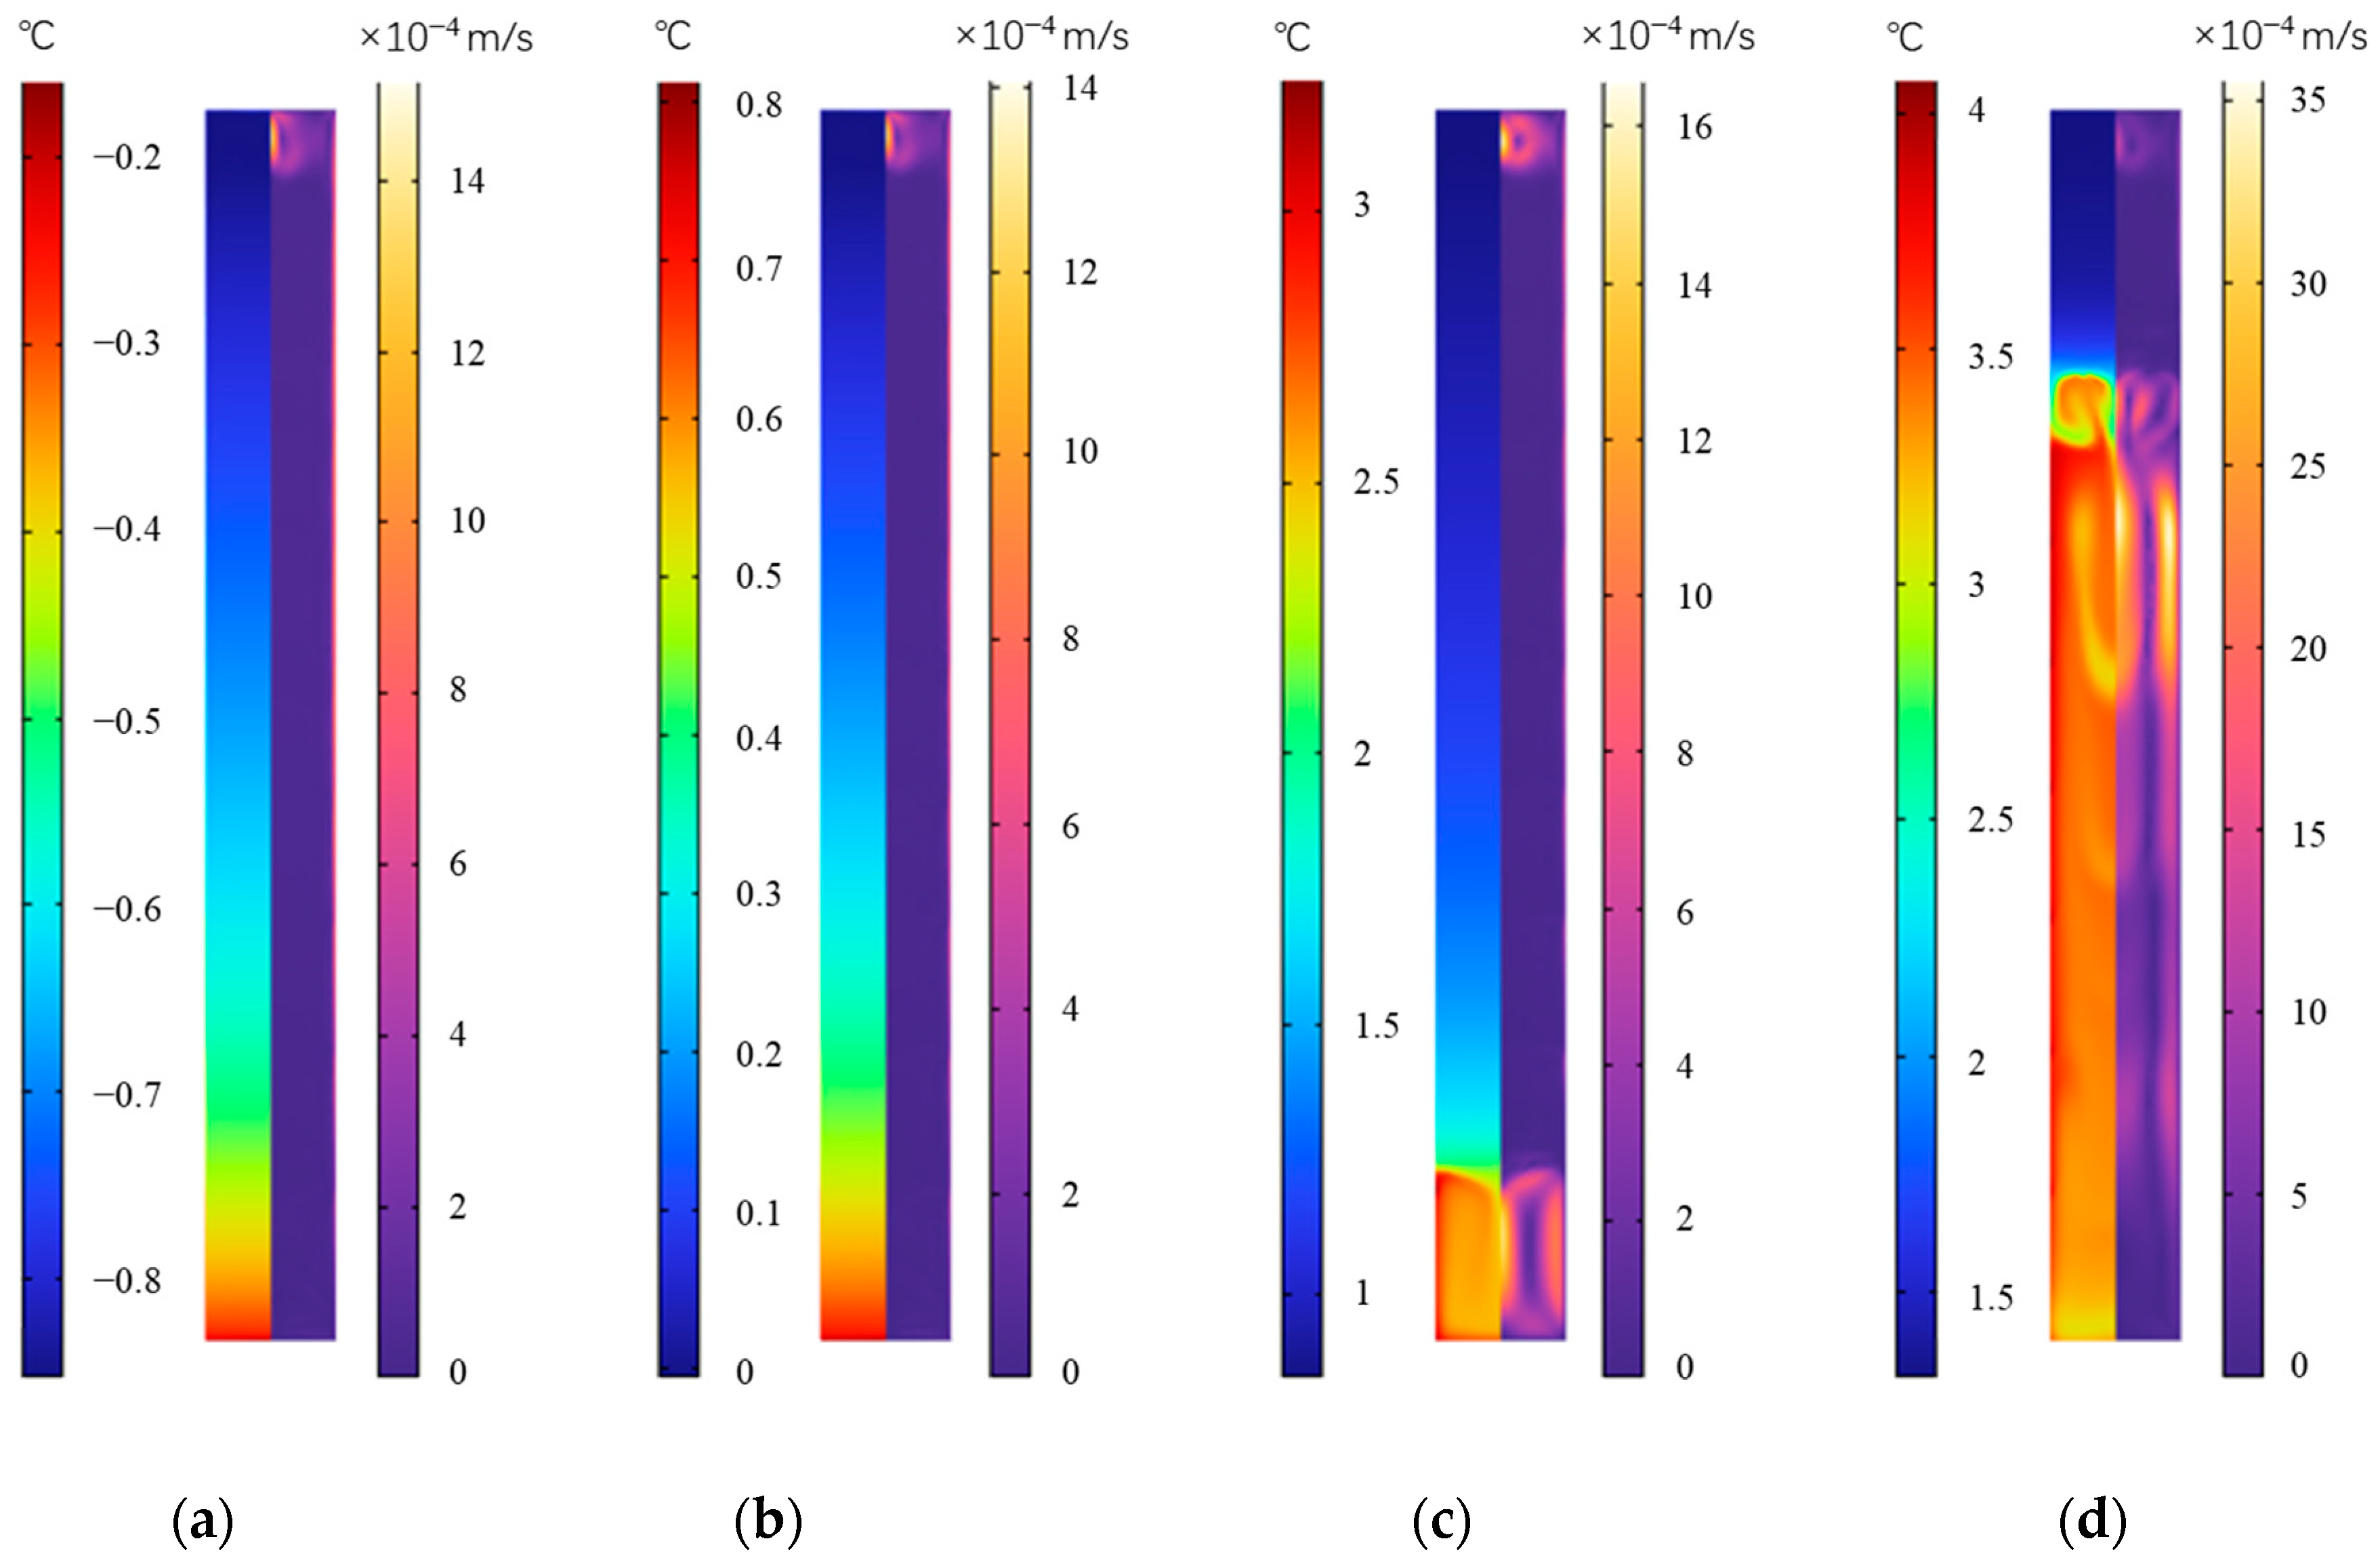
Figure 22 shows the temperature and velocity distribution at various times during the cold release of the inner finned plate. It can be seen that as the cold release progresses, the internal temperature of the plate shows an upward trend, with the highest temperature inside the plate increasing from 0.5 °C to 3.6 °C from 250 min to 1000 min. At any moment of cold release, the temperature gradually decreases horizontally along the surface of the plate and the inner edge of the fins towards the interior of the plate. Taking the middle height as an example, in four corresponding moments, temperature transitions from −0.8 °C, −0.03 °C, 0.7 °C, and 1.8 °C on the surface of the plate to −0.87 °C, −0.08 °C, 0.64 °C, and 1.7 °C, respectively, at the center. In the vertical direction, the temperature at the bottom of the plate is higher, and as the cold release progresses, the zone with higher temperature at the bottom increases. At 1000 min, the highest temperature at the bottom reached 3.1 °C, while the temperature at the top is 1.5 °C. This is because during cold release, the ice near to the surface of the plate and the inner edge of the fins first melts into water, and the water with higher temperature moves downward under the action of gravity, gradually accumulating at the bottom of the plate. This conclusion is consistent with Wu et al. [28] and shows that natural convection plays a dominant role in the melting direction of ice. Ji et al. [22] found overheating in the top part of PCMs and slow melting in the bottom side due to a non-uniform heat transfer that resulted from the natural convection. This conclusion is contrary to this study for the different PCMs. The RT42 PCM used by Ji et al. has a bigger density in solid phase than that in liquid, while in this study, ice’s density is lower than water, which makes a different convection in the two studies. In terms of velocity distribution, after water flows downwards near the inner walls of the ice plate and fins, the remaining ice gradually moves upwards along the vertical center direction of the plate until it completely turns into water.
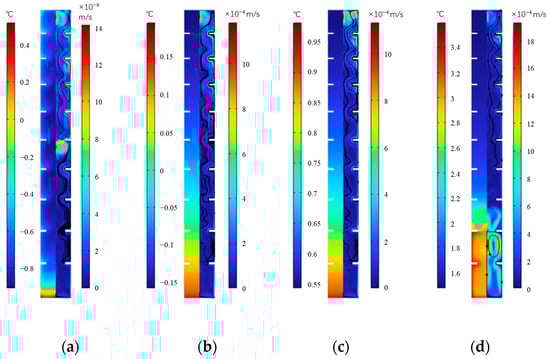
Figure 22.
Temperature and velocity distribution during the cold release of inner fin ice plate. (a) 250 min, (b) 500 min, (c) 750 min, and (d) 1000 min.
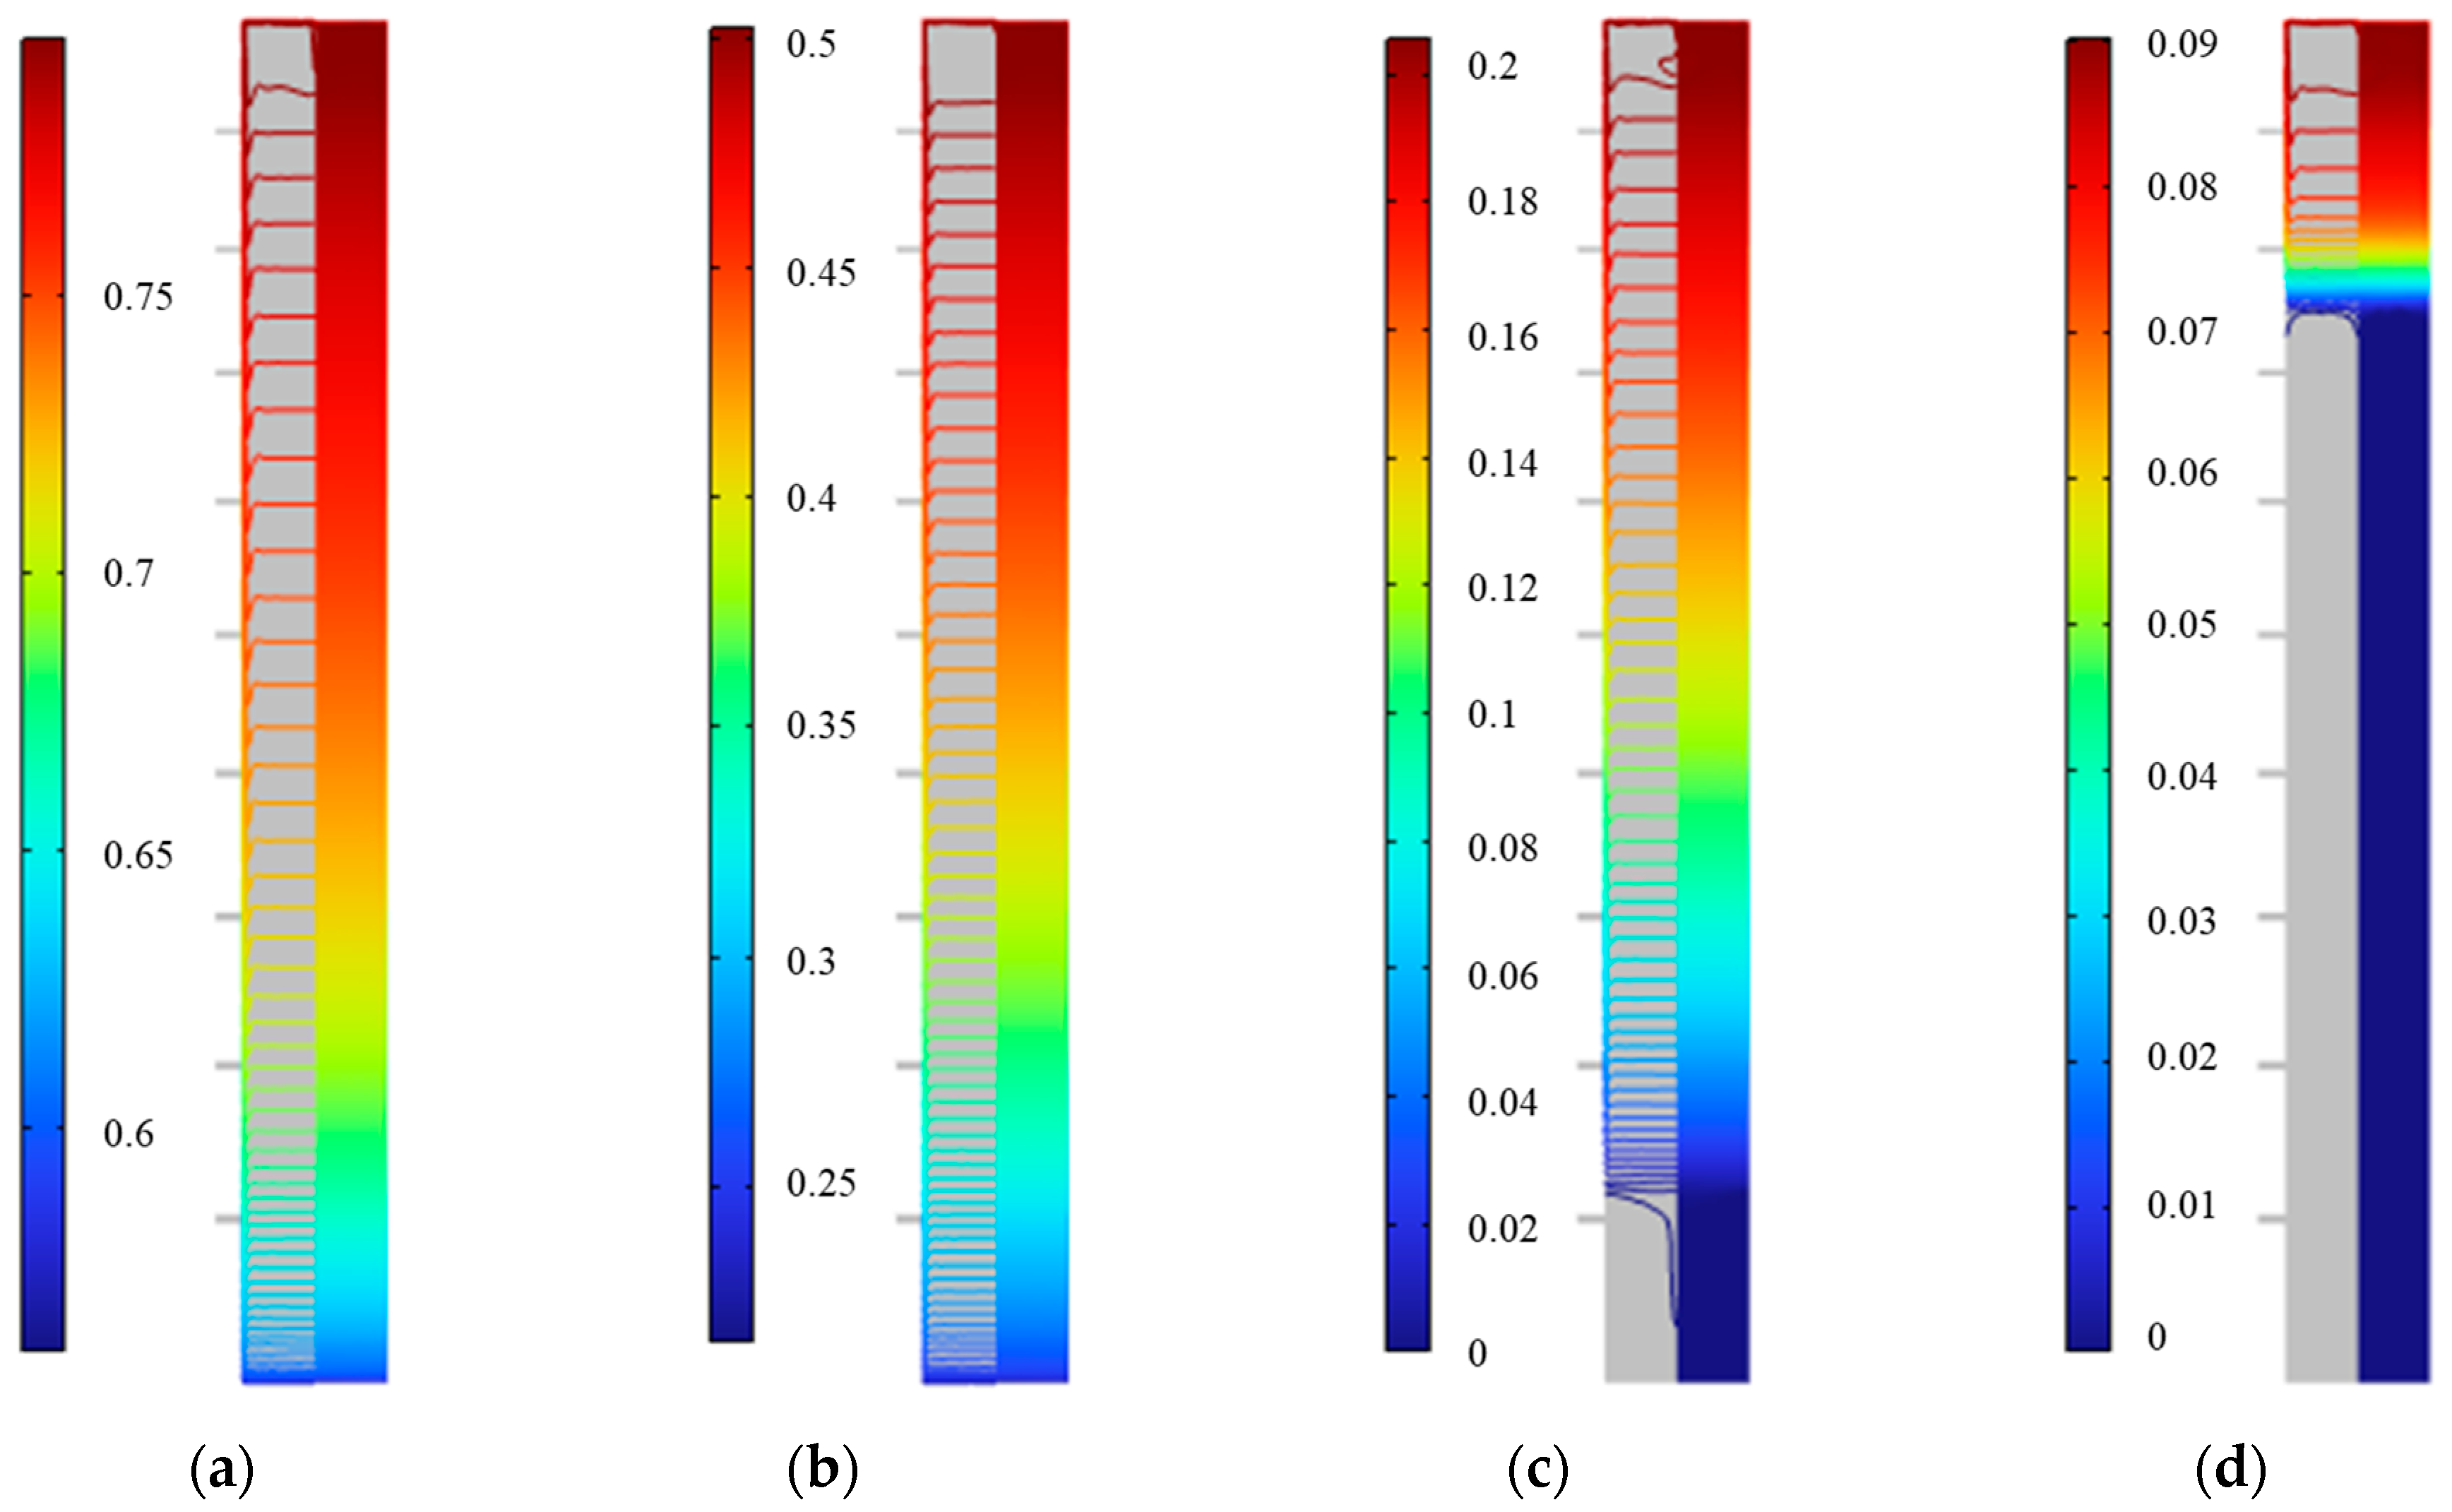
Figure 23 shows the distribution of solid fraction in the inner fin ice plate at various times during cold release. It can be seen that the solid fraction ranges from 0.78 to 0.8, 0.51 to 0.53, 0.25 to 0.27, and 0.024 to 0.03 at the middle height from 250 min to 1000 min, respectively. This indicates that at the same time, the ice near the inner surface of the plate and fins melts, and the solid fraction gradually decreases from inside to outside, but the difference is small. In the vertical direction, as the melted ice flows downwards, the solid fraction inside the plate gradually decreases from the top to the bottom. Similar to cold storage, the distribution of solid fraction can also be approximated as only changing along the height. At 1000 min, the solid fraction at the bottom is 0, and the zone occupied entirely by water accounts for 30% of the total volume. As the cold release progresses, the amount of water at the bottom continues to increase, and the pure water line with a value of 0 will gradually move upwards until all the ice inside the plate turns into water, with a solid fraction of 0. From the above analysis, it can be seen that the cooling process inside the plate is gradually completed from the bottom to the top.
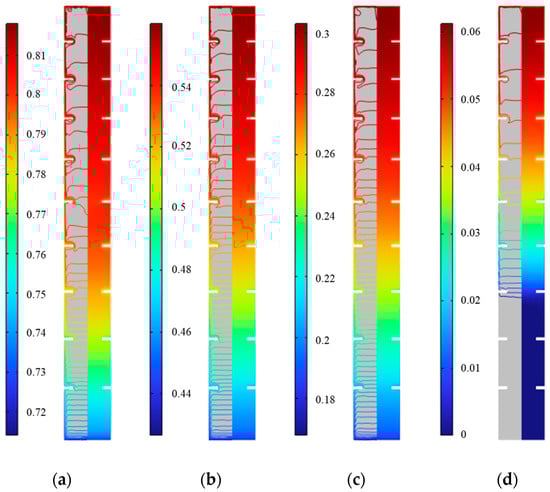
Figure 23.
Distribution of solid fraction during the cold release of inner fin ice plate. (a) 250 min, (b) 500 min, (c) 750 min, and (d) 1000 min.
4.2. Internal Parameter Field of External Fin Ice Plate
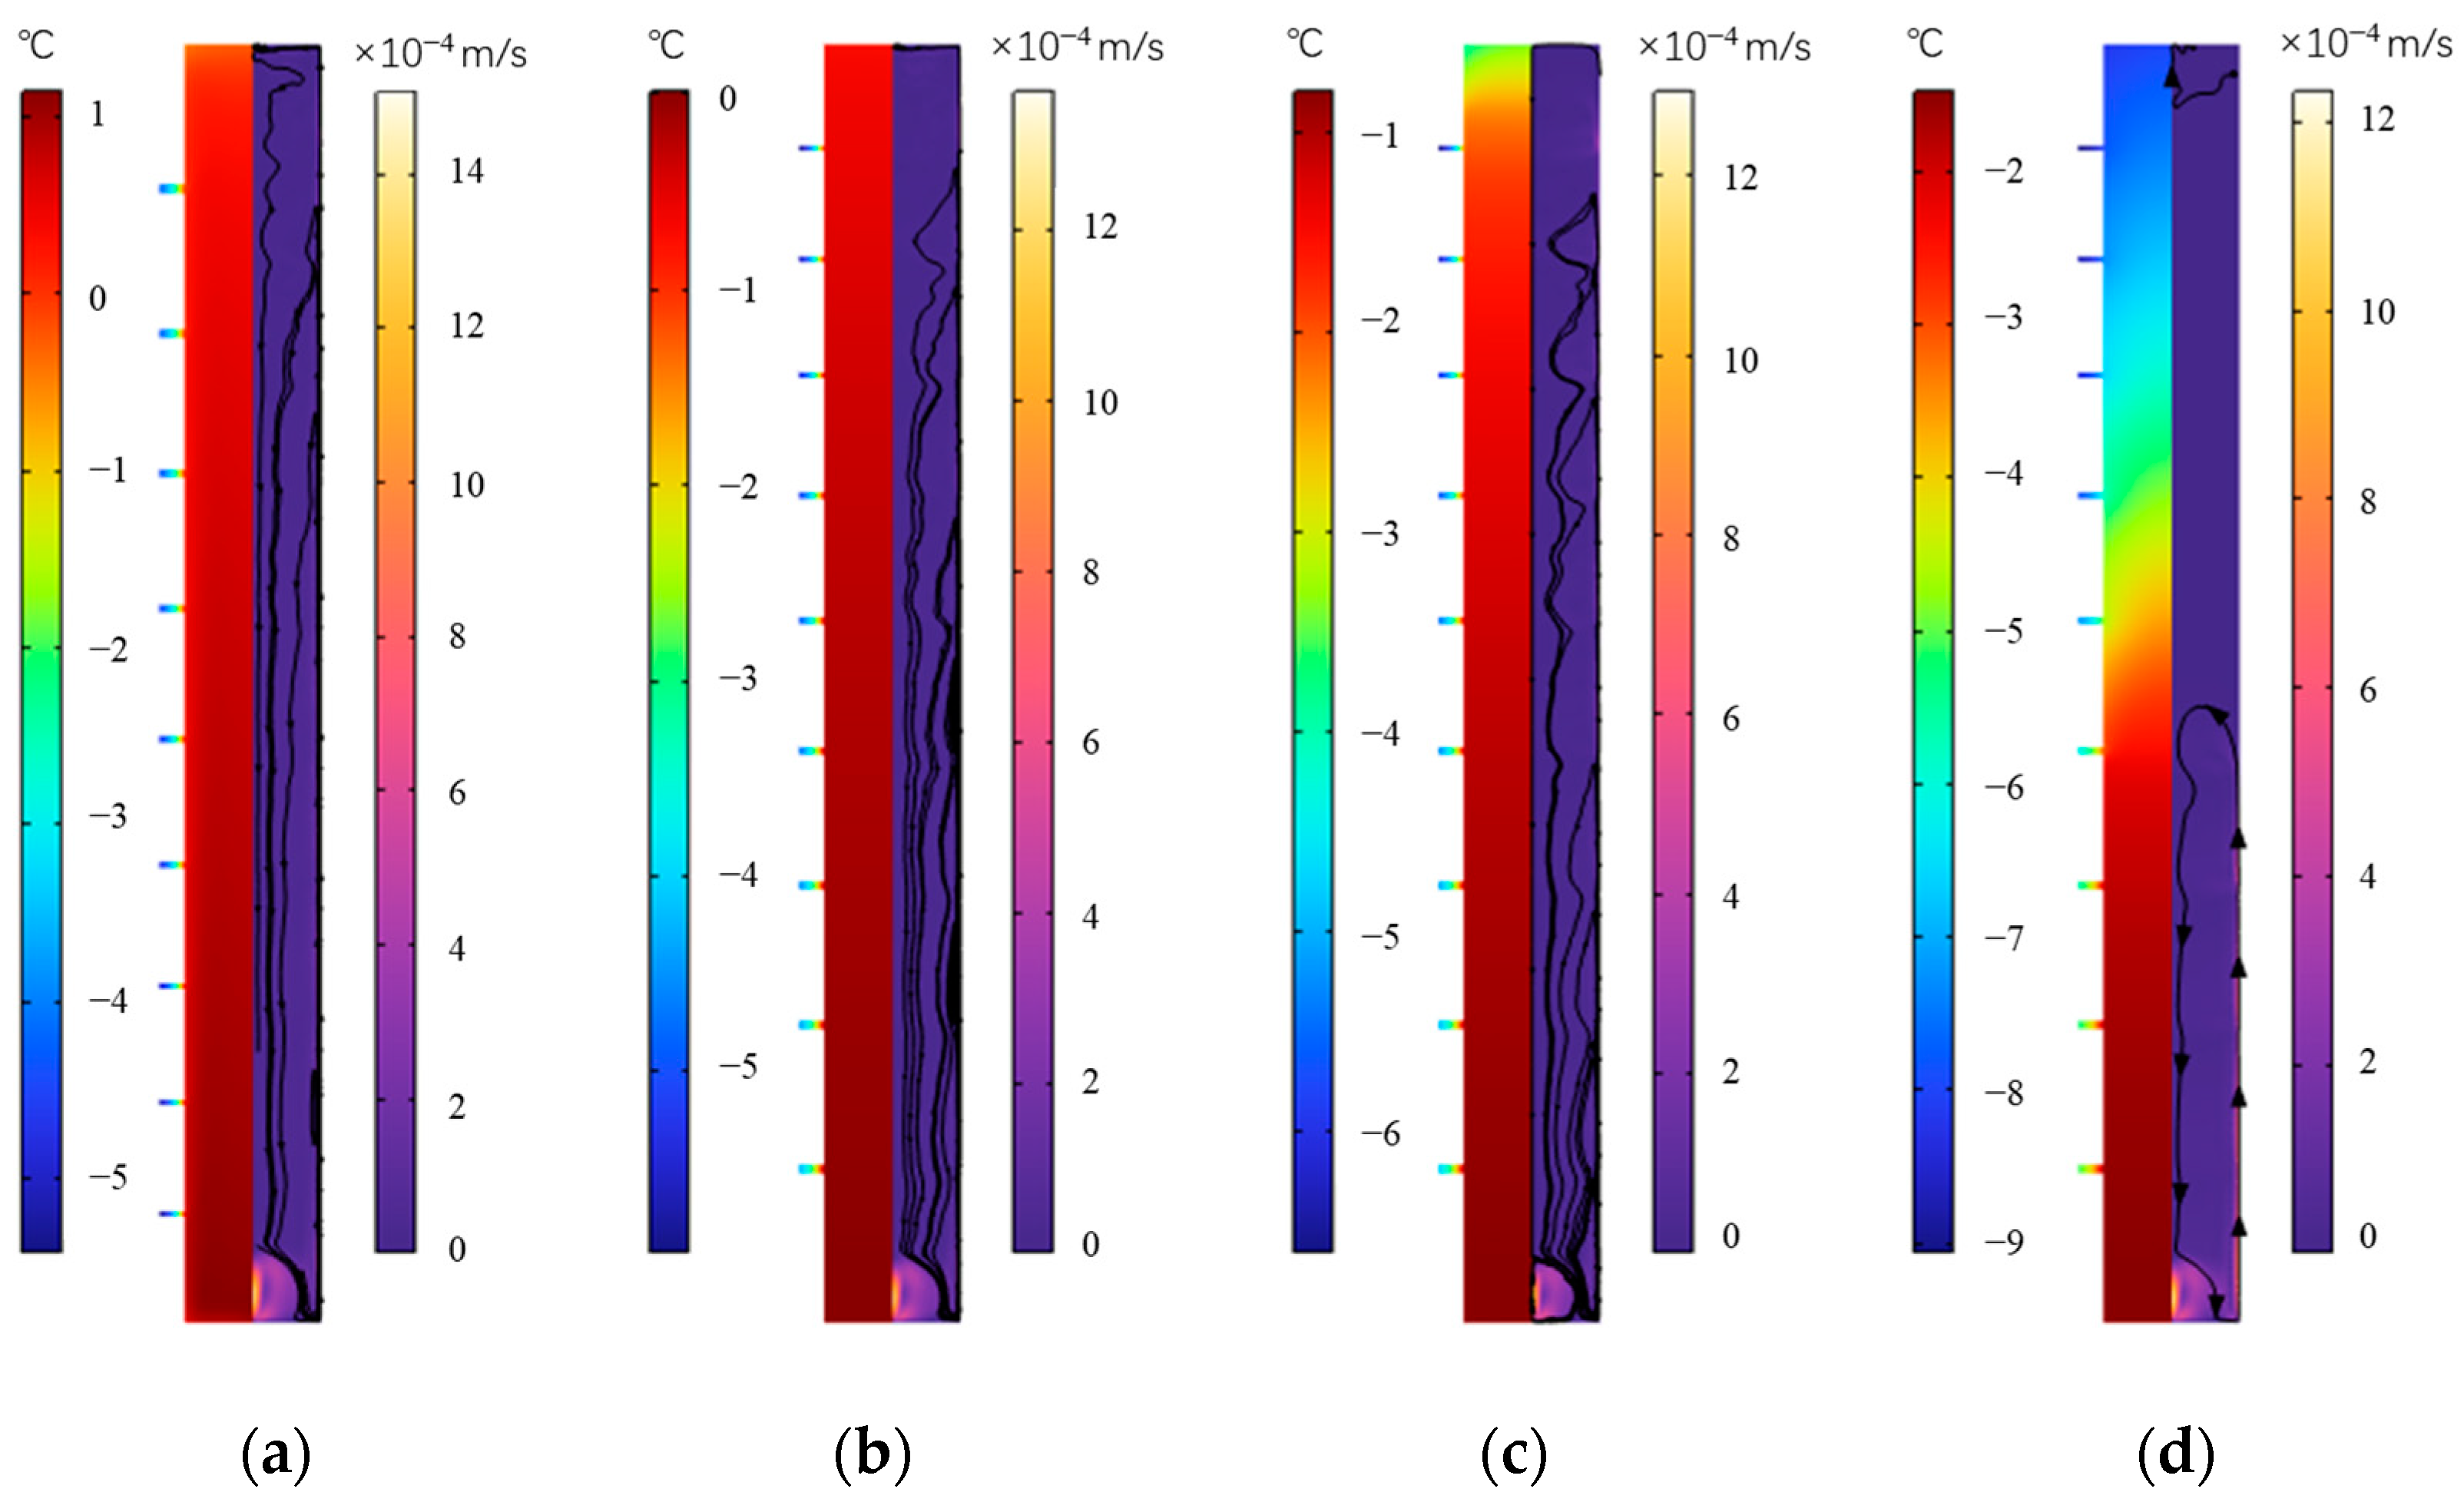
Figure 24 shows the distribution of temperature and velocity of the outer fin ice plate at various times during the cold storage. The outer fins increase the heat transfer area, strengthen the heat transfer process, and accelerate the cold storage process. As the cold storage progresses, the internal temperature of the plate shows a downward trend, with the highest temperature inside it decreasing from 1.1 °C to −1.1 °C from 250 min to 900 min. At the four moments shown in the figure, at the middle height, the temperature distribution inside the plate from the surface to the inside is 0.61~0.69 °C, −0.27~−0.21 °C, −1.2~−1.1 °C, and −3.5~−2.9 °C, respectively. The temperature gradually decreases from the surface of the plate to the inside. In the vertical direction, the temperature distribution on the intermediate interface at the above four moments is 0.8~0.15 °C, −0.05~−0.8 °C, −0.8~−3.4 °C, and −1.5~−8 °C, respectively. The temperature at the bottom of the plate is higher, and the temperature at the top is lower. The icing process is gradually completed from the bottom to the top. In terms of velocity distribution, when the water temperature near the wall decreases, the density decreases and flows upwards along the inner wall of the plate, while the partially frozen water moves downwards along the vertical center direction of the plate.

Figure 24.
Temperature and velocity distribution during the external fin ice plate cold release. (a) 250 min, (b) 500 min, (c) 750 min, and (d) 900 min.
Figure 25 shows the distribution of solid fraction in the outer fin ice plate at various times during the cold storage process. It can be seen that at the same time, the solid fraction near the surface of the plate in the horizontal direction is slightly higher, and after leaving the surface, the solid fraction decreases and seems unchanged. In the vertical direction, as the ice rises, the solid fraction inside the plate gradually decreases from top to bottom. At 750 min, the solid fraction in the upper part reached 1, and as the cold storage progresses, the iso-solid fraction line of 1 gradually moves downwards. At 900 min, the zone where the upper part is completely frozen (with a solid fraction of 1) increased to 60% of the entire plate.
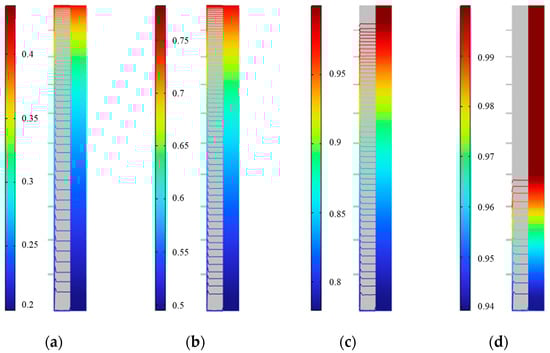
Figure 25.
Distribution of solid fraction during external fin ice plate storage. (a) 250 min, (b) 500 min, (c) 750 min, and (d) 900 min.
Figure 26 shows the distribution of temperature and velocity of the outer fin ice plate at various times during the cold release. It can be seen that, with outer fins, as the convective heat transfer intensity on the surface of the cold storage plate increases, the cold release will accelerate, and the surface temperature of the fins rises rapidly. From 250 min to 850 min, the highest temperature inside the plate rises from −0.16 °C to 4.0 °C. At any moment of cold release, the temperature at the bottom of the plate is higher, and as the release process progresses, the zone having a higher bottom temperature increases. In terms of velocity distribution, ice near the wall first melts into water and flows downwards, while the remaining ice gradually moves upwards along the vertical center direction of the plate. After the release is completed, all of it becomes water.

Figure 26.
Temperature and velocity distribution during the cold release of the outer fin ice plate. (a) 250 min, (b) 500 min, (c) 750 min, and (d) 850 min.
Figure 27 shows the distribution of the solid fraction at various times during the cooling release process of the outer fin ice plate. It can be seen that at a particular time, the ice near the surface of the plate melts, and simultaneously the solid fraction near the wall slightly decreases from the outside to the inside, then remains unchanged horizontally. In the vertical direction, the solid fraction inside the plate gradually decreases from the top to the bottom. At 750 min, the solid fraction at the bottom decreases to 0, and the completely melted water occupies more than 10% of the total volume of the plate. At 850 min, this proportion reaches 80%. The cooling process inside the plate is gradually completed from the bottom to the top.

Figure 27.
Distribution of solid fraction during the cold release process of outer fin ice plate. (a) 250 min, (b) 500 min, (c) 750 min, and (d) 850 min.
Compared with the inner fins, the outer fins increase the heat transfer area of ISP without affecting the natural convection of water inside the plate, thus enhancing heat transfer across the plate wall and resulting in shorter cooling storage and release times.
In terms of fin distribution, when the bottom fin reference spacing is less than 30 mm, the number of fins in the bottom is higher than that of the top, whereas when the reference spacing is larger than 30 mm, the number of the fins in the bottom is lower than that of the top. As cold storage starts from the top and cold release starts from the bottom, more fins in the bottom can enhance cold storage, while more fins in the top can enhance cold release. This can be clearly proved by Figure 18 regarding the cold storage and release time of the outer fins. However, the internal fins have a slightly more complex impact on the storage and release process owing to its influence on natural convection within the plate. The cooling and storage speed is faster for 25–35 mm and 35–45 mm, respectively. Thus, it can be concluded that the effect of uneven distribution of fins on cold storage and release differs.
In terms of fin size, when the bottom fin reference cross-sectional area is less than 10 mm2, the number of fins in the bottom is lower than that of the top. However, when the reference cross-sectional area is larger than 10 mm2, the number of fins in the bottom is higher than that of the top. As the cooling storage and release inside the plate start from the top and bottom, respectively, the release speed is higher when the reference area is less than 10 mm2 than when the reference area is larger than 10 mm2, but the cooling storage speed is slower than when the reference area is larger than 10 mm2. The setting of external and internal fins basically follows this rule. From the opposite effect of fin distribution and size on cold storage and release times, it can be concluded that, for situations where the cold storage time is required to be short but the cooling release time is not strictly required, a fin distribution with small reference spacing and large reference cross-sectional area can be selected. Conversely, a fin distribution with large reference spacing and small reference cross-sectional area can be selected. Owing to the higher cold storage and release speed of the outer fins compared to the inner fins, outer fins should be prioritized in situations with higher requirements for cold storage and release.
Given the diverse forms of cold storage equipment, the influence of fins on their cold storage and release characteristics varies considerably. From the influences of fin setting position, distribution, and size on the cold storage and release of vertical ISPs in this study, it can be seen that in ice plate design, fins should be applied to enhance heat transfer, and the priority of cold storage and release speed should be balanced as per specific requirements. The fin distribution and size should be appropriately selected to minimize the cold storage or release time, reduce refrigeration energy consumption, and improve the refrigeration operation efficiency of cold chain logistics.
5. Conclusions
ISPs are widely used in food cold chain transportation. Given the long storage time, the inefficient use of ISP affects the efficient operation of cold chain transportation. Therefore, this study establishes a mathematical model for ice plate cold storage and release processes, and analyzes the influence of fin setting position, distribution, and size on the cold storage, and the release characteristics of the plate. Our conclusions are:
(1) Compared with finless ISPs, fins can reduce the time required for cold storage and release and help in efficient charging and discharging of cold storage equipment.
(2) Setting fins on the outer surface of the plate saves more time in cold storage and release than setting them on the inner surface. Therefore, external fins must be prioritized in design. Furthermore, their processing and manufacturing are easier than internal fins.
(3) The impacts of fin size and distribution on the cold storage and release speed of the plate were studied for fins set up internally. Among the fin sizes studied, the cooling storage of fins with a reference spacing of 25–35 mm is faster than that of fins with other reference spacing values, while the cold release of fins with a reference spacing of 35–45 mm is faster than others. For a given distribution of fins, the cooling storage speed will increase with the increase in fin cross-sectional area, while the release speed will decrease. Overall, the distribution of inner fins has a higher impact on the cold storage and release speed than the size of fins.
(4) When setting fins externally, both the distribution and the size of fins affect the cold storage and release of the plate. The smaller the reference spacing between the outer fins, the faster the cooling storage, but the slower the cold release. In contrast, the smaller the size of the fins, the slower the cooling storage speed, and the slower the release speed. Consequently, in product design, the priority of cold storage and release should be balanced for specific applications to select the appropriate fin distribution and size.
(5) By analyzing the changes in temperature, velocity, and solid fraction inside the finned plate, it can be concluded that with natural convection, the temperature at the bottom of the plate is higher than that at the top during storage, and the solid fraction decreases from top to bottom, indicating that the icing process begins at the top, while the bottom is completed last. During the cooling process, the temperature at the bottom of the vertical plate is also higher than the top, and the solid fraction gradually decreases from the top to the bottom. The ice melting during the cooling process is gradually completed from the bottom to the top.
Author Contributions
Conceptualization, K.W.; software, H.Z.; validation, K.W.; formal analysis, K.W.; investigation, K.W.; writing—original draft preparation, K.W.; writing—review and editing, K.W.; visualization, Y.W. All authors have read and agreed to the published version of the manuscript.
Funding
This research was funded by Yantai Science and Technology Innovation Development Plan Project from Yantai Bureau of Science and Technology, grant number 2021XDHZ061.
Data Availability Statement
The original contributions presented in the study are included in the article, further inquiries can be directed to the corresponding author.
Conflicts of Interest
The authors declare no conflicts of interest.
Nomenclature
| ρ | Density, kg/m3 |
| time, s | |
| λ | thermal conductivity, W/m/K |
| dynamic viscosity, Pa∙s | |
| c | heat capacity, J/kg/K |
| h | convective heat transfer coefficient, W/m2/K |
| H | specific enthalpy, kJ/kg |
| p | pressure, Pa |
| t | temperature, °C |
| u | velocity, m/s |
| Subscripts | |
| b | plate wall |
| c | ice |
| g | dry air |
| l | denotes water |
| w | plate wall surface |
References
- Sha, Y.S.; Hua, W.S.; Cao, H.F.; Zhang, X.L. Properties and encapsulation forms of phase change material and various types of cold storage box for cold chain logistics: A review. J. Energy Storage 2022, 55, 105426. [Google Scholar] [CrossRef]
- Zhang, B.; Cao, H.-J.; Wei, W.-Y.; Ying, X.G. Influence of temperature fluctuations on growth and recrystallization of ice crystals in frozen peeled shrimp (Litopenaeus vannamei) pre-soaked with carrageenan oligosaccharide and xylooligosaccharide. Food Chem. 2020, 306, 125641. [Google Scholar] [CrossRef] [PubMed]
- Mercier, S.; Villeneuve, S.; Mondor, M.; Uysal, I. Time-temperature management along the food cold chain: A review of recent developments. Compr. Rev. Food Sci. Food Saf. 2017, 16, 647–667. [Google Scholar] [CrossRef] [PubMed]
- Khademi, A.; Shank, K.; Mehrjardi, S.A.A.; Tiari, S.; Sorrentino, G.; Said, Z.; Chamkha, A.J.; Ushak, S. A brief review on different hybrid methods of enhancement within latent heat storage systems. J. Energy Storage 2022, 54, 105362. [Google Scholar] [CrossRef]
- Mousazade, A.; Rafee, R.; Valipour, M.S. Thermal performance of cold panels with phase change materials in a refrigerated truck. Int. J. Refrig. 2020, 120, 119–126. [Google Scholar] [CrossRef]
- Liu, M.; Saman, W.; Bruno, F. Development of a novel refrigeration system for refrigerated trucks incorporating phase change material. Appl. Energy 2012, 92, 336–342. [Google Scholar] [CrossRef]
- Chen, Y.; Zhang, X.; Ji, J.; Zhang, C. Cold chain transportation energy conservation and emission reduction based on phase change materials under dual-carbon background: A review. J. Energy Storage 2024, 86, 111258. [Google Scholar] [CrossRef]
- Li, C.; Peng, M.; Xie, B.; Li, Y.; Li, M. Novel phase change cold energy storage materials for refrigerated transportation of fruits. Renew. Energy 2024, 220, 119583. [Google Scholar] [CrossRef]
- Comodi, G.; Carducci, F.; Nagarajan, B.; Romagnoli, A. Application of cold thermal energy storage (CTES) for building demand management in hot climates. Appl. Therm. Eng. 2016, 103, 1186–1195. [Google Scholar] [CrossRef]
- Zhao, Y.; Zhang, X.; Xu, X.; Zhang, S. Development of composite phase change cold storage material and its application in vaccine cold storage equipment. J. Energy Storage 2020, 30, 101455. [Google Scholar] [CrossRef]
- Zhao, Y.; Zhang, X.; Xu, X.; Zhang, S. Research progress of phase change cold storage materials used in cold chain transportation and their different cold storage packaging structures. J. Mol. Liq. 2020, 319, 114360. [Google Scholar] [CrossRef]
- Wang, Y.; Zadeh, P.G.; Duong, X.Q.; Chung, J.D. Optimizing fin design for enhanced melting performance in latent heat thermal energy storage systems. J. Energy Storage 2023, 73, 109108. [Google Scholar] [CrossRef]
- Qasem, N.A.A.; Belazreg, A.; Khetib, Y.; Abderrahmane, A.; Homod, R.Z.; Younis, O.; Rawa, M. Effect of novel fin distribution on the melting process of thermal storage units. Appl. Therm. Eng. 2024, 243, 122547. [Google Scholar] [CrossRef]
- He, Z.; Ma, H.; Lu, S. Design and experimental investigation of topology-optimized fin structures for enhanced heat transfer in latent heat thermal energy storage units. J. Energy Storage 2024, 80, 110272. [Google Scholar] [CrossRef]
- Yang, X.; Guo, J.; Yang, B.; Cheng, H.; Wei, P.; He, Y. Design of non-uniformly distributed annular fins for a shell-and-tube thermal energy storage unit. Appl. Energy 2020, 279, 115772. [Google Scholar] [CrossRef]
- Nie, C.; Liu, X.; Rao, Z.; Liu, J. Discharging performance evaluation and optimization of a latent heat thermal energy storage unit with helm-shaped fin. Appl. Therm. Eng. 2024, 236, 121595. [Google Scholar] [CrossRef]
- Mahdi, J.M.; Lohrasbi, S.; Ganji, D.D.; Nsofor, E.C. Accelerated melting of PCM in energy storage systems via novel configuration of fins in the triplex-tube heat exchanger. Int. J. Heat Mass Transf. 2018, 124, 663–676. [Google Scholar] [CrossRef]
- Joybari, M.M.; Haghighat, F.; Al-Abidi, A.A. Heat transfer enhancement of phase change materials by fins under simultaneous charging and discharging. Energy Convers. Manag. 2017, 152, 136–156. [Google Scholar] [CrossRef]
- Yang, X.; Wang, X.; Liu, Z.; Luo, X.; Yan, J. Effect of fin number on the melting phase change in a horizontal finned shell-and-tube thermal energy storage unit. Sol. Energy Mater. Sol. Cells 2022, 236, 111527. [Google Scholar] [CrossRef]
- Karami, R.; Kamkari, B. Investigation of the effect of inclination angle on the melting enhancement of phase change material in finned latent heat thermal storage units. Appl. Therm. Eng. 2019, 146, 45–60. [Google Scholar] [CrossRef]
- Yazici, M.Y.; Avci, M.; Aydin, O. Combined effects of inclination angle and fin number on thermal performance of a PCM-based heat sink. Appl. Therm. Eng. 2019, 159, 113956. [Google Scholar] [CrossRef]
- Ji, C.; Qin, Z.; Low, Z.H.; Dubey, S.; Choo, F.H.; Duan, F. Non-uniform heat transfer suppression to enhance PCM melting by angled fins. Appl. Therm. Eng. 2018, 129, 269–279. [Google Scholar] [CrossRef]
- Tong, S.; Nie, B.; Li, Z.; Li, C.; Zou, B.; Jiang, L.; Jin, Y.; Ding, Y. A phase change material (PCM) based passively cooled container for integrated road-rail cold chain transportation—An experimental study. Appl. Therm. Eng. 2021, 195, 117204. [Google Scholar] [CrossRef]
- Zheng, H.; Zhang, Z.; Sun, J. Study on performance of carbon nanotube composite phase change cold storage sphere with annular fins. J. Energy Storage 2024, 78, 110074. [Google Scholar] [CrossRef]
- Zhai, X.Q.; Cheng, X.W.; Wang, C.; Wang, R.Z. Experimental investigation and performance analysis of a fin tube phase change cold storage unit for high temperature cooling application. Energy Build. 2015, 89, 9–17. [Google Scholar] [CrossRef]
- Lee, Y.-T.; Chien, L.-H.; Cheung, F.-B.; Yang, A.-S. Numerical and experimental investigations on melting heat transfer performance of PCM in finned cold thermal energy storage. Int. J. Heat Mass Transf. 2023, 210, 124199. [Google Scholar] [CrossRef]
- Voller, V.R.; Prakash, C. A fixed grid numerical modeling methodology for convection-diffusion mushy region phase-change problems. Int. J. Heat Mass Transf. 1987, 30, 1709–1719. [Google Scholar] [CrossRef]
- Wu, F.; Fan, Y.B.; Zhang, X.J.; Zhang, H.; Wang, Z.L.; Wang, Z.W.; Jiang, L. Performance prediction on ice melting process for cold energy utilization: Effect of natural convection. J. Energy Storage 2022, 55, 105638. [Google Scholar] [CrossRef]


Disclaimer/Publisher’s Note: The statements, opinions and data contained in all publications are solely those of the individual author(s) and contributor(s) and not of MDPI and/or the editor(s). MDPI and/or the editor(s) disclaim responsibility for any injury to people or property resulting from any ideas, methods, instructions or products referred to in the content. |
© 2024 by the authors. Licensee MDPI, Basel, Switzerland. This article is an open access article distributed under the terms and conditions of the Creative Commons Attribution (CC BY) license (https://creativecommons.org/licenses/by/4.0/).