Abstract
In response to the global pursuit of net-zero carbon emissions, the electrification of agricultural machinery is becoming a significant research and development trend. This study introduces the overall design of a 4 kW air compressor aimed at achieving a green vision for agricultural machinery. The design focuses on providing continuous and stable power and air output using a lithium-ion battery. Durability and cost-effectiveness are prioritized, with a particular emphasis on the Arduino system for integrating battery and motor systems to withstand harsh conditions and ensure ease of maintenance. A permanent magnet brushless motor was selected as the power source, paired with an optimized pulley to supply the proper torque to the air compressor. The system employs an Arduino-based feedback control sensor for air pressure regulation, ensuring energy efficiency. The primary energy source is a 48 V lithium iron phosphate battery, known for its high energy density and safety. The battery design focuses on system integration, addressing specific environmental discharge requirements. The embedded battery management system provides thermal and lifecycle parameter estimation, guaranteeing long-duration power supply and safe operation under various conditions. Unlike traditional fuel-driven systems, lithium iron phosphate batteries do not emit harmful gases, aligning with environmental standards. System integration testing demonstrated that the air pressure feedback control effectively meets the energy-saving requirements by digitally reducing power output as air accumulates in the chamber. Bench testing confirmed that the system performs as designed, achieving the desired results and advancing the goal of sustainable agricultural machinery.
1. Introduction
Global warming and carbon dioxide (CO2) concentration in the atmosphere represent critical problems. The agriculture and forestry sectors make major contributions to global greenhouse gas emissions, accounting for almost 20% of carbon dioxide equivalents, 42% of methane, and 75% of nitrogen oxides (NOx). The majority of these pollutants are generated by intensive animal farming and manual labor on the ground. However, internal combustion engines (ICEs), which are the predominant power source in the forestry and agriculture industries, also make a substantial contribution [1]. Traditional fuel-powered agricultural machinery, such as tractors and harvesters, are known for their low energy efficiency and high emissions, exacerbating the environmental impact. These machines often operate under suboptimal conditions, leading to excessive fuel consumption and maintenance challenges.
The advantages of electrification are reflected in the simplification of maintenance and operation. Compared to internal combustion engines, the fewer moving parts of the Battery Electric Vehicles (BEVs) allow for a lower maintenance cost [2]. In addition, the operation and monitoring of electrical equipment is also more convenient. It can be matched with a Programmable Logic Controller (PLC) or embedded system according to the application field and performance requirements to achieve remote monitoring and automatic control, which is further improved to improve operating efficiency; operating power can also be adjusted automatically according to actual load conditions to achieve energy saving effect. Electrified air compressor design should be explored more, including electric motor selection and system integration.
The design and system integration of a 4-kilowatt (4 kW) air compressor is of great significance in the current industrial and agricultural environment. As a widely used power equipment, air compressors play a key role in factories, farms, construction sites, and other places. Agricultural machinery services are an important source of effective farm mechanization via the provision of farm machinery purchase subsidy policies to improve the level of agricultural mechanization. A sound subsidy policy for the purchase of agricultural machinery has a positive effect on farmer income [3,4]. By applying electrification, air compressors will improve efficiency, reduce energy waste, and align with environmental standards set by initiatives like the Sustainable Development Goals (SDGs) of the United Nations [5].
This research focuses on addressing these issues by designing and implementing a 4 kW air compressor powered by a Brushless DC (BLDC) motor, with control facilitated through an Arduino-based system. By leveraging the flexibility and programmability of Arduino, this study aims to provide a viable and efficient alternative to conventional internal combustion engine-powered machinery.
Arduino 1.8.19 is an independent platform in the control with cheap, easy-to-program, open-source hardware and software [6,7,8], which makes it possible to control the elaborate functions of a switch in a BLDC motor via integration with other devices, parts, or sensors, among others. This is because the Arduino microcontroller specifically used in controlling and monitoring this unit is also involved in speed control and torque control, as well as in controlling and monitoring the air compressor system for the performance of the air compressor. In addition, Arduino also makes the control architecture more easily deployed, and it can be modified and enhanced in the future so that the system is ready for future technologies [8,9].
One of the key features of this study revolves around programming Arduino to enhance the BLDC motor [10,11,12,13,14]. These systems manage the motor’s operation by adjusting parameters in real time based on sensor feedback, ensuring optimal efficiency and reliability of the Arduino-based control [12,15]. The system facilitates the fine-tuning of motor performance, enabling the air compressor to operate under varying load conditions with minimal energy consumption. This adaptability is crucial for maintaining high efficiency and durability in agricultural applications.
2. Materials and Methods
Here, we will explain parts of the materials and methods in the process of converting an air compressor from an internal combustion engine to an electric motor.
2.1. Air Compressor
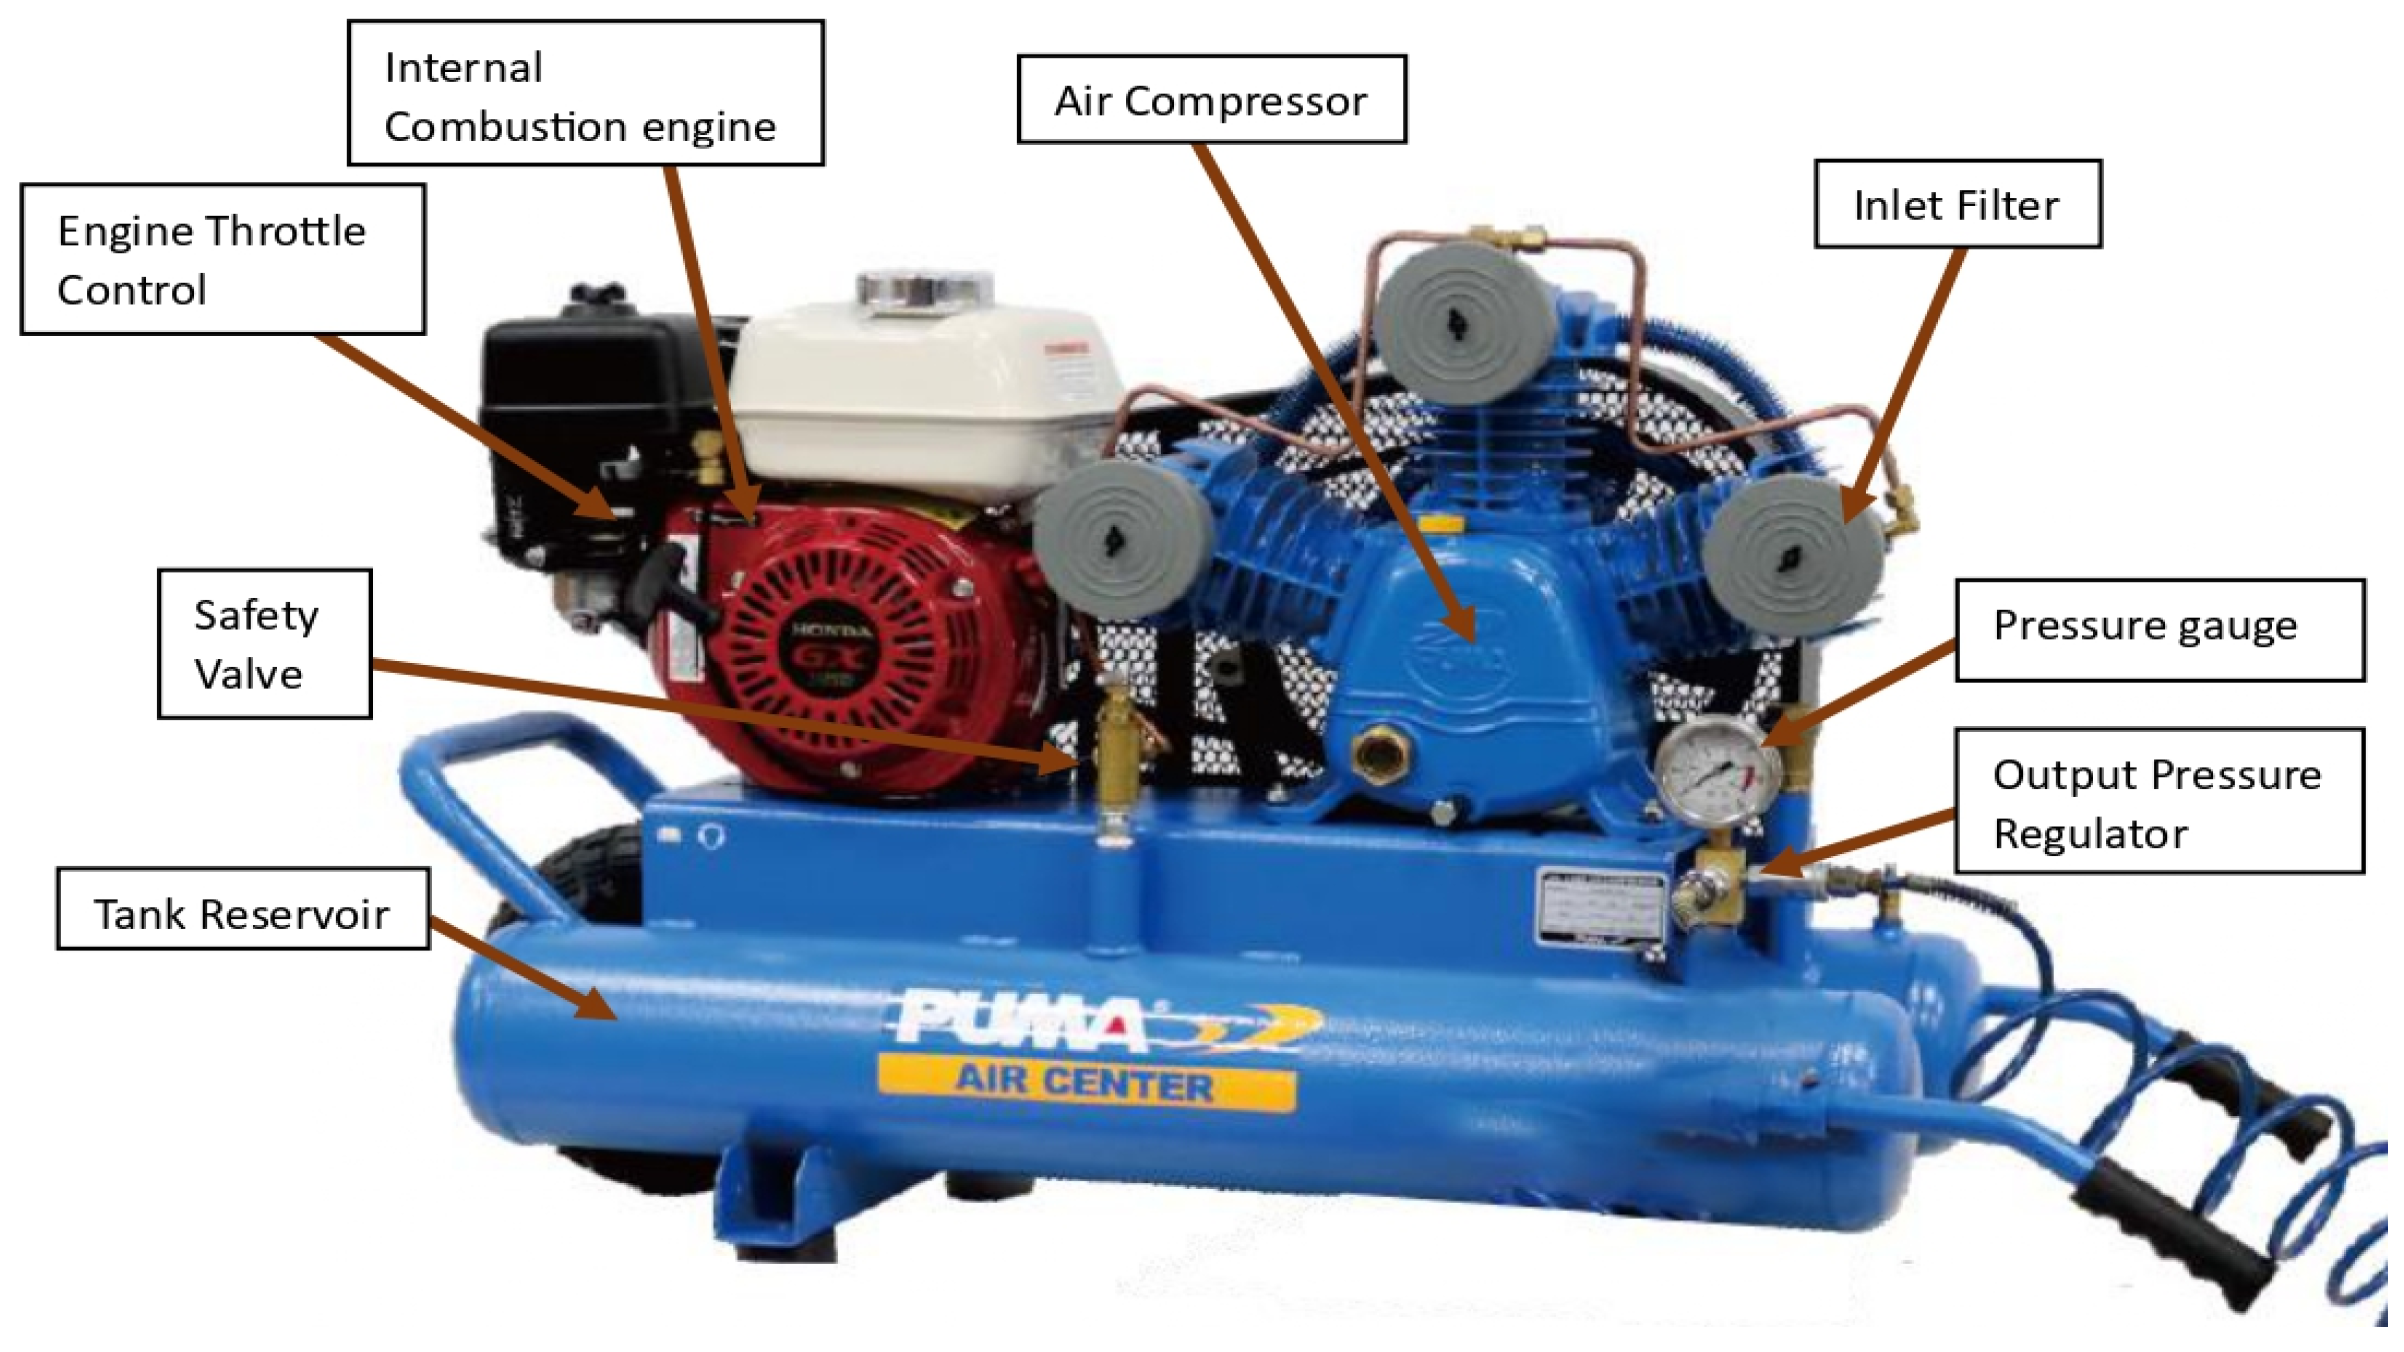
Air compressors play a crucial role in the agriculture sector because of their versatility and efficiency. These devices convert mechanical energy from an internal combustion engine (ICE) into pressurized air by filling more air into the storage tank and increasing the pressure. The main components of an air compressor include the engine, compressor pump, intake and discharge valves, pressure switch, pressure gauge, and regulator. An example of an air compressor can be seen in Figure 1.

Figure 1.
Air compressor.
One of the key points of an air compressor is to reduce manpower by powering tools or machinery such as irrigation systems, pneumatic systems, and spray applications. For instance, in irrigation systems, they ensure consistent water distribution, while in grain handling, they facilitate the safe and efficient movement of grains. In livestock farming, compressed air supports feeding systems and milking machines, contributing to overall operational efficiency. The durability of modern air compressors allows them to withstand harsh agricultural environments, ensuring long-term reliability and minimal downtime. Despite the initial investment, they prove cost-effective over time by reducing the need for multiple specialized tools. When selecting an air compressor, it is crucial to understand its power requirements. The power () required by an air compressor can be estimated using the equation
where Q is the volume flow rate in cubic feet per minute (CFM), P2 is the discharge pressure in pounds per square inch (PSI), P1 is the inlet pressure, is the efficiency of the compressor, and 1714 is a constant for unit conversion. Here, we will replace ICE with BLDC as the main driver of the air compressor.
2.2. BLDC
The concept for developing BLDC motors was established more than 50 years ago by T.G. Wilson and P.H. Trickey’s several experiments using solid-state commutation to run Direct Current (DC) motors [16]. BLDC motors are anticipated to offer lower operating noise, a higher torque-to-weight ratio, and higher efficiency when compared to other motors [1]. The motor in these machines is primed to run at unity power factor by the stationary flux between the rotor and stator. Motor drives with electronic commutation are used to operate BLDC motors. A closed-loop controller drives each phase of the motor. A closed-loop controller’s primary function is to pulse the motor windings with current so that the motor’s torque and speed may be controlled, as the two phenomena work in tandem [17].
A small number of circuits known as sensor-less controls measure the back electromotive force in the non-driven coils to determine the position of the rotor instead of using Hall Effect sensors to determine the rotor’s position directly. Three dual-directional outputs on a general hall sensor fixed BLDC motor are managed by a circuit using digital logic. Other sensor-less controllers are designed to estimate characteristics like flux and back electromotive force by detecting the winding current flow induced by the magnets’ direction. In many high-power automotive applications, indirect controls are used even though they are sensor-free and give less reaction than direct control with sensors, as well as more structural complexity [18]. The drive collects inputs from the motors and the drive, such as the rotor angle and position, stator currents, hysteresis band current, etc., to regulate the motor speed and the commutation logic in an efficient manner. The correct rotation of the motor is ensured by the proper management of the switching of numerous switches in motor drives [19]. Despite the availability of various methods to control the harmonic content in drive supplies, the pulse width modulation (PWM) technique is preferred. Among the PWM techniques, space vector PWM (SVPWM) control is particularly favored. Current control strategies using PWM and hysteresis controllers are crucial for enhancing motor drive performance [20].
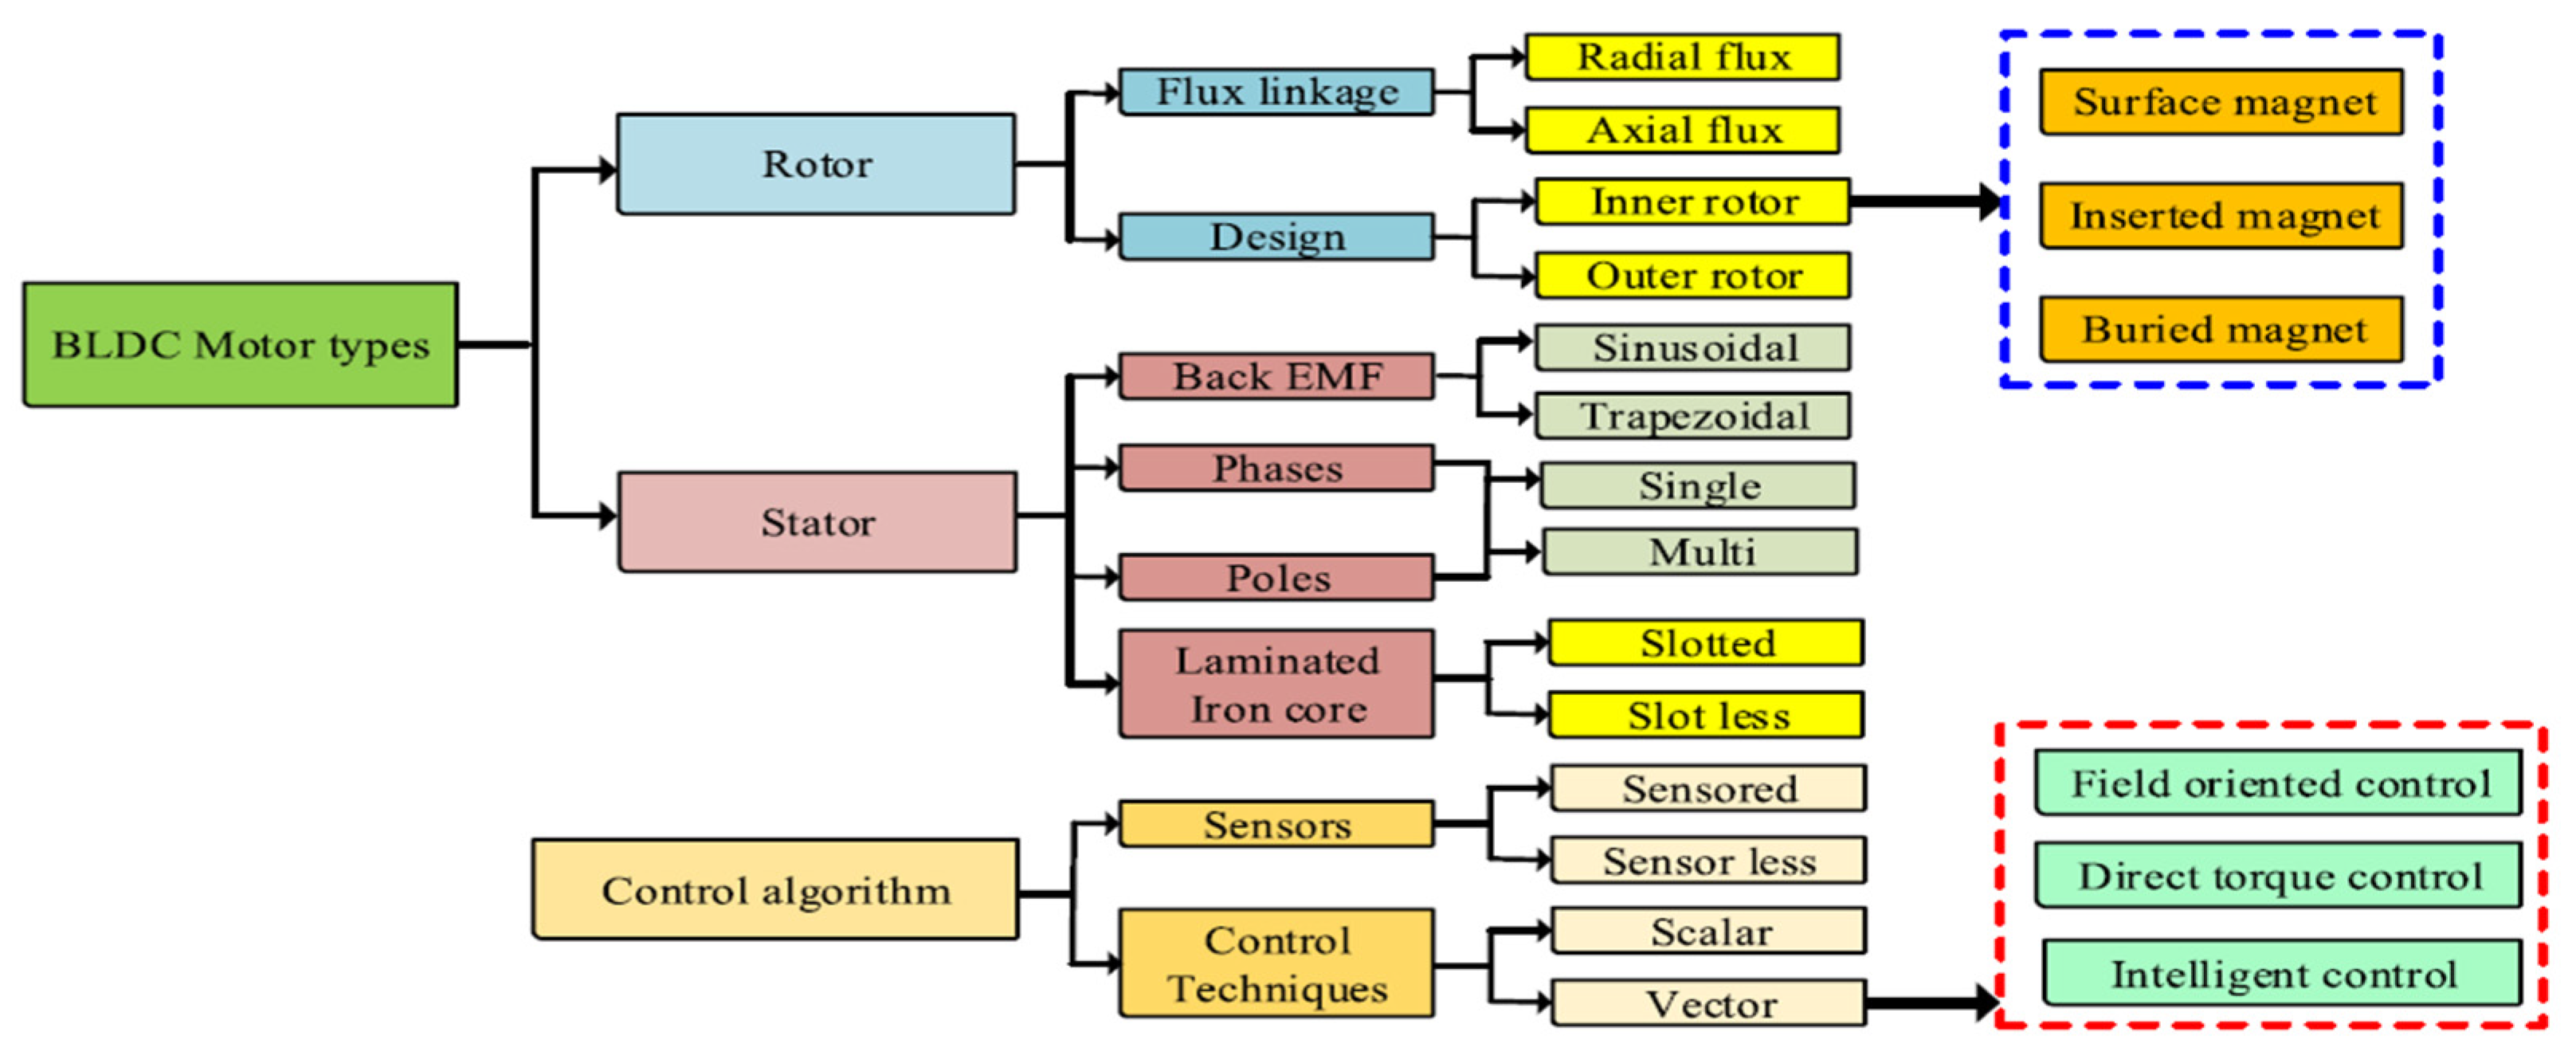
The two components of a BLDC motor’s physical design are the rotor and the stator. Figure 2 depicts the classification of BLDC motor types. The motor is built with an inner rotor and an outer rotor, among other configurations. The outer rotor-designed BLDC motor is covered in [21]. The stator windings are kept motionless within, while the rotor permanent magnet is inserted on the outside. The motor’s output torque and power density are increased by the outer rotor BLDC [11]. The primary applications of the outer rotor BLDC motor are in home electronics, water pumping, electric cars, drones, and variable drive sectors. The airgap radius between the stator and rotor is kept to a minimum while designing an outer rotor BLDC motor. Consequently, the torque capacity per unit length and current is increased. The addition of structural components improves the rotor’s stability.

Figure 2.
Types of BLDC motor and control algorithms [17].
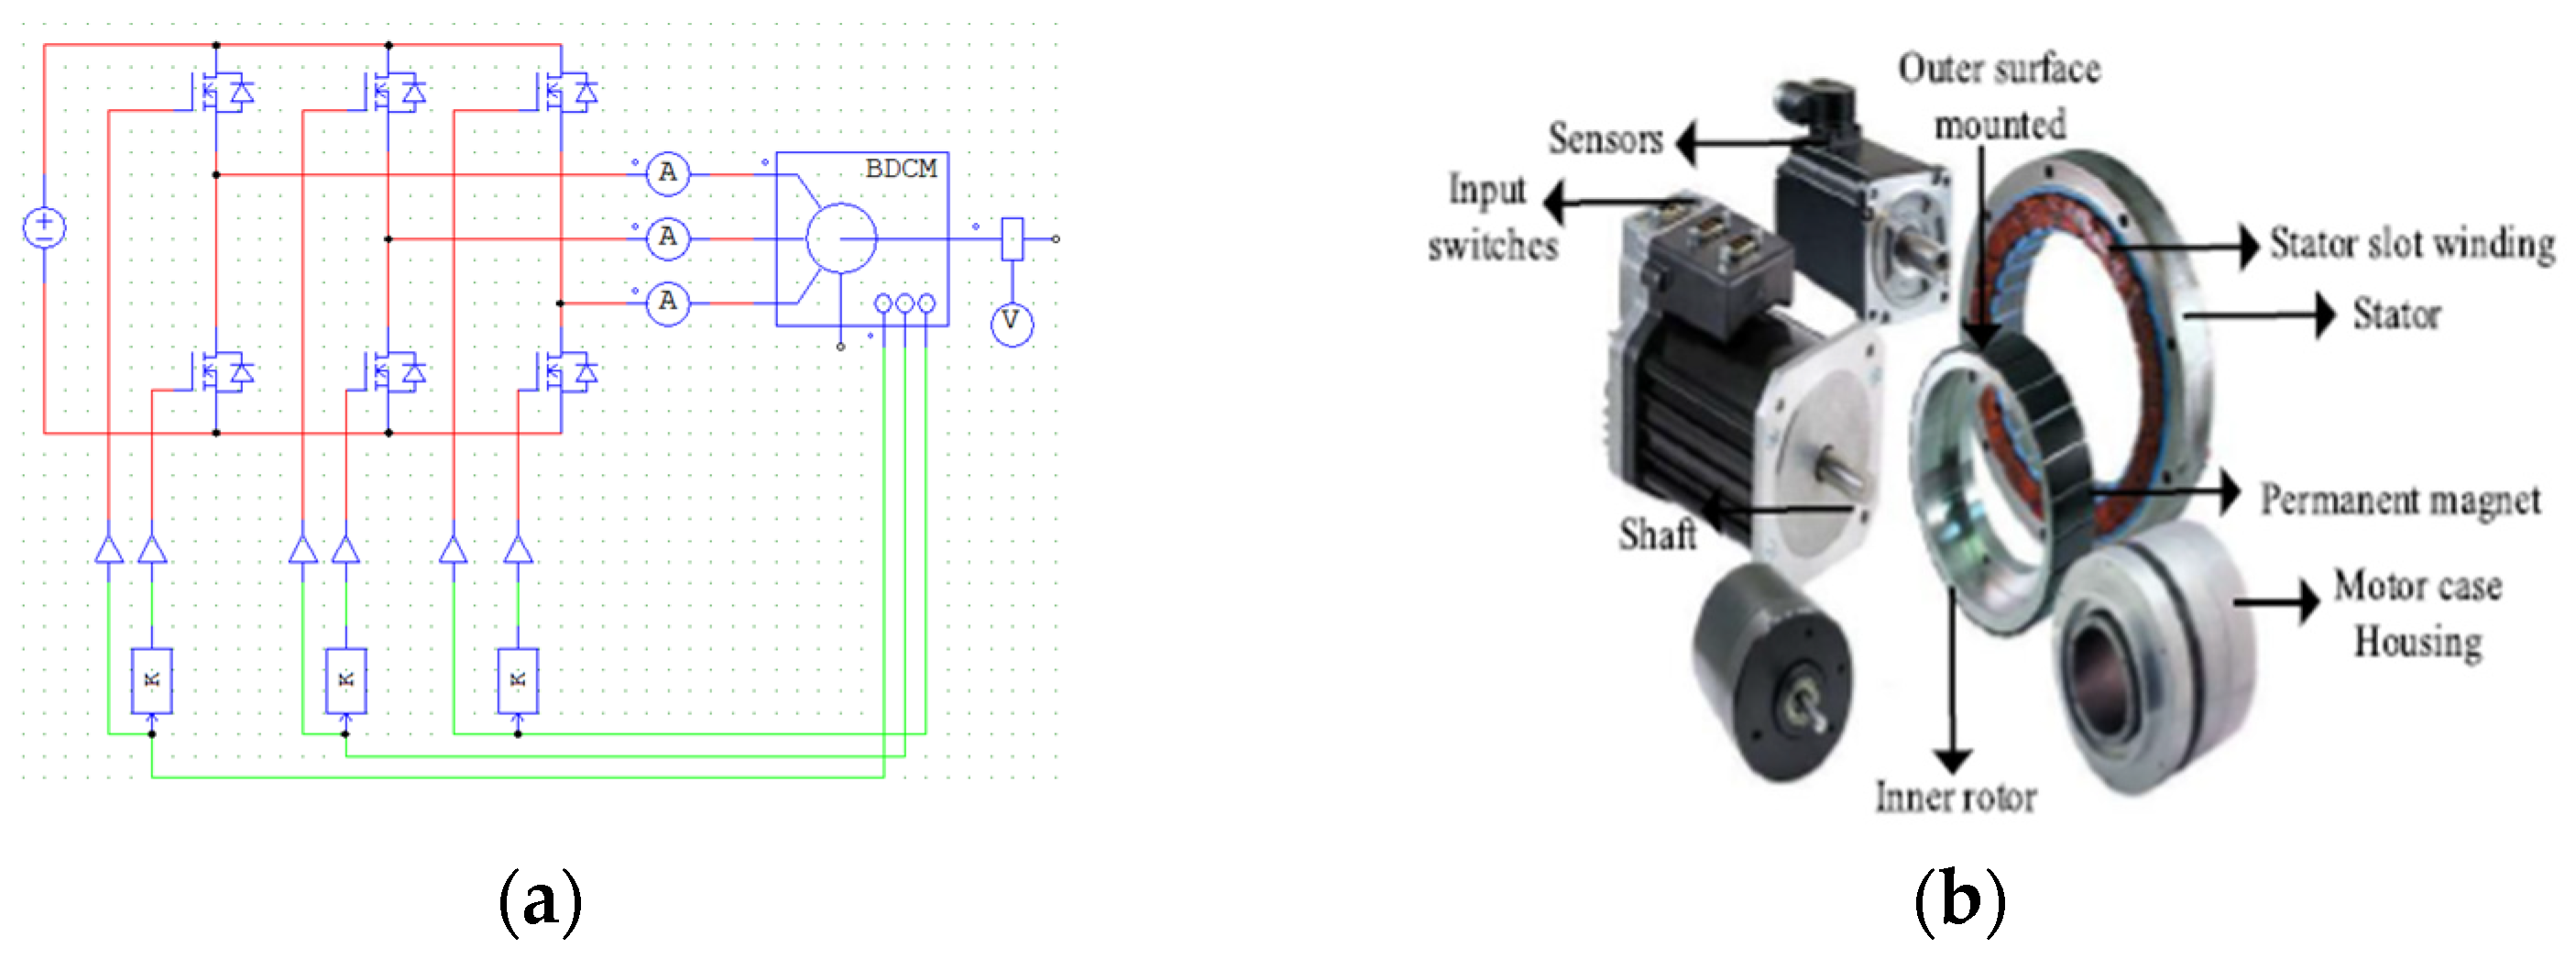
Figure 3a illustrates the power circuit used for the scalar control of the BLDC motor. The power switches T1 to T6 are Insulated Gate Bipolar Transistor (IGBT) devices and are regulated by pulse width modulation (PWM) signals Sa, Sb, and Sc. Given the aforementioned configuration, the BLDC motor can also be combined in the future. Therefore, the losses in motor transmission are minimized. The motor drive systems are categorized into four types: (i) radially housing mounted, (ii) radially stator iron mounted, (iii) axially housing mounted, and (iv) axially stator iron mounted. The picture illustrating the integrated motor drive is shown in Figure 3b.

Figure 3.
(a) The power circuit of scalar control of BLDC motor; (b) BLDC axial flux integrated inverter mounted.
BLDC motors are utilized in various applications because of their favorable characteristics, such as a high torque-to-speed ratio, high efficiency, fast dynamic response, and low maintenance requirements. Figure 4 illustrates the control diagram for the input voltage control technique used to mitigate torque ripple in a BLDC motor. The unique characteristics include a trapezoidal back electromotive force (EMF) and a quasi-square-wave supplied phase current. Torque ripples occur due to the discrepancy between the projected return electromotive force (EMF) and the phase current fed by a quasi-square wave. During this phase, we will examine a method for managing fluctuations in torque by regulating the input voltage. Multiple researchers have examined this method of regulating the input voltage. The methods for controlling the input voltage can be classified into two categories: pulse width modulation (PWM) schemes and altering the dc-link voltage. Torque ripples typically arise from the commutation of power switches. The modulation of this commutation can be regulated using the pulse width modulation (PWM) technique. This text extensively discusses a modern approach to minimizing fluctuations in torque during both conduction and commutation by employing a closed-loop operation using a pulse width modulation (PWM) system with a buck converter. The PWM schemes may be classified into two stages. The first stage involves managing the commutation using PWM schemes. The second stage involves utilizing a buck converter to convert the input voltage (vin) to the output voltage (vout) [17].
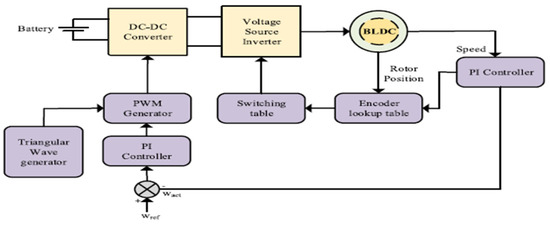
Figure 4.
Controlling input voltage of a BLDC motor [17].
2.3. Battery
Lithium-ion batteries (LIBs) are rechargeable electrochemical energy storage devices widely used due to their high energy density, long lifespan, and efficiency [22] as shown in Figure 5. They work on the principle of lithium ions moving between the anode and cathode during discharge and charge cycles. This movement of ions allows the battery to store and release energy effectively. LIBs are commonly used in various applications such as portable electronic devices, electric vehicles, and energy storage systems due to their superior performance compared to other battery types [23].
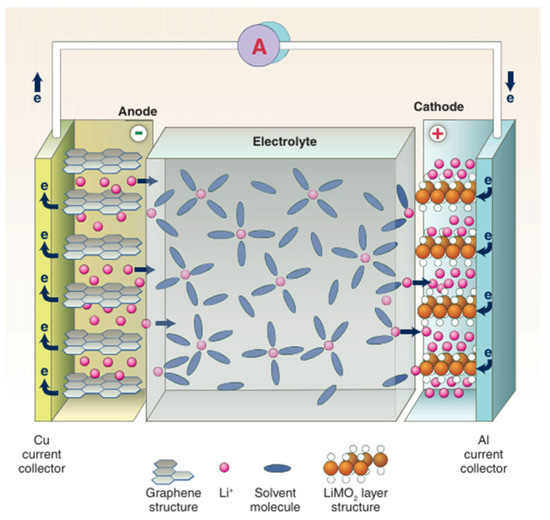
Figure 5.
Diagram of a lithium-ion battery (LIB) [24].
LIBs offer numerous advantages, making them the preferred choice for many modern applications, including powering electric compressors. One of the primary benefits is their high energy density, allowing lithium-ion batteries to store more energy in a smaller size compared to conventional batteries like lead-acid batteries. This characteristic is crucial for applications requiring mobility and space efficiency [25]. Additionally, lithium-ion batteries have long lifespans and can undergo hundreds to thousands of recharge cycles before their capacity significantly decreases, making them a cost-effective long-term option. The efficiency of the charging and discharging processes is another advantage, with minimal energy loss compared to other battery technologies. These advantages make lithium-ion batteries particularly suitable for use in electric compressors, providing reliable and efficient performance [26].
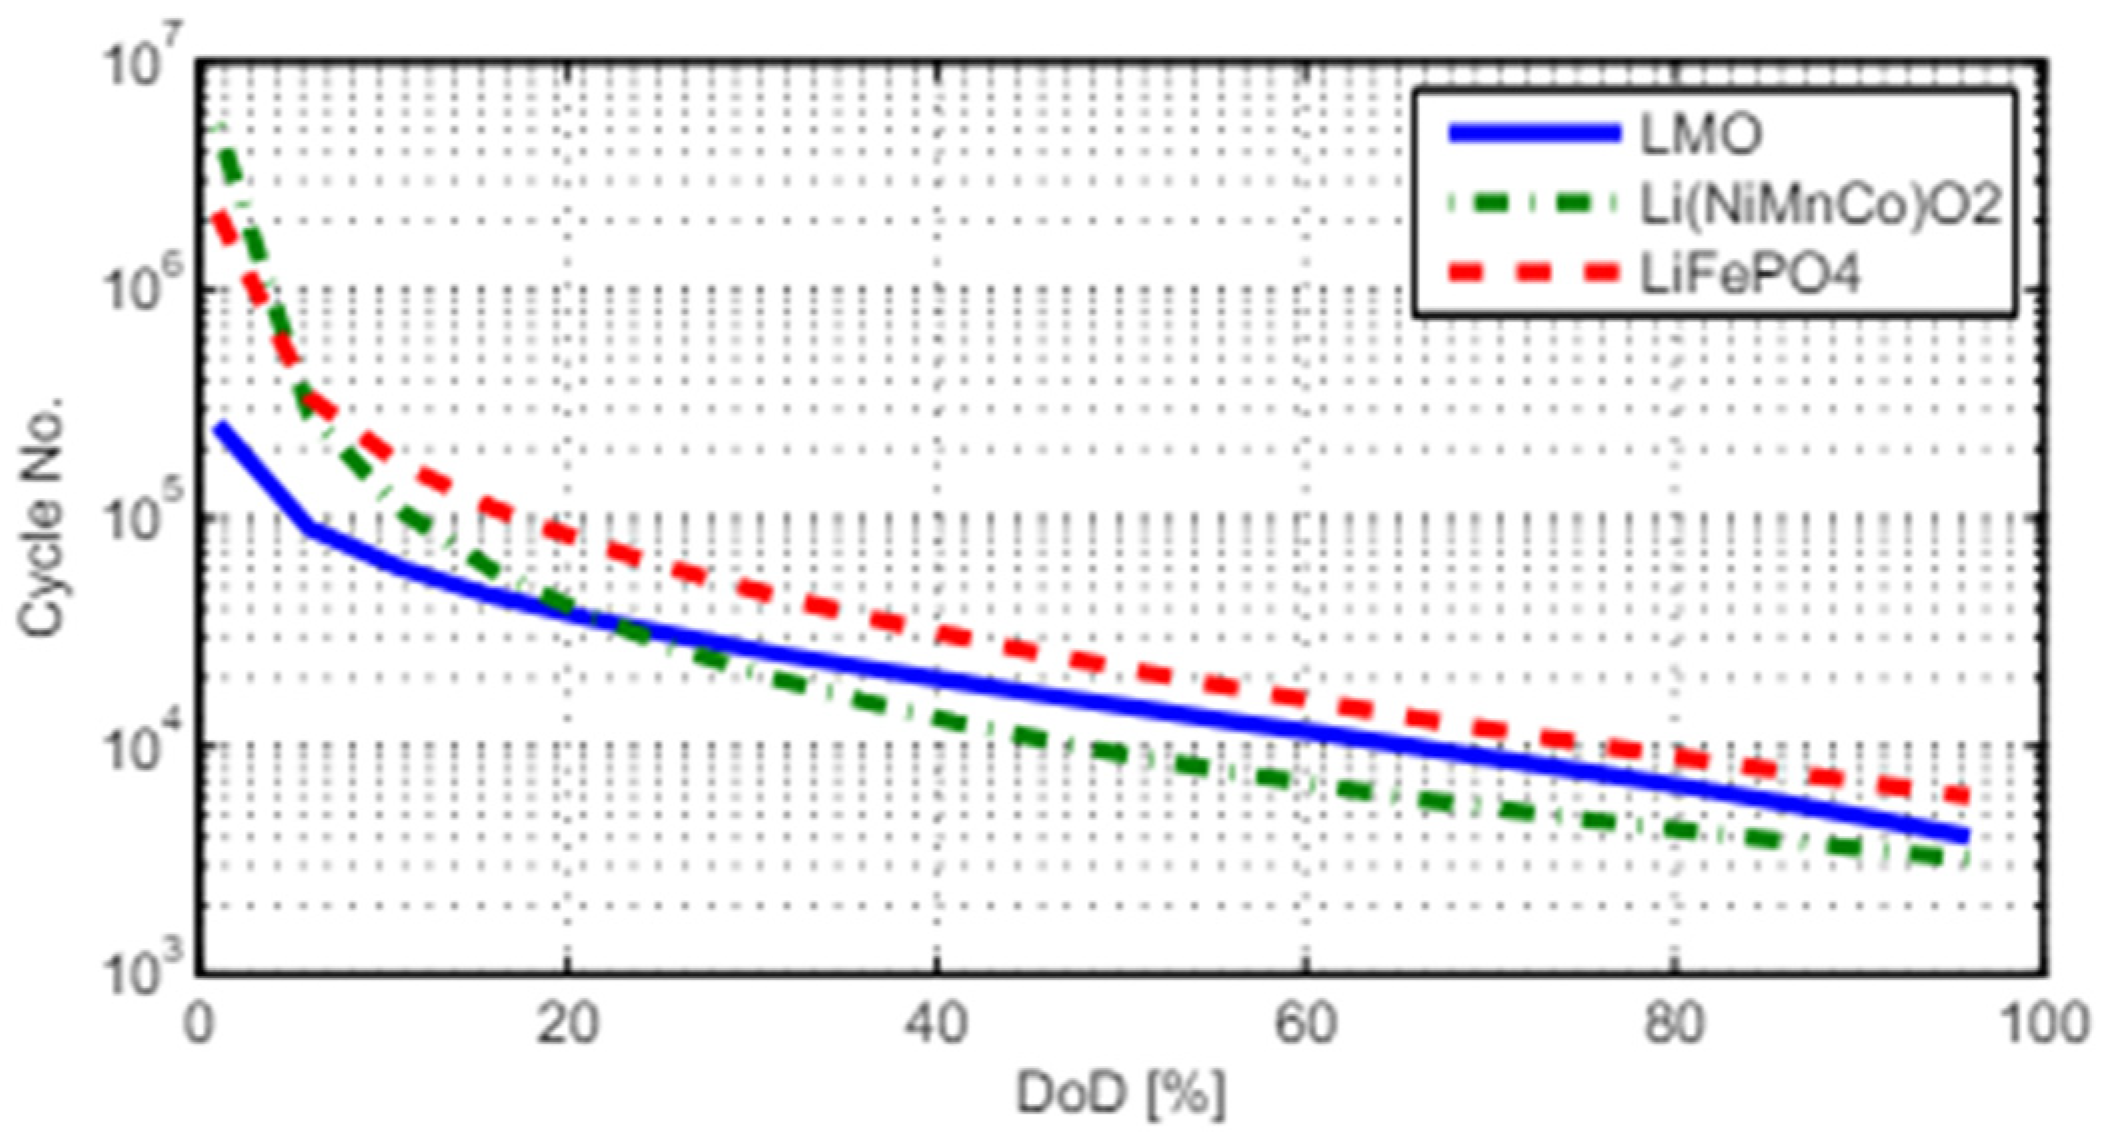
Figure 6 shows a comparison of cycle life for different types of lithium-ion batteries (LIBs), specifically LMO (Lithium Manganese Oxide), Li (NiMnCo)O2 (Lithium Nickel Manganese Cobalt Oxide), and LiFePO4 (Lithium Iron Phosphate). The x-axis represents the depth of discharge (DoD) in percentage, while the y-axis shows the number of cycles on a logarithmic scale. From the graph, it is evident that the cycle life of the batteries decreases as the DoD increases. LiFePO4 has the longest cycle life across various DoD levels, making it the preferred choice for applications requiring long-term durability and high reliability. Li(NiMnCo)O2 offers balanced performance but shows a shorter cycle life compared to LiFePO4, while LMO has the shortest cycle life among the three despite its advantages in cost and thermal stability. In our study, the selection of the battery model was influenced by these characteristics, focusing on a balance between longevity, safety, and performance to ensure the reliability and efficiency of the electrified agricultural machinery system.
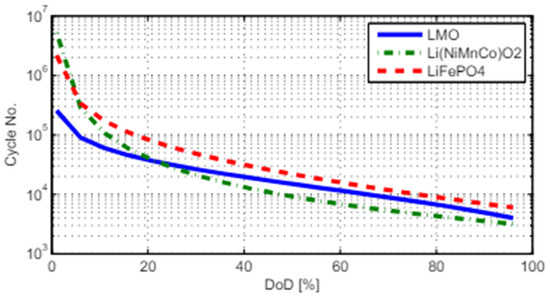
Figure 6.
Comparison of cycle life for different types of lithium-ion batteries [27].
Calculating the lithium battery requirements for a compressor involves several key steps. First, determine the compressor’s power consumption in kilowatts (kW) or watts (W). Next, ascertain the compressor’s operating duration per cycle [22]. The energy requirement in kilowatt-hours (kWh) can be calculated using the following formula:
Subsequently, calculate the required battery capacity, considering an efficiency factor (typically 90% or 0.9), using the following formula:
The battery used in electric machines are typically 12 V or 24 V, so the selection Ampere of battery capacity (Ah) can be determined using the following formula:
This method ensures a well-balanced and effective energy solution by accurately assessing and designing the battery system to meet the compressor’s power requirements.
2.3.1. Key Point of Battery
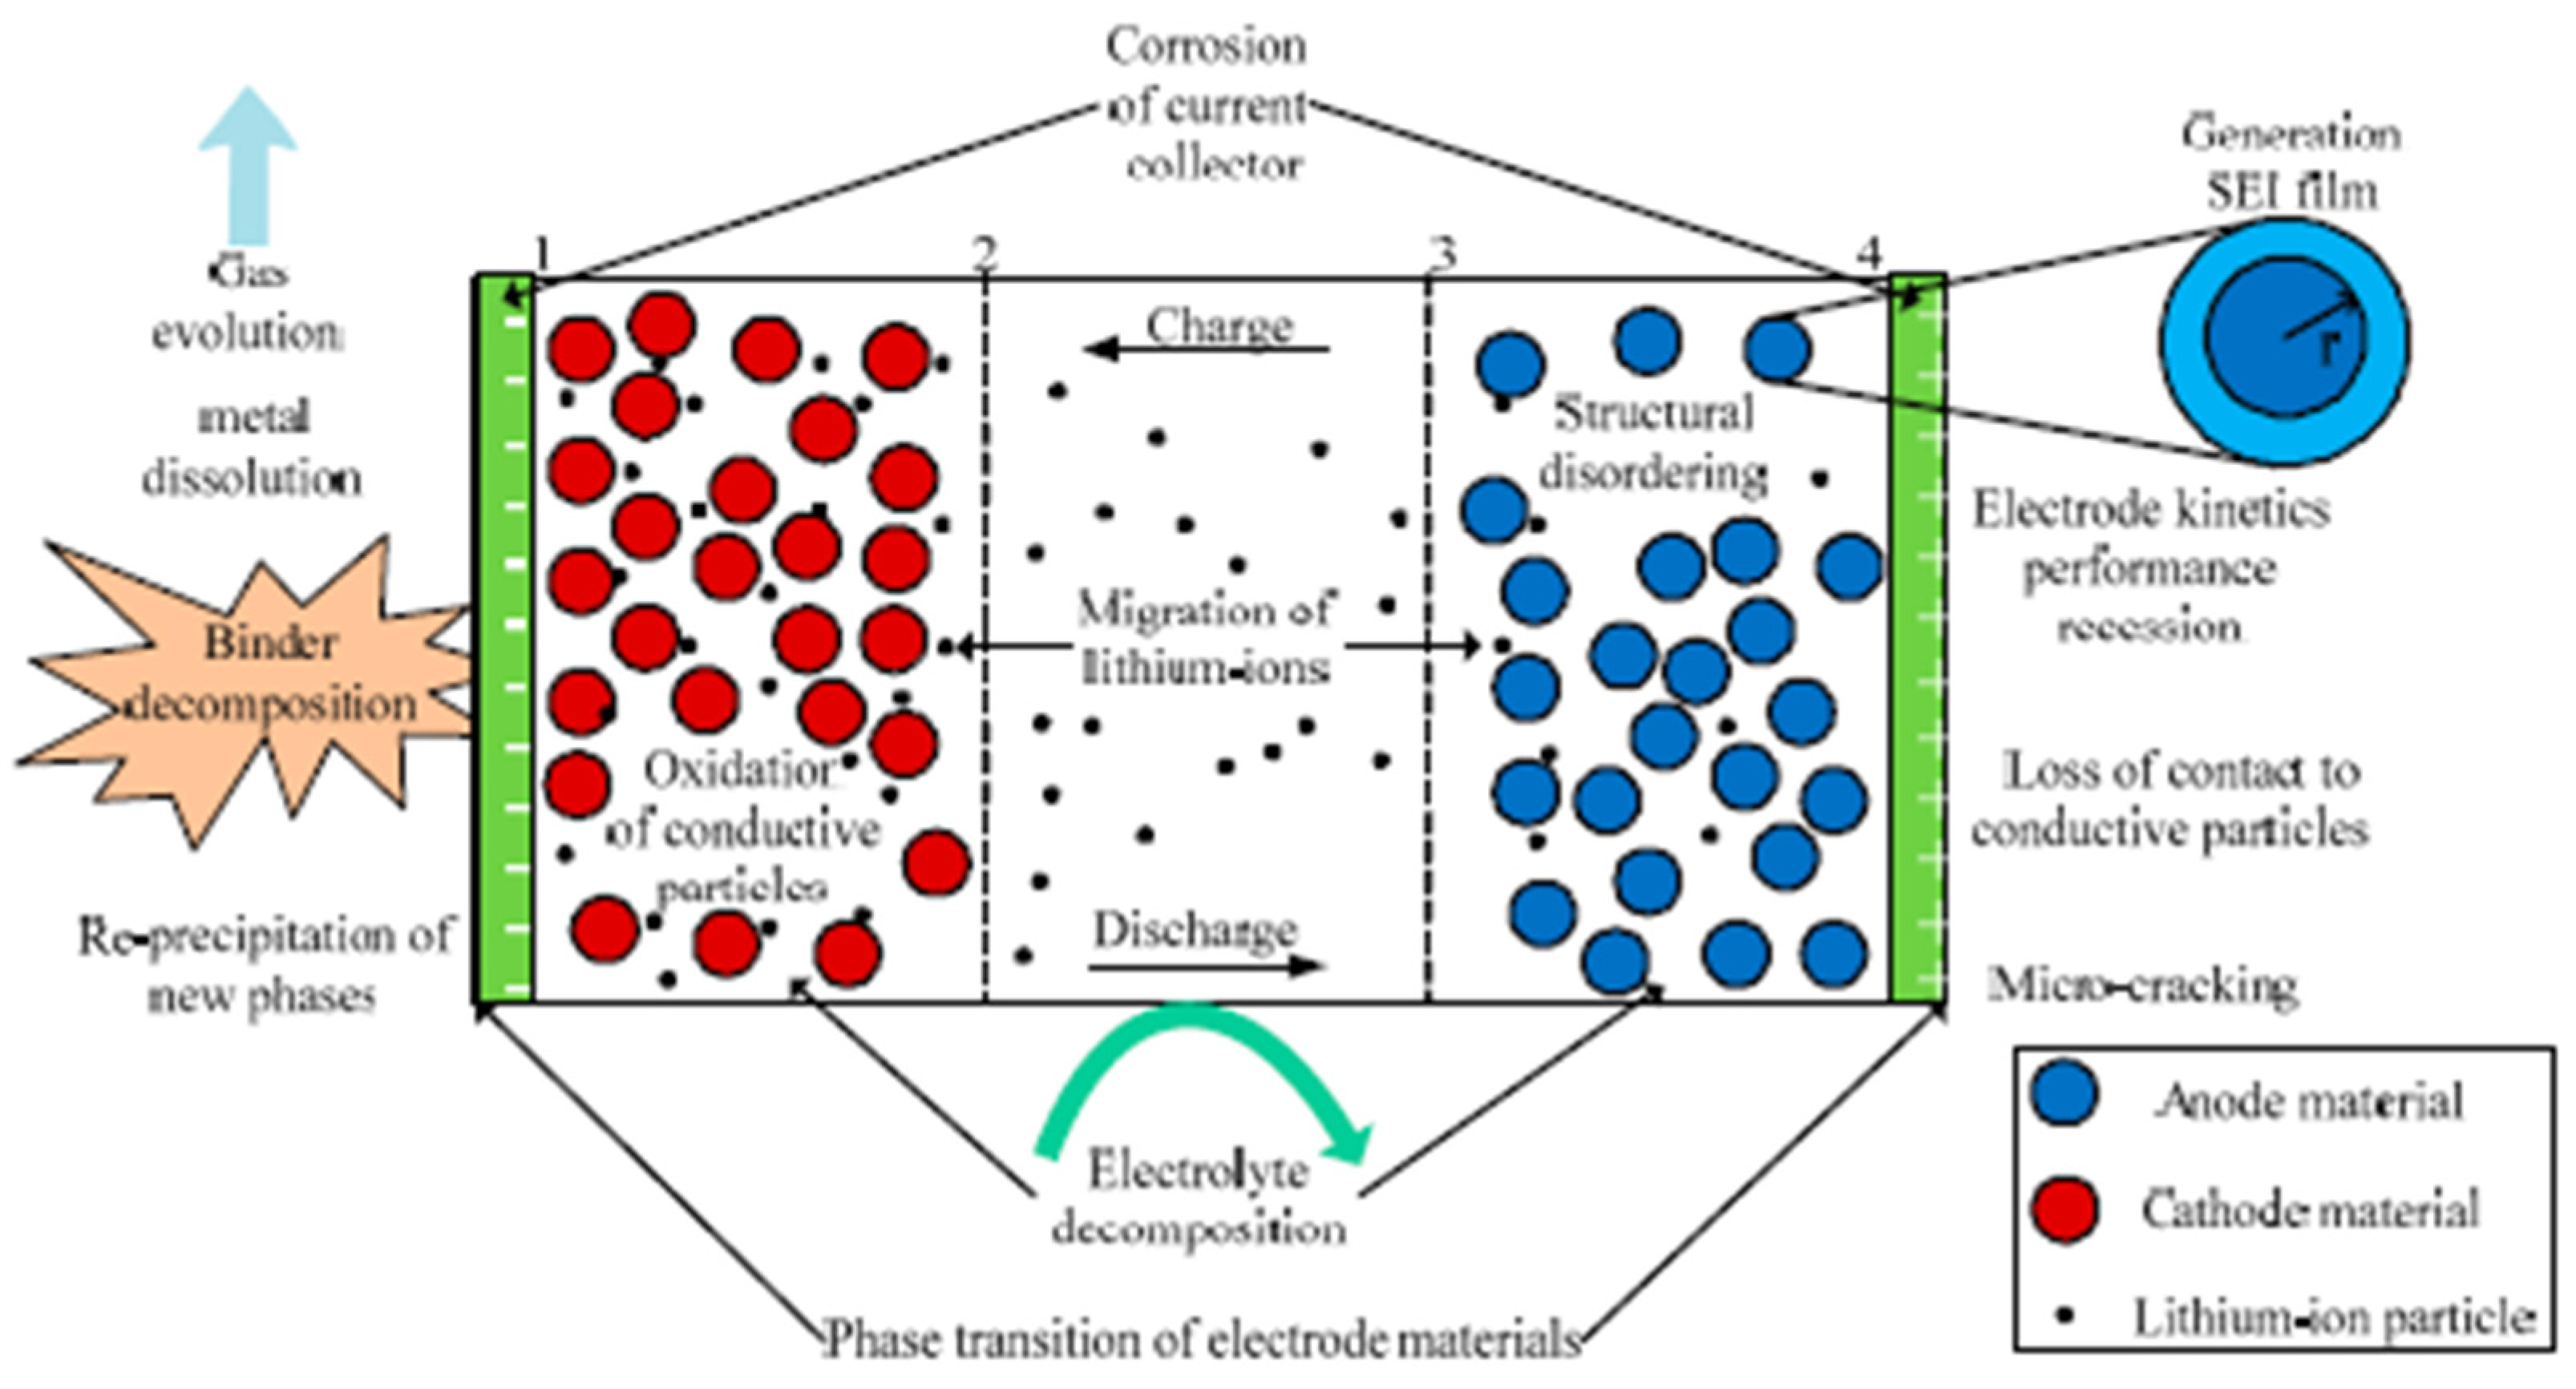
The charge and discharge rates, as well as the life and safety of the battery as shown in Figure 7, depend on the core/surface temperatures and internal resistance of the battery, which necessitates the precise measurement of these factors. These include the temperature of the battery’s surface, which indicates how it interacts with the environment, internal resistance, and battery core temperature, which describes the internal reaction rate from electrochemical processes. All of these are essential in minimizing thermal runaway and battery degradation. Reduced heat generation and improved performance are frequently associated with less internal resistance, which increases battery longevity and efficiency. The lifespan and safety of a battery are largely dependent on its appropriate heat dissipation mechanism and low levels of internal losses, especially in high-demand applications like portable technology and automotive equipment. Because of these reasons, accurate parameter characterization and control are essential to the battery’s optimal operation, long life, and—above all—the prevention of safety concerns.
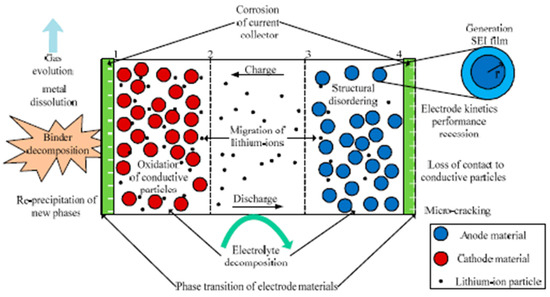
Figure 7.
Basic schematic of lithium-ion battery aging.
- Core and Surface Temperature
The equivalent circuit model (ECM)-based thermal estimation model has been used by many researchers to predict the total heat generation in a lithium-ion battery (LIB) cell. However, based on the complexity of its application, electrochemical modeling has proved to provide the most accurate forecast of the nonlinear characteristics of LIBs. As the nonlinearities are further captured by higher-order models in the form of ECMs, the costs of computationally intensive models, as well as modeling complexity, arise. Another advantage of ECM is that it can achieve a high degree of accuracy, and at the same time, complexity is reduced with the use of model order reduction techniques. Therefore, to predict total heat generation in this context, a first-order ECM (1-RC) is used. As shown in Figure 8, LIB has a 1-RC ECM that represents the electrode processes taking place in a battery. The basic strategy of any kind of ECM-based heat production procedure is, therefore, quantitatively summing up heat production from within power loss, which normally depends on internal resistances, as well as charging and discharging currents. Also, the amount of heat generated cannot be known directly as it depends on the SOC, the current passing through the cell, and its temperature since internal resistance is dependent on these values [28].
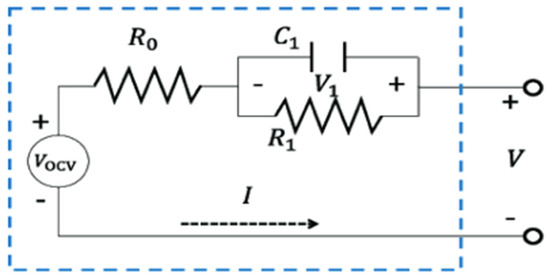
Figure 8.
Electrification system design flow chart [28].
This heat resistor-capacitor model is based on the use of the analogy between thermal and electrical systems, as described earlier in the Section 1. Hence, for the mathematical analysis of it, the heat transfer rate is equal to the electrical current (i), while the branch currents are represented by ia, ib in the respective branches. Thus, the governing equation of the model is deduced based on Kirchhoff’s Current Law (KCL) at node Tc. The current balance equation at node Tc reads
Now, by rewriting Equation (5) in terms of thermal parameters, Equation (6) can be found:
By rearranging Equation (7), we find
Lastly, the empirical value of Tc at any point in time may be calculated by integrating Equation (4) with respect to time for the total heater transfer period of time for which Ts and Tamb values are known. However, the simple way to determine Tamb involves using only one temperature sensor, whereas measuring Ts in a real high-power LIB pack with physical sensors becomes a really challenging task. Thus, an alternative approach to assuaging the Coulomb gauge failure is to employ a temperature estimation scheme to estimate the surface temperature.
- Battery Lifecycle
Battery lifecycle can be regarded as the period during which the battery is capable of being used up to the state when it is no longer capable of storing enough charge to be effective. This cycle begins with the manufacturing phase, where key commodity inputs like lithium, cobalt, nickel, and graphite are sourced and refined to produce battery parts, which include the anode, cathode, electrolyte, and separator. These components are then interconnected in a manner that forms what may be referred to as battery cells, and these cells are, in turn, grouped together to constitute battery packs.
After they have been produced, the battery goes through an initial usage phase, or what is called the formation cycle, in which the battery is cycled several times to open the pores of the electrodes. This process sets the engagement of the positive and negative electrodes and prepares the battery to function well. Some of the normal operations are the charging and discharging operations, also known as the formation of cycles of the battery. This results in sulfur deposition and activation loss, which gradually reduces the capacity of the battery over the course of cycles. Cycle life, the number of full cycles, is counted starting from 100% SoC or its full capacity.
BLDC motors are utilized in various applications due to their superior torque-to-speed ratio, high efficiency, rapid dynamic response, and reduced maintenance requirements. Figure 4 illustrates the control diagram of the input voltage controlling technique used to mitigate torque ripple in a BLDC motor. The unique characteristics include a trapezoidal back electromotive force (EMF) and a quasi-square-wave supplied phase current. Torque ripples occur when there is a discrepancy between the projected back electromotive force (EMF) and the phase current fed by a quasi-square wave. During this phase, our objective is to examine a method for managing fluctuations in torque by regulating the input voltage. Multiple researchers have examined this method of regulating the input voltage. The methods of controlling the input voltage can be classified into two categories: pulse width modulation (PWM) schemes and altering the dc-link voltage. Torque ripples typically arise from the commutation of power switches. The control of this commutation can be achieved through the use of the pulse width modulation (PWM) technique. This text extensively discusses a modern approach to minimize fluctuations in torque, both during conduction and commutation, by employing a closed-loop operation using a pulse width modulation (PWM) scheme with a buck converter. The PWM schemes can be divided into two steps: firstly, managing the commutation through PWM schemes, and secondly, utilizing a buck converter to convert vin to vout.
The performance and degradation of a battery can be described using various equations. One common model is based on Peukert’s Law, which shows how the available capacity of a battery decreases with an increasing discharge rate:
where C is the actual battery capacity at a given discharge current I, Cn_ is the nominal battery capacity at the nominal discharge current In, and k is the Peukert exponent, which varies between battery types. Additionally, the cycle life of a battery can be modeled using the following empirical formula:
where L is the cycle life (number of cycles), C0 is the initial capacity of the battery, and Crate is the capacity loss rate per cycle. Among the factors affecting the average battery lifecycle are environmental temperature, DoD, C/DoD, charging methods that include C/DoD, and battery management systems (BMSs). High temperature is relative to speeding up the chemical reactions, which consequently results in tiring; on the other side, low temperature is capable of reducing the performance. Larger depths of discharge are not very helpful to cycle life, and rapid charging and discharging can put mechanical strain and heat on a battery, which is bad for life. Some of the measures to improve battery longevity include not charging the battery beyond full charge or running it down to a completely dead state, while a battery management system can monitor the battery against harsh conditions as well as organize the charging and discharging processes. Effective strategies that are used to manage these items can be extremely useful in increasing the useful life of batteries while in use, thereby making them cheaper to use in many life applications.
2.3.2. How to Choose Batteries
The design of the lithium-ion battery size begins with calculating the total energy demand by considering the power consumption of all components, such as the motor, control systems, and sensors. This involves using the following empirical formula:
where Etotal is the total energy requirement, and Pmotor, Pcontrol, Pmotor, Pcontrol, and Psensors are the power consumption values for each component over the total operation time. The next step is to determine the required battery capacity using the following formula:
where Cbattery represents the battery capacity, and Vbattery is the voltage of the battery. To ensure reliability, a safety margin is included, adjusting the capacity with
where the safety factor typically ranges from 1.2 to 1.5. The final step involves determining the configuration of the battery cells to meet the voltage and capacity requirements, using the following formula:
where Nseries is the number of cells in series, Nparallel is the number of cells in parallel, Vsystem is the system voltage, Vcell is the voltage of each cell, and Ccell is the capacity of each cell.
Defining the lifespan of the lithium-ion battery involves understanding its cycle life, which is the number of full charge and discharge cycles it can undergo. These data are usually provided by the manufacturer. The depth of discharge (DoD) significantly impacts the lifespan; higher DoD reduces the battery’s life. The typical lifespan can be calculated using
where Lbattery is the actual lifespan, Lrated is the rated lifespan, and f(DoD) represents the relationship between DoD and lifespan. Environmental factors such as temperature and usage patterns also affect the lifespan, with high temperatures and frequent high-current discharge/charge cycles reducing the lifespan.
Comparing lithium-ion (Li-ion) batteries with nickel-metal hydride (NiMH) batteries reveals several advantages of Li-ion batteries. Li-ion batteries have a higher energy density, making them more suitable for weight-sensitive applications. They also boast a longer cycle life, typically between 500–1000 cycles, compared to NiMH batteries, which have a cycle life of 300–500 cycles. Li-ion batteries have a lower self-discharge rate of about 2–3% per month, whereas NiMH batteries can self-discharge at a rate of 20–30% per month. Additionally, Li-ion batteries require less maintenance and do not suffer from the memory effect that affects NiMH batteries, which need periodic full discharges to maintain capacity. Although Li-ion batteries have a higher initial cost, their longer lifespan and lower maintenance needs often result in lower long-term costs.
A comparison between brushless DC (BLDC) motors and induction motors shows that BLDC motors offer several advantages. BLDC motors are more efficient due to reduced electrical losses and provide higher efficiency, particularly at part-load conditions. They require sophisticated control algorithms for electronic commutation, which allows for precise control and high starting torque, leading to smoother operation. In contrast, induction motors have simpler control mechanisms but offer lower starting torque and can experience slip. Maintenance is another critical factor, with BLDC motors requiring less maintenance due to the absence of brushes, while induction motors need more frequent maintenance because of mechanical wear and tear. Although BLDC motors have a higher initial cost due to their complex electronics, their high efficiency, precise control, high torque characteristics, and low maintenance requirements make them a better choice for applications demanding high performance and reliability.
The choice of lithium-ion batteries and BLDC motors is justified based on their superior characteristics compared to alternatives. Lithium-ion batteries are chosen for their high energy density, long cycle life, low self-discharge rate, and minimal maintenance, making them ideal for applications requiring lightweight, high-capacity power sources. BLDC motors are selected for their high efficiency, precise control, high torque characteristics, and low maintenance needs, which are essential for applications that demand high performance and reliability. This comprehensive analysis supports the decisions made for the battery and motor selection, providing a solid foundation for the project’s design and implementation.
2.3.3. How to Extend Battery Life
Lithium iron phosphate (LiFePO4) batteries are widely recognized for their stability, safety, and long cycle life, making them suitable for various applications, including electric vehicles and renewable energy storage. However, like all batteries, they undergo degradation over time. LiFePO4 batteries typically experience a gradual reduction in capacity over their lifespan, retaining about 80% of their initial capacity after approximately 2000–3000 charge/discharge cycles, depending on usage conditions. The cycle life of a LiFePO4 battery is influenced by factors such as depth of discharge (DoD), charge/discharge rates, and operating temperatures, with studies showing that at a moderate DoD (e.g., 80%), these batteries can achieve up to 3000–5000 cycles. Even when not in use, LiFePO4 batteries degrade over time, with a calendar life of up to 10–15 years under optimal storage conditions, such as maintaining a state of charge (SoC) between 40–60% and storing at temperatures between 15–25 °C.
To extend the life of LiFePO4 batteries, several strategies can be implemented. Optimized charging protocols that avoid high voltage charging and deep discharging can significantly prolong battery life, such as limiting the charge to 90% and the discharge to 20% of the battery’s capacity to reduce stress. Temperature management is crucial, as LiFePO4 batteries perform best within a temperature range of 15–35 °C. Using thermal management systems to maintain this temperature range during operation can minimize degradation. Regular balancing of the battery cells ensures uniform charging and discharging, preventing individual cells from being overcharged or deep discharged. Battery management systems (BMSs) play a critical role in maintaining balance and health monitoring. Avoiding high charge and discharge rates (C-rates) is also important, as high C-rates can accelerate degradation. Adopting moderate C-rates (e.g., 0.5 C to 1 C) during normal operation can help preserve the battery’s capacity over time. Maintaining an optimal SoC range (typically between 20–80%) during storage and operation can help reduce stress on the battery. Automated systems can adjust charging cycles based on usage patterns to maintain this range.
Incorporating these lifecycle management strategies can significantly enhance the longevity and performance of LiFePO4 batteries, ensuring their reliability and efficiency over extended periods. Further research and development in battery management systems and optimized usage protocols will continue to improve the lifecycle of these batteries.
2.4. Pulley Ratio
To vary the speed and torque characteristics of the driven machinery, the pulley ratio in a belt-driven system must be changed. The diameters of the driven (load) pulley and the driver (motor) pulley define this ratio. The following formula is used to determine the pulley ratio (R):
where is the diameter of the driven pulley, and is the diameter of the driver pulley. The rotational speed of the driven pulley is inversely proportional to this ratio, meaning a higher pulley ratio results in a slower driven pulley speed, while a lower ratio increases the speed. The speed relationship can be expressed as
Conversely, torque is directly proportional to the pulley ratio. A higher ratio increases the torque on the driven pulley, while a lower ratio decreases it. The torque relationship is given by
In real-world scenarios, raising the pulley ratio is frequently utilized to increase torque at the price of speed. This works well for jobs needing a lot of power, including operating heavy machines or conveyors. Conversely, lowering the pulley ratio improves speed while decreasing torque, which is advantageous for fast-operating devices like fans or pumps. Pulley ratios are frequently altered in two situations: first, when updating machinery and needing to match the new motor’s specifications with the load demands; second, when optimizing for energy economy by making sure the motor runs within its ideal speed range. Furthermore, to ensure constant performance, wear and tear can change pulley size and impact the ratio; therefore, routine maintenance checks are essential. Therefore, altering the pulley ratio is a simple yet effective method of improving the performance of systems that run on belts. To attain the intended results for speed and torque, pulleys must be carefully chosen, installed, and tense.
- Example CalculationCase 1: 88 mm Driver Pulley, 267 mm Driven Pulley
- 1.
- Pulley Ratio
- 2.
- Driven Pulley Speed
- 3.
- Driven Pulley Torque
- Case 2: 152 mm Driver Pulley, 267 mm Driven Pulley
- 1.
- Pulley Ratio
- 2.
- Driven Pulley Speed
- 3.
- Driven Pulley Torque
By comparing these cases, it is evident that the 152 mm driver pulley with a 267 mm driven pulley (Case 2) offers a higher driven pulley speed of approximately 968 RPM, which is more suitable for fast-operating devices like fans or pumps. Although the torque is lower at 87.85 Nm, this setup provides a balanced performance with a better speed-torque ratio for applications that prioritize speed over torque.
In summary, Case 2 (152 mm Driver Pulley, 267 mm Driven Pulley) provides better performance in terms of speed while still maintaining a reasonable torque, making it more suitable for applications that require efficient and reliable control with a focus on higher speeds.
2.5. Environmental Benefits of Electrified Agricultural Machinery
In addition to the fact that lithium-ion batteries (LIBs) do not emit harmful gases, electrifying agricultural machinery provides significant environmental benefits throughout its lifecycle. Traditional internal combustion engine (ICE) machinery emits large amounts of carbon dioxide (CO2) and other greenhouse gases (GHGs). By transitioning to electrified machinery, these emissions can be dramatically reduced, as electric motors produce zero direct emissions. Over the machinery’s operational lifetime, this can lead to a significant decrease in the total carbon footprint. Moreover, if the electricity used to charge these batteries comes from renewable sources, the overall environmental impact is further minimized. Electrified machinery also reduces dependency on fossil fuels, eliminating the need for gasoline or diesel, which contributes to environmental degradation and pollution.
A comprehensive lifecycle analysis (LCA) of electrified agricultural machinery reveals additional benefits, such as energy efficiency and reduced maintenance requirements. Electric motors are more energy-efficient than ICEs, converting a higher percentage of energy into mechanical power. This results in less energy waste and lower operational costs. Furthermore, electrified systems generally require less maintenance, leading to lower environmental impacts associated with manufacturing and disposing of spare parts. Recycling programs for LIBs are improving, allowing for the recovery and reuse of valuable materials, which minimizes the environmental impact of battery disposal. Additionally, electric motors operate more quietly than ICEs, reducing noise pollution and improving air quality by eliminating exhaust emissions, which benefits both human health and the environment.
2.6. Step to Change Primemover
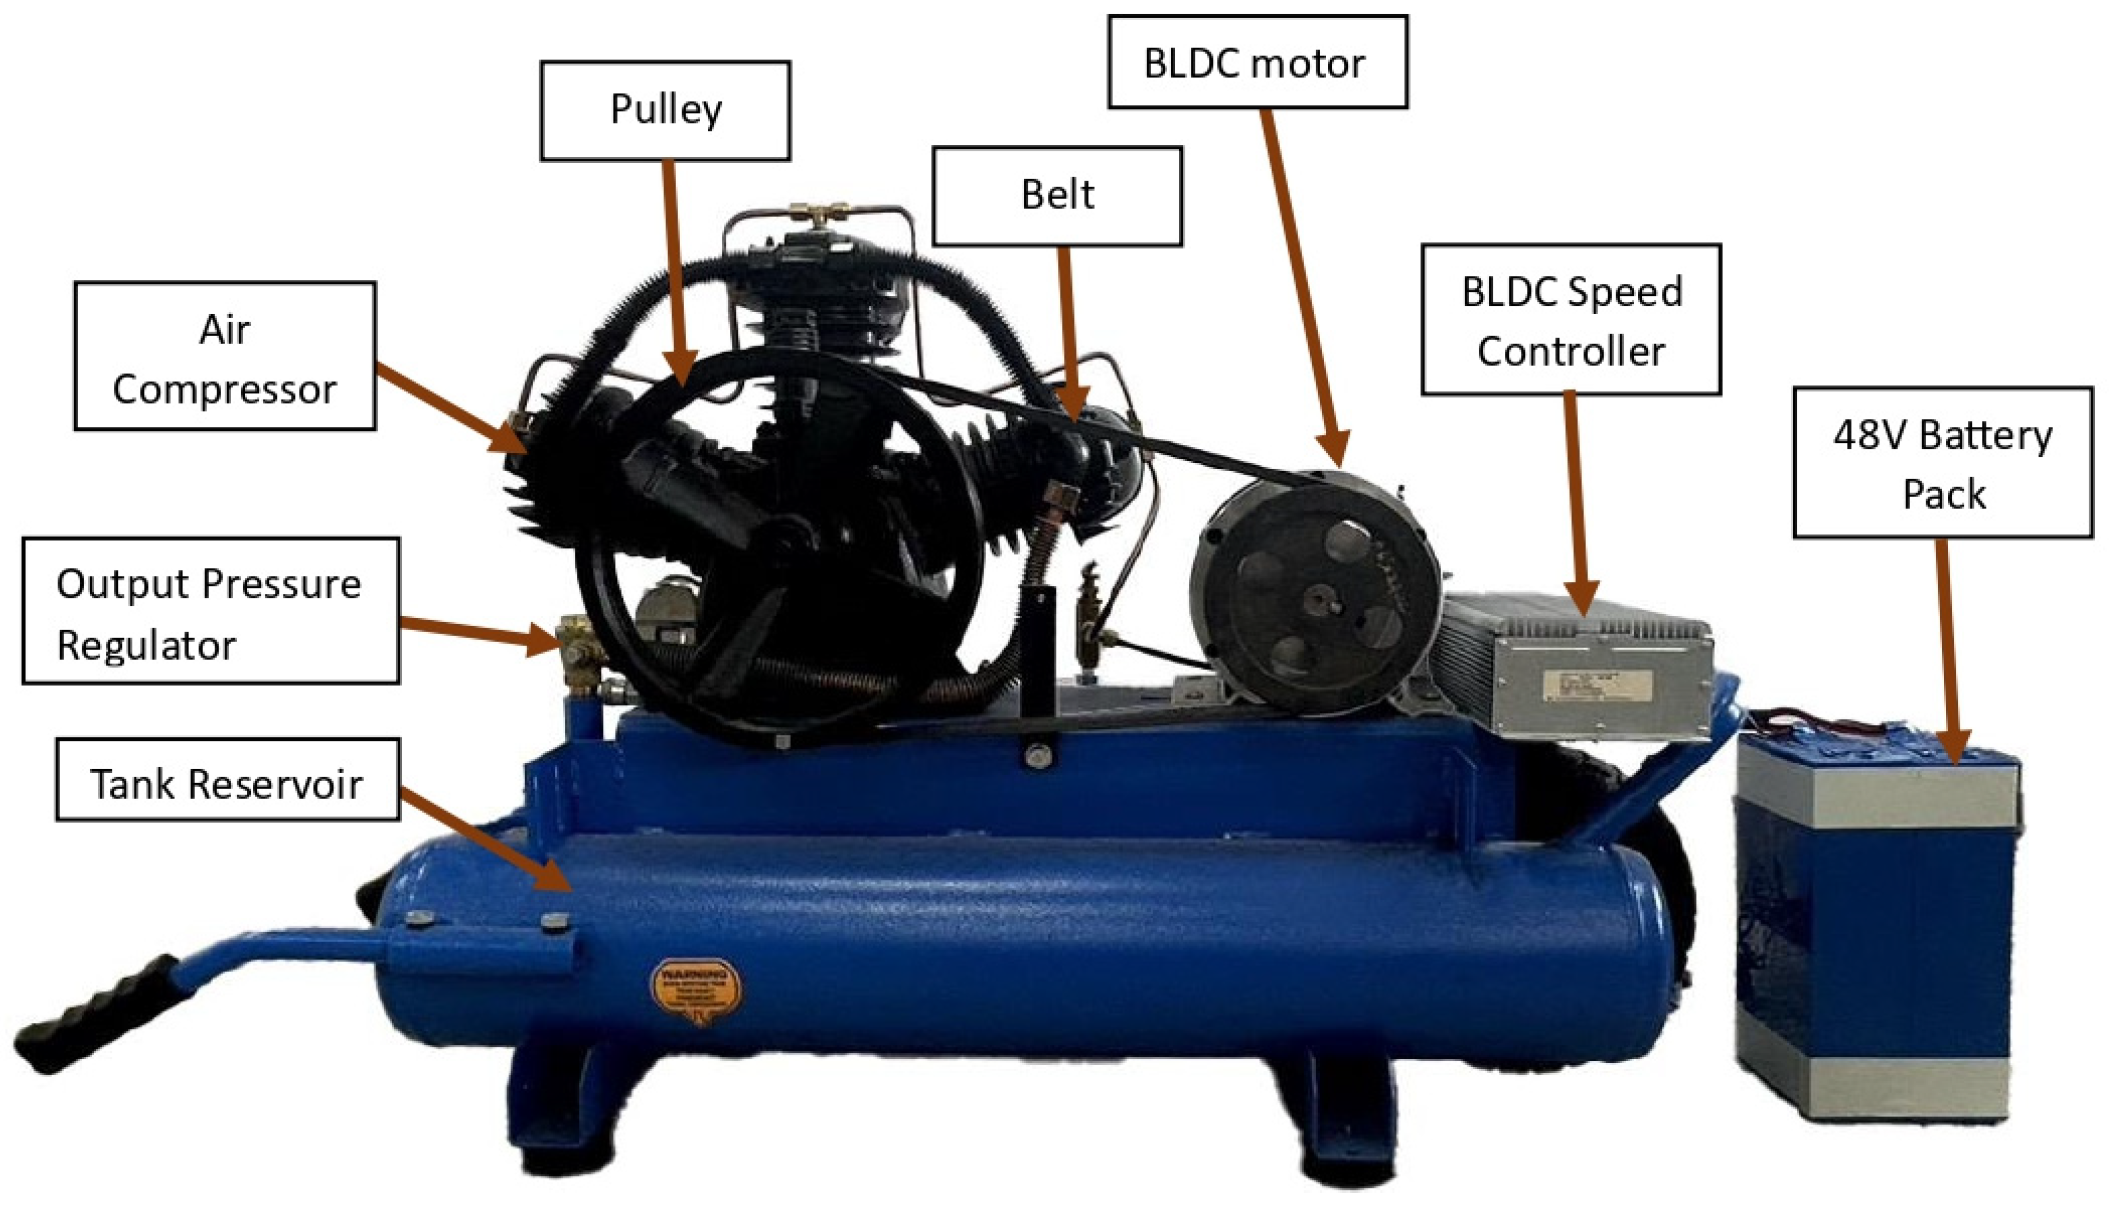
The primary materials used in this experiment are based on a PUMA diesel air compressor as listed in Table 1, along with a 4 KW permanent magnet brushless motor, a 48 V/20 Ah lithium iron battery, and embedded devices. The initial phase of the experiment aims to perform system integration and complete bench testing to achieve the design for electrification as shown Figure 9. The electrification design is divided into four main parts: motor selection and battery testing, Arduino, air pressure sensing components, and their integration for system evaluation.

Table 1.
Specification of Air Compressor Internal Combustion Engine.
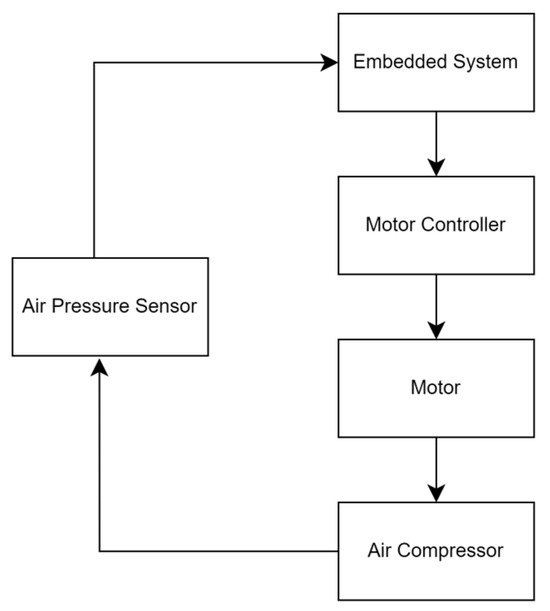
Figure 9.
Electrification system design flow chart.
Switching from an internal combustion engine (ICE) to a brushless DC motor (BLDC) for an air compressor offers several significant advantages. Firstly, BLDC motors provide higher efficiency and lower maintenance costs as they do not require fuel and related engine maintenance tasks, such as oil changes and spark plug replacements as listed in Table 2. Additionally, BLDC motors typically have higher energy efficiency for the same power output; for example, in the given specifications, the BLDC motor provides 4000 W of power compared to the ICE’s maximum power of 3.2 kW. Moreover, BLDC motors operate more quietly and smoothly, with the ability to precisely control speed and torque, making them suitable for various working conditions. In today’s context of increasing environmental regulations, BLDC motors also reduce emissions and noise pollution, aligning with sustainable development goals. Furthermore, the cost comparison reveals that running a BLDC motor is significantly cheaper than an ICE. The BLDC motor costs TWD 12.44 per hour to operate, given the electricity price of TWD 3.11 per kilowatt-hour, whereas the ICE costs TWD 42.56 per hour, based on a gasoline price of TWD 30.4 per liter. This translates to a cost of TWD 3.42 per kilowatt-hour for the ICE. Therefore, the BLDC motor not only offers operational and environmental benefits but also results in substantial cost savings.
Table 2.
Specification of Air Compressor BLDC.
Regarding the choice of battery, lithium iron phosphate batteries are selected due to their higher energy density, which is crucial for the demands of electrified air compressors. High energy density batteries can provide longer operation times and enhance overall performance. Additionally, lithium iron phosphate batteries have a longer lifespan, offering more durable usage and longer battery life, and they charge quickly, capable of recharging fully in a short period. Unlike fuel-driven air compressors, they do not produce harmful gas emissions, meeting environmental standards. An objective assessment of the electrification design aims to achieve higher efficiency.
To enhance the performance of the air compressor and achieve more energy-efficient operation, this experiment employs Arduino for hardware control. The advantage of using Arduino is that users can select and purchase various modules and sensors according to their needs to meet specific application requirements. This means that in the electrification design of the air compressor, it is easy to integrate various electronic components and devices, such as temperature sensors and pressure switches. Compared to other professional hardware and software solutions, the Arduino platform is relatively inexpensive, making it an ideal choice under project budget constraints. Using Arduino to implement the electrification design of the air compressor can save costs and enhance the overall feasibility of the project, contributing to a more efficient, precise, and reliable electrified air compressor system. In this experiment, the Arduino design is divided into two stages: motor operation control in the first stage and sensor value strategy analysis in the second stage. In the first stage, we initially used a Hall sensor throttle grip to replace the control of the electric motor. After ensuring normal operation and understanding the operating principles of the grip, we plan to switch to Arduino to provide the relevant control signals. The second stage involves combining sensor data to determine whether the motor should operate and whether additional pressure needs to be activated.
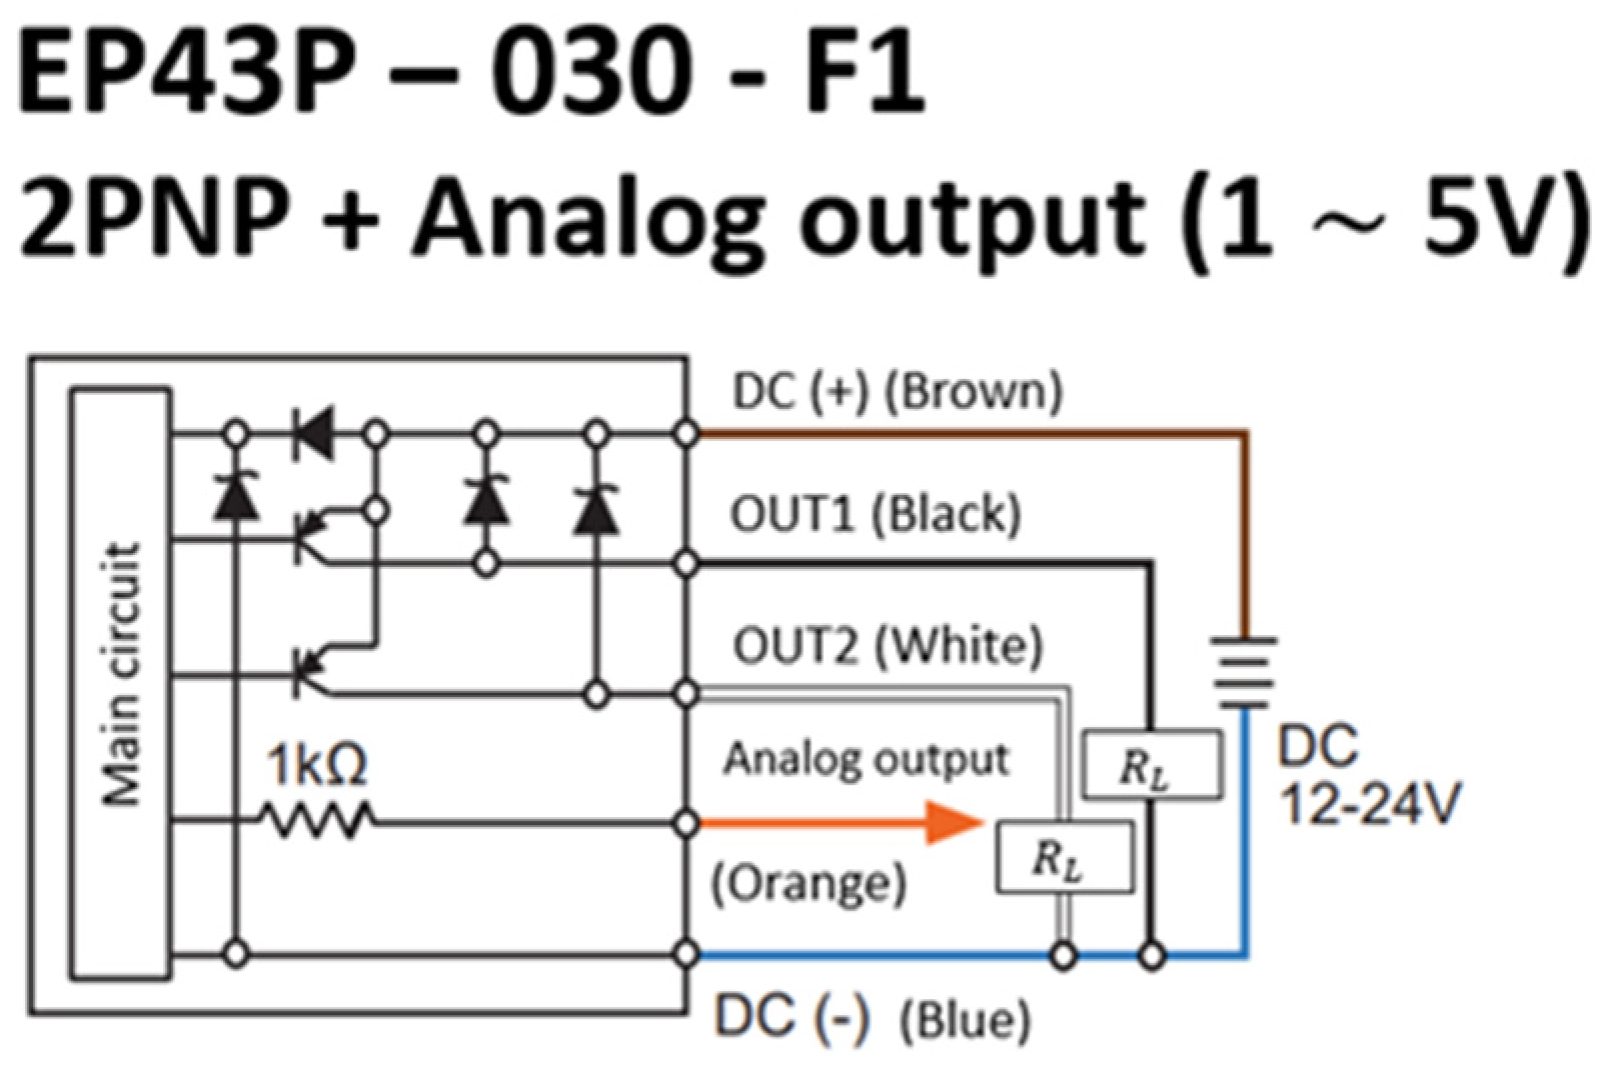
Stage One—Arduino Control Setup Stage: To ensure that subsequent debugging can focus on Arduino hardware and software design, we first use a Hall sensor throttle grip to test the air compressor system before conducting any Arduino tests. The three-wire Hall sensor throttle grip outputs used were positive, negative, and a 0 to 5 V signal as shown in Figure 10. We decided to start with this output signal, changing the original signal provided by the Hall sensor to an input pulse width modulation (PWM) signal provided by Arduino, which is crucial for controlling the operation. Before proceeding to Stage Two, based on Arduino’s analog input specifications and system voltage tolerance, we select which type of pressure sensor would be suitable for this study. The pressure sensor model chosen is EP43P-030-F1, which supports an analog signal output (1–5 V) compatible with Arduino’s analog input (0–5 V). Its pressure tolerance of up to 11 bar makes it suitable for our tests with a maximum pressure of up to 10 bar.
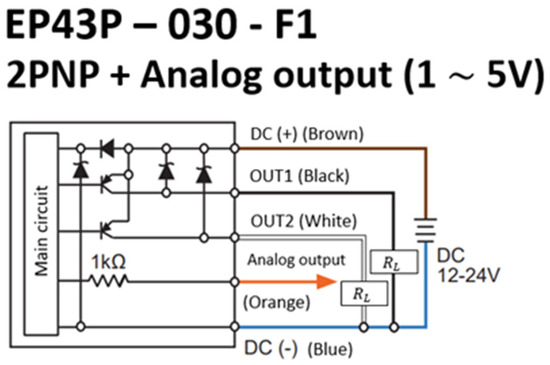
Figure 10.
Output circuit wiring diagram.
Stage Two—Arduino Control, Sensor Integration, and Strategy Assessment: Having previously established an Arduino-controlled test platform for the air compressor, the focus of this stage is on sensor integration, data conversion, and strategy formulation. After several tests, the following formula (with air pressure measured in psi) has been derived:
Having obtained this conversion formula, we can now use the required air pressure to calculate the judgment voltage values, followed by programming the judgment strategy. The experiment involves two rounds of determination: the first determination checks whether the pressure has reached 8 bar. If it has not, the pressurization process begins; if it has, the operation stops. The second determination checks whether the pressure has fallen below 5 bar, appropriately compensating for any pressure drop that occurs during use. If the pressure is below this threshold, the pressurization process begins; if it is not, the operation stops, ensuring that the machine always maintains sufficient pressure for use.
The Arduino program controls the motor’s start and stop by reading the voltage value from the EP43P-030-F1 sensor. After initializing the LCD display and digital pins, the program reads the sensor voltage and converts it to the actual voltage value. If the voltage exceeds 3.99 V, the program stops the motor and displays “stop”; otherwise, it runs the motor and displays “run”. Pin 2 is set to high and pin 3 to low to provide a voltage differential, simulating a Hall throttle signal to drive a permanent magnet brushless motor. In the main loop, the program reads the sensor voltage and converts it to the actual voltage value. If the voltage exceeds 3.99 V, the program stops the motor and displays “stop”; otherwise, it runs the motor and displays “run”. After each operation, the program waits for 1 s to ensure system stability. This design ensures the system’s timeliness, accuracy, and stability, making it suitable for applications requiring efficient and reliable control.
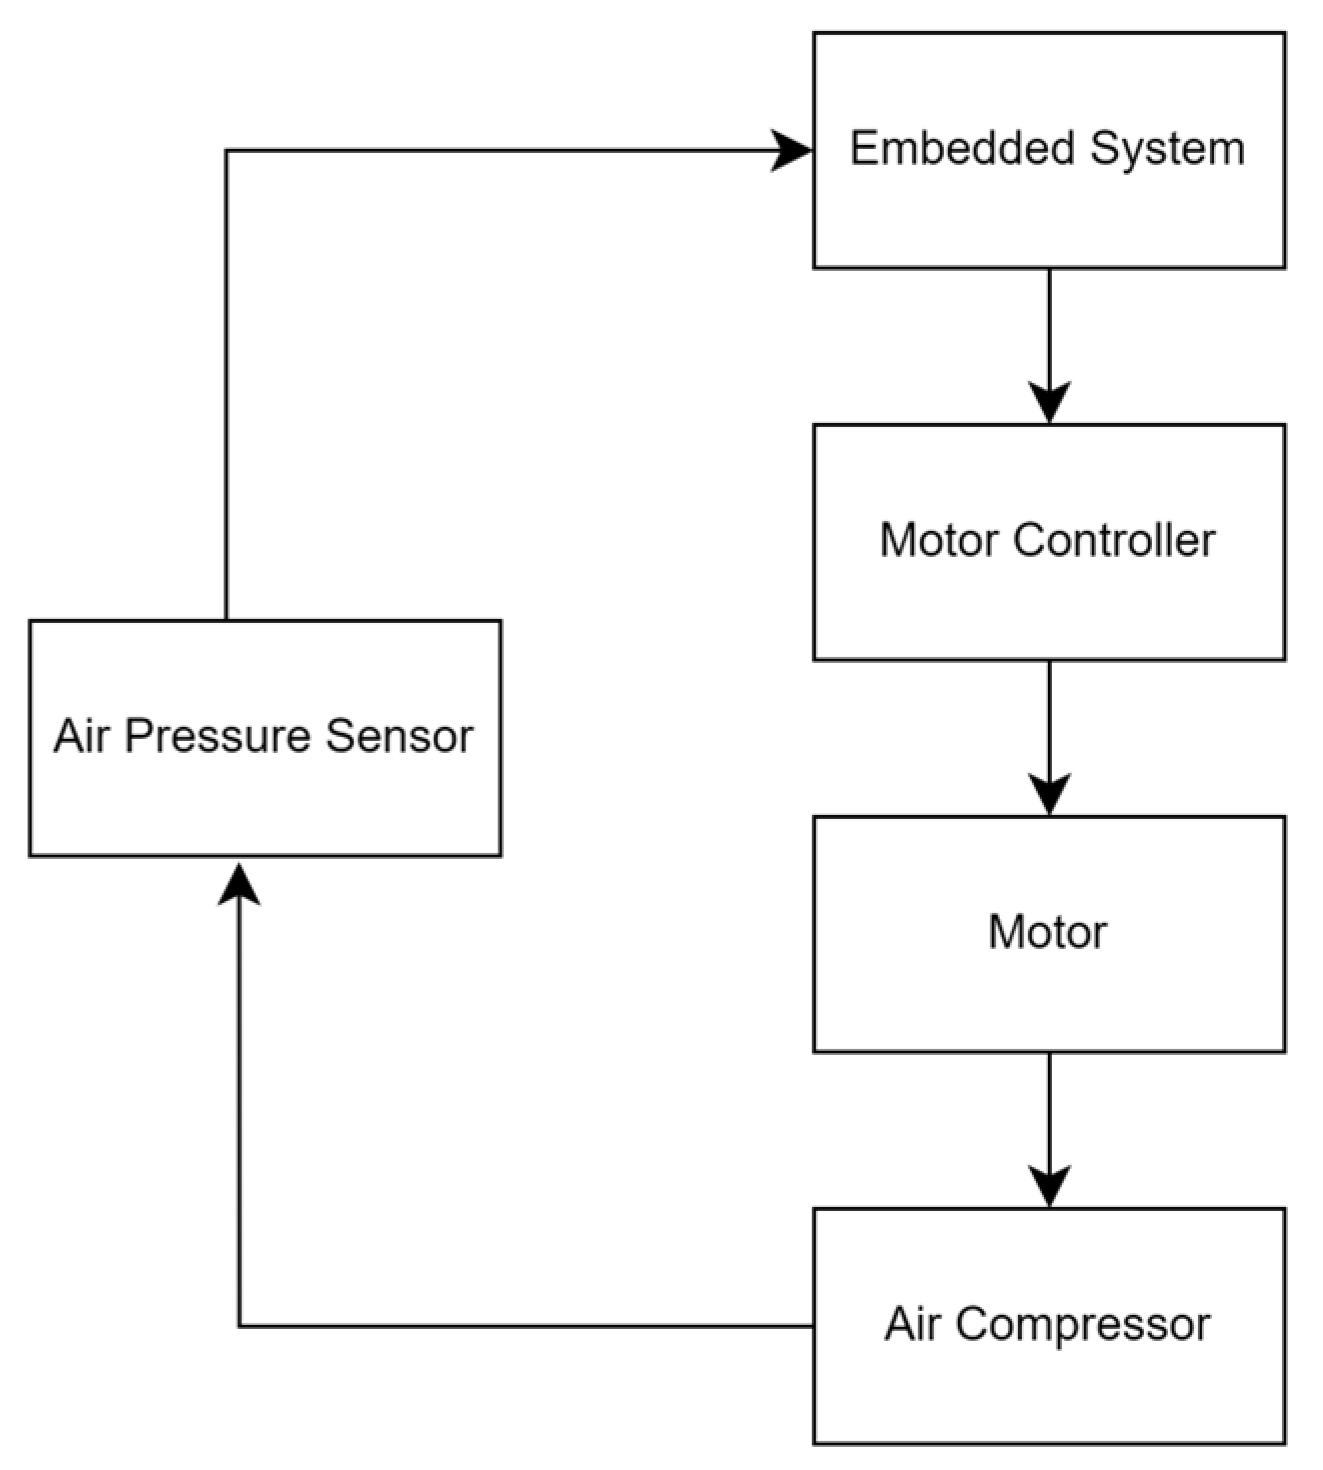
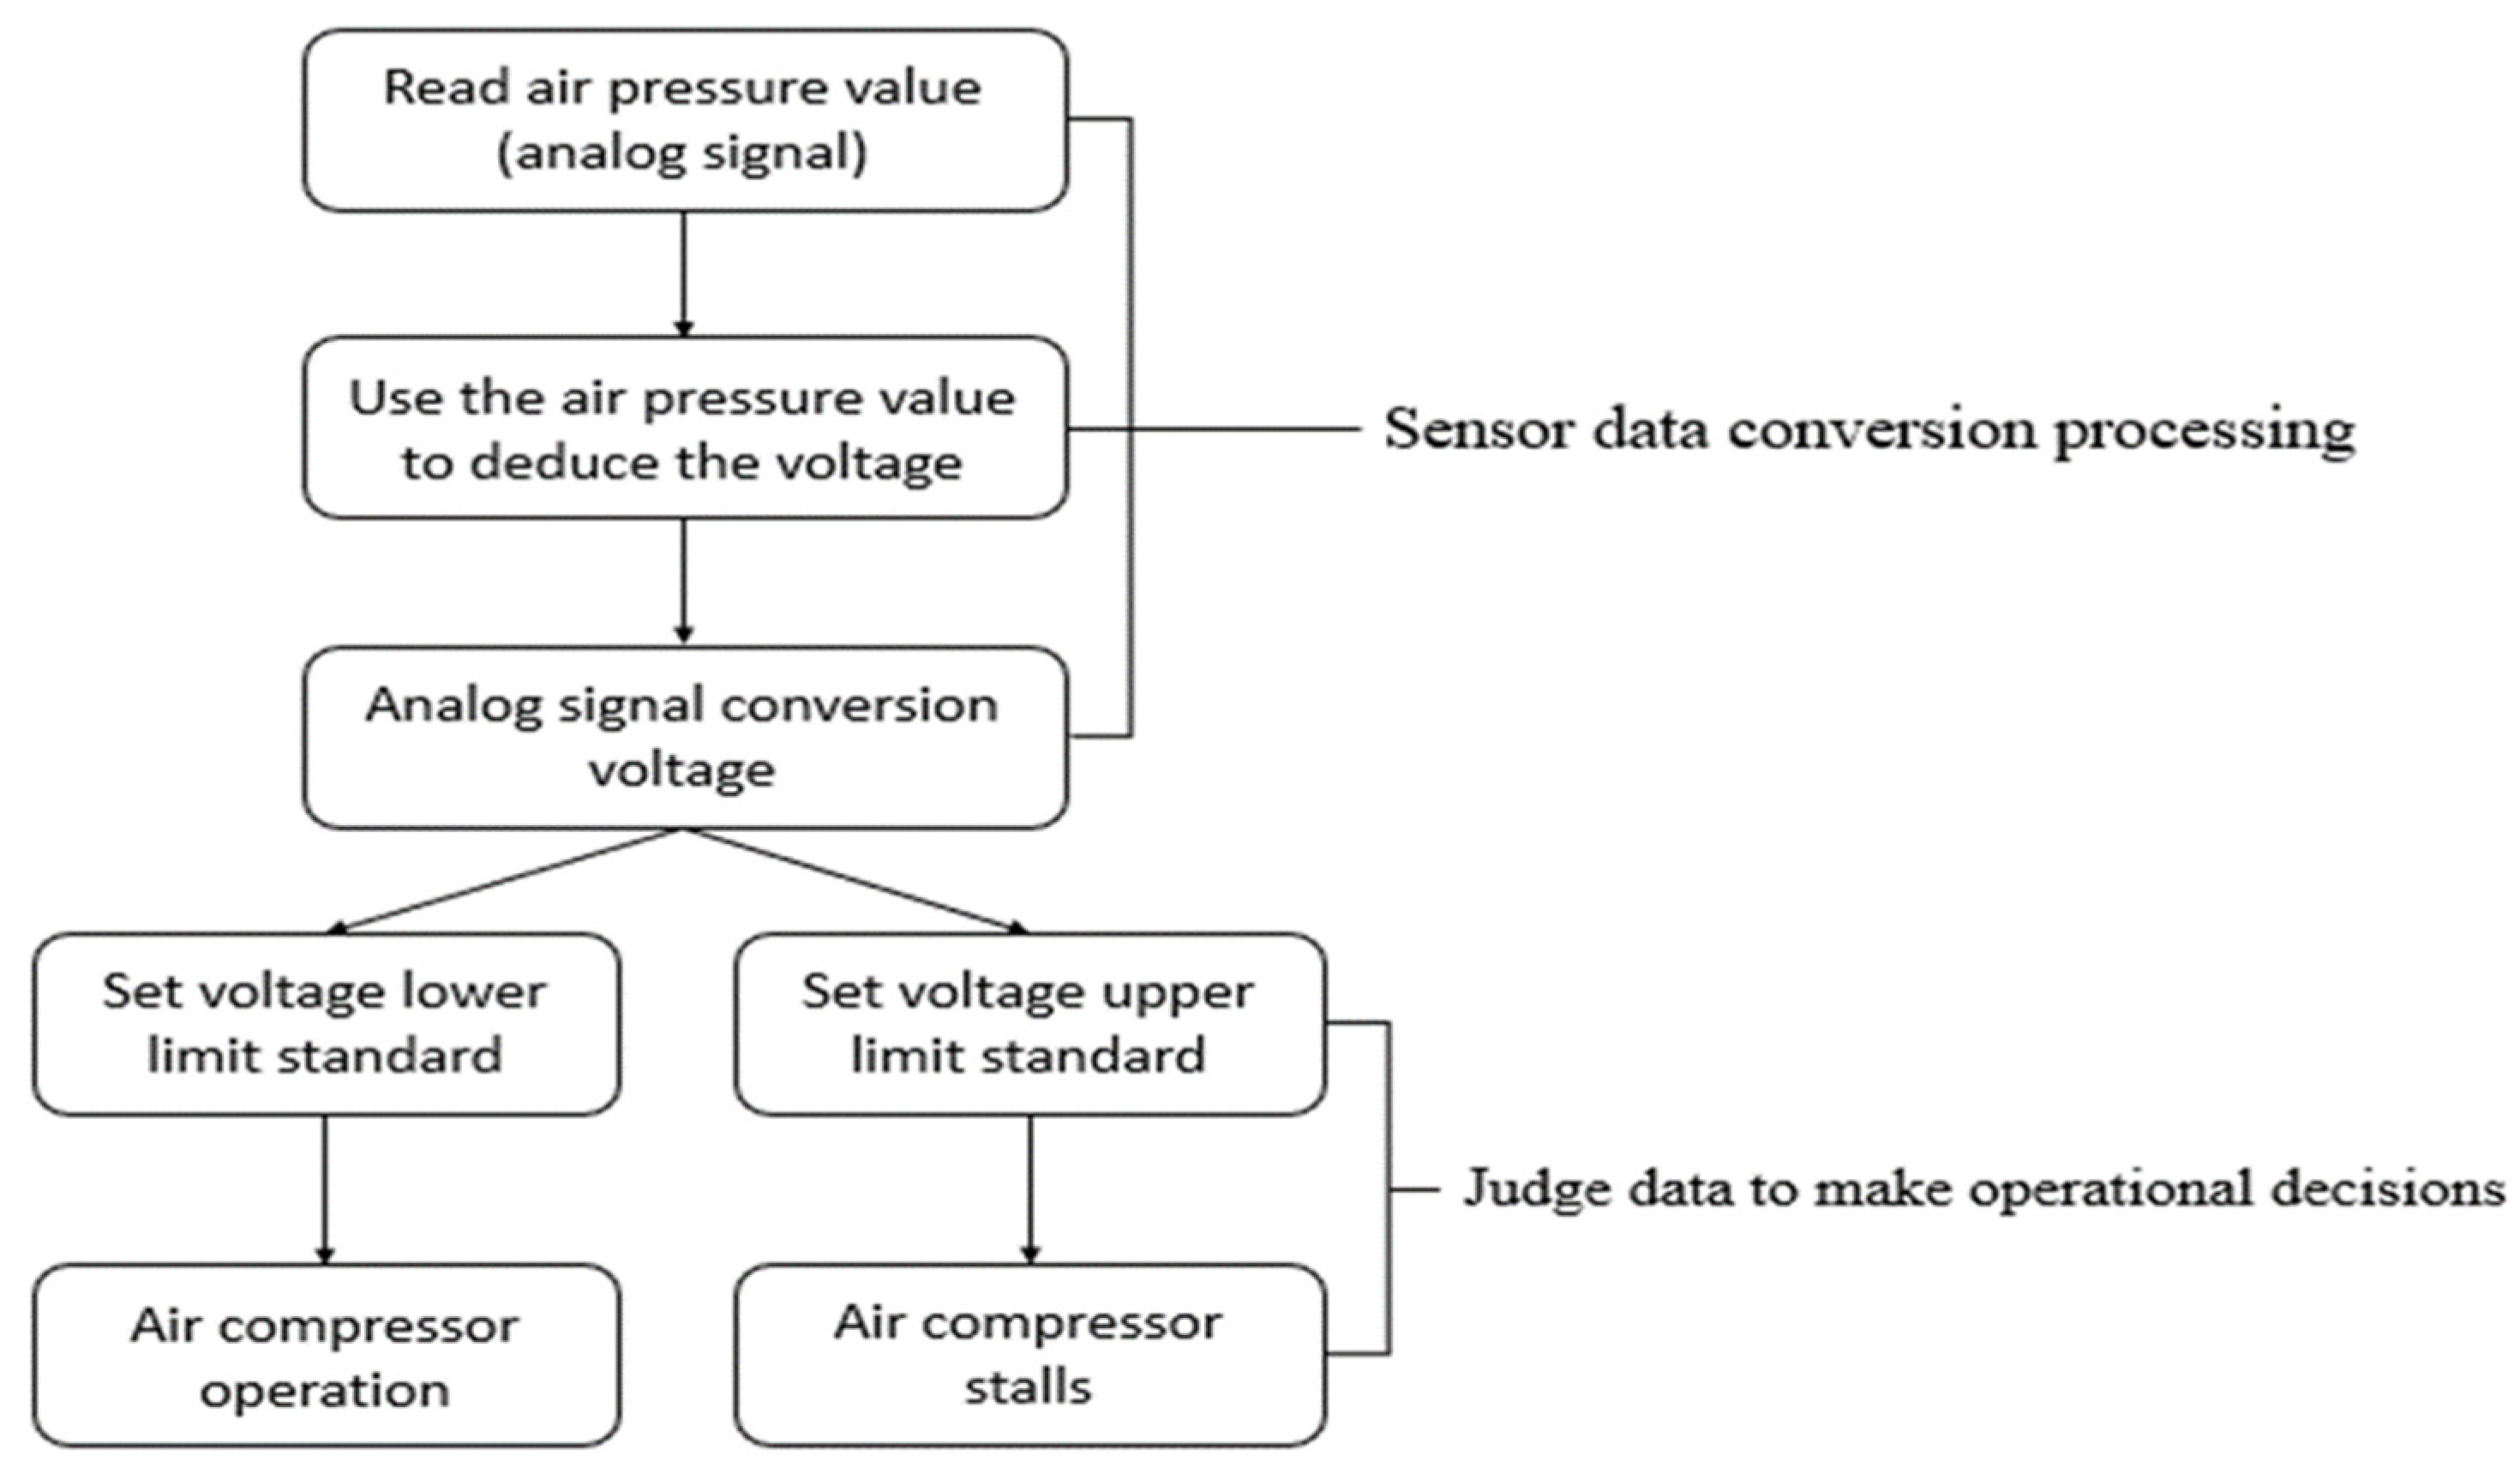
To meet the energy-saving needs of the air compressor, an air pressure feedback control device has been developed to appropriately cut off the power supply when the pressure value meets the required level as listed in Figure 11. This system uses Arduino to measure the air pressure within the compressor and sends the data back to the Arduino. The control device will then compare the sensor data with the pre-set required air pressure values. When the air pressure reaches or exceeds the necessary value, the embedded control device will cut power to the motor to stop the operation of the air compressor. This ensures that the system operates within the required pressure range while avoiding unnecessary energy consumption.
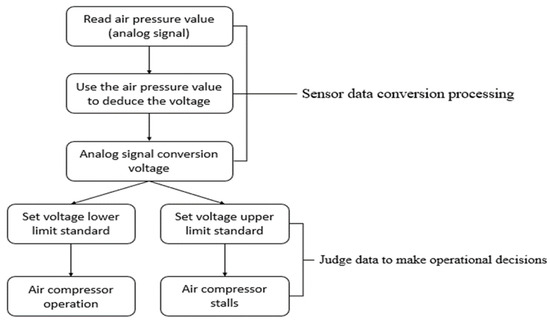
Figure 11.
Air pressure sensing and decision-making system operating logic.
In this experiment, a 4-kilowatt (4 kW) air compressor was redesigned for electrification and integrated with Arduino to achieve automated control. This demonstrates the importance of electrification for the sustainability of air compressors. This technology not only saves energy and reduces carbon emissions but also enhances production efficiency. The application of air pressure sensing components allows the system to adjust its operation based on actual working conditions, increasing the system’s flexibility. The system has been integrated with EP43P-030-F1 air pressure sensors, which can continuously monitor the pressure changes in the air compressor. This feature enables the system to adjust based on actual demand conditions, ensuring optimal performance under various working conditions while conserving battery energy. By controlling the pressure in real time, the system achieves higher efficiency and reduces excessive operation and battery power wastage.
2.7. Simulation System Using PSIM
To design the battery and motor control system using PSIM, the steps taken include modeling the battery and the BLDC motor accurately, designing the motor drive circuit and inverter, assembling all the components in one Simulink model, and then analyzing the performance of the system when subjected to various tests. This involves testing various load torques, speed types, and battery SoC charge levels to determine aspects like efficiency, voltage/current ripple, torque ripple, and response characteristics. Consequently, engineers can fine tune the geometric and topology of the design and also verify the circuit before the actual build of the BLDC motor drive system through simulation. The bold widened lines in the electrical schematics provide an understanding of how the battery, the motor drive circuit, and the inverter are connected, while the battery details that are specified for the simulation provide the allowable voltage and capacity of the battery and the motor specifications that specify power rating and other details guiding the motor simulation.
In this study, we conducted a comprehensive simulation of a lithium-ion battery (LIB) and brushless DC (BLDC) motor using PSIM to analyze the electrification of agricultural machinery. While the existing literature highlights various approaches to modeling and simulating LIBs, there is a notable gap in applying these models specifically to agricultural machinery systems. Key studies by [23,24,25,26,27,28] were reviewed, focusing on electrochemical modeling and equivalent circuit models (ECMs) for battery degradation.
Based on these reviews, we selected the ECM-based model for our simulation due to its balance between accuracy and computational efficiency. This model captures the nonlinear characteristics of LIBs and provides reliable predictions of thermal behavior and capacity fade. Our simulation parameters were aligned with data from these studies to ensure robustness.
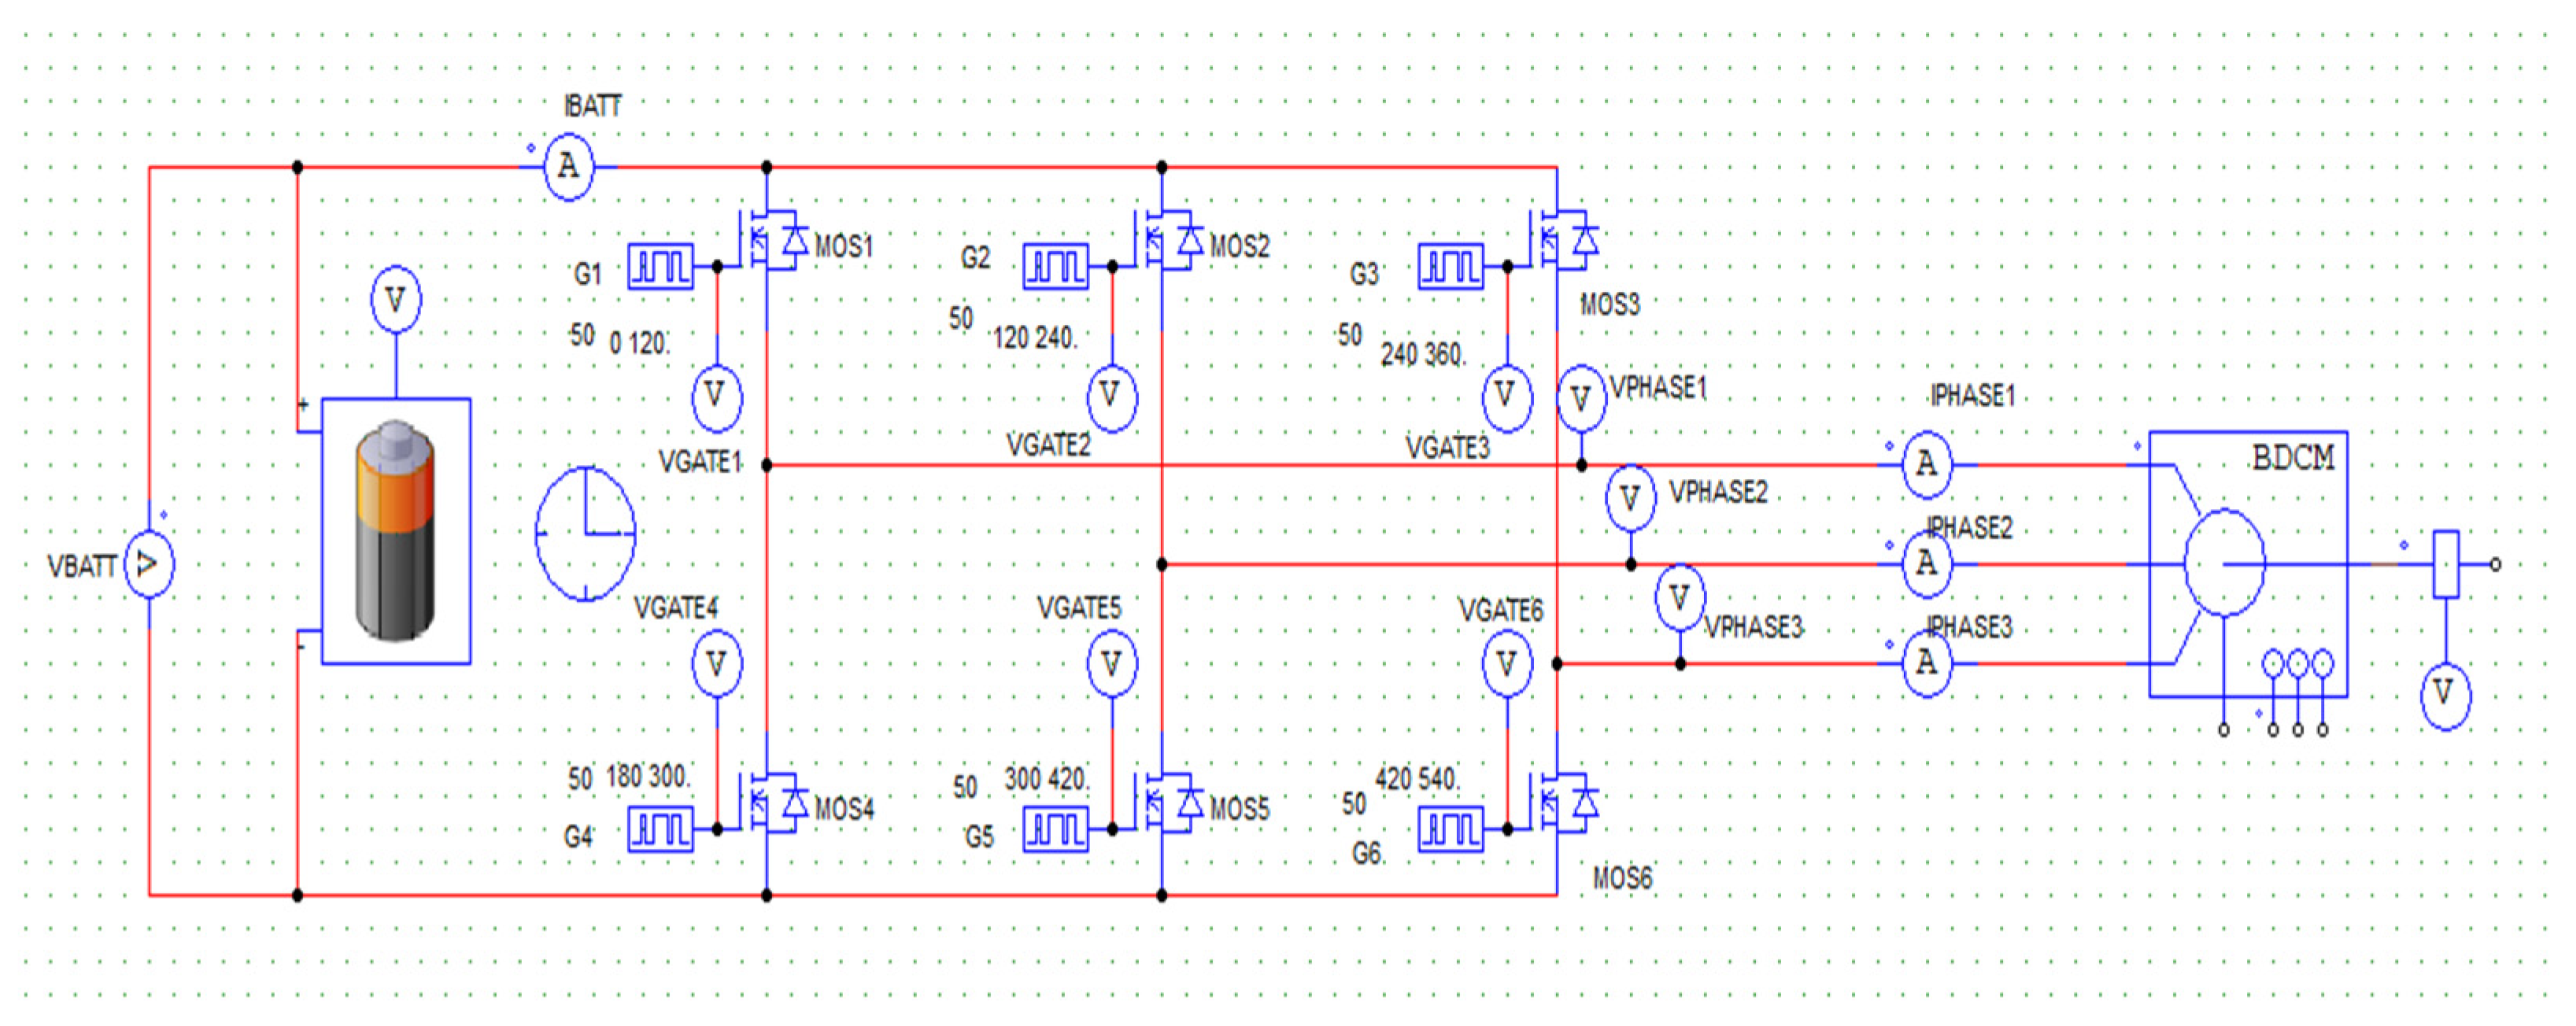
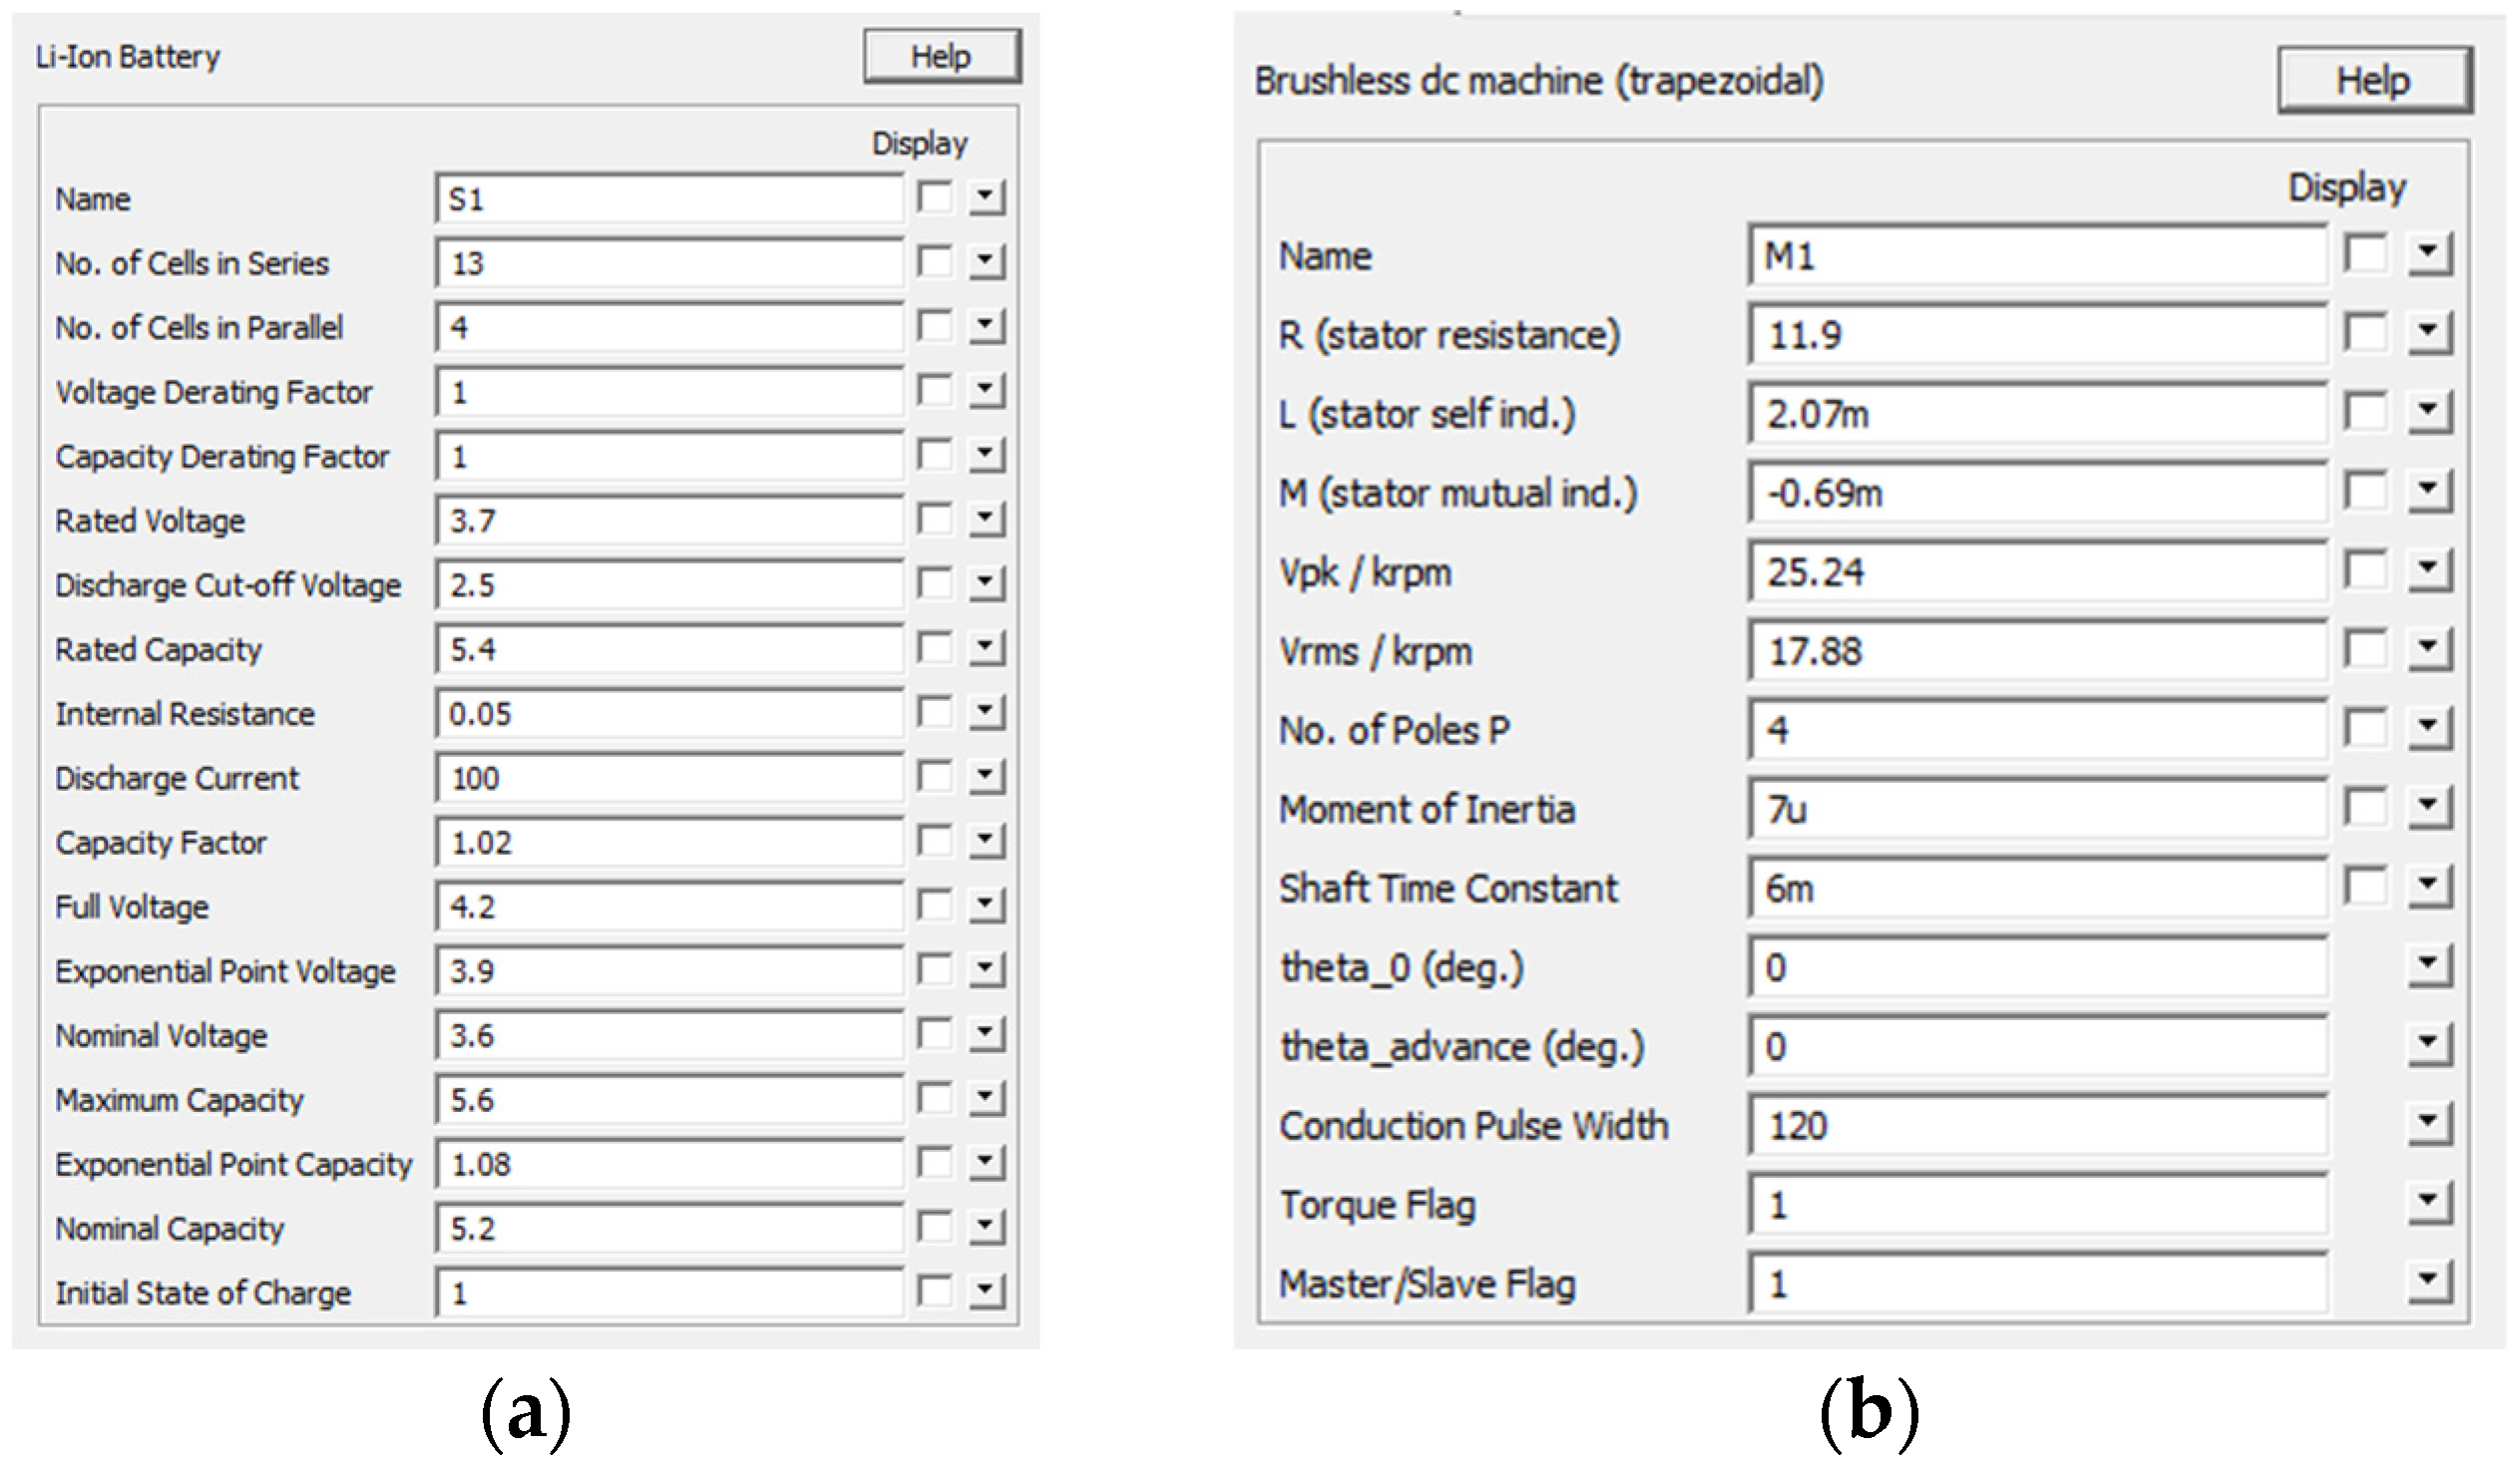
As shown in Figure 12, the schematic system of the simulation includes detailed specifications of the lithium-ion battery and BLDC motor. The battery configuration consists of thirteen cells in series and four cells in parallel, with a rated voltage of 3.7 V and a capacity of 5.4 Ah. It has an internal resistance of 0.05 Ω and a nominal voltage of 3.6 V (Figure 13). The BLDC motor specifications include a stator resistance of 11.9 Ω, stator inductance of 2.07 mH, and a voltage constant of 25.24 V/krpm (Figure 13). These parameters were selected to reflect the operational conditions of agricultural machinery accurately, ensuring a realistic simulation of performance and longevity.

Figure 12.
Result of changing primeover.
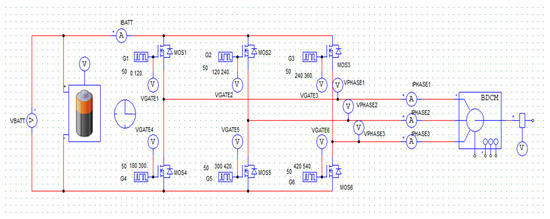
Figure 13.
Schematic system of simulation.
By integrating these detailed specifications, our model not only validates the approach but also provides a foundation for future research in optimizing the performance and durability of electrified agricultural systems.
3. Results
This section will give a detailed discussion of the results that have been obtained, both via simulated results and the experiment that uses the Arduino interface together with the Hall sensor. Moreover, an evaluation and assessment of the impact of varying pulley ratios will follow this part of the study. Whenever what is found by simulation is combined with experimentation, then a much broader perspective of the system behavior provides information for modifying and enhancing, as well as real-life usage. The purpose of this study in implementing reality is to ensure that theoretical modeling is in good sync with empirical validation by incorporating Arduino and Hall sensor technology in the context of pulley ratios with the appropriate care. It will help to increase the amount of knowledge of relevant phenomena within the specified domain.
3.1. Simulation Result
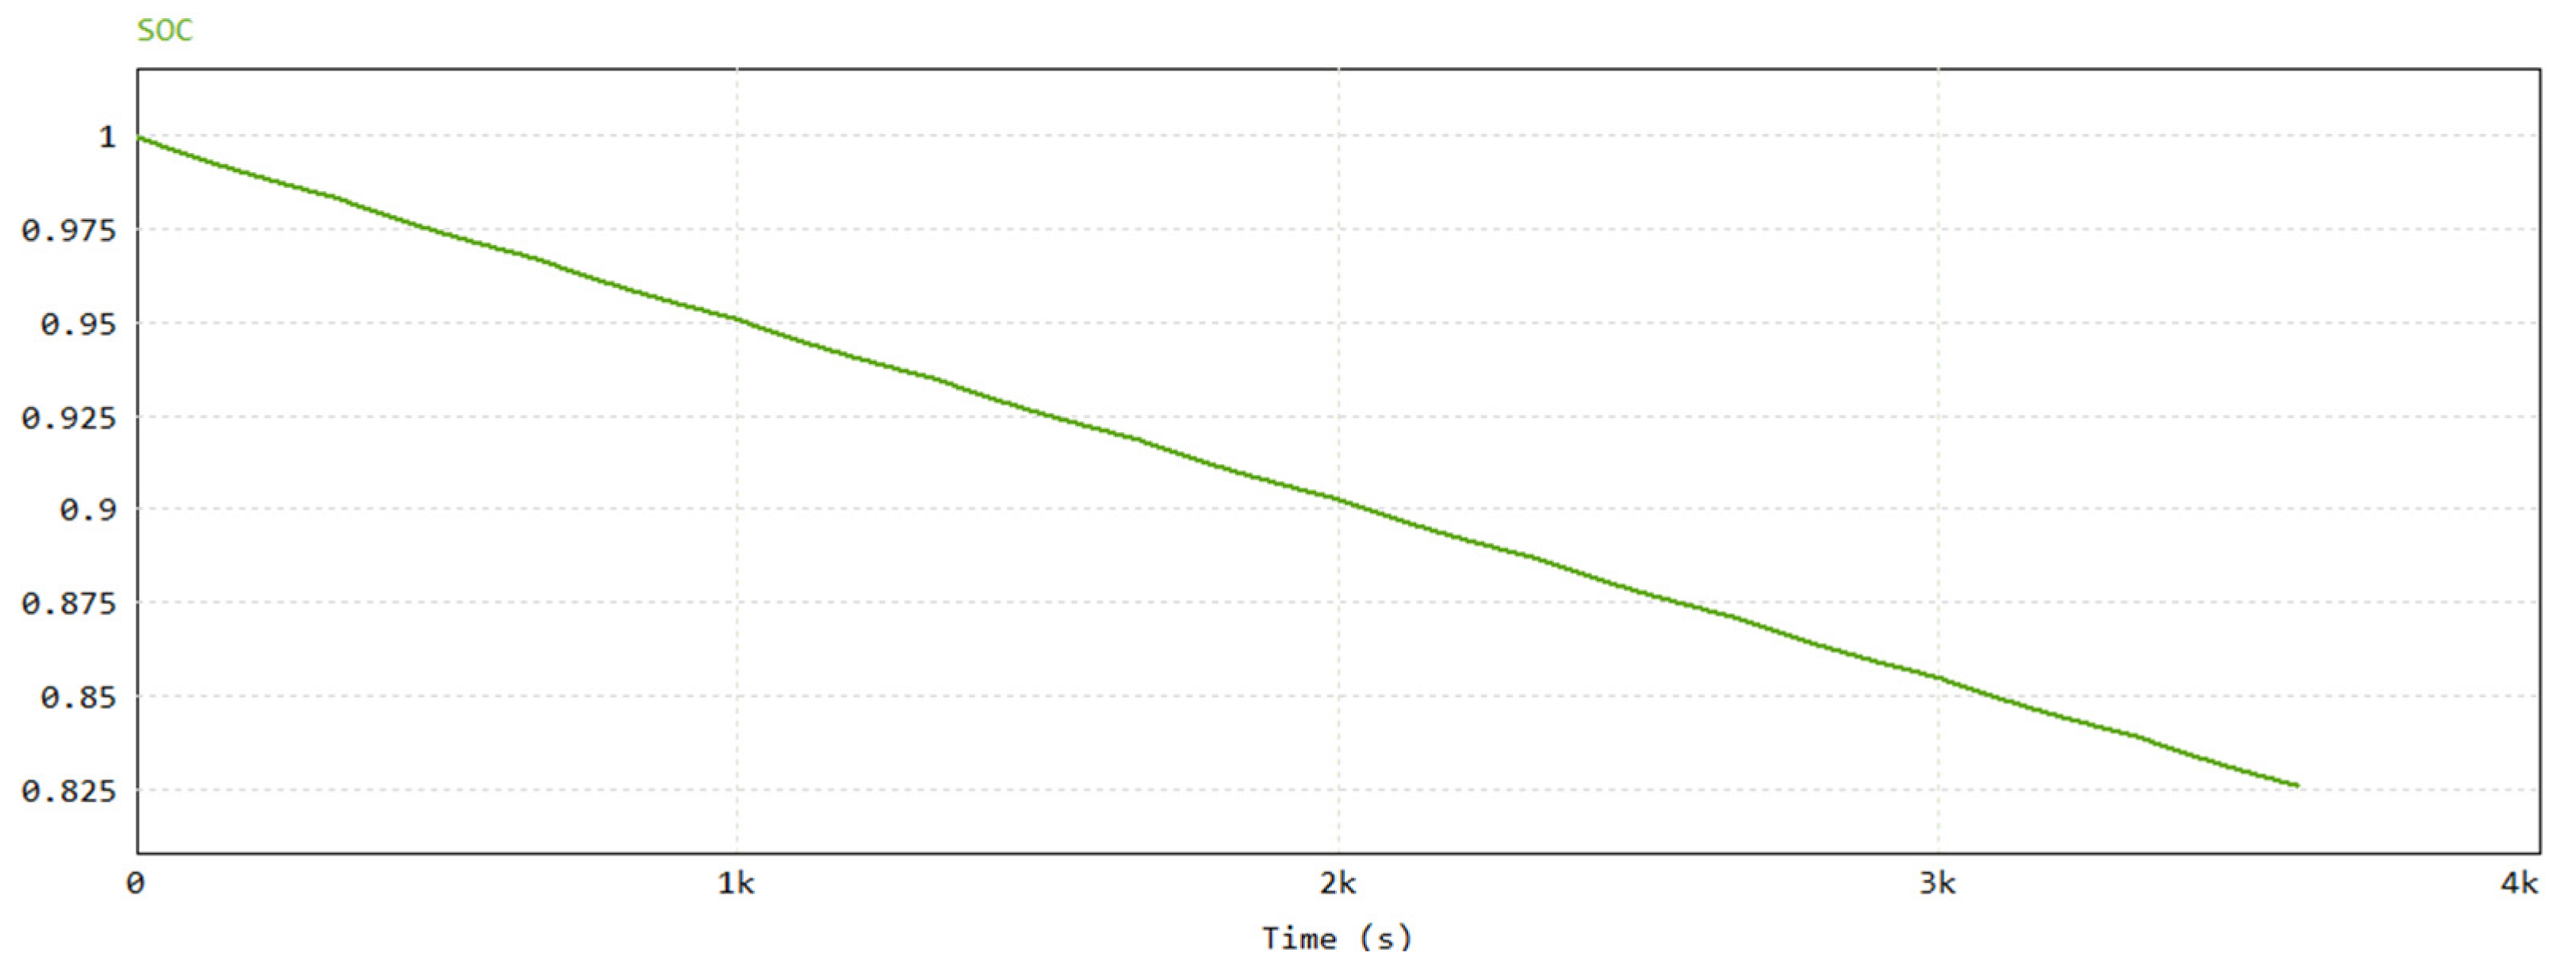
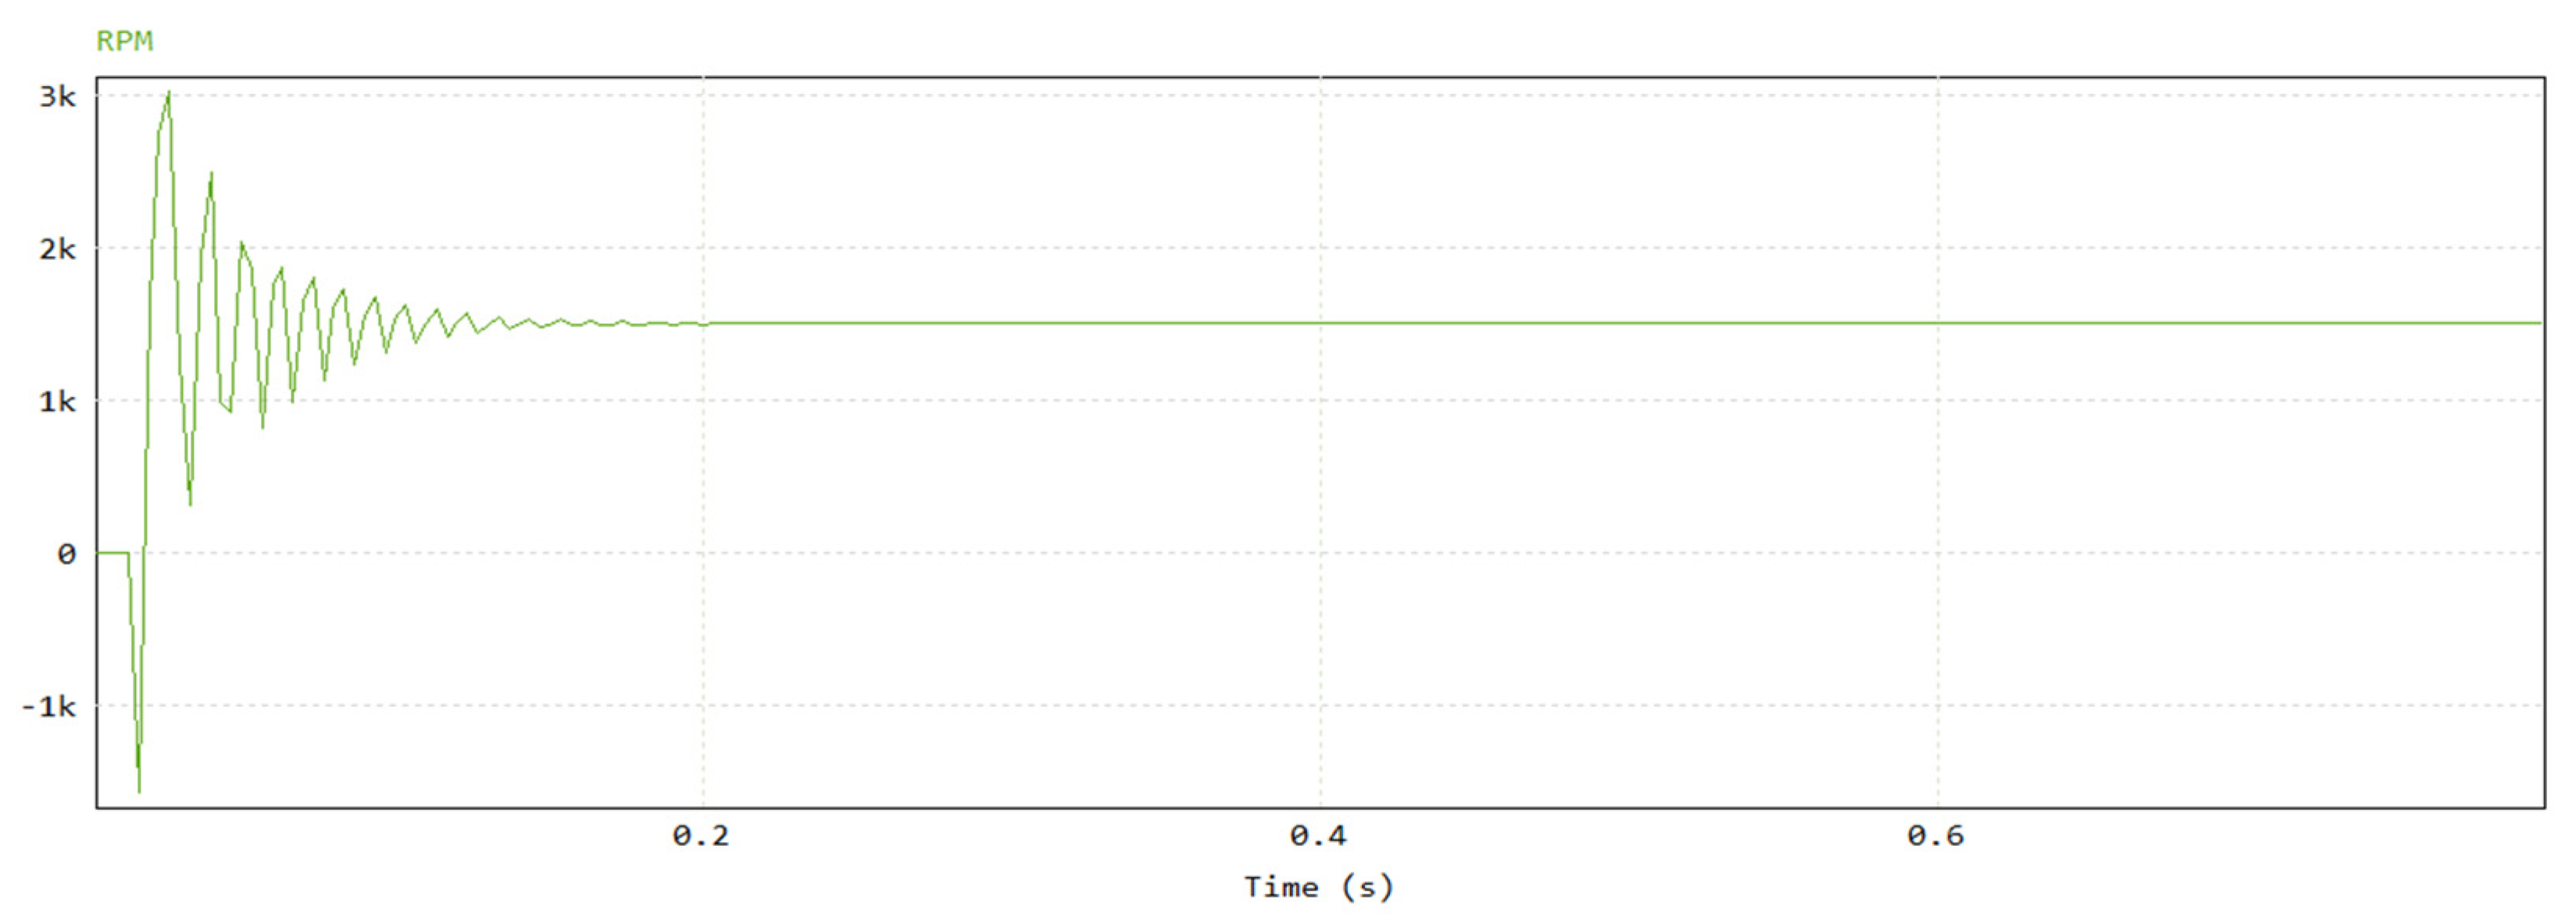
Figure 14 shows the results of the simulation, including battery auxiliary data and battery state of charge, where the curriculum of battery auxiliary data gradually decreases as per test conditions of SOC from full charge to empty charge. At the same time, the Rotation Per Minute (RPM) of the motor also shows a dynamic behavior indicated by changes in the actual value resulting from the effects of load, speed, and efficiency requirements. These three characteristics highlighted above provide a rich picture of the system performance, delineating the coupling between the energy storing and propelling mechanisms within the simulated environment.

Figure 14.
(a) Battery Specification; (b) Motor Specification.
The electrical battery discharging simulation results in SOC that reduces from 1 to 0. 825 within the span of one hour, which is equivalent to 3600, and sometimes an additional number may come after the decimal point. This decline continues further, exhibiting a gradual rate of energy consumption under the test conditions, thereby confirming the use of 15% of the battery capacity in an hour and a half. This information is really essential in order to evaluate the battery’s characteristics and its ability to operate under operational load: the system’s productivity, effectiveness, and the possible ways of its enhancement. Figure 15 shows the rpm output of the BLDC machine. The relative rotation speech is listed in Figure 16.
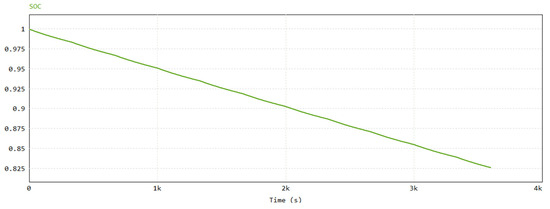
Figure 15.
SOC Decrease.
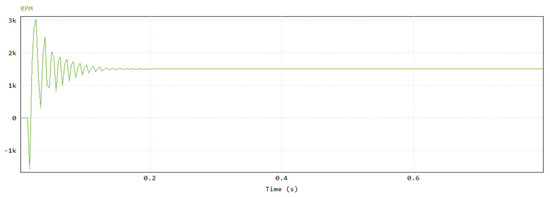
Figure 16.
Rpm Motor.
3.2. Experimental Result Using Hall Effect Sensor
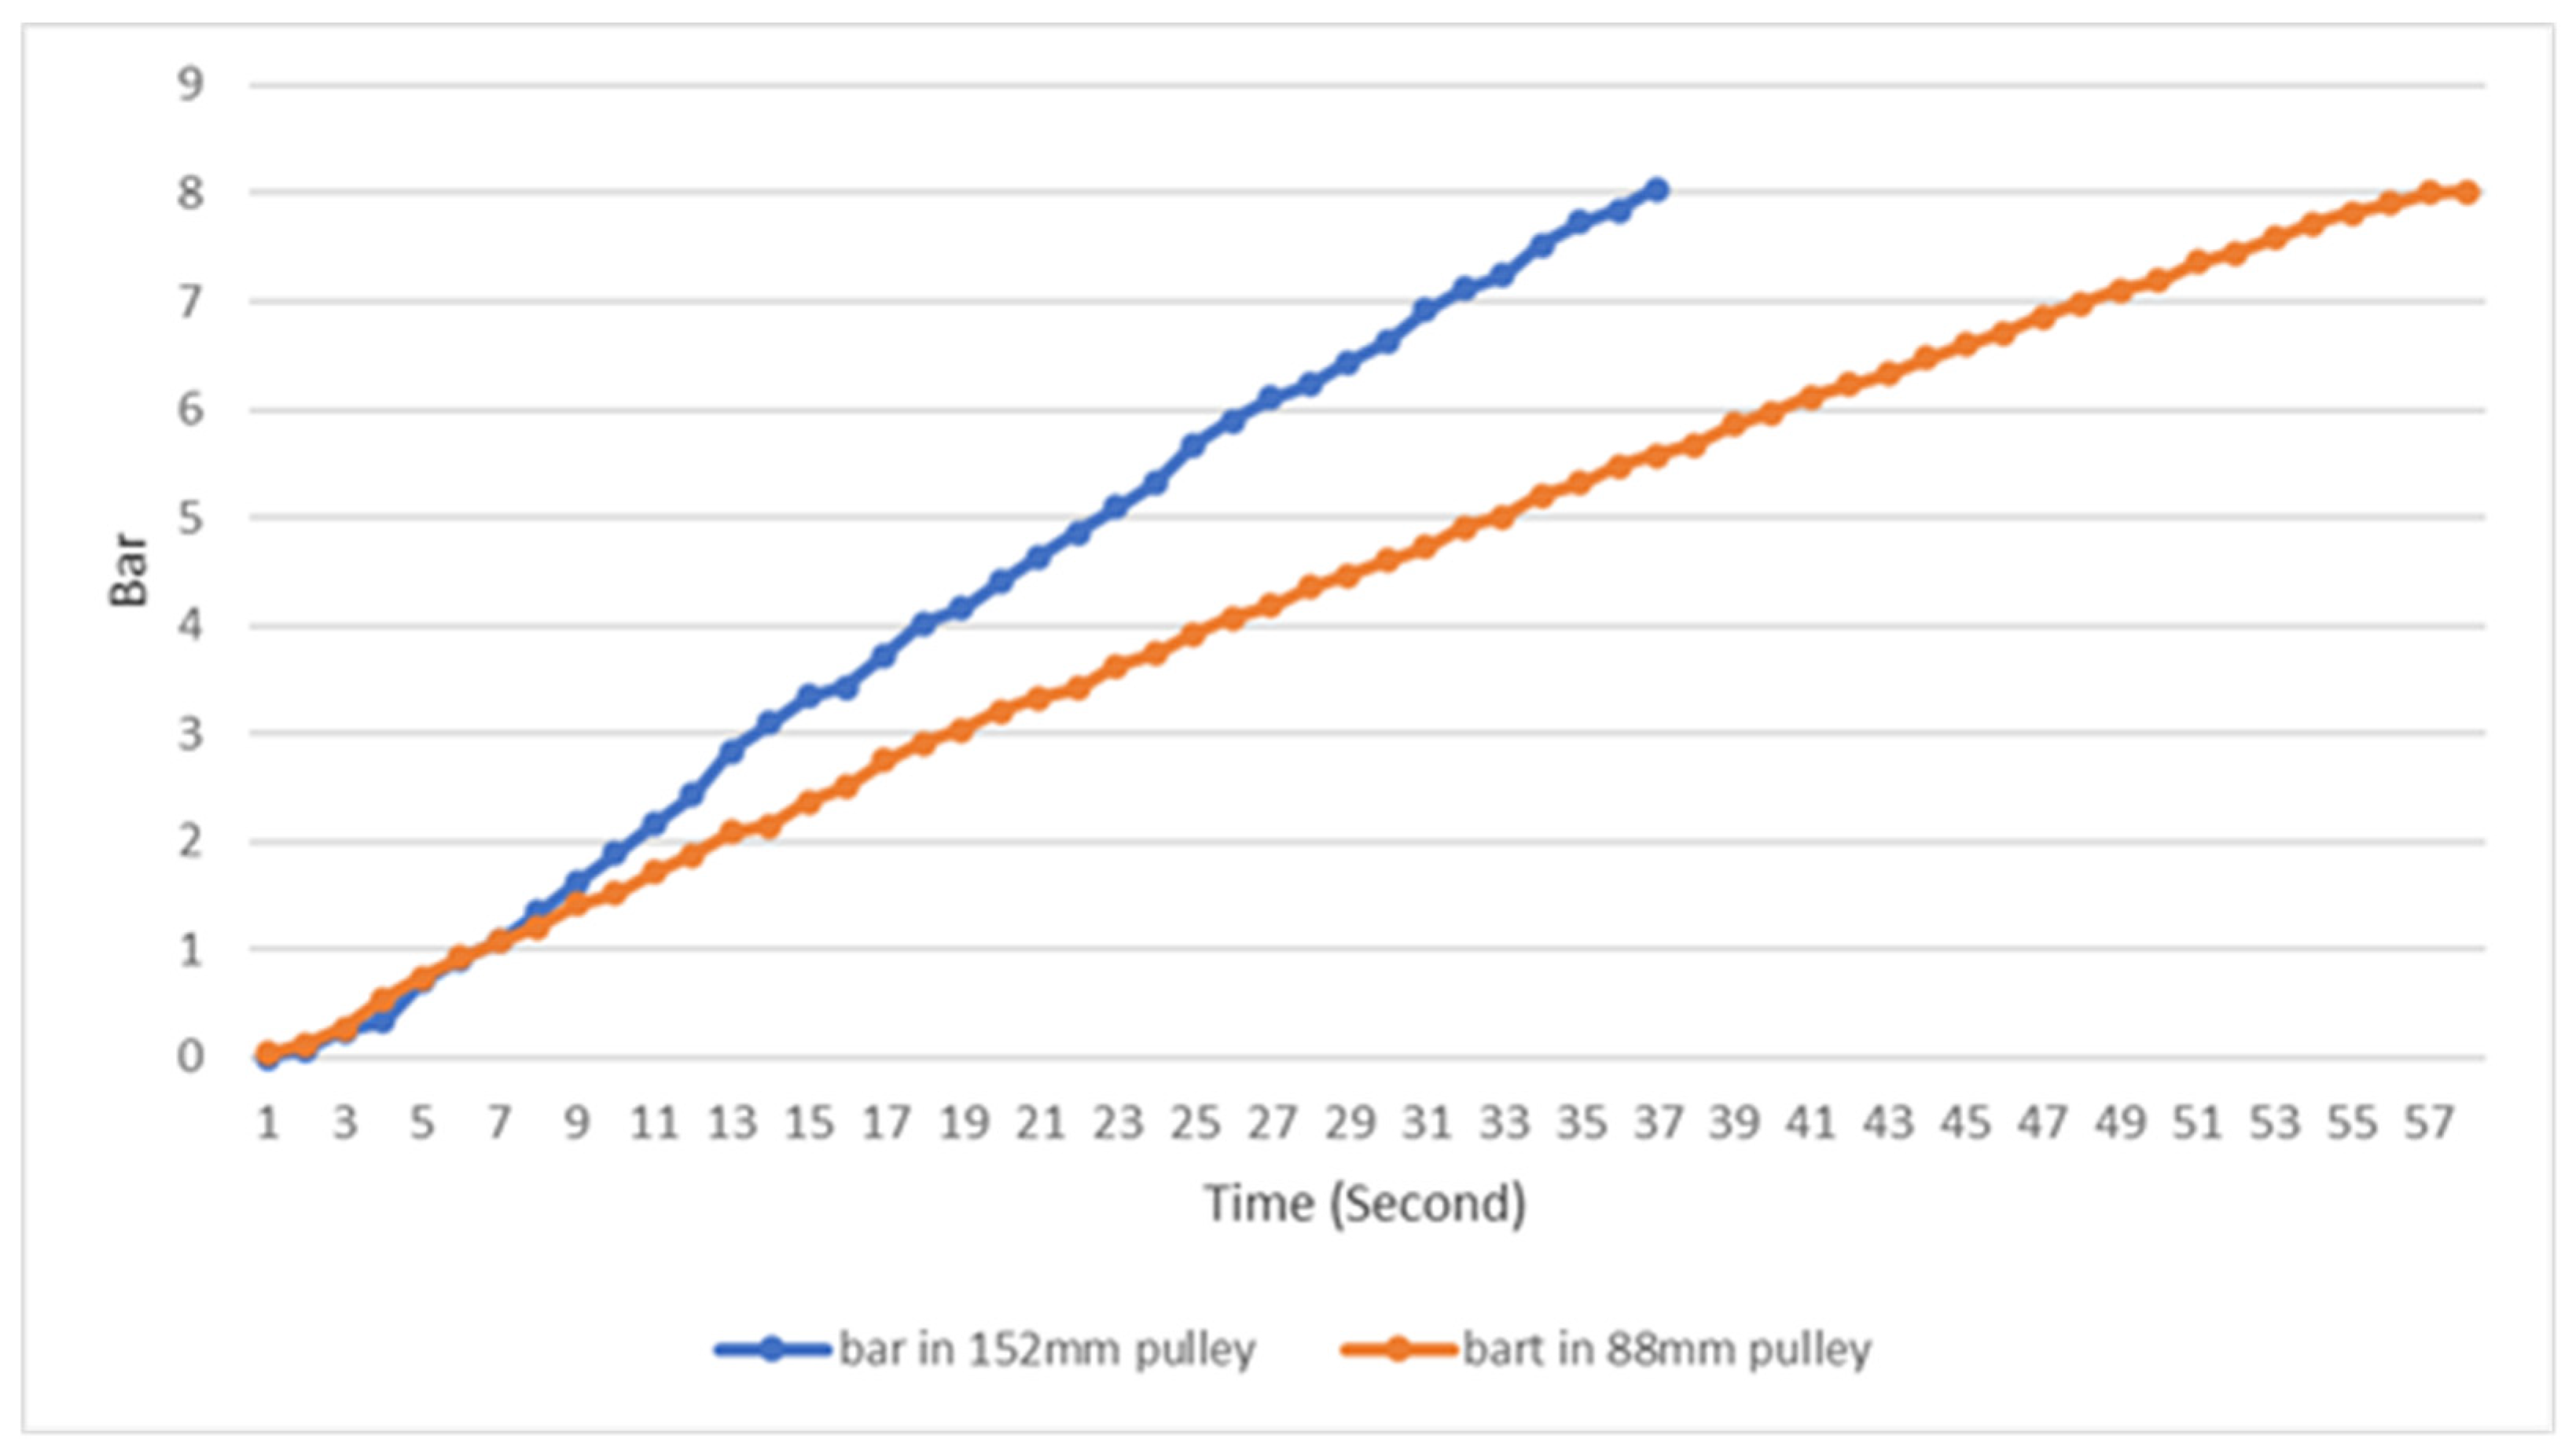
In an experimental setup to assess the performance of an air compressor driven by a brushless DC (BLDC) motor, two different pulley sizes were tested: They came in 88 mm and 152 mm in size. The first and foremost purpose of the experiment involved discovering the effects resulting from the size enlargement of the pulley on the overall efficiency of the compressor and the amount of power it generated. The 88 mm pulley was used as a starting point with a slightly larger diameter, but the shaft rotates at a faster rate. Conversely, the 152 mm pulley, which was larger, led to slower velocity but higher mixed torque. To recap the findings from the experiment, the large pulley caused a slowing down of the compressor, therefore leading to a reduced airflow rate. Therefore, an increment in the torque might have improved the capability of the compressor for further capacity and maintaining pressure within fluctuations found in highly loaded systems. Comparing the time constant with the results of pressure control and equal pressure switching, this trade-off between speed and torque is important to underline the benefit of compressor control over switching with valuable ideas about compressor optimization for applications where constant pressure is more essential than a high volume rate.
From the graph in Figure 17, it can be seen that increasing the pulley diameter can optimize the performance of the air compressor, which has the effect of increasing the speed of the bar rise. But in this case, manpower is still needed, which can be reduced by automating the air compressor and adding a microcontroller.
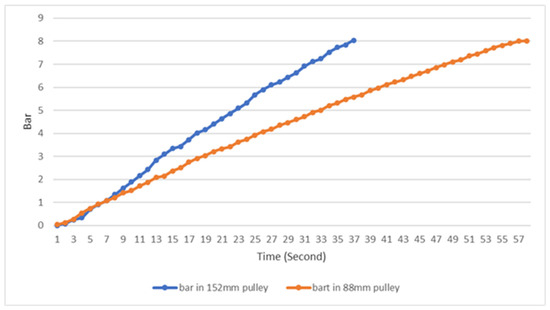
Figure 17.
Comparison of the effect between the 152 mm pulley and 88 mm pulley on bar rise.
3.3. Experimental Result Using Arduino Uno
In an experimental setup to assess the performance of an air compressor driven by a brushless DC (BLDC) motor, two different pulley sizes were tested: the artillery ranging from 88 m and 152 m were applied. The main goal of the experiment thus consisted of ascertaining the effects of the pulley size upsize on the efficacy and capacity of the overall compressor. As a result of the inconvenience and lack of accuracy involved in these processes, an Arduino microcontroller was added to the system. This microcontroller was used to automate the control of the motor while permitting monitoring and recording of the motor data at the same time. The cylinder with a pulley size of 88 mm was chosen as the base model as it provided higher revolutions per minute because of the smaller diameter. Conversely, a large and robust 152 mm pulley allowed for a lower but considerably higher mechanical advantage due to the increased mass and force applied. The initial results disclosed that the size of a larger pulley caused a decrease in the compressor speed and, hence, a lower airflow rate. Still, the increased torque may have contributed to improving the compressor’s capability to hold a steady pressure when the load was high. This trade-off of rotation speed and torque is like the flow and pressure relationship as shown in Figure 17 and Figure 18, where pressure is more important than flow in applications requiring steady pressure output. The incorporation of the Arduino microcontroller in the experiment also proved beneficial in terms of time as well as data accuracy and precision to give an understanding of the different ideas for the improvement of the performance of the compressor depending on the operational conditions of the system.
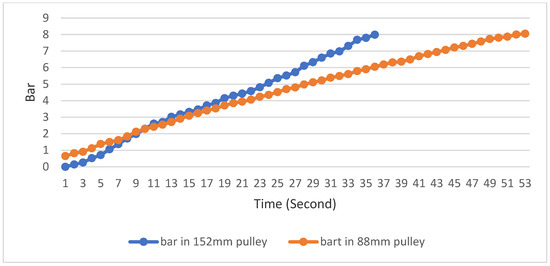
Figure 18.
Comparison of the effect between the 152 mm pulley and 88 mm pulley on bar rise using Arduino.
The experiment conclusively demonstrated that the 152 mm pulley is superior to the 88 mm pulley for the air compressor driven by a BLDC motor, particularly in applications requiring stable pressure maintenance under higher loads. The larger pulley, with its increased torque, effectively sustained consistent pressure levels despite its lower airflow rate. Additionally, the integration of an Arduino microcontroller significantly reduced the need for manual intervention, automating motor control, and data collection. This not only enhanced the accuracy and consistency of the results but also decreased the manpower required, making the system more efficient and reliable.
4. Discussion
While considering the comparative effectiveness of various components of the system in the process of electrification of the 4 kW air compressor, one specific decision between Arduino and Hall effect sensors was made. As a microcontroller platform, disadvantages associated with Arduino are notably smaller in contrast to conventional Hall effect sensors, especially in areas of flexibility and costs. In some cases, Arduino offers the opportunity to modify and integrate other features like real-time monitoring and control for some automated systems, which is significant in improving the robustness and reliability of the system. Also, Arduino could be programmed to perform some specific operations much more effectively than the traditional methods, and this is because programmed control over the air compressor makes it much more energy efficient and safe to operate.
Moreover, the test between using a 152 mm pulley and an 88 mm pulley further concluded that the 152 mm pulley outperforms the 88 mm pulley in handling torque load and maintaining a stable pressure for HI-LO conditions. This size provides a higher mechanical advantage in the handle and lower outlet speed, which proves useful for tasks that do not frequently need changes in rates of work.
The adoption of the Arduino has been found to be crucial in boosting control and, by extension, the effectiveness of the air compressor system. Being open-source and relatively cheap, Arduino allows the creation of a highly degradable system with fine control at a much lower cost compared to other technologies. The design concept, including the incorporation of a 152 mm pulley that was also confirmed to be optimum for optimizing pressure and energy necessary for sustainable and cost-effective agricultural practices, has also proven feasible.
The directions for further developments are as follows: This work presents some opportunities for further research, especially in the development of IoT technologies for the monitoring of real-time data and in its application to the optimization of systems. Another possible scope for further research can include analyses of the applicability of this approach to the systems of greater size and scale of agricultural production business and its influence on the general organizational and administrative costs. The results of this study offer a base for the radical alteration of the agricultural industry towards sustainable means and outputs through the use of advanced technologies in the equipment used.
5. Conclusions
This research demonstrates the significant role of Arduino in controlling and managing a 4 kW air compressor, resulting in enhanced efficiency and reduced costs. The system utilizes a 48 V lithium iron phosphate battery, selected for its high energy density and safety, to power a permanent magnet brushless motor. An Arduino-based feedback control sensor ensures continuous and stable power output, effectively managing energy efficiency. Bench tests confirmed that using a 152 mm pulley, compared to an 88 mm pulley, provides improved pressure stability and better load handling, thereby enhancing the compressor’s functionality and longevity. The system design prioritizes durability, ease of maintenance, and cost-effectiveness, ensuring it meets harsh running conditions. The air pressure feedback control device meets energy-saving requirements by digitally adjusting power output as needed. These findings support the further development and integration of smart technologies in the agricultural machinery industry, aligning with global advancements in automation and efficiency. The study underscores the potential for sustainable, environmentally friendly, and cost-effective solutions in agricultural machinery through the adoption of advanced control systems and optimized components.
Author Contributions
Conceptualization, H.-C.C.; methodology, H.-C.C.; writing—original draft preparation, Y.F.R. and M.B.A.; writing—review and editing, H.-T.L. and W.-Y.S.; supervision, W.-Y.S. All authors have read and agreed to the published version of the manuscript.
Funding
This research received no external funding.
Data Availability Statement
Data is unavailable due to privacy and ethical restrictions.
Conflicts of Interest
The authors declare no conflicts of interest.
References
- Scolaro, E.; Beligoj, M.; Estevez, M.P.; Alberti, L.; Renzi, M.; Mattetti, M. Electrification of Agricultural Machinery: A Review. IEEE Access 2021, 9, 164520–164541. [Google Scholar] [CrossRef]
- Liu, Z.; Song, J.; Kubal, J.; Susarla, N.; Knehr, K.W.; Islam, E.; Nelson, P.; Ahmed, S. Comparing total cost of ownership of battery electric vehicles and internal combustion engine vehicles. Energy Policy 2021, 158, 112564. [Google Scholar] [CrossRef]
- Chen, T.; Rizwan, M.; Abbas, A. Exploring the Role of Agricultural Services in Production Efficiency in Chinese Agriculture: A Case of the Socialized Agricultural Service System. Land 2022, 11, 347. [Google Scholar] [CrossRef]
- Zhou, X.; Ma, W.; Li, G.; Qiu, H. Farm machinery use and maize yields in China: An analysis accounting for selection bias and heterogeneity. Aust. J. Agric. Resour. Econ. 2020, 64, 1282–1307. [Google Scholar] [CrossRef]
- Opoku, A. United Nations Sustainable Development Goals. In Proceedings of the 32nd Annual ARCOM Conference, Manchester, UK, 5–7 September 2016; Volume 2, pp. 1149–1158. [Google Scholar]
- Kvalsund, A.S.; Winkler, D. Development of an Arduino-based, open-control interface for hardware in the loop applications. HardwareX 2023, 16, e00488. [Google Scholar] [CrossRef] [PubMed]
- Kondaveeti, H.K.; Kumaravelu, N.K.; Vanambathina, S.D.; Mathe, S.E.; Vappangi, S. A systematic literature review on prototyping with Arduino: Applications, challenges, advantages, and limitations. Comput. Sci. Rev. 2021, 40, 100364. [Google Scholar] [CrossRef]
- Feliciano, D.; Recha, J.; Ambaw, G.; MacSween, K.; Solomon, D.; Wollenberg, E. Assessment of agricultural emissions, climate change mitigation and adaptation practices in Ethiopia. Clim. Policy 2022, 22, 427–444. [Google Scholar] [CrossRef]
- González, I.; Calderón, A.J. Integration of open source hardware Arduino platform in automation systems applied to Smart Grids/Micro-Grids. Sustain. Energy Technol. Assess. 2019, 36, 100557. [Google Scholar] [CrossRef]
- Vlad, M.; Popov, P.; Vasile, D. Simulation of Arduino Mega 2560 Board Controlling a Variable Frequency Converter Driving a BLDC Motor. In Proceedings of the 2020 7th International Conference on Energy Efficiency and Agricultural Engineering (EE&AE), Ruse, Bulgaria, 12–14 November 2020; pp. 1–4. [Google Scholar]
- Reddy, C.P.; Jayakumar, M.; Raj, K.; Kishore, S.; Pandey, S.S. Development of BLDC Motor Controller Using Sensor-Based Method. In Proceedings of the 2024 Second International Conference on Emerging Trends in Information Technology and Engineering (ICETITE), Vellore, India, 22–23 February 2024; pp. 1–6. [Google Scholar]
- Ibrahim, M.G.; El-Shebiny, M.E.-S.; Din, A.S.Z.E.; Mansour, A.S. Arduino-Based Control of Brushless DC Motor for Electric Vehicles. In Proceedings of the 2023 24th International Middle East Power System Conference (MEPCON), Mansoura, Egypt, 19–21 December 2023; pp. 1–8. [Google Scholar]
- Faruque, K.F.I.; Nawshin, N.; Bhuiyan, M.d.F.; Uddin, M.R.; Hasan, M.; Salim, K.M. Design and Development of BLDC Controller and Its Implementation on E-Bike. In Proceedings of the 2018 International Conference on Recent Innovations in Electrical, Electronics & Communication Engineering (ICRIEECE), Bhubaneswar, India, 27–28 July 2018; pp. 1461–1465. [Google Scholar]
- Mohammad, A.; Abedin, M.d.A.; Khan, M.d.Z.R. Microcontroller Based Control System for Electric Vehicle. In Proceedings of the 2016 5th International Conference on Informatics, Electronics and Vision (ICIEV), Dhaka, Bangladesh, 13–14 May 2016; pp. 693–696. [Google Scholar]
- Aghaee, M.; Jalali, A.A. BLDC Motor Speed Control Based on MPC Sliding Mode Multi-Loop Control Strategy—Implementation on Matlab and Arduino Software. In Proceedings of the 2018 Iranian Conference on Electrical Engineering (ICEE), Mashhad, Iran, 8–10 May 2018; pp. 795–800. [Google Scholar]
- Kim, H.-W.; Kim, K.-T.; Jo, Y.-S.; Hur, J. Optimization Methods of Torque Density for Developing the Neodymium Free SPOKE-Type BLDC Motor. IEEE Trans. Magn. 2013, 49, 2173–2176. [Google Scholar] [CrossRef]
- Mohanraj, D.; Aruldavid, R.; Verma, R.; Sathiyasekar, K.; Barnawi, A.B.; Chokkalingam, B.; Mihet-Popa, L. A Review of BLDC Motor: State of Art, Advanced Control Techniques, and Applications. IEEE Access 2022, 10, 54833–54869. [Google Scholar] [CrossRef]
- Jayasundara, J.W.K.K.; Munasinghe, R. Software Design Tool for Optimum Axial Flux BLDC Motors. In Proceedings of the 2009 International Conference on Industrial and Information Systems (ICIIS), Peradeniya, Sri Lanka, 28–31 December 2009; ISBN 9781424448371. [Google Scholar]
- De, S.; Rajne, M.; Poosapati, S.; Patel, C.; Gopakumar, K. Low-inductance axial flux BLDC motor drive for more electric aircraft. IET Power Electron. 2012, 5, 124–133. [Google Scholar] [CrossRef]
- Perotti, M. On the Influence of the Load Parasitics on the CM EMI of BLDC Motor Drives. In Proceedings of the 2020 IEEE International Conference on Environment and Electrical Engineering and 2020 IEEE Industrial and Commercial Power Systems Europe (EEEIC/I&CPS Europe), Madrid, Spain, 9–12 June 2020; ISBN 9781728174556. [Google Scholar]
- Jo, S.-T.; Shin, H.-S.; Lee, Y.-G.; Lee, J.-H.; Choi, J.-Y. Optimal Design of a BLDC Motor Considering Three-Dimensional Structures Using the Response Surface Methodology. Energies 2022, 15, 461. [Google Scholar] [CrossRef]
- Velázquez-Martínez, O.; Valio, J.; Santasalo-Aarnio, A.; Reuter, M.; Serna-Guerrero, R. A Critical Review of Lithium-Ion Battery Recycling Processes from a Circular Economy Perspective. Batteries 2019, 5, 68. [Google Scholar] [CrossRef]
- Saxon, A.; Yang, C.; Santhanagopalan, S.; Keyser, M.; Colclasure, A. Li-Ion Battery Thermal Characterization for Thermal Management Design. Batteries 2024, 10, 136. [Google Scholar] [CrossRef]
- Dunn, B.; Kamath, H.; Tarascon, J.-M. Electrical Energy Storage for the Grid: A Battery of Choices. Science 2011, 334, 928–935. [Google Scholar] [CrossRef] [PubMed]
- Aydin, A.; Zajonz, F.; Günther, T.; Dermenci, K.B.; Berecibar, M.; Urrutia, L. Lithium-Ion Battery Manufacturing: Industrial View on Processing Challenges, Possible Solutions and Recent Advances. Batteries 2023, 9, 555. [Google Scholar] [CrossRef]
- Yao, L.; Xu, S.; Tang, A.; Zhou, F.; Hou, J.; Xiao, Y.; Fu, Z. A Review of Lithium-Ion Battery State of Health Estimation and Prediction Methods. World Electr. Veh. J. 2021, 12, 113. [Google Scholar] [CrossRef]
- Xu, B.; Oudalov, A.; Ulbig, A.; Andersson, G.; Kirschen, D.S. Modeling of Lithium-Ion Battery Degradation for Cell Life Assessment. IEEE Trans. Smart Grid 2016, 9, 1131–1140. [Google Scholar] [CrossRef]
- Surya, S.; Samanta, A.; Marcis, V.; Williamson, S. Smart Core and Surface Temperature Estimation Techniques for Health-Conscious Lithium-Ion Battery Management Systems: A Model-to-Model Comparison. Energies 2022, 15, 623. [Google Scholar] [CrossRef]


Disclaimer/Publisher’s Note: The statements, opinions and data contained in all publications are solely those of the individual author(s) and contributor(s) and not of MDPI and/or the editor(s). MDPI and/or the editor(s) disclaim responsibility for any injury to people or property resulting from any ideas, methods, instructions or products referred to in the content. |
© 2024 by the authors. Licensee MDPI, Basel, Switzerland. This article is an open access article distributed under the terms and conditions of the Creative Commons Attribution (CC BY) license (https://creativecommons.org/licenses/by/4.0/).