Abstract
This study investigates the technical and economic feasibility of a 20 parabolic trough solar thermal power plant (PTSTPP) located in Kenitra, Morocco, characterized by an annual average direct normal irradiance (DNI) exceeding 5.3 . Utilizing System Advisor Model (SAM) 2012.12.02 software, the plant is designed with Therminol VP-1 as the heat transfer fluid (HTF) throughout the solar field, coupled with a dry cooling system to reduce water consumption. The proposed thermal energy storage (TES) system employs HITEC solar salt as the storage medium, allowing for six full load hours of thermal energy storage. With a solar multiple (SM) of 2, the simulated plant demonstrates the capability to generate an annual electricity output of 50.51 . The economic viability of the plant is further assessed, revealing a Levelized Cost of Electricity (LCOE) of 0.1717 and a capacity factor (CF) of 32%. This comprehensive analysis provides valuable insights into the performance, economic viability, and sustainability of a parabolic trough solar power plant in the specific climatic conditions of Kenitra, Morocco.
1. Introduction
A solar system uses the power of sunlight to generate heat energy for a variety of applications. By using different technologies to collect and concentrate solar radiation, such as parabolic troughs (PTs), solar towers (STs), parabolic dishes (PDs), and linear Fresnel reflectors (LFRs), these systems transfer the sunlight to the receiver, where it becomes thermal energy. This energy serves multiple purposes, including electricity generation [1], powering industries, heating water, and regulating temperature. Solar energy systems are a reliable and eco-friendly way to satisfy energy demands while decreasing dependence on fossil fuels. As of 2023, Morocco has an installed capacity of 582 MW for concentrated solar power (CSP) facilities, contributing approximately 4% to its national electricity generation. This notable achievement positions Morocco as a global leader in CSP development, highlighted by the Noor Ouarzazate complex, the largest CSP plant on the continent with a capacity of 510 MW. This complex consists of four units (Noor I-IV) [2] and exemplifies Morocco’s commitment to diversifying renewable energy (RE) sources and enhancing energy security. Additionally, with an ambitious goal of reaching 2000 MW of CSP capacity by 2030, Morocco is undertaking several large-scale projects, including Noor Midelt, Noor Laayoune, and Noor Tafilalet, demonstrating its strong dedication to advancing the CSP sector [3].
Boukelia et al. [4] compared different parabolic trough solar thermal power plants (PTSTPPs) using oil or molten salt as working fluids, with and without thermal energy storage (TES) and a fuel backup system (FBS). Their study evaluates the thermodynamic, economic, and environmental performance of these configurations and suggests further optimization. Bishoyi et al. [5] assessed the design and thermal performance of a 100 MW PTSTPP with six hours of heat storage, specifically designed for Udaipur, India. This plant, with 194 loops of eight troughs each, can produce 285,288,352 kWh of electricity per year at 21% efficiency, promoting solar thermal innovation in India. Benhadji Serradj et al. [6] based their analysis on the real electricity needs of Tamanrasset, Algeria. Their study evaluates a 100 MW PTSTPP with two condenser options as follows: evaporative and air-cooled. The PTSTPP generates 78% of the electricity needed by the city in winter and 60% in summer. Trabelsi et al. [7] demonstrated that employing a PTSTPP with dry cooling and molten salt as a heat transfer fluid (HTF) can lower electricity and water costs in arid areas. The plant with molten salt has a better Levelized Cost of Electricity (LCOE) of 13.8 cUSD/kWh compared to the plant with wet cooling and synthetic oil HTF. Additionally, the plant with molten salt achieves a higher energy efficiency of 15.79%, compared with 14.9% for the plant with synthetic oil HTF. Ezeanya et al. [8] utilized System Advisor Model (SAM) software to simulate a 50 kW CSP plant in Crowley, Louisiana. They validated the model with real plant data and used it to optimize the plant’s operational performance across various locations. Parametric analyses show that optimizing the combined solar multiple (SM) and storage hours can substantially reduce the price of electricity by 70%. Lopes et al. [9] investigated the use of molten salt for heat transfer and thermal energy storage (TES) in parabolic trough solar panels. Molten salt offers several advantages over conventional liquids such as Therminol VP-1 oil, including higher operating temperatures and lower humidity requirements. These properties enable molten salt to reduce the Levelized Cost of Electricity (LCOE) by 6.3% for a 50 MW power plant, making it a promising technology for improving efficiency and economic performance. Yuanjing et al. [10] introduced an enhanced 30 MW PTSTPP based on sectional heating and optimized its efficiency using Ebsilon Professional 13.02 software. The solar field (SF) is divided into three distinct zones to optimize the use of thermal oil and lower the average oil temperature, thereby improving overall plant efficiency. Under design conditions, the efficiency gains include a 0.52% increase in SF efficiency, a 0.07% increase in cycle efficiency, and a 0.24% increase in overall plant efficiency. Additionally, this design reduces the number of collectors needed, thereby lowering capital costs by 1.24% and reducing the LCOE by 1.54%, offering valuable insights for future trough solar power plants.
Bashir et al. [11] used the System Advisor Model (SAM) to analyze the design and viability of an 80 MW PTSTPP in Sudan. Their findings indicate that the proposed installation can produce 281.145 GWh of electricity at an LCOE of USD 0.155/kWh. After a thorough examination, the authors conclude that the facility could be profitably built at the specified location. A study conducted in Tanzania examined the techno-economic viability of implementing a CSP project, comparing parabolic trough (PT) and solar tower (ST) technologies using SAM. The study found that the discounted LCOE ranged from 11.6 to 14.4 cUSD/kWh, depending on the technology and financing conditions. It emphasized the critical role of public policies in making CSP projects more competitive in Tanzania [12].
Further, Praveen et al. [13] assessed and recommended improvements for a 100 MWe PTSTPP with TES in the Middle East area. The performance evaluation was carried out in two sites with significant direct sun radiation in Abu Dhabi and Aswan. The suggested power plant design can generate 333.15 GWh in Abu Dhabi and 369.26 GWh in Aswan. The study improved the initial design by changing the solar multiple (SM) and the length of TES, proving that the proposed PTSTPP can help the Middle East achieve a sustainable energy future while lowering dependency on fossil fuels. Ait Lahoussine Ouali et al. [14] evaluated the best design and economic viability of a 50 MW CSP plant in Ouarzazate, Morocco, projecting an annual energy output of 189 GWh. Through sensitivity analysis and performance evaluation, the authors discovered parameter combinations that improved performance and lowered the LCOE to USD 0.1303/kWh, which is much cheaper than Morocco’s current power price. This indicates the CSP plant’s viability and appeal as a renewable energy source in the country.
A comprehensive literature review unveiled that previous research projects have thoroughly investigated and discussed PT systems. These studies have not consistently utilized the SAM for analyzing financial parameters LCOE, techno-economic analysis, and simulating the performance of these solar thermal systems.
The objective of this research paper is to investigate the potential and versatility of multi-utility solar thermal systems (20 PTSTPP), specifically focusing on the utilization of parabolic trough concentrators (PTCs) in conjunction with System Advisor Model (SAM) software for a specific Atlantic city in Morocco. This study aims to achieve the following specific goals:
- -
- Conduct a detailed evaluation of the thermal and electrical performance of PTC-based solar thermal systems using SAM software.
- -
- Simulate the operation of PTC systems under specific climatic conditions to determine their efficiency and output.
- -
- Analyze the impact of different parameters such as solar irradiance, ambient temperature, and wind speed on system performance.
- -
- Investigate the thermal losses and overall energy conversion efficiency, providing a thorough assessment of the system’s potential in real-world applications.
- -
- Develop a robust simulation model within SAM software to accurately predict the behavior of PTC systems.
- -
- Integrate thermal storage options within the simulation to evaluate their impact on system performance and reliability.
- -
- Use the simulation results to generate performance maps and guidelines for designing and deploying PTC systems in various settings.
- -
- Identify key factors and design parameters that influence the performance and efficiency of PTC systems. This includes investigating—in the future—the impact of reflector materials, absorber coatings, tracking mechanisms, and thermal storage options.
- -
- Investigate the potential applications of PTC systems across different sectors, including residential, commercial, and industrial domains. (i) For residential applications, assess the feasibility of using PTC systems for water heating, space heating, and potentially cooling through absorption chillers. (ii) For industrial applications, explore the use of PTC systems for process heat, such as in food processing, chemical manufacturing, and textile production.
By achieving these objectives, this research aims to provide a comprehensive understanding of the multi-utility capabilities of parabolic trough concentrator solar thermal systems, thereby promoting their wider adoption and integration into both industrial and residential energy solutions.
2. System Description
2.1. SAM Software
SAM software equips RE analysts with a robust toolset for comprehensive analysis. SAM was developed by the National Renewable Energy Laboratory (NREL) in the United States. It incorporates financing options and was developed in partnership with Sandia National Laboratories and the University of Wisconsin. It allows for detailed techno-economic analysis of renewable energy systems and is used by project managers, policy analysts, technology developers, and researchers to evaluate decisions regarding project implementation, financial viability, and energy production. SAM is a widely used and respected software that plays a crucial role in facilitating decision-making processes in the field of renewable energies Additionally, SAM provides a wide range of features and capabilities. These features include the ability to model and simulate system performance, analyze financial parameters such as project costs and returns on investment, and evaluate the impact of different configurations and technologies on energy production and costs. SAM is a comprehensive and flexible software tool that enables users to perform detailed techno-economic analysis of renewable energy systems [15].
2.2. Weather Data for Kenitra Site
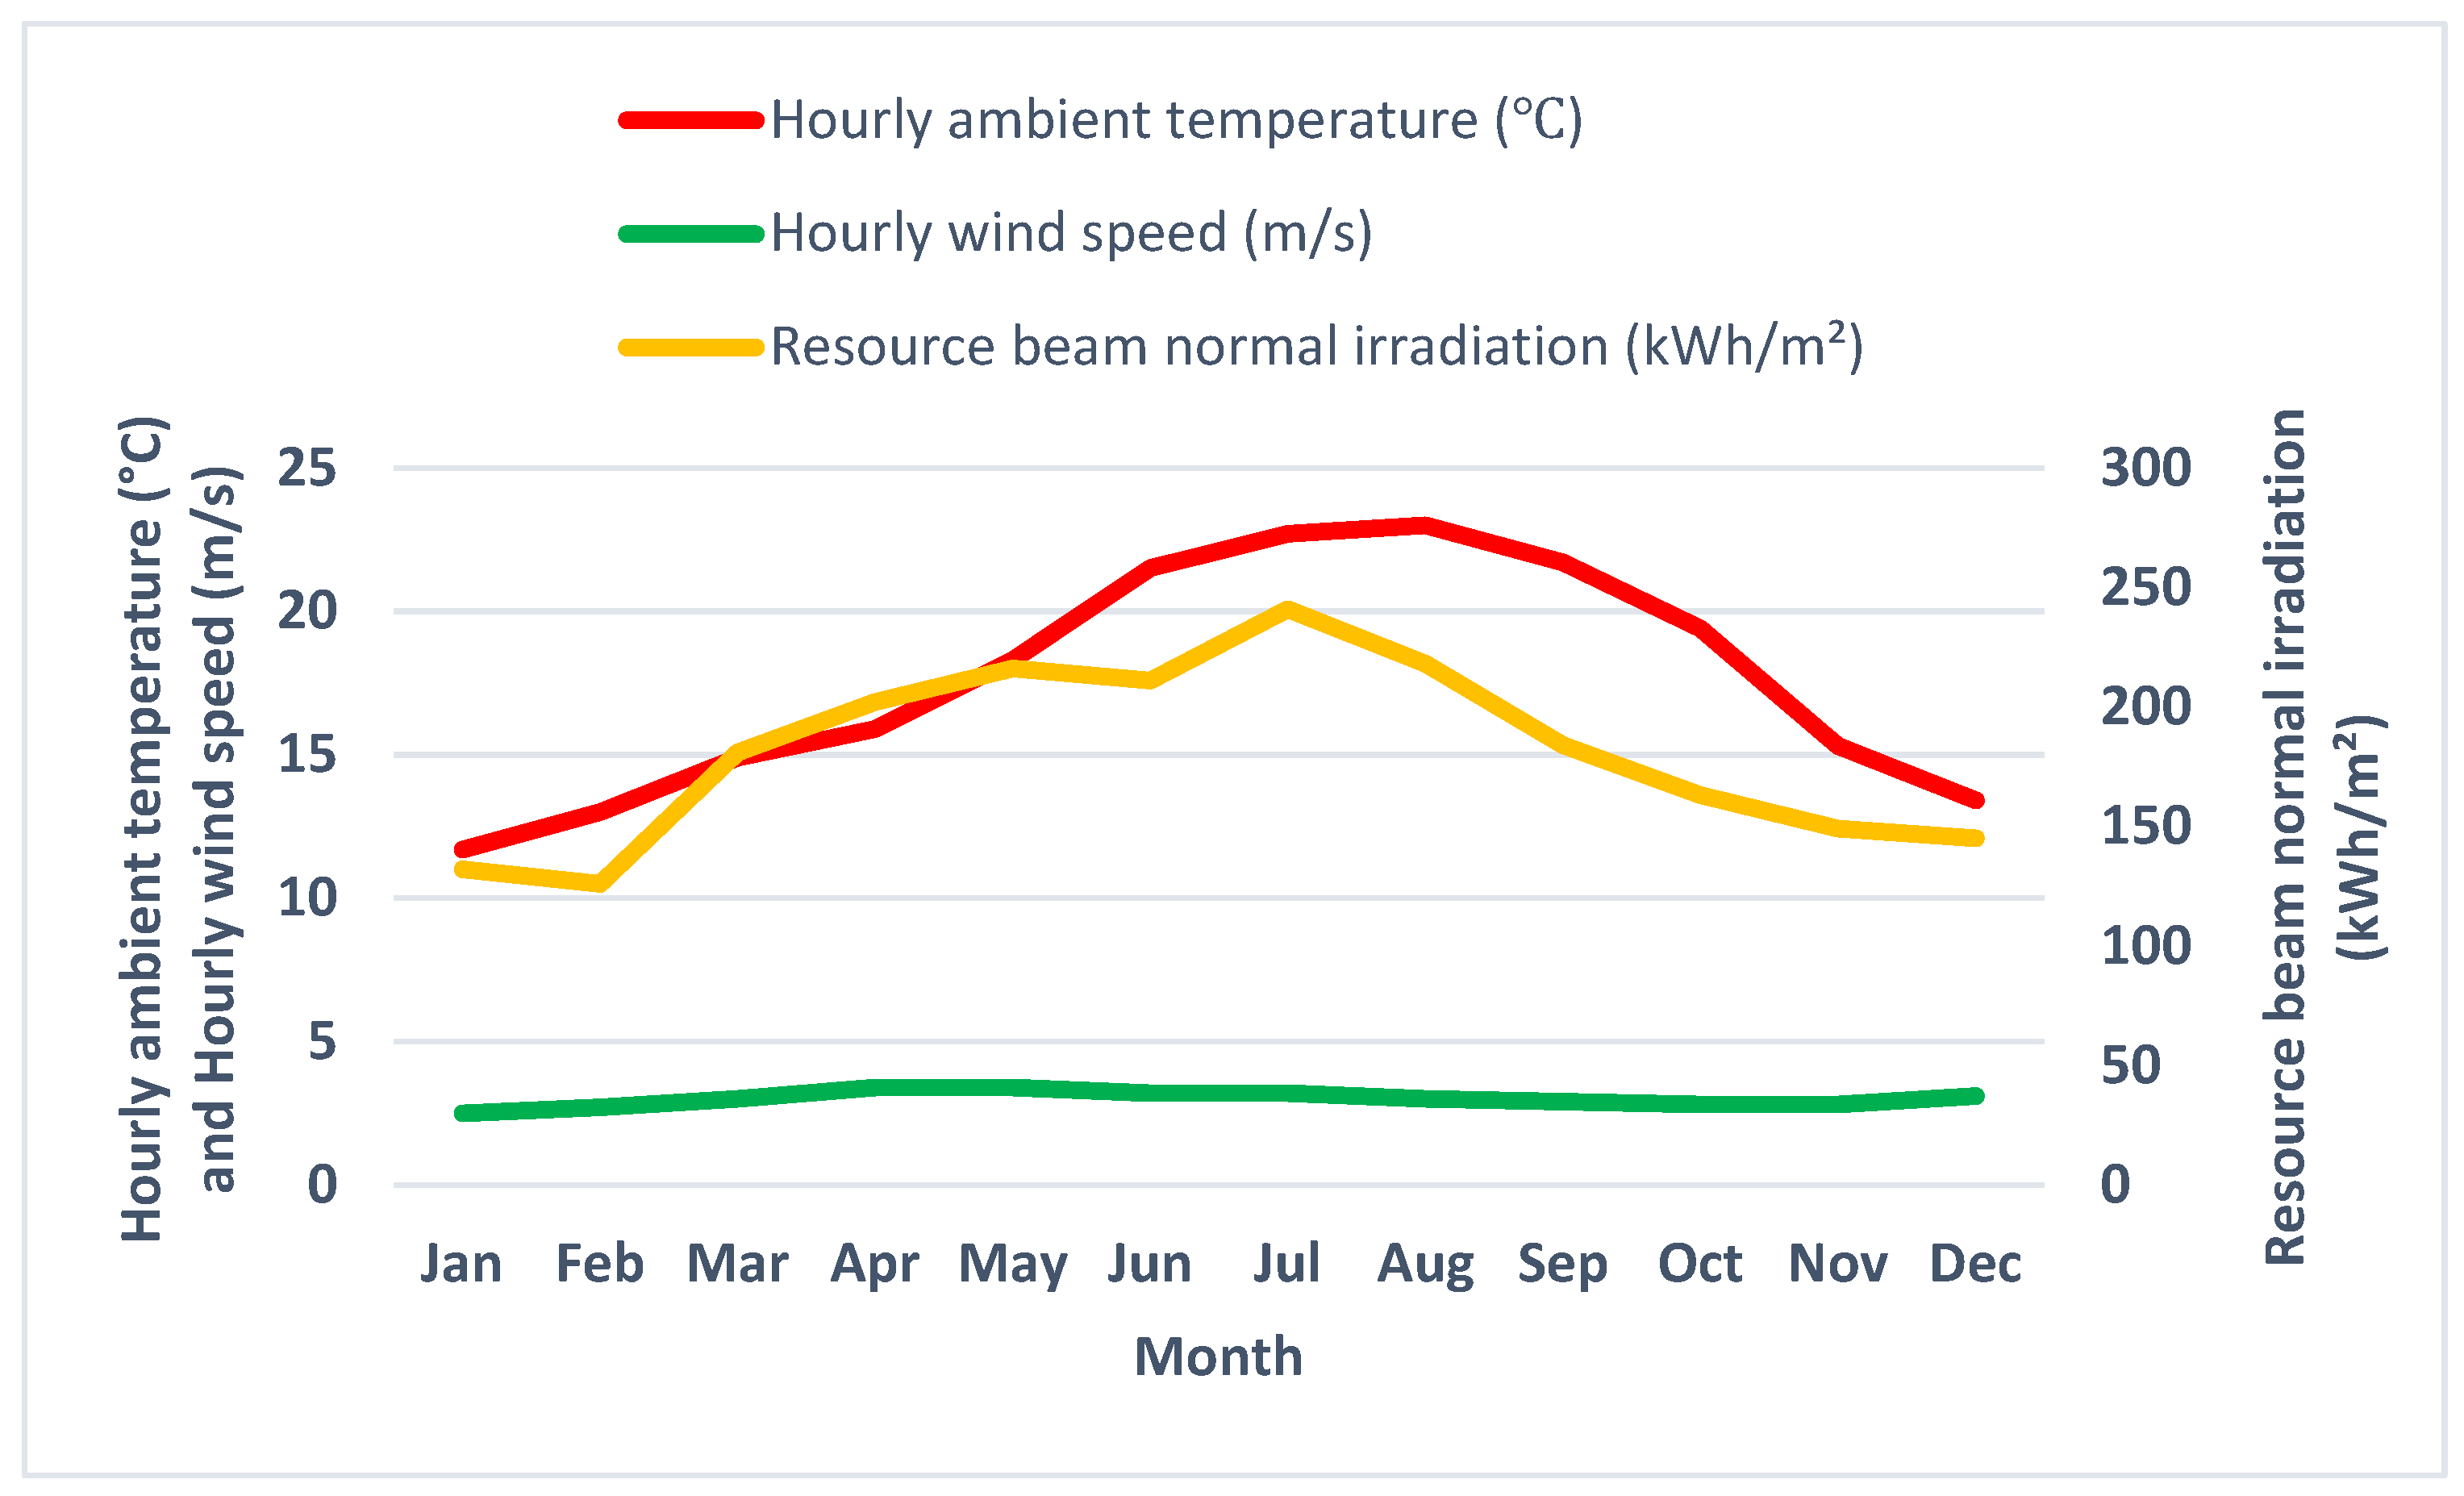
To model and simulate the PT solar collector, SAM provides a valuable tool to incorporate local meteorological data for accurate analyses and predictions. By utilizing SAM and local meteorological data, researchers and engineers can effectively model and simulate the performance of a PTC system, allowing for more informed decision-making and optimization of the system’s design and operation. SAM is a powerful tool that enables accurate modeling and simulation of PT solar collector systems [16]. The weather data obtained by the Meteonorm database allows for the incorporation of site-specific weather conditions, including solar radiation, temperature, wind speed, and precipitation (Figure 1) for Kenitra City.
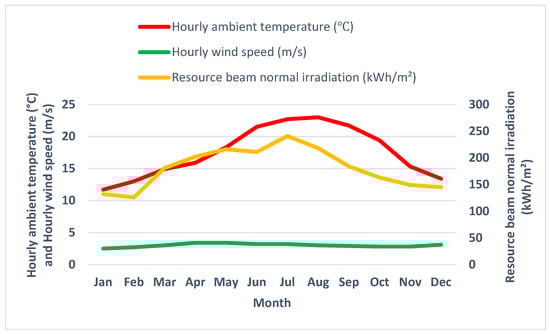
Figure 1.
Kenitra weather measurements acquired from the Meteonorm Database.
The coordinates of the City of Kenitra are shown in Table 1:

Table 1.
Geographic characteristics of the site in Kenitra.
3. Parabolic Trough Concentrator Technology (PTC)
3.1. Physical Model for a PTC
PTSTPP technology is a type of RE system that uses a circular glass tube to absorb sunlight onto a receiver tube. Figure 2 shows a PTSTPP model that illustrates how this technology works.
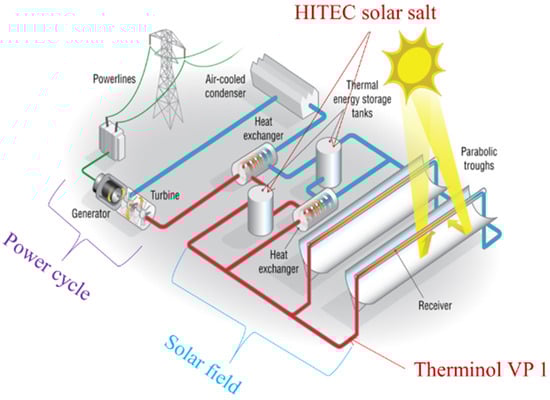
Figure 2.
The components and operation of a parabolic trough solar thermal system (SAM 2012.12.02).
The receiver tube contains an HTF that is heated by solar radiation and used to generate steam. The PTC is characterized by its concentration factor, which is the ratio of the collector area or the opening area of the concentrator to the lateral area of the absorber; this factor is approximately 80. To ensure that the concentrator’s opening plane always faces the sun directly, a solar tracker is often used in a PTC, which changes the concentrator’s inclination accordingly. The steam can then be used for a variety of purposes such as electricity production, desalination, heat regeneration, cogeneration, and refrigeration. Electricity production is the most commonly used parabolic trough technology, as it can provide on- or off-grid electricity. Desalination is a process of removing salts and other impurities from water, which can be performed by steam or heat transfer fluid from the PT systems. Regenerative heat parabolic trough systems recover waste heat and recycle it to improve overall efficiency and reduce environmental impact. Co-generation of PT electric heat is simultaneously produced, which can be used for industrial or domestic purposes. Refrigeration is a cooling process, using heat from a PT system to drive an absorption refrigerator or heat pump [17,18,19].
3.2. Components for a PTSTPP
The principal elements of a PTSTPP (as illustrated in Figure 2) are the power cycle (PC), the solar field (SF), and the thermal energy storage (TES) system (optional) or a fuel backup system (FBS), which can improve the system’s performance.
3.2.1. Solar Field
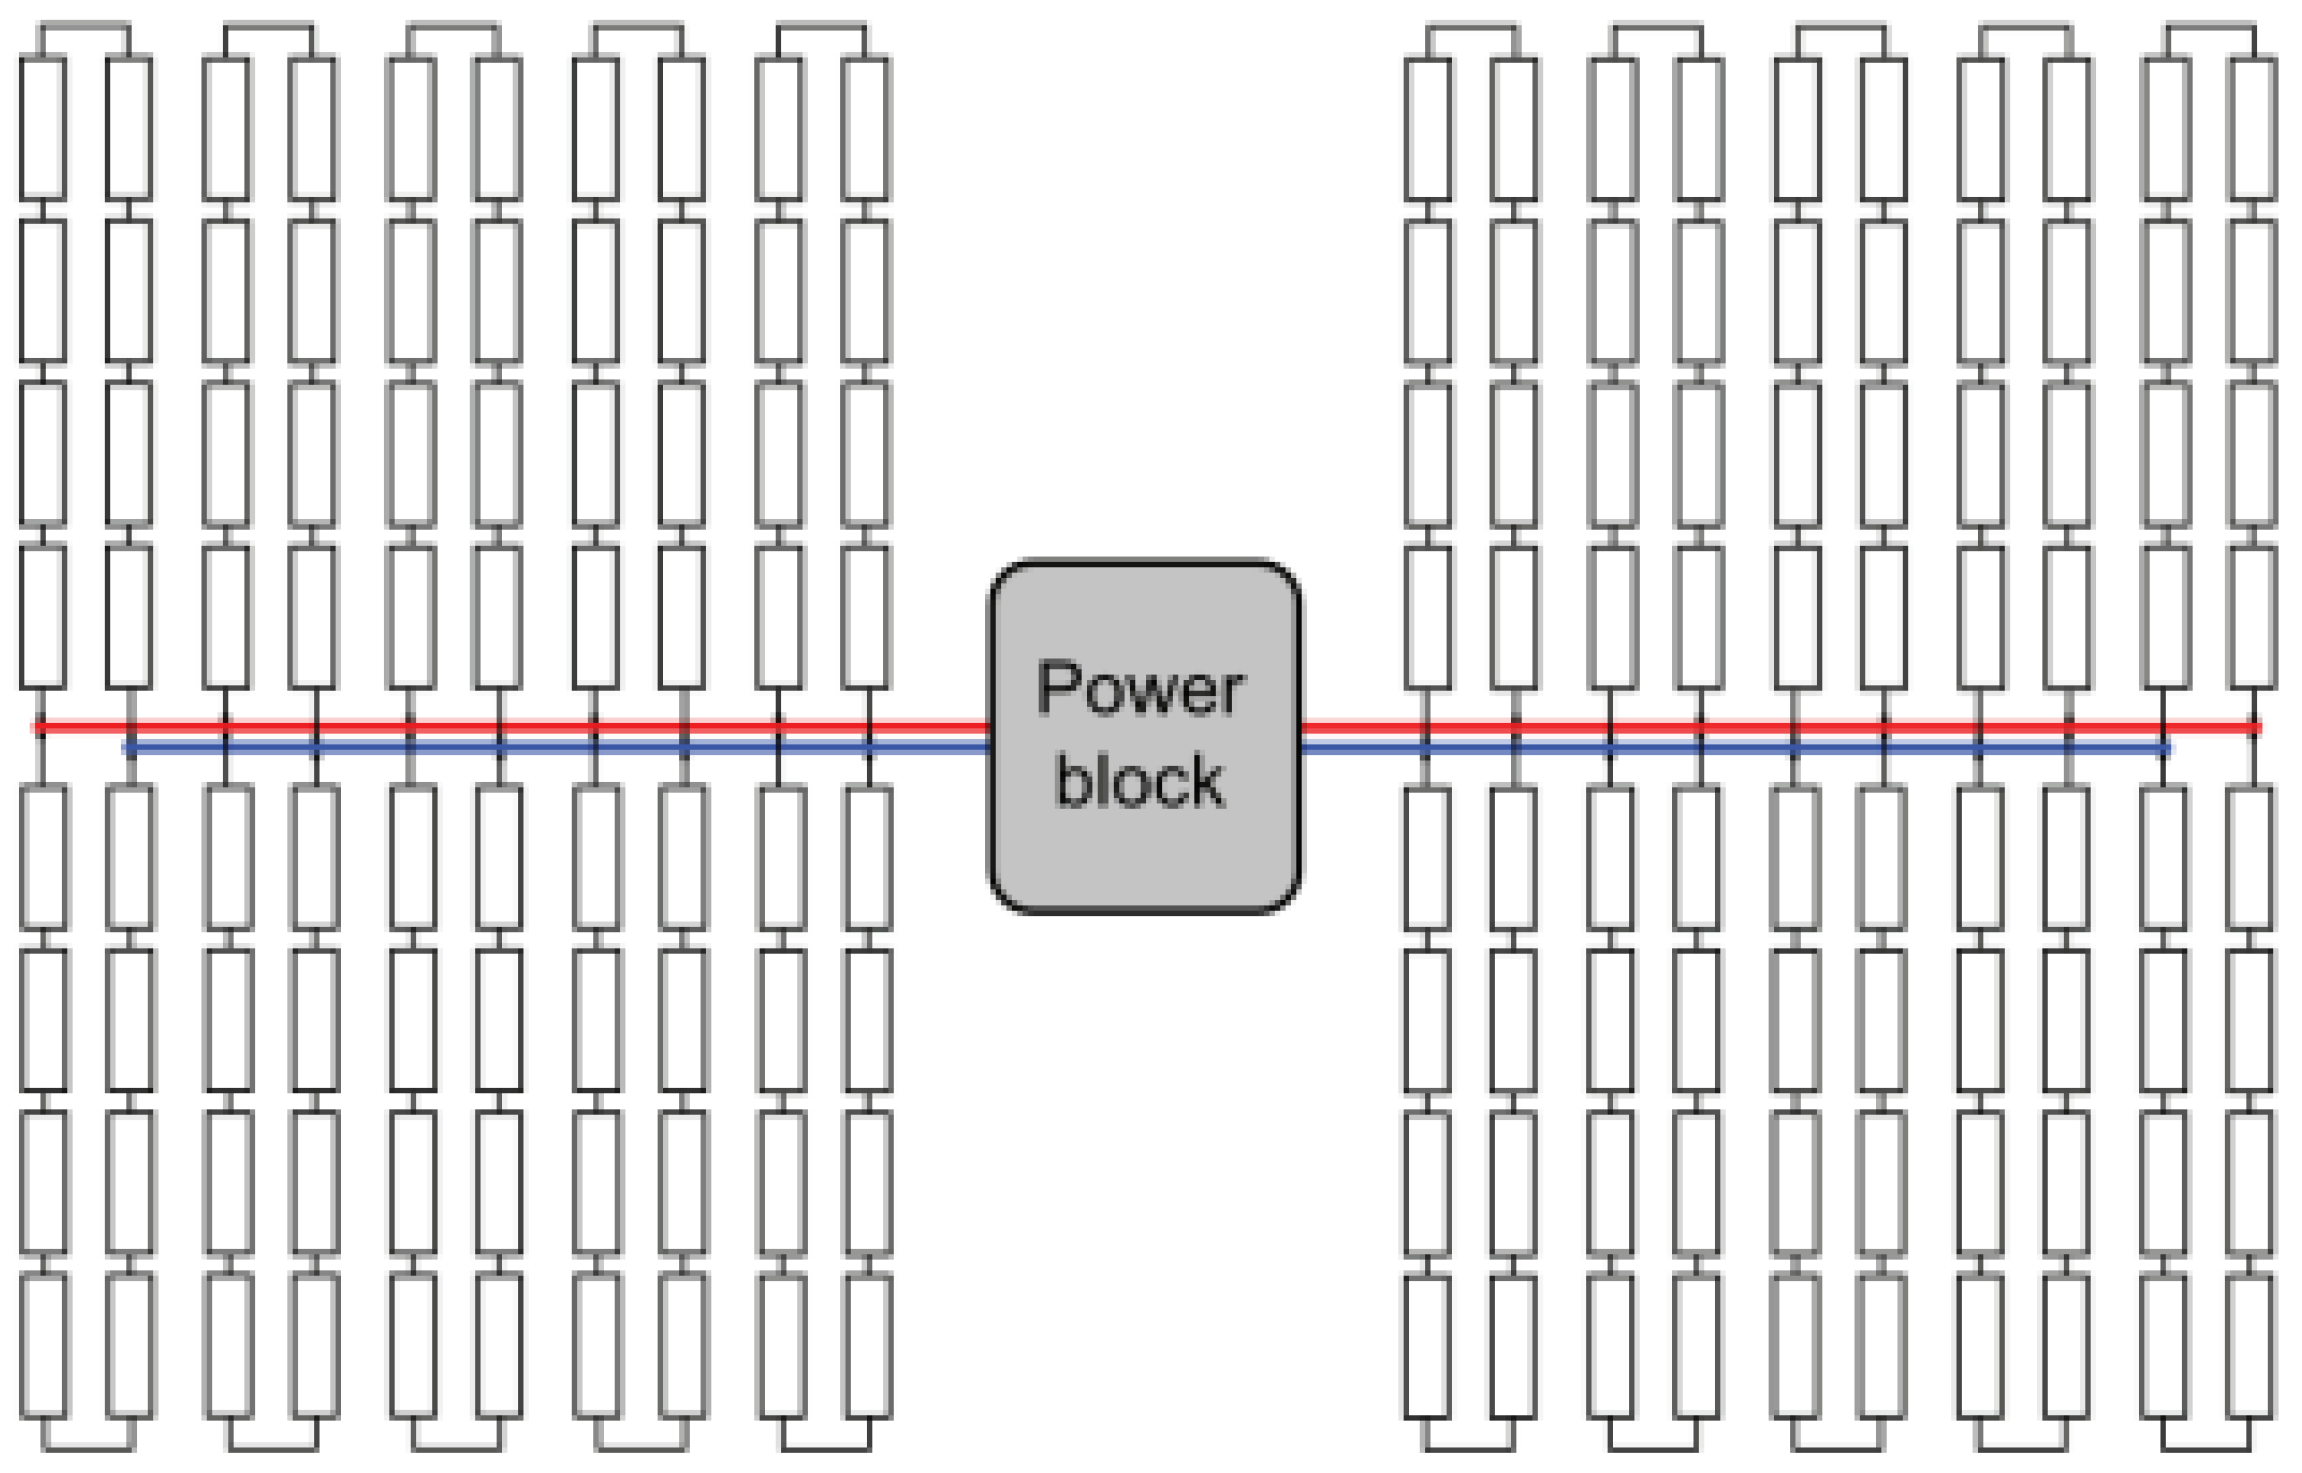
The power plant that is simulated in this study is a PTC solar power plant type, the EuroTrough ET150 collector [20], with a capacity of 20 MWe. An SF consists of multiple loops, each with a pair of solar collector assemblies (SCAs), as shown in Figure 3. Each loop depends on a thermal energy demand. A proposed field layout would divide the field into two header sections.
The solar field contains 50 loops, where each loop has a length of 150 m with a reflective area of 163,500 and a solar multiple equal to 2. The solar analyses assumed that the PT solar collector was oriented along the local north–south axis. This orientation allows the collector to capture more solar energy in summer than other orientations throughout the year [21]. The HTF circulating in the SF has a low temperature of 293 °C and a high temperature of 400 °C. The power plant employs Therminol VP-1 as the HTF because of its low freezing point of 12 °C, which reduces the electricity consumption. The Therminol VP-1 proprieties are detailed in Table 2. The SFs number of collectors was determined using SAM software, which includes various commercially available heat transfer fluids and allows users to define new properties.
Table 2.
Therminol VP-1 proprieties.
The features of the collector and receiver that were utilized in this work are shown in Table 3.
Table 3.
Characteristics of the parabolic trough collector and the heat receiver.
PT collectors are a type of solar thermal device that only make use of the DNI, which is the component of solar radiation that comes in a direct line from the sun. For a surface that has a certain angle with respect to the horizontal plane, the DNI can be written by using the following formula:
where
- is the horizontal beam radiation;
- is the zenith angle;
- is the incidence angle.
One way to find a point in the sky from the Earth is to use the hour angle and the declination of the sun. These represent a pair of angles that determine the Sun’s location as it pertains to the Earth.
- Declination is the angular location of the sun relative to the equator plane. It depends on the day of the year
- Hour angle is the angular position of the sun relative to the local meridian. It changes by 15° per hour because of Earth’s rotation around its axis.
Thus, the following equation can be used to compute () in degrees [23]:
The cosine of zenith angle can be written:
where is the latitude angle.
The incidence angle is the angle formed between the rays of the sun and the normal (perpendicular) to the surface of the collector. The calculation of this angle was based on the assumption that the collectors are aligned along the standard north–south axis orientation and constantly track the sun’s trajectory [24]. In this context:
Accurately accounting for the influence of the sun’s angle on optical efficiency requires consideration of both the geometric reduction due to the cosine law and the specific losses captured by the incidence angle modifier (IAM). The specific formulation of IAM for a Eurotrough 150 collector is shown below [25]:
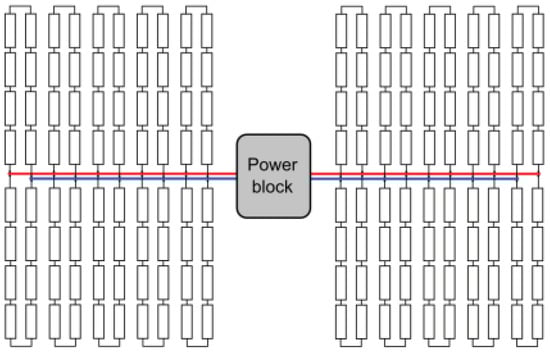
Figure 3.
Solar field arrangement [26].
Figure 3.
Solar field arrangement [26].
3.2.2. Power Cycle
The PC is the component of a solar thermal power plant that converts heat from the solar collectors into electricity. The PC consists of a steam turbine, a generator, a condenser, a pump, and a boiler. The power cycle operates on a Rankine cycle (RC), which is a thermodynamic cycle that uses a working fluid (WF) (usually water or steam) to transport heat from a high-temperature source to a low-temperature sink. The performance of the proposed power plant is assessed by choosing one of the following cooling systems: hybrid, evaporative, or air-cooled condenser. Table 4 presents the characteristics of the PC system utilized in this research.
Table 4.
Power cycle characteristics.
Overall, the selection of the cooling system to use depends on many factors, such as the water supply, the cost of water, the environmental impact, and the desired power output [7]. In general, dry cooling systems are becoming increasingly popular in areas where water is scarce, such as the Middle East and North Africa (MENA). Wet cooling systems are still the most common type of cooling system used in power plants, but their use is declining in water-scarce regions.
The theoretical model for the PC in a RC, as implemented in SAM, involves the following key components and equations:
- The Energy Balance for the Turbine (Work Output):
- 2.
- Pump Work Input:
- 3.
- Energy Balance for the Boiler (Heat Input):
- 4.
- Energy Balance for the Condenser (Heat Rejection):
- 5.
- The net work output:
The net work output from the RC is calculated as the difference between the work output from the turbine and the work input to the pump.
- 6.
- Thermal Efficiency ():
The thermal efficiency of the RC is given by the ratio of the net work output to the heat input.
where , , , , , , and are the enthalpies of the WF at the turbine outlet, turbine inlet, pump outlet, pump inlet, boiler outlet, boiler inlet, condenser outlet, and condenser inlet, respectively, and is the mass flow rate of the WF.
These equations represent the basic principles of energy conservation and efficiency for each component of a Rankine cycle. The specific form of these equations depends on the thermodynamic properties of the WF and the assumptions made about the cycle configuration. The regression model mentioned likely involves variations or simplifications of these equations to achieve a balance between accuracy and computational efficiency.
3.2.3. Storage System
A TES serves the purpose of retaining heat obtained from the SF using a liquid medium. This stored heat is utilized to drive the PC turbine through cloudy days and low sunlight. This particular system proves to be advantageous in areas where the demand for energy reaches its peak after sunset. In the case of direct storage systems, the storage medium utilized is the HTF of the SF itself. In the case of indirect systems, the storage medium is the HTF of the SF, while direct systems employ separate fluid and heat exchangers [27]. The components of this system include tank pairs, pumps, and heat exchangers.
This study’s proposed PT power plant is engineered to include a thermal energy storage system comprising two tanks. This system integrates an indirect active storage tank that retains the Therminol VP-1 circulating in the SF, alongside a separate tank dedicated to molten salt storage. The dimensioning of the molten salt tank aligns with the peak load design strategy and takes into account the demand for electricity during the night. To preclude the need for undue backup capacity, the design of the energy storage system limits its maximum capacity to a duration of 6 h. Detailed specifications of the storage system and the HTF, Hitec solar salt, employed in this research are presented in Table 5.
Table 5.
Storage system and heat transfer fluid properties.
4. Results and Discussion
The solar capacity of Morocco holds great importance, similar to other nations within the MENA region, characterized by long sunshine hours annually, ranging between 2700 and over 3500 h. In addition, the daily solar radiation measures 5.3 , with an annual average falling within the range of 2000 [28,29].
As shown in Figure 1, Kenitra City received a maximum DNI in the month of July and received the highest DNI of 241 and a minimum DNI in the month of February of about 126 . The wind velocity registered maximum and minimum values of 37.8 and 4 . The maximum and minimum dry bulb temperatures measured were 37.8 and 4 , respectively.
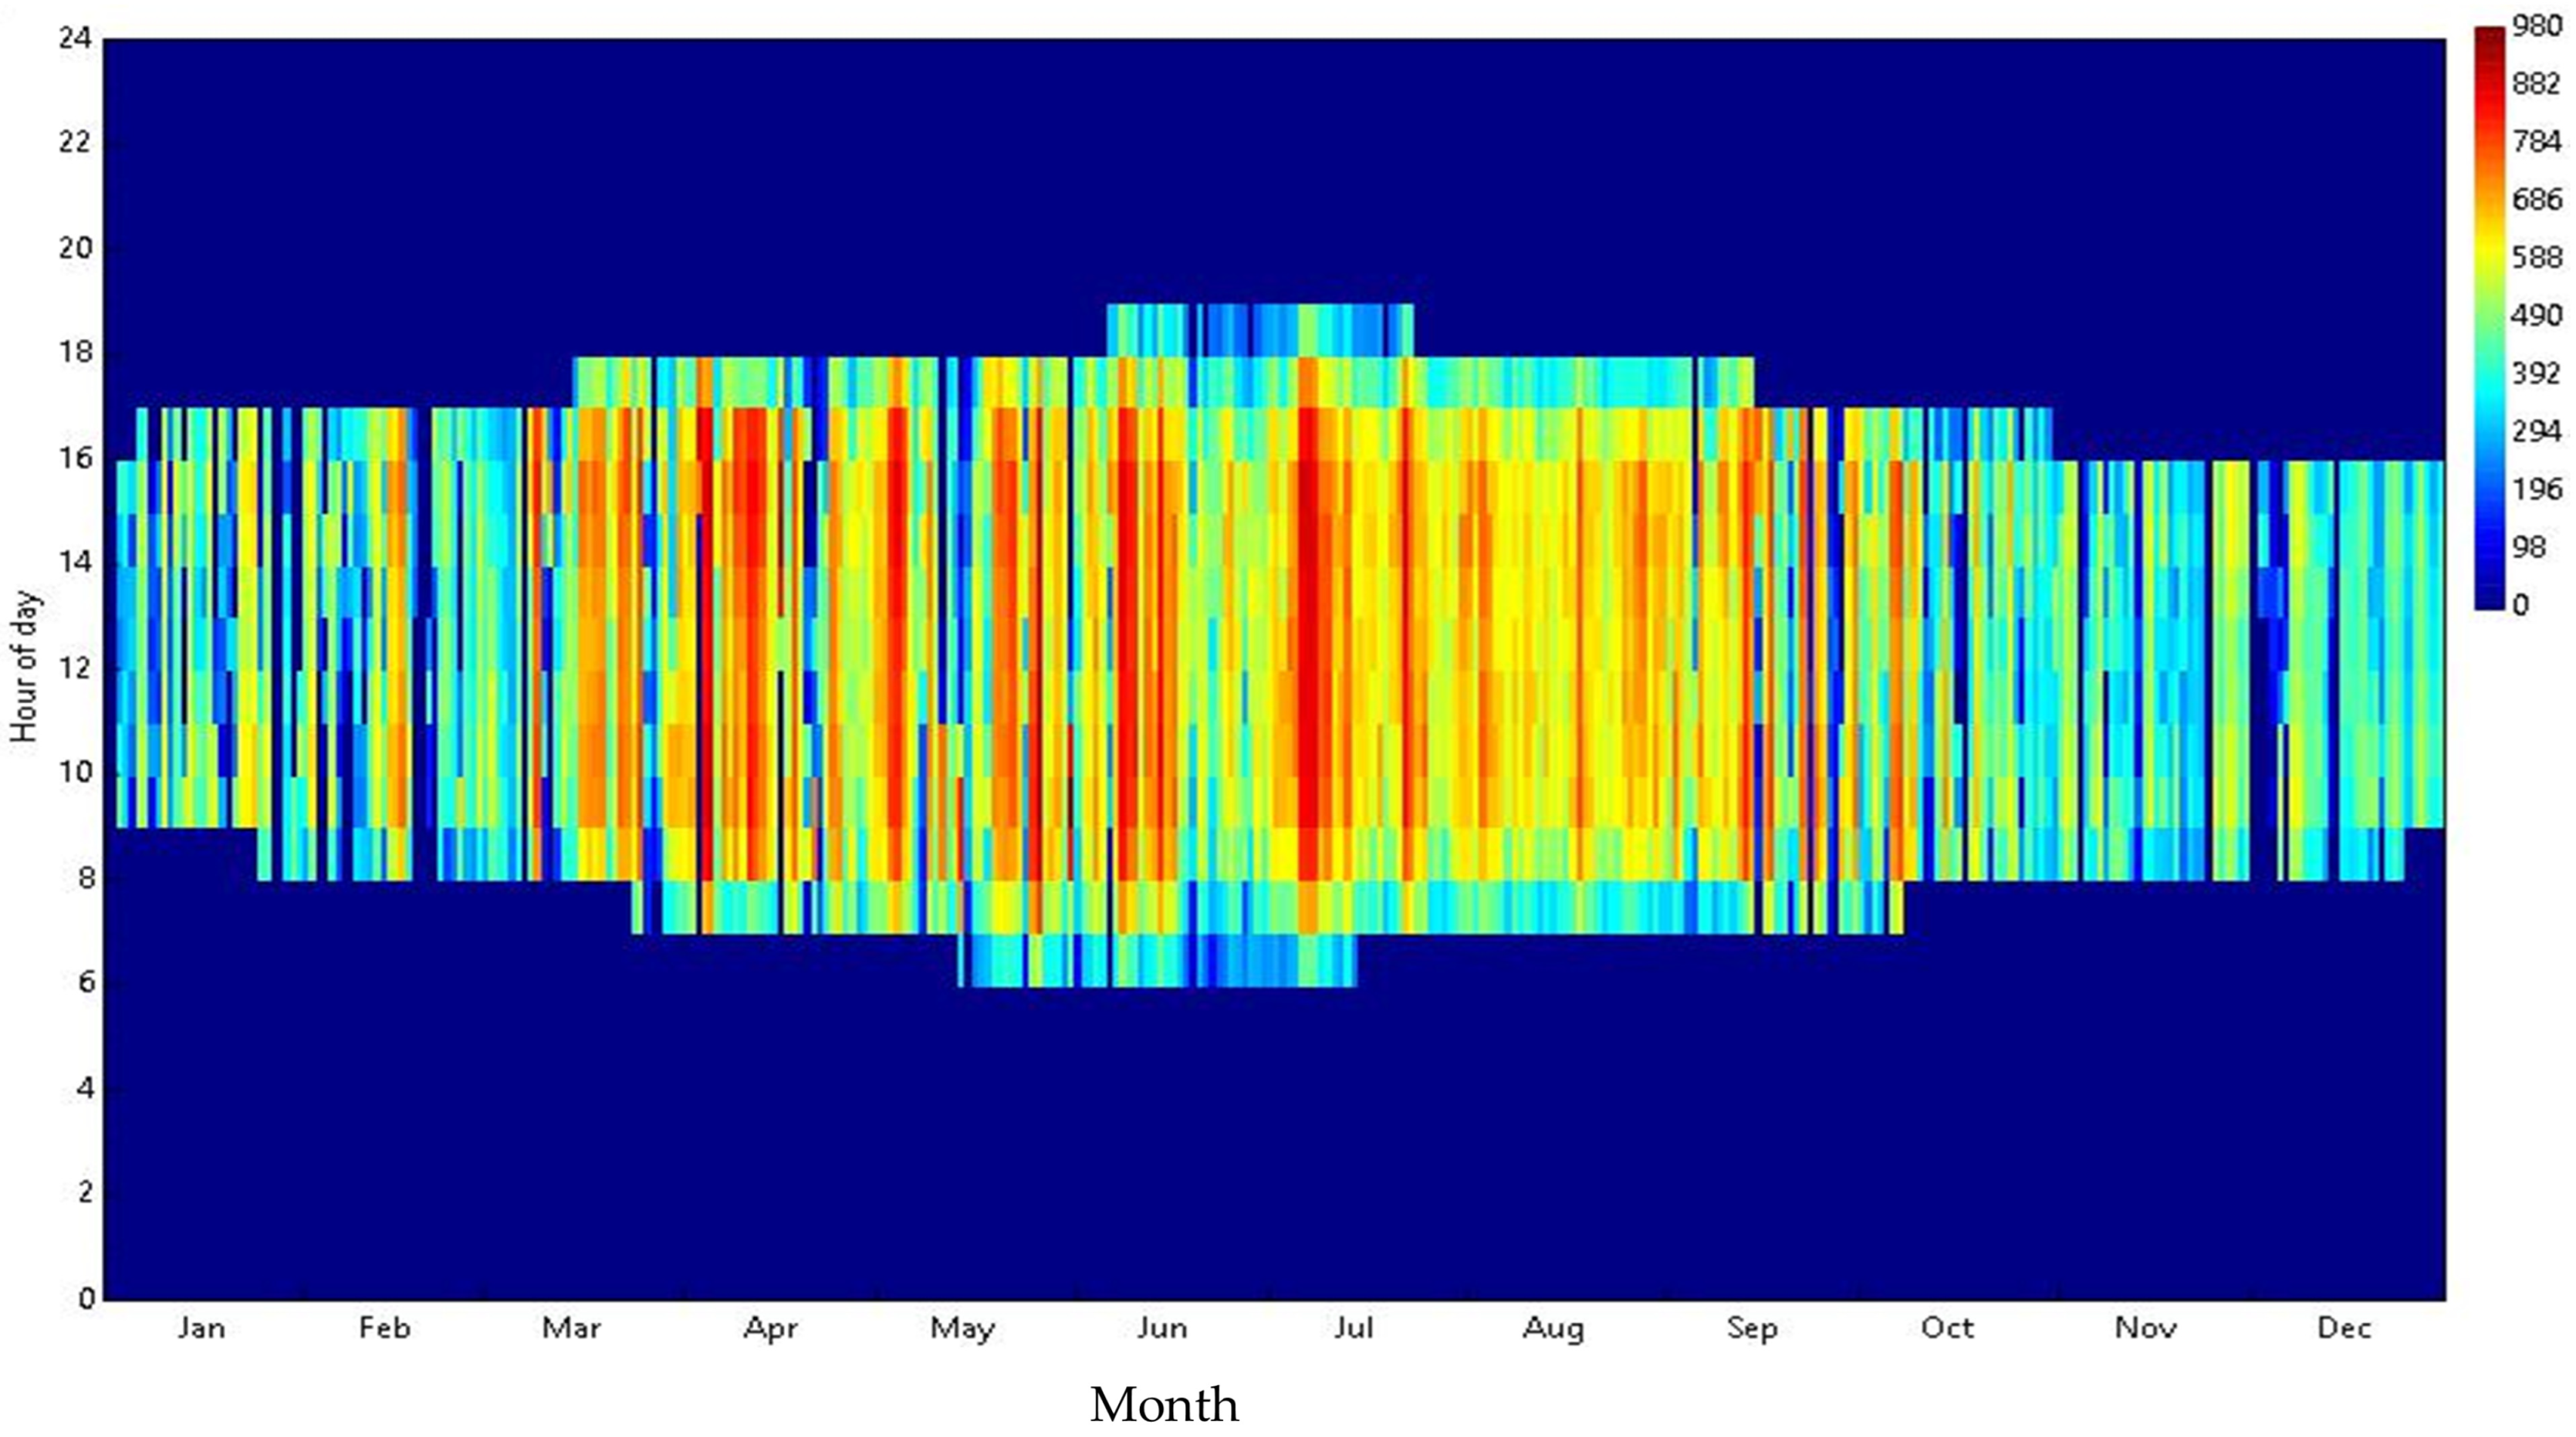
In addition, Figure 4 showcases a heat map depicting the DNI () throughout the entirety of the year.
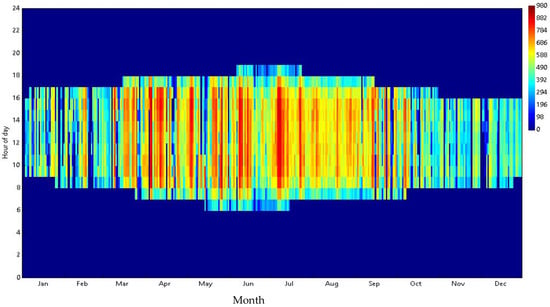
Figure 4.
Annual beam normal irradiation heat map ().
4.1. Electricity Production and Performance Analysis
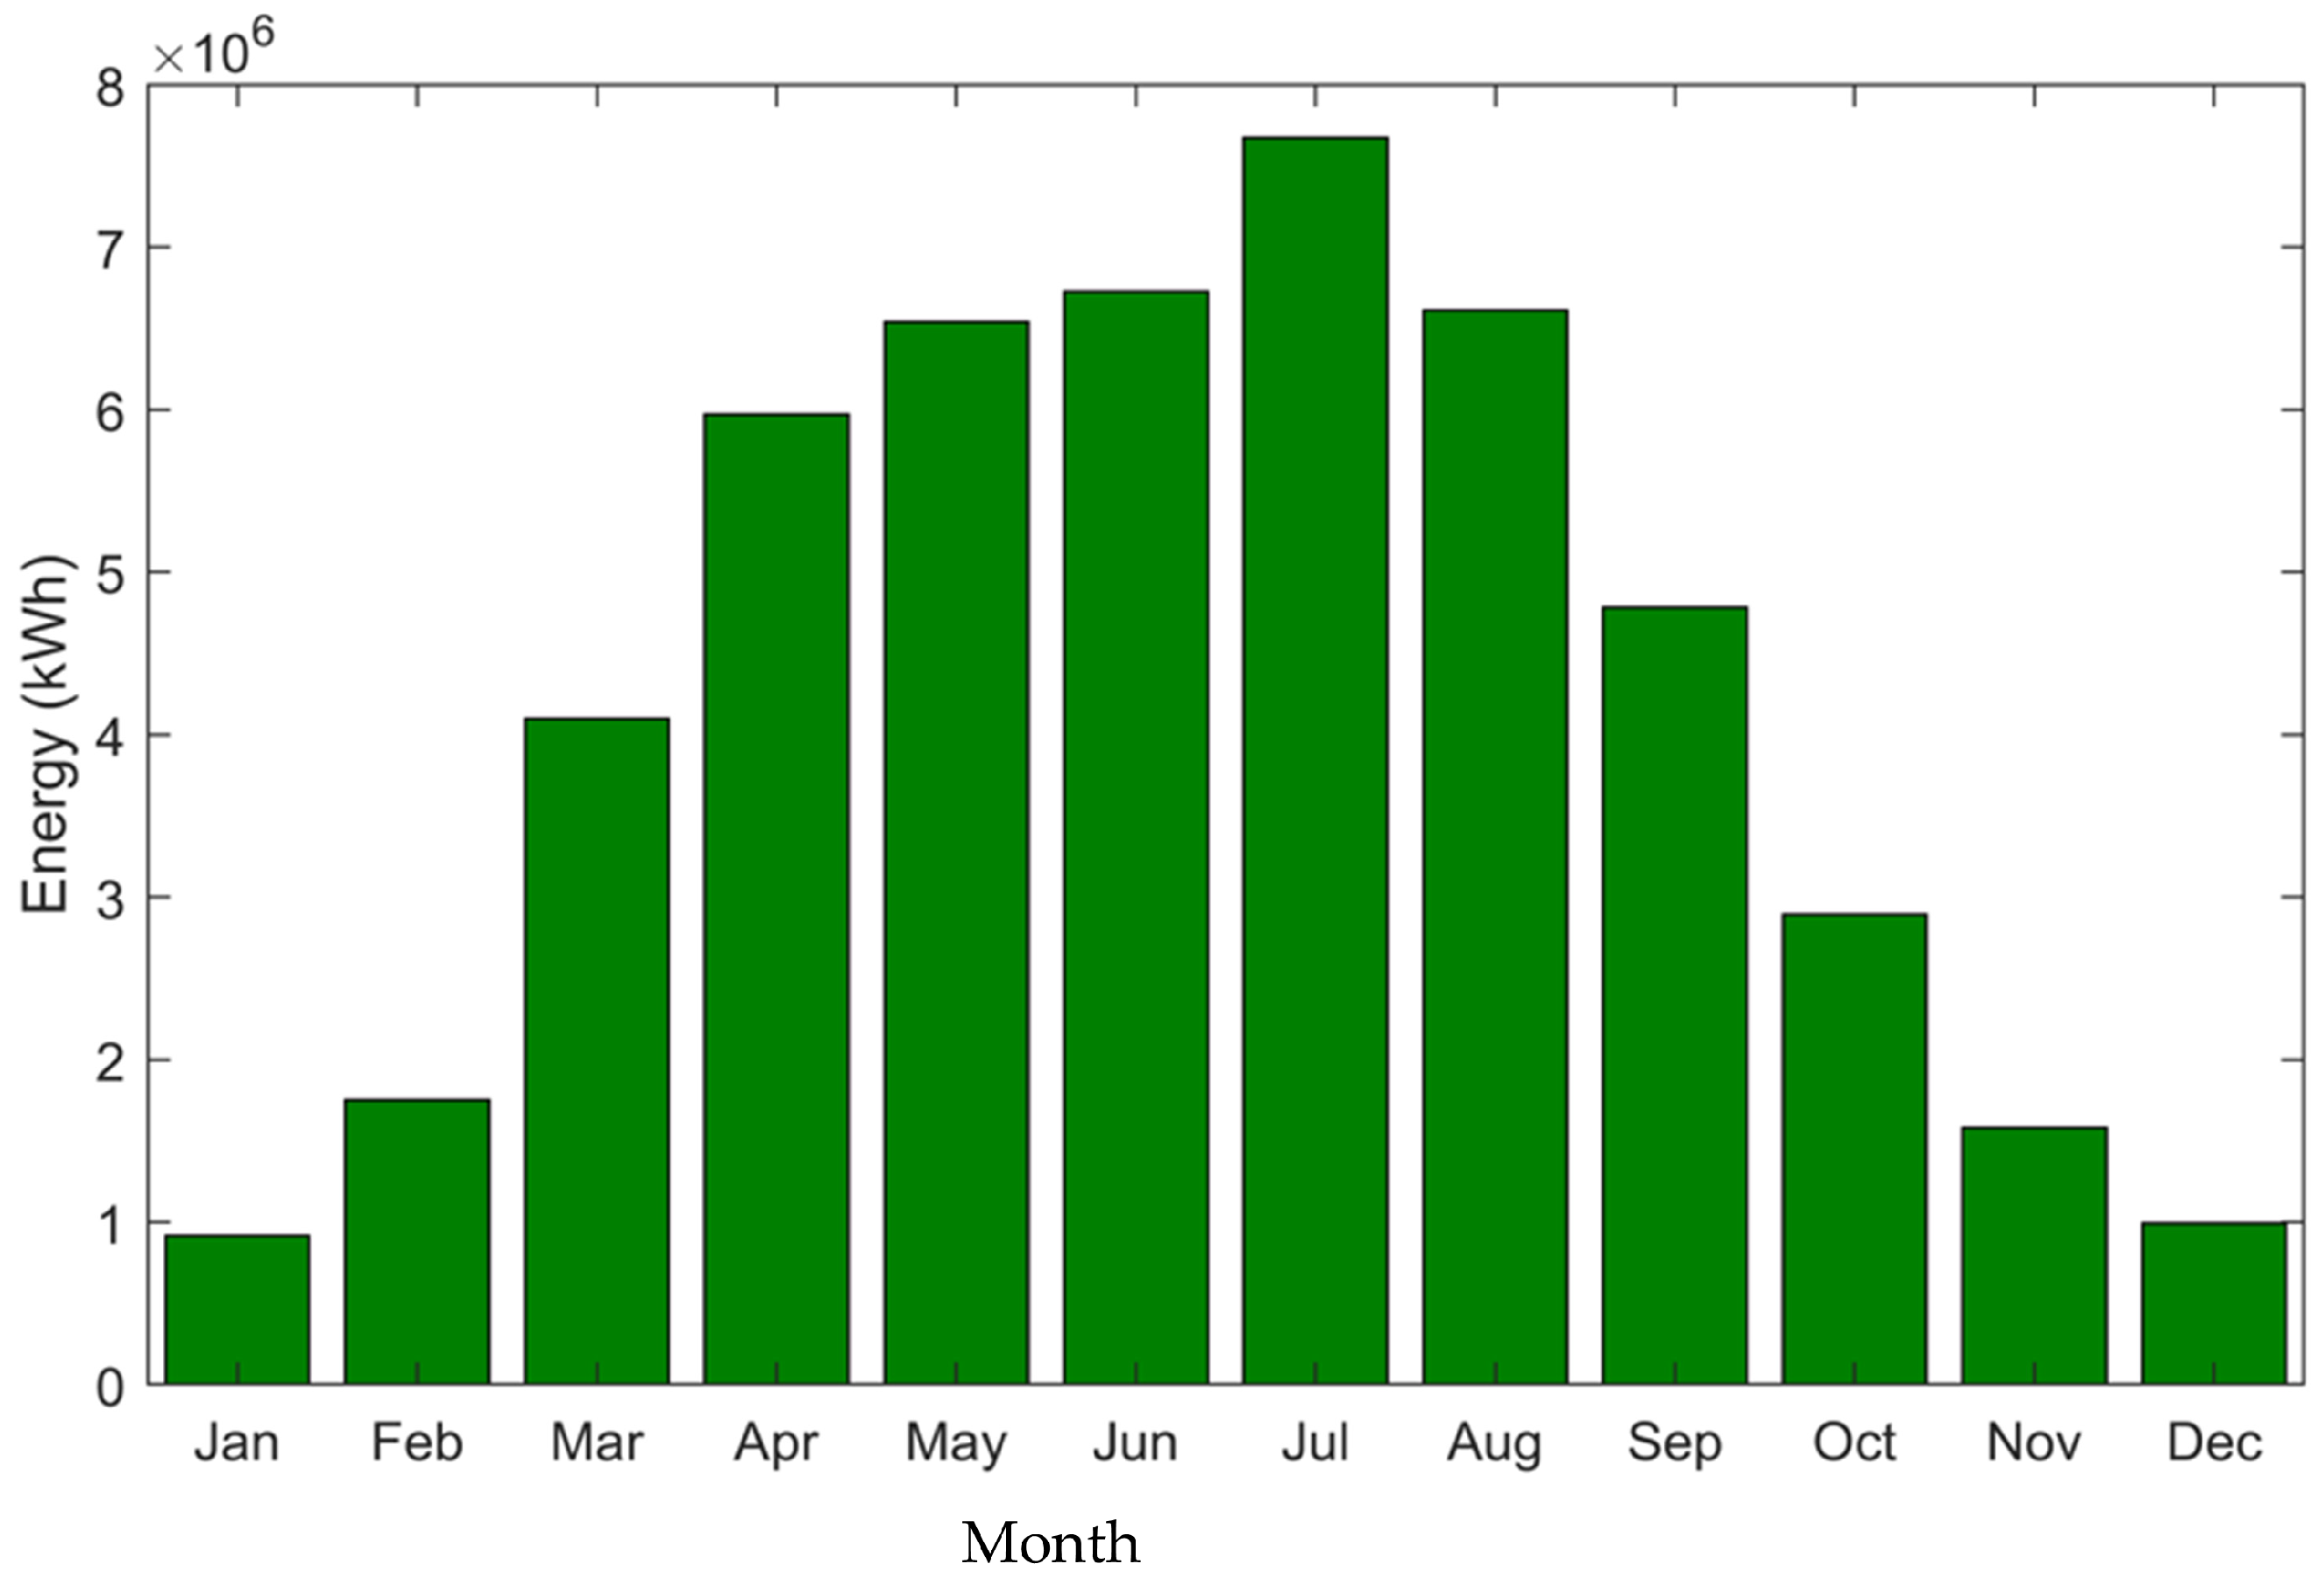
The monthly energy generated using SAM software from the PTC is presented in Figure 5. It states that a maximum energy of 7672.18 was generated in July, while a minimum energy of 918.090 was generated in January.

Figure 5.
Monthly energy generation of the parabolic trough concentrator (PTC).
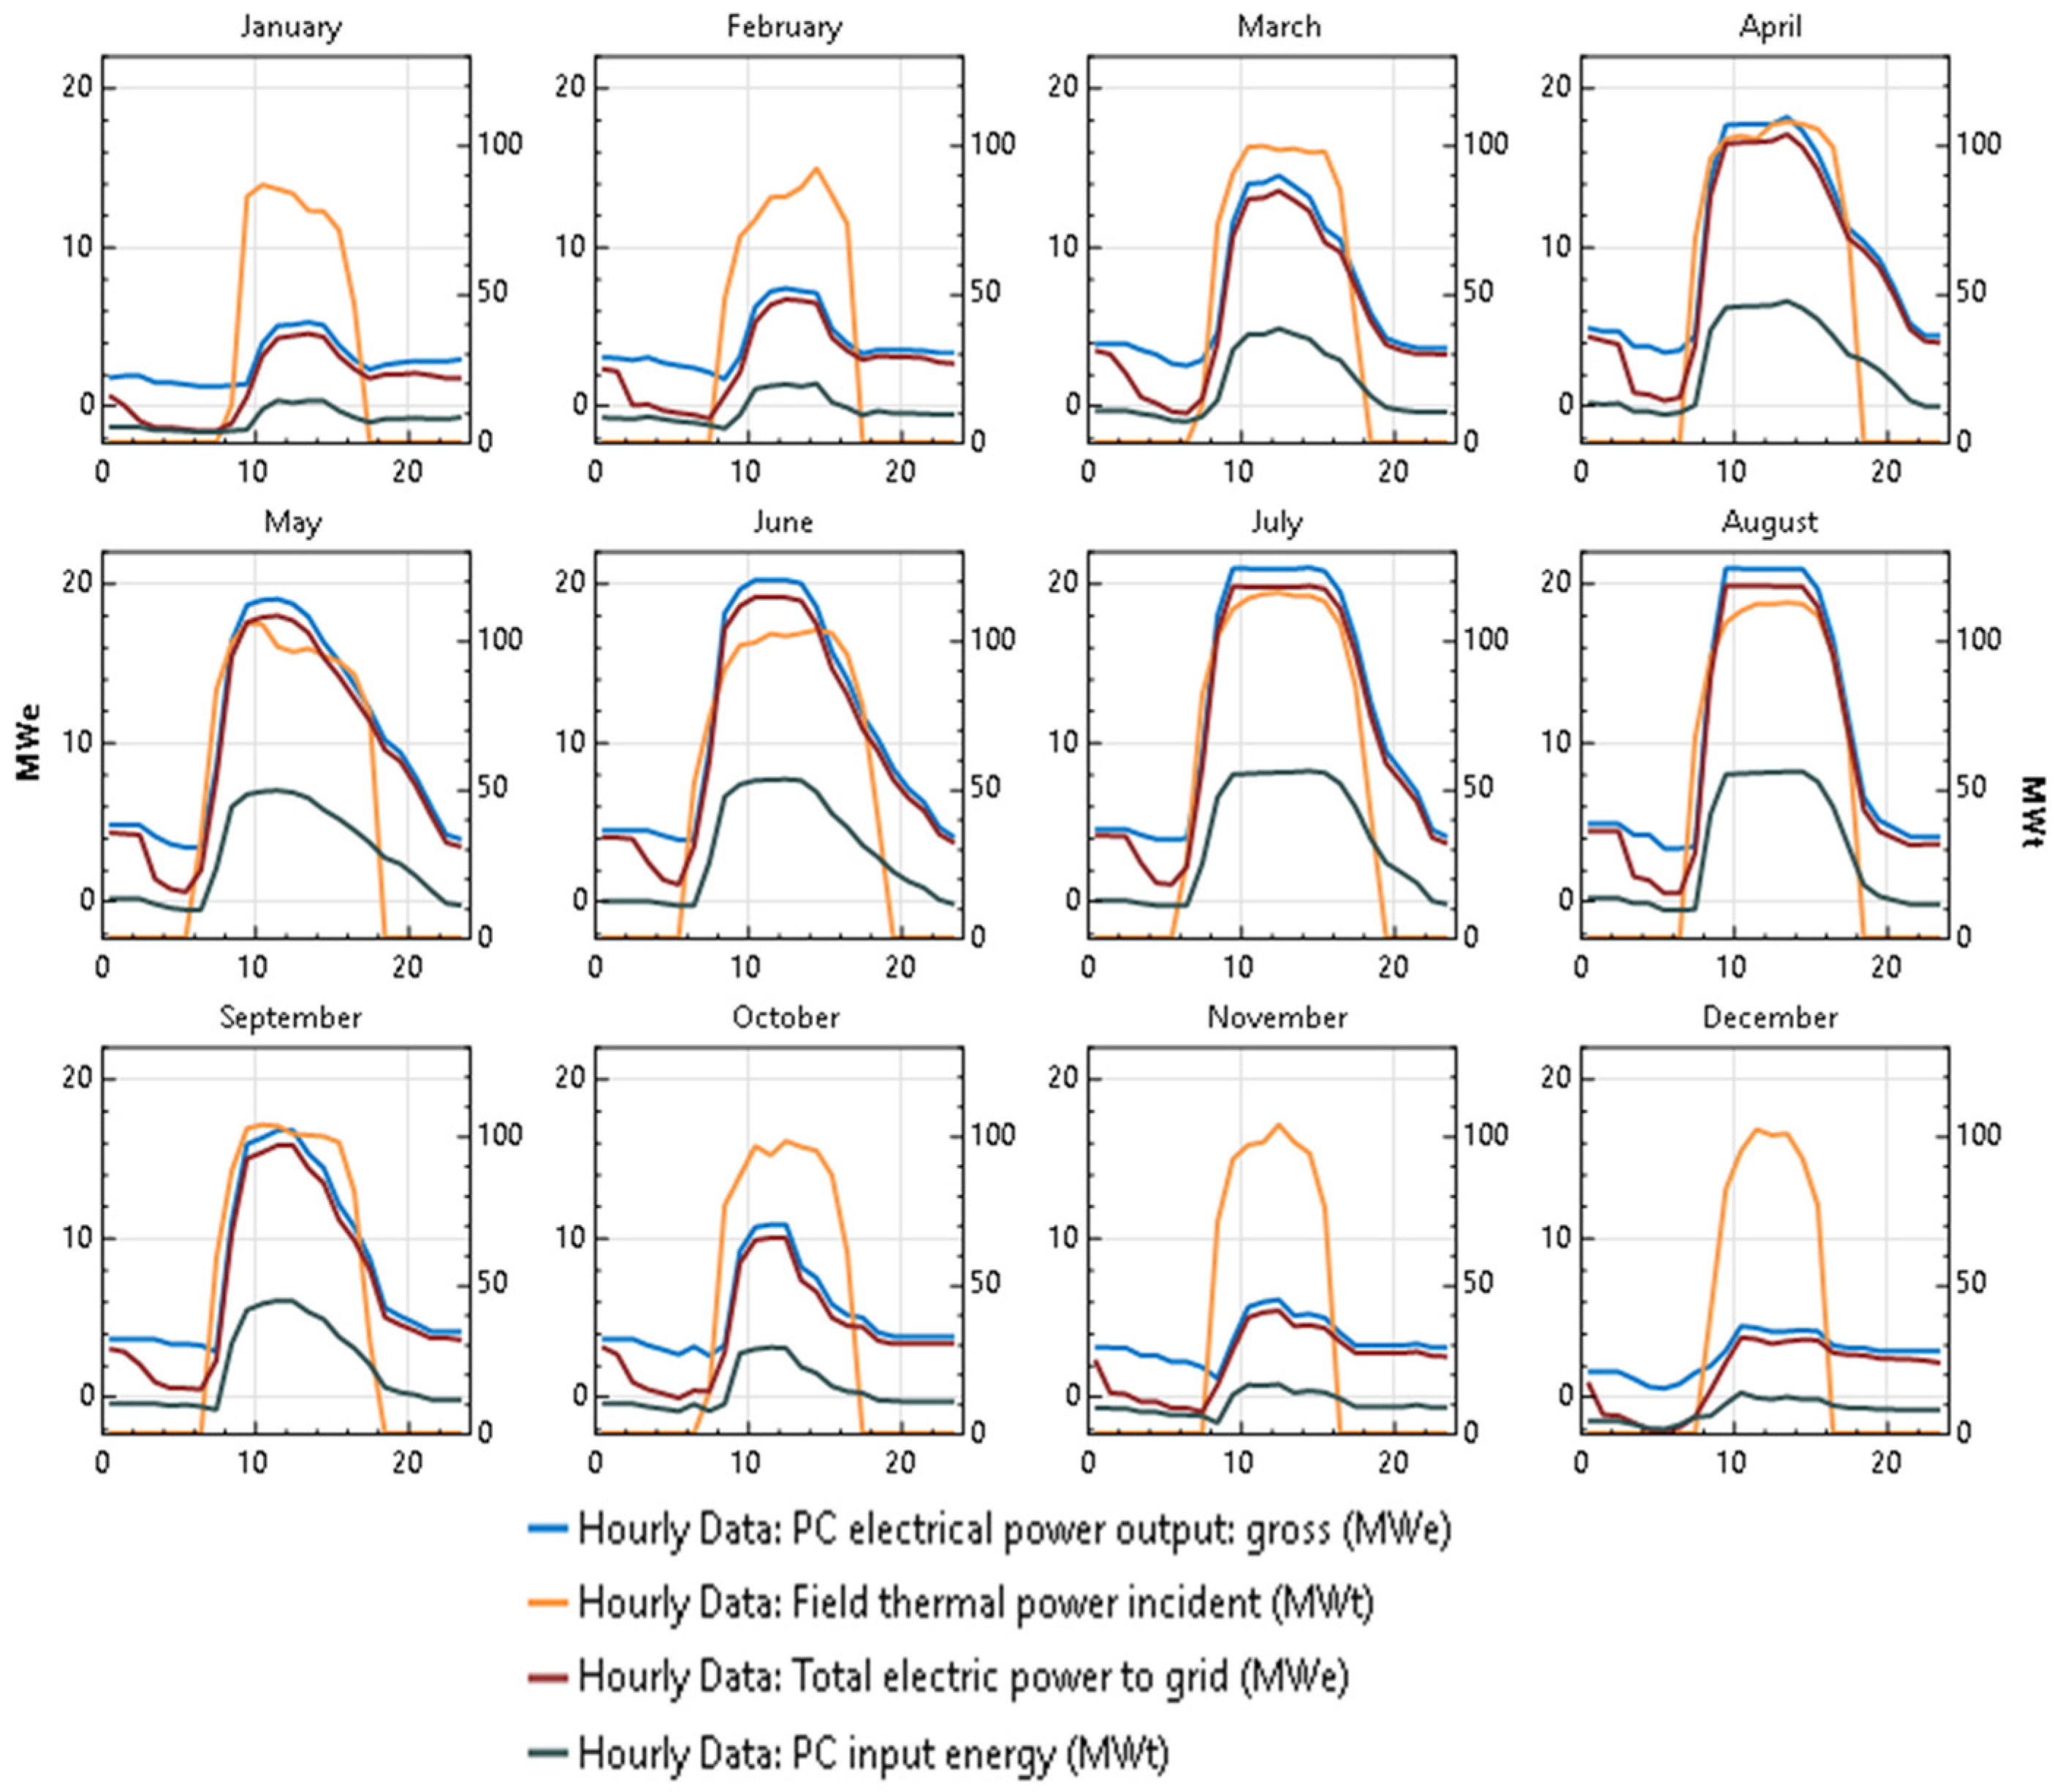
As illustrated in Figure 6, the power plant achieved a maximum thermal power input to power cycle of 56.025 , the maximum total electrical power to grid reached 19.755 , the maximum gross electrical power output to power cycle peaked at 20.947 and the maximum field thermal power incident was 115.895 throughout the month of July. The total electrical power to grid generated is influenced by both the field thermal power incident and the thermal power input to the PC. A maximum gross cycle efficiency power cycle of 0.3974 was noted in February.
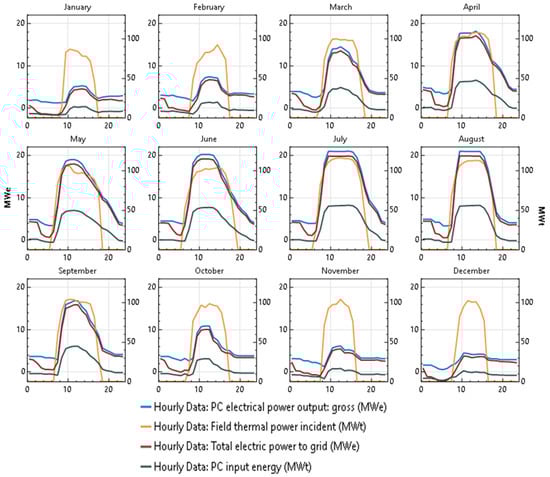
Figure 6.
Hourly data of thermal power input, total electric power to grid, gross electrical power output to power cycle, and field thermal power incident.
The annual net energy generated by the assumed 20 MW concentrating solar power (CSP) plant is approximately 50.51 , which has a total field thermal output of 112.6 . This implies that the plant has a CF (capacity factor) of 32%, which is the ratio of the net annual energy to the system capacity over a year, as shown in Equation (18), and a gross to net conversion rate of 80.4. The net output energy of the PT solar power plant is presented in Table 6.
where () the net annual energy, which is the total amount of electrical energy that the power plant produced over the specified time period, () is the number of hours in the period, which represents the total number of hours in the time period for which you are calculating the capacity factor, and () is the system capacity, which is the maximum possible electrical energy output if the power plant operated at its rated capacity continuously.
Table 6.
Net output energy of the parabolic trough solar power plant (PTCSPP).
In our research study, we comprehensively analyzed the intricate relationships among several environmental and operational parameters and their impact on the electricity generation of a parabolic trough solar system, specifically focusing on an air-cooled configuration. These environmental factors include dry bulb temperature, direct normal irradiance, and incidence angle. The temperature variation in Figure 7 for July and January plays a significant role in the heat losses and PC efficiency of the parabolic trough system. Higher temperatures (July) result in increased heat losses (Figure 8) and decreased power cycle efficiency, while lower temperatures (January) lead to reduced heat losses (Figure 9) and improved power cycle efficiency. The DNI has a direct impact on electricity generation by the parabolic trough system. Higher direct normal irradiance leads to increased electricity generation (average of 7672.18 in July) but also increases the heat losses from the SF, while a lower DNI results in decreased electricity generation (average of 918.090 in January). The incidence angle is the angle between the sun rays and the normal to the aperture plane of the PT collector. The incidence angle (Figure 7) affects the amount of solar radiation that is intercepted by the collector and transferred to the HTF. The higher the incidence angle, the lower the intercepted radiation and the lower the electricity generation.
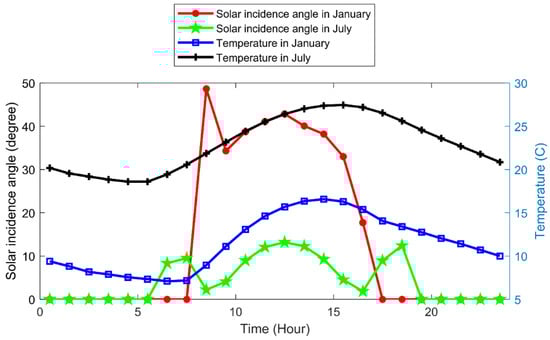
Figure 7.
Dry bulb temperature and solar incidence angle.

Figure 8.
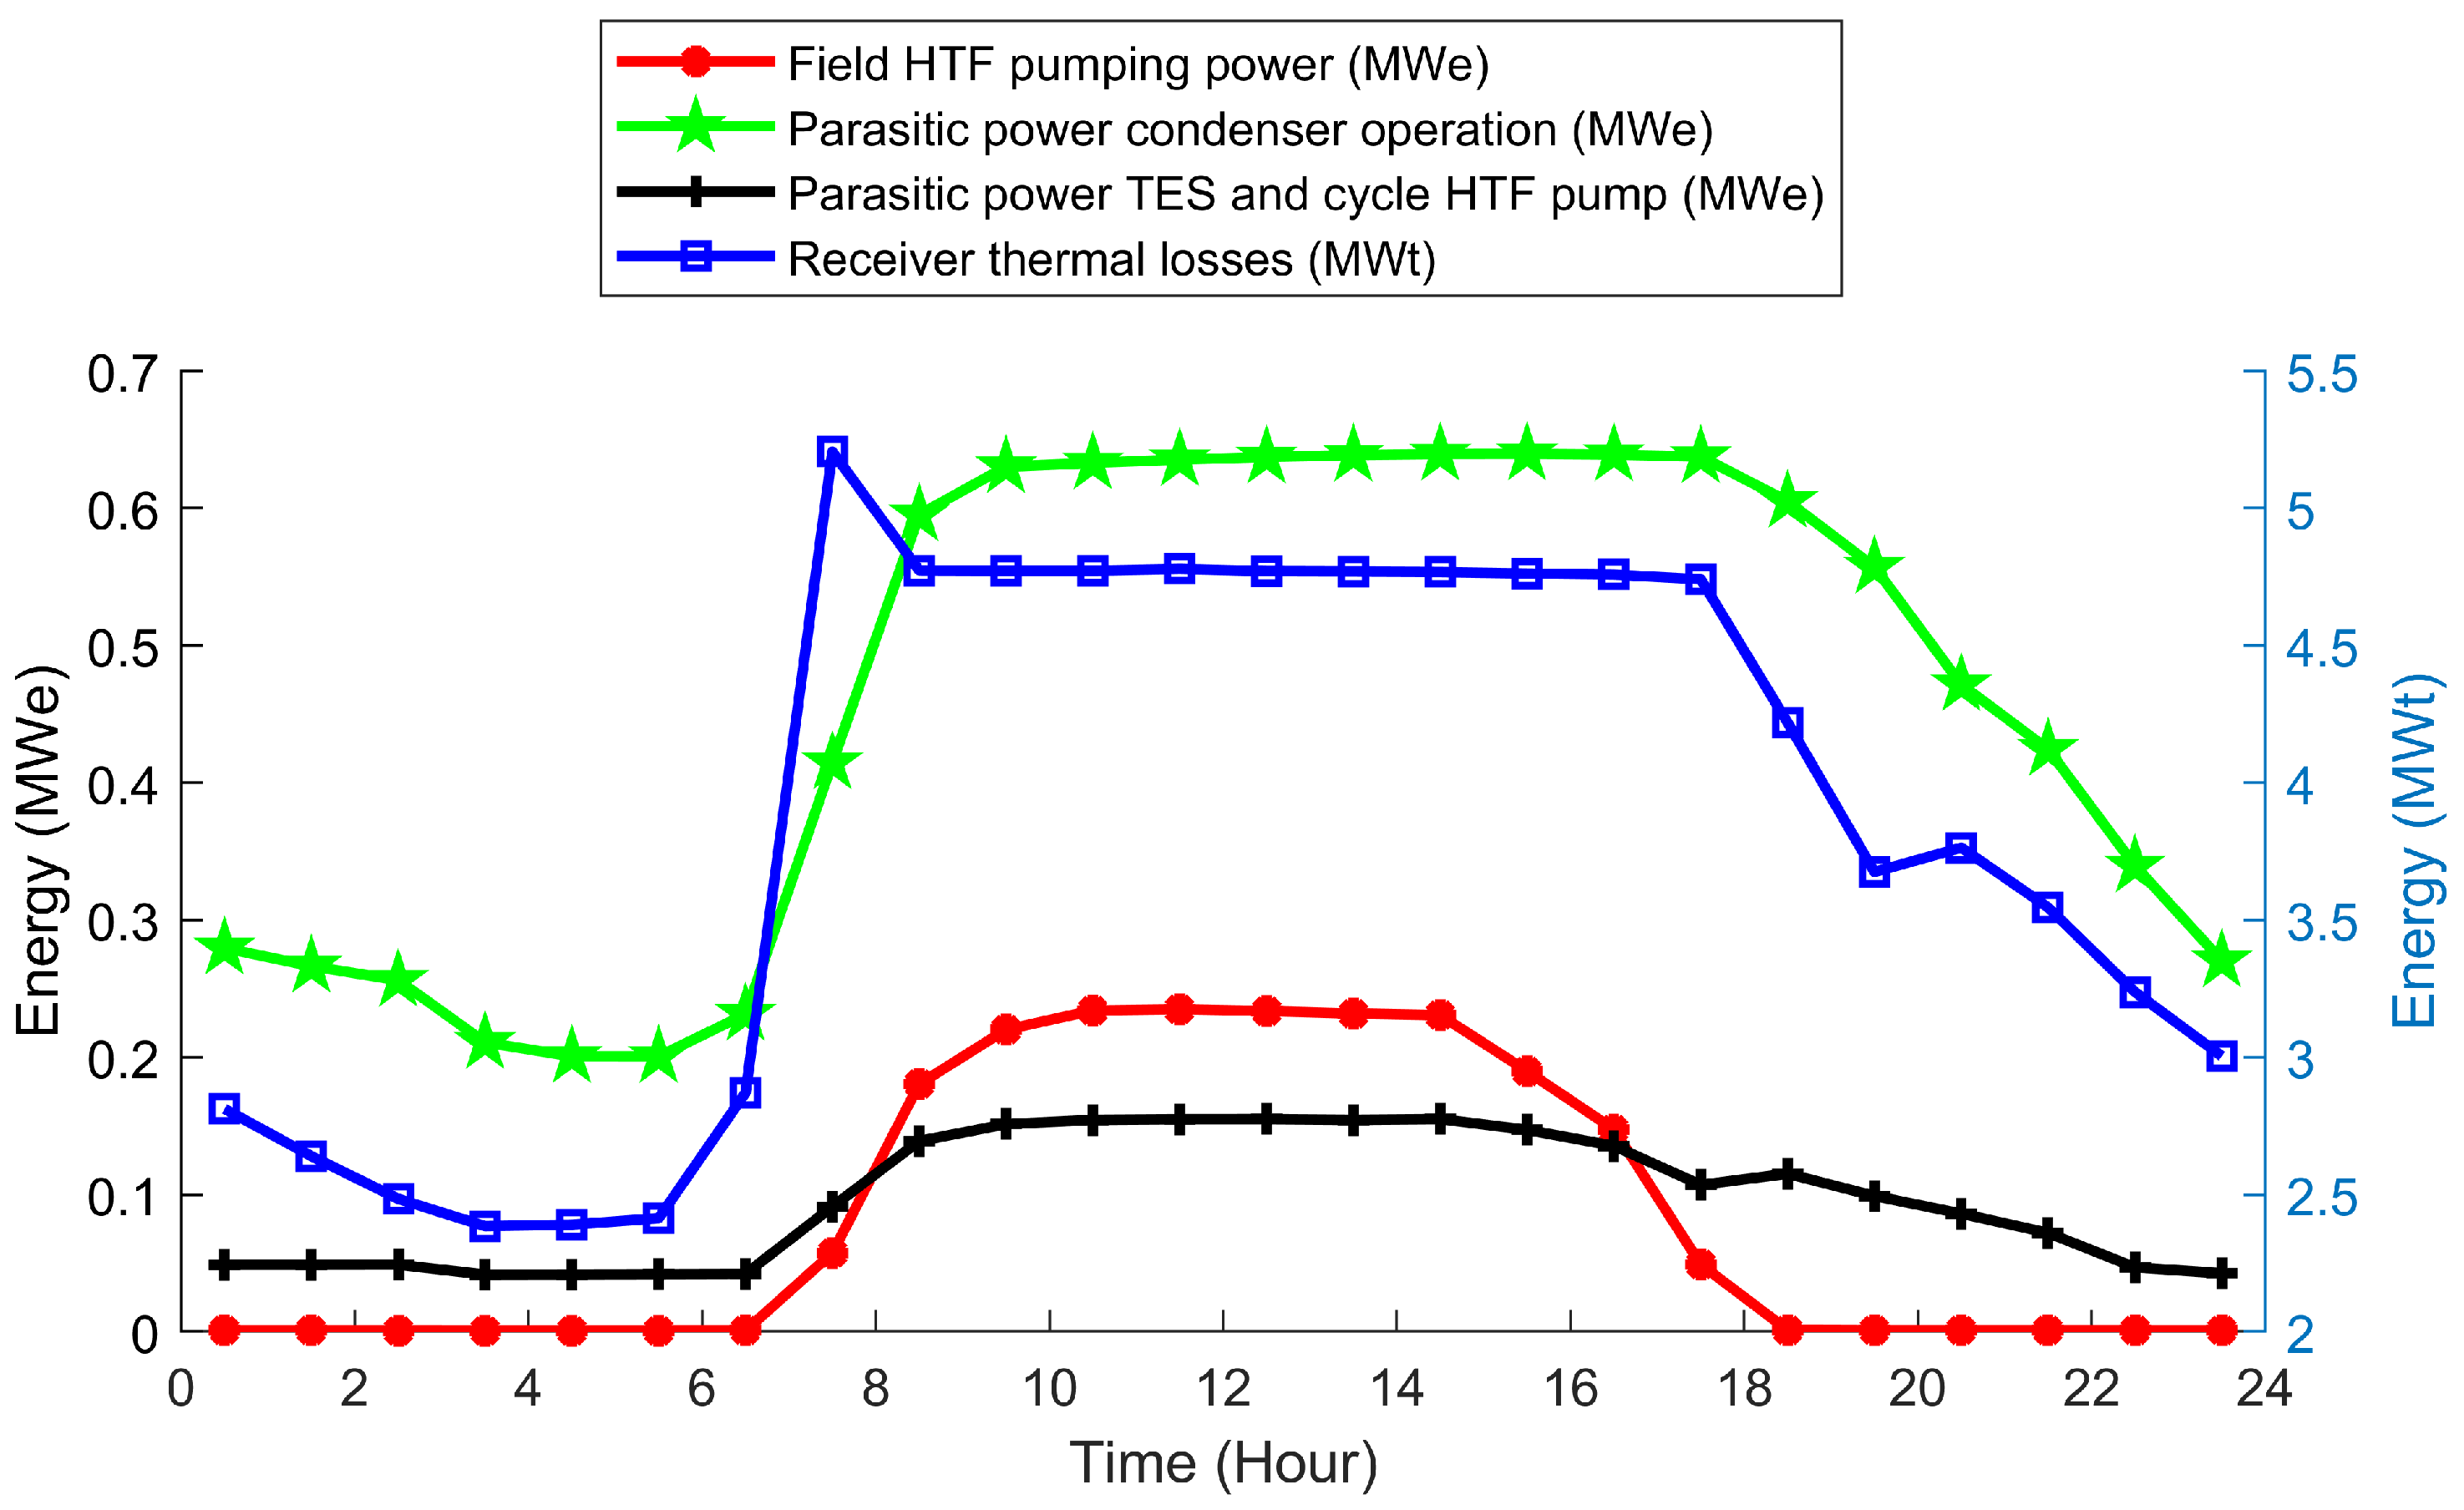
Power and thermal losses in a parabolic trough system in July.

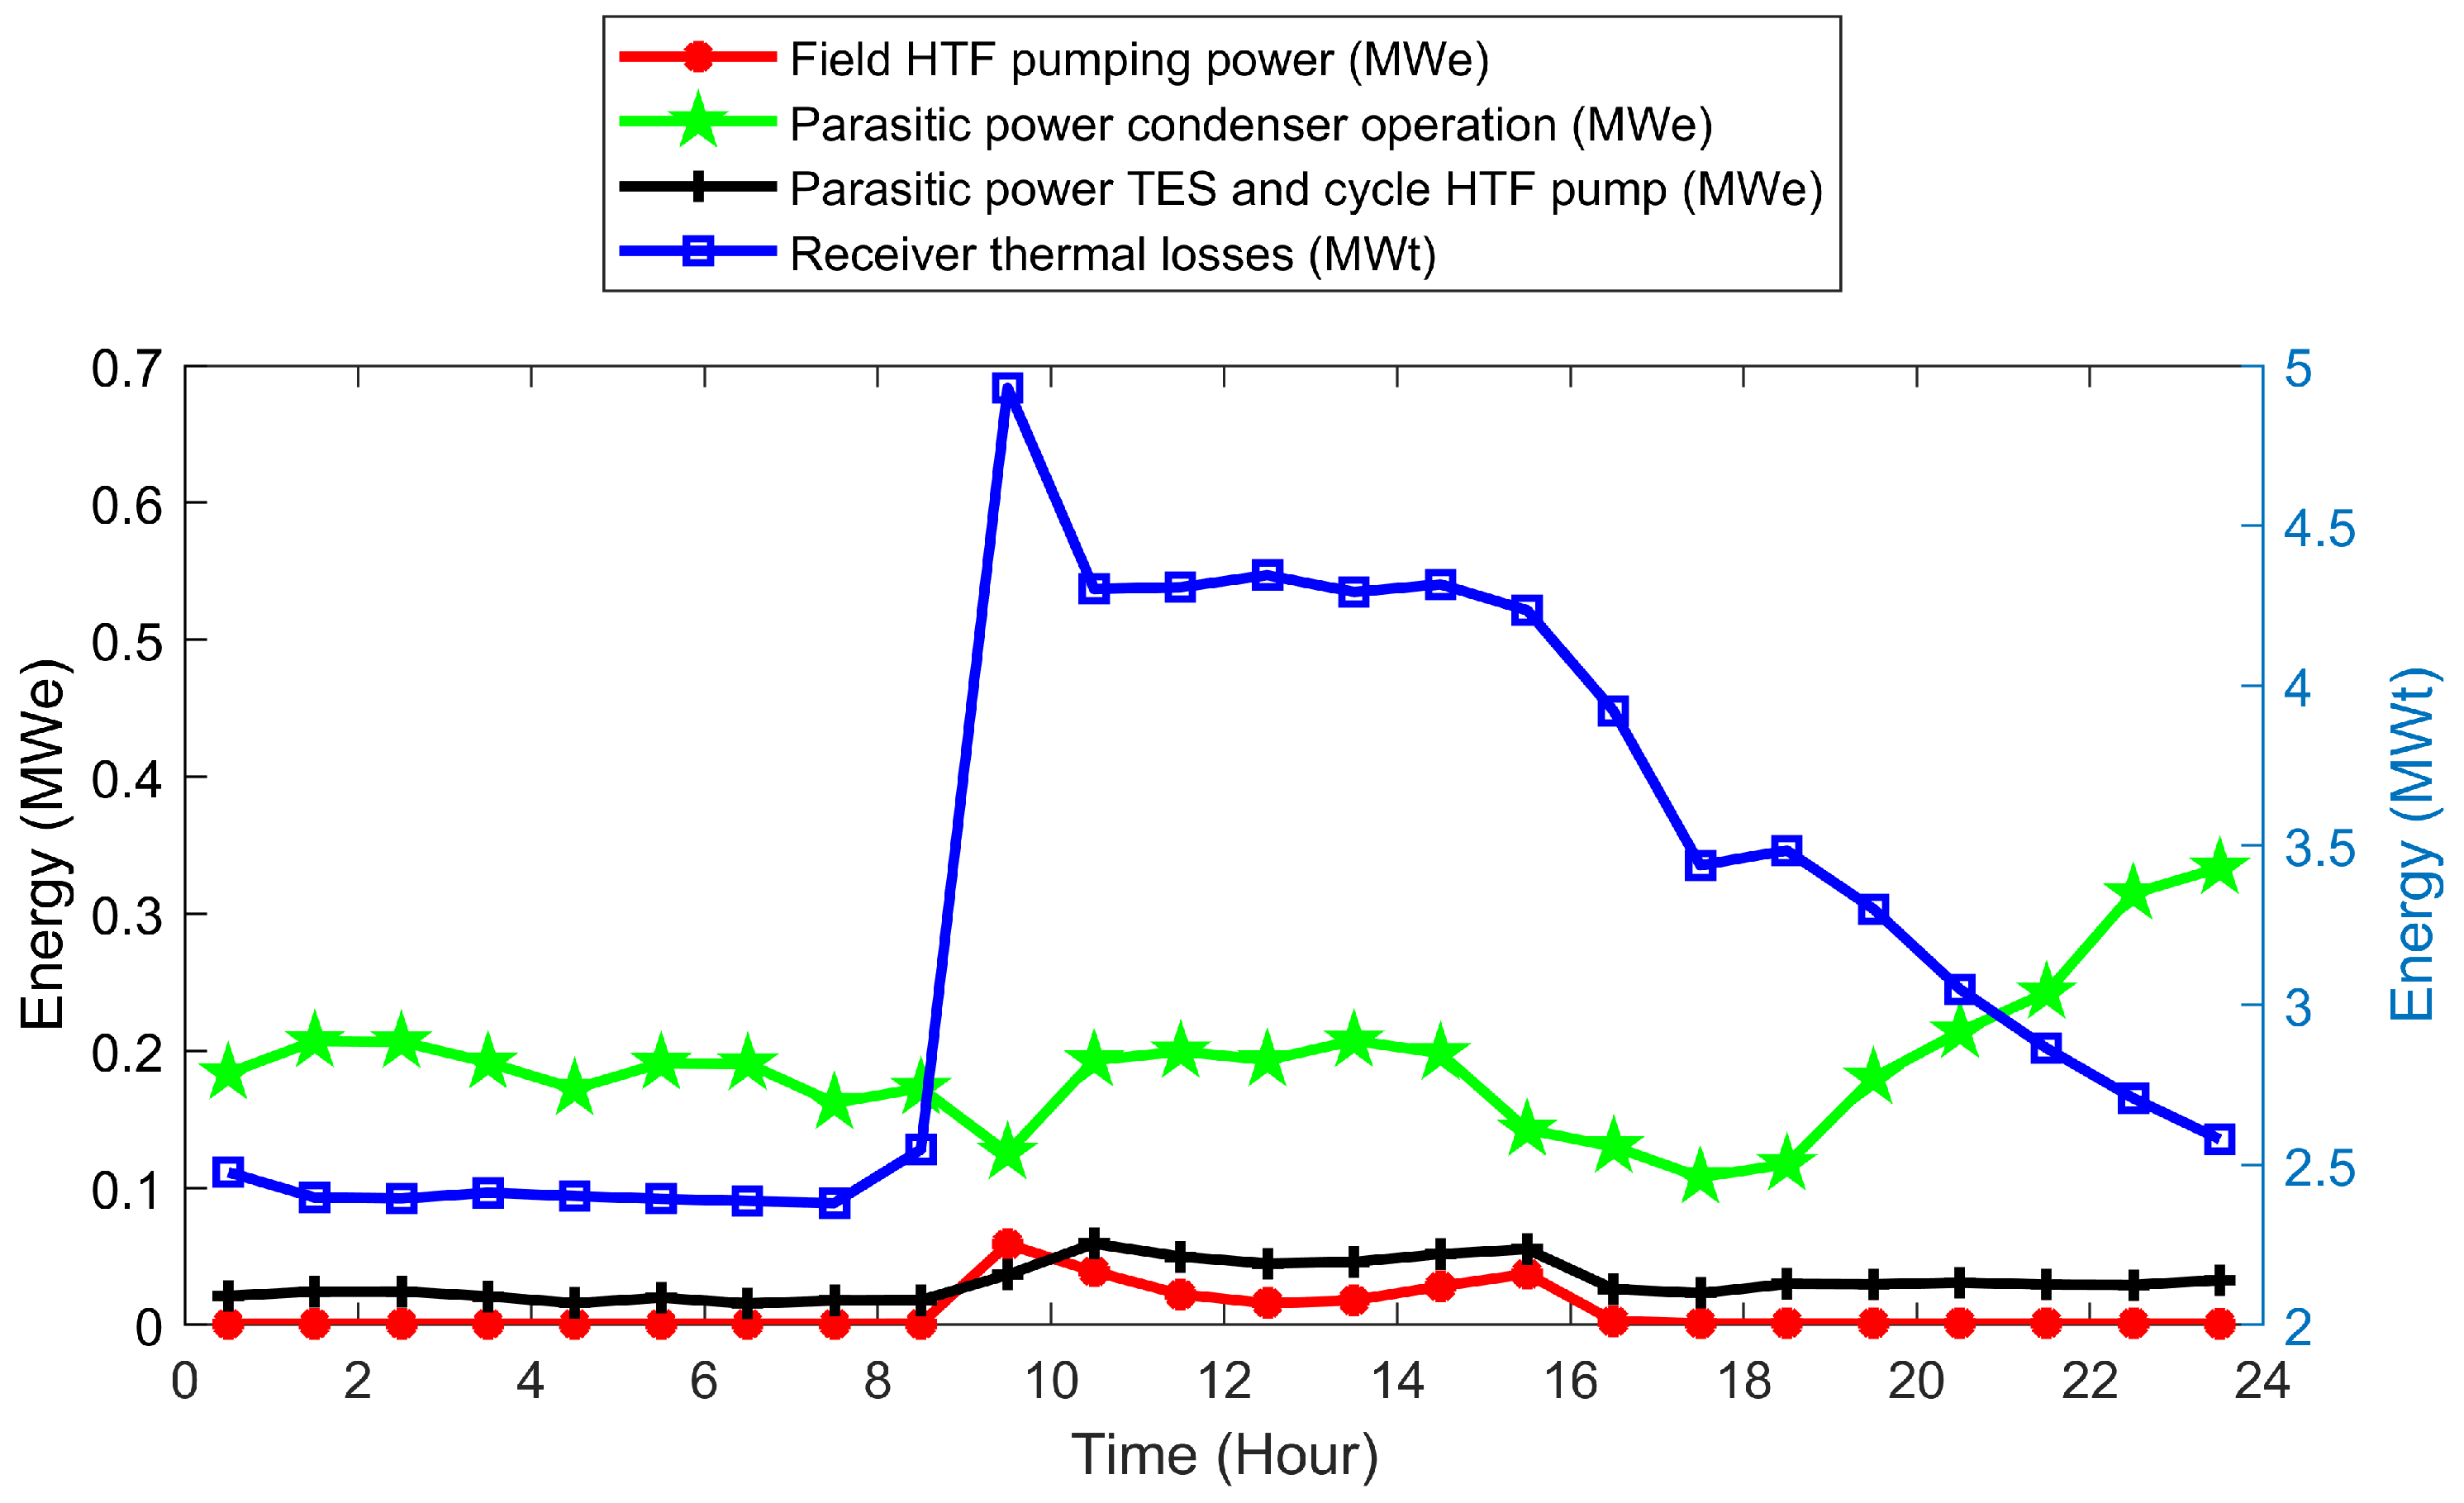
Figure 9.
Power and thermal losses in a parabolic trough system in January.
4.2. Power and Thermal Losses
The two graphs in Figure 8 and Figure 9 show several lines representing different components of the parasitic losses. The field HTF pumping power shows the power required to pump the HTF through the SF. It peaks around midday, coinciding with peak solar irradiance, and reaching values around 0.23 and 0.003 for July and January, respectively. The parasitic power condenser operation indicates the power consumed by the condenser in the power block. It remains relatively constant throughout the day, around 0.6 and 0.33 for July and January, respectively. Parasitic power TES and cycle HTF pump represent the power used to pump the HTF through the TES system and the PC. It follows a similar pattern to the field HTF pumping power but with slightly lower values for the two months.
The receiver thermal losses line shows the thermal losses from the receivers, which are highest during the day when the receivers are hottest. It starts around 2.8 and 2.4 in the early morning, peaks close to 5 and 4.5 around midday, and gradually decreases to around 3 and 2.5 by night for July and January, respectively.
Parasitic losses are generally lower in January compared with July. This is likely due to several factors, including the following:
- Lower solar irradiance in January. Less solar energy input means less heat needs to be transported and less condenser operation is required.
- Cooler ambient temperatures in January. A reduced need for cooling leads to lower condenser power consumption.
- Both graphs show similar trends with peak parasitic losses occurring around midday.
- The July graph shows higher magnitudes for all parasitic losses compared with January. This aligns with the expected lower energy demand and reduced thermal losses in January.
5. Economic Analysis
The levelized LCOE is a metric that quantifies the mean net present value of producing electricity for a power plant throughout its operational life. It serves as a tool for making informed investment decisions and facilitates the comparison of various approaches to electricity generation in a standardized manner [30].
The equation to calculate LCOE is:
where TCC is the installed capital cost in USD, FOC is the fixed annual operating cost in USD, or operation and maintenance costs, VOC is the variable operating cost , AEP is the annual electricity production in and FCR is the fixed charge rate.
The economic viability of an 18 PTSTPP (estimated net output at design (nameplate)) was evaluated using the SAM model over a 25-year analysis period. An inflation rate of 2.5% was considered, with nominal debt and construction interest rates of 4% and 3.5%, respectively. The capital cost of the project was estimated at USD 101.29 million, with fixed and variable operating costs of USD 1.19 million and 4 per year, respectively. Based on these inputs, the LCOE calculated using the FCR method was found to be 0.1717 $ per kWh. Table 7 shows the results of the SAM simulation of the power plant, using the financing and economic parameters from the baseline scenario that applies to all computational models.
Table 7.
Financial and economic parameters (costs).
Further analysis is needed to understand the key drivers of the high LCOE and identify potential areas for cost reduction. This could include exploring alternative financing options, optimizing the plant design, or evaluating different operating strategies. Additionally, a sensitivity analysis could be conducted to assess the impact of changes in key hypotheses, such as solar resource availability, fuel prices, and discount rates, on the overall project economics.
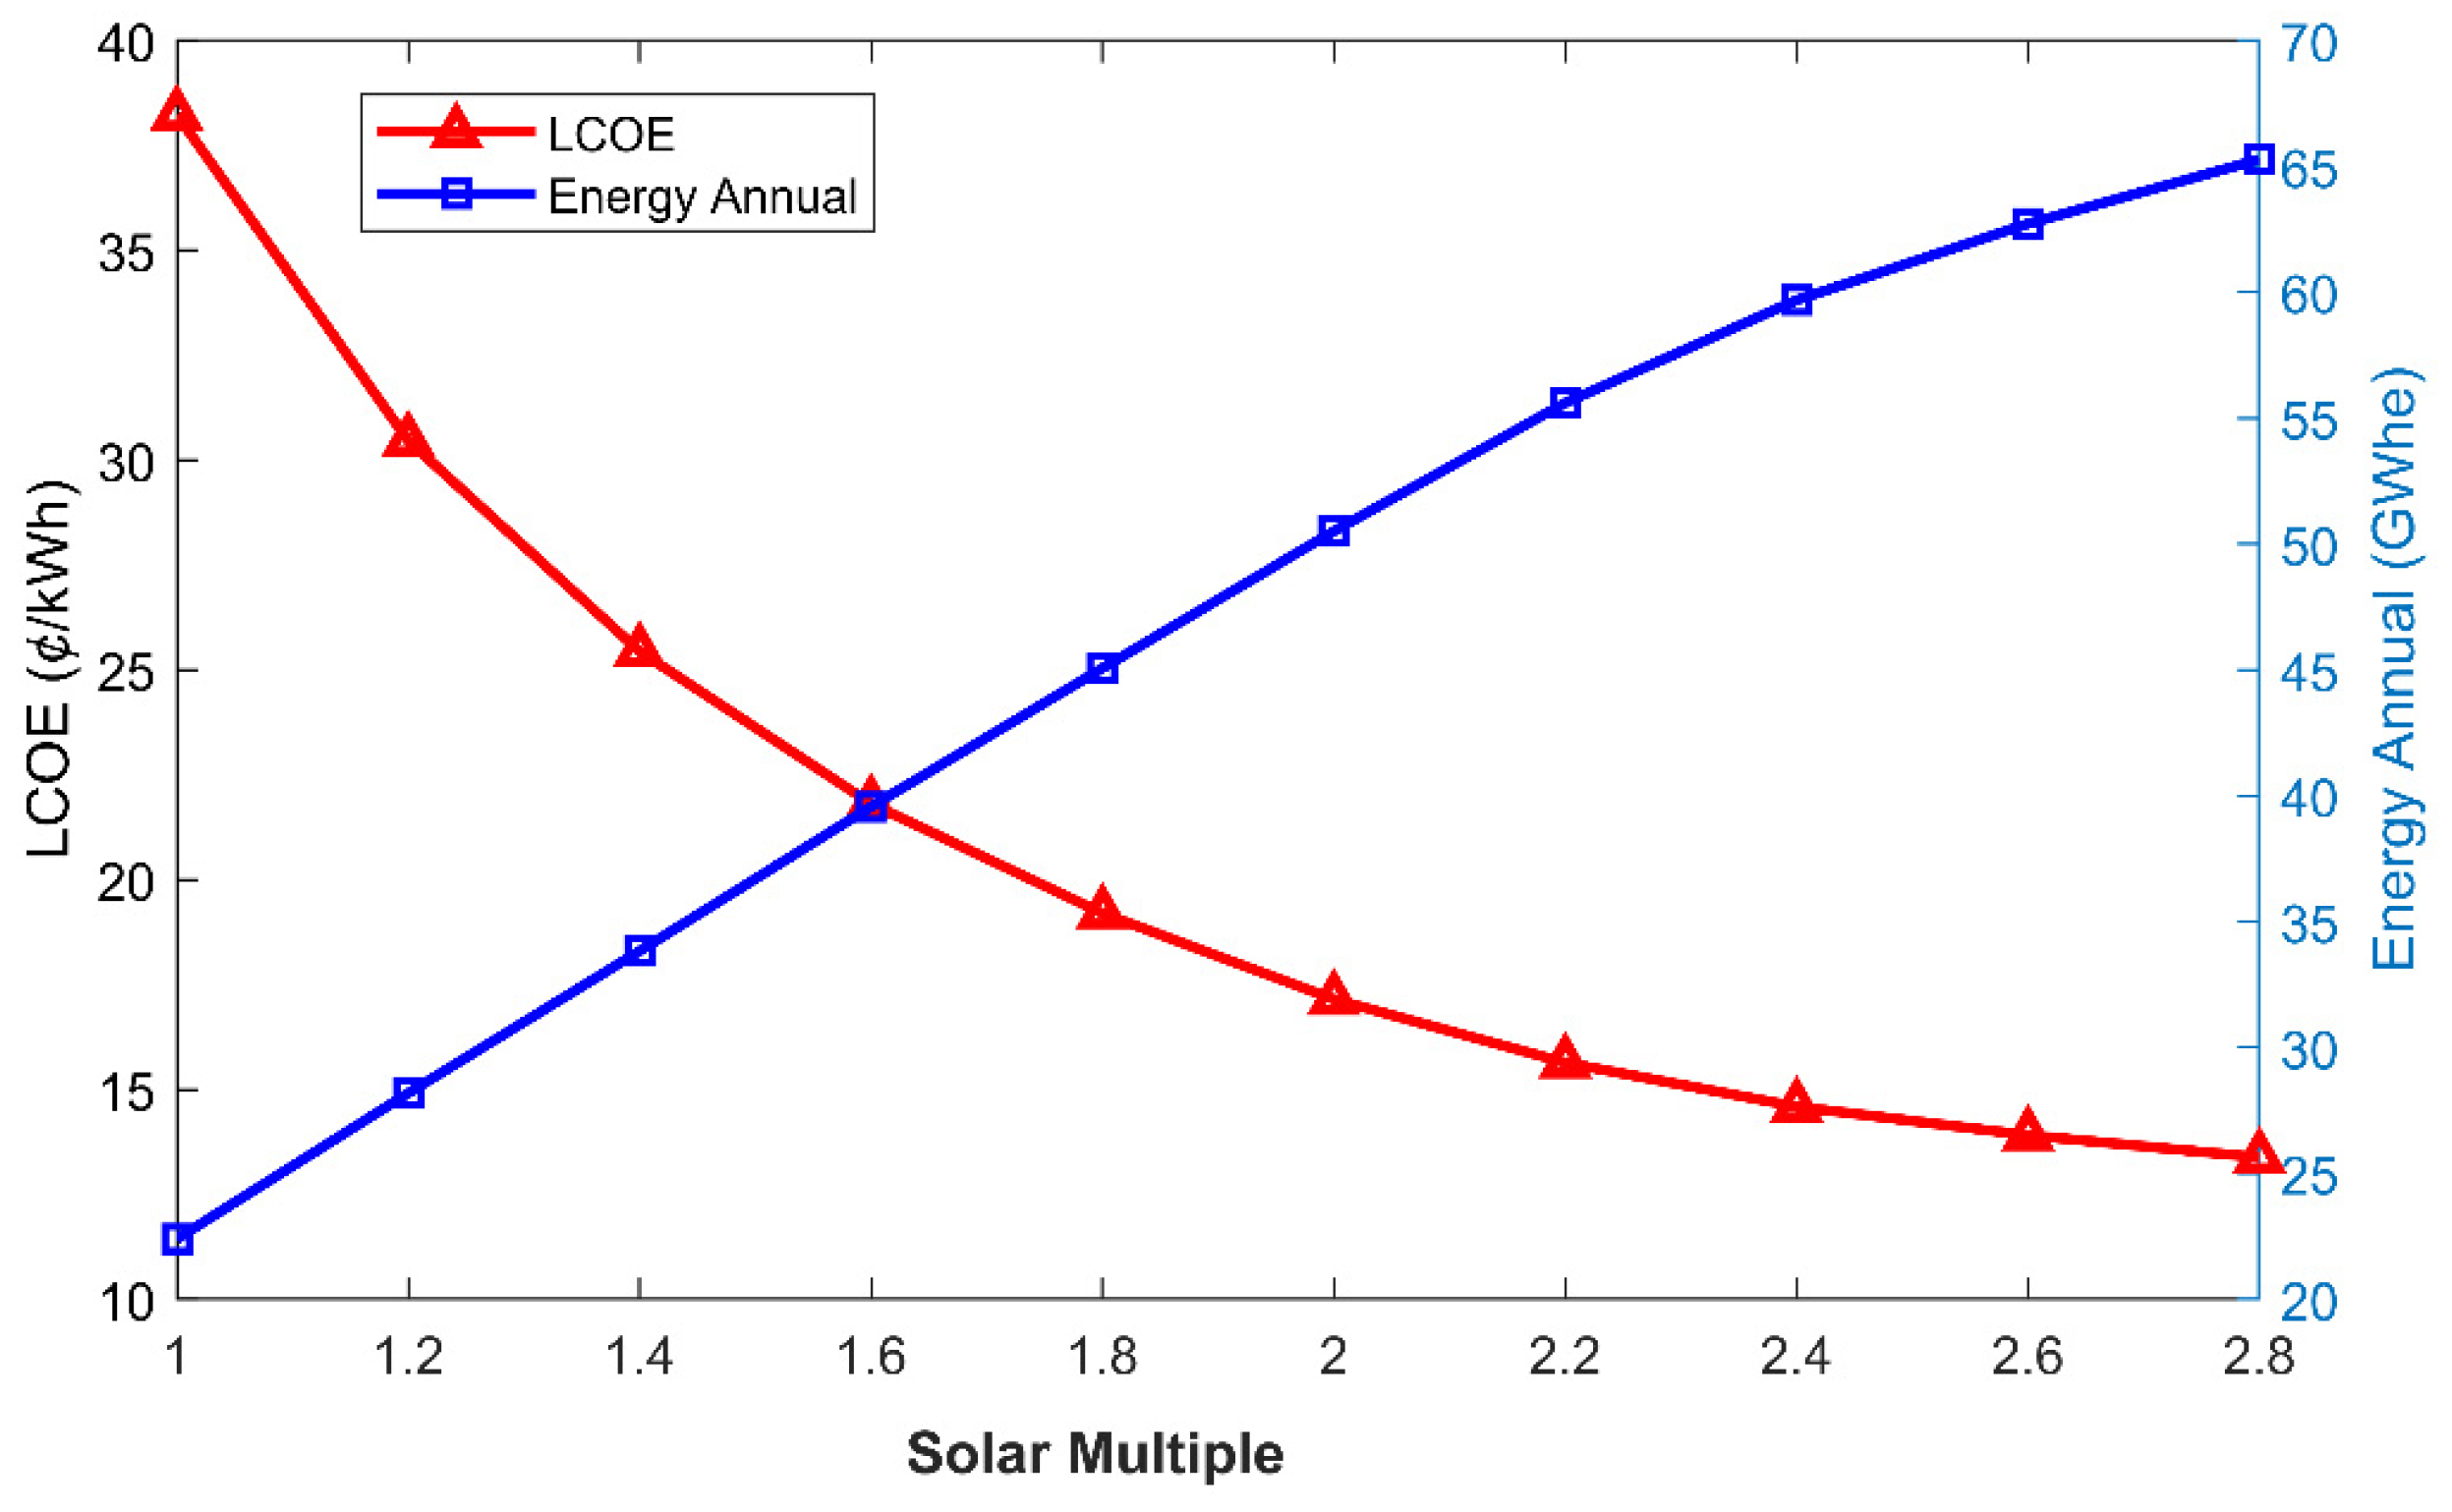
Figure 10 illustrates how the annual energy and the LCOE of a PT plant vary with the solar multiple. The SM is the ratio of the solar field size to the minimum size required to operate the PC at full load. A higher SM means more solar energy is collected and stored, which can increase the energy output and reduce the LCOE.
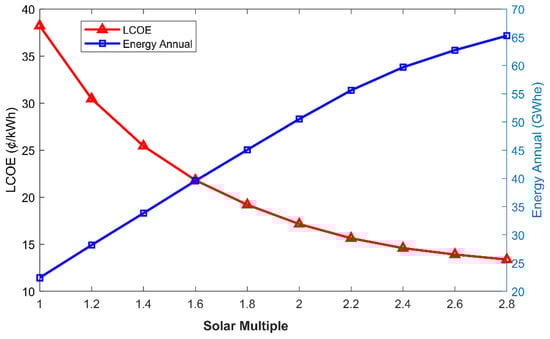
Figure 10.
The effect of solar multiple on annual energy production and LCOE for Kenitra.
The graph shows that as the SM increases from 1 to 2.8, the annual energy production increases from about 22 GWh/year to about 65 GWh/year, while the LCOE decreases from 0.38 to 0.13 . This indicates that there is a positive correlation between the solar multiple and the energy output and a negative correlation between the solar multiple and the LCOE. However, the slopes of both lines are not constant, and they tend to flatten out as the solar multiple approaches 2.8.
Table 8 presents a comparison of the theoretical PTSTPP with the Noor I [31] and Andasol I [32] plants from previous publications. The results from this study are consistent with the results from other studies, where the proposed plant’s LCOE is lower and reasonable compared to the other plants.
Table 8.
Comparison and validation of existing PTSTPPs with the proposed plant.
6. Conclusions and Future Work
The design and analysis of a 20 MW parabolic trough solar thermal power plant (PTSTPP) in Kenitra, Morocco, demonstrate the significant potential of solar energy for providing clean and sustainable power in this region. This study highlights the need for ongoing research and development to further optimize this technology and promote its wider adoption. Kenitra’s geographical advantage, with a direct normal irradiance (DNI) exceeding 2000 kWh/m²/year, offers an optimal environment for harnessing solar power through parabolic trough concentrators. The detailed analysis conducted with System Advisor Model (SAM) software showcases the technical and economic feasibility of the proposed plant, incorporating several advanced features including the following:
- ✓
- Therminol VP-1 as the heat transfer fluid (HTF). This fluid ensures efficient heat transfer, enhancing the overall thermal performance of the system.
- ✓
- Dry cooling system. This technology minimizes water consumption, which is essential in arid regions, thus improving the plant’s sustainability.
- ✓
- HITEC solar salt in the thermal energy storage (TES) system. This allows for efficient energy storage, enabling continuous power supply even during non-sunny periods.
The analysis projects an impressive annual electricity output of 50.51 GWh, with a Levelized Cost of Energy (LCOE) of 0.1717 $⁄kWh and a capacity factor of 32%. These figures underscore the plant’s viability and its potential as a sustainable energy source.
Moreover, the implications for Kenitra are substantial. The electricity produced can be integrated into the national grid, providing a reliable and renewable power supply. This will support local industries, boosting economic growth and promoting sustainable industrial practices. Additionally, the plant’s energy can be utilized for critical processes such as desalination, addressing freshwater scarcity by converting seawater into potable water. The successful deployment of this project could serve as a benchmark for similar initiatives in regions with high solar potential. By validating the feasibility and benefits of advanced solar thermal systems, this research contributes to the global transition towards renewable energy and the fight against climate change.
As we look to the future, further research avenues should be explored to enhance the performance and economic viability of solar power plants in the region. Future work could delve into optimizing the plant design to maximize energy capture and storage efficiency, considering variations in climatic conditions. Additionally, an in-depth economic analysis could be conducted to assess the long-term sustainability and potential scalability of the proposed solar power infrastructure. Integration with emerging technologies, advancements in energy storage, and exploring novel applications for the generated electricity will be crucial aspects of future endeavors. Furthermore, community engagement and stakeholder involvement should be prioritized to ensure the seamless integration of solar energy into Kenitra’s broader energy landscape. This holistic approach to research and development will pave the way for more robust, efficient, and sustainable solar energy solutions in Kenitra and similar regions.
The successful deployment of this project could serve as a benchmark for similar initiatives in regions with high solar potential. By validating the feasibility and benefits of advanced solar thermal systems, this research contributes to the global transition towards renewable energy and the fight against climate change. In conclusion, the study of the 20 MW PTSTPP in Kenitra not only proves the practicality of solar thermal technology in Morocco but also paves the way for future developments in the sector. The results encourage continued innovation and investment in solar energy, fostering a cleaner, more sustainable future.
Author Contributions
Conceptualization, S.N. and B.O.; methodology, S.N.; software, S.N.; validation, B.O., M.A., and B.D.; formal analysis, M.A.; investigation, B.O.; resources, M.M.; data curation, E.M.E.M.; writing—original draft preparation, S.N.; writing—review and editing, B.O. and S.N.; supervision, B.D. All authors have read and agreed to the published version of the manuscript.
Funding
This research received no external funding.
Data Availability Statement
The raw data supporting the conclusions of this article will be made available by the authors on request.
Conflicts of Interest
The authors declare no conflicts of interest.
Nomenclature
| direct normal radiation () | |
| the horizontal beam radiation () | |
| the zenith angle (degree) | |
| the incidence angle (degree) | |
| declination (degree) | |
| CF | capacity factor (%) |
| PTC | parabolic trough collector |
| RC | Rankine cycle |
| CSP | concentrated solar power |
| LCOE | levelized cost of electricity |
| DNI | direct normal irradiance |
| SAM | System Advisor Model |
| SF | solar field |
| SM | solar multiple |
| TES | thermal energy storage |
| TMY | typical meteorological year |
| NREL | National Renewable Energy Laboratory |
| RE | renewable energy |
| WF | working fluid |
| PC | power cycle |
| FBS | fuel backup system |
| HTF | heat transfer fluid |
| IAM | incidence angle modifier |
References
- Kousksou, T.; Allouhi, A.; Belattar, M.; Jamil, A.; El Rhafiki, T.; Arid, A.; Zeraouli, Y. Renewable energy potential and national policy directions for sustainable development in Morocco. Renew. Sustain. Energy Rev. 2015, 47, 46–57. [Google Scholar] [CrossRef]
- Ouarzazate NOOR I, II and III: 550 MW—SolarPaces. Available online: https://www.solarpaces.org/worldwide-csp/csp-potential-solar-thermal-energy-by-country/morocco/ (accessed on 6 April 2024).
- Morocco Advances Its Solar Energy Plan with Noor Midelt II Project—Marina Coronado. Available online: https://www.atalayar.com/en/articulo/economy-and-business/morocco-advances-its-solar-energy-plan-with-noor-midelt-ii-project/20230804113539189166.html (accessed on 6 April 2024).
- Boukelia, T.E.; Mecibah, M.S.; Kumar, B.N.; Reddy, K.S. Investigation of solar parabolic trough power plants with and without integrated TES (thermal energy storage) and FBS (fuel backup system) using thermic oil and solar salt. Energy 2015, 88, 292–303. [Google Scholar] [CrossRef]
- Bishoyi, D.; Sudhakar, K. Modeling and performance simulation of 100 MW PTC based solar thermal power plant in Udaipur India. Case Stud. Therm. Eng. 2017, 10, 216–226. [Google Scholar] [CrossRef]
- Benhadji Serradj, D.E.; Sebitosi, A.B.; Fadlallah, S.O. Design and performance analysis of a parabolic trough power plant under the climatological conditions of Tamanrasset, Algeria. Int. J. Environ. Sci. Technol. 2022, 19, 3359–3376. [Google Scholar] [CrossRef] [PubMed]
- Trabelsi, S.E.; Qoaider, L.; Guizani, A. Investigation of using molten salt as heat transfer fluid for dry cooled solar parabolic trough power plants under desert conditions. Energy Convers. Manag. 2018, 156, 253–263. [Google Scholar] [CrossRef]
- Ezeanya, E.K.; Massiha, G.H.; Simon, W.E.; Raush, J.R.; Chambers, T.L. System advisor model (SAM) simulation modelling of a concentrating solar thermal power plant with comparison to actual performance data. Cogent Eng. 2018, 5, 1524051. [Google Scholar] [CrossRef]
- Lopes, T.; Fasquelle, T.; Silva, H.G. Pressure drops, heat transfer coefficient, costs and power block design for direct storage parabolic trough power plants running molten salts. Renew. Energy 2021, 163, 530–543. [Google Scholar] [CrossRef]
- Yuanjing, W.; Cheng, Z.; Yanping, Z.; Xiaohong, H. Performance analysis of an improved 30 MW parabolic trough solar thermal power plant. Energy 2020, 213, 118862. [Google Scholar] [CrossRef]
- Bashir, A.A.A.; Özbey, M. Modelling and analysis of an 80-MW parabolic trough concentrated solar power plant in Sudan. Clean Energy 2022, 6, 512–527. [Google Scholar] [CrossRef]
- Aly, A.; Bernardos, A.; Fernandez-Peruchena, C.M.; Jensen, S.S.; Pedersen, A.B. Is Concentrated Solar Power (CSP) a feasible option for Sub-Saharan Africa?: Investigating the techno-economic feasibility of CSP in Tanzania. Renew. Energy 2019, 135, 1224–1240. [Google Scholar] [CrossRef]
- Praveen, R.P.; Baseer, M.A.; Awan, A.B.; Zubair, M. Performance analysis and optimization of a parabolic trough solar power plant in the middle east region. Energies 2018, 11, 741. [Google Scholar] [CrossRef]
- Ait Lahoussine Ouali, H.; Alami Merrouni, A.; Chowdhury, S.; Techato, K.; Channumsin, S.; Ullah, N. Optimization and Techno-Economic Appraisal of Parabolic Trough Solar Power Plant under Different Scenarios: A Case Study of Morocco. Energies 2022, 15, 8485. [Google Scholar] [CrossRef]
- Blair, N.; Diorio, N.; Freeman, J.; Gilman, P.; Janzou, S.; Neises, T.; Wagner, M. System Advisor Model (SAM) General Description (Version 2017.9.5); No. NREL/ TP-6A20-70414; National Renewable Energy Lab (NREL): Golden, CO, USA, 2018. [Google Scholar] [CrossRef]
- Diorio, N.; Dobos, A.; Janzou, S. Economic Analysis Case Studies of Battery Energy Storage with SAM; No. NREL/TP-6A20-64987; National Renewable Energy Lab (NREL): Golden, CO, USA, 2015. [Google Scholar] [CrossRef]
- Sun, J.; Zhang, Z.; Wang, L.; Zhang, Z.; Wei, J. Comprehensive review of line-focus concentrating solar thermal technologies: Parabolic trough collector (PTC) vs linear Fresnel reflector (LFR). J. Therm. Sci. 2020, 29, 1097–1124. [Google Scholar] [CrossRef]
- Meng, X.-L.; Liu, C.-L.; Bai, X.-H.; Kong, D.-H.; Du, K. Improvement of the performance of parabolic trough solar concentrator using freeform optics and CPV/T design. AIMS Energy 2021, 9, 286–304. [Google Scholar] [CrossRef]
- Tagle-Salazar, P.D.; Nigam, K.D.P.; Rivera-Solorio, C.I. Parabolic trough solar collectors: A general overview of technology, industrial applications, energy market, modeling, and standards. Green Process. Synth. 2020, 9, 595–649. [Google Scholar] [CrossRef]
- Geyer, M.; Lüpfert, E.; Osuna, R.; Esteban, A.; Schiel, W.; Schweitzer, A.; Zarza, E.; Nava, P.; Langenkamp, J.; Mandelberg, E. EUROTROUGH-Parabolic trough collector developed for cost efficient solar power generation. In Proceedings of the 11th SolarPACES International Symposium on Concentrated Solar Power and Chemical Energy Technologies, Zurich, Switzerland, 4–6 September 2002; Volume 7. [Google Scholar]
- Kalogirou, S.A. A detailed thermal model of a parabolic trough collector receiver. Energy 2012, 48, 298–306. [Google Scholar] [CrossRef]
- Nuwayhid, R.Y.; Mrad, F.; Abu-Said, R.J.R.E. The realization of a simple solar tracking concentrator for university research applications. Renew. Energy 2001, 24, 207–222. [Google Scholar] [CrossRef]
- Duffie, J.A.; Beckman, W.A. Solar Engineering of Thermal Processes, 4th ed.; Wiley: New York, NY, USA, 2013; 928p. [Google Scholar]
- Giglio, A.; Lanzini, A.; Leone, P.; Rodríguez García, M.M.; Zarza Moya, E. Direct steam generation in parabolic-trough collectors: A review about the technology and a thermo-economic analysis of a hybrid system. Renew. Sustain. Energy Rev. 2017, 74, 453–473. [Google Scholar] [CrossRef]
- Giostri, A.; Binotti, M.; Silva, P.; MacChi, E.; Manzolini, G. Comparison of two linear collectors in solar thermal plants: Parabolic trough versus Fresnel. J. Sol. Energy Eng. 2013, 135, 011001. [Google Scholar] [CrossRef]
- Wagner, M.J.; Gilman, P. Technical Manual for the SAM Physical trough Model; No. NREL/TP-5500-51825; National Renewable Energy Lab (NREL): Golden, CO, USA, 2011. [Google Scholar] [CrossRef]
- McMahan, A.C. Design & Optimization of Organic Rankine Cycle Solar-Thermal Powerplants. Master’s Thesis, University of Wisconsin-Madison, Madison, WI, USA, 2006. Available online: https://minds.wisconsin.edu/handle/1793/7889 (accessed on 15 March 2024).
- Ouammi, A.; Zejli, D.; Dagdougui, H.; Benchrifa, R. Artificial neural network analysis of Moroccan solar potential. Renew. Sustain. Energy Rev. 2012, 16, 4876–4889. [Google Scholar] [CrossRef]
- Azouzoute, A.; Alami Merrouni, A.; Touili, S. Overview of the integration of CSP as an alternative energy source in the MENA region. Energy Strategy Rev. 2020, 29, 100493. [Google Scholar] [CrossRef]
- Short, W.; Packey, D.J.; Holt, T. A Manual for the Economic Evaluation of Energy Efficiency and Renewable Energy Technologies; No. NREL/TP-462-5173; National Renewable Energy Lab (NREL): Golden, CO, USA, 1995. [Google Scholar] [CrossRef]
- Aqachmar, Z.; Allouhi, A.; Jamil, A.; Gagouch, B.; Kousksou, T. Parabolic trough solar thermal power plant Noor I in Morocco. Energy 2019, 178, 572–584. [Google Scholar] [CrossRef]
- Bhuiyan, N.; Ullah, W.; Islam, R.; Ahmed, T.; Mohammad, N. Performance optimisation of parabolic trough solar thermal power plants—A case study in Bangladesh. Int. J. Sustain. Energy 2020, 39, 113–131. [Google Scholar] [CrossRef]


Disclaimer/Publisher’s Note: The statements, opinions and data contained in all publications are solely those of the individual author(s) and contributor(s) and not of MDPI and/or the editor(s). MDPI and/or the editor(s) disclaim responsibility for any injury to people or property resulting from any ideas, methods, instructions or products referred to in the content. |
© 2024 by the authors. Licensee MDPI, Basel, Switzerland. This article is an open access article distributed under the terms and conditions of the Creative Commons Attribution (CC BY) license (https://creativecommons.org/licenses/by/4.0/).