Meteorological Data Mining and Synthesis for Supplementing On-Site Data for Regulatory Compliance
Abstract
:1. Introduction
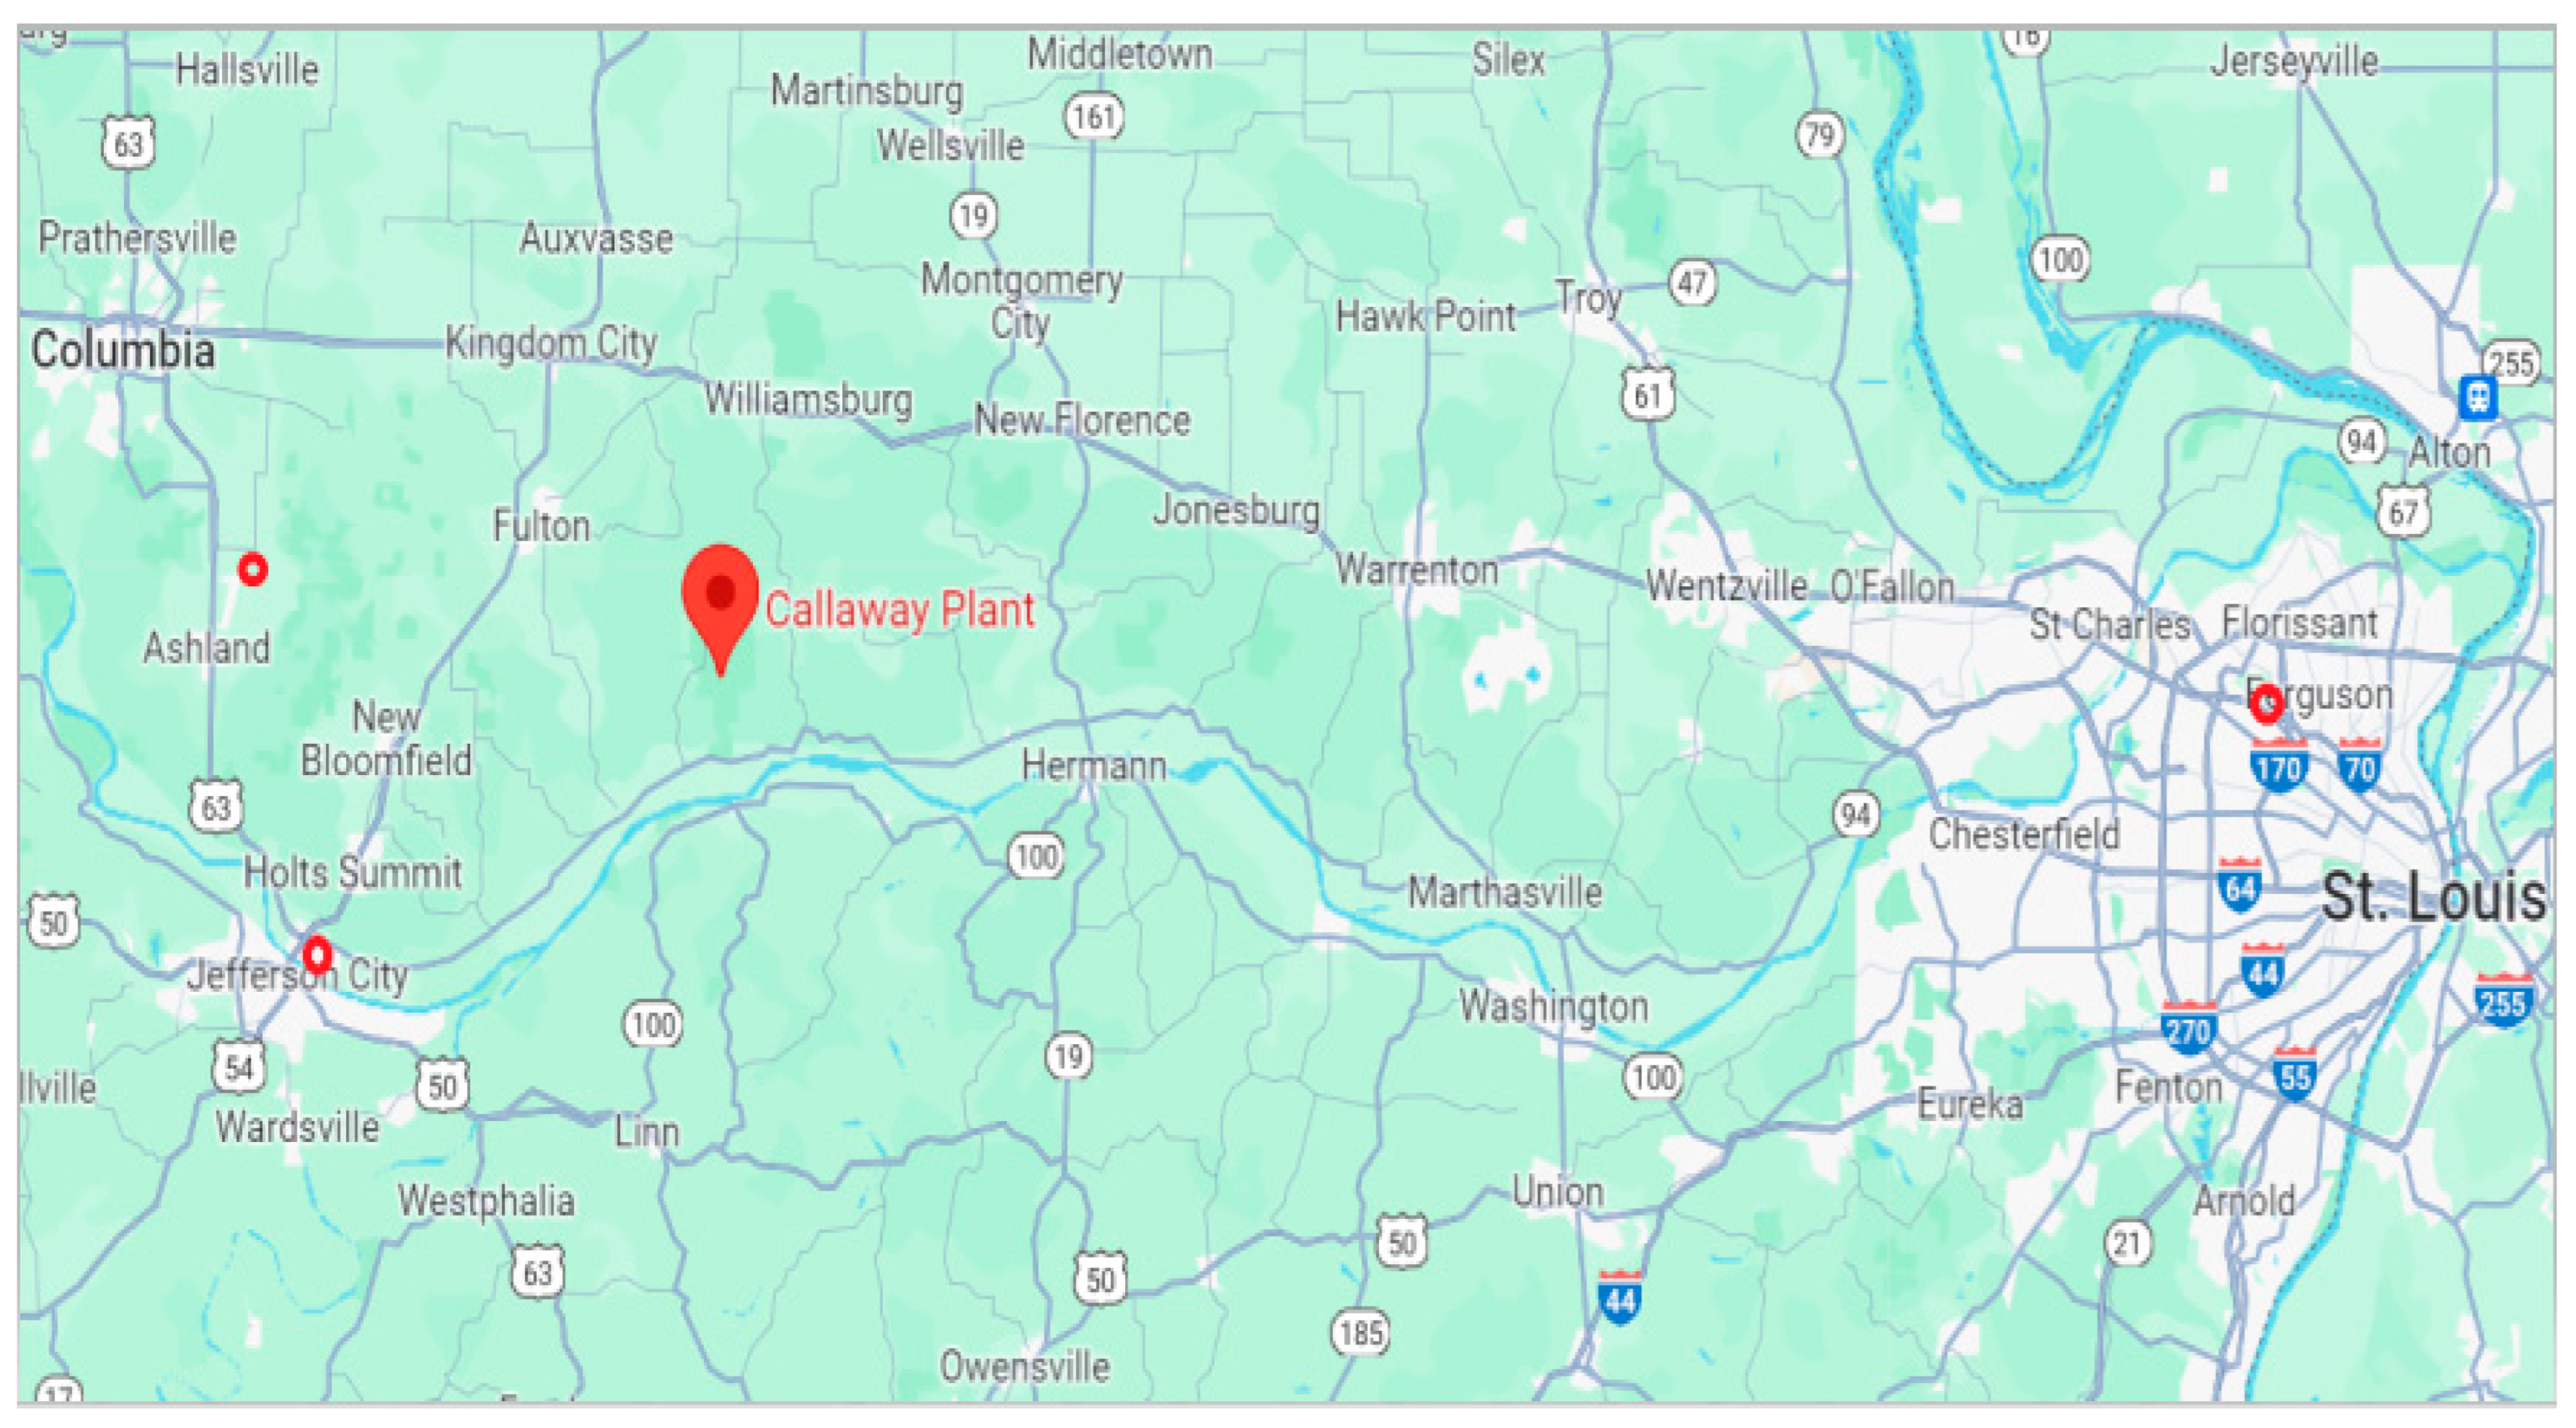
2. Site Geography
- Columbia Regional Airport (West Northwest of the reference plant):
- ▪
- The distance between the reference plant and Columbia Regional Airport is approximately 24 miles and can be characterized by rolling hills and extensive fields. Some of these fields are farmed and others are natural forest typical of Midwest.
- ▪
- Columbia itself is situated within a mix of urban and suburban landscapes, featuring residential areas, commercial districts, and the University of Missouri campus.
- Jefferson City Memorial Airport (Southwest of the reference plant):
- ▪
- The reference plant lies approximately 23.5 miles away from Jefferson City Memorial Airport. The terrain between these locations may include both rural and semi-urban areas.
- ▪
- As the capital city of Missouri, Jefferson City has a scenic location along the Missouri River, offering riverfront views and possibly hilly terrain. Presence of a large river can possibly impact some aspects of meteorological observations and correlations between the reference site and the Jefferson City Memorial Airport.
- St. Louis Lambert International Airport (East of the reference plant):
- ▪
- The distance separating the reference plant from St. Louis Lambert International Airport measures approximately 76.37 miles, encompassing a diverse landscape. Traveling from central Missouri to St. Louis, the terrain transitions from rural areas to suburban land and eventually to the urban environment of St. Louis.
- Q = release rate;
- U = wind speed;
- H = effective stack height;
- σStability = dispersion coefficient (a function of atmospheric stability).
Atmospheric Stability Classification
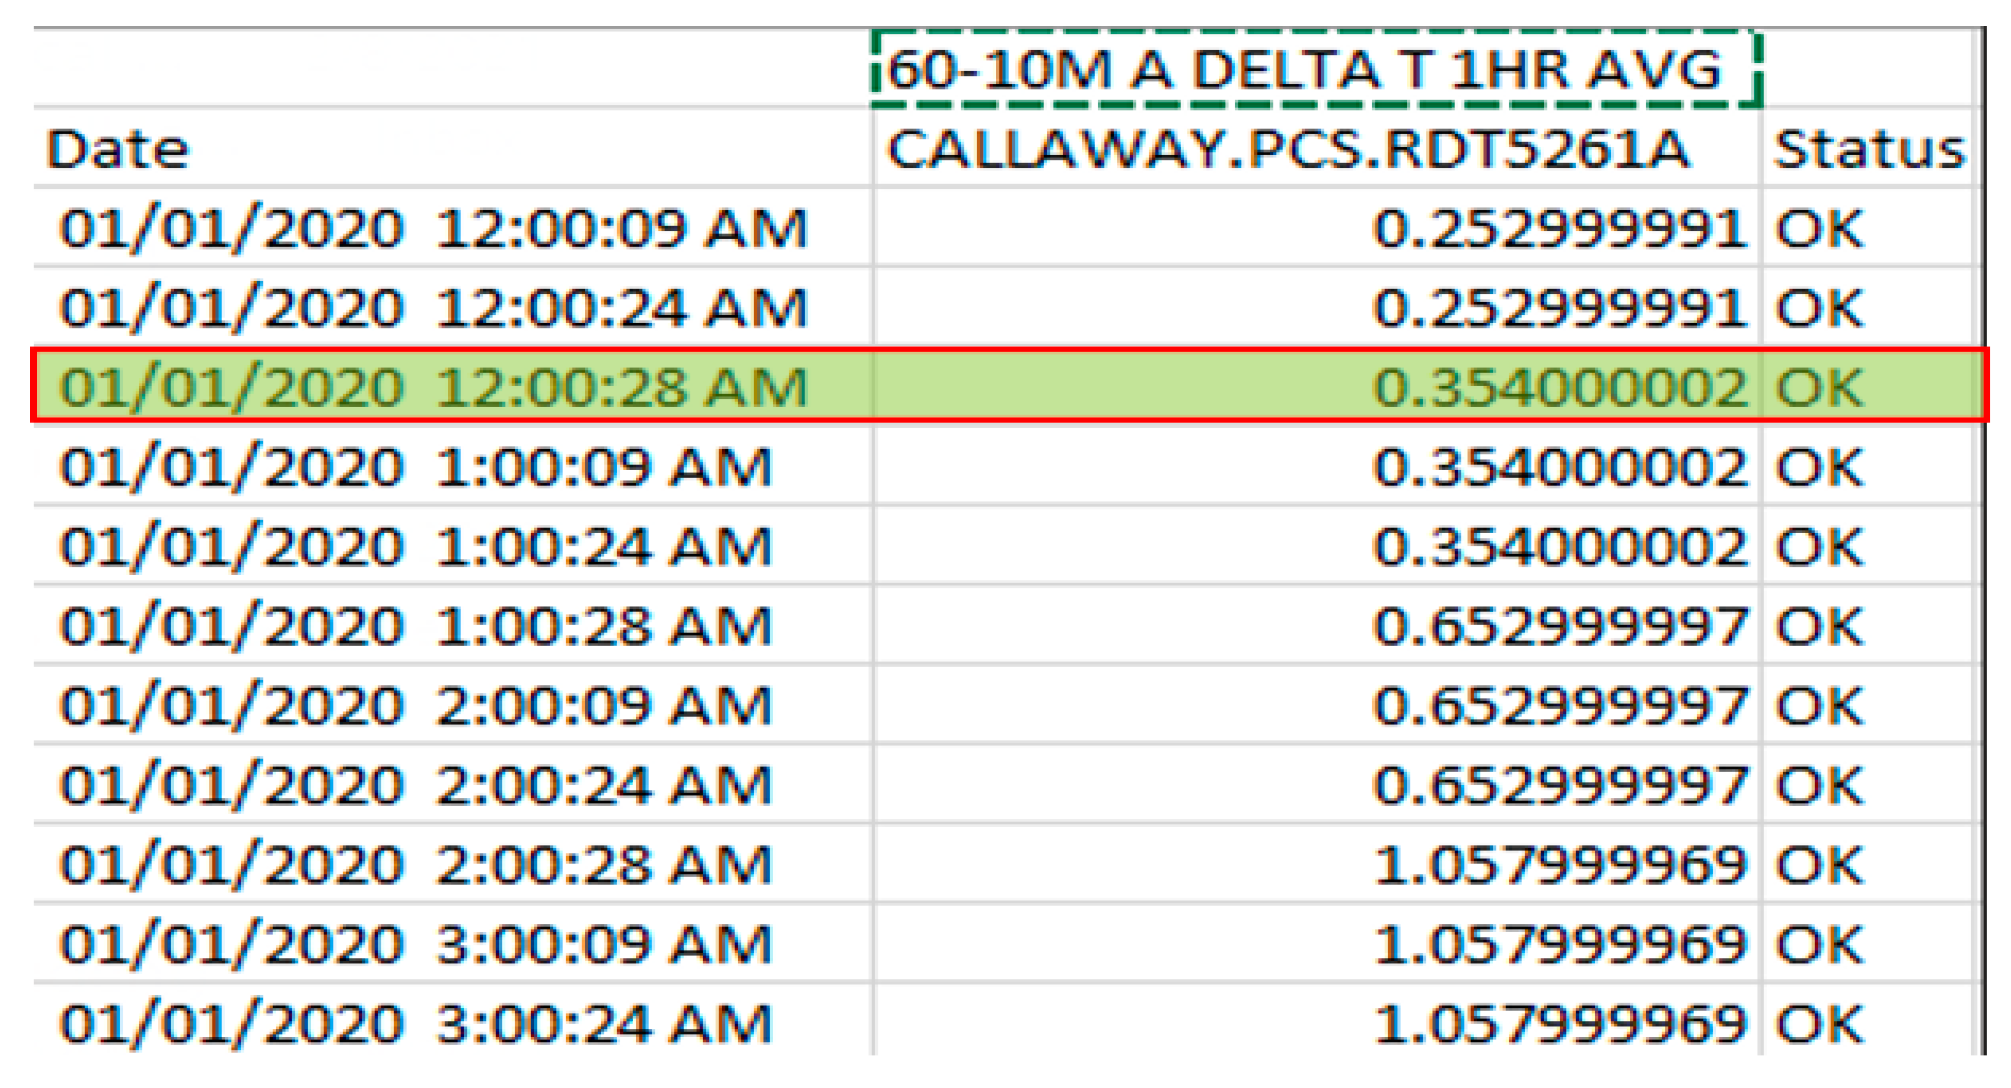
- Delta T (, which represents the temperature difference between 60 m and 10 m, calculated as a one-hour average from Met. T Alpha.
- Delta T (, similarly measured as the temperature difference between 60 m and 10 m from Met. T Bravo.
- Wind direction and wind speed data at both 60 m and 10 m for Met. T Alpha and Bravo.
- g = acceleration due to gravity;
- T = temperature;
- = adiabatic lapse rate;
- z = height above ground;
- = wind speed at the geometrical mean of the heights used to determine the temperature gradient.
- = friction velocity;
- ρ = density;
- = specific heat at constant pressure;
- T = shear stress;
- k = von Karman’s constant;
- g = acceleration due to gravity;
- H = vertical heat flux.
3. Results
| Columbia Regional Airport Time | CRA Solar Elevation Corrected for Atm Refraction (deg) | CRA Hourly Wind Direction (deg) | CRA Wind Speed (m/s) at 10 m | CRA Wind Speed (m/s) at 60 m | CRA STABILITY Letter | Callaway Date and Time | Callaway 10 m A WIND DIR 1 HR AVG | Callaway Hourly Wind Speed (m/s) at 10 m | Callaway 60 m A WIND DIR 1 HR AVG | Callaway Hourly Wind Speed (m/s) at 60 m | Callaway Stability a 60 m & 10 m |
|---|---|---|---|---|---|---|---|---|---|---|---|
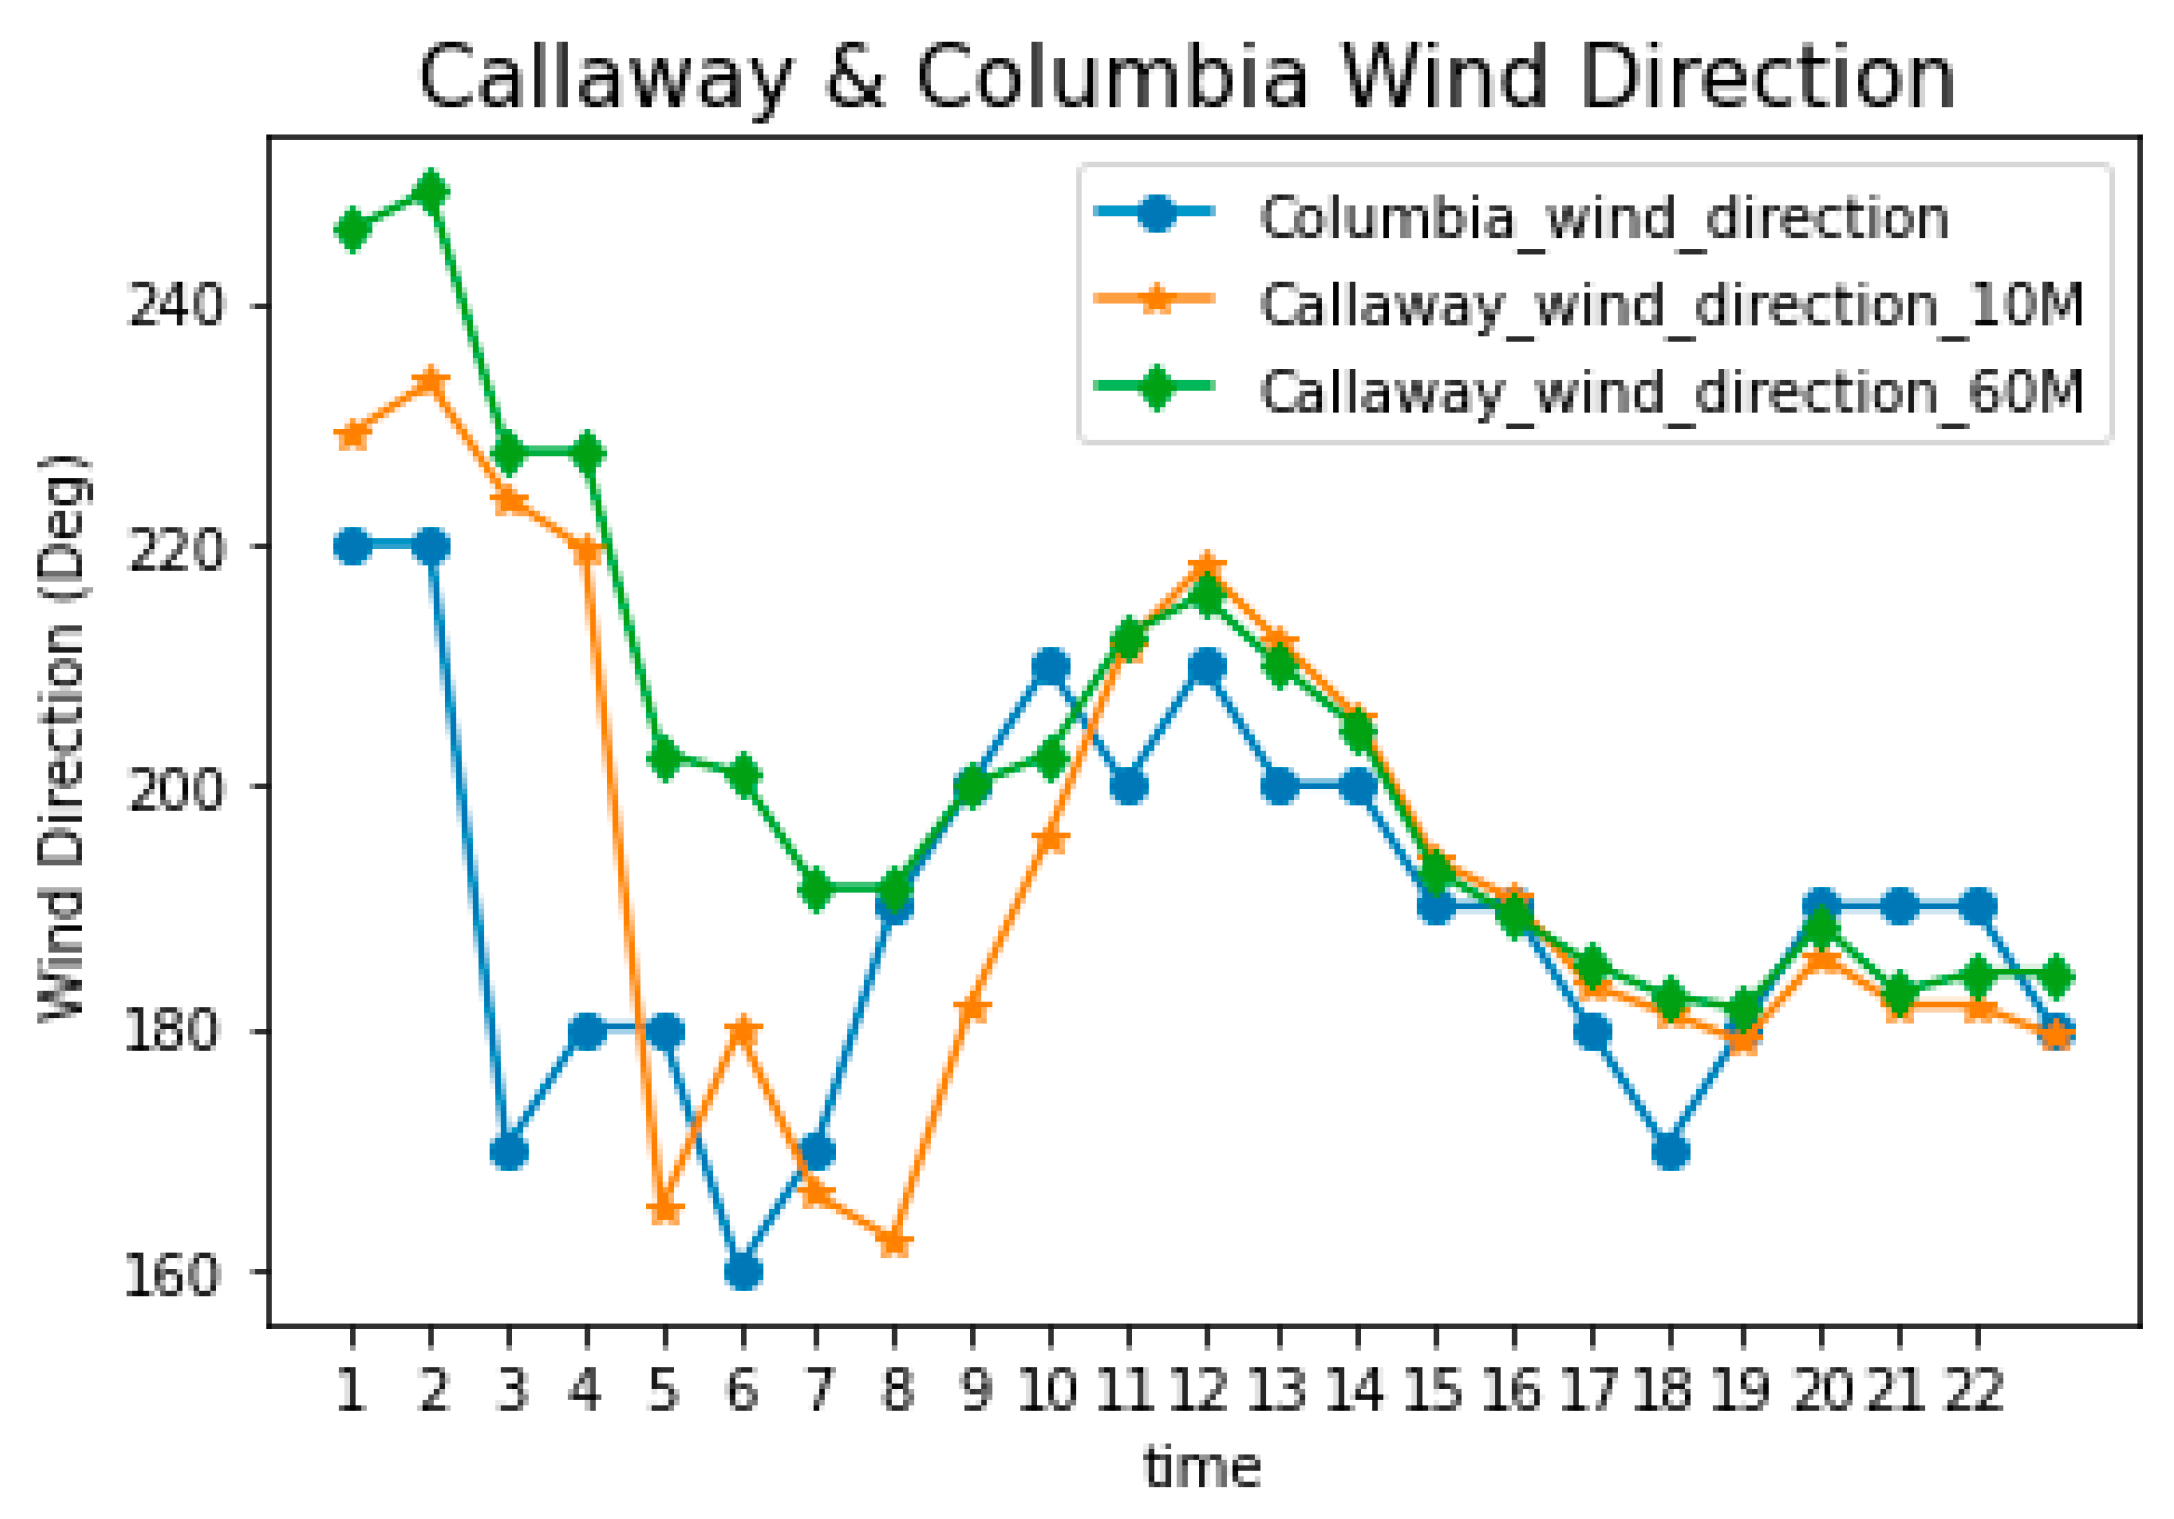
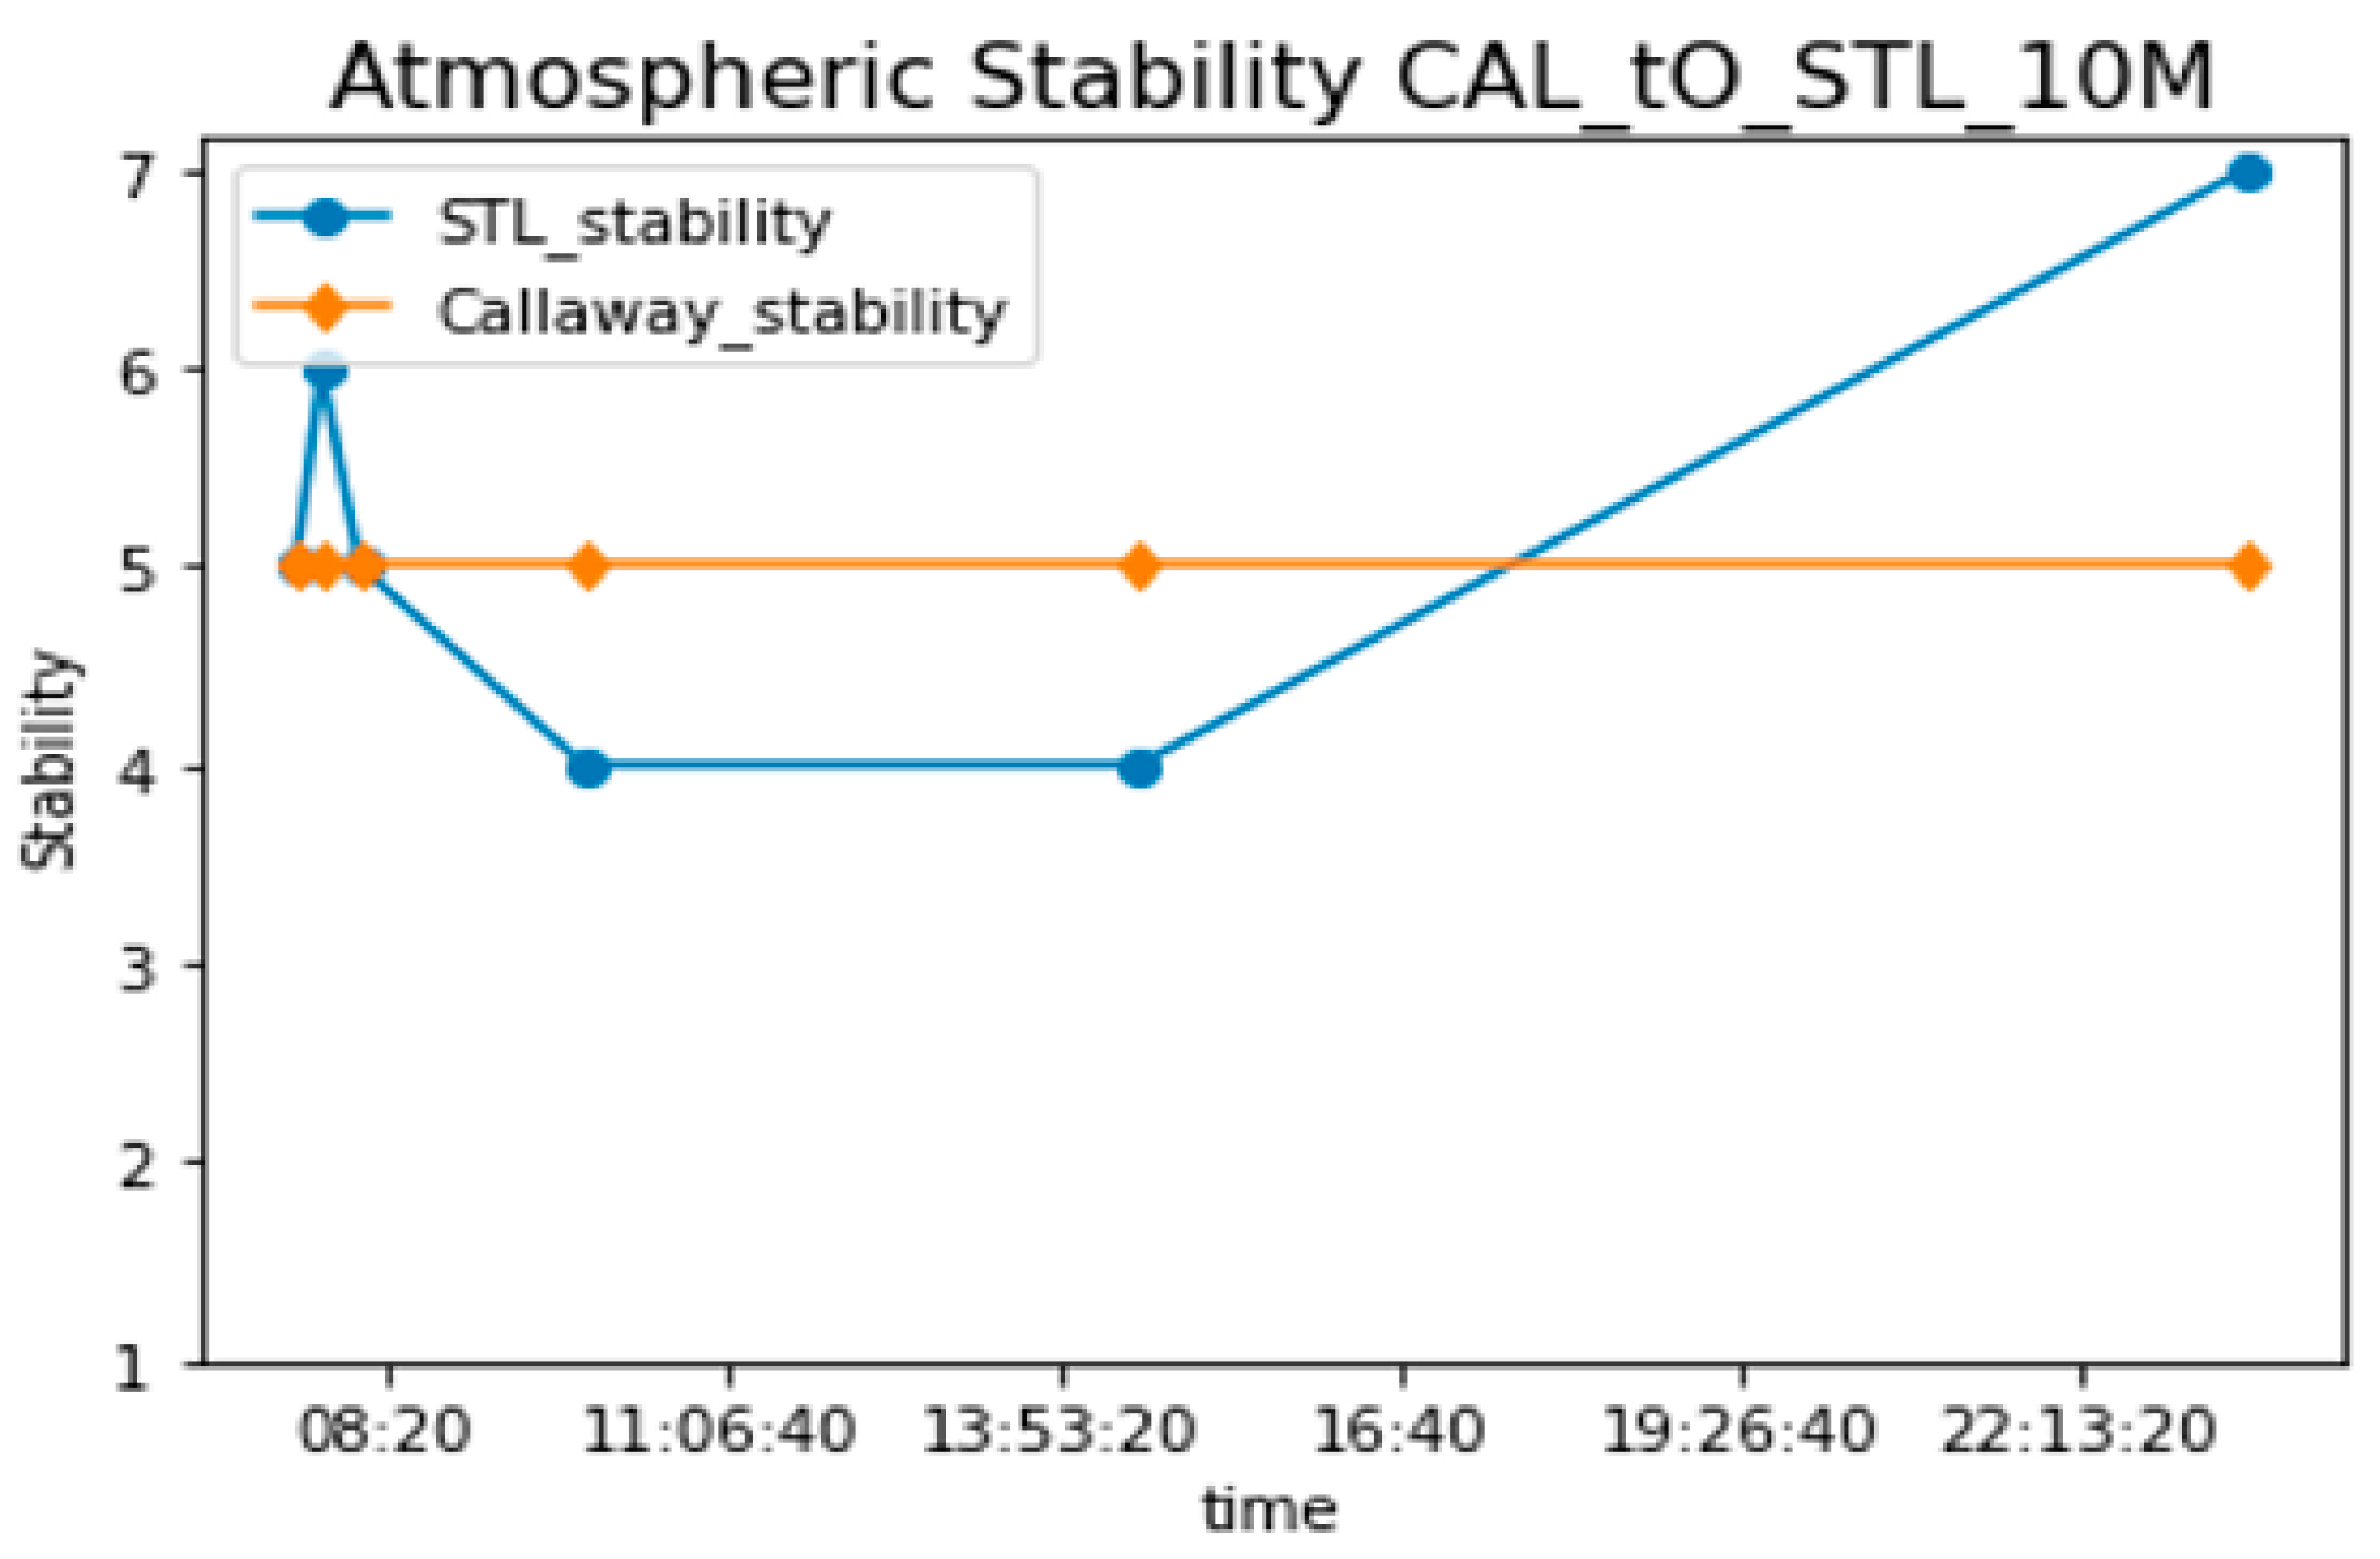
| 00:54:00 | −73.8 | 220 (SW b) | 3.1 | 5.4 | E (5) | 1 January 2020 1:00:28 A.M. | 229.2 (SW b) | 2.4 | 229.2 (SW b) | 5.9 | E (5) |
| 01:54:00 | −71.9 | 220 (SW b) | 4.0 | 6.9 | E (5) | 1 January 2020 2:00:28 A.M. | 233.3 (SW b) | 2.6 | 233.3 (W b) | 6.5 | E (5) |
| 02:54:00 | −63.2 | 170 (S b) | 3.1 | 5.4 | E (5) | 1 January 2020 3:00:28 A.M. | 223.8 (SW b) | 2.5 | 223.8 (SW b) | 6.5 | E (5) |
| 03:54:00 | −52.3 | 180 (S b) | 2.7 | 4.6 | F (6) | 1 January 2020 4:00:28 A.M. | 219.6 (SW b) | 2.4 | 219.6 (SW b) | 6.3 | E (5) |
| 04:54:00 | −40.7 | 180 (S b) | 3.6 | 6.1 | E (5) | 1 January 2020 5:00:28 A.M. | 165 (S b) | 0.7 | 165 (SW b) | 4.7 | E (5) |
| 05:54:00 | −29.0 | 160 (S b) | 3.6 | 6.1 | E (5) | 1 January 2020 6:00:28 A.M. | 179.8 (S b) | 2.7 | 179.8 (S b) | 6.5 | F (6) |
| 06:54:00 | −17.6 | 170 (S b) | 2.7 | 4.6 | F (6) | 1 January 2020 7:00:28 A.M. | 166.1 (S b) | 3.0 | 166.1 (S b) | 6.4 | F (6) |
| 07:54:00 | −6.6 | 190 (S b) | 4.0 | 6.9 | E (5) | 1 January 2020 8:00:28 A.M. | 162.4 (S b) | 3.3 | 162.4 (S b) | 6.9 | F (6) |
| 08:54:00 | 3.8 | 200 (S b) | 4.9 | 7.7 | D (4) | 1 January 2020 9:00:28 A.M. | 181.8 (S b) | 3.7 | 181.8 (S b) | 7.3 | E (5) |
| 09:54:00 | 12.8 | 210 (SW b) | 6.3 | 9.8 | D (4) | 1 January 2020 10:00:28 A.M. | 195.7 (S b) | 4.4 | 195.7 (SW b) | 6.7 | D (4) |
| 10:54:00 | 20.3 | 200 (S b) | 6.7 | 10.5 | D (4) | 1 January 2020 11:00:28 A.M. | 211.6 (SW b) | 4.6 | 211.6 (SW b) | 6.8 | D (4) |
| 11:54:00 | 25.6 | 210 (SW b) | 7.2 | 11.2 | D (4) | 1 January 2020 12:00:28 P.M. | 218.1 (SW b) | 5.3 | 218.1 (SW b) | 7.7 | D (4) |
| 12:54:00 | 28.1 | 200 (S b) | 9.4 | 14.7 | D (4) | 1 January 2020 1:00:28 P.M. | 211.9 (SW b) | 5.7 | 211.9 (SW b) | 8.2 | D (4) |
| 13:54:00 | 27.5 | 200 (S b) | 10.3 | 16.1 | D (4) | 1 January 2020 2:00:28 P.M. | 205.7 (SW b) | 6.5 | 205.7 (SW b) | 9.2 | D (4) |
| 14:54:00 | 23.8 | 190 (S b) | 8.9 | 14.0 | D (4) | 1 January 2020 3:00:28 P.M. | 193.9 (S b) | 6.6 | 193.9 (S b) | 9.0 | D (4) |
| 15:54:00 | 17.6 | 190 (S b) | 6.7 | 10.5 | D (4) | 1 January 2020 4:00:28 P.M. | 190.6 (S b) | 5.9 | 190.6 (S b) | 8.3 | E (5) |
| 16:54:00 | 9.5 | 180 (S b) | 6.7 | 10.5 | D (4) | 1 January 2020 5:00:28 P.M. | 183.5 (S b) | 6.1 | 183.5 (S b) | 9.0 | E (5) |
| 17:54:00 | 0.3 | 170 (S b) | 5.8 | 9.1 | D (4) | 1 January 2020 6:00:24 P.M. | 181.2 (S b) | 5.4 | 181.2 (S b) | 8.4 | E (5) |
| 18:54:00 | −10.8 | 180 (S b) | 4.9 | 8.4 | E (5) | 1 January 2020 7:00:24 P.M. | 178.8 (S b) | 5.3 | 178.8 (S b) | 8.2 | E (5) |
| 19:54:00 | −21.9 | 190 (S b) | 6.7 | 11.5 | E (5) | 1 January 2020 8:00:24 P.M. | 185.9 (S b) | 6.2 | 185.9 (S b) | 9.3 | E (5) |
| 20:54:00 | −33.5 | 190 (S b) | 6.3 | 10.7 | E (5) | 1 January 2020 9:00:24 P.M. | 181.8 (S b) | 5.3 | 181.8 (S b) | 8.2 | E (5) |
| 21:54:00 | −45.2 | 190 (S b) | 4.5 | 7.7 | E (5) | 1 January 2020 10:00:24 P.M. | 181.8 (S b) | 5.0 | 181.8 (S b) | 8.0 | E (5) |
| 22:54:00 | −56.6 | 180 (S b) | 4.9 | 8.4 | E (5) | 1 January 2020 11:00:24 P.M. | 179.3 (S b) | 4.6 | 179.3 (S b) | 7.6 | E (5) |
| 23:54:00 | −67.0 | 180 (S b) | 6.3 | 10.7 | E (5) |

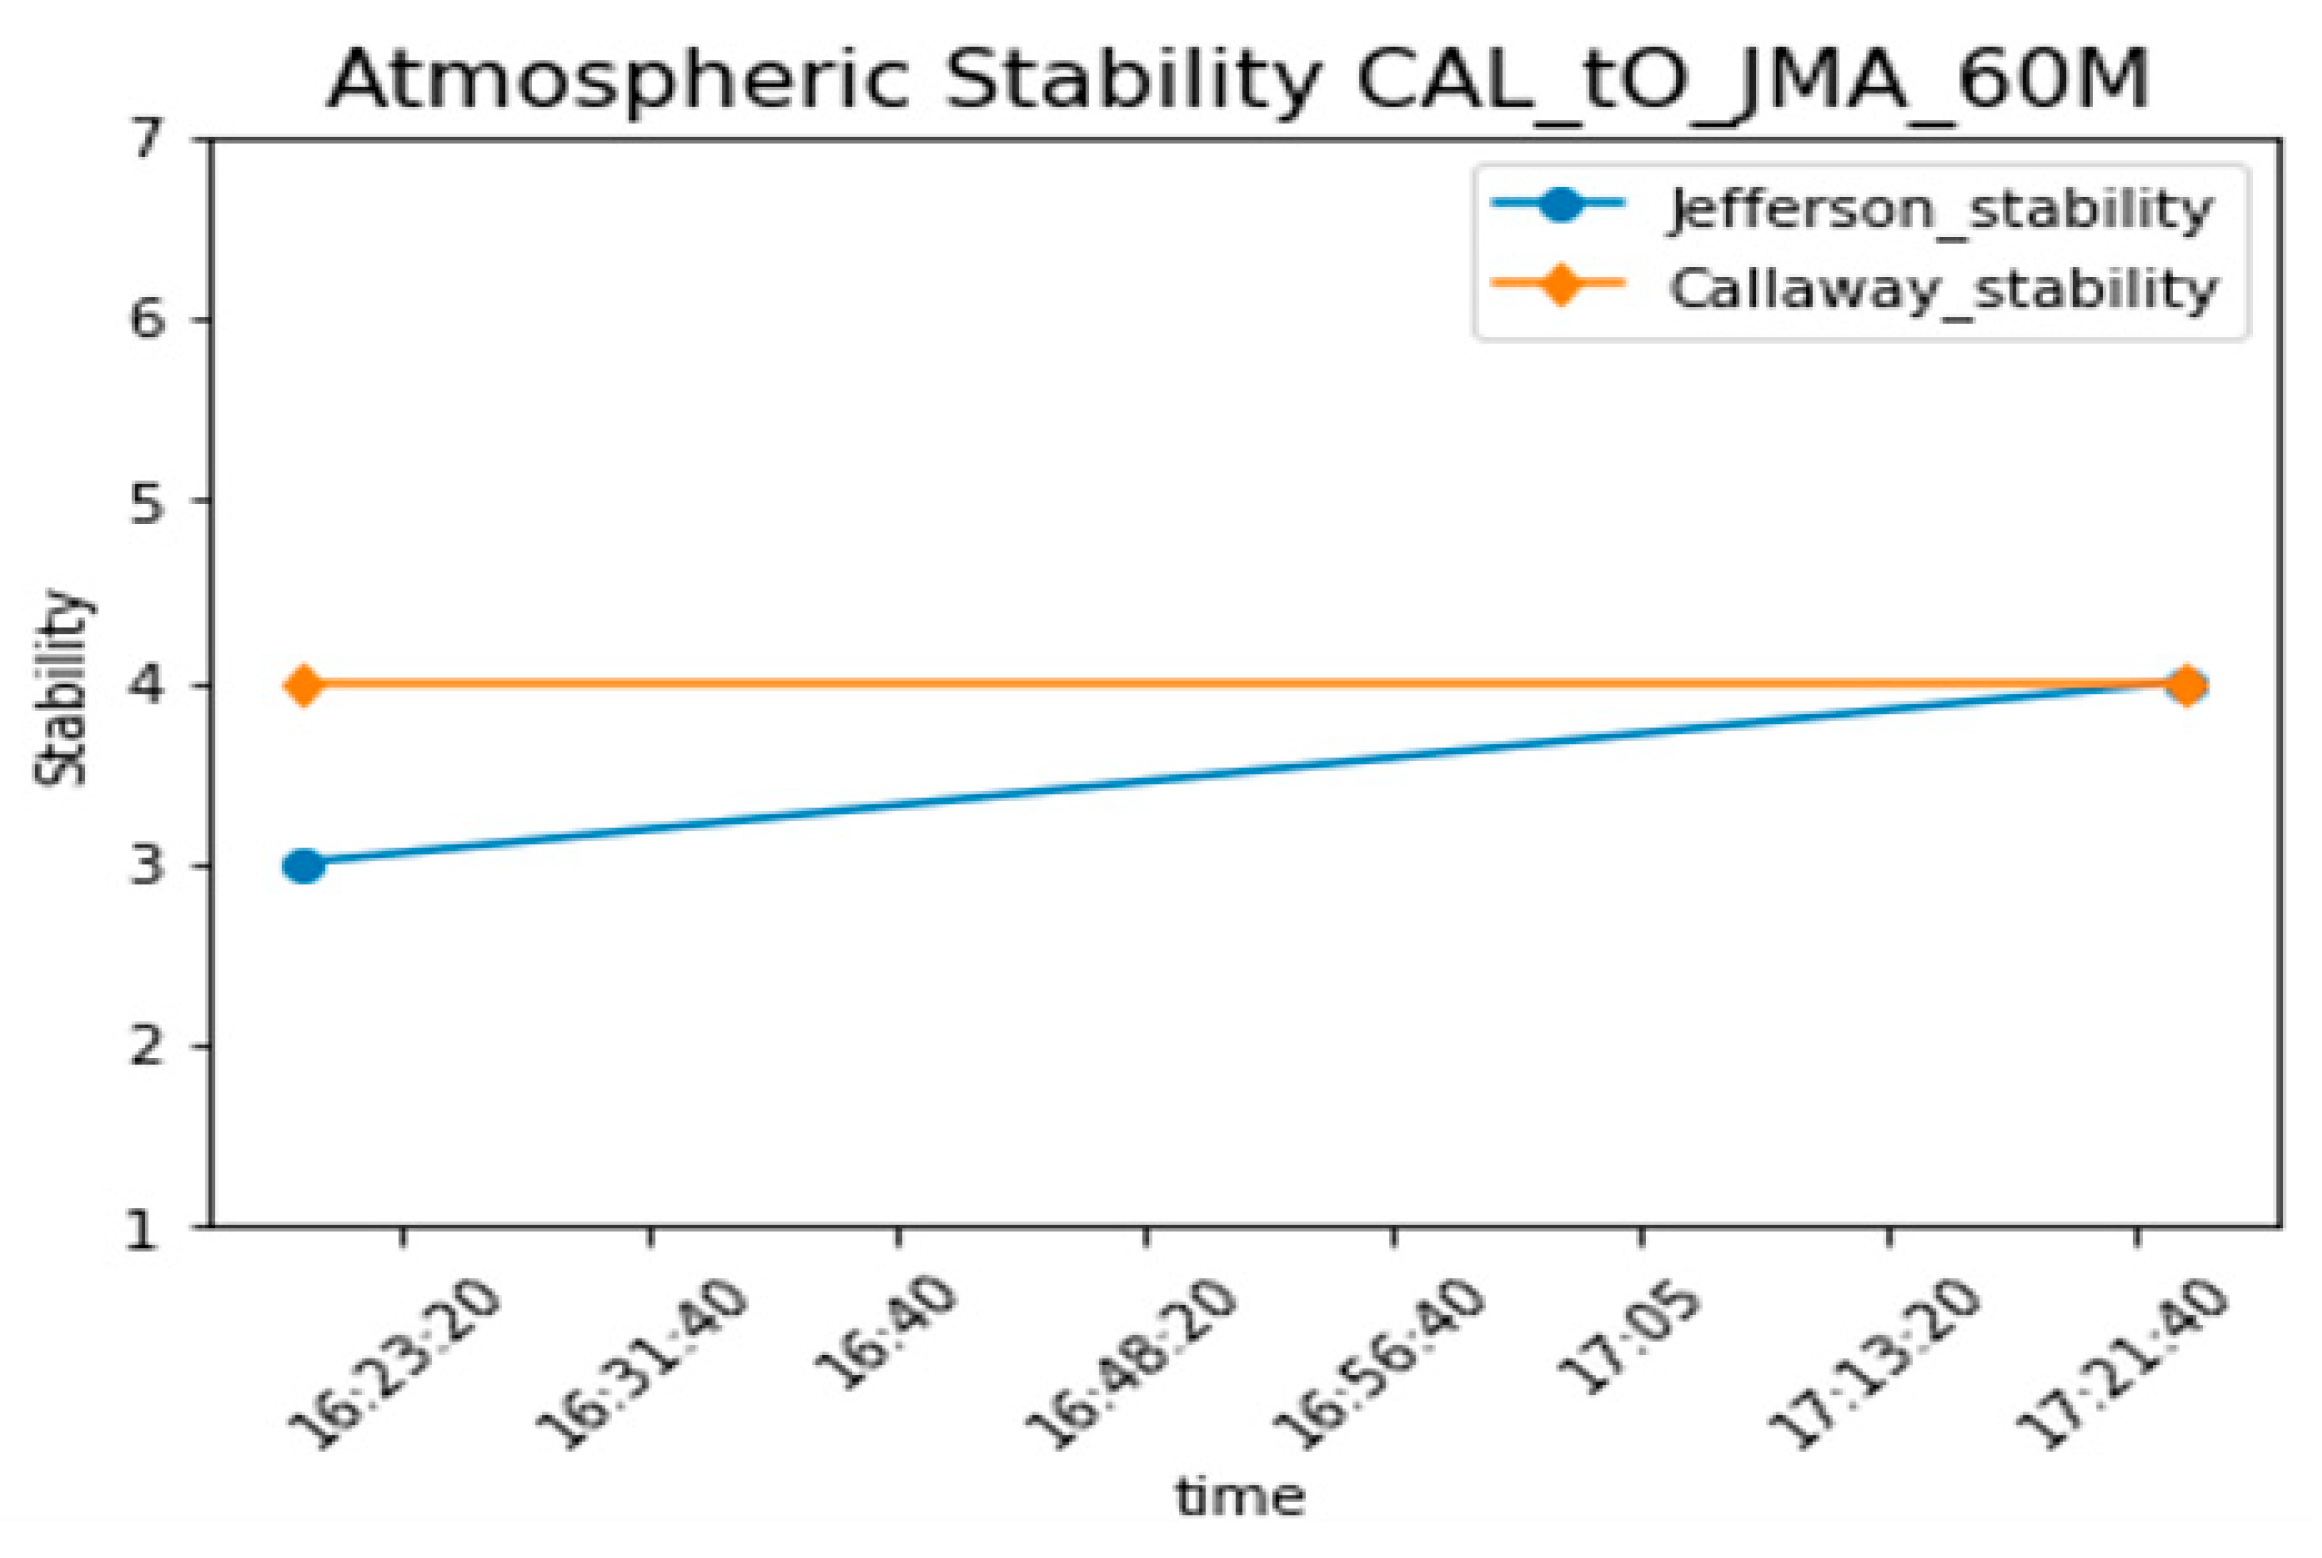
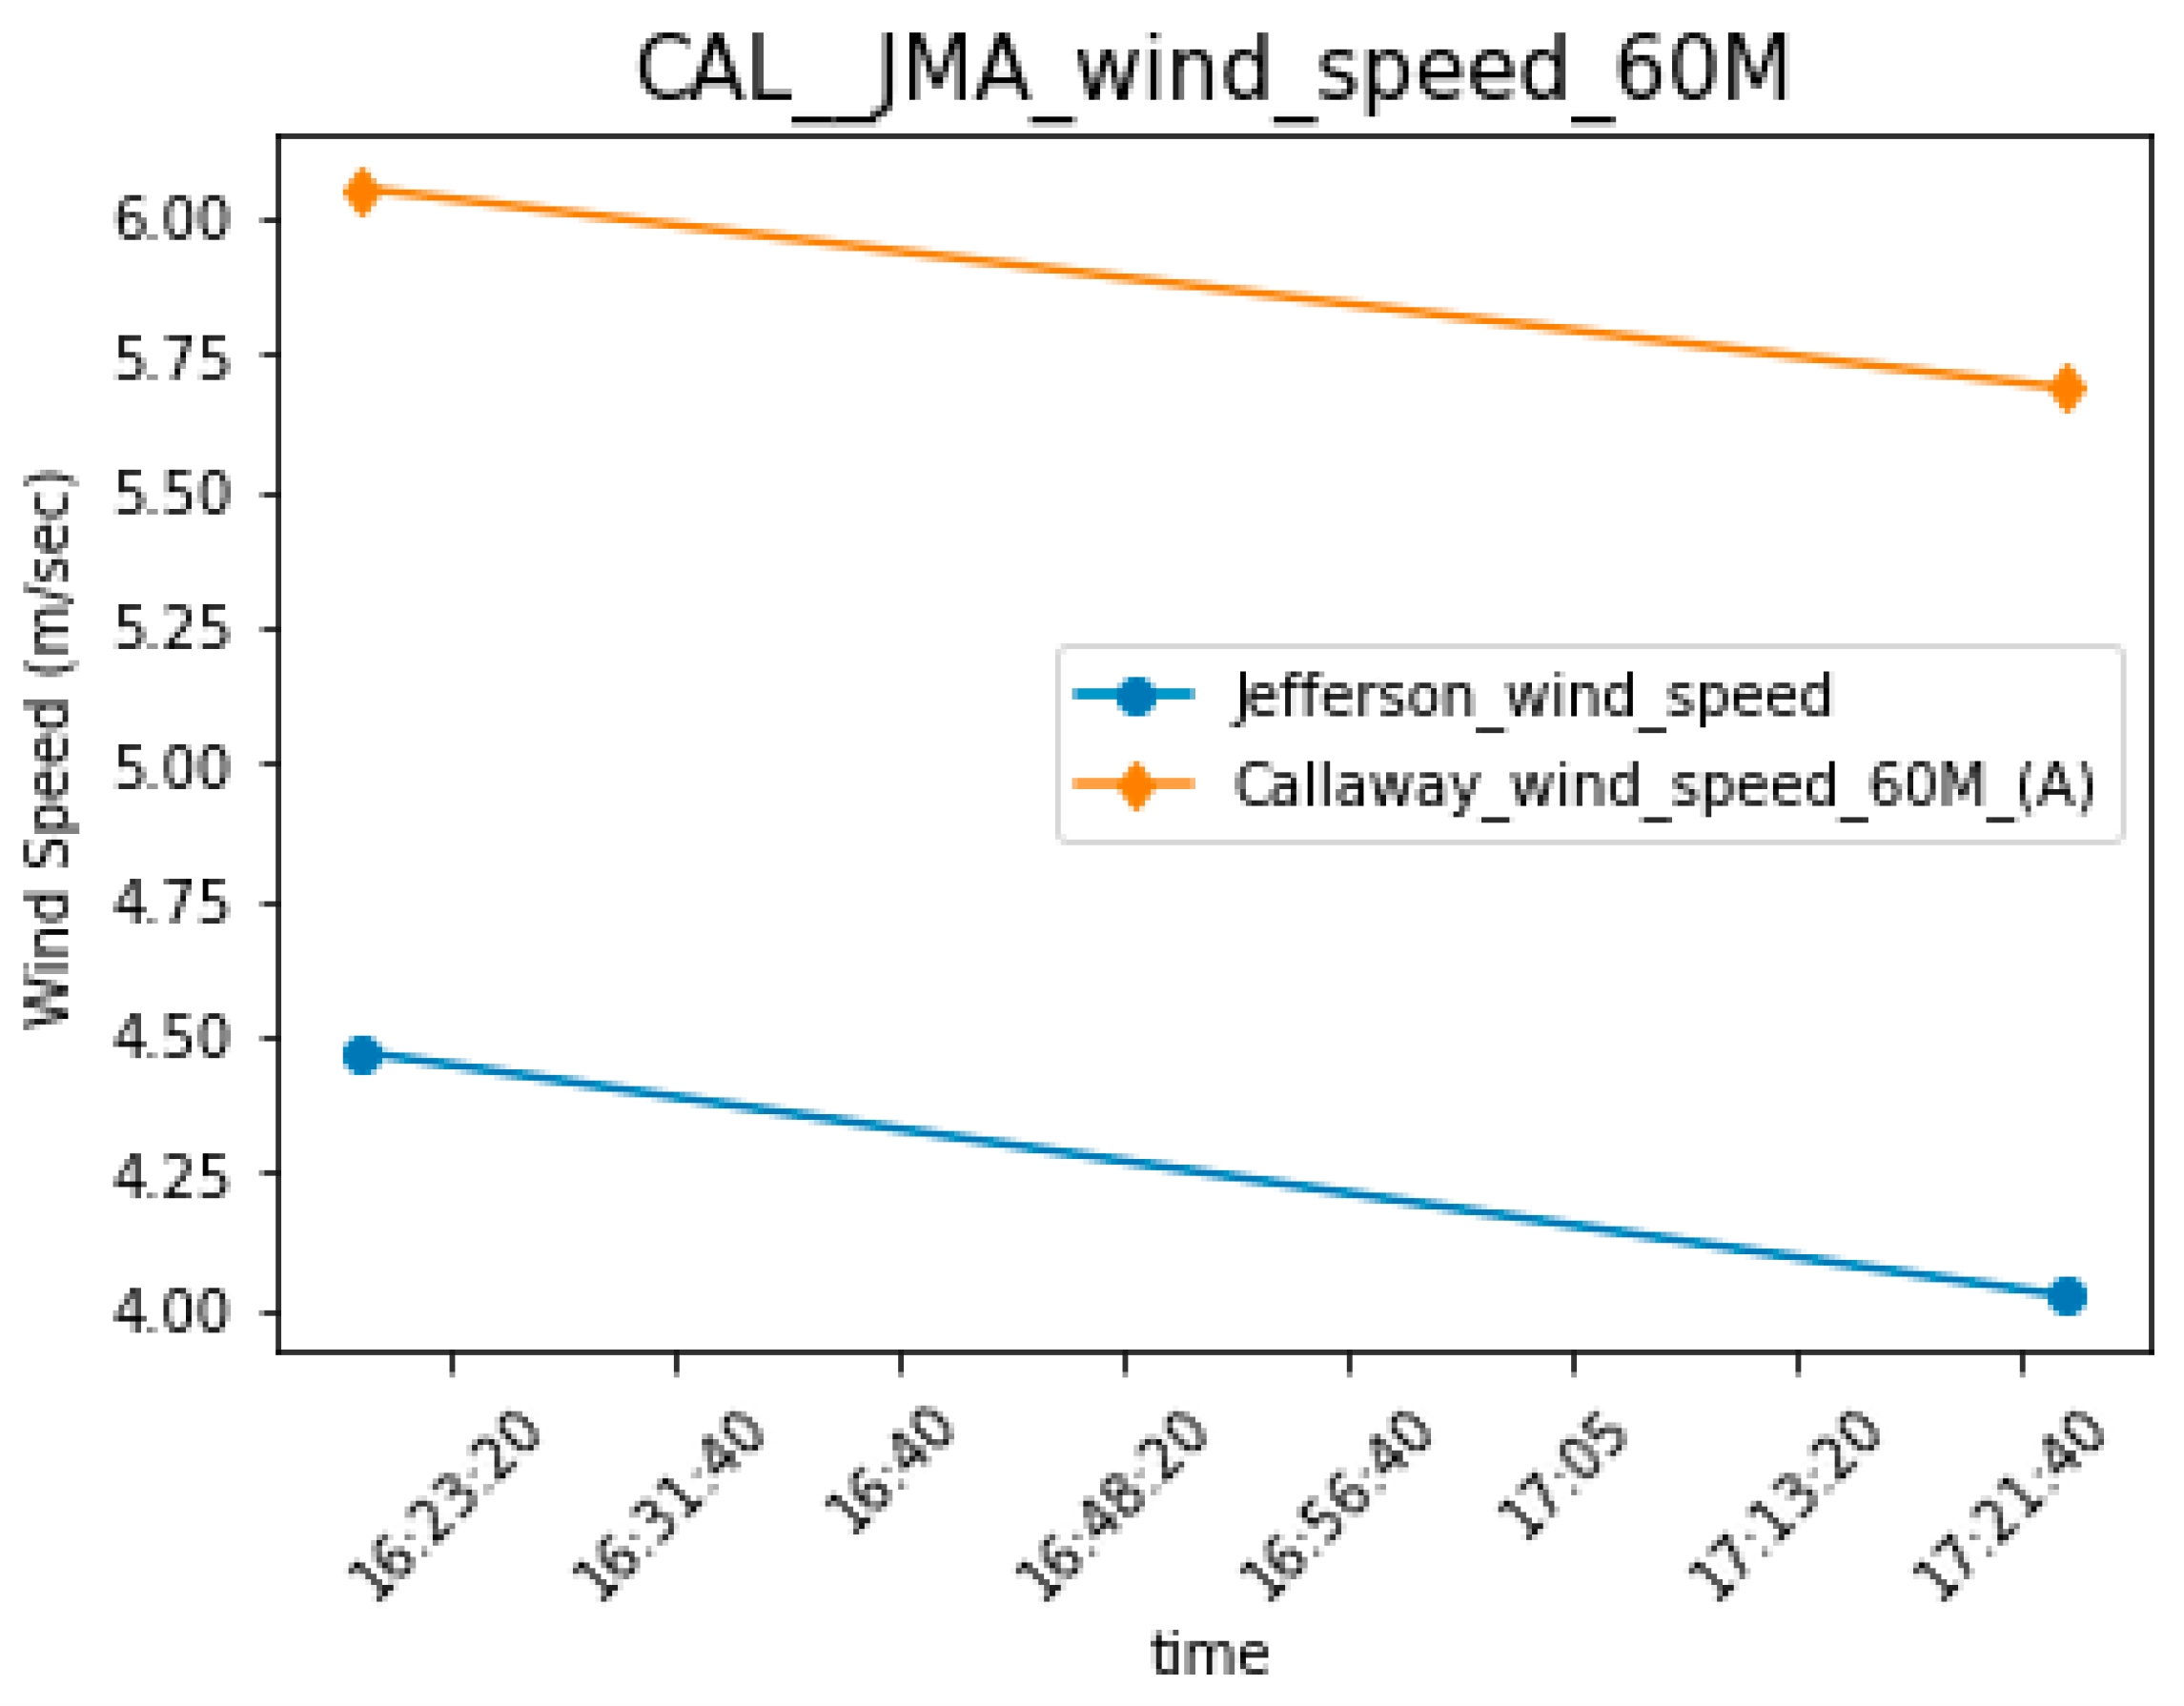
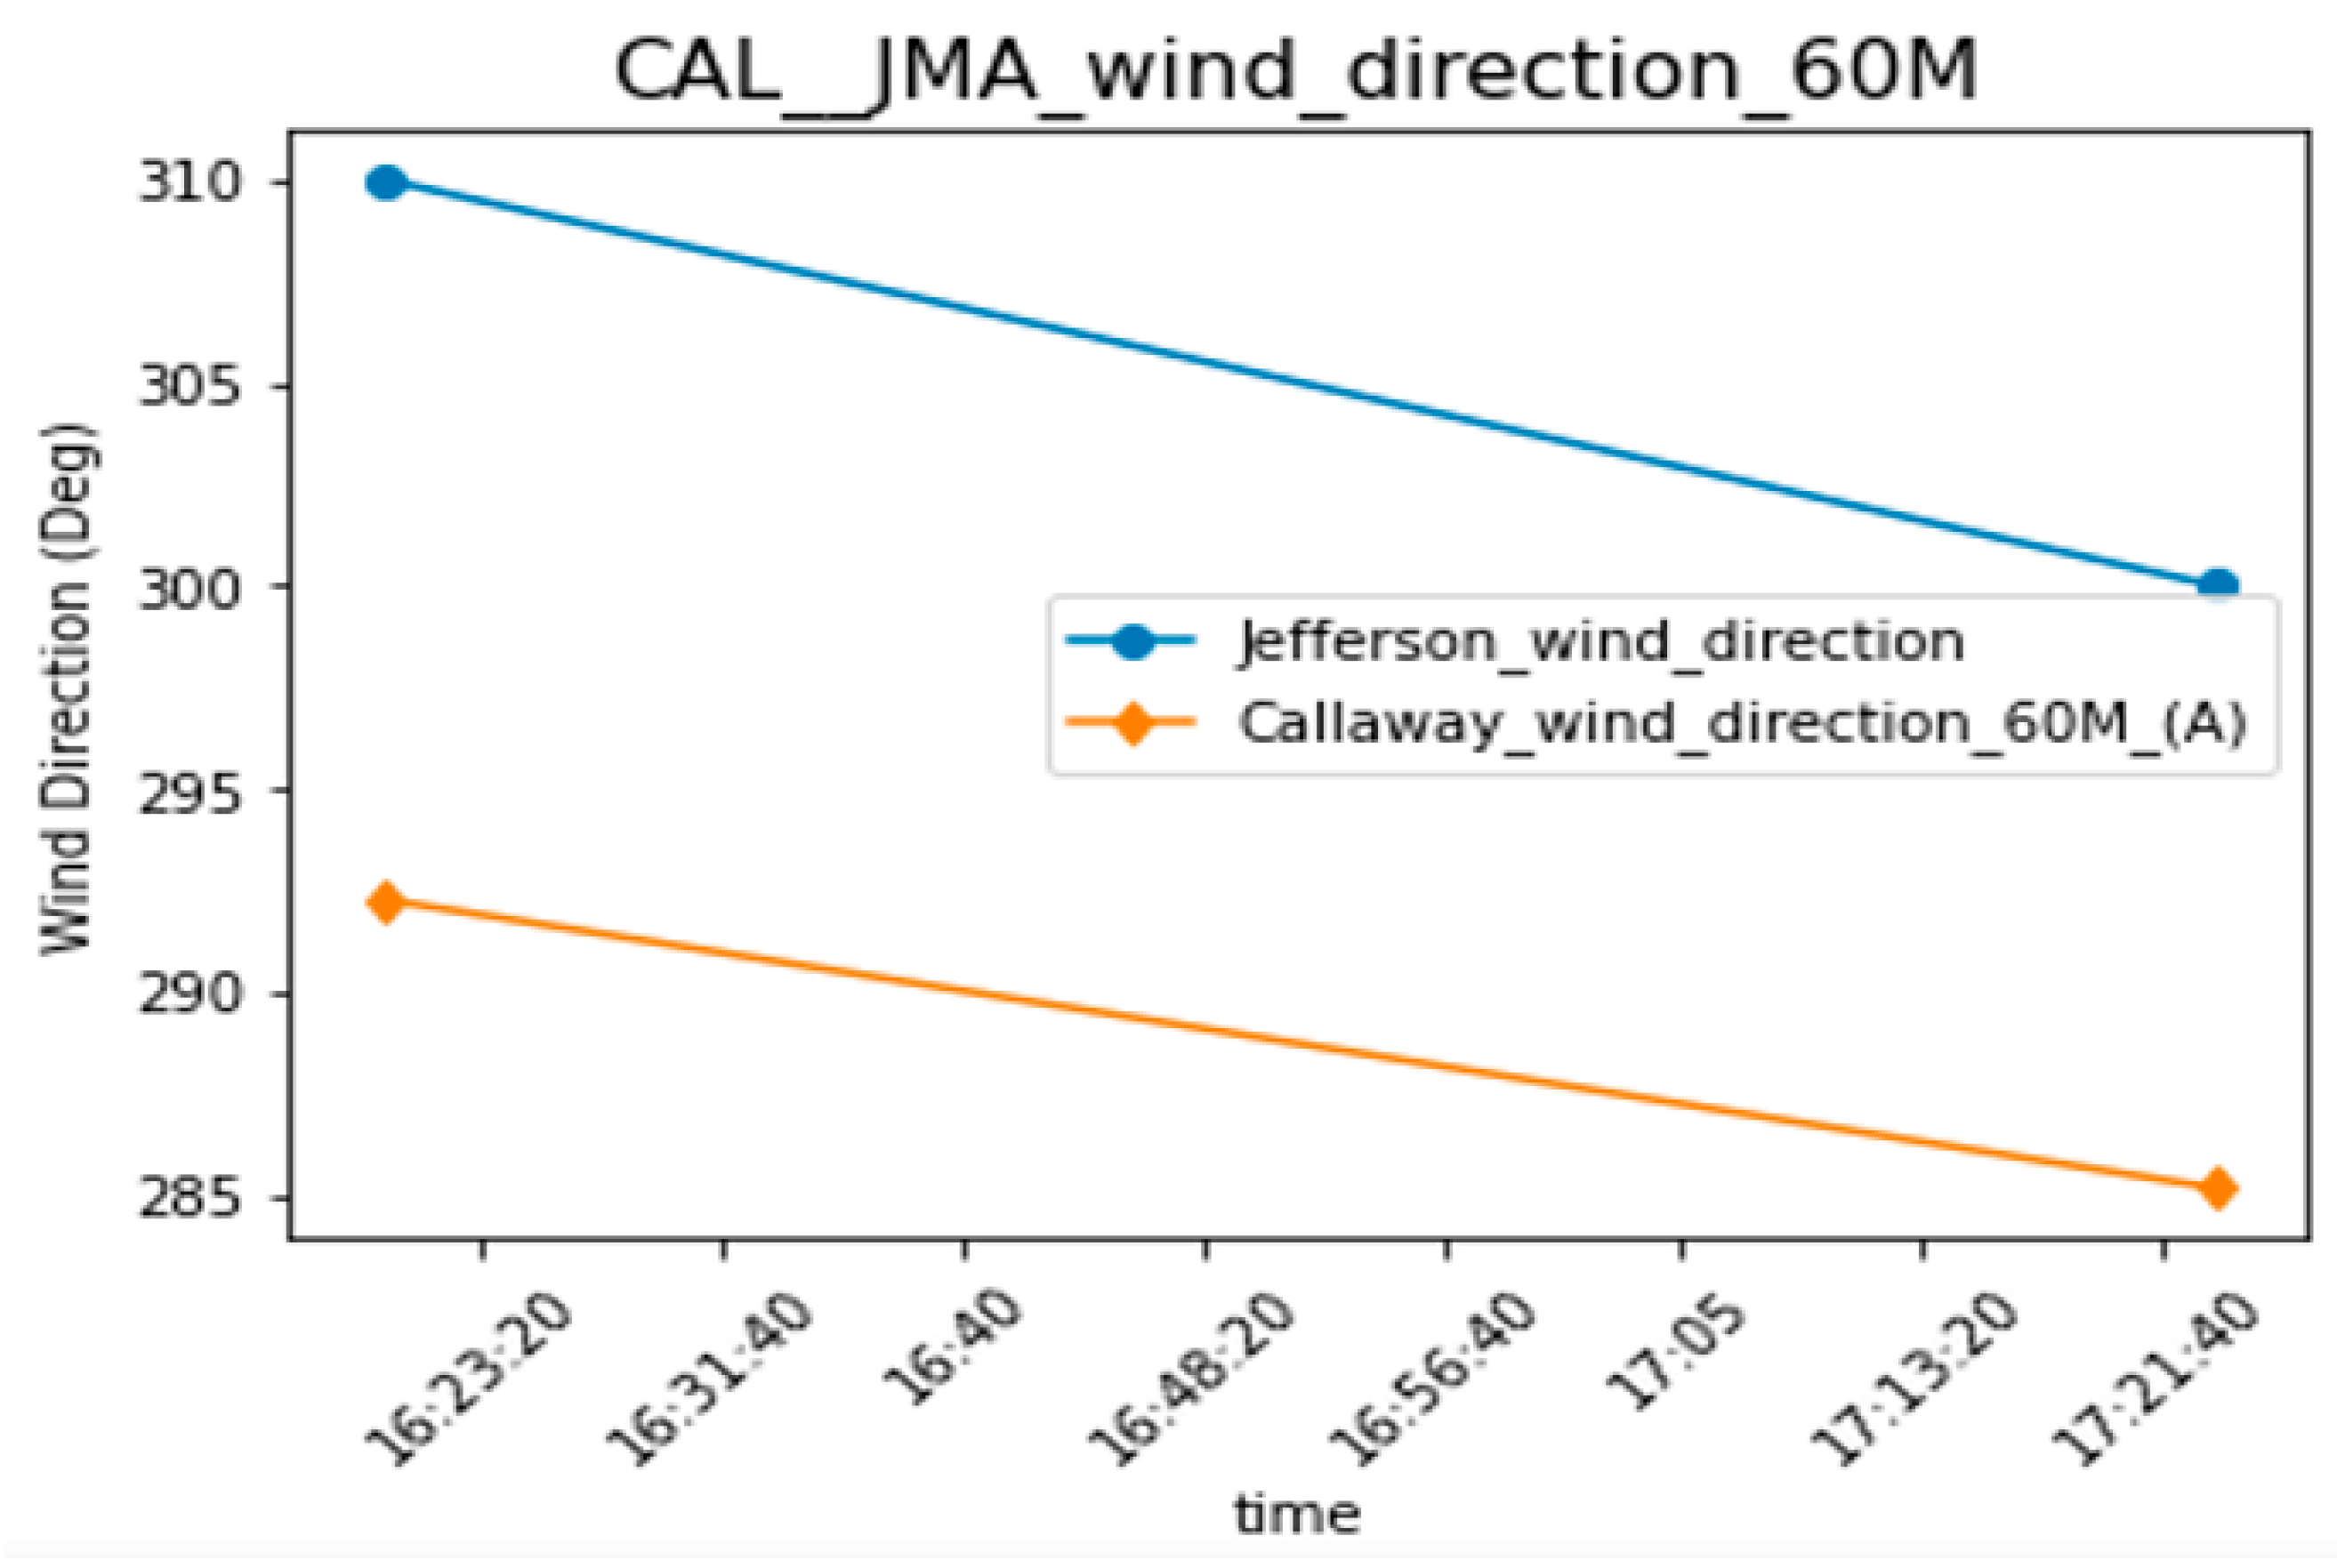
| Callaway Time | Callaway Wind Direction in Number 60 m (A) | Callaway Hourly Wind Speed (m/s) at 60 m (A) | Callaway Stability a 60 m and 10 m | Travel Time | Arrival Time | Jefferson City Memorial Airport Time | JMA Solar Elevation Corrected for Atm Refraction (deg) | JMA Hourly Wind Direction (deg) | JMA Wind Speed (m/s) | JMA Stability Letters |
|---|---|---|---|---|---|---|---|---|---|---|
| 19 January 2020 12:30:00 | 292.3 (W b) | 6.1 | D (4) | 0 days 03:49:55 | 19 January 2020 16:19:56 | 19 January 2020 16:15:31 | 18.1 | 310 (NW b) | 4.5 | C (3) |
| 19 January 2020 13:00:00 | 285.2 (W b) | 5.7 | D (4) | 0 days 04:23:28 | 19 January 2020 17:23:28 | 19 January 2020 17:20:31 | 8.5 | 300 (NW b) | 4.0 | D (4) |
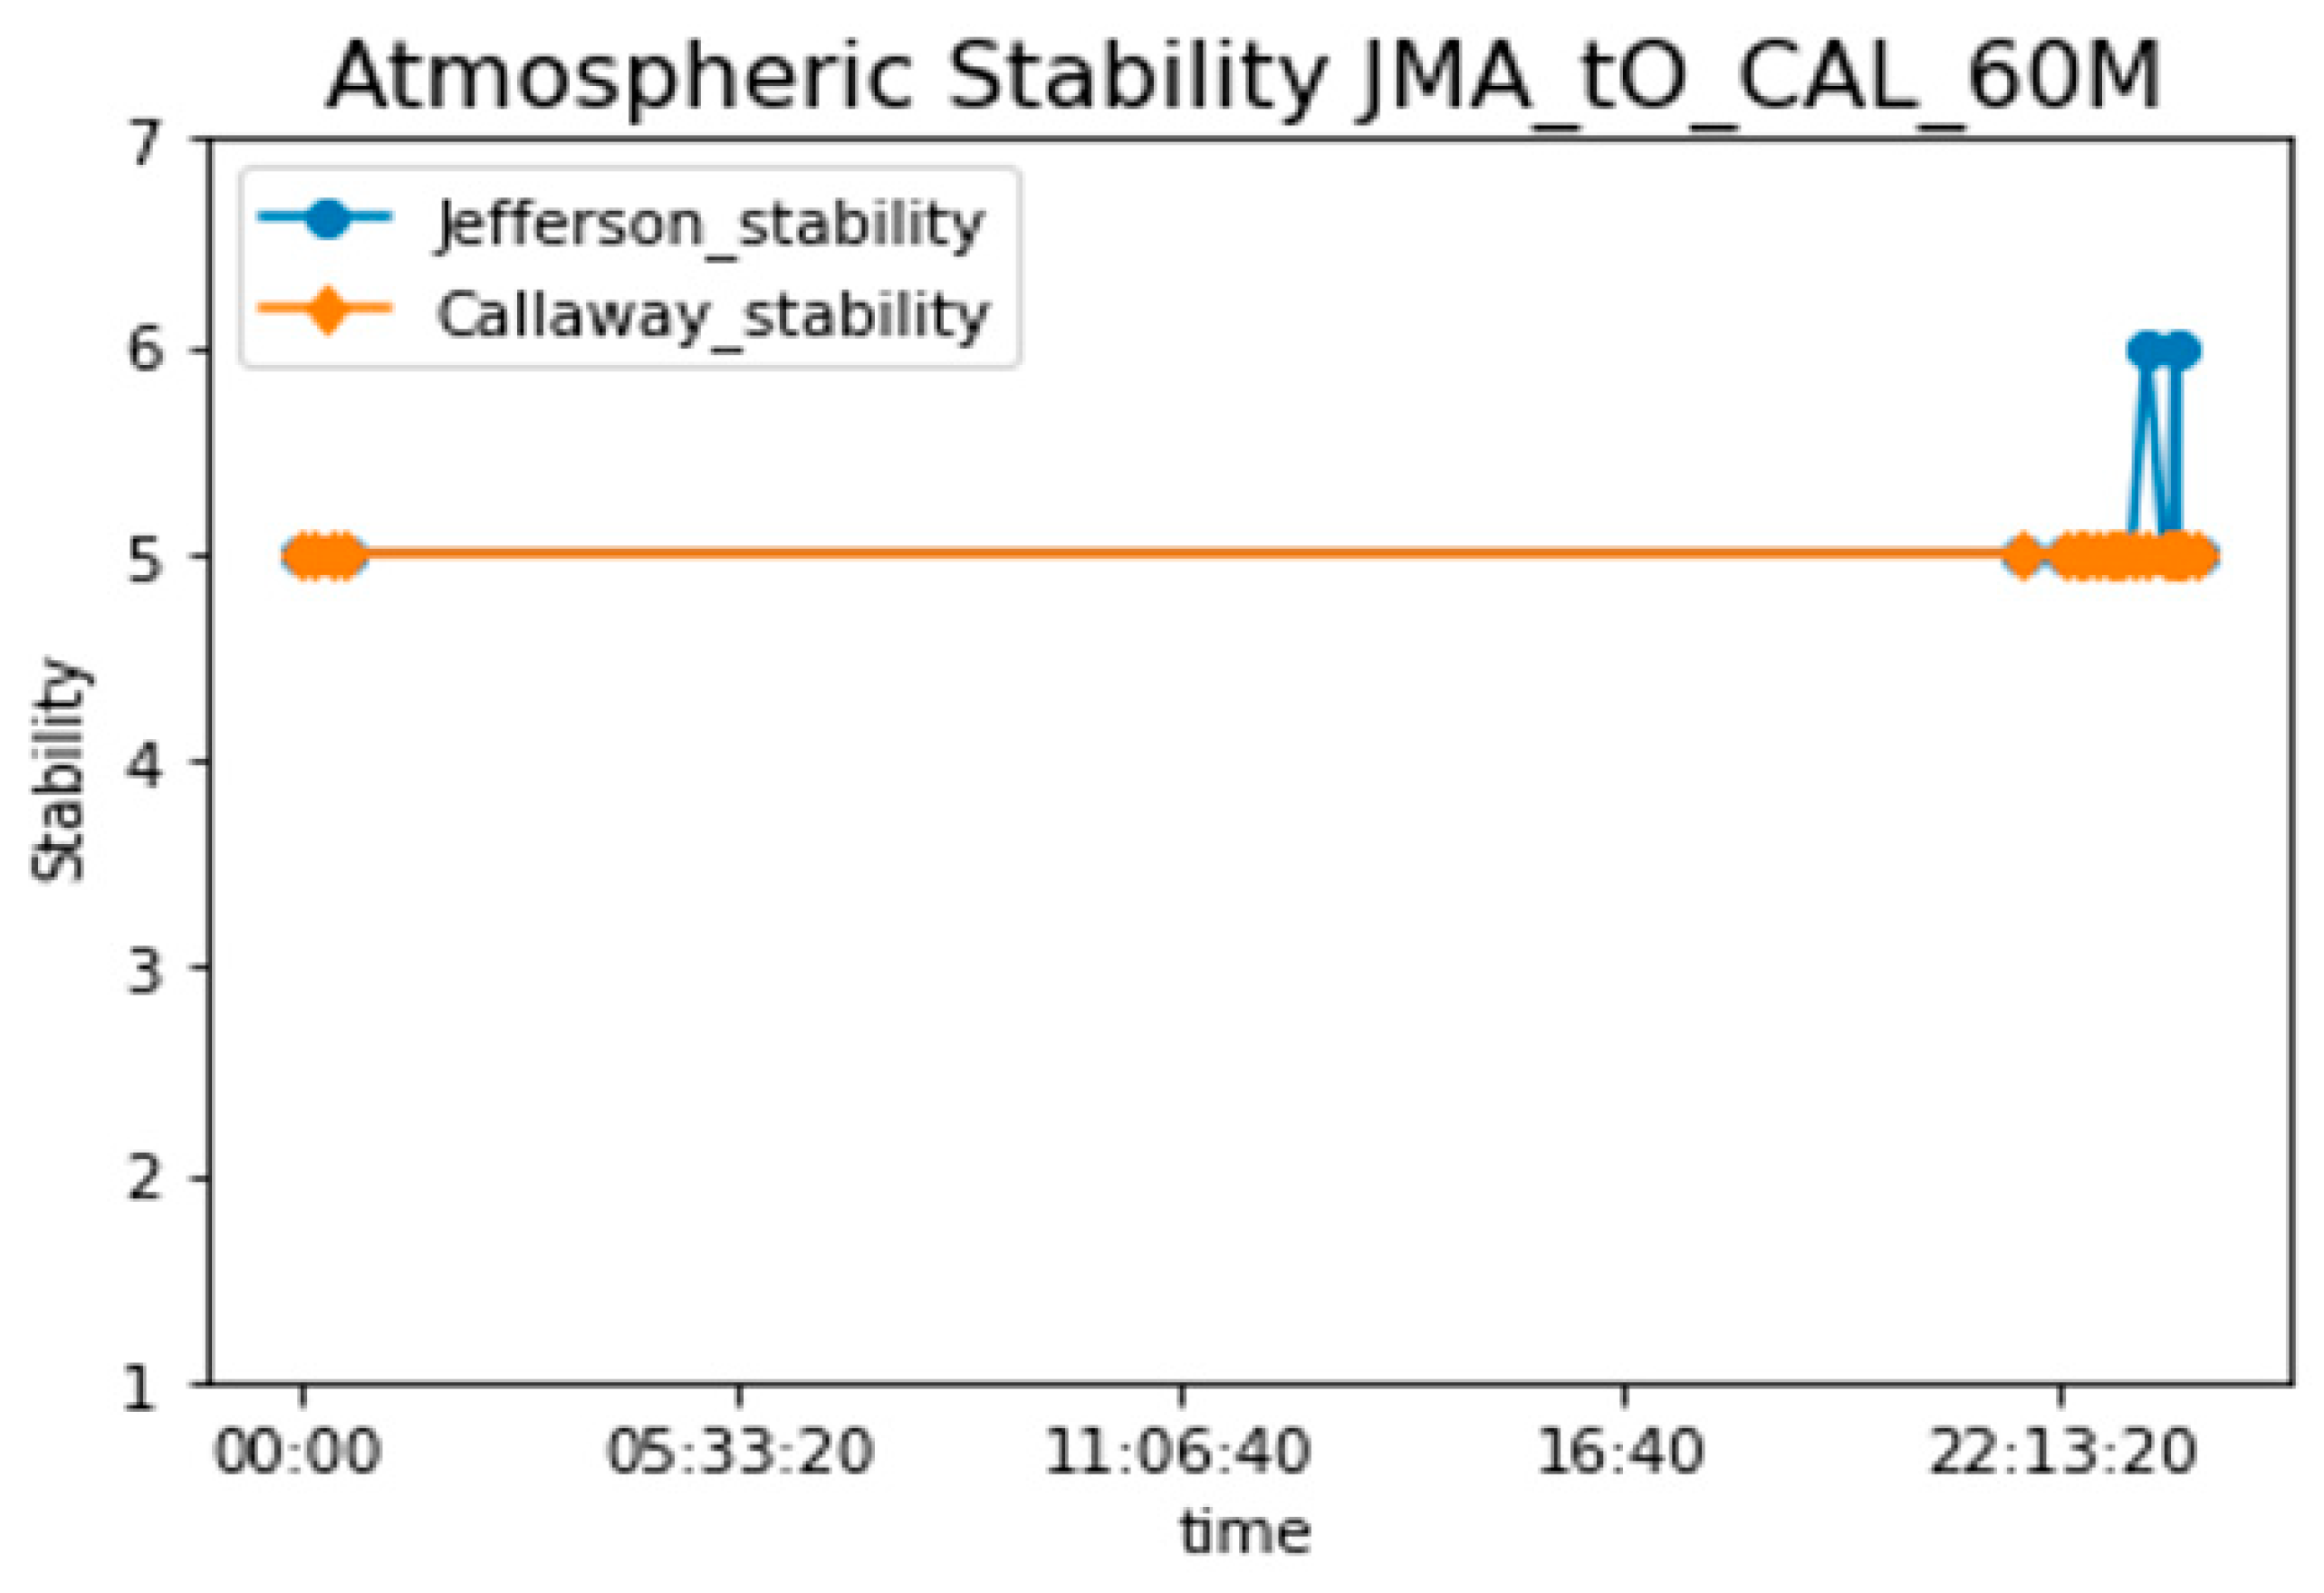
| Jefferson City Memorial Airport Time | JMA Solar Elevation Corrected for Atm Refraction (deg) | JMA Hourly Wind Direction (deg) | JMA Wind Speed (m/s) | JMA Stability | Travel Time | Arriva Time | Callaway Time | Callaway Wind Direction in Number 60 m (A) | Callaway Hourly Wind Speed (m/s) at 60 m (A) | Callaway Stability a 60 m and 10 m |
|---|---|---|---|---|---|---|---|---|---|---|
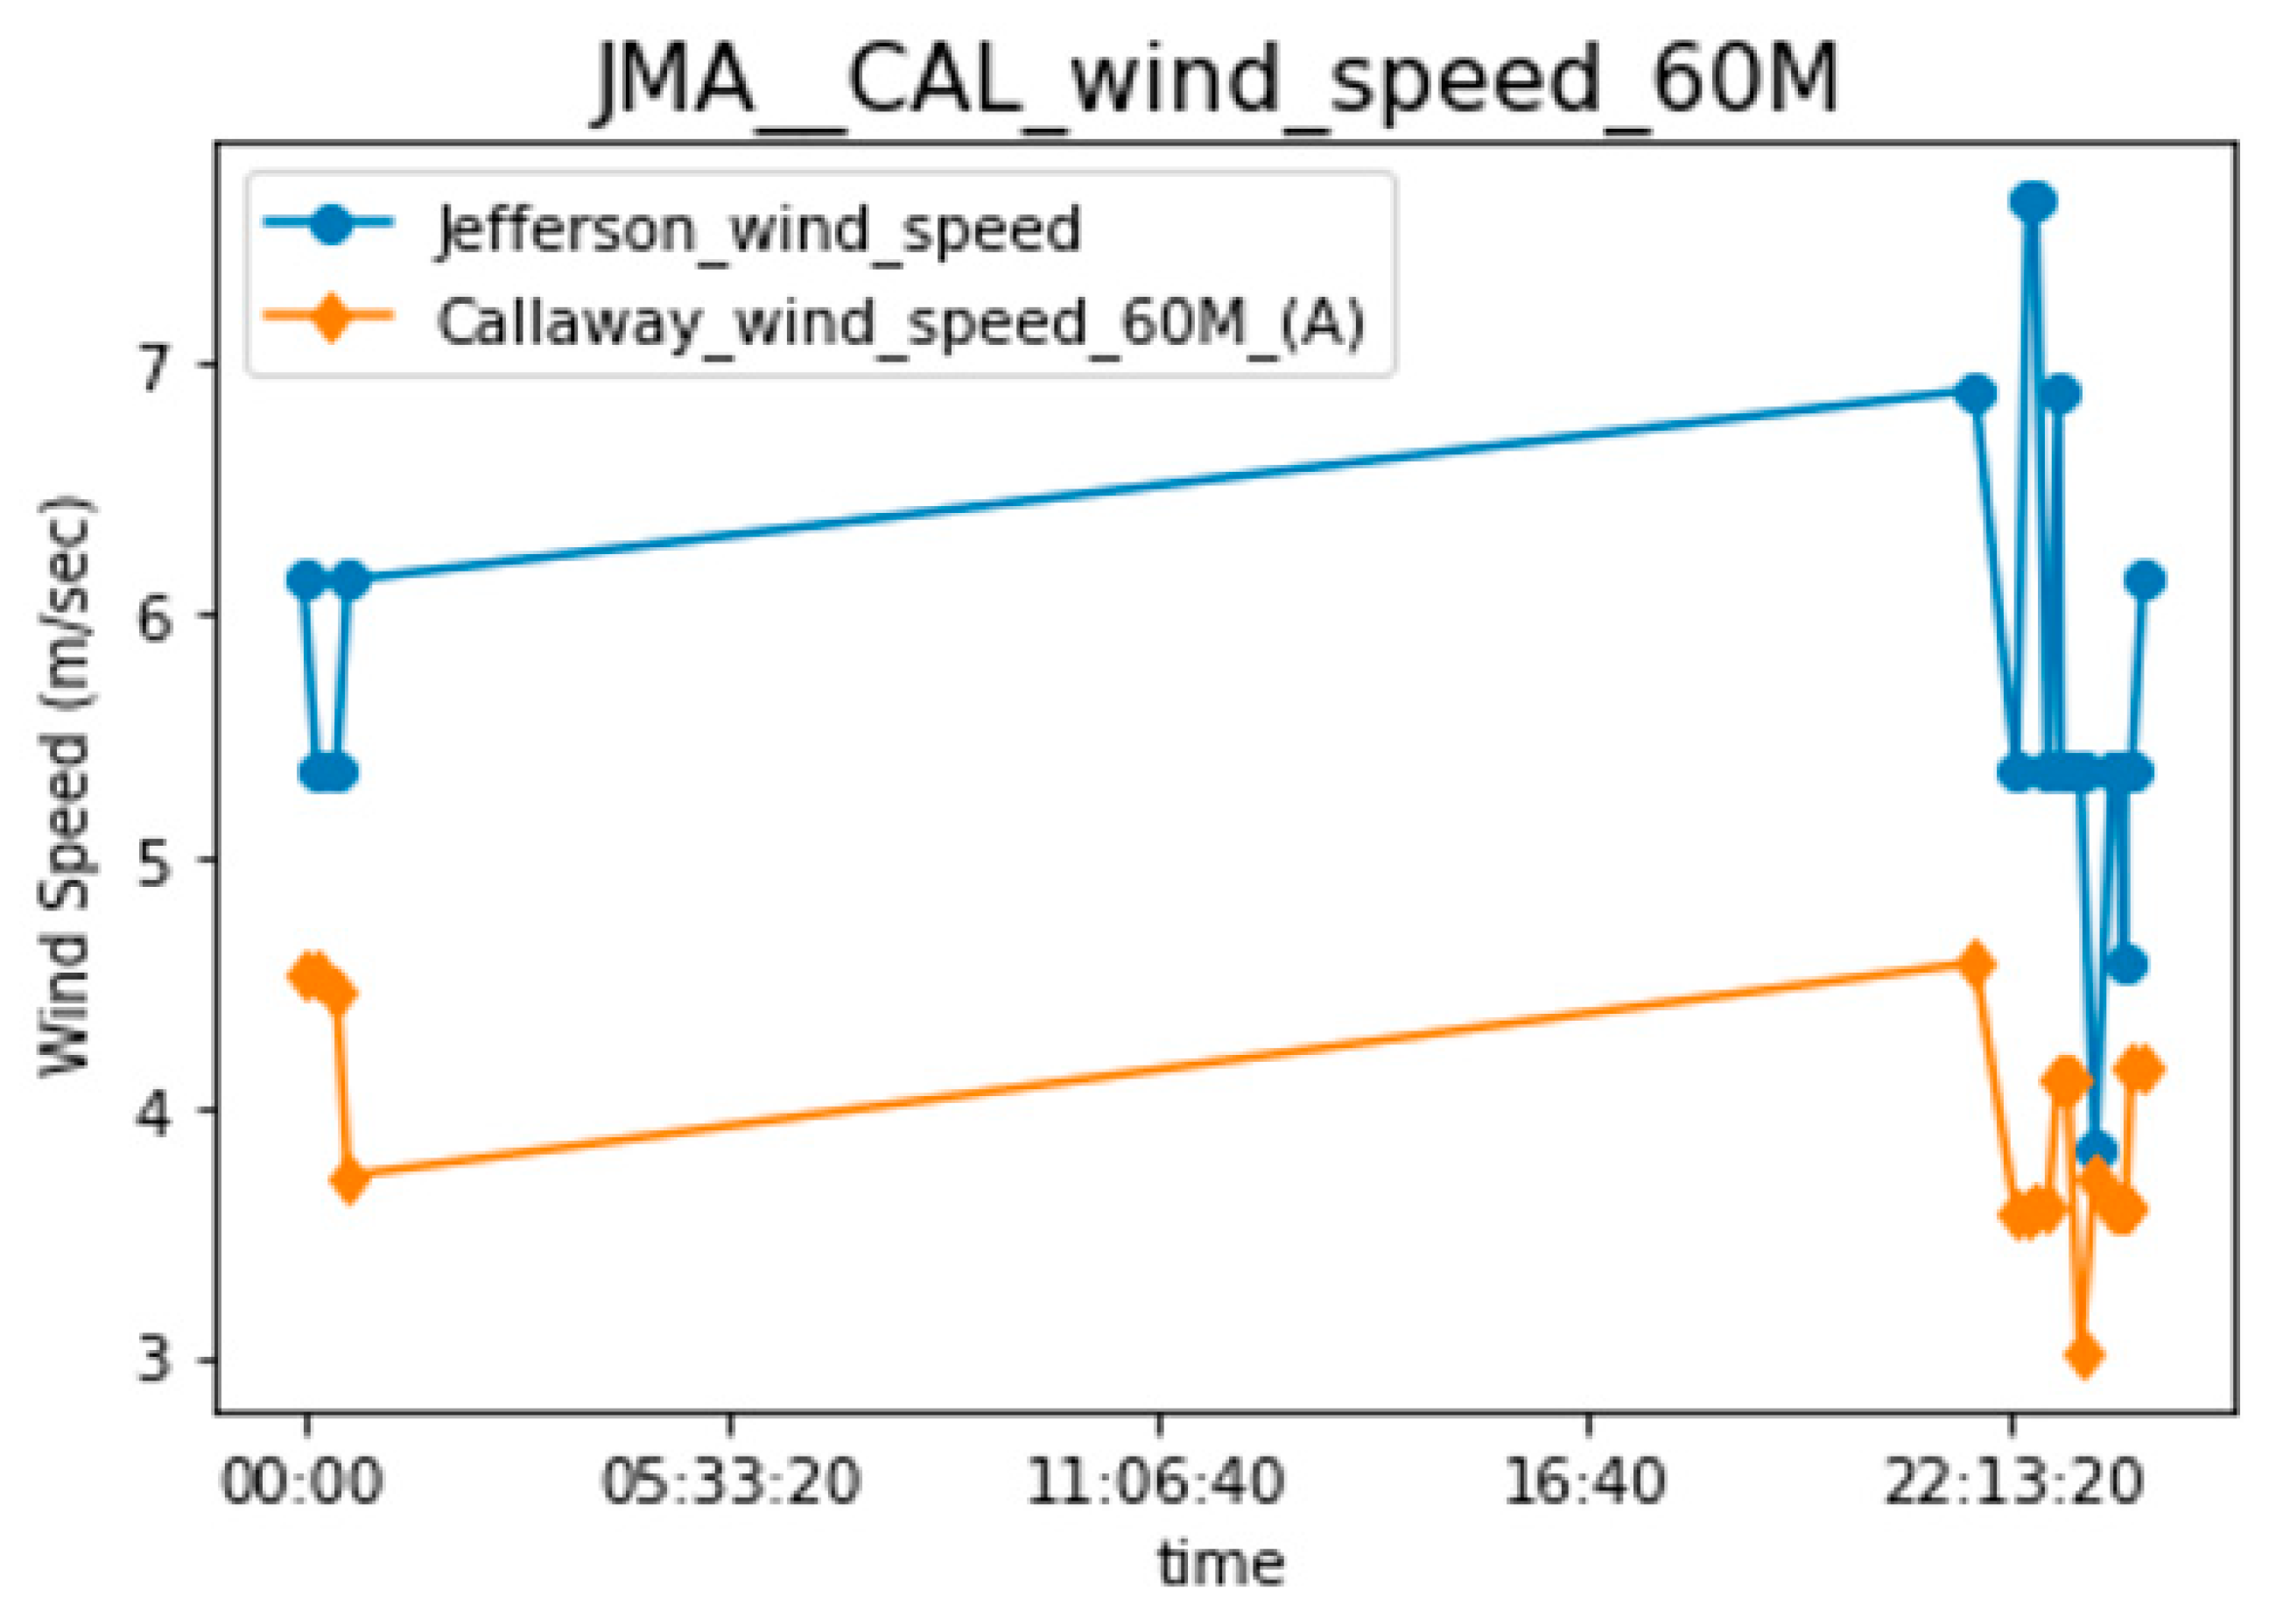
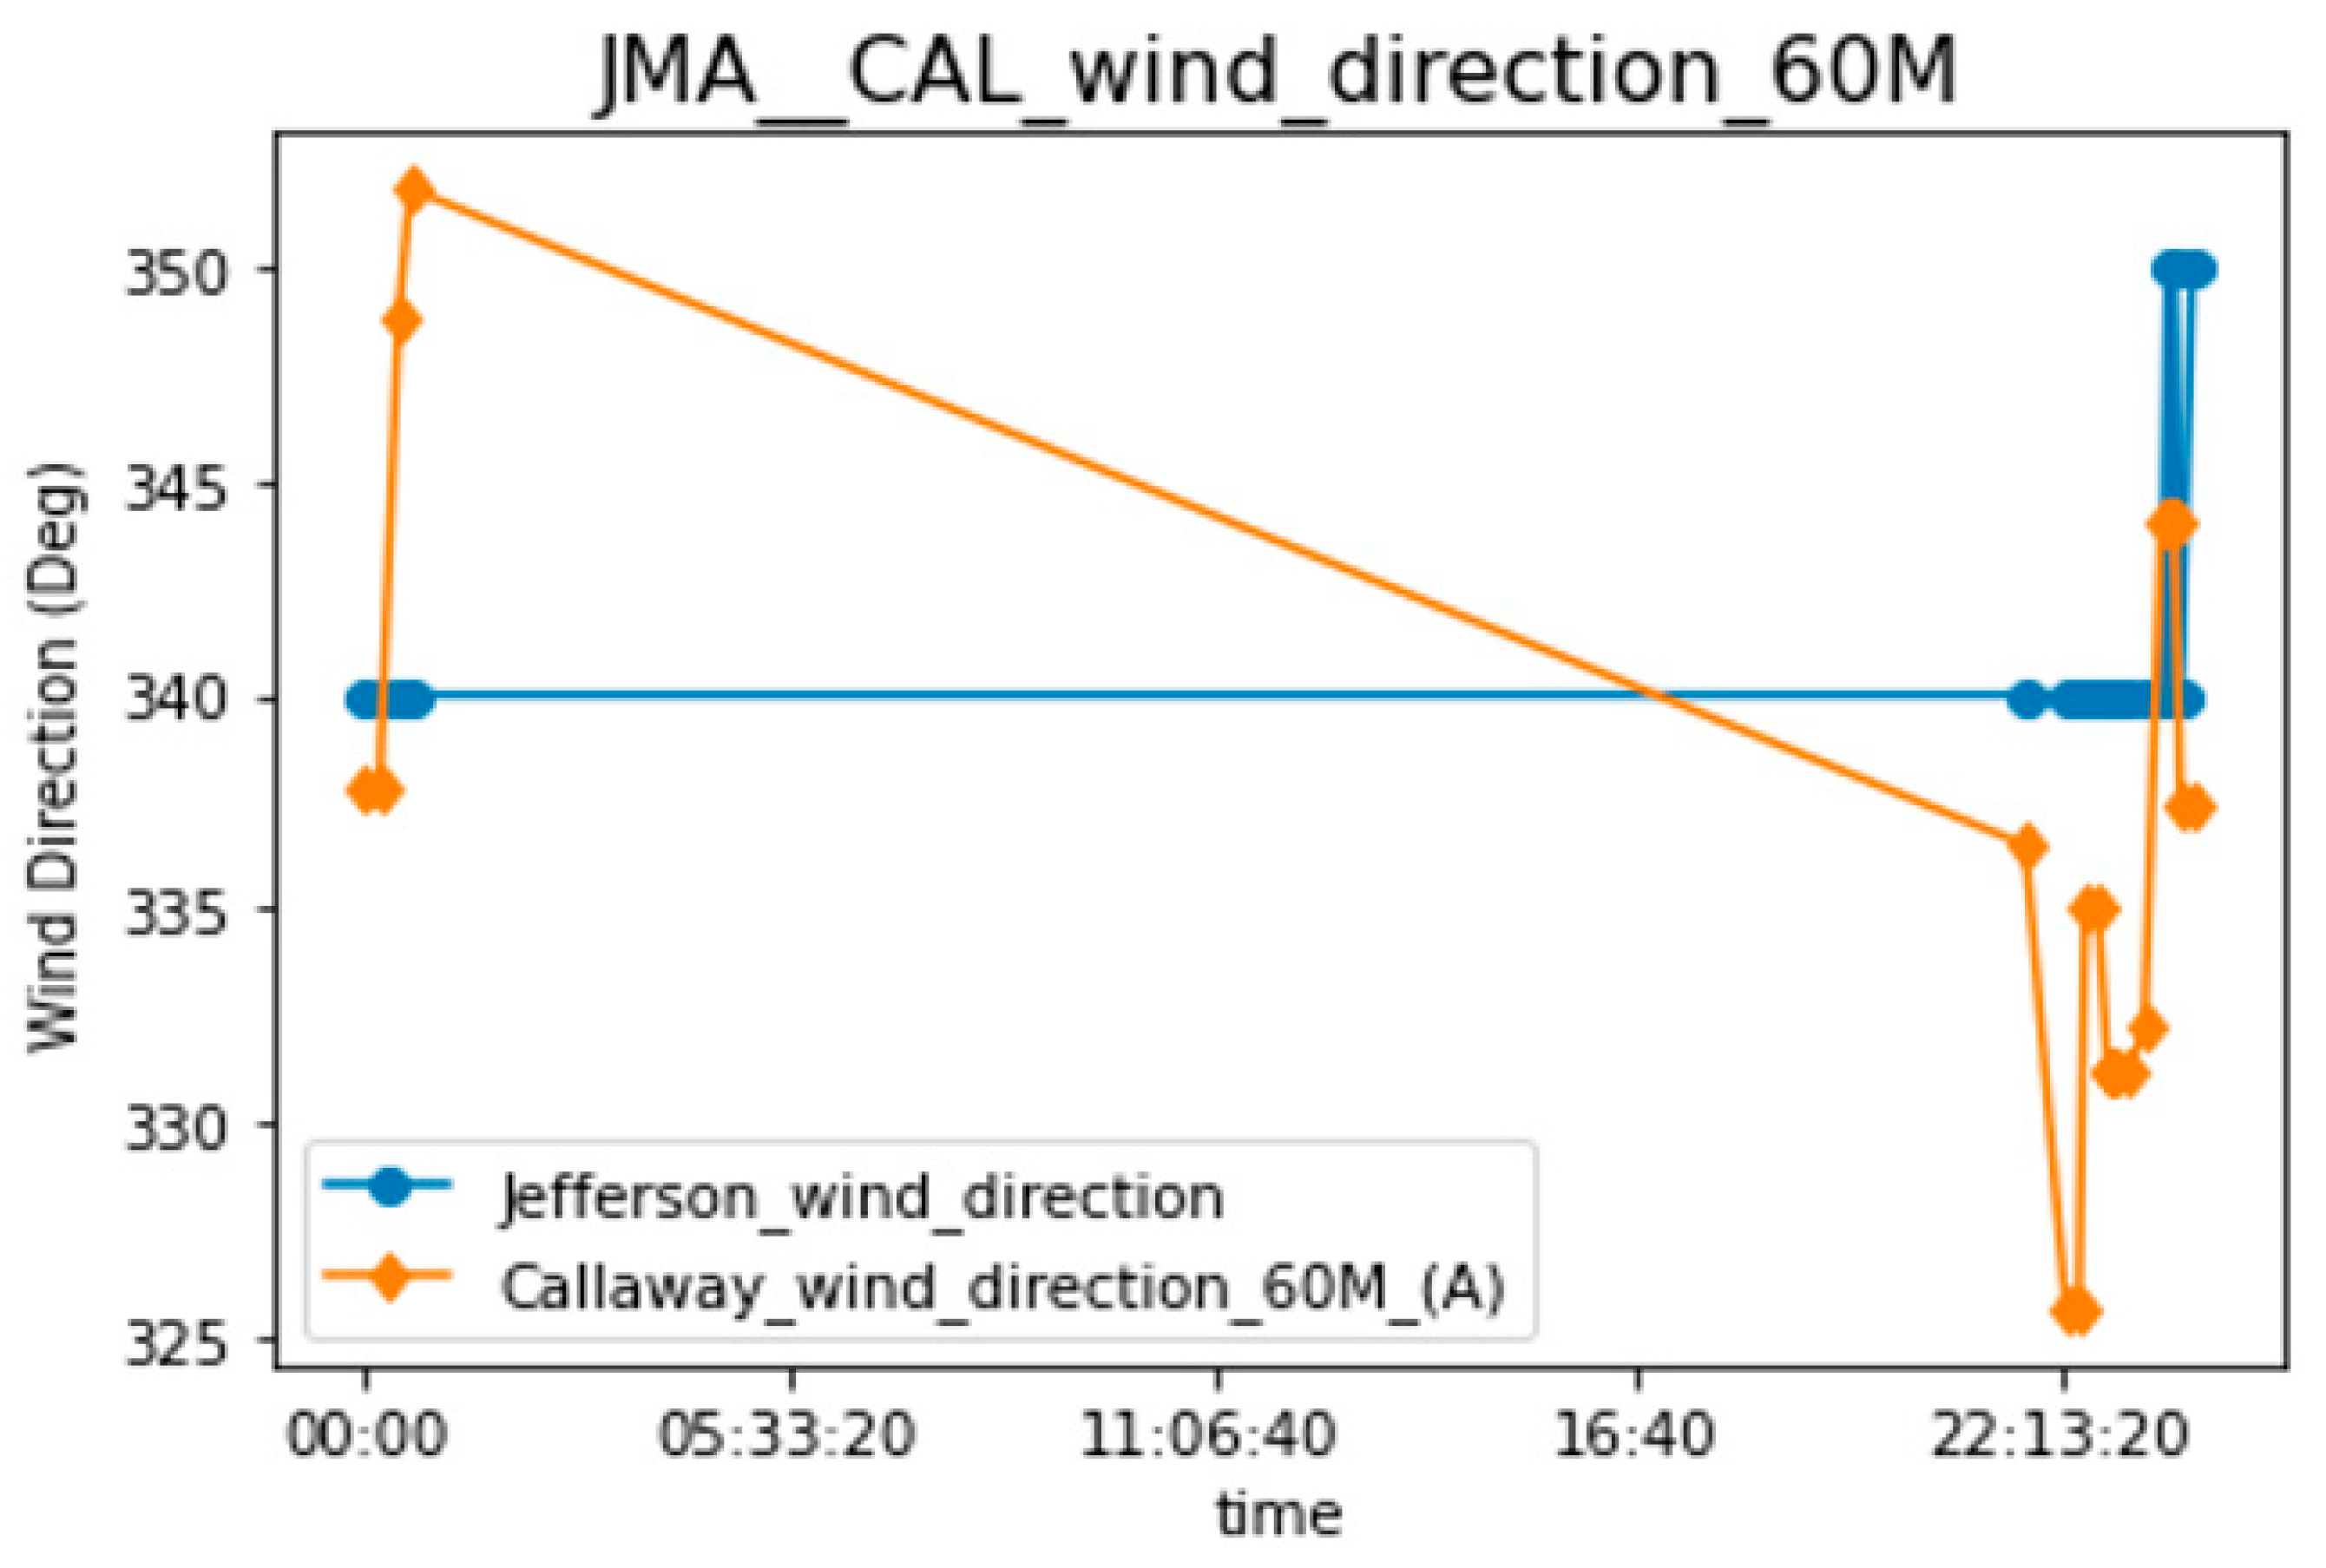
| 19 January 2020 19:35:31 | −15.5 | 340 (N b) | 6.9 | E (5) | 0 days 02:09:32 | 19 January 2020 21:45:04 | 19 January 2020 21:45:00 | 336.5 (NW b) | 4.6 | E (5) |
| 19 January 2020 19:30:31 | −14.6 | 340 (N b) | 5.4 | E (5) | 0 days 02:46:33 | 19 January 2020 22:17:05 | 19 January 2020 22:15:00 | 325.7 (NW b) | 3.6 | E (5) |
| 19 January 2020 20:30:31 | −26.1 | 340 (N b) | 7.7 | E (5) | 0 days 01:56:35 | 19 January 2020 22:27:07 | 19 January 2020 22:15:00 | 325.7 (NW b) | 3.6 | E (5) |
| 19 January 2020 20:35:31 | −27.1 | 340 (N b) | 7.7 | E (5) | 0 days 01:56:35 | 19 January 2020 22:32:06 | 19 January 2020 22:30:00 | 335.1 (NW b) | 3.6 | E (5) |
| 19 January 2020 19:55:31 | −19.3 | 340 (N b) | 5.4 | E (5) | 0 days 02:46:33 | 19 January 2020 22:42:04 | 19 January 2020 22:30:00 | 335.1 (NW b) | 3.6 | E (5) |
| 19 January 2020 20:40:31 | −28.0 | 340 (N b) | 6.9 | E (5) | 0 days 02:09:32 | 19 January 2020 22:50:04 | 19 January 2020 22:45:00 | 331.2 (NW b) | 4.1 | E (5) |
| 19 January 2020 20:05:31 | −21.3 | 340 (N b) | 5.4 | E (5) | 0 days 02:46:33 | 19 January 2020 22:52:04 | 19 January 2020 22:45:00 | 331.2 (NW b) | 4.1 | E (5) |
| 19 January 2020 20:10:31 | −22.2 | 340 (N b) | 5.4 | E (5) | 0 days 02:46:33 | 19 January 2020 22:57:05 | 19 January 2020 22:45:00 | 331.2 (NW b) | 4.1 | E (5) |
| 19 January 2020 20:20:31 | −24.2 | 340 (N b) | 5.4 | E (5) | 0 days 02:46:33 | 19 January 2020 23:07:05 | 19 January 2020 23:00:00 | 331.2 (NW b) | 3.0 | E (5) |
| 19 January 2020 19:25:31 | −13.6 | 340 (N b) | 3.8 | F (6) | 0 days 03:53:11 | 19 January 2020 23:18:42 | 19 January 2020 23:15:00 | 332.3 (NW b) | 3.7 | E (5) |
| 19 January 2020 20:45:31 | −29.0 | 340 (N b) | 5.4 | E (5) | 0 days 02:46:33 | 19 January 2020 23:32:04 | 19 January 2020 23:30:00 | 344.1 (N b) | 3.6 | E (5) |
| 19 January 2020 20:50:31 | −30.0 | 350 (N b) | 5.4 | E (5) | 0 days 02:46:33 | 19 January 2020 23:37:04 | 19 January 2020 23:30:00 | 344.1 (N b) | 3.6 | E (5) |
| 19 January 2020 20:25:31 | −25.1 | 340 (N b) | 4.6 | F (6) | 0 days 03:14:19 | 19 January 2020 23:39:50 | 19 January 2020 23:30:00 | 344.1 (N b) | 3.6 | E (5) |
| 19 January 2020 20:55:31 | −31.0 | 350 (N b) | 5.4 | E (5) | 0 days 02:46:33 | 19 January 2020 23:42:05 | 19 January 2020 23:30:00 | 344.1 (N b) | 3.6 | E (5) |
| 19 January 2020 21:00:31 | −32.0 | 340 (N b) | 5.4 | E (5) | 0 days 02:46:33 | 19 January 2020 23:47:05 | 19 January 2020 23:45:00 | 337.4 (NW b) | 4.2 | E (5) |
| 19 January 2020 21:30:31 | −37.8 | 350 (N b) | 6.1 | E (5) | 0 days 02:25:44 | 19 January 2020 23:56:15 | 19 January 2020 23:45:00 | 337.4 (NW b) | 4.2 | E (5) |
| 19 January 2020 21:35:31 | −38.8 | 340 (N b) | 6.1 | E (5) | 0 days 02:25:44 | 20 January 2020 00:01:15 | 20 January 2020 00:00:00 | 337.9 (N b) | 4.5 | E (5) |
| 19 January 2020 21:25:31 | −36.8 | 340 (N b) | 5.4 | E (5) | 0 days 02:46:33 | 20 January 2020 00:12:04 | 20 January 2020 00:00:00 | 337.9 (N b) | 4.5 | E (5) |
| 19 January 2020 21:40:31 | −39.8 | 340 (N b) | 5.4 | E (5) | 0 days 02:46:33 | 20 January 2020 00:27:05 | 20 January 2020 00:15:00 | 348.8 (N b) | 4.5 | E (5) |
| 19 January 2020 22:10:31 | −45.6 | 340 (N b) | 6.1 | E (5) | 0 days 02:25:44 | 20 January 2020 00:36:15 | 20 January 2020 00:30:00 | 351.8 (N b) | 3.7 | E (5) |
| Callaway Time | Callaway Wind Direction in Number 10 m (A) | Callaway Hourly Wind Speed (m/s) at 10 m (A) | Callaway Stability a 60 m and 10 m | Travel Time | Arrival Time | St. Louis Lambert International Airport Time | STL Solar Elevation Corrected for Atm Refraction (deg) | STL Hourly Wind Direction (deg) | STL Wind Speed (m/s) | STL Stability Letters |
|---|---|---|---|---|---|---|---|---|---|---|
| 2 January 2020 21:30:00 | 60.0 (NE b) | 1.3 | E (5) | 1 days 12:27:50 | 4 January 2020 09:57:51 | 4 January 2020 09:55:31 | 14.1 | 300 (NW b) | 4.9 | D (4) |
| 2 January 2020 21:45:00 | 36.8 (NE b) | 1.2 | E (5) | 1 days 16:46:21 | 4 January 2020 14:31:21 | 4 January 2020 14:30:31 | 25.5 | 280 (W b) | 6.7 | D (4) |
| 2 January 2020 20:15:00 | 39.4 (NE b) | 0.9 | E (5) | 2 days 03:21:29 | 4 January 2020 23:36:30 | 4 January 2020 23:35:31 | −64.8 | 0 (N b) | 0 | G (7) |
| 2 January 2020 19:45:00 | 112.2 (E b) | 0.6 | E (5) | 2 days 11:51:10 | 5 January 2020 07:36:10 | 5 January 2020 07:35:31 | −8.6 | 190 (S b) | 3.6 | E (5) |
| 2 January 2020 22:00:00 | 70.5 (E b) | 0.6 | E (5) | 2 days 09:48:50 | 5 January 2020 07:48:50 | 5 January 2020 07:45:31 | −6.8 | 180 (S b) | 2.7 | F (6) |
| 2 January 2020 19:15:00 | 33.4 (NE b) | 0.4 | E (5) | 4 days 12:52:39 | 7 January 2020 08:07:39 | 7 January 2020 08:05:31 | −3.2 | 280 (W b) | 6.3 | E (5) |
| St. Louis Lambert International Airport Time | STL Solar Elevation Corrected for Atm Refraction (deg) | STL Hourly Wind Direction (deg) | STL Wind Speed (m/s) | STL Stability | Travel Time | Arriva Time | Callaway’s Time | Callaway Wind Direction in Number 10 m (A) | Callaway Hourly Wind Speed (m/s) at 10 m (A) | Callaway Stability a 60 m and 10 m |
|---|---|---|---|---|---|---|---|---|---|---|
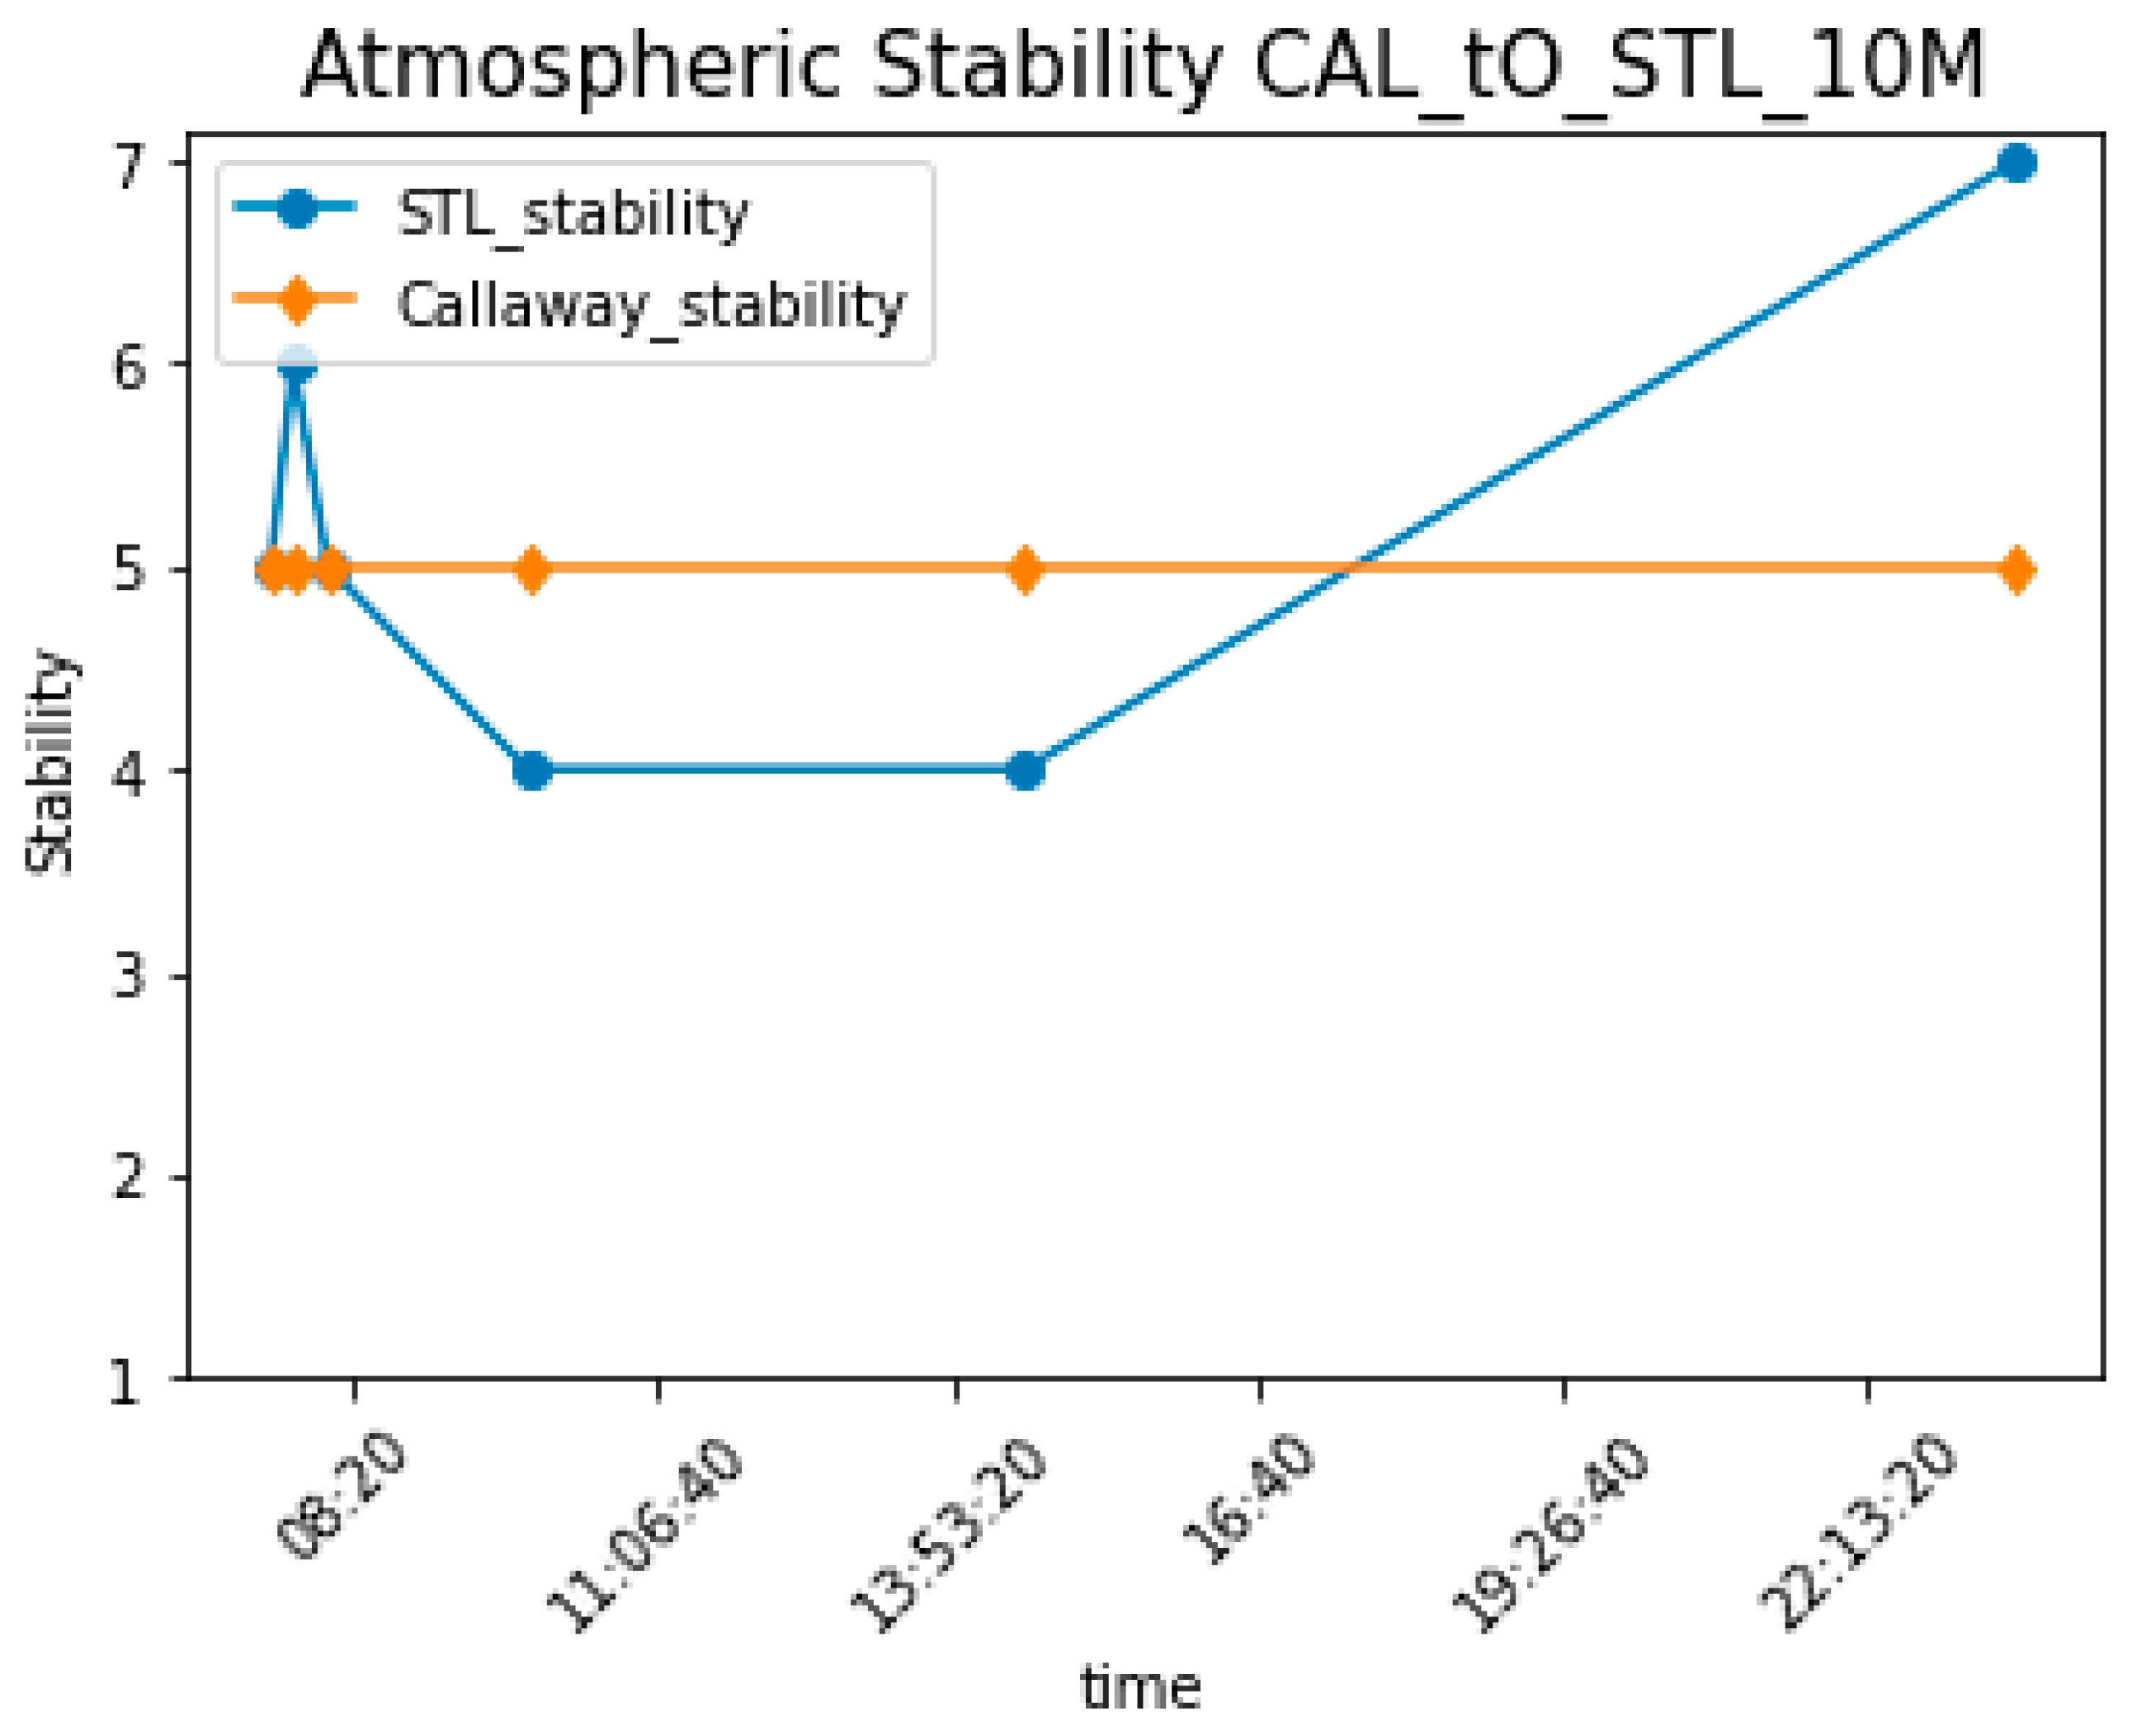
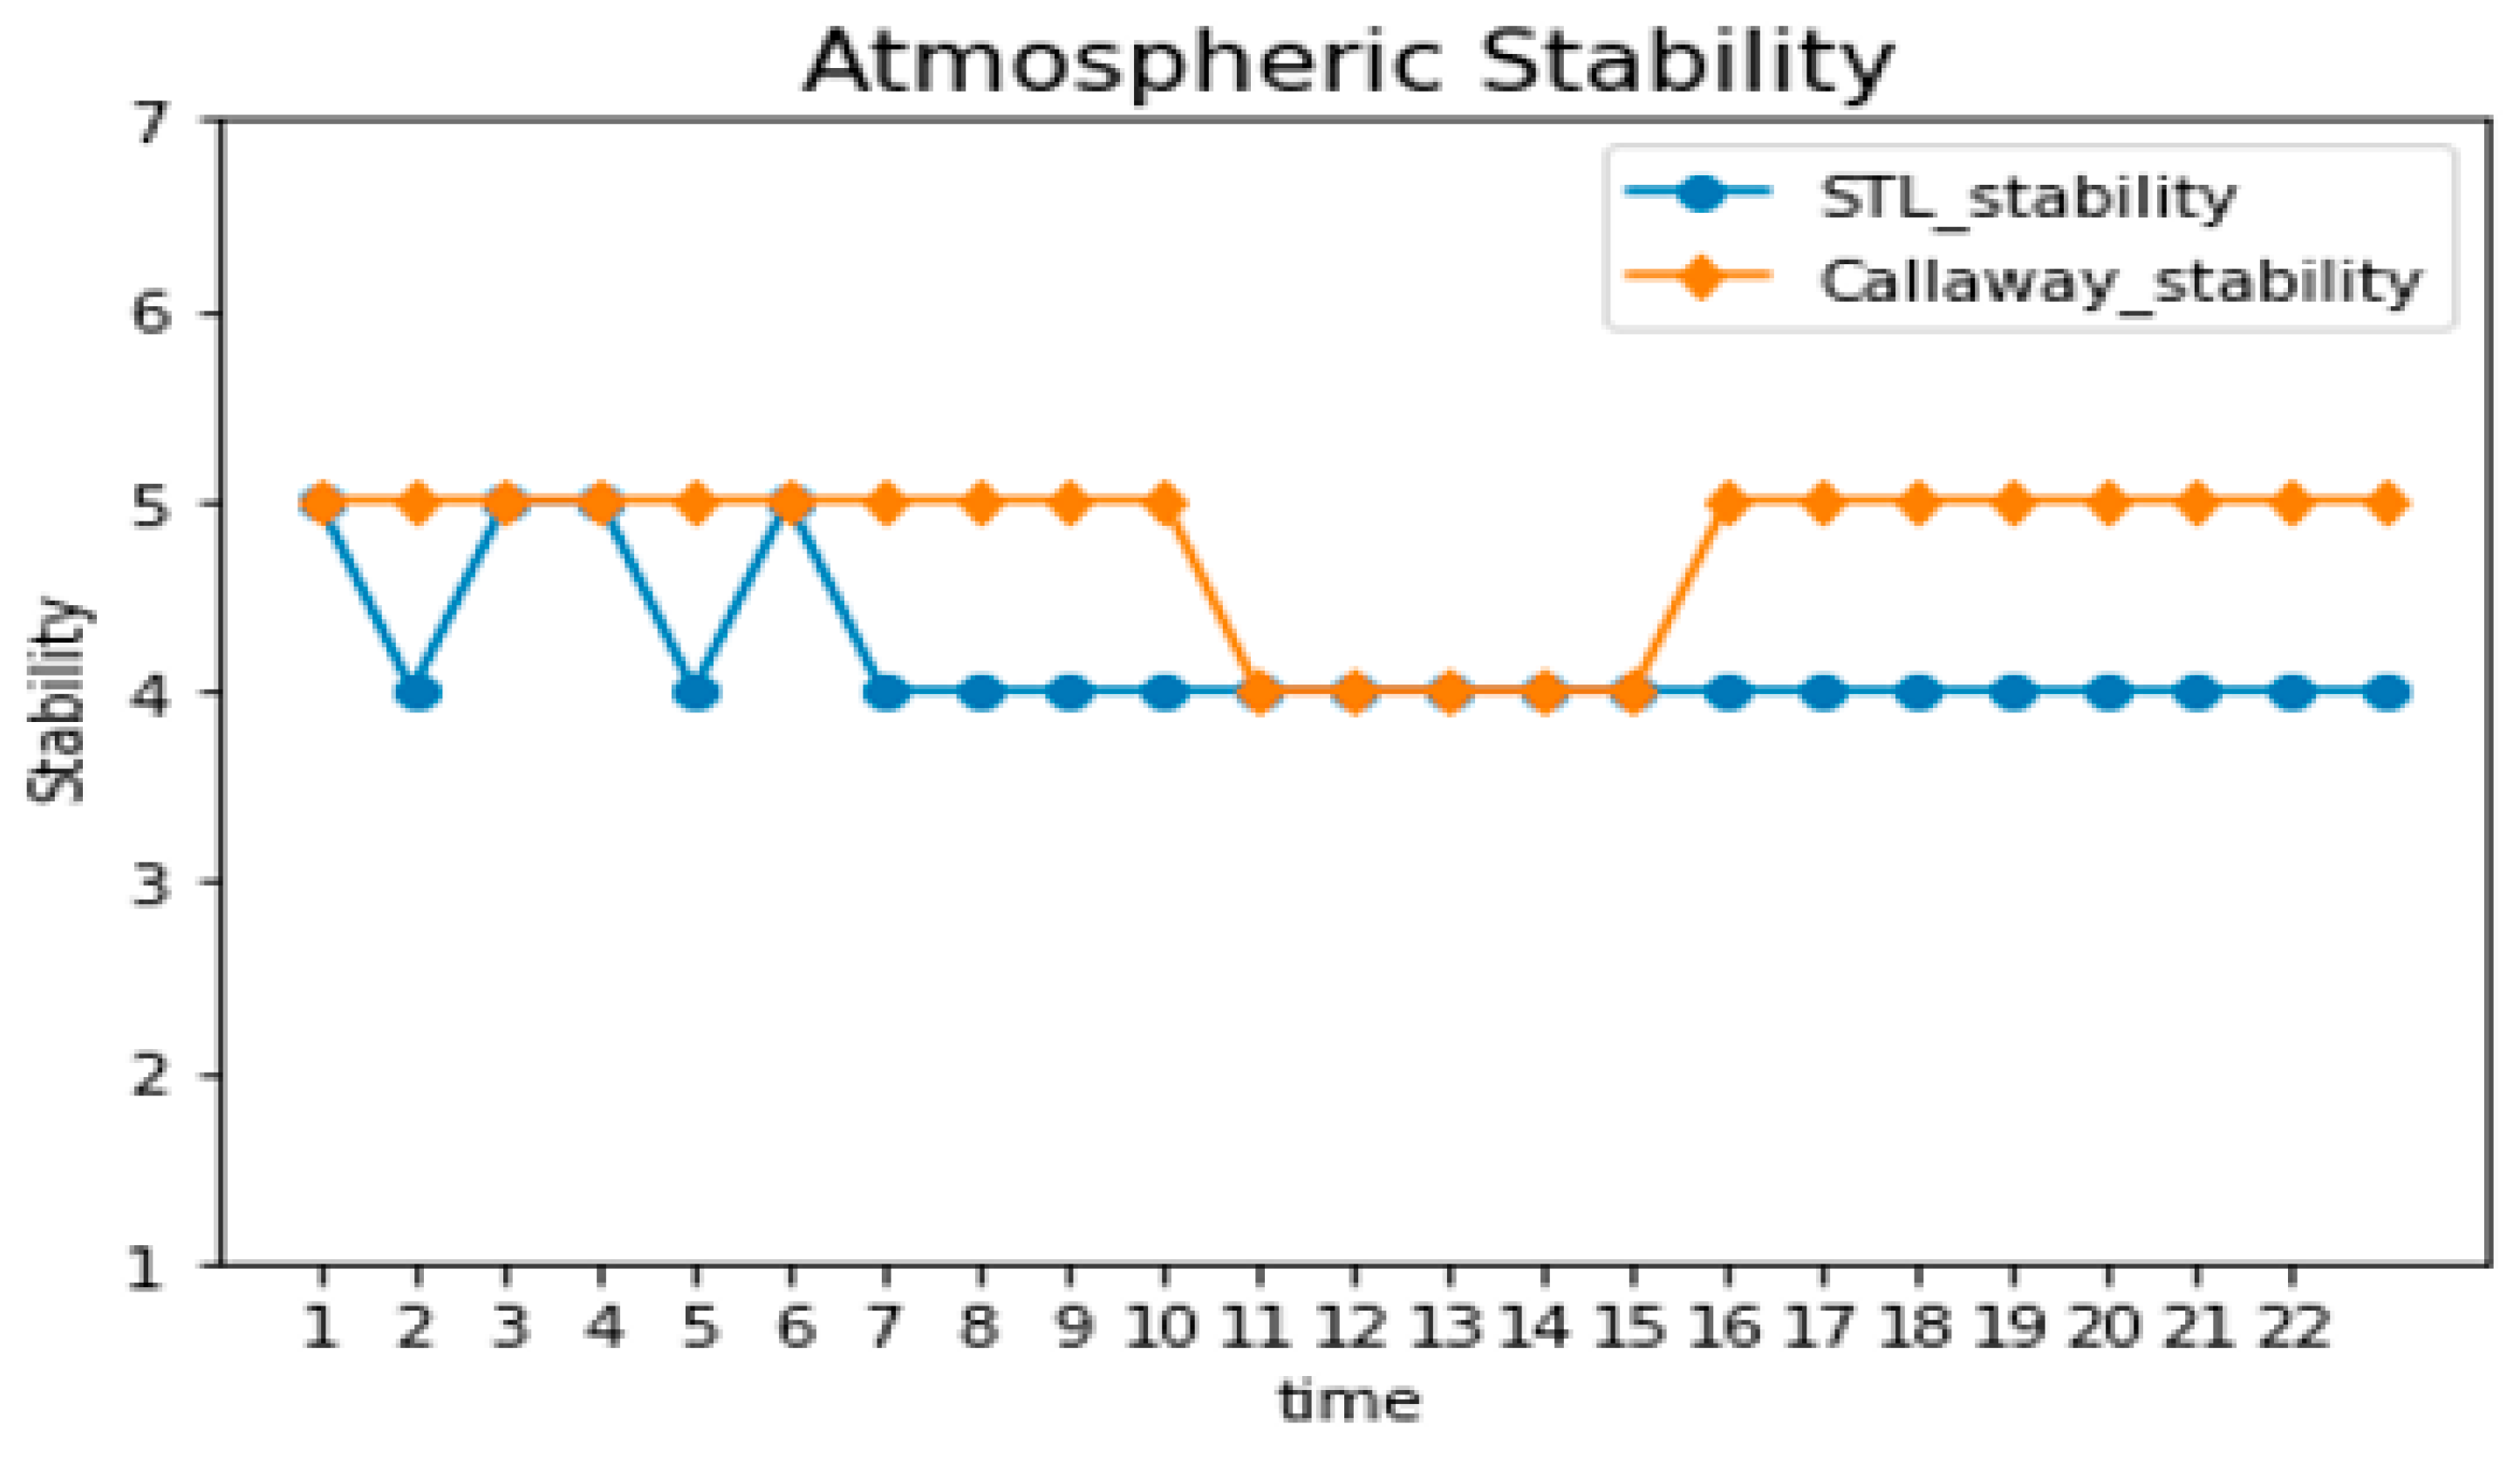
| 2 January 2020 01:20:31 | −73.9 | 210 (SW b) | 5.8 | E (5) | 0 days 08:18:29 | 2 January 2020 09:39:00 | 2 January 2020 09:30:00 | 177.3 (S b) | 3.66 | E (5) |
| 2 January 2020 12:20:31 | 27.5 | 210 (SW b) | 4.5 | C (3) | 0 days 10:48:02 | 2 January 2020 23:08:33 | 2 January 2020 23:00:00 | 278.2 (W b) | 0.91 | E (5) |
| 2 January 2020 11:10:31 | 22.8 | 210 (SW b) | 3.6 | C (3) | 0 days 13:30:02 | 3 January 2020 00:40:34 | 3 January 2020 00:30:00 | 346.2 (N b) | 1.09 | E (5) |
| 2 January 2020 12:15:31 | 27.3 | 210 (SW b) | 3.1 | C (3) | 0 days 15:25:46 | 3 January 2020 03:41:17 | 3 January 2020 03:30:00 | 12.28 (N b) | 3.48 | E (5) |
| 2 January 2020 13:40:31 | 27.8 | 210 (SW b) | 3.1 | C (3) | 0 days 15:25:46 | 3 January 2020 05:06:17 | 3 January 2020 05:00:00 | 357.2 (N b) | 5.27 | E (5) |
| 2 January 2020 22:50:31 | −57.2 | 210 (SW b) | 1.8 | D+ (4) | 1 days 03:00:05 | 4 January 2020 01:50:37 | 4 January 2020 01:45:00 | 274.4 (W b) | 4.11 | E (5) |
| 2 January 2020 22:15:31 | −50.6 | 210 (SW b) | 1.3 | G (7) | 1 days 12:00:07 | 4 January 2020 10:15:38 | 4 January 2020 10:15:00 | 295.5 (NW b) | 3.85 | D (4) |
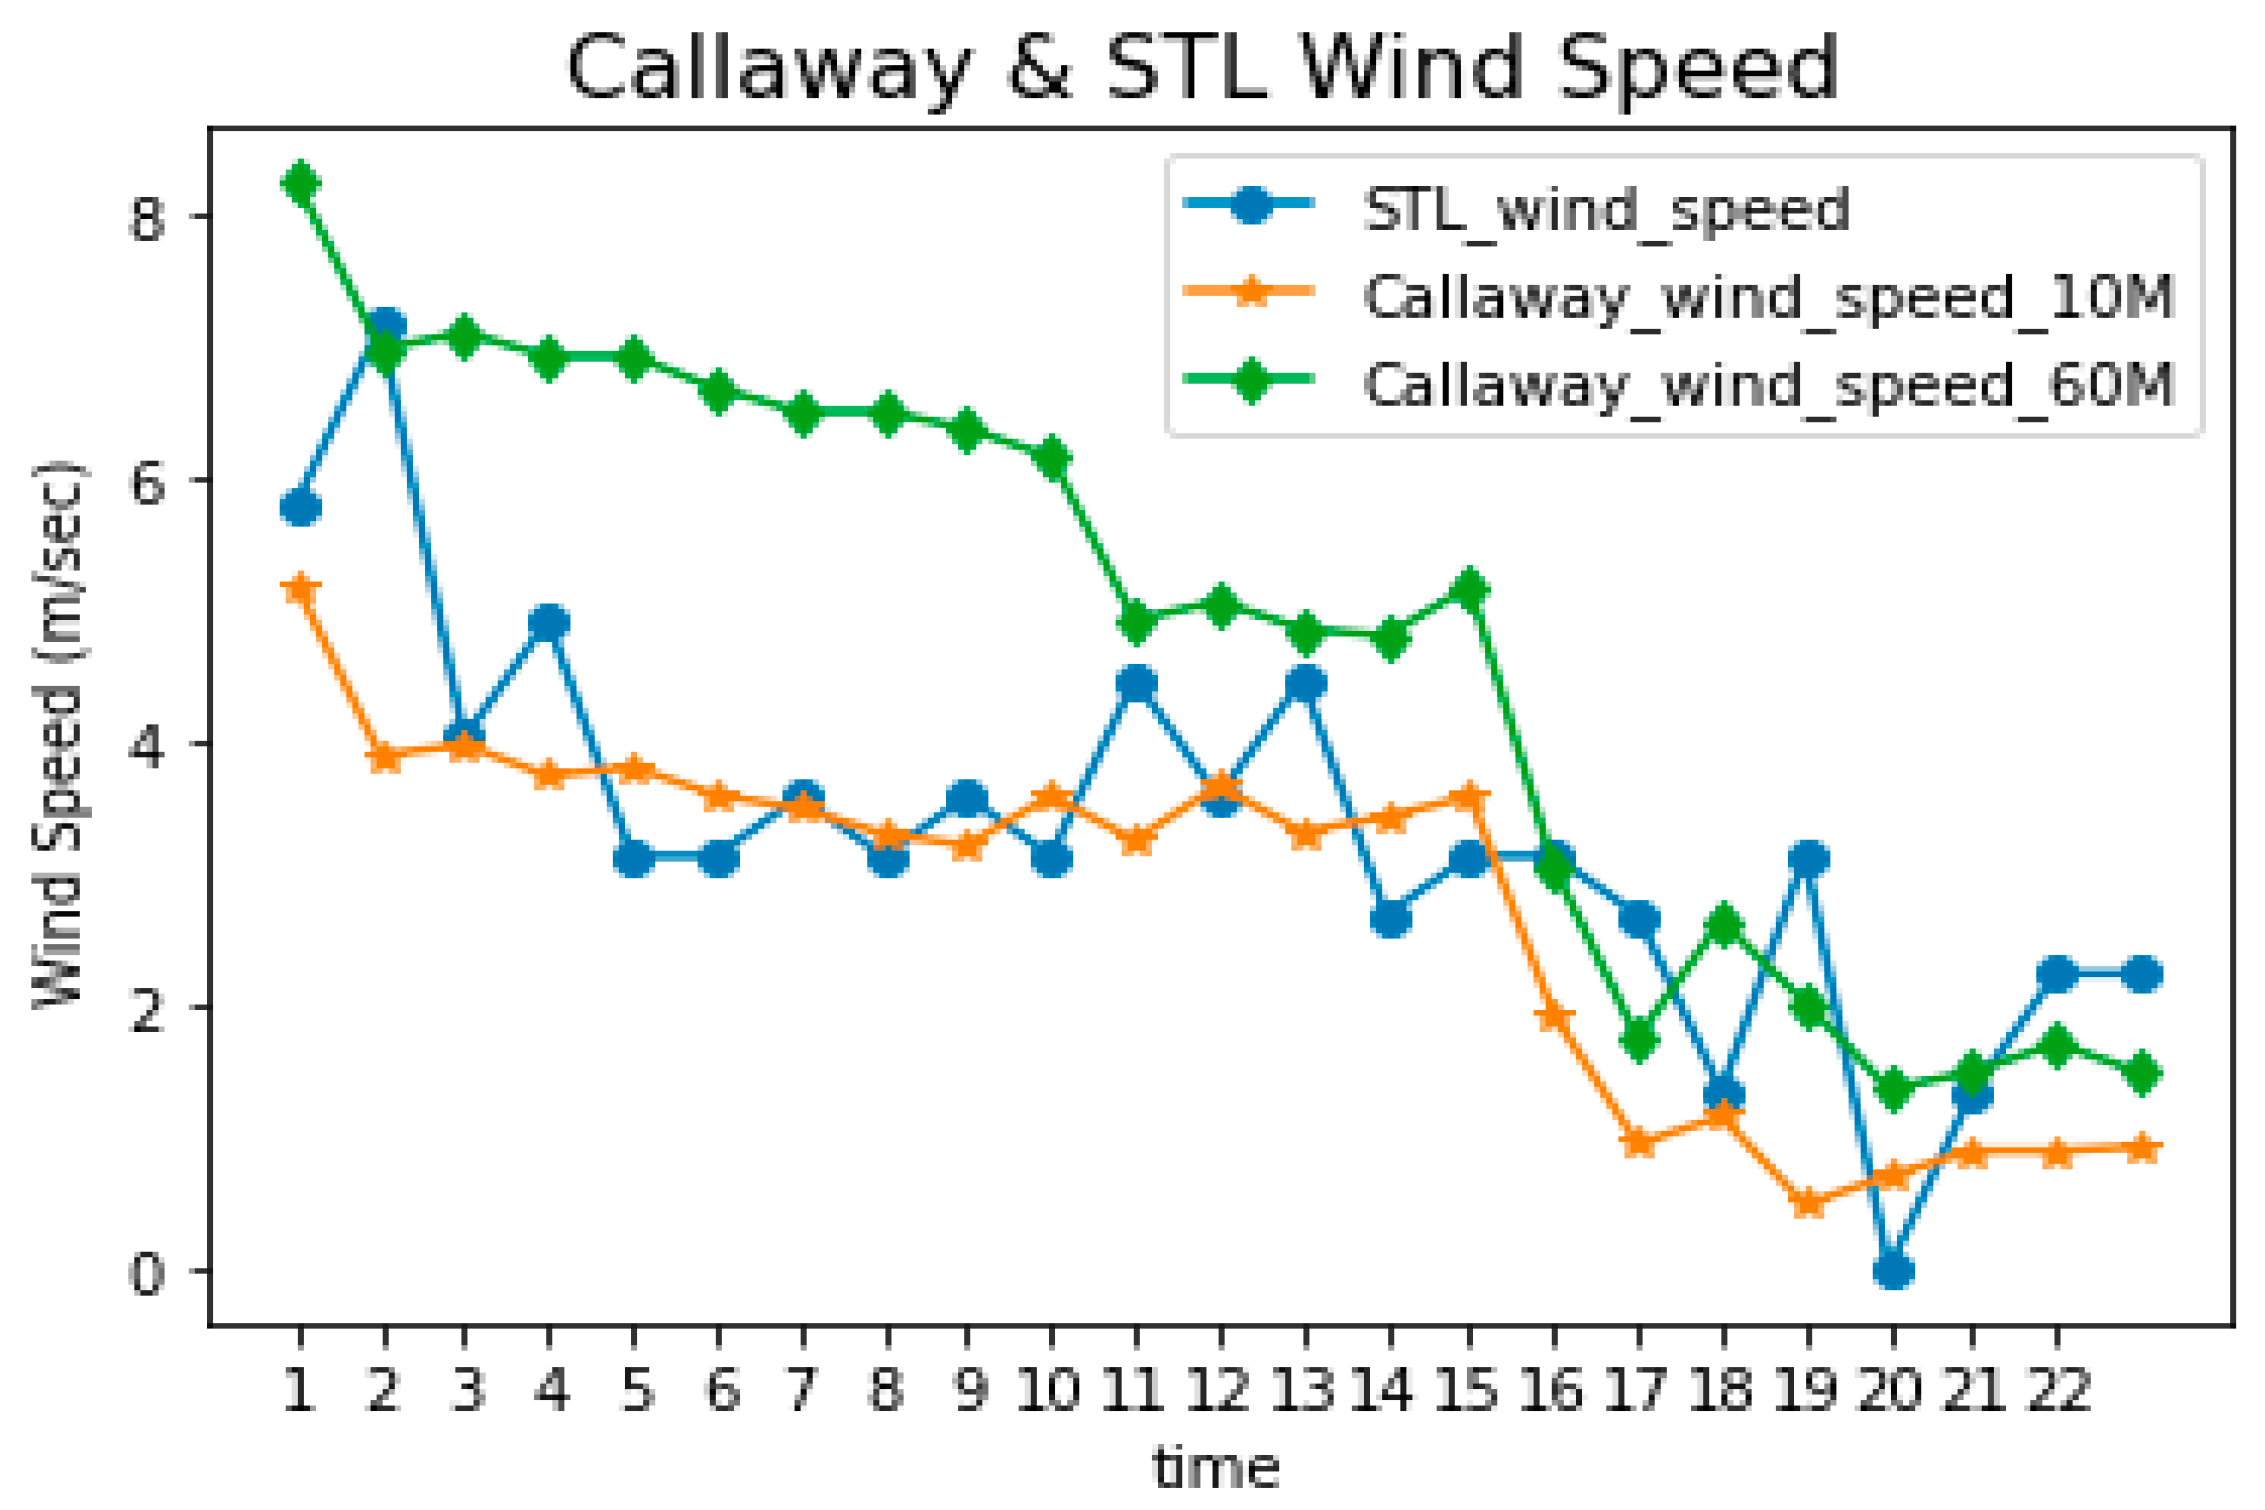

4. Conclusions
- Most licensees rely on a vertical temperature gradient approach to infer stability class. The use of alternative methods such as proposed by researchers like McElroy and Vogt is equally effective.
- It is quite feasible to utilize already available data in the public domain to obtain useful information for radiological assessment. It was possible for us to infer stability class from the available data of the cloud cover, the date of the year, and the time of the day (the Vogt method) for airports surrounding our reference nuclear site. These predicted stability classes were mostly within one stability class difference from on-site observation at the reference nuclear power plant.
- There is a need for developing carefully designed protocols and methodologies for data integration from various sources. With such tools, reliability and consistency data synthesis is possible. However, for each new site, careful examination of data before integration is necessary.
- Correlation coefficients for velocity and wind directions were also in reasonable agreement for the reference site and the airport locations in the proximity of the reference site.
- Because of the chaotic nature atmospheric flow, there was no significant improvement when applying travel time correction and/or wind direction correction on the net value of correlation coefficients.
- Historical data from reference plant and the off-site locations can be used to develop and validate reliable correlation models. The models need to be continuously evaluated and updated using new available data.
- For a new site, the implementation of this technique includes (1) identification of suitable offsite weather stations and airports with reliable meteorological data, (2) collecting limited onsite data and testing the hypothesis that a temporal–spatial correlation exists between offsite and onsite data, and (3) determining the correlation coefficient and uncertainty of said correlation.
- While NRC does allow for offsite data utilization to demonstrate regulatory compliance, nuclear industry only relies on their onsite meteorological data. There are no examples in the literature of using offsite data for either new COL application or operational compliance. Our work has demonstrated feasibility of utilizing offsite data. This approach can significantly help the nuclear industry.
Author Contributions
Funding
Data Availability Statement
Acknowledgments
Conflicts of Interest
Nomenclature
| CNPP | Callaway Nuclear Power Plant |
| CRA | Columbia Regional Airport |
| JMA | Jefferson City Memorial Airport |
| STL | St. Louis Lambert International Airport |
| NRC | Nuclear Regulatory Commission |
| COL | Combine License |
| JFD | Joint Frequency Distribution |
| Met. T | Meteorological Tower |
| ΔT | Vertical Temperature Gradient (K) |
| Change in temperature with height (K/m) | |
| Pollutant Concentration | |
| Q | Release Rate |
| Mean Wind Speed | |
| Horizontal Dispersion Coefficient (m) | |
| Vertical Dispersion Coefficient (m) | |
| y | Crosswind Distance (m) |
| z | Vertical Distance (m) |
| H | Effective Stack Height (m) |
| L | Monin and Obukhov Length (m) |
| Friction Velocity (m/s) | |
| ρ | Air Density |
| Specific Heat at Constant Pressure | |
| k | Von Karman’s constant (Dimensionless) |
| H | Vertical Heat Flux |
| dispersion coefficient (a function of atmospheric stability) | |
| Bulk Richardson Number (Dimensionless) | |
| g | Gravitational Acceleration |
| T | Absolute Temperature (K) |
| Temperature Gradient (K/m) | |
| Lapse Rate (K/m) | |
| Z | Vertical Distance (m) |
| Wind Speed at Height Z (m/s) | |
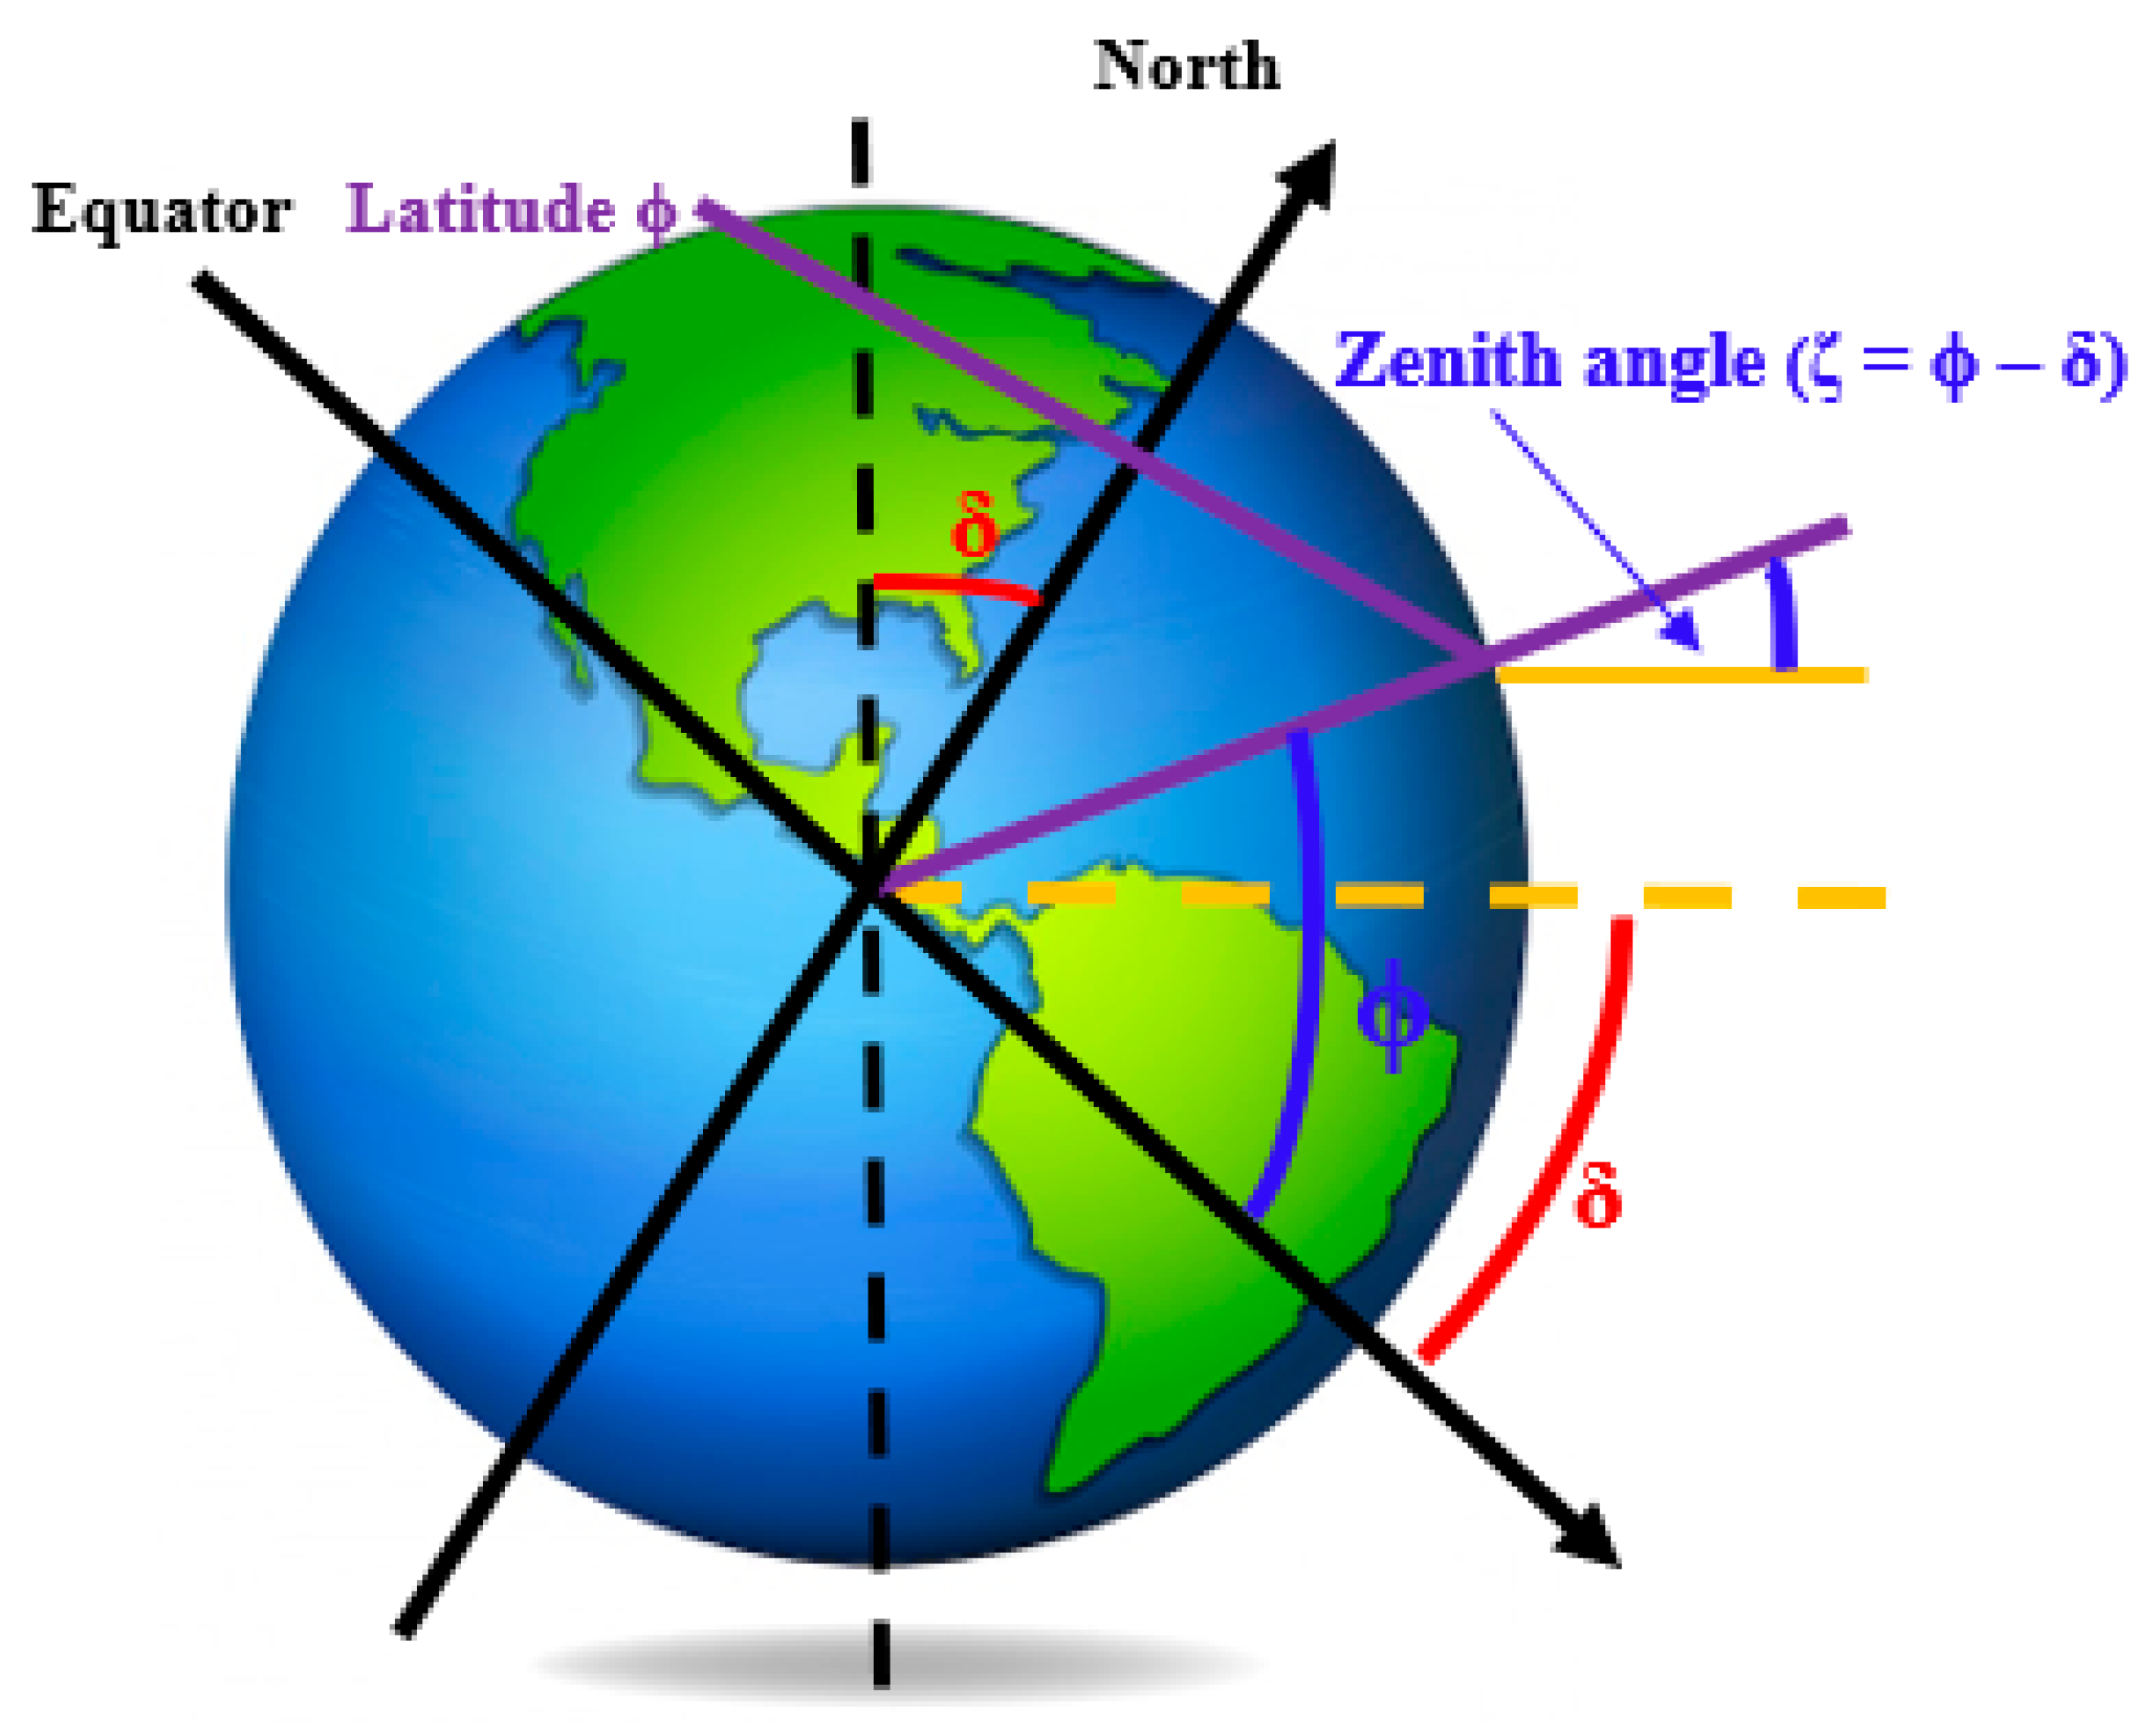
| α | Sun Elevation Angle |
| β | Wind velocity correction exponent |
| δ | Declination Angle |
| d | Number of days |
| φ | Latitude |
| LST | Local Solar Time |
| HRA | Hour Angle |
| Wind Speed at Height z | |
| Wind Speed at Reference Height | |
| Reference Height (m) |
Appendix A

Appendix B
| Days | CAL and CRA | CAL to CRA at 10 m | CRA to CAL at 10 m | CAL to CRA at 60 m | CRA to CAL at 60 m |
| 1 January | 0.69 | 0 | 0 | 0 | 0 |
| 2 January | 0.66 | 0 | 0 | 0 | 0 |
| 3 January | 0.45 | −0.25 | 0 | 0.42 | 0 |
| 4 January | 0.71 | 0.34 | 0 | 0.39 | 0 |
| 5 January | 0.60 | 0.88 | 0 | 0.83 | 0 |
| 6 January | 0.58 | 0 | −0.26 | 0 | 0.07 |
| 7 January | 0.66 | 0.42 | 0 | 0.81 | 0 |
| 8 January | 0.61 | 0 | 0.17 | 0 | 0.36 |
| 9 January | 0.10 | 0 | 0 | 0 | 0 |
| 10 January | 0 | 0 | 0 | 0 | 0 |
| 11 January | 0 | 0 | 0 | 0 | 0 |
| 12 January | 0 | 0 | 0 | 0 | 0 |
| 13 January | 0.06 | 0 | 0.55 | 0 | 0.55 |
| 14 January | 0.83 | 0 | 0 | −0.22 | 0 |
| 15 January | 0 | 0 | 0 | 0.29 | 0 |
| 16 January | 0.79 | −0.35 | 0 | −0.26 | 0 |
| 17 January | 0.14 | 0 | 0.15 | 0 | 0.16 |
| 18 January | 0 | 0.30 | 0 | 0.29 | 0 |
| 19 January | 0.67 | 0.43 | 0 | 0.65 | 0 |
| 20 January | 0.24 | 0.08 | 0 | −0.16 | 0 |
| 21 January | 0.63 | 0.61 | 0 | 0 | 0.50 |
| 22 January | 0.35 | −0.10 | 0 | 0 | 0.27 |
| 23 January | 0 | 0 | 0 | 0 | 0 |
| 24 January | 0 | 0 | 0 | 0 | 0 |
| 25 January | 0.14 | −0.11 | 0 | 0.19 | 0 |
| 26 January | 0.62 | −0.23 | 0.24 | 0 | 0.18 |
| 27 January | −0.07 | −0.04 | 0 | −0.03 | 0 |
| 28 January | 0 | 0 | 0 | 0 | 0 |
| 29 January | 0 | 0 | 0 | 0 | 0 |
| 30 January | 0.40 | 0 | 0 | 0 | −0.14 |
| 31 January | 0 | 0 | 0 | 0 | 0 |
| Days | CAL and CRA | CAL to CRA at 10 m | CRA to CAL at 10 m | CAL to CRA at 60 m | CRA to CAL at 60 m |
| 1 January | 0.87 | 0 | 0 | 0.41 | 0 |
| 2 January | 0.93 | 0.17 | 0 | −0.05 | 0 |
| 3 January | 0.11 | 0.34 | 0 | 0.62 | 0 |
| 4 January | 0.72 | 0.64 | 0 | 0.71 | 0 |
| 5 January | 0.96 | 0.74 | 0 | 0.69 | 0 |
| 6 January | 0.68 | −0.55 | 0.11 | −0.72 | −0.11 |
| 7 January | 0.79 | −0.10 | 0 | −0.04 | 0 |
| 8 January | 0.59 | −0.80 | −0.06 | 0.77 | 0 |
| 9 January | 0.77 | 0 | −0.51 | 0 | −0.42 |
| 10 January | 0.45 | 0.25 | −0.06 | 0.62 | −0.35 |
| 11 January | 0.69 | 0.67 | 0 | 0.60 | 0 |
| 12 January | 0.68 | −0.65 | 0.47 | −0.63 | 0.54 |
| 13 January | 0.05 | 0 | −0.08 | 0 | 0.69 |
| 14 January | −0.30 | −0.73 | −0.26 | −0.65 | 0.04 |
| 15 January | 0.76 | 0.25 | 0.48 | 0.42 | 0.39 |
| 16 January | 0.85 | 0.18 | 0.27 | 0.50 | 0.31 |
| 17 January | 0.21 | 0 | 0.14 | 0 | 0.17 |
| 18 January | 0.66 | 0.29 | 0.47 | 0.14 | −0.47 |
| 19 January | 0.66 | 0.57 | 0 | 0.70 | 0 |
| 20 January | −0.02 | 0.01 | 0 | 0.10 | 0 |
| 21 January | 0.91 | 0 | 0.13 | 0 | 0.52 |
| 22 January | 0.22 | 0 | 0.16 | 0 | 0.19 |
| 23 January | 0.88 | 0 | 0.58 | 0 | 0.77 |
| 24 January | 0.82 | −0.17 | 0 | −0.11 | 0 |
| 25 January | 0.59 | 0.39 | 0 | 0.64 | 0 |
| 26 January | 0.52 | 0.14 | 0.02 | −0.23 | 0.24 |
| 27 January | 0.38 | −0.21 | −0.39 | −0.34 | −0.49 |
| 28 January | −0.08 | 0 | 0.10 | 0 | −0.27 |
| 29 January | 0.68 | 0 | 0.27 | 0 | −0.82 |
| 30 January | 0.42 | 0 | −0.20 | 0 | −0.39 |
| 31 January | 0.52 | 0 | 0.08 | 0.87 | −0.08 |
| Days | CAL and CRA at 10 m | CAL and CRA at 60 m | CAL to CRA at 10 m | CRA to CAL at 10 m | CAL to CRA at 60 m | CRA to CAL at 60 m |
| 1 January | 0.57 | 0.46 | 0 | 0 | 0.30 | 0 |
| 2 January | −0.27 | 0.16 | 0.37 | 0 | 0.10 | 0 |
| 3 January | 0.09 | 0.30 | −0.22 | 0 | 0.10 | 0 |
| 4 January | 0.90 | 0.90 | 0.50 | 0 | 0.66 | 0 |
| 5 January | 0.90 | 0.85 | −0.04 | 0 | 0 | 0 |
| 6 January | 0.43 | 0.71 | −0.54 | −0.01 | 0.84 | 0.13 |
| 7 January | 0.80 | 0.71 | 0.46 | 0 | 0.18 | 0 |
| 8 January | 0.68 | 0.69 | 0.11 | 0.52 | 0.15 | 0.74 |
| 9 January | 0.64 | 0.76 | 0 | −0.18 | 0 | −0.12 |
| 10 January | 0.29 | 0.23 | 0.17 | −0.27 | 0.95 | −0.07 |
| 11 January | 0.69 | 0.40 | 0.57 | 0 | 0.60 | 0 |
| 12 January | 0.65 | 0.68 | −0.14 | 0.17 | 0.25 | 0.10 |
| 13 January | 0.67 | 0.69 | 0 | −0.02 | 0 | 0.34 |
| 14 January | 0.51 | 0.74 | −0.65 | −0.07 | −0.26 | 0.32 |
| 15 January | 0.86 | 0.90 | 0.14 | 0.05 | 0.28 | −0.08 |
| 16 January | 0.17 | 0.15 | 0.21 | 0.31 | 0 | 0.50 |
| 17 January | 0.83 | 0.83 | 0 | 0.81 | 0 | 0.89 |
| 18 January | 0.76 | 0.74 | 0.59 | 0 | 0.55 | 0 |
| 19 January | 0.73 | 0.77 | 0.07 | 0 | 0.41 | 0 |
| 20 January | −0.16 | −0.03 | −0.33 | 0 | 0.16 | 0 |
| 21 January | 0.13 | 0.17 | 0 | 0.20 | 0 | 0.61 |
| 22 January | 0.22 | 0.19 | 0 | 0.11 | 0 | 0.26 |
| 23 January | 0.86 | 0.79 | 0 | 0.34 | 0 | 0.29 |
| 24 January | 0.41 | 0.39 | 0.16 | 0 | 0 | 0 |
| 25 January | 0.68 | 0.46 | 0.45 | 0 | 0.54 | 0 |
| 26 January | 0.66 | 0.64 | −0.01 | 0.32 | 0.12 | 0.54 |
| 27 January | 0.48 | 0.46 | −0.13 | −0.05 | 0.10 | −0.33 |
| 28 January | 0.46 | 0.41 | 0 | 0.28 | 0 | −0.03 |
| 29 January | 0.10 | 0.16 | 0 | 0 | 0 | 0 |
| 30 January | 0.20 | 0.66 | 0 | −0.02 | 0 | −0.39 |
| 31 January | 0.73 | 0.72 | 0 | 0.28 | 0 | 0.08 |
Appendix C
| Days | CAL and JMA | CAL to JMA at 10 m | JMA to CAL at 10 m | CAL to JMA at 60 m | JMA to CAL at 60 m |
| 1 January | 0.74 | −0.25 | 0.03 | −0.19 | −0.19 |
| 2 January | 0.44 | 0.17 | −0.50 | 0.22 | 0.05 |
| 3 January | 0.52 | 0.81 | 0.06 | −0.86 | 0.24 |
| 4 January | 0.73 | −0.03 | −0.43 | −0.16 | 0.46 |
| 5 January | 0.60 | 0.21 | −0.25 | 0.27 | −0.17 |
| 6 January | 0.69 | 0.24 | 0 | 0.16 | −0.03 |
| 7 January | 0.73 | 0.27 | −0.33 | 0.31 | 0 |
| 8 January | 0.70 | 0 | 0.01 | 0 | −0.08 |
| 9 January | 0.12 | 0.05 | 0 | 0.07 | 0 |
| 10 January | 0 | 0 | 0 | 0 | 0 |
| 11 January | 0 | 0 | 0 | 0 | 0 |
| 12 January | 0 | 0.16 | 0 | 0.23 | 0 |
| 13 January | 0.08 | 0 | 0.11 | 0 | 0.07 |
| 14 January | 0.76 | 0.42 | 0 | 0.42 | −0.45 |
| 15 January | 0 | 0 | 0 | −0.03 | 0 |
| 16 January | 0.76 | 0 | −0.32 | 0 | −0.10 |
| 17 January | 0.14 | 0 | 0.04 | 0 | 0.14 |
| 18 January | 0.09 | −0.04 | 0 | −0.01 | 0 |
| 19 January | 0.77 | 0 | −0.44 | 0 | 0 |
| 20 January | 0.52 | 0 | 0 | 0 | 0 |
| 21 January | 0.69 | 0.08 | 0.70 | 0.14 | 0.74 |
| 22 January | 0.35 | 0.32 | −0.71 | 0.20 | −0.71 |
| 23 January | 0 | 0 | 0 | 0 | 0 |
| 24 January | 0 | 0.13 | 0 | 0.08 | 0 |
| 25 January | 0.06 | 0.20 | 0 | 0.17 | 0 |
| 26 January | 0.64 | −0.41 | 0.33 | −0.15 | −0.33 |
| 27 January | −0.08 | 0 | −0.03 | 0 | −0.04 |
| 28 January | 0 | 0 | −0.15 | 0 | −0.05 |
| 29 January | 0 | 0 | −0.10 | 0 | −0.21 |
| 30 January | 0.59 | 0 | −0.06 | 0 | −0.11 |
| 31 January | 0.43 | 0 | −0.22 | −0.31 | −0.22 |
| Days | CAL and JMA | CAL to JMA at 10 m | JMA to CAL at 10 m | CAL to JMA at 60 m | JMA to CAL at 60 m |
| 1 January | 0.83 | −0.10 | −0.43 | 0.18 | −0.34 |
| 2 January | 0.68 | −0.21 | −0.12 | −0.25 | 0.15 |
| 3 January | 0.32 | 0.13 | 0.09 | 0.34 | −0.14 |
| 4 January | 0.75 | 0.57 | −0.62 | 0.77 | −0.54 |
| 5 January | 0.79 | 0.64 | −0.02 | 0.53 | −0.24 |
| 6 January | 0.40 | −0.41 | −0.12 | −0.32 | 0.06 |
| 7 January | 0.88 | −0.14 | 0.26 | −0.05 | 0.77 |
| 8 January | 0.76 | −0.77 | −0.23 | 0 | 0.28 |
| 9 January | 0.69 | 0.84 | 0 | 0.83 | 0 |
| 10 January | 0.57 | 0.08 | 0.23 | 0.02 | 0.13 |
| 11 January | 0.07 | 0.24 | 0.21 | 0.03 | −0.01 |
| 12 January | 0.52 | −0.64 | 0.10 | −0.49 | 0.08 |
| 13 January | 0.03 | −0.73 | −0.20 | −0.04 | 0.10 |
| 14 January | 0.43 | 0.80 | 0.20 | 0.74 | 0.23 |
| 15 January | 0.83 | −0.29 | −0.44 | −0.16 | −0.15 |
| 16 January | 0.55 | 0 | 0.30 | 0 | 0.35 |
| 17 January | 0.40 | 0 | 0.19 | 0 | 0.23 |
| 18 January | 0.77 | 0.18 | −0.50 | 0.12 | −0.36 |
| 19 January | 0.62 | 0 | 0.52 | 0 | 0.14 |
| 20 January | 0.14 | 0 | −0.84 | 0 | 0.66 |
| 21 January | 0.84 | −0.29 | 0.36 | 0.16 | 0.68 |
| 22 January | 0.28 | 0.04 | 0.22 | −0.50 | 0.13 |
| 23 January | 0.70 | 0 | 0.64 | 0 | 0.66 |
| 24 January | 0.88 | 0.15 | 0 | 0.27 | 0 |
| 25 January | 0.61 | 0.48 | 0 | 0.57 | 0.21 |
| 26 January | 0.50 | 0.71 | −0.26 | 0.33 | 0.77 |
| 27 January | 0.60 | −0.57 | 0.24 | −0.60 | 0.28 |
| 28 January | −0.05 | 0 | −0.12 | 0 | −0.10 |
| 29 January | 0.17 | 0 | 0.20 | 0 | 0.31 |
| 30 January | 0.46 | 0 | 0.46 | 0 | −0.36 |
| 31 January | 0.51 | 0.25 | 0.04 | 0.36 | −0.07 |
| Days | CAL and JMA at 10 m | CAL and JMA at 60 m | CAL to JMA at 10 m | JMA to CAL at 10 m | CAL to JMA at 60 m | JMA to CAL at 60 m |
| 1 January | 0.13 | −0.13 | −0.37 | −0.04 | 0.10 | −0.13 |
| 2 January | −0.14 | −0.16 | 0.39 | −0.29 | 0.27 | −0.01 |
| 3 January | 0.30 | 0.20 | −0.11 | 0.10 | −0.05 | 0.22 |
| 4 January | 0.77 | 0.76 | 0.33 | 0.45 | 0.31 | −0.13 |
| 5 January | 0.45 | 0.48 | 0.12 | −0.01 | 0.46 | −0.02 |
| 6 January | −0.34 | −0.16 | −0.07 | 0.30 | 0 | 0.66 |
| 7 January | 0.57 | 0.40 | 0.34 | 0 | 0.38 | 0 |
| 8 January | 0.60 | 0.62 | 0.26 | 0.01 | 0 | 0.28 |
| 9 January | 0.21 | 0.20 | 0.21 | 0 | 0.03 | 0 |
| 10 January | 0.10 | 0.02 | −0.50 | 0.16 | −0.34 | 0.17 |
| 11 January | 0.60 | 0.38 | −0.45 | −0.06 | −0.65 | −0.18 |
| 12 January | 0.30 | 0.32 | −0.20 | −0.17 | −0.29 | −0.09 |
| 13 January | 0.19 | 0 | 0.18 | 0.03 | −0.18 | −0.06 |
| 14 January | −0.56 | −0.36 | 0 | 0.02 | −0.17 | 0.46 |
| 15 January | 0.85 | 0.81 | 0.41 | −0.23 | 0.75 | −0.08 |
| 16 January | 0.60 | 0.61 | 0 | −0.09 | 0 | −0.05 |
| 17 January | 0.62 | 0.64 | 0 | 0.59 | 0 | 0.65 |
| 18 January | 0.59 | 0.58 | 0.20 | −0.10 | 0.26 | −0.08 |
| 19 January | 0.75 | 0.78 | 0 | −0.26 | 0 | 0.32 |
| 20 January | 0.13 | −0.11 | 0 | 0 | 0 | 0 |
| 21 January | 0.49 | 0.53 | −0.48 | 0.03 | −0.51 | 0.23 |
| 22 January | 0.31 | 0.39 | 0.25 | 0 | −0.22 | 0 |
| 23 January | 0.26 | 0.22 | 0 | −0.18 | 0 | −0.11 |
| 24 January | 0.52 | 0.55 | 0.44 | 0 | 0.42 | 0 |
| 25 January | 0.24 | 0.05 | 0.33 | −0.94 | 0.29 | −0.19 |
| 26 January | 0.76 | 0.76 | −0.08 | −0.77 | −0.01 | −0.77 |
| 27 January | 0.06 | 0.05 | −0.12 | 0.01 | −0.30 | 0.08 |
| 28 January | 0.50 | 0.47 | 0 | 0.14 | 0 | −0.02 |
| 29 January | 0.12 | 0.17 | 0 | 0.06 | 0 | −0.08 |
| 30 January | 0.11 | 0.50 | 0.78 | 0.07 | −0.22 | 0.05 |
| 31 January | 0.31 | 0.56 | 0.32 | −0.19 | 0.48 | 0.02 |
Appendix D
| Days | CAL and STL | CAL to STL at 10 m | STL to CAL at 10 m | CAL to STL at 60 m | STL to CAL at 60 m |
| 1 January | 0.65 | 0.67 | −0.35 | 0 | 0 |
| 2 January | 0.24 | 0 | −0.68 | 0 | −0.25 |
| 3 January | 0.77 | −1 | −0.08 | −0.58 | −0.05 |
| 4 January | 0.61 | 0 | −0.27 | 0 | 0.19 |
| 5 January | 0.76 | 0 | −0.40 | 0 | 0.45 |
| 6 January | 0.68 | −0.06 | 0.73 | −0.22 | 0.24 |
| 7 January | 0.67 | 0 | −0.09 | 0 | −0.12 |
| 8 January | 0.64 | −0.22 | 0.57 | −0.25 | −0.02 |
| 9 January | 0 | 0 | 0 | 0 | 0 |
| 10 January | 0 | 0 | 0 | 0 | 0 |
| 11 January | 0 | 0 | 0 | 0 | 0 |
| 12 January | 0 | 0.11 | 0 | 0 | 0 |
| 13 January | 0 | 0.18 | 0.03 | 0.19 | 0.01 |
| 14 January | 0.57 | 0.03 | −0.21 | 0.10 | 0 |
| 15 January | 0.11 | 0 | −0.09 | 0 | −0.06 |
| 16 January | 0.22 | −0.48 | −0.37 | −0.48 | −0.51 |
| 17 January | 0 | 0.12 | 0 | 0.12 | 0 |
| 18 January | 0 | 0.26 | 0.28 | 0 | 0.33 |
| 19 January | 0.50 | 0 | −0.40 | 0 | −0.16 |
| 20 January | 0.53 | 0.77 | 0 | 0.38 | −0.38 |
| 21 January | 0.55 | −0.55 | 0.37 | −0.47 | −0.43 |
| 22 January | 0.11 | −0.14 | 0 | 0 | 0 |
| 23 January | 0 | 0 | 0 | 0 | 0 |
| 24 January | 0 | 0 | 0 | 0 | 0 |
| 25 January | 0.24 | 0 | −0.05 | 0 | 0.14 |
| 26 January | 0.62 | 0 | 0.14 | 0.04 | −0.12 |
| 27 January | −0.08 | 0 | 0.14 | 0 | 0.10 |
| 28 January | 0 | 0 | −0.21 | 0 | 0.49 |
| 29 January | 0.32 | 0.23 | 0 | 0.20 | 0 |
| 30 January | 0.59 | −0.01 | 0 | 0.04 | 0 |
| 31 January | 0.42 | 0 | 0 | 0 | 0 |
| Days | CAL and STL | CAL to STL at 10 m | STL to CAL at 10 m | CAL to STL at 60 m | STL to CAL at 60 m |
| 1 January | 0.84 | 0.15 | 0.29 | 0 | 0.45 |
| 2 January | 0.72 | 0.09 | −0.58 | 0.61 | 0.09 |
| 3 January | −0.03 | 0 | 0.23 | 0.40 | 0.30 |
| 4 January | 0.53 | 0 | −0.24 | 0 | −0.41 |
| 5 January | 0.73 | 0.47 | 0.25 | 0 | 0.65 |
| 6 January | 0.24 | −0.38 | −0.34 | −0.12 | 0.31 |
| 7 January | 0.73 | 0 | 0.12 | 0 | −0.02 |
| 8 January | 0.57 | 0.29 | −0.31 | 0.23 | −0.59 |
| 9 January | 0.49 | 0.85 | 0 | 0.87 | 0 |
| 10 January | 0.05 | 0.18 | 0.72 | 0.41 | 0.57 |
| 11 January | 0.06 | 0 | 0.49 | 0 | 0.42 |
| 12 January | 0.67 | −0.28 | −0.09 | −0.18 | −0.70 |
| 13 January | 0.16 | −0.75 | 0.72 | −0.35 | −0.89 |
| 14 January | 0.14 | 0.28 | 0 | 0.10 | −0.28 |
| 15 January | 0.77 | 0 | −0.04 | 0.04 | −0.01 |
| 16 January | 0.84 | −0.24 | −0.28 | −0.04 | −0.07 |
| 17 January | −0.05 | −0.42 | 0 | −0.39 | 0 |
| 18 January | 0.64 | −0.27 | 0.45 | −0.56 | 0.18 |
| 19 January | 0.78 | 0 | 0.69 | 0 | 0.64 |
| 20 January | 0.26 | −1 | −0.39 | −0.13 | −0.03 |
| 21 January | 0.60 | 0.23 | −0.03 | 0.18 | −0.41 |
| 22 January | 0.05 | 0.42 | 0 | 0.12 | 0 |
| 23 January | 0.74 | −0.14 | 0 | −0.29 | 0 |
| 24 January | 0.87 | 0 | −0.11 | 0.51 | 0.02 |
| 25 January | 0.71 | 0.12 | 0.54 | 0 | 0.72 |
| 26 January | 0.35 | 0.18 | −0.08 | 0.22 | −0.24 |
| 27 January | −0.04 | −0.12 | −0.09 | −0.18 | −0.28 |
| 28 January | −0.29 | −0.07 | 0.44 | 0.02 | 0.25 |
| 29 January | 0.48 | 0.46 | −0.50 | 0.48 | −0.57 |
| 30 January | 0.34 | −0.23 | 0.02 | −0.16 | −0.49 |
| 31 January | 0.59 | 0 | 0 | 0 | 0 |
| Days | CAL and STL at 10 m | CAL and STL at 60 m | CAL to STL at 10 m | STL to CAL at 10 m | CAL to STL at 60 m | STL to CAL at 60 m |
| 1 January | 0.60 | 0.53 | −0.67 | 0.49 | 0 | 0.63 |
| 2 January | −0.27 | −0.24 | 0.29 | 0 | 0.37 | 0 |
| 3 January | 0.02 | −0.17 | 0 | 0.08 | −0.63 | −0.37 |
| 4 January | 0.68 | 0.66 | 0 | −0.38 | 0 | −0.37 |
| 5 January | 0.89 | 0.83 | 0.39 | −0.11 | 0 | 0.61 |
| 6 January | 0.43 | 0.48 | 0.18 | −0.49 | 0.11 | −0.12 |
| 7 January | 0.57 | 0.43 | 0 | 0.61 | 0 | 0.37 |
| 8 January | 0.49 | 0.49 | 0.35 | 0.49 | 0.28 | 0.79 |
| 9 January | 0.71 | 0.74 | 0.91 | 0 | 0.71 | 0 |
| 10 January | −0.30 | −0.17 | −0.04 | 0.05 | −0.05 | 0.28 |
| 11 January | 0.53 | 0.60 | 0 | 0.55 | −0.01 | 0.58 |
| 12 January | 0.85 | 0.87 | −0.14 | 0.23 | −0.05 | 0.17 |
| 13 January | −0.03 | 0.28 | −0.08 | 0.16 | −0.03 | 0.29 |
| 14 January | 0.51 | 0.29 | −0.13 | −0.42 | −0.21 | 0.14 |
| 15 January | 0.90 | 0.95 | −0.06 | 0 | 0.21 | −0.20 |
| 16 January | −0.11 | −0.07 | 0.17 | −0.16 | 0.88 | −0.03 |
| 17 January | 0.88 | 0.89 | 0.89 | 0 | 0.41 | 0 |
| 18 January | 0.85 | 0.85 | −0.19 | 0.65 | 0 | 0.74 |
| 19 January | 0.51 | 0.49 | 0 | −0.05 | 0.18 | 0.16 |
| 20 January | 0.29 | 0.36 | 0.40 | −0.04 | −0.07 | −0.05 |
| 21 January | −0.32 | −0.36 | 0.05 | −0.09 | −0.06 | 0.03 |
| 22 January | 0.41 | 0.39 | −0.13 | 0 | −0.55 | 0 |
| 23 January | 0.70 | 0.76 | −0.47 | 0 | 0.04 | 0 |
| 24 January | −0.02 | −0.03 | 0.31 | 0.15 | 0.04 | 0.13 |
| 25 January | 0.23 | −0.03 | −0.58 | −0.16 | 0 | −0.16 |
| 26 January | 0.589 | 0.52 | −0.05 | −0.25 | −0.07 | −0.01 |
| 27 January | −0.16 | −0.18 | −0.23 | 0.07 | −0.33 | −0.18 |
| 28 January | −0.20 | −0.22 | 0.05 | 0.27 | 0.10 | −0.01 |
| 29 January | −0.23 | −0.22 | 0.34 | 0.03 | 0.37 | −0.08 |
| 30 January | 0.29 | −0.03 | −0.21 | −0.31 | −0.13 | 0.48 |
| 31 January | 0.24 | 0.48 | 0 | 0 | 0 | 0 |
References
- Nuclear Power in a Clean Energy System. Available online: https://www.iea.org/reports/nuclear-power-in-a-clean-energy-system (accessed on 16 July 2024).
- Azam, A.; Rafiq, M.; Shafique, M.; Yuan, J. Towards Achieving Environmental Sustainability: The Role of Nuclear Energy, Renewable Energy, and ICT in the Top-Five Carbon Emitting Countries. Frontiers 2021, 9, 804706. [Google Scholar] [CrossRef]
- From Consideration to Construction: The United Arab Emirates’ Journey to Nuclear Power. IAEA, 3 February 2015. Available online: www.iaea.org/newscenter/news/consideration-construction-united-arab-emirates-journey-nuclear-power (accessed on 16 July 2024).
- Backgrounder on the Three Mile Island Accident. NRC Web. Available online: www.nrc.gov/reading-rm/doc-collections/fact-sheets/3mile-isle.html (accessed on 16 July 2024).
- Chernobyl Accident 1986. World Nuclear Association. Available online: https://world-nuclear.org/information-library/safety-and-security/safety-of-plants/chernobyl-accident (accessed on 16 July 2024).
- The National Environmental Policy Act as Amended through 3 June 2023. Available online: https://www.energy.gov/sites/default/files/2023-08/NEPA%20reg%20amend%2006-2023.pdf (accessed on 16 July 2024).
- Environmental Protection Regulations for Domestic Licensing and Related Regulatory Functions, (10 CFR 51). Available online: https://www.nrc.gov/reading-rm/doc-collections/cfr/part051/full-text.html (accessed on 16 July 2024).
- Meteorological and Hydrological Hazards in Site Evaluation for Nuclear Installations. Available online: https://www-pub.iaea.org/mtcd/publications/pdf/pub1506_web.pdf (accessed on 16 July 2024).
- IAEA Safety Standards Environmental and Source Monitoring for Purposes of Radiation Protection. Available online: https://www-pub.iaea.org/MTCD/publications/PDF/Pub1216_web.pdf (accessed on 16 July 2024).
- 4 Meteorology and the Nuclear Industry—A Case Study of Industry/Government Cooperation (2010-90annual_3ccm). Available online: https://ams.confex.com/ams/90annual/techprogram/paper_166528.htm (accessed on 16 July 2024).
- ANSI/ANS-3.11-2015 (R2020). ANSI Webstore. Available online: https://webstore.ansi.org/standards/ansi/ansians112015r2020 (accessed on 16 July 2024).
- NRC. Regulatory Guide 1.23, Meteorological Monitoring Programs for Nuclear Power Plants. Available online: www.nrc.gov/docs/ML0703/ML070350028.pdf (accessed on 16 July 2024).
- Economics of Nuclear Power. World Nuclear Association. Available online: https://world-nuclear.org/information-library/economic-aspects/economics-of-nuclear-power (accessed on 3 June 2024).
- Data Mining with Meteorological Data by A.R. Chaudhari, D.P. Rana, R.G. Mehta, International Journal of Advanced Computer Research (ISSN (print): 2249-7277 ISSN (online): 2277-7970) Volume-3 Number-3 Issue-11 September-2013. Available online: https://nam02.safelinks.protection.outlook.com/?url=https%3A%2F%2Fwww.accentsjournals.org%2FPaperDirectory%2FConference%2FICETTR-2013%2F5.pdf&data=05%7C02%7Cbsg4n%40mst.edu%7C0503def568904a93e70708dcab4d0704%7Ce3fefdbef7e9401ba51a355e01b05a89%7C0%7C0%7C638573594641549768%7CUnknown%7CTWFpbGZsb3d8eyJWIjoiMC4wLjAwMDAiLCJQIjoiV2luMzIiLCJBTiI6Ik1haWwiLCJXVCI6Mn0%3D%7C0%7C%7C%7C&sdata=D677uNF0RK6jJwjI%2FSyPLpue%2FeMsoxSnZnjikiyJ%2Fok%3D&reserved=0 (accessed on 16 July 2024).
- Chen, L.; Han, B.; Wang, X.; Zhao, J.; Yang, W.; Yang, Z. Machine Learning Methods in Weather and Climate Applications: A Survey. Appl. Sci. 2023, 13, 12019. [Google Scholar] [CrossRef]
- Becker, R.; Thrän, D. Optimal siting of wind farms in wind energy dominated power systems. Energies 2018, 11, en11040978. [Google Scholar] [CrossRef]
- Callaway, Unit 1, 2020 Annual Radioactive Effluent Release Report–NRC. Available online: www.nrc.gov/docs/ML2111/ML21118B043.pdf (accessed on 16 July 2024).
- Callaway Energy Center 2021 Annual Radioactive Effluent Release Report. Available online: www.nrc.gov/docs/ML2211/ML22110A036.pdf (accessed on 16 July 2024).
- NRC 10 CFR 100.10 Subpart A–Evaluation Factors for Stationary Power Reactor Site Applications before 10 January 1997, and for Testing Reactors. Available online: https://www.nrc.gov/reading-rm/doc-collections/cfr/part100/part100-0010.html (accessed on 16 July 2024).
- Callaway Plant Unit 1, Resubmittal of Supplement to 2018 Annual Radioactive Effluent Release Report. NRC. Available online: www.nrc.gov/docs/ML1919/ML19197A319.html (accessed on 16 July 2024).
- Smriti, S.; Sinha, I.N. Classification of Air Pollution Dispersion Models: A Critical Review. April 2004. Available online: www.researchgate.net/publication/228712544_CLASSIFICATION_OF_AIR_POLLUTION_DISPERSION_MODELS_A_CRITICAL_REVIEW (accessed on 16 July 2024).
- Giovannini, L.; Ferrero, E.; Karl, T.; Rotach, M.W.; Staquet, C.; Trini Castelli, S.; Zardi, D. Atmospheric Pollutant Dispersion over Complex Terrain: Challenges and Needs for Improving Air Quality Measurements and Modeling. Atmosphere 2020, 11, 646. [Google Scholar] [CrossRef]
- Inversions. Utah Department of Environmental Quality. 5 January 2024. Available online: https://deq.utah.gov/air-quality/inversions#:~:text=Surface%20temperature%20inversions%20play%20a,leading%20to%20poor%20air%20quality (accessed on 16 July 2024).
- Finardi, S.; Morselli, M.G. Wind Flow Models over Complex Terrain for Dispersion Calculations. Available online: https://www2.dmu.dk/atmosphericenvironment/cost/docs/cost710-4.pdf (accessed on 16 July 2024).
- Wang, R.; Cui, K.; Sheu, H.L.; Wang, L.C.; Liu, X. Effects of Precipitation on the Air Quality Index, PM2.5 Levels and on the Dry Deposition of PCDD/Fs in the Ambient Air. Aerosol Air Qual. Res. 2023, 23, 220417. [Google Scholar] [CrossRef]
- 18 Atmospheric Boundary Layer. Available online: www.eoas.ubc.ca/books/Practical_Meteorology/prmet102/Ch18-abl-v102.pdf (accessed on 16 July 2024).
- Hanna, S.R.; Briggs, G.A.; Hosker, R.P., Jr. Handbook on Atmospheric Diffusion (Technical Report) | OSTI.GOV. 1 January 1982. Available online: www.osti.gov/biblio/5591108/ (accessed on 16 July 2024).
- Radiological Assessment: A Textbook on Environmental Dose Analyses (NUREG/CR-3332, ORNL-5968). NRC Web. Available online: www.nrc.gov/reading-rm/doc-collections/nuregs/contract/cr3332/index.html (accessed on 16 July 2024).
- O.G.S. Atmospheric Diffusion. by F. Pasquill. London (Van Nostrand Co.), 1962. Pp. XII, 297; 60s. Q. J. R. Meteorol. Soc. 1962, 88, 202–203. [Google Scholar] [CrossRef]
- McElroy, J.L.; Pooler, F., Jr. St. Louis Dispersion Study Volume I–Instrumentation, Procedures and Data Tabulations; U.S. Department of Health Education and Welfare, Consumer Protection and Environmental Health Service National Air Pollution Control Administration: Durham, NC, USA, 1968. [Google Scholar]
- Gifford, F.A., Jr. Turbulent Diffusion Typing Schemes—A Review. Nucl. Saf. 1976, 17, 68–86. [Google Scholar]
- Vogt, K.J. Umweltkontamination und Strahlenbelastung durch Radioaktive Abluft aus Kerntechnischen Anlagen. JUl-Rep. 1970, 637-ST. [Google Scholar]
- PVEducation. Available online: https://www.pveducation.org/pvcdrom/properties-of-sunlight/elevation-angle (accessed on 16 July 2024).
- Local Climatological Data (LCD) Dataset Documentation. Available online: www.ncei.noaa.gov/pub/data/cdo/documentation/LCD_documentation.pdf (accessed on 16 July 2024).
- EPA Regulatory Modeling Applications. Available online: www.epa.gov/sites/default/files/2020-10/documents/mmgrma_0.pdf (accessed on 6 February 2024).
| Stability Classification | Pasquill Categories | Temperature Change with Height (°C/100) m) |
|---|---|---|
| Extremely unstable | A | |
| Moderately unstable | B | |
| Slightly unstable | C | |
| Neutral | D | |
| Slightly stable | E | |
| Moderately Stable | F | |
| Extremely stable | G |
| A: Extremely Unstable Conditions | D: Neutral Conditions | ||||
| B: Moderately Unstable Conditions | E: Slightly Stable Conditions | ||||
| C: Slightly Unstable Conditions | F: Moderately Stable Conditions | ||||
| Surface Wind Speed at 10 m (m/s) | Daytime Insolation | Nighttime Conditions | |||
| Strong | Moderate | Slight | Thin Overcast or >3/8 Cloudiness | ≤3/8 Cloudiness | |
| <2 | A | A–B | B | ||
| 2–3 | A–B | B | C | E | F |
| 3–5 | B | B–C | C | D | E |
| 5–6 | C | C–D | D | D | D |
| >6 | C | D | D | D | D |
(deg) | Richardson Number (Dimensionless) | ||
|---|---|---|---|
| <−0.01 | >0.01 | ±0.01 | |
| 24 to 30 | |||
| 24 to 30 | |||
| 15 to 30 | |||
| 8 to 13 | |||
| Pasquill Type | (At 2 m) | L (m) |
|---|---|---|
| A | −1.0 to −0.7 | −2 to −3 |
| B | −0.5 to −0.4 | −4 to −5 |
| C | −0.17 to −0.13 | −12 to −15 |
| D | 0 | ∞ |
| E | 0.03 to 0.05 | 35 to 75 |
| F | 0.05 to 0.11 | 8 to 35 |
| Stability Classification | Pasquill Categories | (deg) |
|---|---|---|
| Extremely unstable | A | |
| Moderately unstable | B | |
| Slightly unstable | C | |
| Neutral | D | |
| Slightly stable | E | |
| Moderately stable | F | |
| Extremely stable | G |
| Synoptic Observations | Time of Day | Sun Height, α | Degree of Cloudiness | ||||
|---|---|---|---|---|---|---|---|
| Day | >50° 31° … 50° 16° … 30° 8° … 15° ≤7° | ≤4/8 | 5/8 … 7/8 ≤4/8 | 8/8 5/8 … 7/8 ≤4/8 | 8/8 5/8 … 7/8 ≤4/8 | 8/8 >4/8 (0) … 8/8 Fog | |
| Night | 8/8 | 5/8–7/8 | ≤4/8 | ||||
| Fog | |||||||
| Insolation Index | 4 | 3 | 2 | 1 | 0 | −1 | −2 |
| Measurement of Insolation, cal/cm2∙min | >0.60 | 0.60 … 0.35 | 0.34 … 0.16 | 0.15 … 0.09 | 0.08 … −0.01 | −0.02 … −0.04 | ≤−0.05 |
| Measurement of Stability [temperature gradient (ΔT/Δz), °C/100 m, measured at height of 120 m and 20 m] | ≤−1.5 | −1.4 … −1.2 | −1.1 … −0.9 | −0.8 … −0.7 | −0.6 … 0.0 | 0.1 … 2.0 | >2.0 |
| Wind Velocity (u), m/s | |||||||
| <1 | A | A | B | C | D+ | G | G |
| 1 … 1.9 | A | B | B | C | D+ | G | G |
| 2 … 2.9 | A | B | C | D | D | E | F |
| 3 … 4.9 | B | B | C | D | D | D | E |
| 5 … 6.9 | C | C | D | D | D | D | E |
| ≥7 | D | D | D | D | D | D | D |
| Reportable Contraction (ccc) | Meaning | Summation Amount of Layer (ll) |
|---|---|---|
| VV | Vertical Visibility | 8/8 |
| SKC or CLR | Clear | 0 |
| FEW | Few | 1/8–2/8 |
| SCT | Scattered | 3/8–4/8 |
| BKN | Broken | 5/8–7/8 |
| OVC | Overcast | 8/8 |
| Diffusion Category | Wind Profile Exponents, | |
|---|---|---|
| A (j = 6) | 0.09 | 0.10 |
| B (j = 5) | 0.20 | 0.15 |
| C (j = 4) | 0.22 | 0.20 |
| D (j = 3) | 0.28 | 0.25 |
| E (j = 2) | 0.37 | 0.30 |
| F (j = 1) | 0.42 | 0.30 |
| Callaway Time | Callaway Wind Direction in Number 10 m (A) | Callaway Hourly Wind Speed (m/s) at 10 m (A) | Callaway Stability a 60 m and 10 m | Travel Time | Arrival Time | Columbia Regional Airport time | CRA Solar Elevation Corrected for atm refraction (deg) | CRA Hourly Wind Direction (deg) | CRA Wind Speed (m/s) | CRA Stability |
|---|---|---|---|---|---|---|---|---|---|---|
| 1 January 2020 00:00:00 | 265.1 (W) b | 3.4 | E (5) | 0 days 03:22:39 | 1 January 2020 03:22:40 | 1 January 2020 03:20:31 | −58.5 | 180 (S b) | 2.2 | F (6) |
| Callaway Time | Callaway Wind Direction in Number 60 m (A) | Callaway Hourly Wind Speed (m/s) at 60 m (A) | Callaway Stability a 60 m and 10 m | Travel Time | Arrival Time | Columbia Regional Airport Time | CRA Solar Elevation Corrected for Atm Refraction (deg) | CRA Hourly Wind Direction (deg) | CRA Wind Speed (m/s) | CRA Stability |
|---|---|---|---|---|---|---|---|---|---|---|
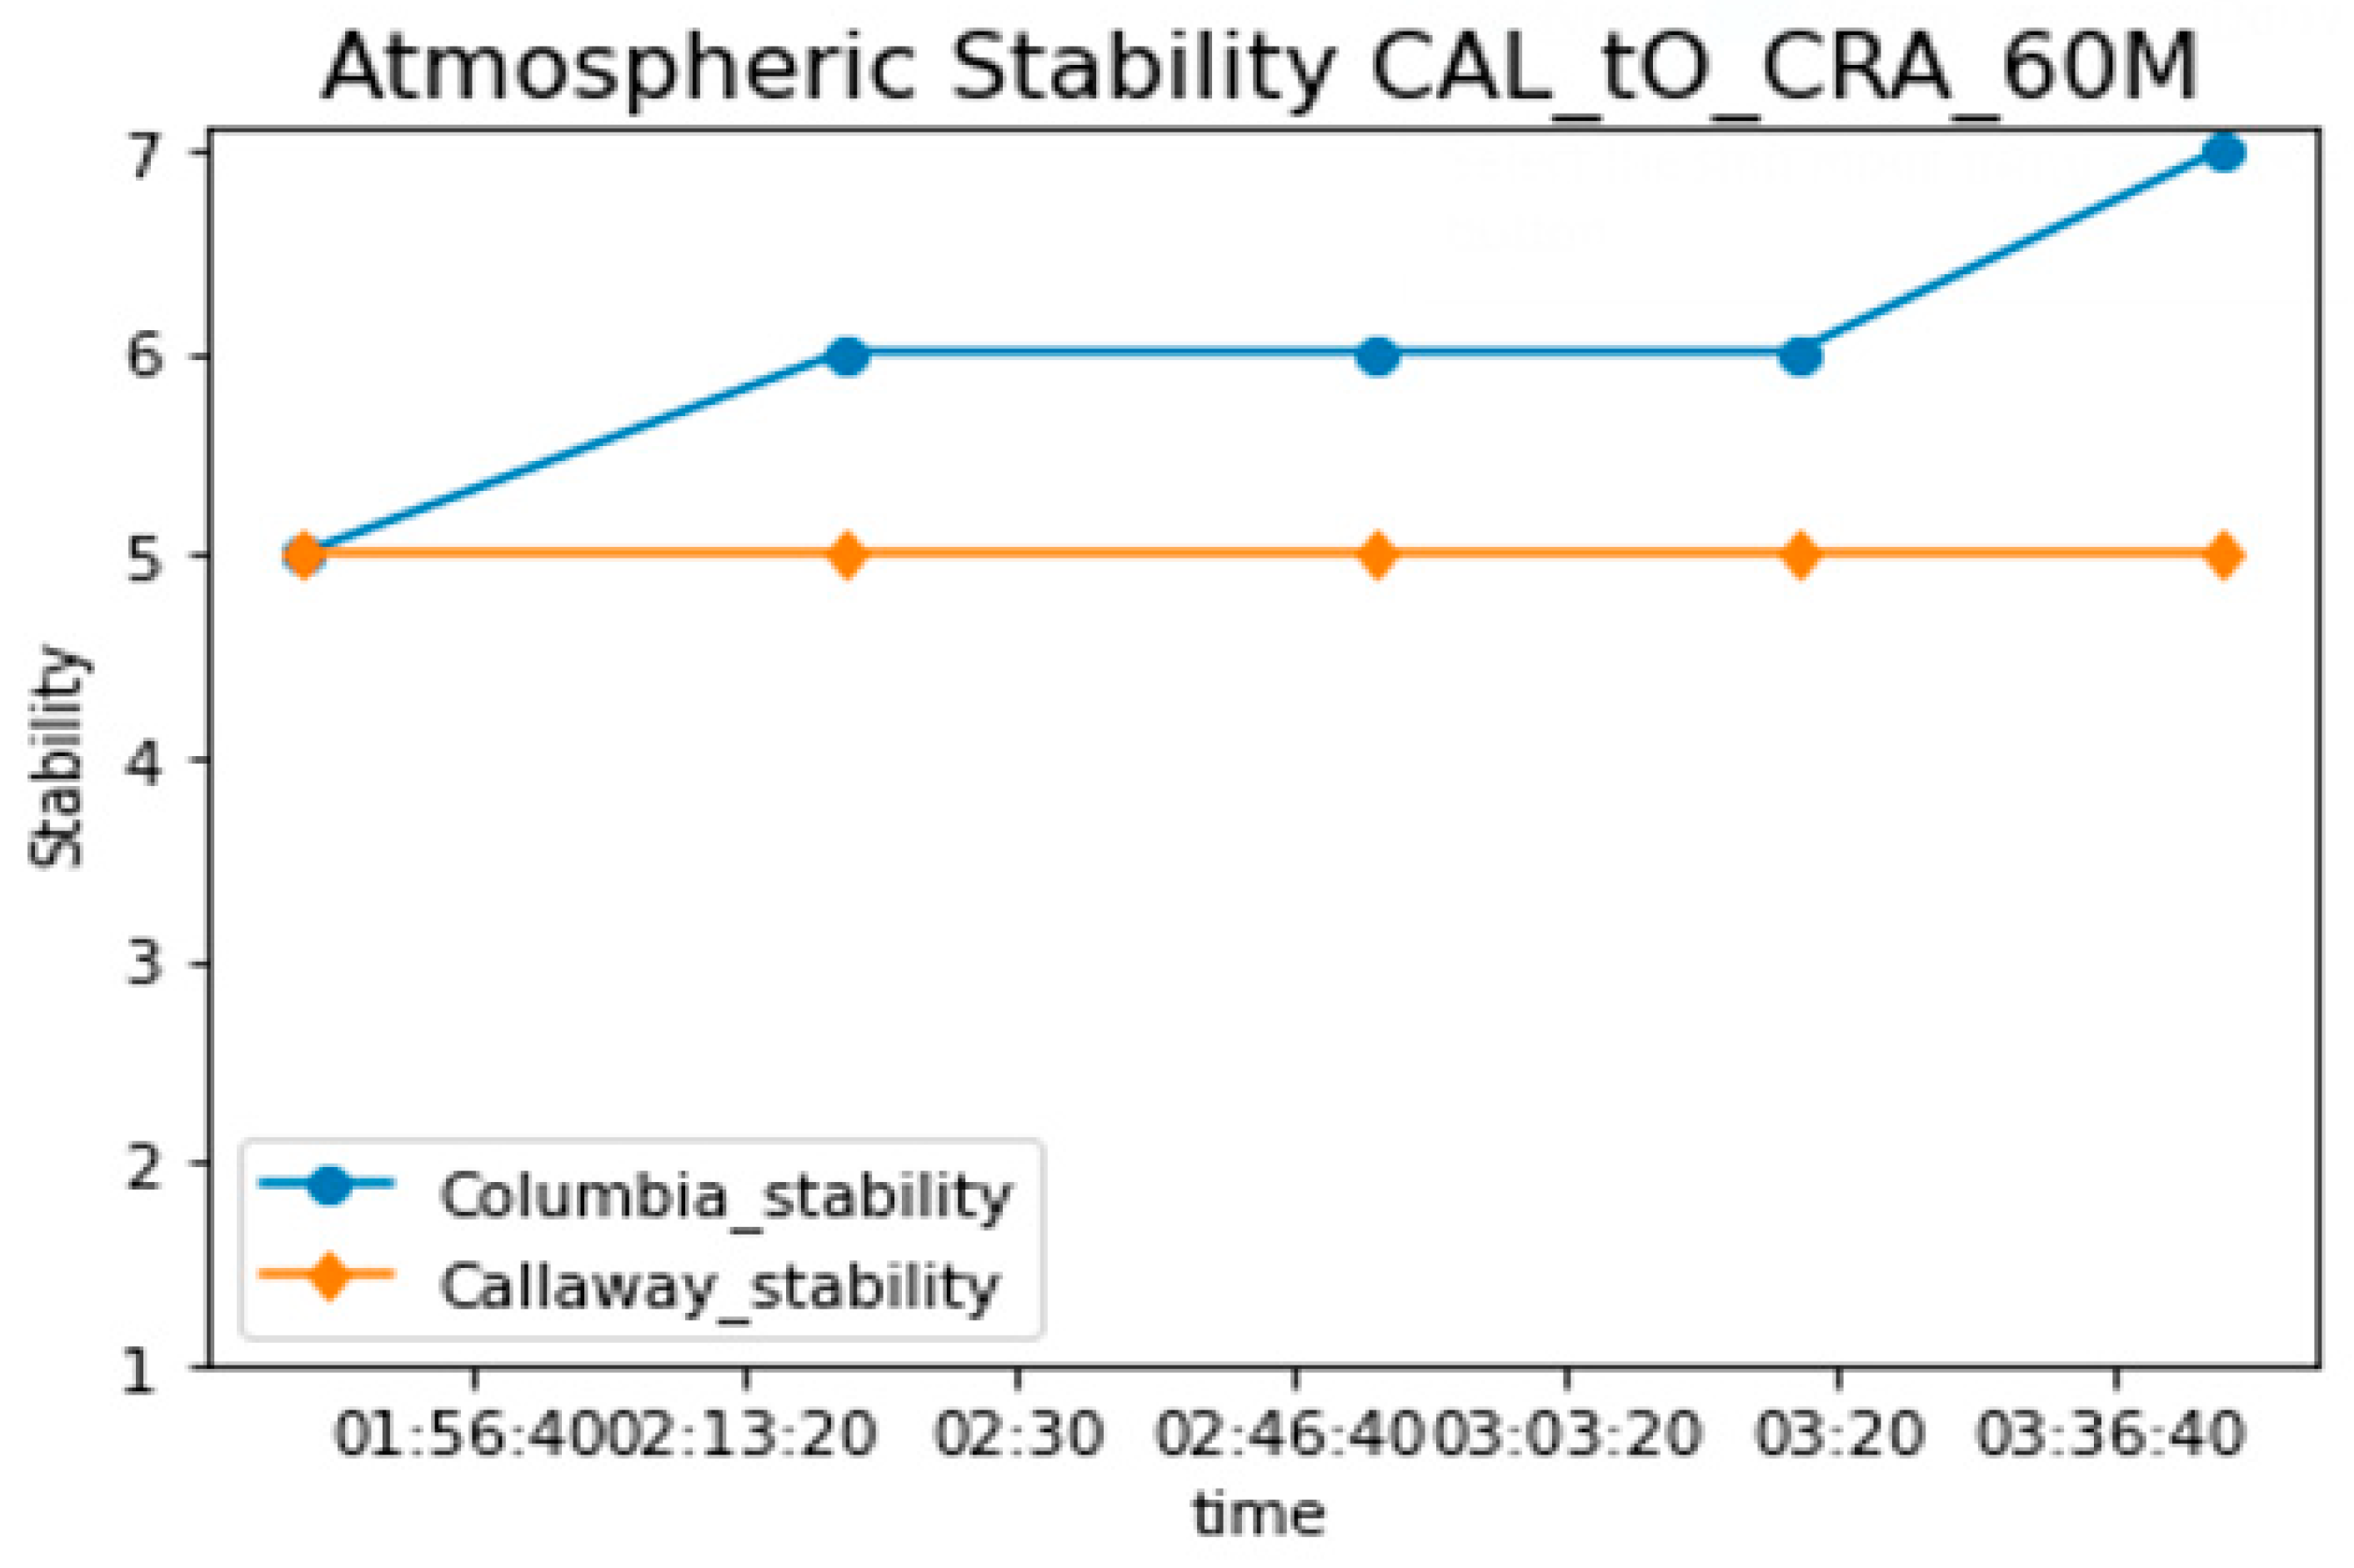
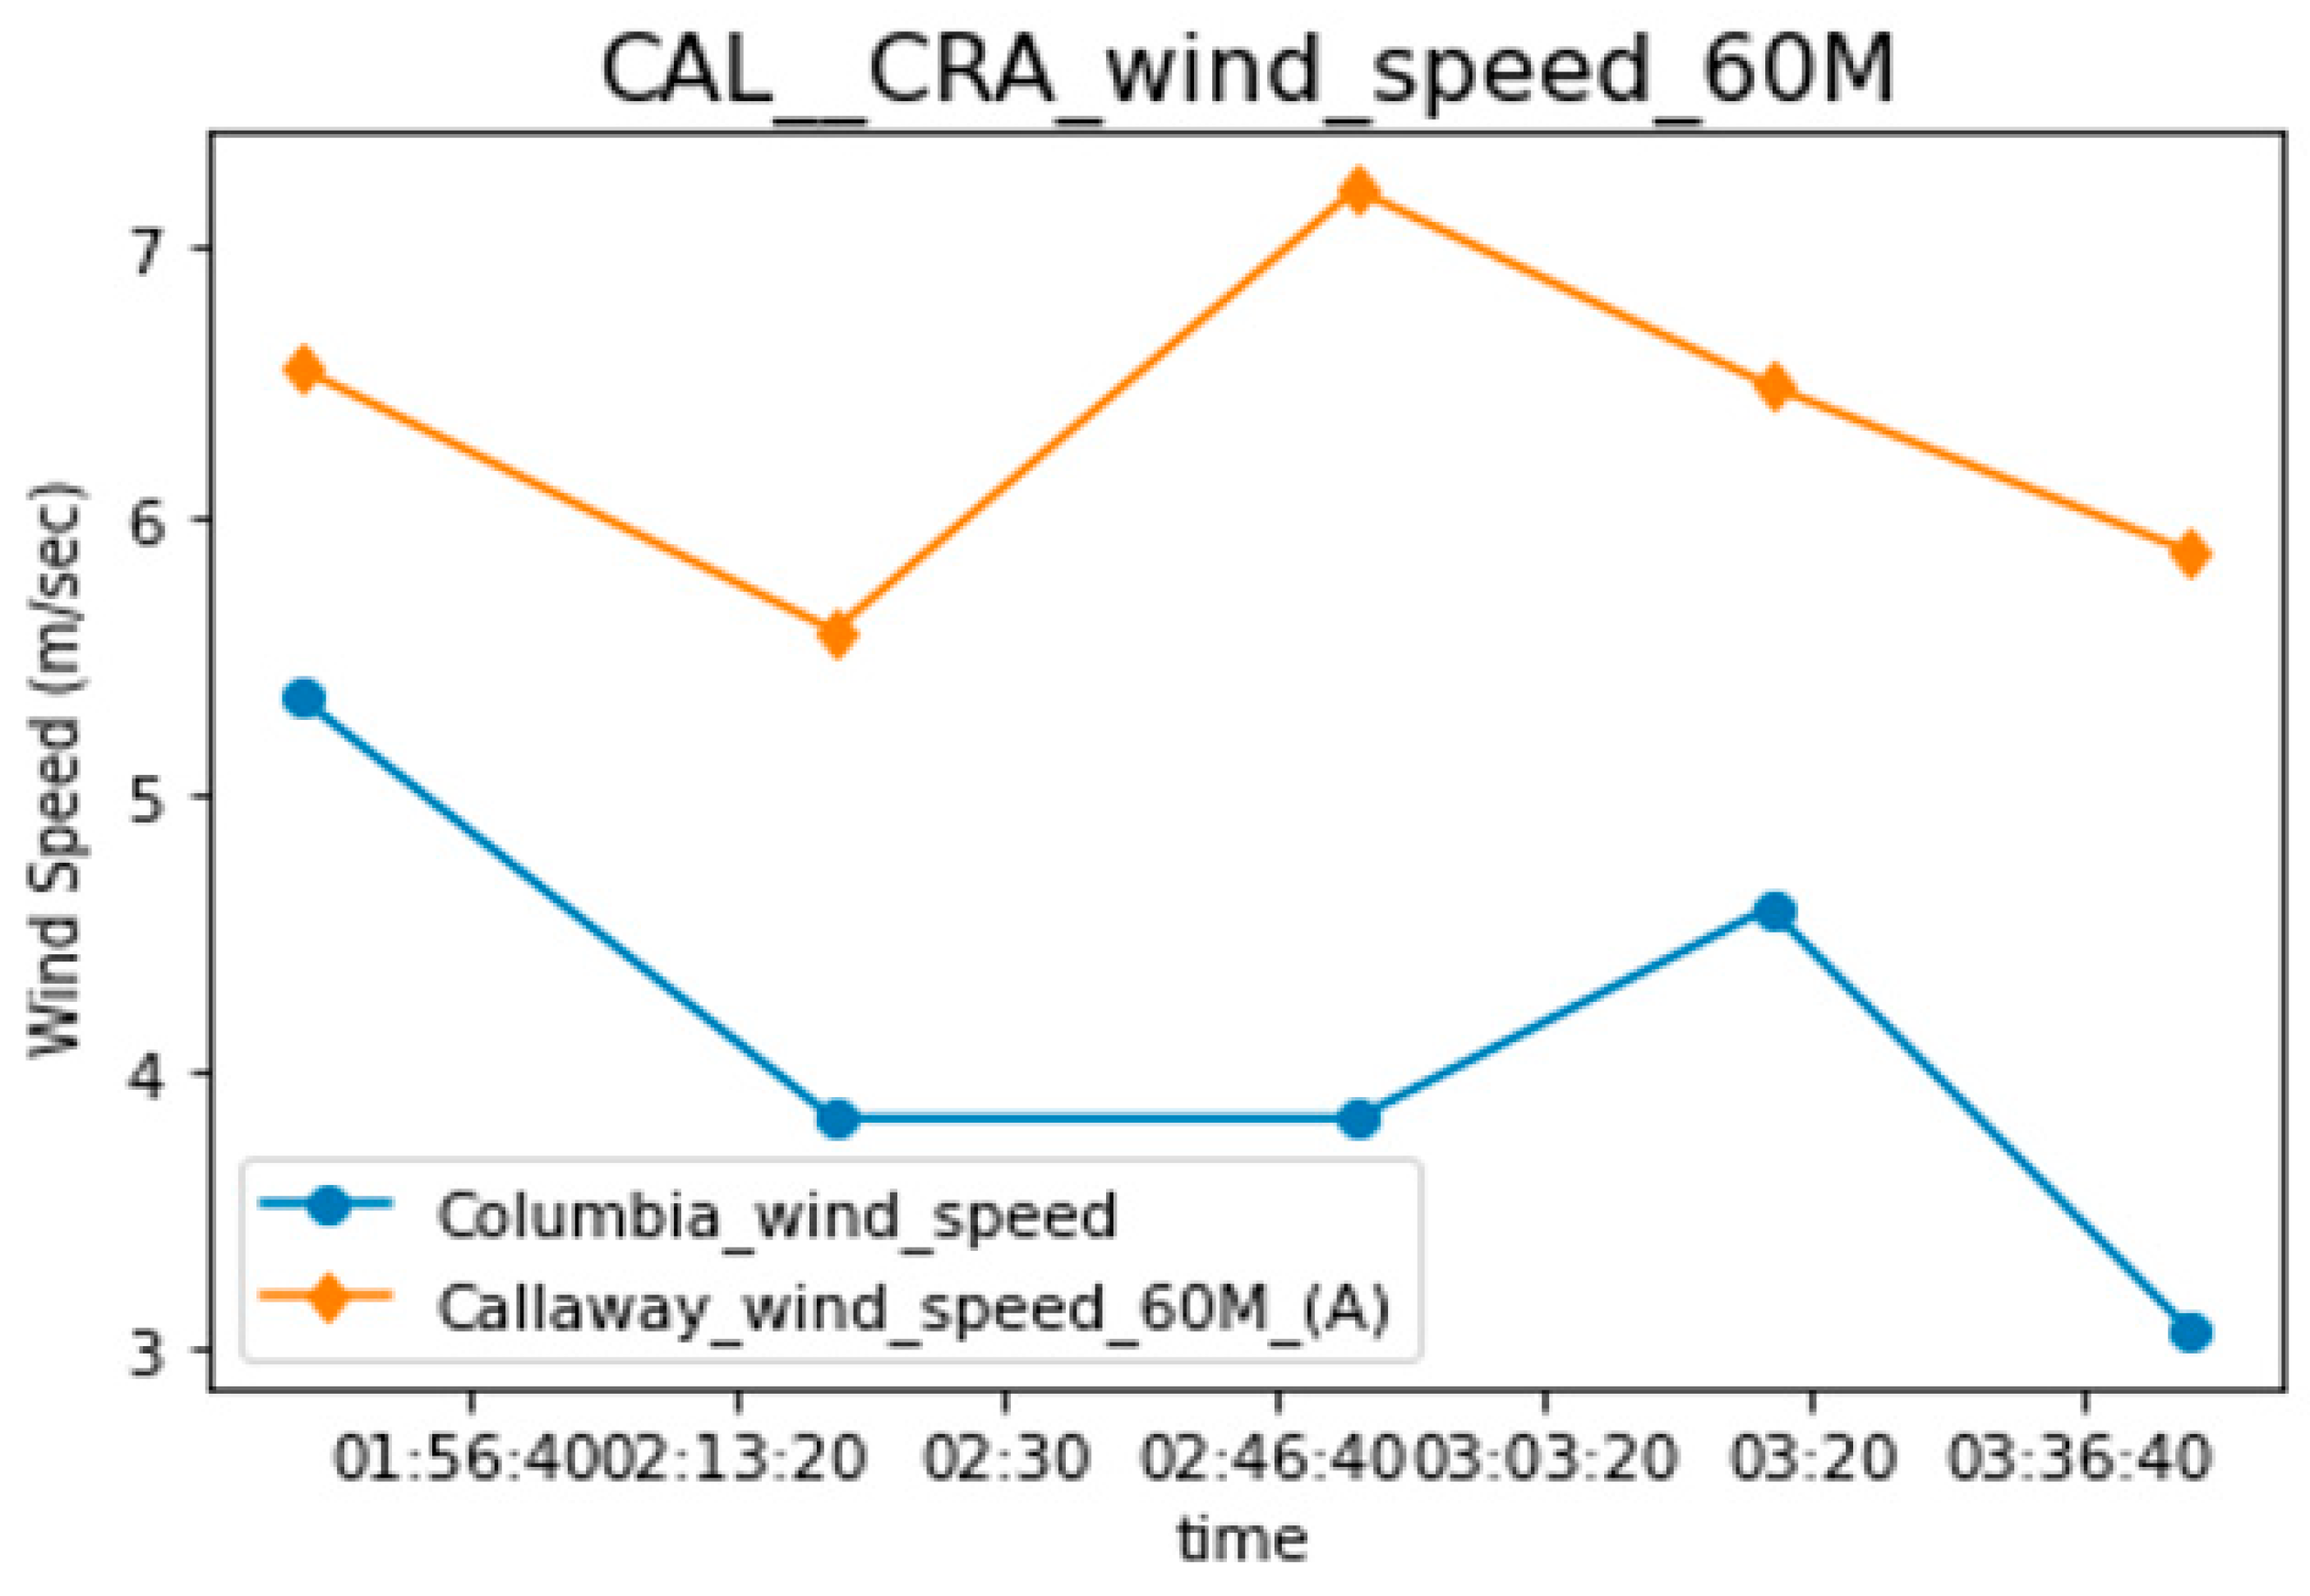
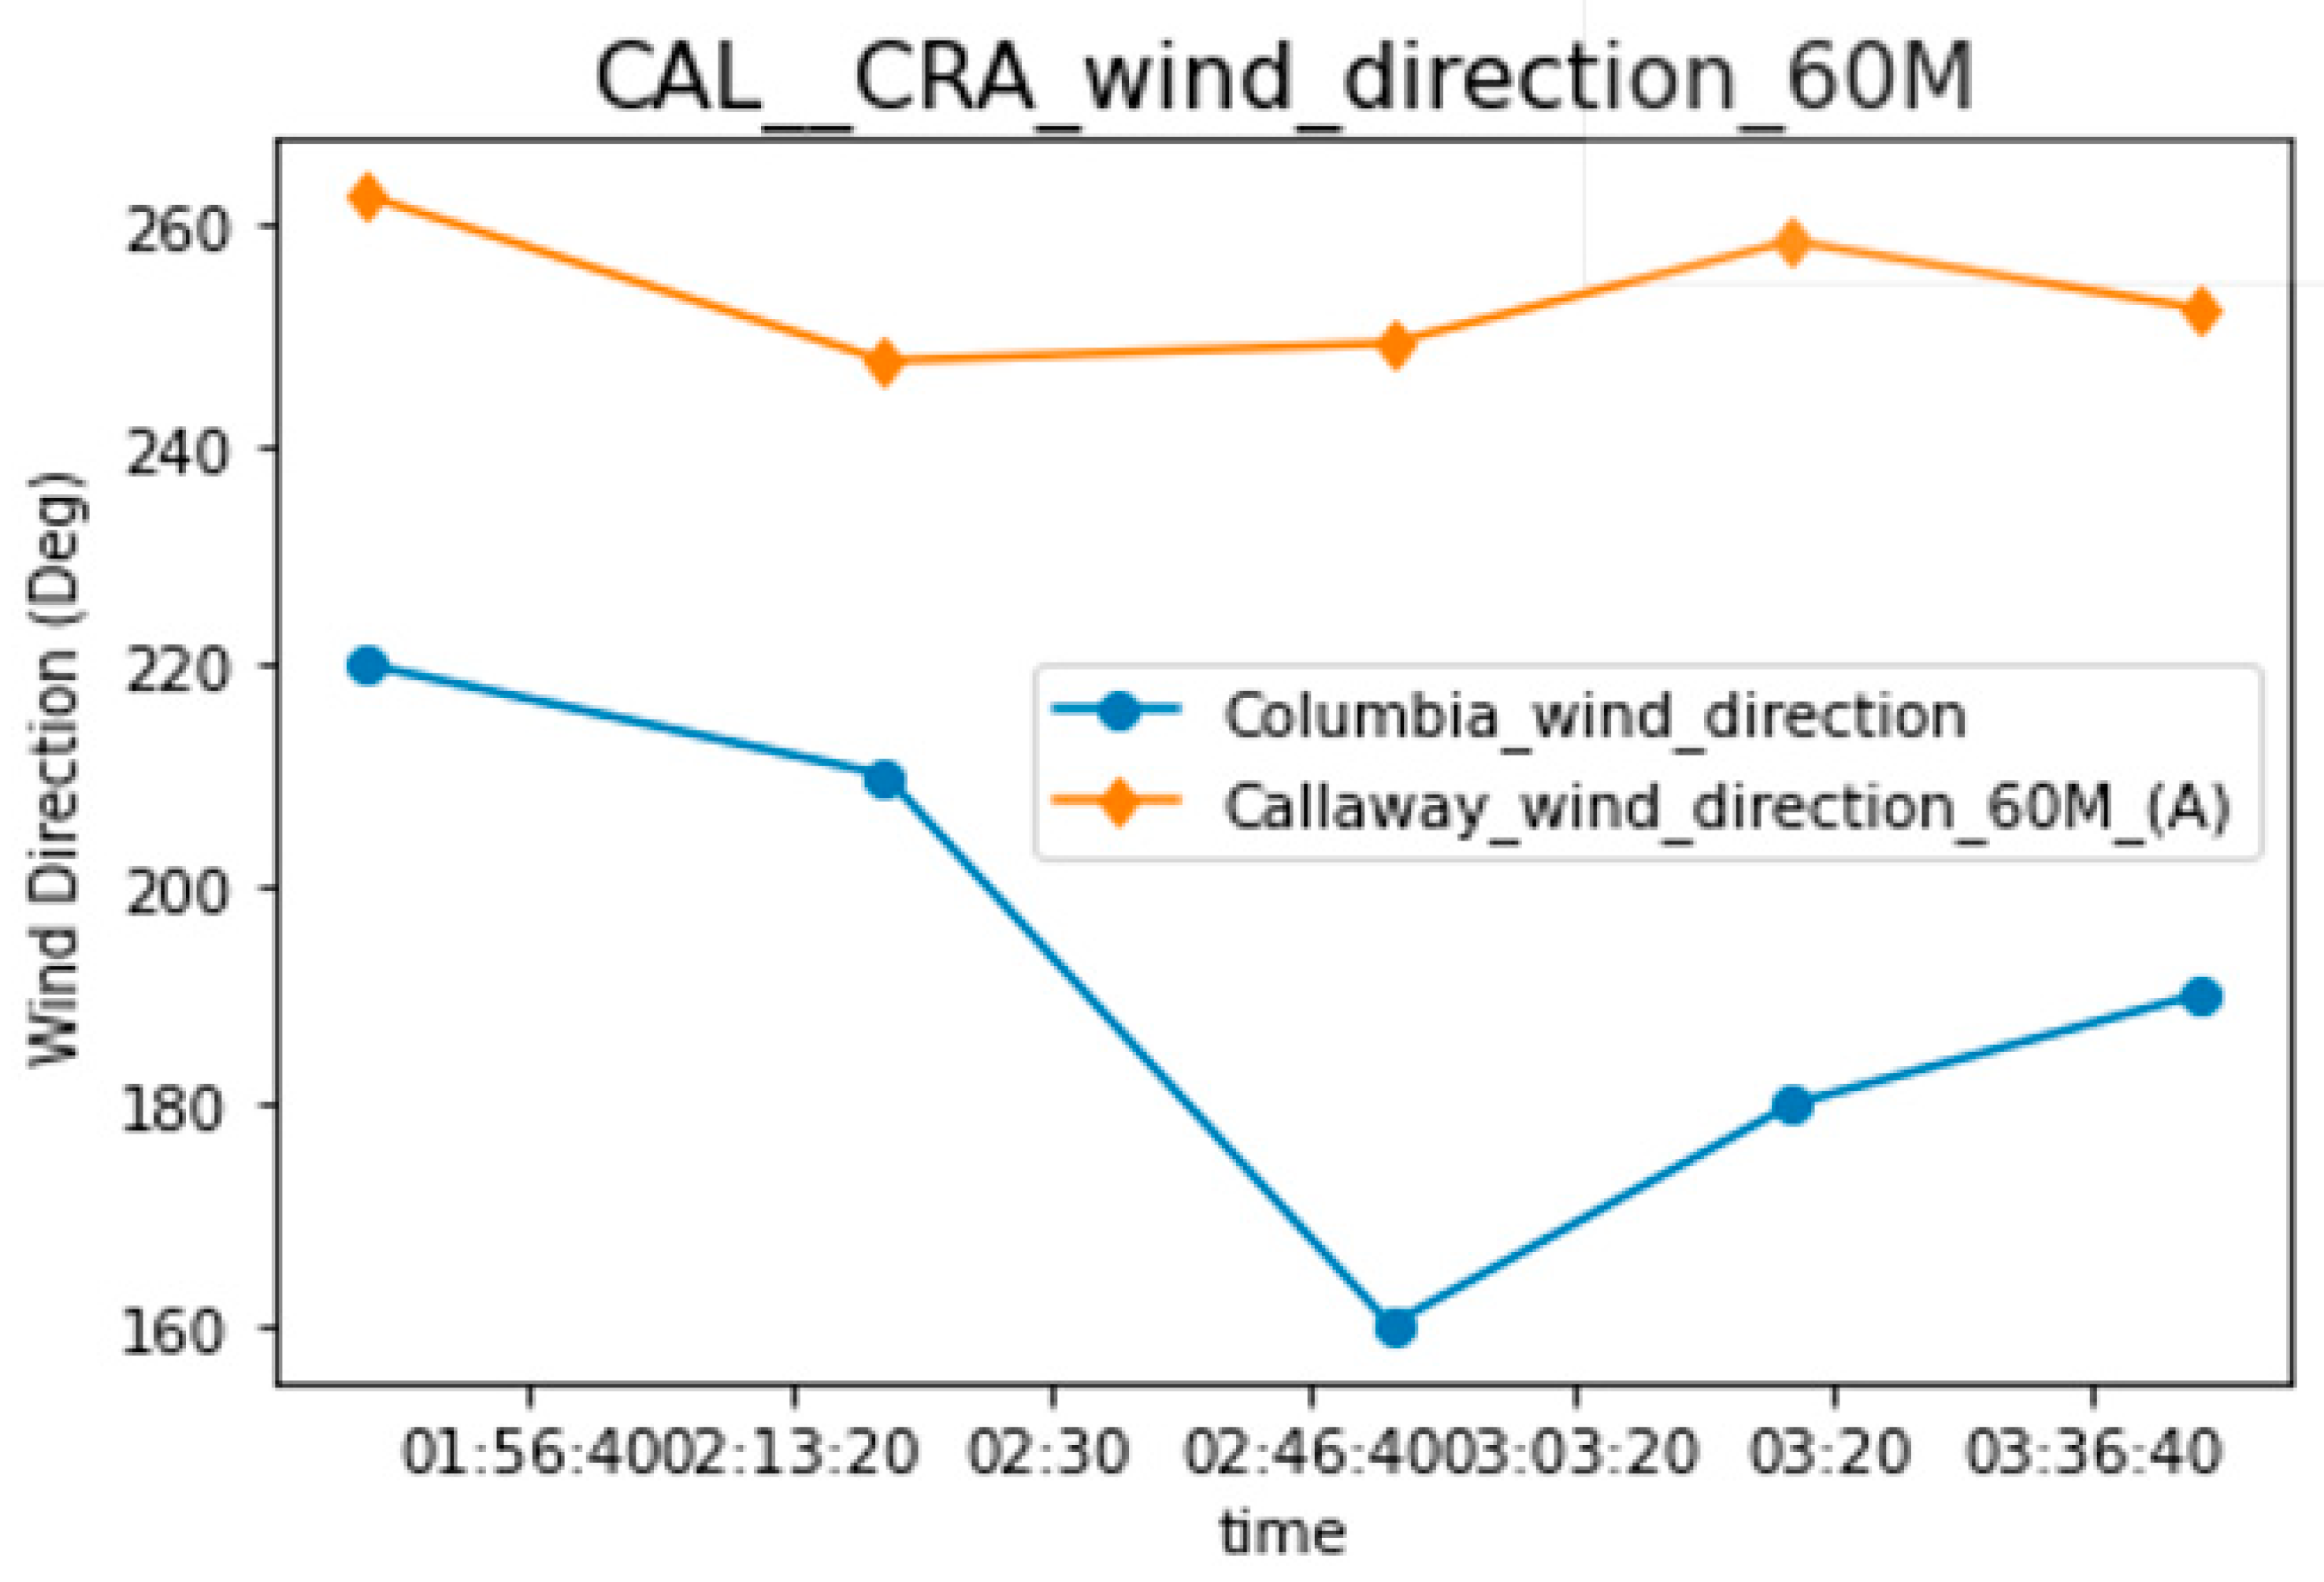
| 1 January 2020 00:00:00 | 262.6 (W b) | 6.5 | E (5) | 0 days 01:46:21 | 1 January 2020 01:46:21 | 1 January 2020 01:45:31 | −72.7 | 220 (SW b) | 5.4 | E (5) |
| 1 January 2020 00:15:00 | 247.6 (W b) | 5.6 | E (5) | 0 days 02:04:26 | 1 January 2020 02:19:27 | 1 January 2020 02:15:31 | −69.2 | 210 (SW b) | 3.8 | F (6) |
| 1 January 2020 01:15:00 | 249.2 (W b) | 7.2 | E (5) | 0 days 01:36:46 | 1 January 2020 02:51:46 | 1 January 2020 02:50:31 | −63.8 | 160 (S b) | 3.8 | F (6) |
| 1 January 2020 01:30:00 | 258.5 (W b) | 6.5 | E (5) | 0 days 01:47:22 | 1 January 2020 03:17:23 | 1 January 2020 03:15:31 | −59.4 | 180 (S b) | 4.6 | F (6) |
| 1 January 2020 01:45:00 | 252.4 (W b) | 5.9 | E (5) | 0 days 01:58:23 | 1 January 2020 03:43:24 | 1 January 2020 03:40:31 | −54.8 | 190 (S b) | 3.1 | G (7) |
Disclaimer/Publisher’s Note: The statements, opinions and data contained in all publications are solely those of the individual author(s) and contributor(s) and not of MDPI and/or the editor(s). MDPI and/or the editor(s) disclaim responsibility for any injury to people or property resulting from any ideas, methods, instructions or products referred to in the content. |
© 2024 by the authors. Licensee MDPI, Basel, Switzerland. This article is an open access article distributed under the terms and conditions of the Creative Commons Attribution (CC BY) license (https://creativecommons.org/licenses/by/4.0/).
Share and Cite
Sonpon, B.; Usman, S.; Smith, J.; Kovaleski, S.; Wibbenmeyer, J. Meteorological Data Mining and Synthesis for Supplementing On-Site Data for Regulatory Compliance. Energies 2024, 17, 3691. https://doi.org/10.3390/en17153691
Sonpon B, Usman S, Smith J, Kovaleski S, Wibbenmeyer J. Meteorological Data Mining and Synthesis for Supplementing On-Site Data for Regulatory Compliance. Energies. 2024; 17(15):3691. https://doi.org/10.3390/en17153691
Chicago/Turabian StyleSonpon, Ben, Shoaib Usman, Joseph Smith, Sarah Kovaleski, and Jason Wibbenmeyer. 2024. "Meteorological Data Mining and Synthesis for Supplementing On-Site Data for Regulatory Compliance" Energies 17, no. 15: 3691. https://doi.org/10.3390/en17153691
APA StyleSonpon, B., Usman, S., Smith, J., Kovaleski, S., & Wibbenmeyer, J. (2024). Meteorological Data Mining and Synthesis for Supplementing On-Site Data for Regulatory Compliance. Energies, 17(15), 3691. https://doi.org/10.3390/en17153691


