Abstract
The study of the thermokinetics of two types of wheat straw pellets, T1 (100% wheat straw) and T2 (70% wheat straw, 10% each of bentonite clay, sawdust, and biochar), under a nitrogen atmosphere (31–800 °C and 5, 10, and 20 °C/min heating rates) using model-free and model-based approaches by TG/DTG data, revealed promising results. While model-free methods were not suitable, model-based reactions, particularly Fn (nth-order phase interfacial) and F2 (second-order) models, effectively described the three-phase consecutive thermal degradation pathway (A→B, C→D, and D→E). The activation energy (Eα) for phases 2 and 3 (Fn model) averaged 136.04 and 358.11 kJ/mol for T1 and 132.86 and 227.10 kJ/mol for T2, respectively. The pre-exponential factor (lnA) varied across heating rates and pellets (T2: 38.244–2.9 × 10⁹ 1/s; T1: 1.2 × 10²–5.45 × 10¹⁴ 1/s). Notably, pellets with additives (T2) exhibited a higher degradable fraction due to lower Eα. These findings suggest a promising potential for utilizing wheat straw pellet biomass as a bioenergy feedstock, highlighting the practical implications of this research.
1. Introduction
Wheat production, a dominant force in the Australian grain industry, produces significant straw by-products. In the 2021/22 season alone, Australia’s 36.3 million tonnes of wheat [1] produced an estimated 45 million tonnes of straw waste. This issue is not unique to Australia, as the global wheat production of 776.0 million tonnes in 2020/21 led to approximately 1.0 billion tonnes of straw annually. Major producers such as China (172.2 million tonnes) and India (121.6 million tonnes) [2] underscore the worldwide challenge of managing this agricultural residue. The potential to convert wheat straw into bioenergy (solid, liquid, or gas) presents a promising solution, promoting waste valorization, reducing greenhouse gas emissions, and addressing environmental concerns on a global scale.
Bioenergy research has increasingly focused on converting biomass, like wheat straw, through pyrolysis [3]. This thermochemical process offers a path to convert biomass into valuable products like syngas, bio-oils, and chemicals [4]. However, despite significant research on pyrolysis applications [5], a key knowledge gap remains: understanding the initial formation of products (primary products) and the intra-molecular reactions within the biomass itself. To connect this gap, this study proposes utilizing thermo-analytical methods to investigate how temperature influences the material’s physical and chemical properties [6]. Temperature can induce physical transitions between solid, liquid, and gas phases and chemical changes involving bond breaking and formation within the material’s molecules [7]. A crucial challenge lies in differentiating the contributions of these physical and chemical phenomena to establish the limits of similar reaction rates at varying temperatures [8].
Therefore, assessing reaction rates across temperature variations is essential for understanding the material’s thermokinetic behavior. Two fundamental approaches using thermo-analytical (TA) tools are the degree of conversion and kinetic system [9]. (1) Degree of conversion: This method quantifies the reaction’s extent at specific temperatures, particularly for complex or slow reactions [10]. This can be achieved through controlled experiments with reliable equipment like a thermogravimetric analyzer (TGA). (2) Kinetic system: This method elucidates the underlying chemical reactions. It requires defining the reaction sequence and intermediate product formation, providing a deeper qualitative and quantitative understanding of the process (mechanistic approach) [11].
Kinetic analysis is crucial in understanding heat-activated reactions like pyrolysis and combustion [12]. Two main approaches dominate this field: (i) the isothermal approach and (ii) the non-isothermal approach [13]. Within these approaches, researchers often apply two categories of methods: model-free and model-fitting. Model-free methods utilize mathematical models to analyze isothermal and non-isothermal conversion data [14]. Both approaches require data obtained through thermo-analytical techniques at various temperatures. These data can be generated using experiments with different heating rates.
Thermogravimetric analysis (TGA) and derivative thermogravimetry (DTG) are established workhorses for studying how solid fuels like coal respond to pyrolysis [15]. However, information on wheat straw pellets still needs to be made available. While abundant research exists on TGA analysis of biomass [16,17,18,19,20], applying these techniques to understand the reaction schemes (exact chemical reactions) for pellet pyrolysis is a significant challenge, limiting the transferability of findings [21].
Although studies like Anca-Couce and Tsekos [22] demonstrate TGA’s utility for various materials, differentiating between hemicellulose and cellulose degradation peaks in lignocellulosic biomass like wheat straw pellets proves difficult [23]. This complexity, coupled with the random breaking of chemical bonds within the biomass matrix, hinders the targeted release of desired products during pyrolysis [24]. While Khankari and Rajan [25] analyzed wheat straws using TGA and compared kinetic determination methods, a fundamental gap persists in our understanding of solid fuels like pellets. The thermal properties of wheat straw pellets remain largely unknown.
Therefore, this research aims to bridge this gap by utilizing a thermogravimetric analyzer (TGA) to elucidate the pyrolytic degradation pathways of primary pseudo-components within wheat straw pellets. By acquiring previously unavailable data on wheat straw pellets, this research holds the potential to improve bioenergy production processes significantly. This pyrolysis study’s primary goals are (a) to compare and analyze thermal decomposition processes using model-free and model-based approaches and (b) to determine the reaction’s thermodynamic properties. These kinetic parameters could be used as input for computational fluid dynamics (CFD) modeling, particularly in designing and evaluating energy conversion reactors for pellets, such as gasifiers [26].
2. Theoretical Approach
2.1. Kinetic Parameters
Feedstocks’ physicochemical parameters and operating conditions significantly impact a reactor’s efficacy and conversion performance [27]. The kinetic performance is often expressed as activation energy (Eα), pre-exponential factor (lnA), and conversion model (f(α)), which are referred to as “kinetic triplets”, ideally representing the thermal breakdown [28]. Furthermore, a heterogeneous single-step kinetic equation characterizes biomass’s conversion or thermal degradation [29]. These kinetic triplets are generally determined based on the fundamental Arrhenius law, which is relevant in studying thermokinetic decomposition (Equation (1)). This law elegantly captures the transformation of sample mass over time (t) or concerning temperature (T) function [30]:
where
- f(α) = conversion model [31];
- α = conversion degree;
- (T) = reaction at absolute temperature.
The data regarding the fraction (α) data are generally applied in the biomass decomposition kinetic model (Equation (2)). The extent of conversion degree are noted [32]:
where
- α = reactant decomposition fraction or conversion degree at the time (t);
- m, m0, mf = sample’s actual, initial, and final mass (gm).
Arrhenius’s law is commonly used to determine reaction kinetics (combustion and pyrolysis), understand how it affects reaction rates, and optimize chemical reaction processes at different temperatures [33]. This law finds application in various fields, including chemistry, chemical engineering, biology, and environmental science. The Arrhenius equation (Equation (3)) is tropically written as the following [34]:
where
- k = constant of reaction rate, (1/min);
- Eα = activation of energy (kJ/mole);
- lnA = pre-exponential factor (1/s);
- T = absolute temperature (°C);
- R = universal gas constant (8.314 kJ/K.mole).
Equations (1) and (3) can be utilized to express the subsequent equations for a non-isothermal reaction subjected to a constant linear heating rate [35] (Equation (4)):
where the heating rate is defined as .
Various models have been applied to explore the kinetic factors through a single-step equation [36]. Model-based and model-free methods are commonly used in TG analysis [37].
2.2. Model-Free (Iso-Conversional) Analysis
The “model-free” method is an iso-conversational technique [38]. It involves determining Eα across different conversion (α) degrees without adhering to a specific kinetic model. It is typically unnecessary to understand the reaction type to find the activation energy using model-free techniques [14]. Conversely, this approach needs empirical data at various heating speeds to calculate the kinetic factors [39]. This process can concisely describe a single chemical equation (Arrhenius equation), thus underscoring its simplicity and elegance in kinetic analysis (Equation (5)).
Here, and are unknown, while can be found only with the assumption of .
Describing the Arrhenius equation with a single value is challenging due to its inherent complexity. Consequently, this method employs a systematic approach, computing from TG/DTG data sets gathered at constant heating rates and temperatures [40]. However, it is essential to note that this method relies on assumptions and presupposes specific kinetic reactions [41]. For any model derived from this method to be considered valid, the data must conform to particular assumptions as outlined in model-based techniques [42]:
- ▪
- Only single kinetic equation, for instance, Reactants A → Products B;
- ▪
- Eα and A based on α;
- ▪
- At a consistent level of conversion, the reaction rate is solely dependent on temperature;
- ▪
- Across all curves, the overall impact (total mass loss or total peak area) should remain consistent;
- ▪
- Reaction pathway change must maintain a similar conversion value.
The model-free methods offer a distinct advantage in chemical kinetics by allowing for a more precise identification of multi-step reactions [43]. These techniques primarily rely on data pertaining solely to the initial reactant (A) and the resulting product (B), providing no additional insights into intermediate stages or secondary outcomes [44]. Also, this method can quickly analyze the reaction process. Notably, it excels even in scenarios involving complex mixtures, competitive reactions, or processes characterized by overlapping steps. Interestingly, the method achieves all this with the modest tools of paper or a commonplace Excel spreadsheet.
2.3. Model-Based Method
The model-based method is a sophisticated approach for dissecting complex chemical processes with multiple reaction steps, where each step is accompanied by its equation and kinetic parameters [45]. This method precisely visualizes the reaction rates and concentrations of each reactant. Consequently, model-based kinetics is exceptionally effective for analyzing chemical reactions comprehensively, especially considering that approximately 95% of chemical reactions are inherently multi-stage [46]. However, before delving into thermal data, it is crucial to acknowledge a key prerequisite of the model-based method: recognizing the underlying assumptions governing the kinetic analysis process:
- ▪
- Firstly, it is implicit that the reaction comprises several distinct primary reaction stages, each characterized by its own kinetic reaction equation.
- ▪
- Additionally, it is posited that constant values exist for all kinetic factors governing the reaction.
- ▪
- Lastly, the total signal arises from aggregating individual reaction steps, each weighted accordingly. These combined steps form the foundation of the model-based kinetic analysis.
Multi-stage reaction systems are often characterized by two- and three-stage reaction models [47]. The formulation of a model, by the “International Confederation for Thermal Analysis and Calorimetry” references, a model should have minimum steps and be consistent with a substantial experiment scale [46]. The following equation can express the overall reaction rate for single reaction phases (Equation (6)).
where
- fj(ejpj) = function of reaction type;
- ej = initial reactant concentration;
- pj = product concentration;
- lnAj = pre-exponential factor;
- j = reaction steps number.
Model-based methods offer flexibility by incorporating sub-models tailored to the material’s physical and chemical reactions, whether occurring concurrently, sequentially, competitively, or independently [48]. This approach allows for nuanced consideration of various reaction types based on empirical data, facilitating the calculation of kinetic parameters for each reaction phase and optimizing reactions individually. Furthermore, the developed model can be optimized for the entire system, enhancing understanding of the chemical process and improving accuracy and applicability across broader contexts.
Based on the available literature, the computation of kinetic triples depends on user discretion, as disparate outcomes can arise even when employing identical datasets [49]. This process relies on factors such as the chosen model range and the specific reactions under examination [37]. The Kinetics NETZSCH, renowned for its multi-step analytical capabilities, is a highly proficient tool in current thermal analysis. Furthermore, this investigation considered the appropriate kinetic model [50] and regarded other pertinent reaction equations to ensure a comprehensive and accurate analysis (Equations (7) and (8)).
where n = reaction order and kcat = catalytic rate constant.
2.4. Kinetic Reaction Model
The study employed various kinetic approaches to analyze reaction speed and mechanism, categorized into model-based and model-free methods. Model-based methods, like nth-order reactions with autocatalysis (Cn) and general nth-order reactions (Fn), utilize predefined models for analyzing kinetic parameters. Conversely, model-free methods, such as Friedman, Ozawa–Flynn–Wall (OFW), and Kissinger–Akahira–Sunose (KAS), extract kinetic information directly from data without specific models. This combination of techniques allows for a comprehensive analysis of reaction kinetics. Table 1 summarizes commonly used kinetic reaction models in solid-state reaction kinetics.

Table 1.
Common reaction models [42,43,51,52].
3. Experimental Approach
3.1. Experimental Sample Preparation
The wheat straw pellets (T1: 100% wheat straw; T2: 70% wheat straw, 10% sawdust, 10% biochar, and 10% bentonite clay) were produced by combining various materials, as detailed in prior research [53]. In line with the study’s objective, locally available and cost-effective additives were chosen for pellet manufacturing. Consequently, this study opted for additives such as bentonite clay, sawdust, and biochar. Sawdust served as a binding material, enhancing the cohesive properties of the pellets, while biochar contributed to the pellets’ heating values. Additionally, bentonite clay, commonly employed as a binding agent, played a pivotal role in the pellet formation.
The cylindrical solid fuel pellet was produced using wheat straw with and without additives. However, the samples need to be ground to enhance conversion efficiency [54] and augment the surface area for the TGA. The materials were subjected to 24 h of drying in a furnace at 105 °C. The dried samples were manually ground into a fine powder using the Sage Precision Brewer & Smart Grinder Pro: BCG820BSSUK. Subsequently, the resulting ground (powder) sample was sieved through a 125 mm mesh screen to analyze particle size and ensure an even distribution of particle sizes. The particle size analysis in Table 1 indicated that over 35% of particles were less than 1 mm, which was deemed suitable for TGA analysis. A dummy test for every heating rate also reduced systemic errors and provided a baseline reference.
A consistent sample size (weight) was employed for every treatment to ensure precise and reliable experimental outcomes, adhering to the established methodology [55]. It is essential to highlight that the TGA pan had a practical sample-holding capacity ranging from 8.75 to 9.75 mg (Figure 1), factoring in the actual weight range utilization. The combustion process occurred in an Alumina-based pan, which was sealed with a lid to optimize heat transmission conditions. To ensure accuracy and reproducibility, the experimental test was conducted in triplicate. The average collected data were subsequently utilized for the present study.

Figure 1.
Categories of particles.
3.2. Thermogravimetric Analysis
The wheat straw pellets pyrolysis was conducted utilizing a thermogravimetric analyzer (STA 449F3 Jupiter, Erich NETZSCH GmbH & Co. Holding KG, Selb, Germany). Experimental work, including pyrolysis and combustion tests, occurred at the Institute for Future Environments, Central Analytical Research Facility, Queensland University of Technology, Brisbane, QLD, Australia 4000. The STA was employed to calculate and record material weight loss over time [56]. Pyrolysis occurred in a controlled environment, maintaining 0.1 MP pressure [57]; nitrogen gas serves as the carrier at a flow rate of 50 mL per minute to ensure consistent conditions throughout the process. For the TGA analysis, 9.0 mg of the sample with a particle size of approximately 1 mm was used.
The kinetic triplets for WSP pyrolysis were determined using NETZSCH Proteus 8.0 software, a sophisticated package enabling analysis of temperature-dependent chemical processes [43]. The process is automated, with a computer system overseeing operations, recording mass fluctuations, and generating a weight loss curve. TGA data, sourced from the integrated computer, utilized varying heating rates of 5, 10, and 20 °C/min, with temperatures ranging from 31 to 800 °C. These heating rates and temperature ranges are widely adopted in experiments to assess the kinetic properties of various biomass materials [58].
4. Results and Discussion
4.1. Physicochemical Analysis
Understanding the elemental composition of wheat straw pellets is crucial for modeling thermochemical conversion processes and predicting product formation and optimal reactant ratios. Proximate and ultimate analyses determine major and minor elements. Following established protocols, as described by Nath, Chen [53] (refer to Table 2), revealed a favorable composition for pyrolysis. Proximate analysis indicated low moisture content (3–6%), high volatile matter (53–76%), and moderate fixed carbon (11–32%). The ultimate analysis confirmed minimal nitrogen and sulfur content, suggesting minimal pollutant gas emissions during conversion.
Table 2.
Evaluate the physicochemical properties of the test sample.
The ultimate analysis of wheat straw pellets indicates minimal nitrogen (0.5–0.7%) and sulfur (0.11~2.1%) content, suggesting negligible emissions of contaminant gases during thermochemical conversion (Table 2). Combined with the high volatile matter content (53–76%), characteristic of suitable biomass feedstock, wheat straw pellets emerge as promising sustainable feedstock for bioenergy production processes like pyrolysis, potentially yielding valuable products such as biogas and biochar [59,60]. Table 2 compares the physical properties of T1 and T2 pellets. T2 exhibits higher bulk density (607.40 kg/m3) and average length (37.0 mm) than T1, possibly due to better composition or different binders. Conversely, T1’s larger diameter may result from looser bonding between components.
Table 3 outlines the composition of wheat straw (WS) pellets under various treatments. Lignin, hemicellulose, and cellulose are major biomass components, including WS pellets [61]. Lignin serves as a natural binder, enhancing the strength of densified products [62]. WS pellets may have weaker binding due to lower lignin content. Treatment T2 incorporated binders to increase overall lignin content (from 7.0% to 10.60%). This likely contributes to the enhanced strength and durability of densified T2 pellets.
Table 3.
Compositional analysis of wheat straw pellets.
4.2. Thermokinetic Characteristics
Thermokinetic characteristics are typically synthesized from TG and DTG graphs. The pyrolysis of WS pellets was evaluated based on fundamental assumptions of the model. Figure 2 visually presents this evaluation, displaying pyrolysis properties derived from data conforming to the standard model. This graphical representation is crucial for understanding the complexities of the pyrolytic process.


Figure 2.
(A1–D2). Evaluation of WSP pyrolysis characteristics through model-free approaches. Note: (A1,B1) = TG curve (model-free), (A2,B2) = TG curve (model-based), (C1,D1) = DTG curve (model-free), and (C2,D2) = DTG curve (model-based).
Model-free and model-based methods are applied to investigate the kinetic analysis of any biomass, particularly in the context of single-step conversion reactions. When it comes to a single response, model-free approaches are best fitted [63]. On the other hand, the model-based methods prove versatile and helpful for single as well as multi-phase reactions [49]. Literature indicates that the transformation process of lignocellulosic biomass, entailing kinetic pathway shifts, follows intricate reactions [64]. Significantly, the conversion of wheat straw has ventured into a multi-faceted path [65]. It is worth noting, however, that some researchers opt to investigate lignocellulosic biomass through the lens of single-step reactions [66,67,68]. This diversity in approach highlights the nuanced nature of biomass analysis.
The interpretation of results for multi-point kinetic reactions has shown significant variability across different methodologies [69]. Upon close examination, it became evident that the model-free methods’ hypothesis did not align with the thermal decomposition profiles of wheat straw pellets (TG/DTG curves). Rather than providing a coherent understanding, the model-free methods tend to result in inconsistency, presenting potentially misleading values for Eα and A due to the dynamic shifts occurring throughout the reactions (Figure 2). Consequently, in this study, emphasis was placed solely on employing a model-based approach, which offered a more robust and appropriate framework for the analysis of the complex multi-point kinetic reaction involved.
4.3. Pyrolysis Process Assessment through a Model-Based Technique
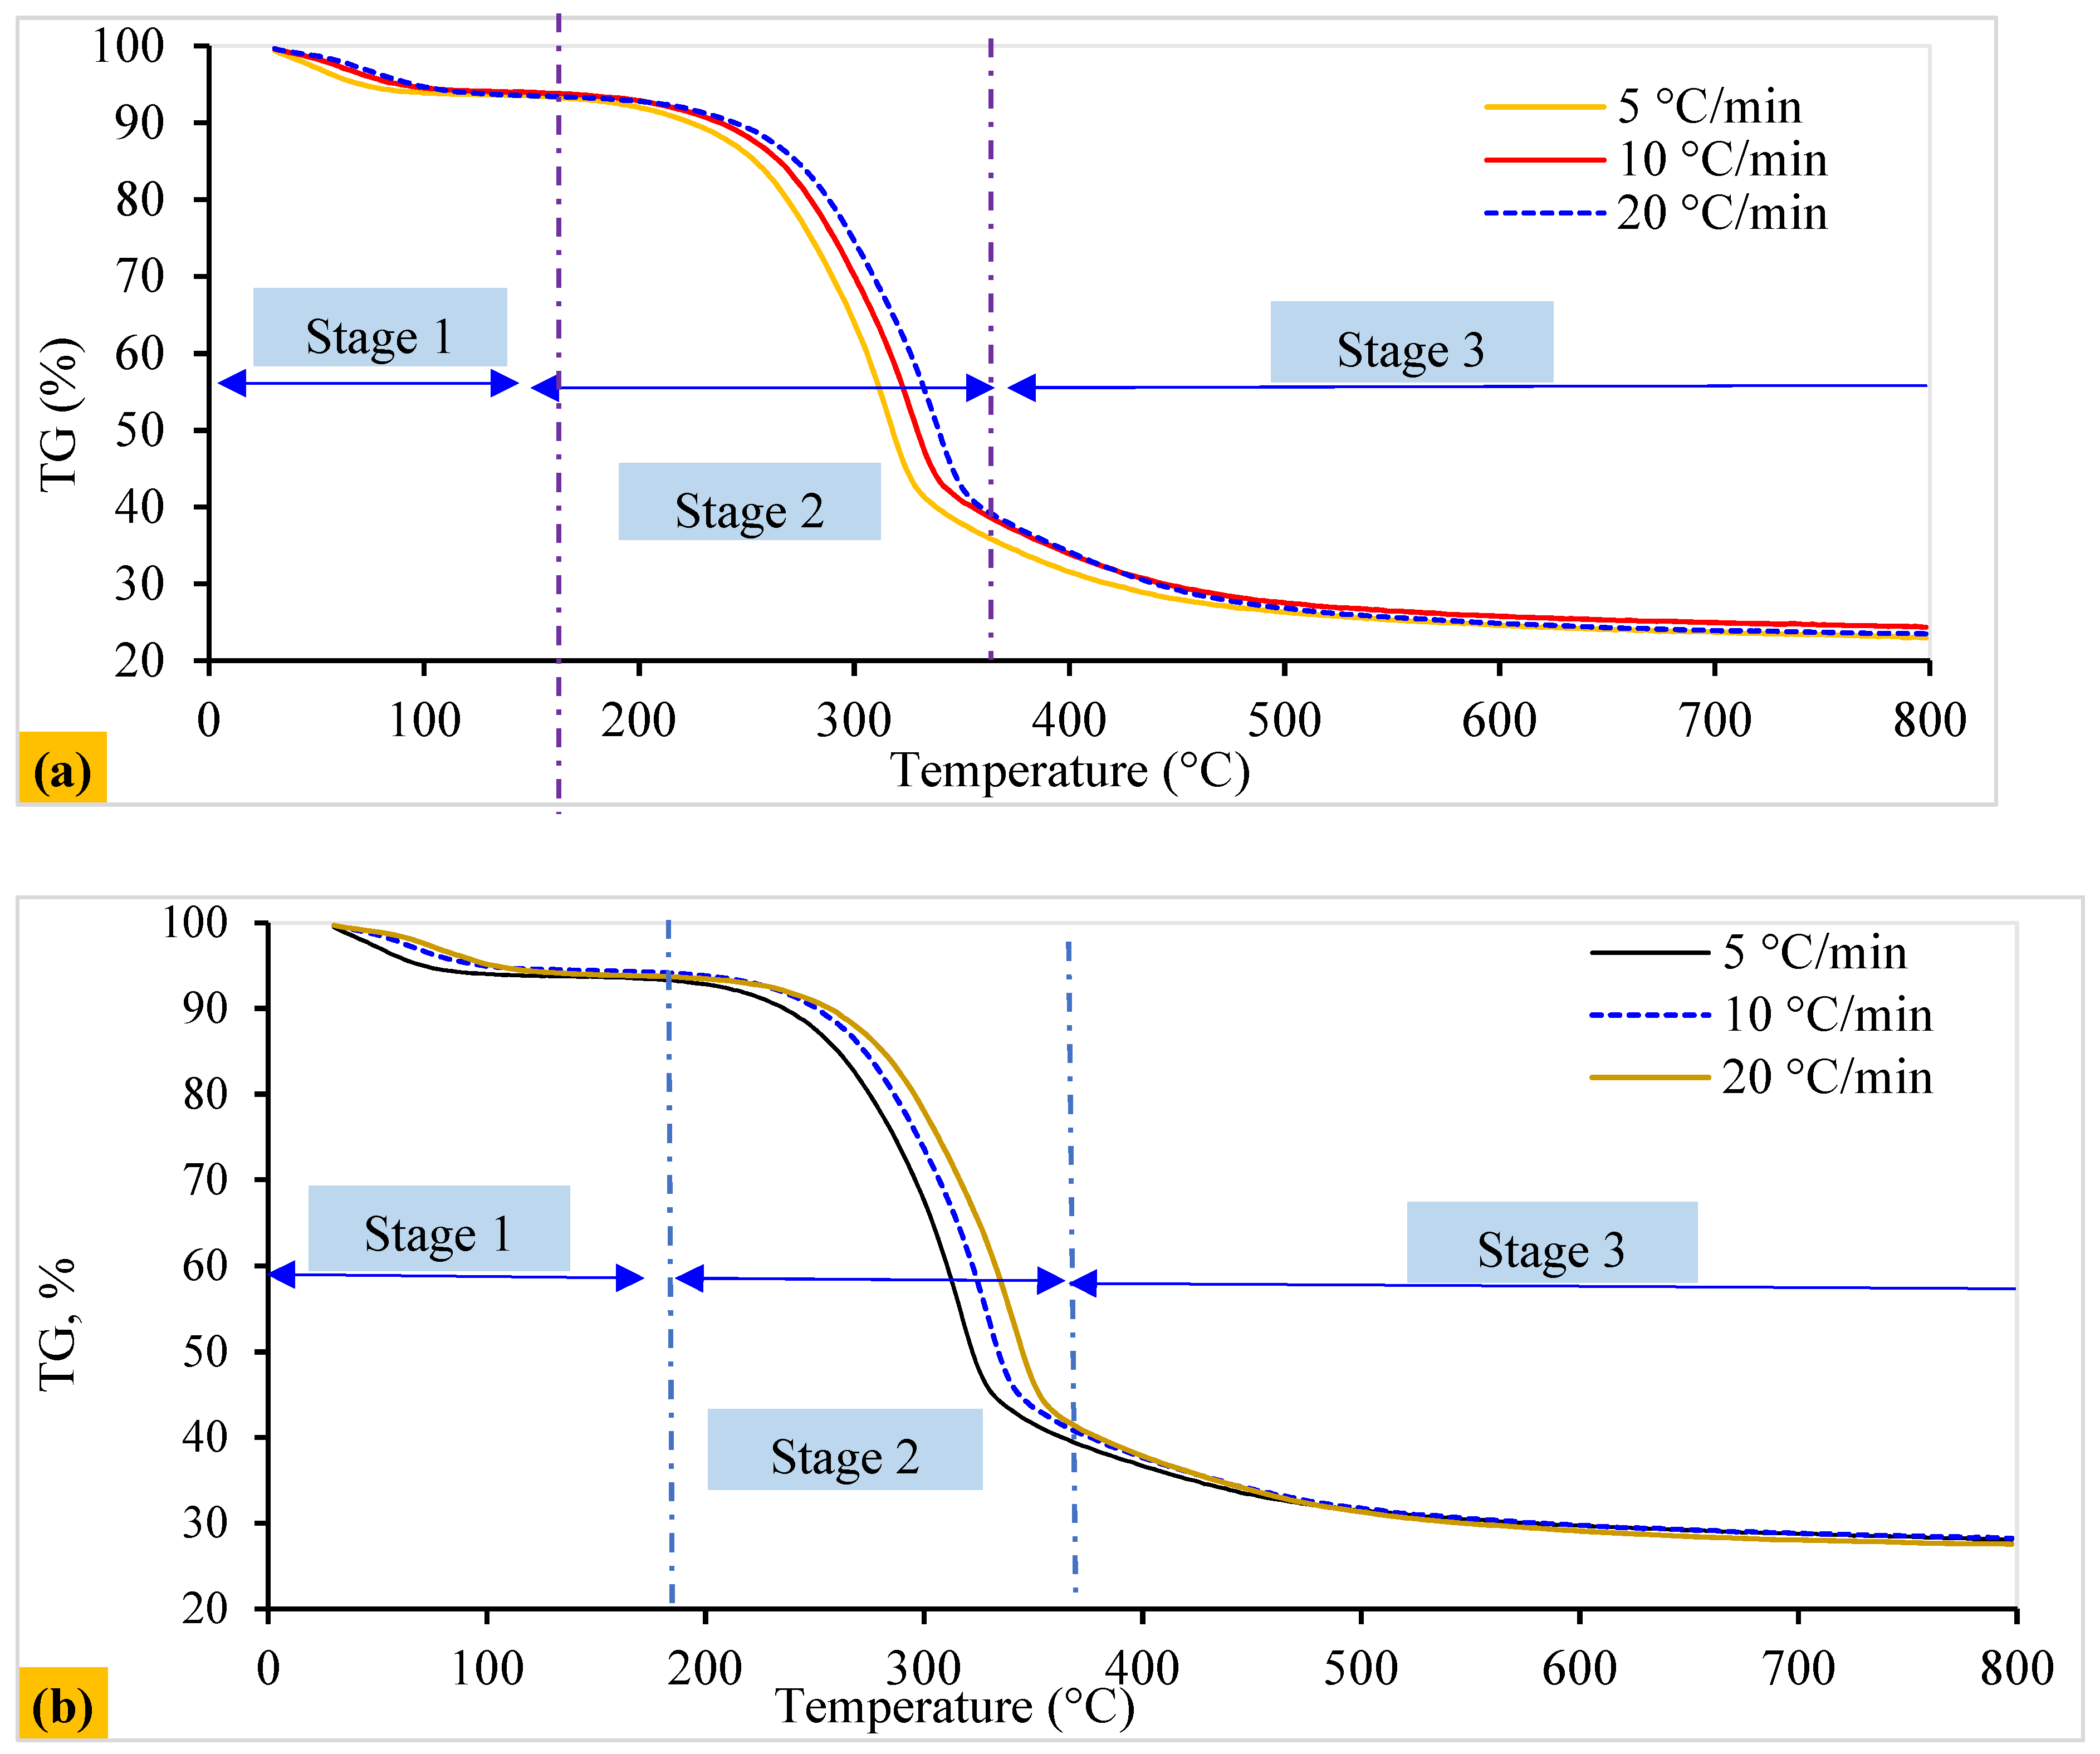
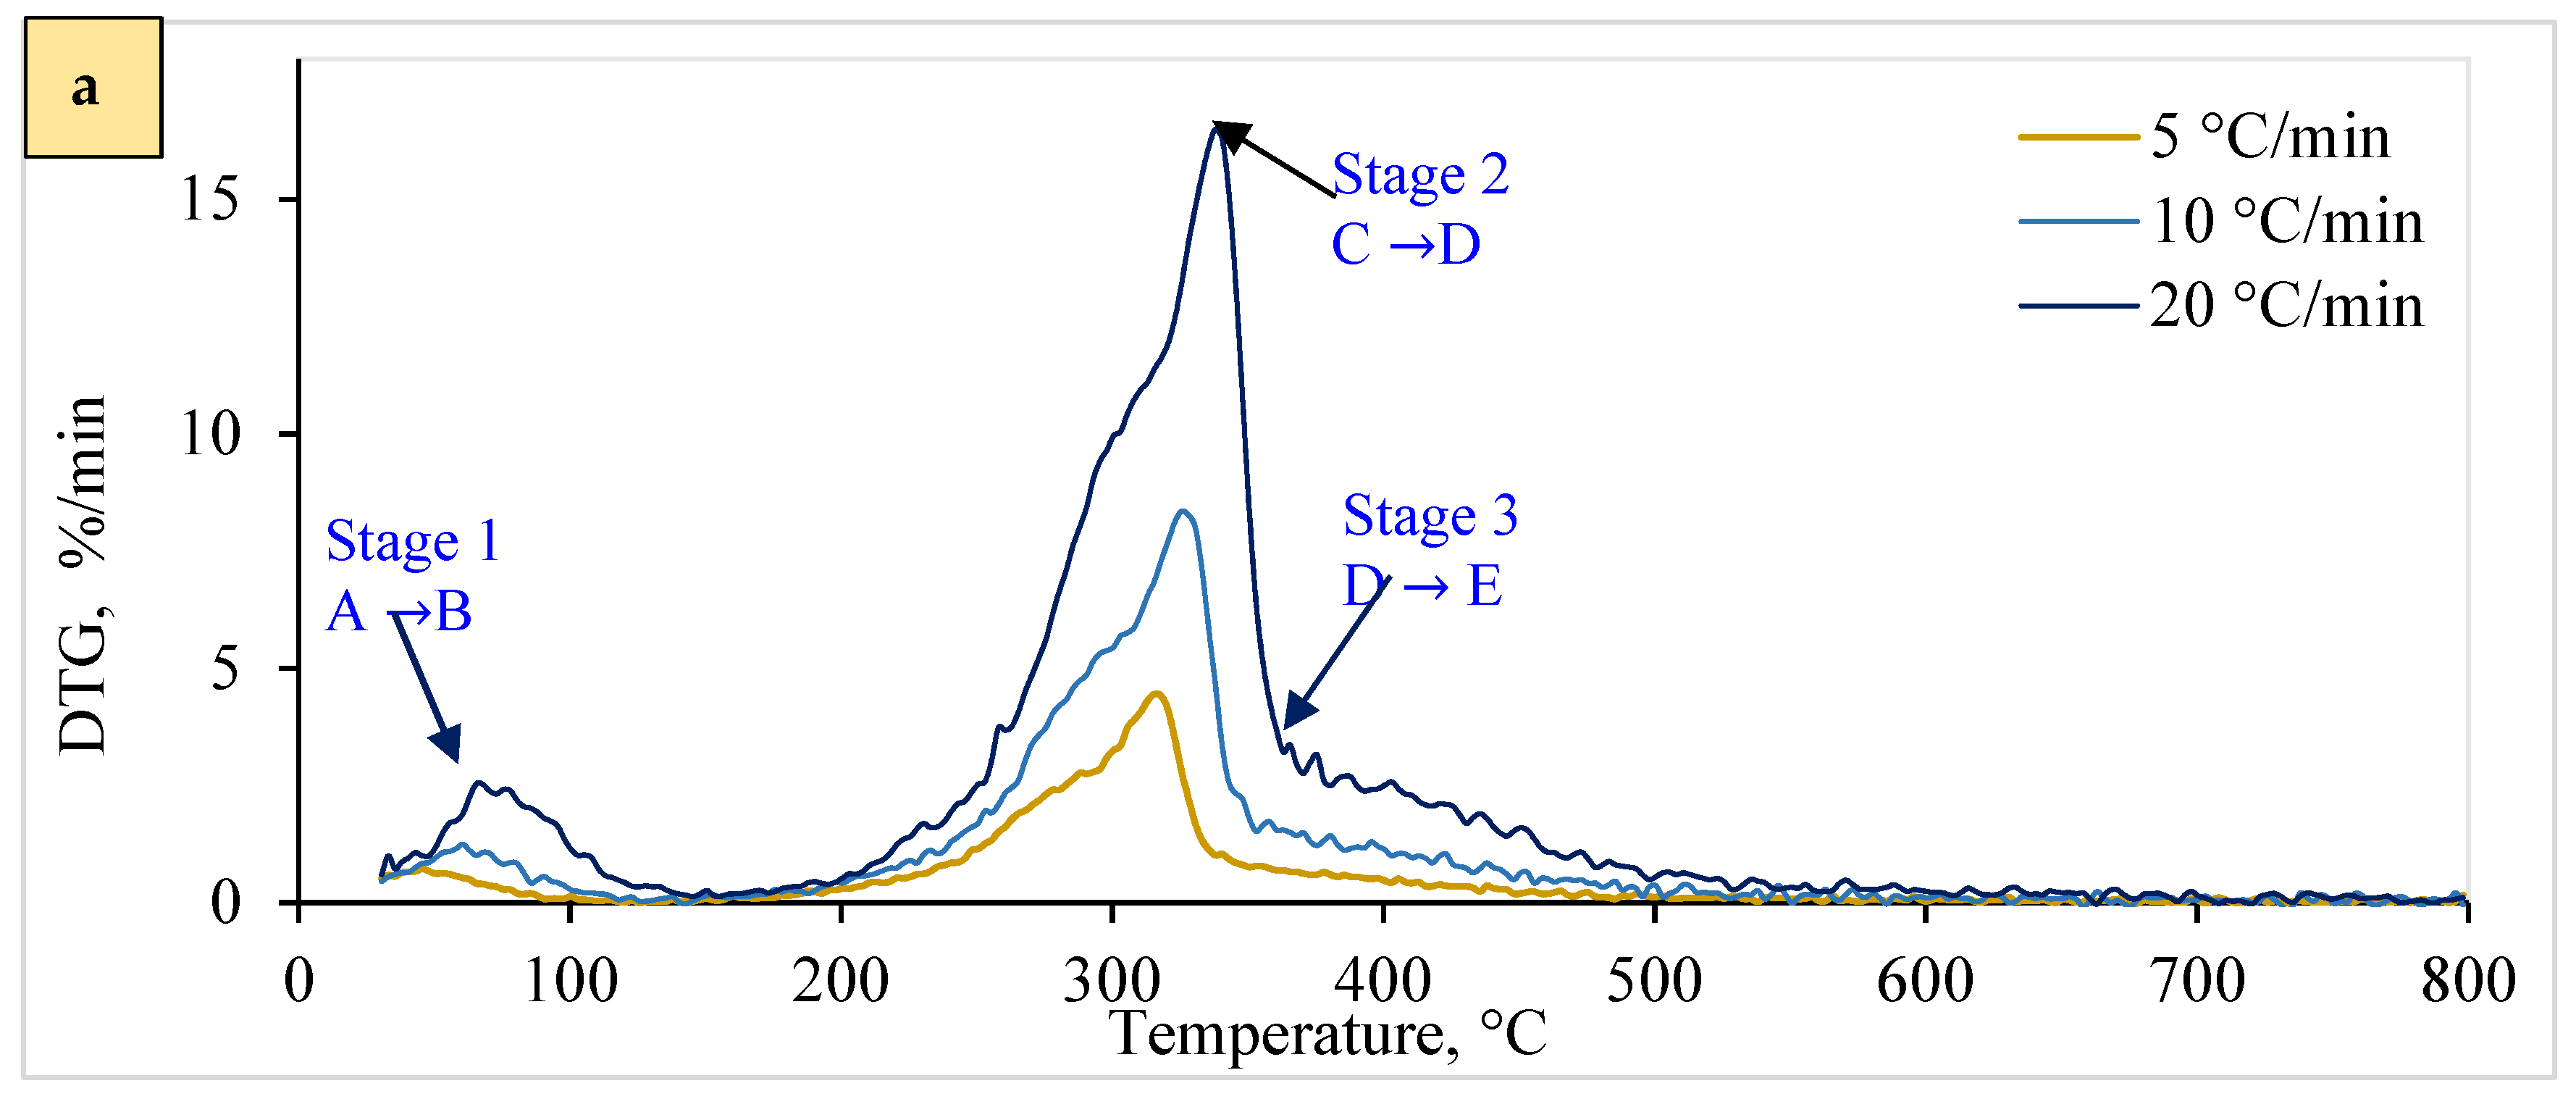
The pyrolysis process is essential for efficient pyrolysis plant design and operation. Due to its complex, multi-step reaction pathway, model-based techniques are used to investigate pyrolysis kinetics [70]. Figure 3 and Figure 4 display the thermal behavior (25 to 800 °C) relating to the pyrolytic breakdown for solid WSP (T1 and T2), which follows a multi-step reaction. Figure 4 also represents the DTG curves of various peaks, revealing the involvement of multiple stages throughout the process. These peaks are categorized as follows: A = dehydration of sample; C = decomposition of hemicellulose; and D E = decomposition of cellulose. These include dehydration and volatile release (<150 °C, peak 1), hemicellulose decomposition (at a temperature between 50 and 350 °C, represented by peak 2), and cellulose pyrolysis (occurring above <350 °C, indicated by peak 3). Furthermore, pyrolysis parameters, including the maximum rates of weight loss (DTGmax) and their corresponding maximum temperatures (Tmax), were derived from the DTG data using heating rates that vary from 5 to 20 °C/min (Figure 4).

Figure 3.
Weight loss profile under a nitrogen (N2) atmosphere: (a) T1 and (b) T2 pellet curves.


Figure 4.
Derivative thermogravimetric curve for wheat straw pellet in a nitrogen environment: (a) for T1 pellets and (b) for T2 pellets. Note: A B = dehydration of sample; C = decomposition of hemicellulose; and D E = decomposition of cellulose.
In Stage 1 (A to B), devolatilization and volatile pyrolysis reactions occurred, with slower weight loss than in the subsequent cellulose and hemicellulose stages (Figure 3). Due to material dehydration, key losses were observed from 25 °C to 150 °C. This stage, characterized by moisture removal (<100 °C) and an endothermic effect (near 70 °C), accounted for about 2%/min of the highest reaction rate according to the maximum mass loss percentage.
Stage 2 (C to D) (150–350 °C) predominantly involved cellulose and hemicellulose pyrolysis, contributing a maximum of about 16%/min of reaction rate according to the maximum mass loss percentage, which displayed significant overlapping exothermic effects (Figure 3 and Figure 4). This phase, referred to as reactive pyrolysis, involves the depolymerization and degradation of critical elements (such as hemicellulose, cellulose, and lignin) within biomass [71]. This leads to the formation of light organic molecules, condensable hydrocarbons, high tar content, and forming a slurry containing carbonaceous residues. This pyrolytic breakdown of slurry occurs between 350 and 800 °C. This subsequent or passive pyrolysis stage involves disintegrating a complicated mixture comprising lignin-tar and carbonaceous residues. Both pellets exhibited similar behavior (Figure 4a,b).
Stage 3 (D to E) involves the thermal decomposition of cellulose (Figure 4), resulting in peak 3 and numerous side peaks along with the shoulder (Figure 4a,b). The process commences after reaching 350 °C and extends to 800 °C. A char residue forms at temperatures exceeding 800 °C and is composed of fixed carbon and ash (inorganic fraction) [72]. The <350 °C range proves crucial in understanding the conversion–temperature relationship, particularly for modulating chemical species yield and composition during pyrolysis. This zone encompasses multiple stages and steps, including dehydroxylation, depolymerization, fusion, and degradation by releasing functional groups, illustrating the intricate physical and chemical interactions governing lignocellulosic biomass pyrolytic degradation [73].
The observed phenomena, influenced by pelletization, reduce mass and heat diffusion. Notably, one exception was observed: T1’s DTGmax exceeded T2’s, likely due to differing chemical composition and thermal behavior. Additionally, Figure 4a,b reveal a consistent trend: decomposition peaks shift to higher temperatures with increased heating rates across all samples. This is primarily attributed to biomass’s relatively poor thermal conductivity and shorter residence time during pyrolysis [74].
4.4. Reaction Mechanism Analysis Based on Model-Based Results
Kinetic triplets (activation energy, pre-exponential factor, and degree of conversion) were estimated using the NETZSCH Proteus 8.0 software associated with the STA 449F3 Jupiter. Following the simulation conducted with the NETZSCH Proteus 8.0 software, utilizing the test searching of various models listed by Manić, Janković [43], the final reaction mechanism for the pyrolysis process was determined.
The standard analysis methods and data visualization pathway were employed to analyze the data from thermogravimetric analysis (TGA) as data import and pre-processing, selection of a suitable reaction model, kinetic parameter estimation, and presentation of results (reaction order and mechanism). This approach allowed for delineating WSP decomposition curves into three distinct stages, as outlined in Table 4. Pellets (T1 and T2) exhibited two reactions: A B and C D E. The initial stage is denoted as , where A signifies the substance (raw sample) and B represents the product (dehydrated sample). Alternatively, the subsequent reaction stage involves the breakdown of the sample, which comprises two distinct steps: () and (). This process is mathematically represented as , where C represents the initial material, E is the ultimate product, and D denotes the intermediate product (Table 4).
Table 4.
Thermal reactions and kinetic parameters of wheat straw pellet.
4.4.1. Kinetic Reaction Pathway and Consecutive Stages
The differential equations were employed to address a sequence of multi-phase pyrolysis reactions to solve a single-phase equation. The following differential equations could solve a single-phase response to a series of subsequent multi-phase pyrolysis reactions, where the balance equation is as follows (Equation (9)):
Through the overall procedure, which is identical for all reaction models, the pyrolysis of WSP adhered to a three-step sequential reaction pathway: A → B → C → D, where A, B, C, D, and E represented different decomposition states expressed by the rate of change of a concerning time (. The following differential equations can be settled by expanding the kinetic analysis from a single-step reaction to a consecutive multi-step response (Table 5).
Table 5.
Reaction steps and consecutive reaction equations for wheat straw pellet pyrolysis.
In the provided equations (10 to 13), total conversion, α was equal to 1 (one) as α = 1 = a + b + c + d. It could be expressed as the sum of a, b, c, and d, denoted by the concentration of A, B, C, and D in the chemical kinetic model, respectively. Furthermore, the sequential pathway could be described as follows: a = (1 − α1), b = (1 − α2), and c = (1 − α3). The subscript base, cap E, end base, and sub a. 3 represented pre-exponential factors and activation energy values associated with the first, second, and third reaction sequences. Additionally, n1, n2, and n3 referred to the reaction orders of the autocatalyst’s first, second, and third reaction steps, Avrami–Erofeev nucleation exponent (Table 1). The terms α1, α2, and α3 stated the degree of conversion for the first, second, and third reaction steps, respectively.
The initial phase (A → B) involved the removal of gases from the pore gases, primarily due to the evaporation of moisture from the WSP. In the subsequent step (C → D → E), the WSP underwent vapor sorption, resulting in enhanced weight loss. This tripartite breakdown of the reaction provided a simplified framework for kinetic modeling. Specifically, A → B is given by , which represents the drying and desorption phase; C → D is given by , which signifies the devolatilization/pyrolysis phase; and D → E is given by which represents the carbonization process. This category aligns seamlessly with the findings of Manić, Janković [43], who also incorporated lignin decomposition into their study.
4.4.2. Reaction Pathway and Kinetic Triplets
Determining kinetic triplets is essential in optimizing industrial reactors and predicting reactions [75,76]. Model-based methods were employed to identify the most fitting kinetic triplets, considering the nth-order equation (f(α) =). It is worth noting that this thermal reaction process involves combining or overlapping various pathways, including phase interface reactions such as F2 and Fn [49]. Additionally, Table 3 displays the kinetic parameters (Eα and A) acquired through the ETZSCH for each reaction pathway about T1 and T2 pellets.
During the initial reaction step (A → B), the presence of moisture and volatile matters boosted the sequential reaction pathway, with Eα of 45.02 kJ/mole for T1 and 37.29 kJ/mole for T2, representing the lowest values among the various reaction pathways. This suggests that in this initial step, there is a tendency for moisture to evaporate and release some simple volatiles; after that, a small quantity transforms into tar, aligning with the principles of solid-phase pyrolysis chemistry [8]. Moreover, the pre-exponential factor (lnA) showed values of 1.2 × 10² (1/s) and 38.24 (1/s) for T1 and T2 pellets, respectively, with a corresponding reaction contribution of about 0.08 (Table 3).
Moving to the reaction step C → D, the average Eα quantities were 132.87 kJ/mole for T2 and 136.04 kJ/mole for T1 pellets. These results parallel findings by Varma, Lal [76] regarding the decomposition of wheat straw, with the mean Eα values being 163.56 kJ/mole and 155.59 kJ/mole. In addition, Zhao, Xu [77] noted that the Eα ranges from 163 to 208 kJ/mole for biomass reaction processes and depends on the sample origin, processing, and experimental conditions. Also, in this step, the reaction order was 2.76 and 2.35 for the T1 and T2 pellets, respectively (Table 3). Conversely, in reaction pathway 3 (D → E), the pre-exponential factors for T1 and T2 were 5.45 × 10¹⁴ and 2.9 × 10⁹ (1/s), respectively. These findings align with the research of Gupta, Gupta [70], who found the pre-exponential value ranging from 9.9 × 10³ to 9.95 × 10²⁰ (1/s) for TGA pyrolysis of a pistachio shell, even though they used different iso-conversational models. In the third reaction path, the Eα values are higher than other reaction steps, which might potentially lower reaction rates with cellulose and lignin-enriched biomass.
The Eα serves as a metric of reactivity, with higher values indicating lower reactivity, signifying the need for more energy to sustain the reactions [71]. All across the reaction pathways, the T2 pellets exhibited lower Eα and lnA values than the T1 pellets, while the reaction type and contribution remained relatively consistent. Typically, a lower Eα value indicates that less energy is needed to initiate the reaction, whereas a higher value implies a more gradual onset, which aligns with the findings [78]. This could be attributed to biochar in the T2 pellets, which readily ignites for a higher heating value, a phenomenon referred to as the synergistic effect. Also, the lower Eα values are likely attributed to contaminants and higher extractive substances in the WSP sample [48].
4.4.3. Reaction Pathway and Kinetic Reactions
Various empirical reaction models were applied to assess the kinetic pathways, such as Cn (autocat reaction), Dn (diffusion models), Fn (nth-order interfacial reaction-phase response), and An (Avarami–Erofeev) [52]. In this current investigation, the F2 model best described the primary pyrolysis stages (peak 1) observed in both pellets (Table 3). This model aligns with the decomposition process of lignocellulose [79], highlighting a second-order “phase interfacial reaction” in this stage. This result is consistent with the findings of Huang, Zhang [78]. Furthermore, steps 2 and 3 were characterized as phase interfacial nth-order reactions, with the corresponding differential equation representing f(α) =. For step 2, the Fn model signifies the most appropriate pyrolysis process, involving nth-order reactions and contracting cylinders, significantly reducing the growth rate due to volatile destruction and increased emissions. These findings align with the research conducted by Várhegyi, Chen [80]. Therefore, it can be concluded that several steps in the pyrolysis method arise from the breakdown of WSP components and the intricate reaction dynamics.
4.5. Dependence of Activation Energy (Eα) on the Degree of Conversion (α)
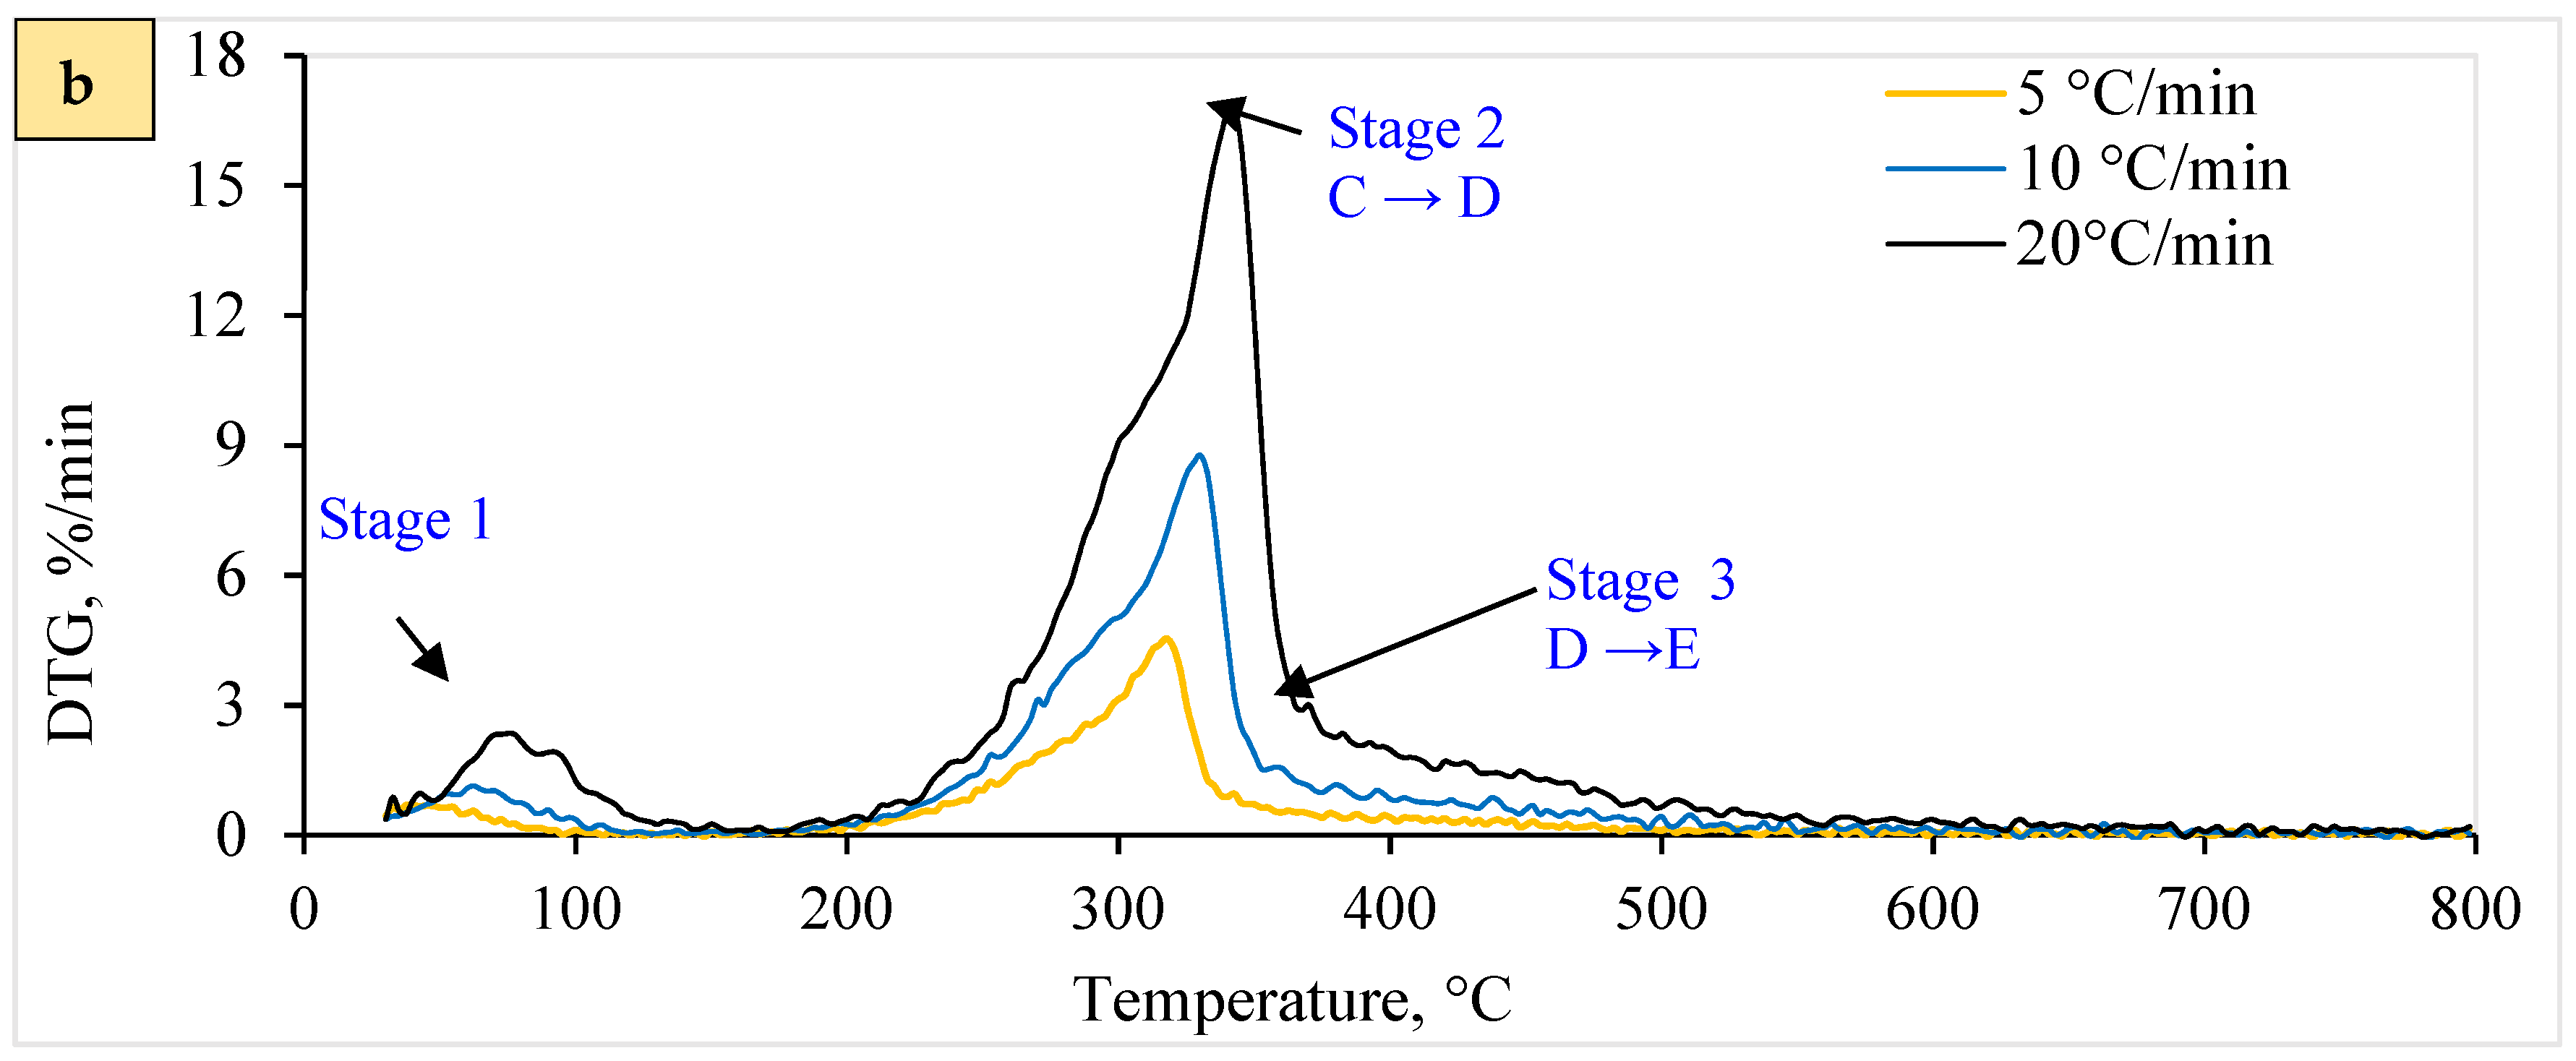
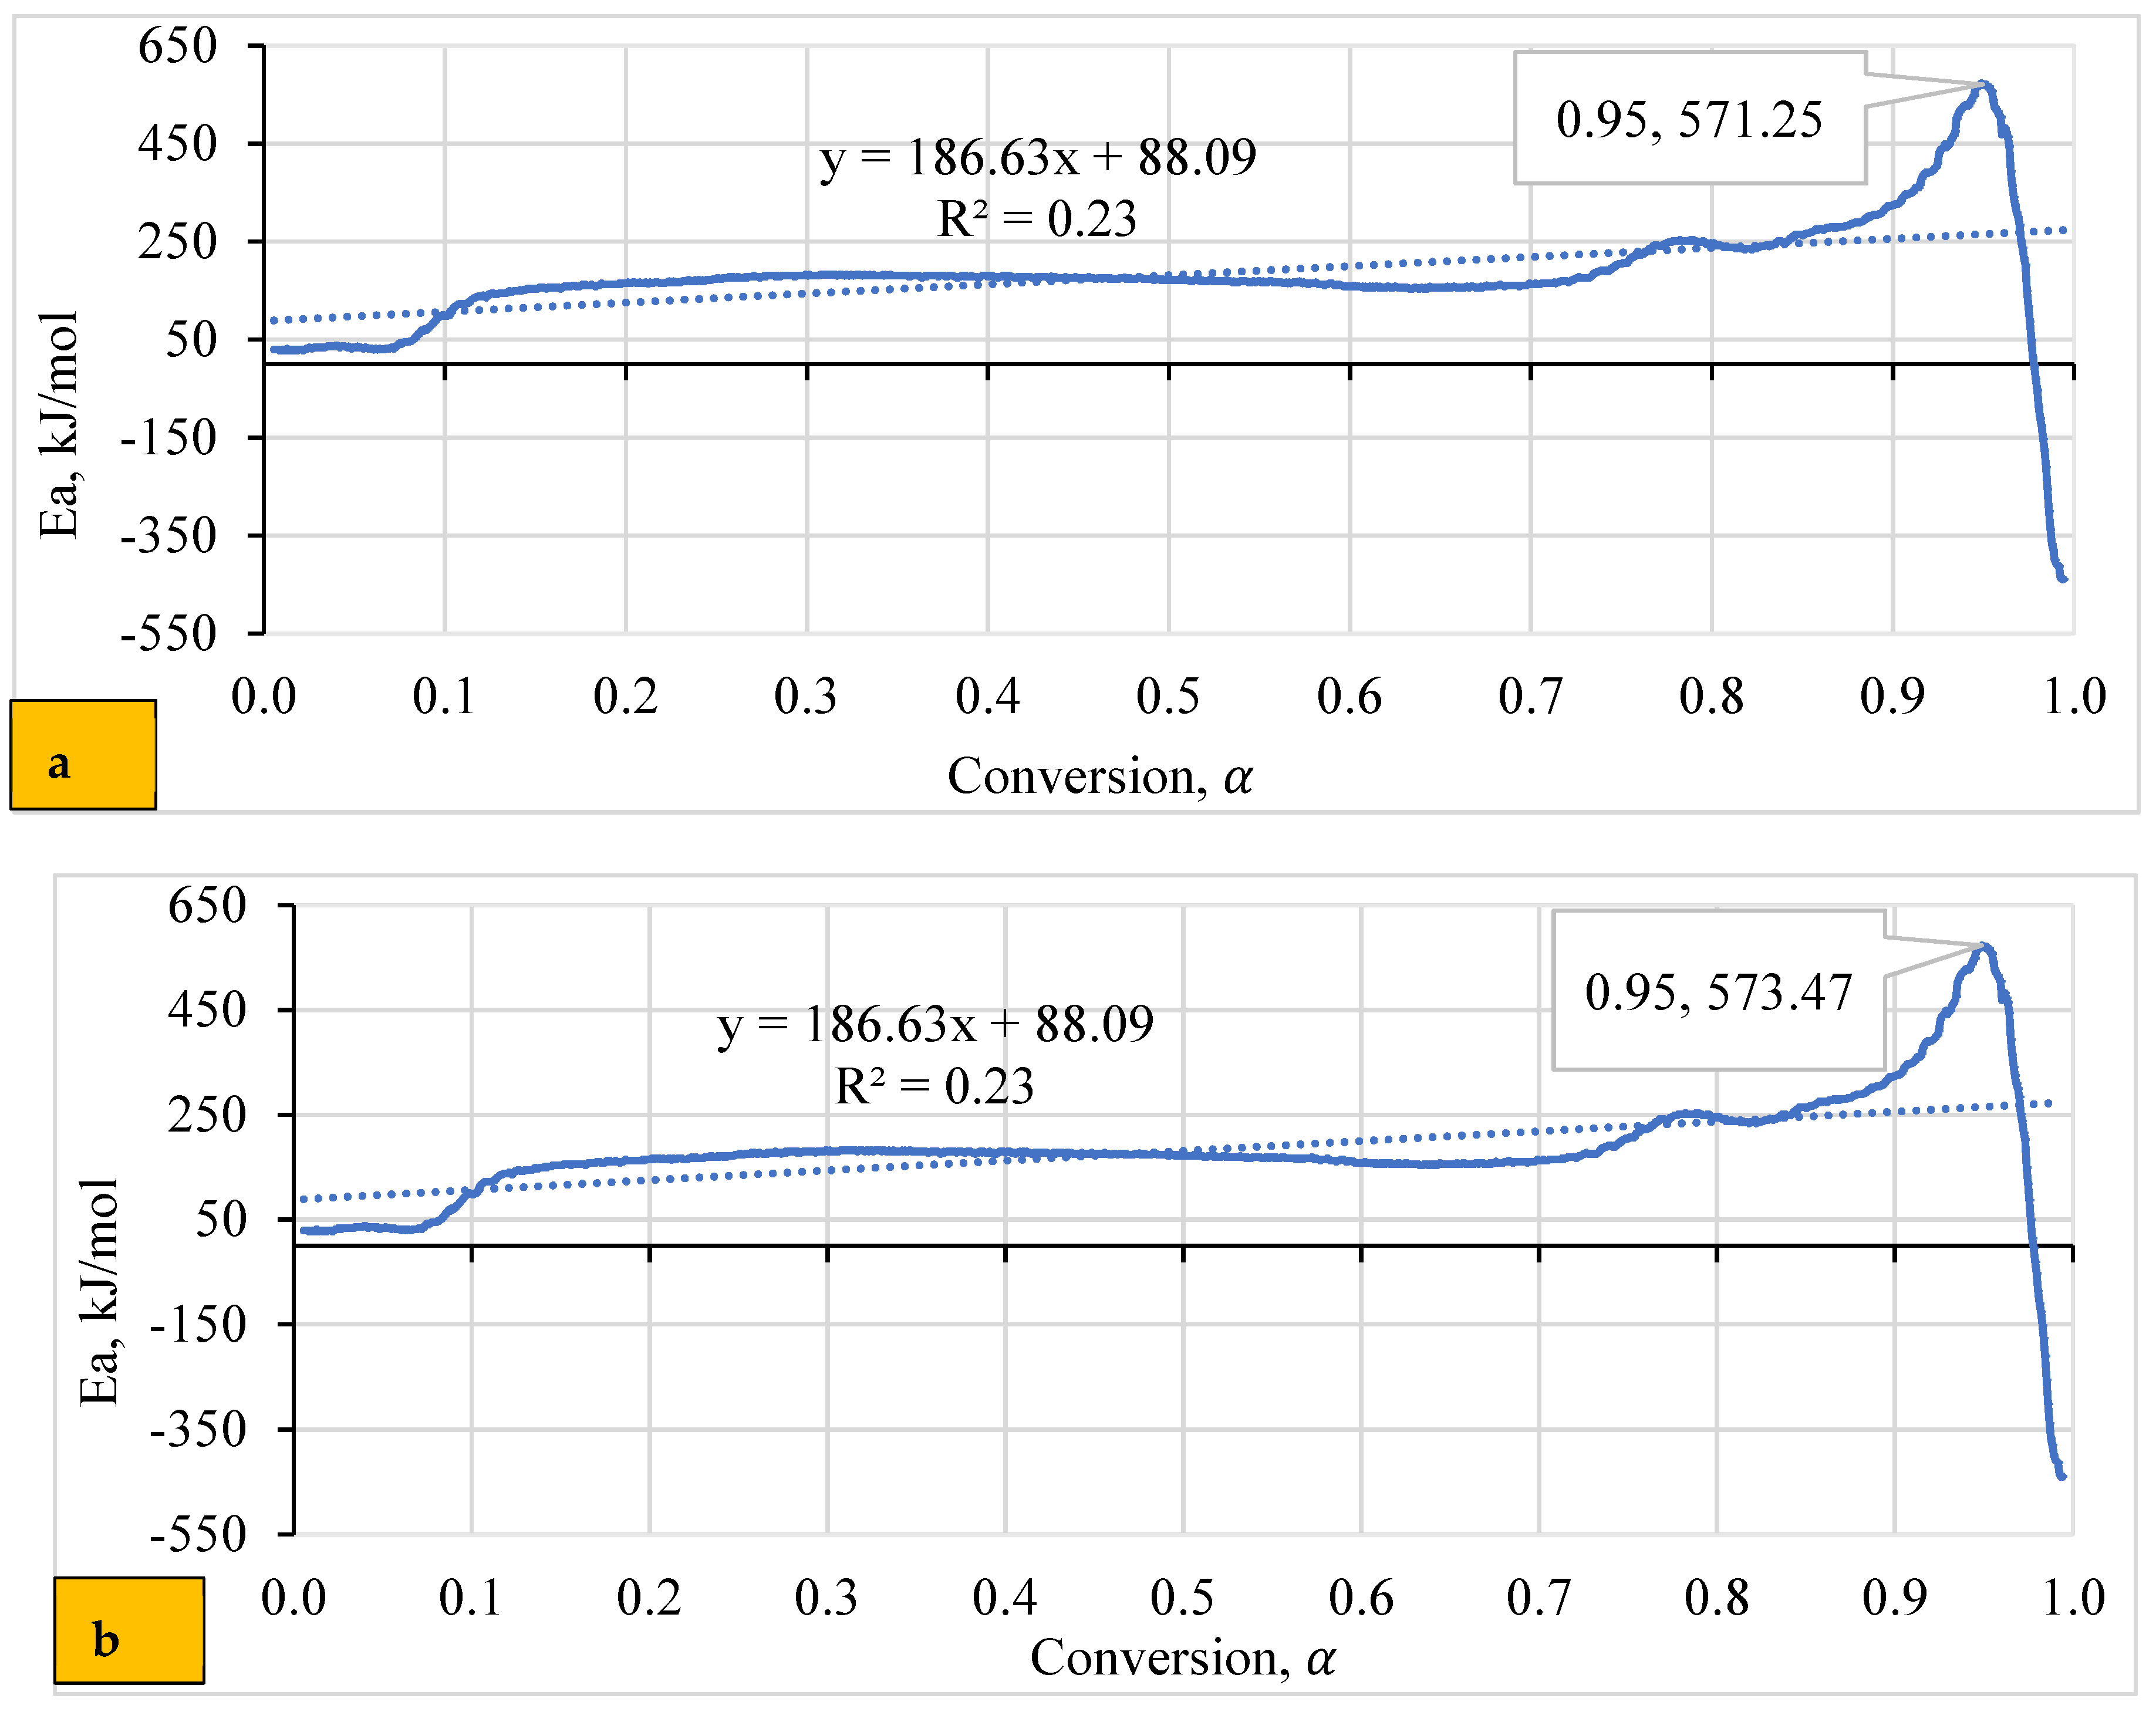
Variations in biomass composition may imply an intricate pyrolytic reaction, leading to differences in activation energy (Eα). Figure 5 reveals an exciting relationship between activation energy (Eα) and the degree of conversion (α) for both WSP (T1 and T2). The fluctuating Eα values signify a sequence of endothermic (energy absorption) and exothermic (energy release) reactions during pyrolysis, as documented by [69,81]. This aligns with the complex reaction pathway proposed by Thakur, Varma [82] for WSP pyrolysis due to its lower hemicellulose and cellulose content.

Figure 5.
Relationship between conversion degree and activation energy for (a) T2 and (b) T1 Pellets.
According to Figure 5a, the T1 pellet shows a prominent peak in Eα at a conversion of 0.9496, corresponding to a high energy demand (around 571 kJ/mole) for breaking down biomass components. Conversely, the lowest Eα value (negative 439 kJ/mole) suggests a significant energy release, likely coinciding with cellulose degradation. Figure 5b demonstrates similar trends for T2 pellets, with peak Eα values at comparable conversion degrees. Despite these fluctuations, the overall correlation coefficient (R2) suggests no statistically significant linear relationship. This contradicts the findings of Sharma [83], who observed a correlation between Eα and lnA, possibly due to differing analytical methods.
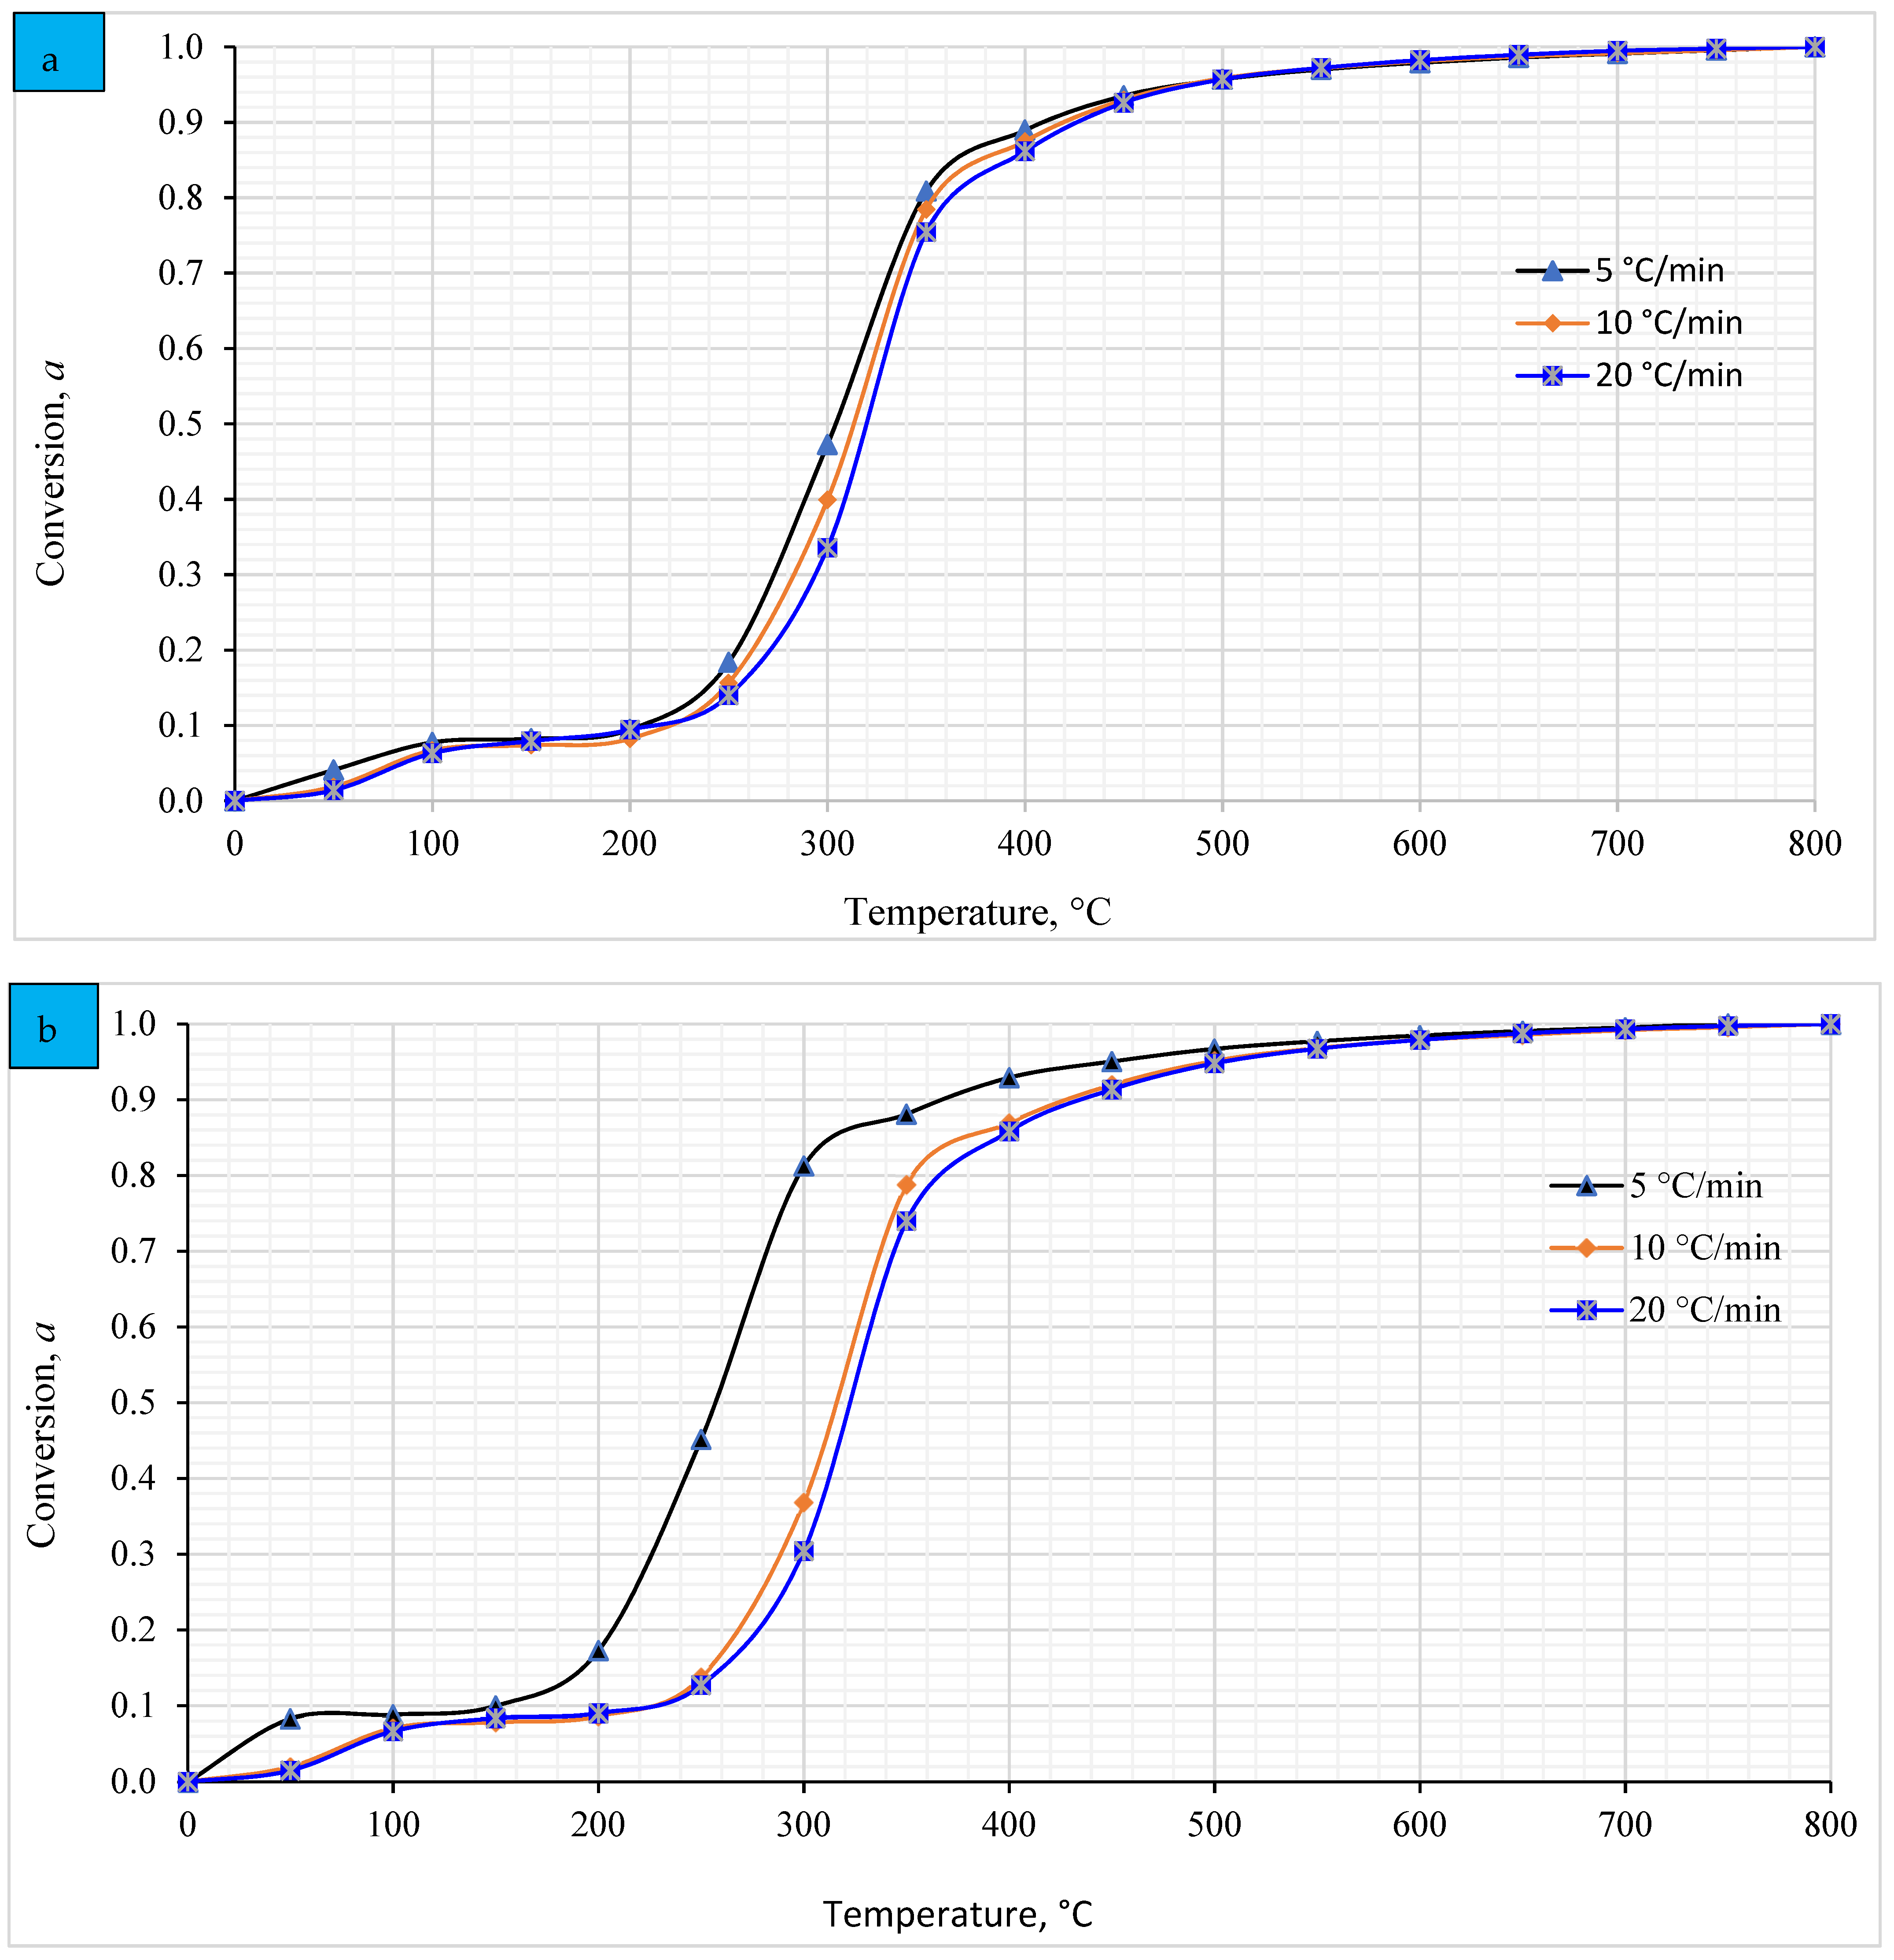
4.6. Relationship between the Temperature and the Conversion Degree (α)
Figure 6 demonstrates the relationship between the temperature and conversion degree of both pellets at different heating rates. The T1 pellet shows a consistent correlation between temperature and conversion degree across all heating rates, as supported by Banerjee, Vithusha [84], indicating an insignificant impact of heating rates on conversion. The conversion rate progresses slowly between 31 °C and 250 °C, followed by a sharp increase between 250 and 500 °C, indicating the complex nature of pyrolysis, consistent with Soria-Verdugo, Rubio-Rubio [85]. Conversely, the T2 pellet exhibits similar trends at 10 and 20 °C/min heating rates, with higher temperatures (Figure 6b). However, at 5 °C/min, T1 pellet demonstrates higher conversion rate sensitivity than T2, likely due to compositional differences. Overall, conversion degree shows a consistent association with rising temperature, regardless of heating rate, aligning with observations by [86].

Figure 6.
Correlation between conversion degree and temperatures of (a) T1 and (b) T2 pellets at various heating rates.
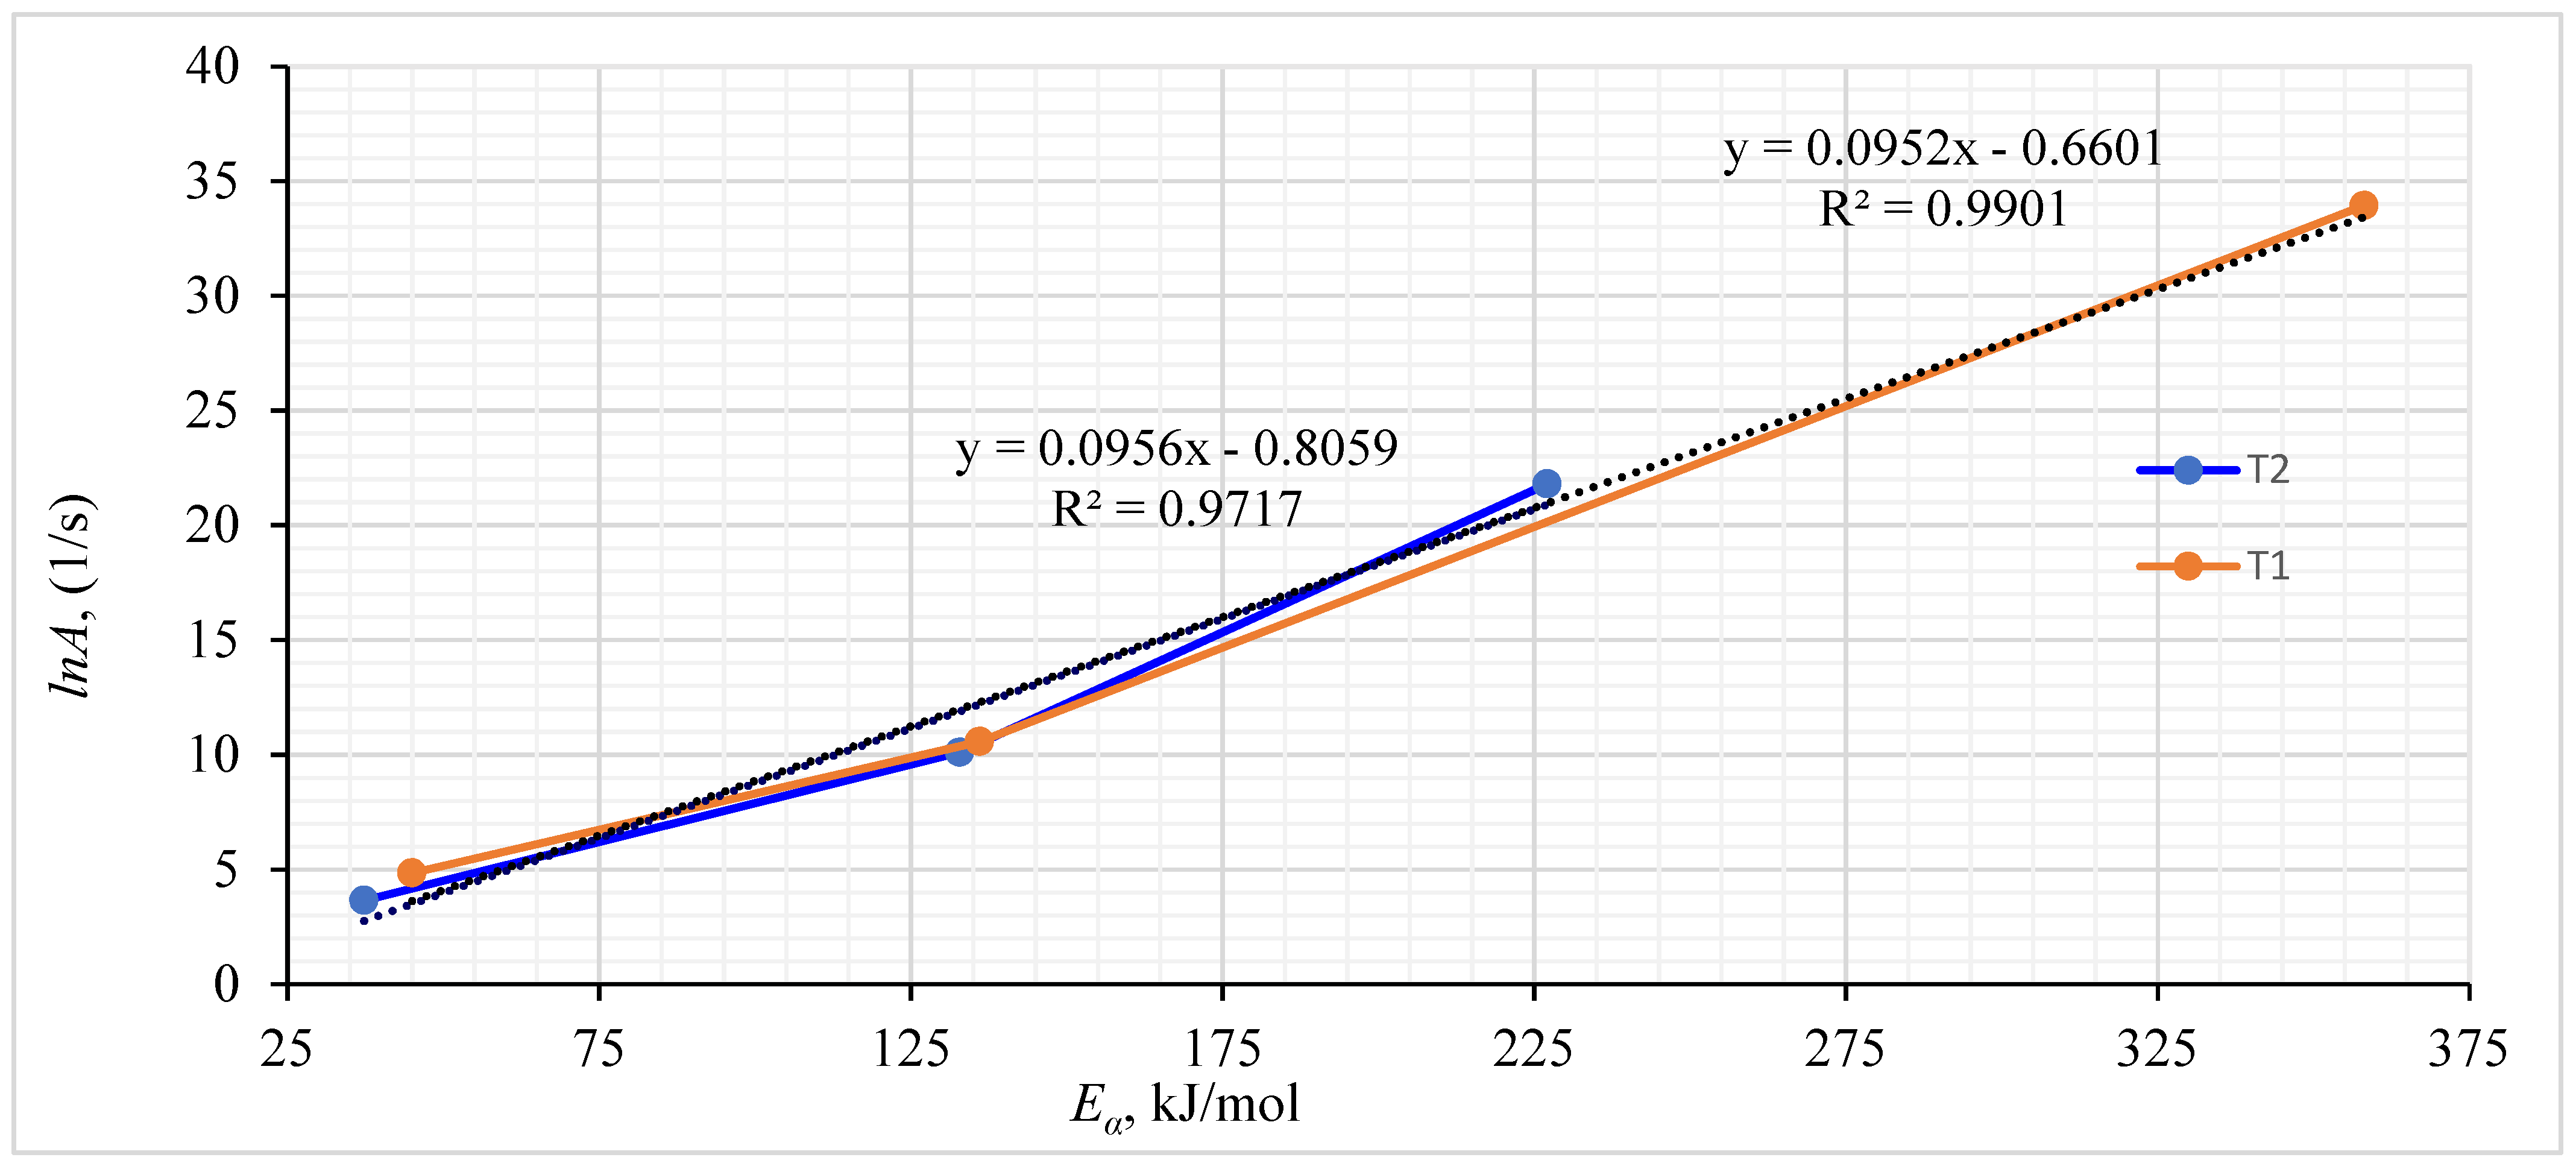
4.7. Compensation Effect
Using a model-based technique, various conversion levels for WSP were determined, and the interplay between Eα and lnA is visualized in Figure 7. Across the complete range of α values, there is an evident compensatory effect with perfect fit [70]. Typically, as the temperature rises, there is an increase in particle vibration at the molecular level, leading to the degradation and debonding of the molecules. Furthermore, the dominance of biomass porosity and “phase interfacial reaction” becomes more pronounced at higher temperatures. Following the Arrhenius-type law, the plot demonstrates a clear correlation between lnA and Eα [87]. Moreover, the linear trend with high precision in fitting (R2 ) implies the robustness of the calculated kinetic factors [88]. The result aligns with previous research conducted by Tarchoun, Trache [89].

Figure 7.
Correlation between wheat straw pellets’ pre-exponential factor and activation energy.
5. Limitations of the Study
The research aimed to explore the thermokinetics of pyrolysis in wheat straw pellets using TGA. Formulating a mathematical model is recommended to improve precision and achieve more accurate findings. Additionally, employing simulation techniques aids in optimizing the influential parameters of pyrolysis, an aspect not addressed in this research and for forthcoming study endeavors, integrating machine learning-based model development and incorporating a hybrid intelligence program for validation and sensitivity analysis.
The decomposition of WSP demonstrated the most accurate representation with a model-based approach employing a multi-point reaction analysis. Nevertheless, it is essential to note that researchers commonly utilize both model-free and model-based methods. Additionally, numerous studies have primarily focused on single-stage reactions. Consequently, it is necessary to undertake a more comprehensive and intricate investigation of the outcomes obtained in this study. Furthermore, it is recommended that the research be extended and the results be validated with other types of lignocellulosic biomass.
6. Conclusions
This study highlights the importance of understanding biomass decomposition kinetics for optimizing pyrolysis processes. By examining two types of wheat straw pellets (WSP), T1 (pure), and T2 (with additives), using simultaneous thermal analyzer STA 449F3 Jupiter along with NETZSCH Proteus 8.0 software, the research provides valuable insights. It was determined that model-based approaches are suitable for analyzing the kinetic properties of WSP, whereas model-free approaches proved inapplicable. The pyrolysis process of WSP was identified to follow a three-phase consecutive reaction sequence (A→B, C→D, and D→E). The model-based reactions, specifically the nth-order phase interfacial reaction (Fn) and the second-order chemical reaction (F2), were effective for studying the thermal degradation pathway.
Interestingly, the activation energy (Eα) of the additive-blend wheat straw pellets (T2) was found to be lower than that of the pure wheat straw pellets (T1), likely due to the synergistic effect of the additives, though the precise mechanism behind this remains unknown and is under further investigation. This study’s estimated activation energies and pre-exponential factors provide critical data for process modeling and optimization. The findings highlight the promising potential of wheat straw pellet biomass as a bioenergy feedstock. Additionally, to design an efficient pyrolysis reaction, wheat straw pellets’ activation energy and pre-exponential factors necessitate validation through computational fluid dynamics (CFD) modeling. This research thus contributes significantly to developing efficient and optimized pyrolysis processes for converting wheat straw into valuable bioenergy products.
Author Contributions
B.N.—conceptualization, methodology, investigation, and writing—original draft. G.C.—supervision, conceptualization, and writing—review and editing. L.B.—writing—review and editing. E.G.—data visualization, analysis, and software. T.N.-H.—advising, reviewing, and editing. All authors have read and agreed to the published version of the manuscript.
Funding
This research received no external funding.
Data Availability Statement
Data will be made available on request.
Acknowledgments
The authors thank the University of Southern Queensland, Australia, for its research facility. Many thanks to the Institute for Future Environments, Central Analytical Research Facility, Queensland University of Technology, Brisbane, QLD, Australia 4000, for carrying out the wheat straw pellet sample TGA test (combustion and pyrolysis) work. The National Agricultural Technology Program Phase-II, Project Implementation Unit (PIU), Bangladesh Agricultural Research Council (BARC), Farmgate, Dhaka 1215, Bangladesh, financially supported this work.
Conflicts of Interest
The authors declare no conflicts of interest.
References
- Mamun, A.; Glauber, J.W.; Laborde Debucquet, D. How the War in Ukraine Threatens Bangladesh’s Food Security; CGIAR: Montpellier, France, 2023. [Google Scholar]
- Erenstein, O.; Jaleta, M.; Mottaleb, K.A.; Sonder, K.; Donovan, J.; Braun, H.-J. Global trends in wheat production, consumption and trade. In Wheat Improvement: Food Security in a Changing Climate; Springer International Publishing: Cham, Switzerland, 2022; pp. 47–66. [Google Scholar]
- Perkins, G.; Bhaskar, T.; Konarova, M. Process development status of fast pyrolysis technologies for the manufacture of renewable transport fuels from biomass. Renew. Sustain. Energy Rev. 2018, 90, 292–315. [Google Scholar] [CrossRef]
- Nisar, J.; Ali, F.; Malana, M.A.; Ali, G.; Iqbal, M.; Shah, A.; Bhatti, I.A.; Khan, T.A.; Rashid, U. Kinetics of the pyrolysis of cobalt-impregnated sesame stalk biomass. Biomass Convers. Bior. 2020, 10, 1179–1187. [Google Scholar] [CrossRef]
- Czajczyńska, D.; Anguilano, L.; Ghazal, H.; Krzyżyńska, R.; Reynolds, A.; Spencer, N.; Jouhara, H. Potential of pyrolysis processes in the waste management sector. Therm. Sci. Eng. Prog. 2017, 3, 171–197. [Google Scholar] [CrossRef]
- Wuzella, G.; Kandelbauer, A.; Mahendran, A.R.; Müller, U.; Teischinger, A. Influence of thermo-analytical and rheological properties of an epoxy powder coating resin on the quality of coatings on medium density fibreboards (MDF) using in-mould technology. Prog. Org. Coat. 2014, 77, 1539–1546. [Google Scholar] [CrossRef]
- Vyazovkin, S. Isoconversional Kinetics of Thermally Stimulated Processes; Springer: Berlin/Heidelberg, Germany, 2015. [Google Scholar]
- Kan, T.; Strezov, V.; Evans, T.J. Lignocellulosic biomass pyrolysis: A review of product properties and effects of pyrolysis parameters. Renew. Sustain. Energy Rev. 2016, 57, 1126–1140. [Google Scholar] [CrossRef]
- Jelić, D.; Papović, S.; Vraneš, M.; Gadžurić, S.; Berto, S.; Alladio, E.; Gajić, D.; Janković, B. Thermo-analytical and compatibility study with mechanistic explanation of degradation kinetics of ambroxol hydrochloride tablets under non-isothermal conditions. Pharmaceutics 2021, 13, 1910. [Google Scholar] [CrossRef]
- Lateef, H.U.; Kazmi, M.; Tabish, A.N.; Cheema, I.I.; Rashid, M.I. Effect of demineralization on physiochemical and thermal characteristics of wheat straw. Energy Sources Part A Recovery Util. Environ. Eff. 2020, 1–10. [Google Scholar] [CrossRef]
- Radhaboy, G.; Pugazhvadivu, M.; Ganeshan, P.; Raja, K. Influence of kinetic parameters on Calotropis procera by TGA under pyrolytic conditions. Energy Sources Part A-Recovery Util. Environ. Eff. 2019, 45, 8257–8270. [Google Scholar]
- Nath, B.; Chen, G.; Bowtell, L.; Graham, E. Kinetic mechanism of wheat straw pellets combustion process with a thermogravimetric analyser. Heliyon 2023, 9, e20602. [Google Scholar] [CrossRef]
- Zanutto, C.P.; Paladino, E.E.; Evrard, F.; van Wachem, B.; Denner, F. Modeling of interfacial mass transfer based on a single-field formulation and an algebraic VOF method considering non-isothermal systems and large volume changes. Chem. Eng. Sci. 2022, 247, 116855. [Google Scholar] [CrossRef]
- Mureddu, M.; Dessì, F.; Orsini, A.; Ferrara, F.; Pettinau, A. Air-and oxygen-blown characterization of coal and biomass by thermogravimetric analysis. Fuel 2018, 212, 626–637. [Google Scholar] [CrossRef]
- Fonseca, F.G.; Anca-Couce, A.; Funke, A.; Dahmen, N. Challenges in Kinetic Parameter Determination for Wheat Straw Pyrolysis. Energies 2022, 15, 7240. [Google Scholar] [CrossRef]
- Paul, A.S.; Panwar, N.L.; Salvi, B.L.; Jain, S.; Sharma, D. Experimental investigation on the production of bio-oil from wheat straw. Energy Sources Part A Recovery Util. Environ. Eff. 2020, 1–16. [Google Scholar] [CrossRef]
- Naqvi, S.R.; Ali, I.; Nasir, S.; Ali Ammar Taqvi, S.; Atabani, A.E.; Chen, W.-H. Assessment of agro-industrial residues for bioenergy potential by investigating thermo-kinetic behavior in a slow pyrolysis process. Fuel 2020, 278, 118259. [Google Scholar] [CrossRef]
- Luo, L.; Guo, X.; Zhang, Z.; Chai, M.; Rahman, M.M.; Zhang, X.; Cai, J. Insight into pyrolysis kinetics of lignocellulosic biomass: Isoconversional kinetic analysis by the modified friedman method. Energy Fuels 2020, 34, 4874–4881. [Google Scholar] [CrossRef]
- Peng, Y.; Wu, S. The structural and thermal characteristics of wheat straw hemicellulose. J. Anal. Appl. Pyrolysis 2010, 88, 134–139. [Google Scholar] [CrossRef]
- Singh, S.; Tagade, A.; Verma, A.; Sharma, A.; Tekade, S.P.; Sawarkar, A.N. Insights into kinetic and thermodynamic analyses of co-pyrolysis of wheat straw and plastic waste via thermogravimetric analysis. Bioresour. Technol. 2022, 356, 127332. [Google Scholar] [CrossRef]
- Sher, F.; Iqbal, S.Z.; Liu, H.; Imran, M.; Snape, C.E. Thermal and kinetic analysis of diverse biomass fuels under different reaction environment: A way forward to renewable energy sources. Energy Convers. Manag. 2020, 203, 112266. [Google Scholar] [CrossRef]
- Anca-Couce, A.; Tsekos, C.; Retschitzegger, S.; Zimbardi, F.; Funke, A.; Banks, S.; Kraia, T.; Marques, P.; Scharler, R.; de Jong, W.; et al. Biomass pyrolysis TGA assessment with an international round robin. Fuel 2020, 276, 118002. [Google Scholar] [CrossRef]
- Gaitán-Álvarez, J.; Moya, R.; Puente-Urbina, A.; Rodriguez-Zúñiga, A. Thermogravimetric, devolatilization rate, and differential scanning calorimetry analyses of biomass of tropical plantation species of Costa Rica torrefied at different temperatures and times. Energies 2018, 11, 696. [Google Scholar] [CrossRef]
- López Ordovás, J. Construction of a Model for the Design of a Rotary Kiln for Slow Pyrolysis of Biomass–GreenCarbon Project. Ph.D. Thesis, Aston University, Birmingham, UK, 2020. [Google Scholar]
- Khankari, G.; Rajan, D. Utilization of mill rejects with biomass pellets in the existing coal power plants-a novel approach towards sustainability & fuel security. Energy Sources Part A Recovery Util. Environ. Eff. 2023, 45, 12633–12650. [Google Scholar]
- Nath, B.; Chen, G.; Bowtell, L.; Mahmood, R.A. CFDs Modeling and Simulation of Wheat Straw Pellet Combustion in a 10 kW Fixed-Bed Downdraft Reactor. Processes 2024, 12, 863. [Google Scholar] [CrossRef]
- Janković, B. Devolatilization kinetics of swine manure solid pyrolysis using deconvolution procedure. Determination of the bio-oil/liquid yields and char gasification. Fuel Process. Technol. 2015, 138, 1–13. [Google Scholar] [CrossRef]
- Sobek, S.; Werle, S. Isoconversional determination of the apparent reaction models governing pyrolysis of wood, straw and sewage sludge, with an approach to rate modelling. Renew. Energy 2020, 161, 972–987. [Google Scholar] [CrossRef]
- Singh, R.K.; Patil, T.; Sawarkar, A.N. Pyrolysis of garlic husk biomass: Physico-chemical characterization, thermodynamic and kinetic analyses. Bioresour. Technol. Rep. 2020, 12, 100558. [Google Scholar] [CrossRef]
- Huang, J.; Liu, J.; Chen, J.; Xie, W.; Kuo, J.; Lu, X.; Chang, K.; Wen, S.; Sun, G.; Cai, H.; et al. Combustion behaviors of spent mushroom substrate using TG-MS and TG-FTIR: Thermal conversion, kinetic, thermodynamic and emission analyses. Bioresour. Technol. 2018, 266, 389–397. [Google Scholar] [CrossRef]
- Chong, C.T.; Mong, G.R.; Ng, J.-H.; Chong, W.W.F.; Ani, F.N.; Lam, S.S.; Ong, H.C. Pyrolysis characteristics and kinetic studies of horse manure using thermogravimetric analysis. Energy Convers. Manag. 2019, 180, 1260–1267. [Google Scholar] [CrossRef]
- Kartal, F.; Özveren, U. Prediction of activation energy for combustion and pyrolysis by means of machine learning. Therm. Sci. Eng. Prog. 2022, 33, 101346. [Google Scholar] [CrossRef]
- Nath, B.; Chen, G.; Bowtell, L.; Graham, E. An investigation of thermal decomposition behavior and combustion parameter of pellets from wheat straw and additive blends by thermogravimetric analysis. Int. J. Thermofluids 2024, 22, 100660. [Google Scholar] [CrossRef]
- Laidler, K.J. The development of the Arrhenius equation. J. Chem. Educ. 1984, 61, 494. [Google Scholar] [CrossRef]
- Urbanovici, E.; Popescu, C.; Segal, E. Improved iterative version of the Coats-Redfern method to evaluate non-isothermal kinetic parameters. J. Therm. Anal. Calorim. 1999, 58, 683–700. [Google Scholar] [CrossRef]
- Shagali, A.A.; Hu, S.; Li, H.; Chi, H.; Qing, H.; Xu, J.; Jiang, L.; Wang, Y.; Su, S.; Xiang, J. Thermal behavior, synergistic effect and thermodynamic parameter evaluations of biomass/plastics co–pyrolysis in a concentrating photothermal TGA. Fuel 2023, 331, 125724. [Google Scholar] [CrossRef]
- Mandal, S.; Mohalik, N.K.; Ray, S.K.; Khan, A.M.; Mishra, D.; Pandey, J.K. A comparative kinetic study between TGA & DSC techniques using model-free and model-based analyses to assess spontaneous combustion propensity of Indian coals. Process Saf. Environ. Prot. 2022, 159, 1113–1126. [Google Scholar]
- Hu, J.; Yan, Y.; Evrendilek, F.; Buyukada, M.; Liu, J. Combustion behaviors of three bamboo residues: Gas emission, kinetic, reaction mechanism and optimization patterns. J. Clean. Prod. 2019, 235, 549–561. [Google Scholar] [CrossRef]
- Liu, Y.; Li, X.; Zhang, W.; Ma, F.; Zhang, Q.; Gu, Q. Pyrolysis of heavy hydrocarbons in weathered petroleum-contaminated soil enhanced with inexpensive additives at low temperatures. J. Clean. Prod. 2021, 302, 127017. [Google Scholar] [CrossRef]
- Wang, S.; Dai, G.; Yang, H.; Luo, Z. Lignocellulosic biomass pyrolysis mechanism: A state-of-the-art review. Prog. Energy Combust. Sci. 2017, 62, 33–86. [Google Scholar] [CrossRef]
- Martín-Lara, M.; Ronda, A.; Blázquez, G.; Pérez, A.; Calero, M. Pyrolysis kinetics of the lead-impregnated olive stone by non-isothermal thermogravimetry. Process Saf. Environ. Prot. 2018, 113, 448–458. [Google Scholar] [CrossRef]
- Vyazovkin, S.; Burnham, A.K.; Criado, J.M.; Pérez-Maqueda, L.A.; Popescu, C.; Sbirrazzuoli, N. ICTAC Kinetics Committee recommendations for performing kinetic computations on thermal analysis data. Thermochim. Acta 2011, 520, 1–19. [Google Scholar] [CrossRef]
- Manić, N.; Janković, B.; Dodevski, V. Model-free and model-based kinetic analysis of Poplar fluff (Populus alba) pyrolysis process under dynamic conditions. J. Therm. Anal. Calorim. 2021, 143, 3419–3438. [Google Scholar] [CrossRef]
- Liu, H.; Xu, G.; Li, G. Pyrolysis characteristic and kinetic analysis of sewage sludge using model-free and master plots methods. Process Saf. Environ. Prot. 2021, 149, 48–55. [Google Scholar] [CrossRef]
- Nebojša, P.; Marija, I.; Kristina, Č. Organizational Culture and Job Satisfaction among University Professors in the Selected Central and Eastern European Countries. Stud. Bus. Econ. 2020, 15, 168–184. [Google Scholar] [CrossRef]
- Karaeva, J.V.; Timofeeva, S.S.; Islamova, S.I.; Gerasimov, A.V. Pyrolysis kinetics of new bioenergy feedstock from anaerobic digestate of agro-waste by thermogravimetric analysis. J. Environ. Chem. Eng. 2022, 10, 107850. [Google Scholar] [CrossRef]
- Vargeese, A.A. A kinetic investigation on the mechanism and activity of copper oxide nanorods on the thermal decomposition of propellants. Combust. Flame 2016, 165, 354–360. [Google Scholar] [CrossRef]
- Janković, B.; Manić, N.; Radović, I.; Janković, M.; Rajačić, M. Model-free and model-based kinetics of the combustion process of low rank coals with high ash contents using TGA-DTG-DTA-MS and FTIR techniques. Thermochim. Acta 2019, 679, 178337. [Google Scholar] [CrossRef]
- Vyazovkin, S.; Burnham, A.K.; Favergeon, L.; Koga, N.; Moukhina, E.; Pérez-Maqueda, L.A.; Sbirrazzuoli, N. ICTAC Kinetics Committee recommendations for analysis of multi-step kinetics. Thermochim. Acta 2020, 689, 178597. [Google Scholar] [CrossRef]
- Safiullina, A.S.; Buzyurov, A.V.; Ziganshina, S.A.; Gerasimov, A.V.; Schick, C.; Gorbatchuk, V.V.; Ziganshin, M.A. Using fast scanning calorimetry to study solid-state cyclization of dipeptide L-leucyl-L-leucine. Thermochim. Acta 2020, 692, 178748. [Google Scholar] [CrossRef]
- Khawam, A.; Flanagan, D.R. Solid-state kinetic models: Basics and mathematical fundamentals. J. Phys. Chem. B 2006, 110, 17315–17328. [Google Scholar] [CrossRef] [PubMed]
- Dhyani, V.; Kumar, J.; Bhaskar, T. Thermal decomposition kinetics of sorghum straw via thermogravimetric analysis. Bioresour. Technol. 2017, 245, 1122–1129. [Google Scholar] [CrossRef] [PubMed]
- Nath, B.; Chen, G.; Bowtell, L.; Mahmood, R.A. Assessment of densified fuel quality parameters: A case study for wheat straw pellet. J. Bioresour. Bioprod. 2023, 8, 45–58. [Google Scholar] [CrossRef]
- Qi, K.; Liu, S.-y.; Chen, Y.; Xia, B.; Li, G.-D. A simple post-treatment with urea solution to enhance the photoelectric conversion efficiency for TiO2 dye-sensitized solar cells. Sol. Energy Mater. Sol. Cells 2018, 183, 193–199. [Google Scholar] [CrossRef]
- Ahmad, A.; Yadav, A.K.; Singh, A.; Singh, D.K. A comprehensive machine learning-coupled response surface methodology approach for predictive modeling and optimization of biogas potential in anaerobic Co-digestion of organic waste. Biomass Bioenergy 2024, 180, 106995. [Google Scholar] [CrossRef]
- Vhathvarothai, N.; Ness, J.; Yu, Q.J. An investigation of thermal behaviour of biomass and coal during copyrolysis using thermogravimetric analysis. Int. J. Energy Res. 2014, 38, 1145–1154. [Google Scholar] [CrossRef]
- Rex, P.; Miranda, L.R. Catalytic activity of acid-treated biomass for the degradation of expanded polystyrene waste. Environ. Sci. Pollut. Res. 2020, 27, 438–455. [Google Scholar] [CrossRef] [PubMed]
- Kaur, R.; Gera, P.; Jha, M.K.; Bhaskar, T. Pyrolysis kinetics and thermodynamic parameters of castor (Ricinus communis) residue using thermogravimetric analysis. Bioresour. Technol. 2018, 250, 422–428. [Google Scholar] [CrossRef] [PubMed]
- Torres, C.; Urvina, L.; de Lasa, H. A chemical equilibrium model for biomass gasification. Application to Costa Rican coffee pulp transformation unit. Biomass Bioenergy 2019, 123, 89–103. [Google Scholar] [CrossRef]
- Nath, B.; Chen, G.; Bowtell, L.; Nguyen-Huy, T. Pyrolysis of wheat straw pellets in a pilot-scale reactor: Effect of temperature and residence time. Energy Sci. Eng. 2024. [Google Scholar] [CrossRef]
- Lu, D.; Tabil, L.G.; Wang, D.; Wang, G.; Emami, S. Experimental trials to make wheat straw pellets with wood residue and binders. Biomass Bioenergy 2014, 69, 287–296. [Google Scholar] [CrossRef]
- Nanou, P.; Huijgen, W.; Carbo, M.; Kiel, J. The role of lignin in the densification of torrefied wood in relation to the final product properties. Biomass Bioenergy 2018, 111, 248–262. [Google Scholar] [CrossRef]
- Moukhina, E. Determination of kinetic mechanisms for reactions measured with thermoanalytical instruments. J. Therm. Anal. Calorim. 2012, 109, 1203–1214. [Google Scholar] [CrossRef]
- Soh, M.; Chew, J.J.; Liu, S.; Sunarso, J. Comprehensive kinetic study on the pyrolysis and combustion behaviours of five oil palm biomass by thermogravimetric-mass spectrometry (TG-MS) analyses. BioEnergy Res. 2019, 12, 370–387. [Google Scholar] [CrossRef]
- Anca-Couce, A. Reaction mechanisms and multi-scale modelling of lignocellulosic biomass pyrolysis. Prog. Energy Combust. Sci. 2016, 53, 41–79. [Google Scholar] [CrossRef]
- El-Sayed, S.A.; Mostafa, M.E. Thermal pyrolysis and kinetic parameter determination of mango leaves using common and new proposed parallel kinetic models. RSC Adv. 2020, 10, 18160–18179. [Google Scholar] [CrossRef] [PubMed]
- Mandapati, R.N.; Ghodke, P.K. Kinetics of pyrolysis of cotton stalk using model-fitting and model-free methods. Fuel 2021, 303, 121285. [Google Scholar] [CrossRef]
- Singh, R.K.; Pandey, D.; Patil, T.; Sawarkar, A.N. Pyrolysis of banana leaves biomass: Physico-chemical characterization, thermal decomposition behavior, kinetic and thermodynamic analyses. Bioresour. Technol. 2020, 310, 123464. [Google Scholar] [CrossRef] [PubMed]
- Kumar, P.; Nandi, B.K. Combustion characteristics of high ash Indian coal, wheat straw, wheat husk and their blends. Mater. Sci. Energy Technol. 2021, 4, 274–281. [Google Scholar] [CrossRef]
- Gupta, S.; Gupta, G.K.; Mondal, M.K. Thermal degradation characteristics, kinetics, thermodynamic, and reaction mechanism analysis of pistachio shell pyrolysis for its bioenergy potential. Biomass Convers. Bior. 2020, 12, 4847–4861. [Google Scholar] [CrossRef]
- Radojević, M.; Janković, B.; Jovanović, V.; Stojiljković, D.; Manić, N. Comparative pyrolysis kinetics of various biomasses based on model-free and DAEM approaches improved with numerical optimization procedure. PLoS ONE 2018, 13, e0206657. [Google Scholar] [CrossRef] [PubMed]
- Cai, J.; Wu, W.; Liu, R.; Huber, G.W. A distributed activation energy model for the pyrolysis of lignocellulosic biomass. Green Chem. 2013, 15, 1331–1340. [Google Scholar] [CrossRef]
- Galano, J.-M.; Lee, Y.Y.; Oger, C.; Vigor, C.; Vercauteren, J.; Durand, T.; Giera, M.; Lee, J.C.-Y. Isoprostanes, neuroprostanes and phytoprostanes: An overview of 25 years of research in chemistry and biology. Prog. Lipid Res. 2017, 68, 83–108. [Google Scholar] [CrossRef]
- Saldarriaga, J.F.; Aguado, R.; Pablos, A.; Amutio, M.; Olazar, M.; Bilbao, J. Fast characterization of biomass fuels by thermogravimetric analysis (TGA). Fuel 2015, 140, 744–751. [Google Scholar] [CrossRef]
- Chen, J.; Wang, Y.; Lang, X.; Fan, S. Comparative evaluation of thermal oxidative decomposition for oil-plant residues via thermogravimetric analysis: Thermal conversion characteristics, kinetics, and thermodynamics. Bioresour. Technol. 2017, 243, 37–46. [Google Scholar] [CrossRef] [PubMed]
- Varma, A.K.; Lal, N.; Rathore, A.K.; Katiyar, R.; Thakur, L.S.; Shankar, R.; Mondal, P. Thermal, kinetic and thermodynamic study for co-pyrolysis of pine needles and styrofoam using thermogravimetric analysis. Energy 2021, 218, 119404. [Google Scholar] [CrossRef]
- Zhao, S.; Xu, W.; Gu, H.; Bi, X.; Chen, L.; Zhang, Y. Density functional theory and experimental study on the chemisorption and catalytic decomposition of benzene over exposed bio-char surface: The influence of unsaturated carbon atoms and potassium. Fuel 2022, 326, 125032. [Google Scholar] [CrossRef]
- Huang, J.; Zhang, J.; Liu, J.; Xie, W.; Kuo, J.; Chang, K.; Buyukada, M.; Evrendilek, F.; Sun, S. Thermal conversion behaviors and products of spent mushroom substrate in CO2 and N2 atmospheres: Kinetic, thermodynamic, TG and Py-GC/MS analyses. J. Anal. Appl. Pyrolysis 2019, 139, 177–186. [Google Scholar] [CrossRef]
- Zhang, D.; Cao, C.-Y.; Lu, S.; Cheng, Y.; Zhang, H.-P. Experimental insight into catalytic mechanism of transition metal oxide nanoparticles on combustion of 5-Amino-1H-Tetrazole energetic propellant by multi kinetics methods and TG-FTIR-MS analysis. Fuel 2019, 245, 78–88. [Google Scholar] [CrossRef]
- Várhegyi, G.; Chen, H.; Godoy, S. Thermal decomposition of wheat, oat, barley, and Brassica carinata straws. A kinetic study. Energy Fuels 2009, 23, 646–652. [Google Scholar] [CrossRef]
- Muravyev, N.V.; Pivkina, A.N.; Koga, N. Critical appraisal of kinetic calculation methods applied to overlapping multistep reactions. Molecules 2019, 24, 2298. [Google Scholar] [CrossRef] [PubMed]
- Thakur, L.S.; Varma, A.K.; Mondal, P. Analysis of thermal behavior and pyrolytic characteristics of vetiver grass after phytoremediation through thermogravimetric analysis. J. Therm. Anal. Calorim. 2018, 131, 3053–3064. [Google Scholar] [CrossRef]
- Sharma, K. Carbohydrate-to-hydrogen production technologies: A mini-review. Renew. Sustain. Energy Rev. 2019, 105, 138–143. [Google Scholar] [CrossRef]
- Banerjee, A.; Vithusha, T.; Krishna, B.B.; Kumar, J.; Bhaskar, T.; Ghosh, D. Pyrolysis of de-oiled yeast biomass of Rhodotorula mucilaginosa IIPL32: Kinetics and thermodynamic parameters using thermogravimetric analysis. Bioresour. Technol. 2021, 340, 125534. [Google Scholar] [CrossRef]
- Soria-Verdugo, A.; Rubio-Rubio, M.; Goos, E.; Riedel, U. Combining the lumped capacitance method and the simplified distributed activation energy model to describe the pyrolysis of thermally small biomass particles. Energy Convers. Manag. 2018, 175, 164–172. [Google Scholar] [CrossRef]
- Luo, Z.; Zhou, J. Thermal conversion of biomass. In Handbook of Climate Change Mitigation and Adaptation; Springer: Berlin/Heidelberg, Germany, 2022; pp. 965–1021. [Google Scholar]
- Liang, W.; Ning, X.; Wang, G.; Zhang, J.; Li, R.; Chang, W.; Wang, C. Influence mechanism and kinetic analysis of co-gasification of biomass char and semi-coke. Renew. Energy 2021, 163, 331–341. [Google Scholar] [CrossRef]
- Chelouche, S.; Trache, D.; Tarchoun, A.F.; Abdelaziz, A.; Khimeche, K.; Mezroua, A. Organic eutectic mixture as efficient stabilizer for nitrocellulose: Kinetic modeling and stability assessment. Thermochim. Acta 2019, 673, 78–91. [Google Scholar] [CrossRef]
- Tarchoun, A.F.; Trache, D.; Klapötke, T.M.; Chelouche, S.; Derradji, M.; Bessa, W.; Mezroua, A. A promising energetic polymer from Posidonia oceanica brown algae: Synthesis, characterization, and kinetic modeling. Macromol. Chem. Phys. 2019, 220, 1900358. [Google Scholar] [CrossRef]


Disclaimer/Publisher’s Note: The statements, opinions and data contained in all publications are solely those of the individual author(s) and contributor(s) and not of MDPI and/or the editor(s). MDPI and/or the editor(s) disclaim responsibility for any injury to people or property resulting from any ideas, methods, instructions or products referred to in the content. |
© 2024 by the authors. Licensee MDPI, Basel, Switzerland. This article is an open access article distributed under the terms and conditions of the Creative Commons Attribution (CC BY) license (https://creativecommons.org/licenses/by/4.0/).