Article

Evaporative Fractionation as the Important Formation Mechanism of Light Oil Reservoirs in the Dongying Depression, NE China

1
National Key Laboratory of Petroleum Resources and Engineering, College of Geosciences, China University of Petroleum (Beijing), Beijing 102249, China
2
School of Geoscience, China University of Petroleum, Changjiang West Road 66, Qingdao 266580, China
*
Author to whom correspondence should be addressed.
Energies 2024, 17(15), 3734; https://doi.org/10.3390/en17153734 (registering DOI)
Submission received: 13 May 2024 / Revised: 13 July 2024 / Accepted: 24 July 2024 / Published: 29 July 2024
(This article belongs to the Topic Petroleum Geology and Geochemistry of Sedimentary Basins)

Abstract

:
Light oil, a high-quality energy resource abundant in deep basins, is prevalent in the northern zone of the Dongying Depression. To elucidate the formation mechanism of light oil reservoirs, this study investigates the molecular and stable isotope composition, biomarkers, light hydrocarbons, and diamondoid compositions of petroleum. The results reveal that the gas primarily consists of oil-cracking gas from a late filling event, mixed with oil-associated gas generated during the source rock’s “oil window” maturity phase. Methane exhibits enriched light carbon isotopes, indicating noticeable migration fractionation effects. The crude oil in the same deep strata exhibits high maturity, originating from both terrestrial and aquatic organic matter in the source materials. Molar proportions of n-alkanes and light hydrocarbon indices (Tol/nC7, nC7/MCH) indicate significant evaporative fractionation in the petroleum reservoirs. This fractionation process modified early-formed oil reservoirs due to the late filling of highly mature gas reservoirs. The evaporative fractionation at different stages has varying effects on the diamondoid ratio (1- + 2-MA)/(3- + 4-MD). It is considered a pivotal mechanism in the formation of deep condensate reservoirs and volatile oil reservoirs.

1. Introduction

In recent years, petroleum basins worldwide have shifted towards deep and ultra-deep exploration, driven by the global demand for petroleum energy and advancements in exploration technology. Notably, deep and ultra-deep light oil reservoirs, including condensate and volatile oil reservoirs, have emerged as significant focal points in petroleum exploration. These reservoirs have been discovered in various regions across the globe, such as the southeastern Mediterranean coastal area of Israel [1], the Gulf of Mexico coastal area in the United States [2], Egypt’s Gulf of Suez region [3], the Central North Sea [4], offshore East Kalimantan, Indonesia [5], and China’s Bohai Bay Basin [6].
Deep reservoirs contain light oil, characterized by low-density, low molecular weight hydrocarbons (LMWH), making it a valuable petroleum resource. These reservoirs include condensate reservoirs, which are a special phase state between oil and gas reservoirs and are classified into two categories: primary and secondary condensate reservoirs. Primary condensate reservoirs primarily form through the thermal evolution of type I or type II kerogen at high maturity levels (Ro = 1.0–1.6%) [7,8]. Additionally, specific macerals, like resins from terrestrial higher plants, can produce immature condensate directly in the early stages (Ro = 0.4–0.6%) [1,9]. However, this immature condensate does not possess the potential for sustained condensate field development [10]. Secondary condensate reservoirs primarily result from in situ oil cracking [11,12,13] and evaporative fractionation [2,14,15].
In recent years, evaporative fractionation has gained significant attention as a secondary transformation process in deep petroleum reservoirs [16,17,18]. It plays a crucial role in the formation of most light oil reservoirs, as indicated by current global exploration and prior research [19,20,21]. Secondary condensate reservoirs resulting from evaporative fractionation have been identified in various fields, including Eugene Island, offshore Louisiana, USA [22,23], Novoportovskoye field in the West Siberia Basin, Russia [24], Kuparuk field in the North Slope, Alaska, USA [25], Sleipner fields in the South Viking Graben, the North Sea [26], Tunu fields in the Kutei Basin, Indonesia [5], Snøhvit field in the Hammerfest Basin, Norway [27], Kelamili Gas field in the Junggar Basin, China [28], and the Ningbo Large Gas field in the East Sea Shelf Basin, China [17,29].
The theory of evaporative fractionation has garnered significant attention from scholars. Gussow (1954) introduced the “differential accumulation” model, proposing that deep reservoirs could undergo fractionation and form condensate during hydrocarbon replacement [30]. Subsequently, Silverman et al. (1965) posited that oil fractions migrating in the gas phase could create condensate reservoirs under specific conditions [31]. Thompson (1987; 1988) put forth the evaporative fractionation theory to elucidate the genetic mechanism of non-thermal cracking condensate reservoirs, supported by extensive experimental observations [2,14]. Additionally, Larter and Mills (1991), Dzou and Hughes (1993), and Curiale and Bromley (1996) contributed refinements and supplements to the evaporative fractionation theory [32,33,34]. Evaporative fractionation now refers to a complex process that segregates gaseous materials from oil within a reservoir [31]. In this process, a substantial volume of gas is injected into the reservoir, dissolving and extracting crude oil under high-temperature and high-pressure conditions. This results in LMWH (or even medium molecular weight hydrocarbons) from the crude oil entering the gas phase and migrating out of the reservoir as part of the gas, eventually forming condensate reservoirs [2,15,22,31]. This understanding emphasizes the role of late-charging gas in “carrying” lightweight oil components from reservoirs. However, in the case of an early original reservoir invaded by late high-maturity gas, equal importance should be placed on the residual oil reservoir post-transformation. In other words, after gas invasion, more LMWH would “dissolve into” the reservoir, converting a normal reservoir into a light one. This crucial mechanism in light reservoir formation has not received sufficient attention.
The Dongying Depression, located in the Bohai Bay Basin in eastern China, is a significant region rich in petroleum. In recent years, numerous light oil reservoirs, including volatile and condensate reservoirs, have been unearthed in the deep Paleogene layers in the northern region of this depression [35]. While the fundamental geological characteristics contributing to the formation of these reservoirs have been investigated [35,36], further research is required to delve into their specific formation mechanisms.
This study investigates the formation mechanisms of these light oil reservoirs by analyzing various geochemical parameters of natural gas and oil, including molecular and stable isotopic compositions, biomarkers, light hydrocarbons, and diamondoids. Our research focuses on several crucial aspects: (1) understanding the origin and secondary alterations of gas through molecular and stable isotopic compositions, (2) examining evaporative fractionation in deep oil reservoirs by analyzing n-alkane and light hydrocarbon components, (3) evaluating the impact of evaporative fractionation on diamondoids by assessing absolute diamondoid concentrations, and (4) developing a comprehensive formation model for deep light oil reservoirs based on geochemical analysis.

2. Geological Setting

The Bohai Bay Basin, covering an area of 2 × 10⁵ km2, is a prominent petroleum basin in eastern China (Figure 1A). Specifically, the Dongying Depression, a significant petroleum-producing subsidiary of the Jiyang Depression, is situated in the southeastern part of the Bohai Bay Basin (Figure 1B). Most of its petroleum resources are derived from the Cenozoic strata [37,38].
The northern portion of the Dongying Depression, encompassing the Minfeng, Lijin, and Shengtuo areas, is located between the central uplift belt and the northern steep slope belt. More precisely, the Minfeng area, which is the focus of this study, is bordered by the Qingtuozi uplift to the east, the Shengtuo Area to the west, the Chenjiazhuang uplift to the north, and the Luxi uplift to the south (Figure 1C).
In terms of stratigraphy (Figure 1D), the depression has seen the development of the Kongdian Formation (Ek), Shahejie Formation (Es), Dongying Formation (Ed), Guantao Formation (Ng), Minghuazen Formation (Nm), and Pingyuan Formation (Qp) since ancient times [35]. Of particular note is the Shahejie Formation, which witnessed the accumulation of substantial dark gray oil shale and mudstone during its sedimentary period, serving as the primary site for petroleum generation and accumulation. The Shahejie Formation is further divided into Mbr 1 (Es1), Mbr 2 (Es2), Mbr 3 (Es3), and Mbr 4 (Es4), in sequential order (Figure 1D). Notably, the most significant source rocks for deep petroleum are located in the lower part of Mbr 4 of the Shahejie Formation (Es4L) [35]. These rocks predominantly contain type I and II kerogen, with total organic carbon (TOC) levels ranging from 0.42% to 5.04%, averaging 1.83% [36].

3. Samples and Methods

3.1. Samples

In this study, we collected and analyzed a total of eight oil samples from specific wells, including F8, FS1, FS1-P1, FS1-X1, FSX101, FSX11, Y22-X100, and YX229, along with eight gas samples, all originating from the northern region of the Dongying Depression within the Bohai Bay Basin (Table 1). The analysis of the fluid samples reveals distinct phases and components. Specifically, the YX229 and Y22-X100 samples exhibit characteristics of volatile oils, while FS3 is classified as gas. The remaining samples fall into the category of condensates (Figure 2). This classification provides valuable insights into the nature of the collected fluids, which is crucial for our subsequent analysis and interpretation.

3.2. Methods

3.2.1. Oil Analysis

The oil group components were separated using column chromatography, a traditional method. The sample was divided into asphaltene, saturated hydrocarbons, aromatic hydrocarbons, and non-hydrocarbon components by using elution solvents such as petroleum ether, dichloromethane, and dichloromethane + methanol.
Saturated hydrocarbon and aromatic components were analyzed using gas chromatography-mass spectrometry (GC-MS) with an Agilent 6890GC/5975i MS system (Santa Clara, CA, USA). A HP-PONA column (60 m × 0.25 mm × 0.25 μm) was employed in the gas chromatograph. The analysis involved heating the gas chromatograph to 50 °C, holding for 1 min, increasing to 250 °C at a rate of 20 °C/min, and finally reaching 310 °C at a rate of 20 °C/min, where it was held for 10 min. The mass spectrometer operated at an electron ionization energy of 70 eV in the selected ion monitoring mode. To quantify the chemicals in the saturated hydrocarbon components, known concentrations of sterane in d4-C29 (20R) were used as internal standards.
The GC-MS analysis of diamondoids followed the same procedure as for the saturated hydrocarbon components. To determine the absolute concentration of diamondoids, known concentrations of d16-diamantine were added to the entire oil sample as a quantitative internal standard.

3.2.2. Light Hydrocarbons Analysis

Light hydrocarbons were analyzed using an Agilent 6890A gas chromatograph (GC, Santa Clara, CA, USA) equipped with an HP-PONA quartz capillary column (50 m × 0.20 mm × 0.5 μm). The temperature schedule was as follows: initially set at 35 °C for 5 min, then gradually increased to 70 °C at a rate of 3 °C/min, and finally raised to 300 °C at a rate of 4.5 °C/min, holding for 35 min. High-purity helium (99.9%) served as the carrier gas at a constant flow rate of 1 mL/min. The sampler temperature was set to 300 °C, and the sample was injected with a split ratio of 100:1.

3.2.3. Gas Analysis

Natural gas samples were analyzed using an HP 6890 II gas chromatograph (Agilent; Santa Clara, CA, USA) with flame ionization and thermal conductivity detectors. The hydrocarbon gas components were identified through gas chromatography, while the stable carbon isotopes of the gas samples were measured using GC-IRMS (Thermo Finnigan MAT 253, San Jose, CA, USA) with a carrier, coupled to the HP 6890 II GC (Agilent; Santa Clara, CA, USA) apparatus.

4. Results

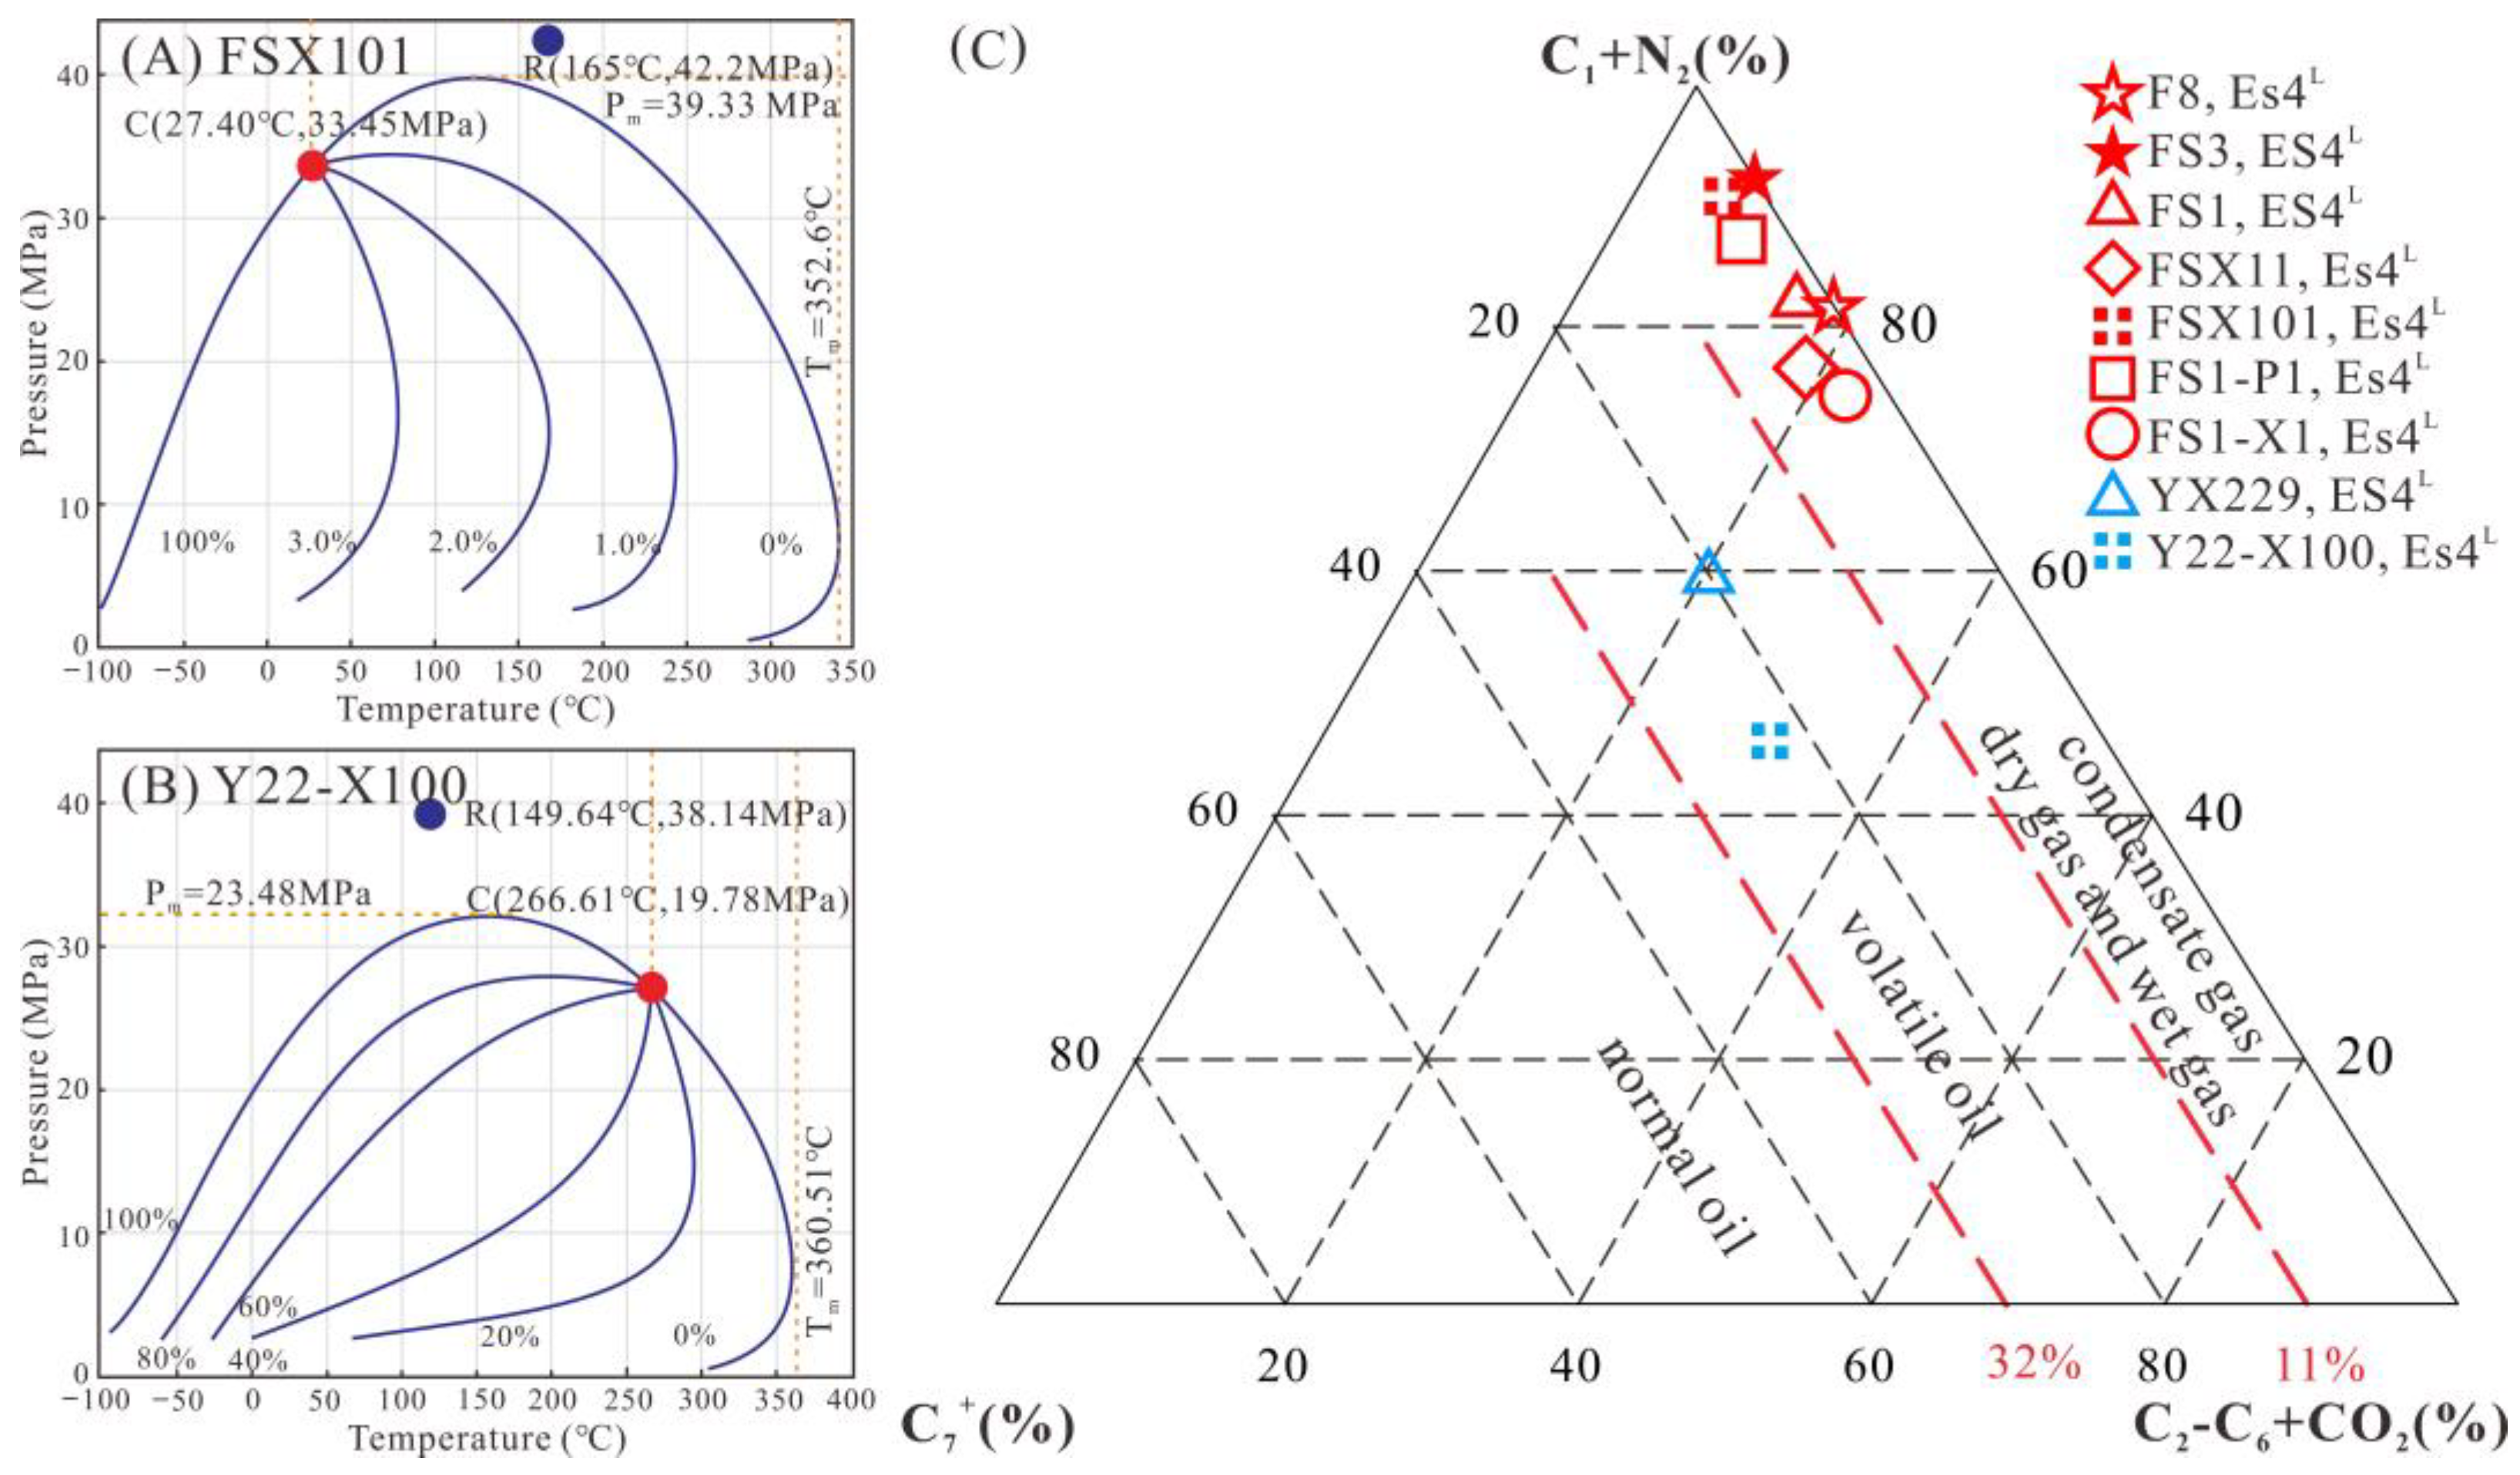
4.1. Petroleum Properties

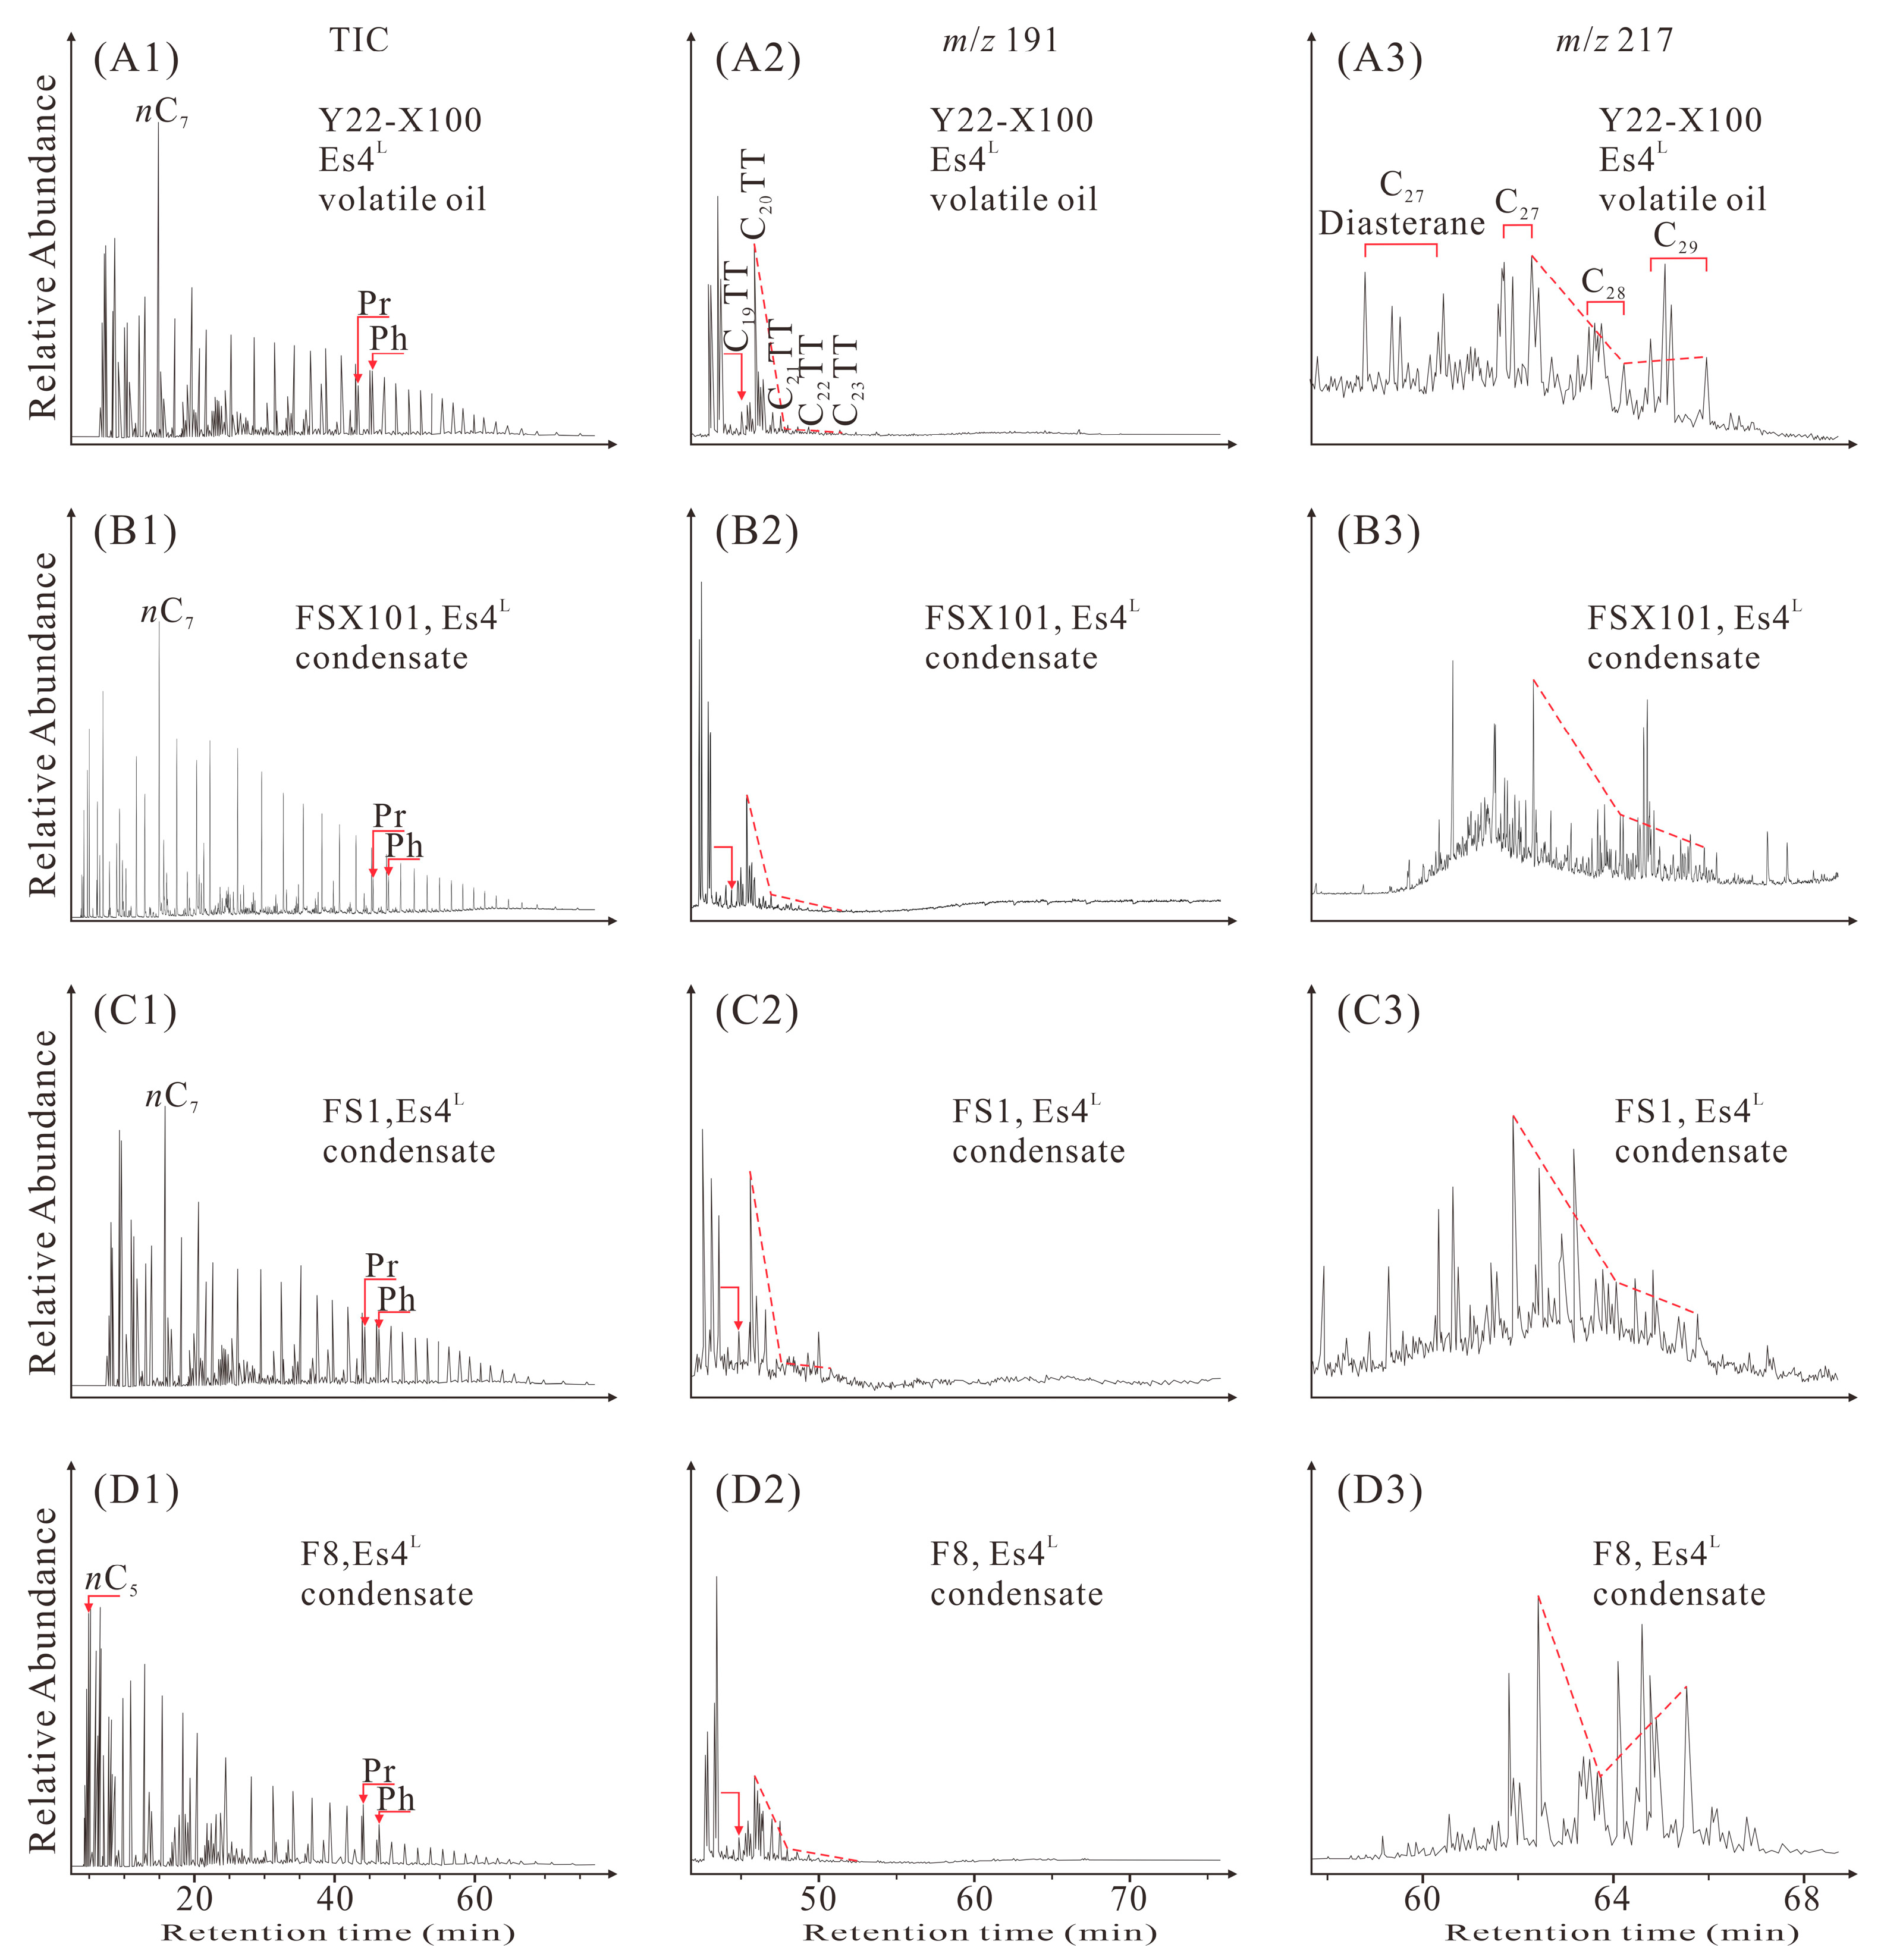
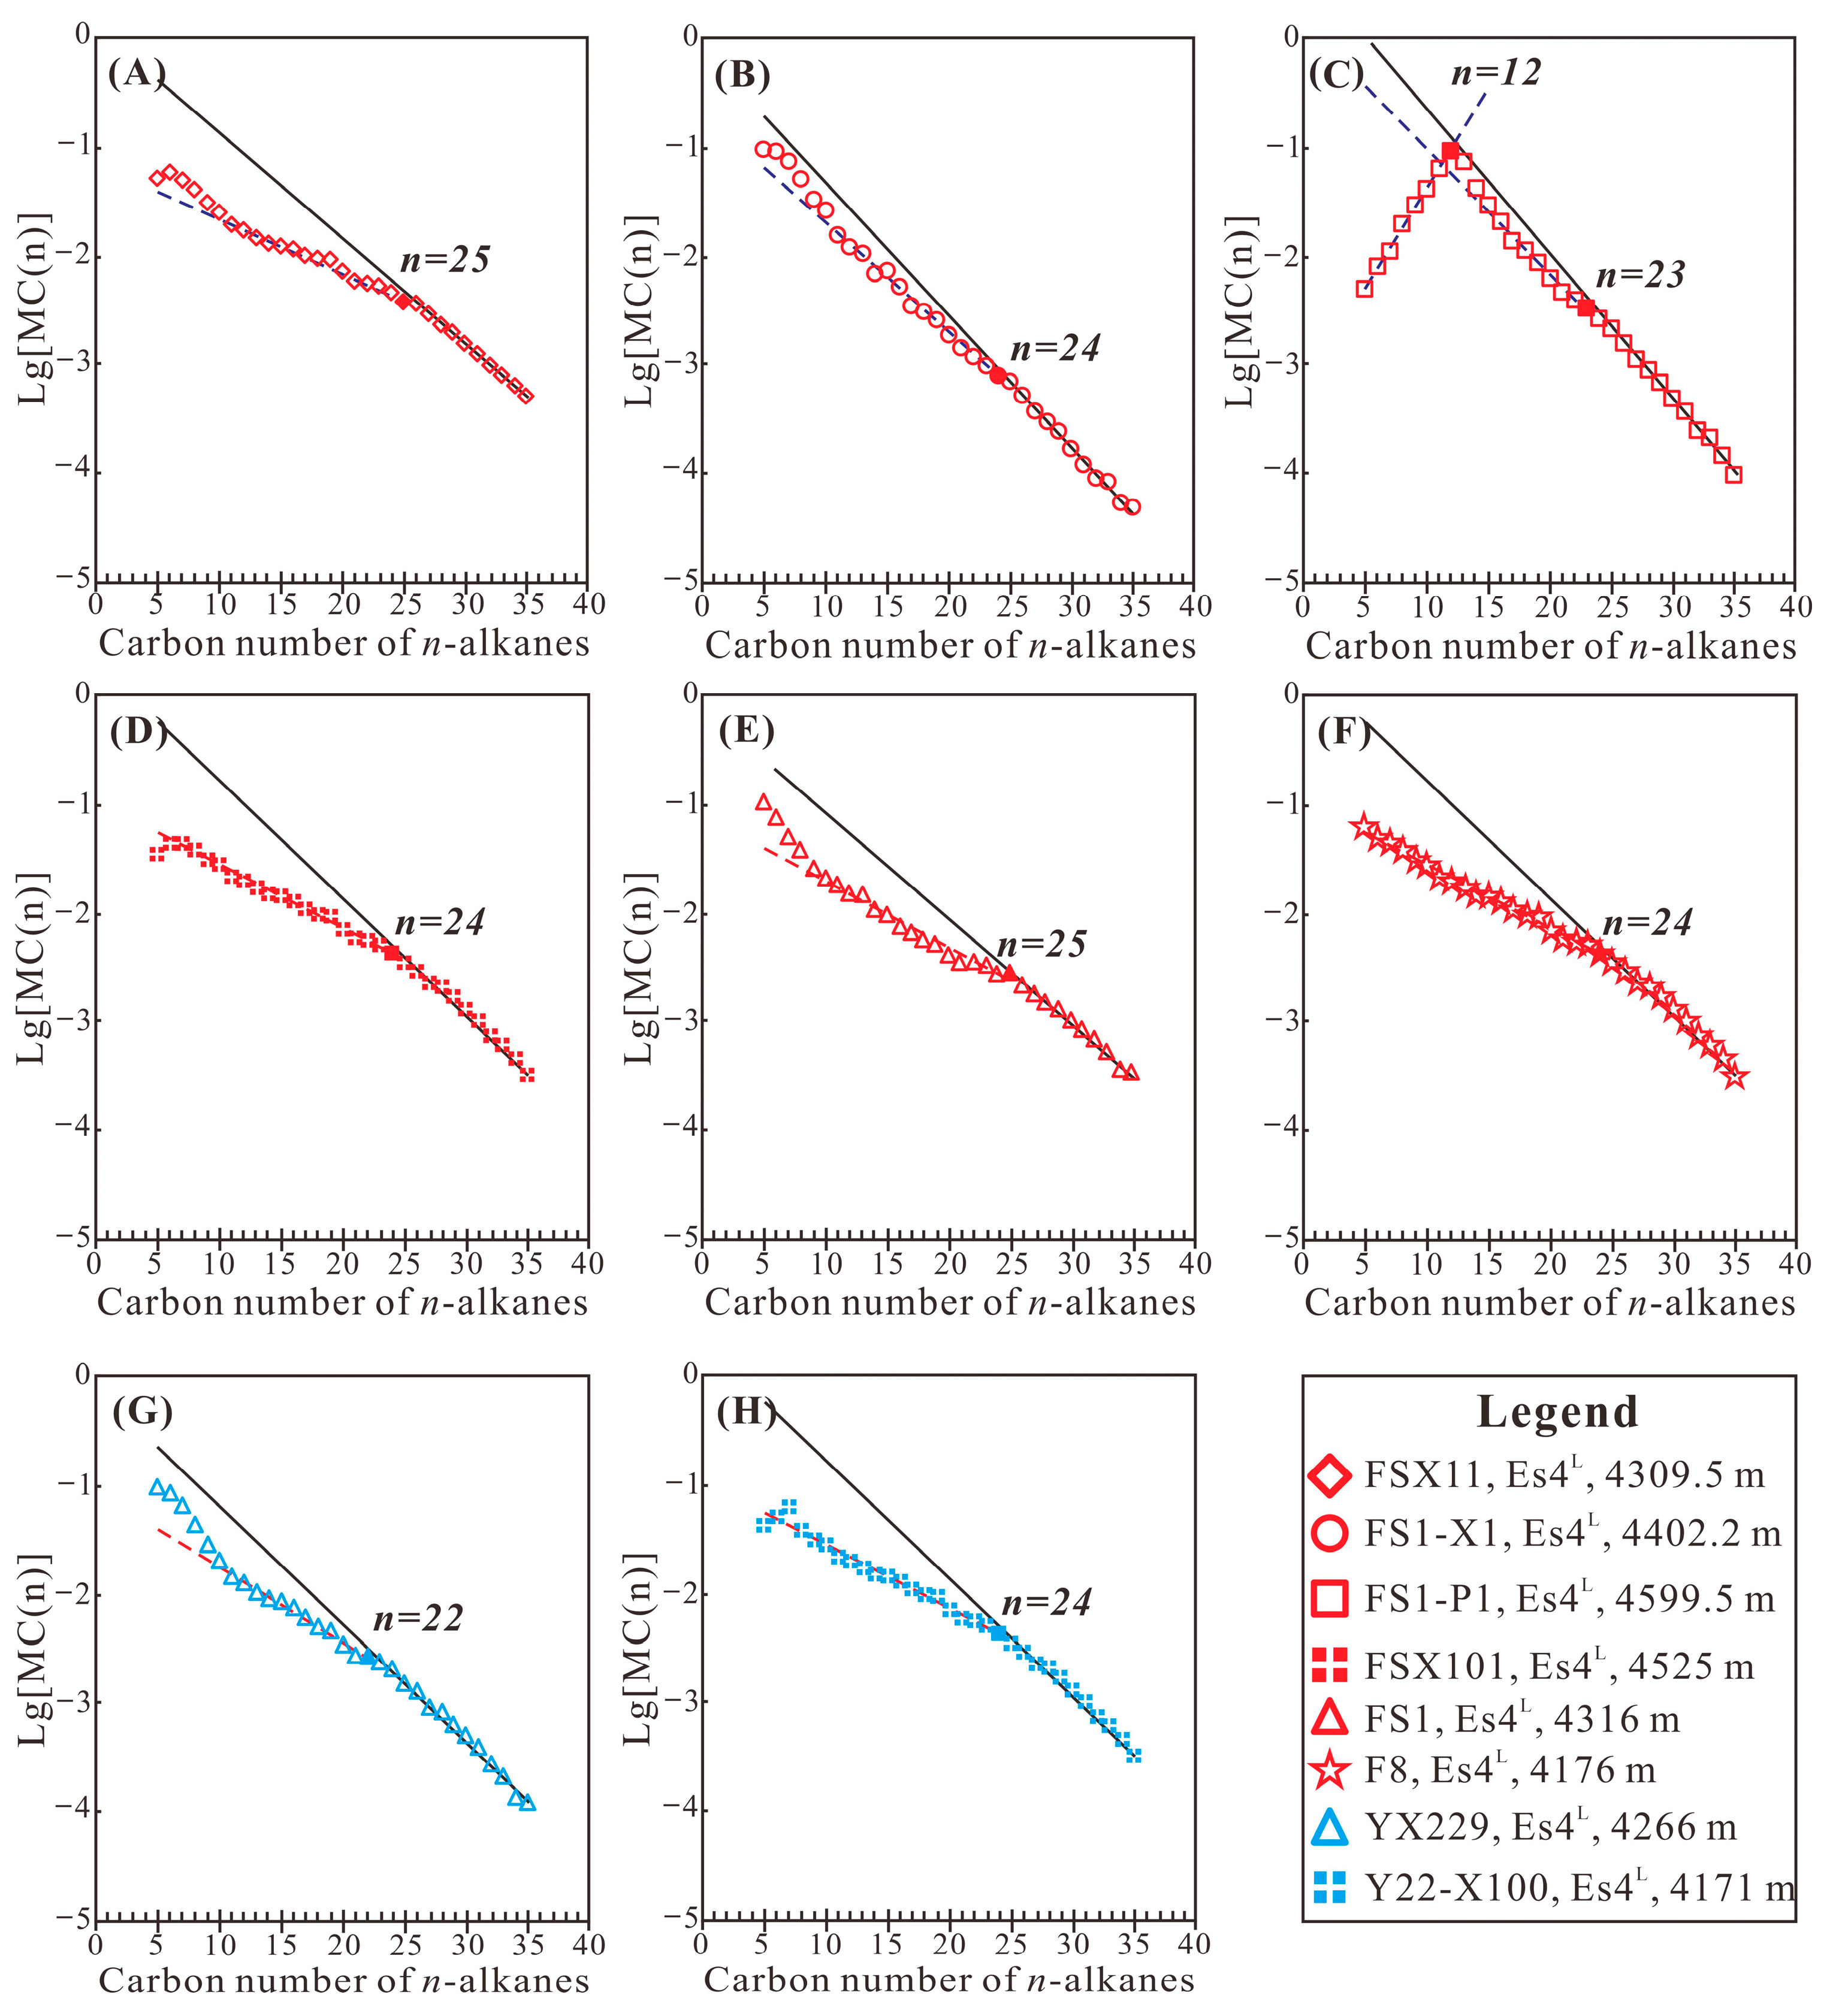
4.1.1. Oil Physical Property and Alkane Characteristics

The oil samples exhibit consistently low values for density, viscosity, and sulfur content. Crude oil densities range from 0.72 g/cm3 to 0.88 g/cm3, with an average of 0.79 g/cm3. Viscosities vary between 0.81 MPa·s and 12.8 MPa·s, with an average of 3.85 MPa·s, while sulfur content spans from 0.02% to 0.55%, with an average of 0.16% (Table 1).
The oil’s saturated hydrocarbon content varies between 71.29% and 87.40%, with a corresponding range of 3.93 to 12.95 for the ratio of saturated hydrocarbons to aromatic hydrocarbons. Additionally, aromatic content ranges from 6.75% to 19.05%, while non-hydrocarbon and asphaltene content spans from 5.85% to 16.83% (Table 1). This consistent composition suggests similar maturity levels among the oil samples.
Moreover, Figure 3 illustrates a general decrease in peak area with increasing carbon numbers. The oil samples display a comprehensive distribution of n-alkanes, ranging from nC5 to nC38, and exhibit a high content of LMWH. Notably, the average value of nC10/nC10+ is 0.68, with a range of 0.11 to 1.12 (Table 2). This phenomenon can be attributed to the high maturity of the crude oil, resulting in the cracking of some high molecular weight hydrocarbons (HMWH) [35]. When examining the Total Ion Chromatogram (TIC) of whole oil (Figure 3), it is evident that there are no noticeable unresolved complex mixtures. This observation indicates that the samples have either not been significantly affected by biodegradation or have experienced only slight biodegradation effects [40,41,42].

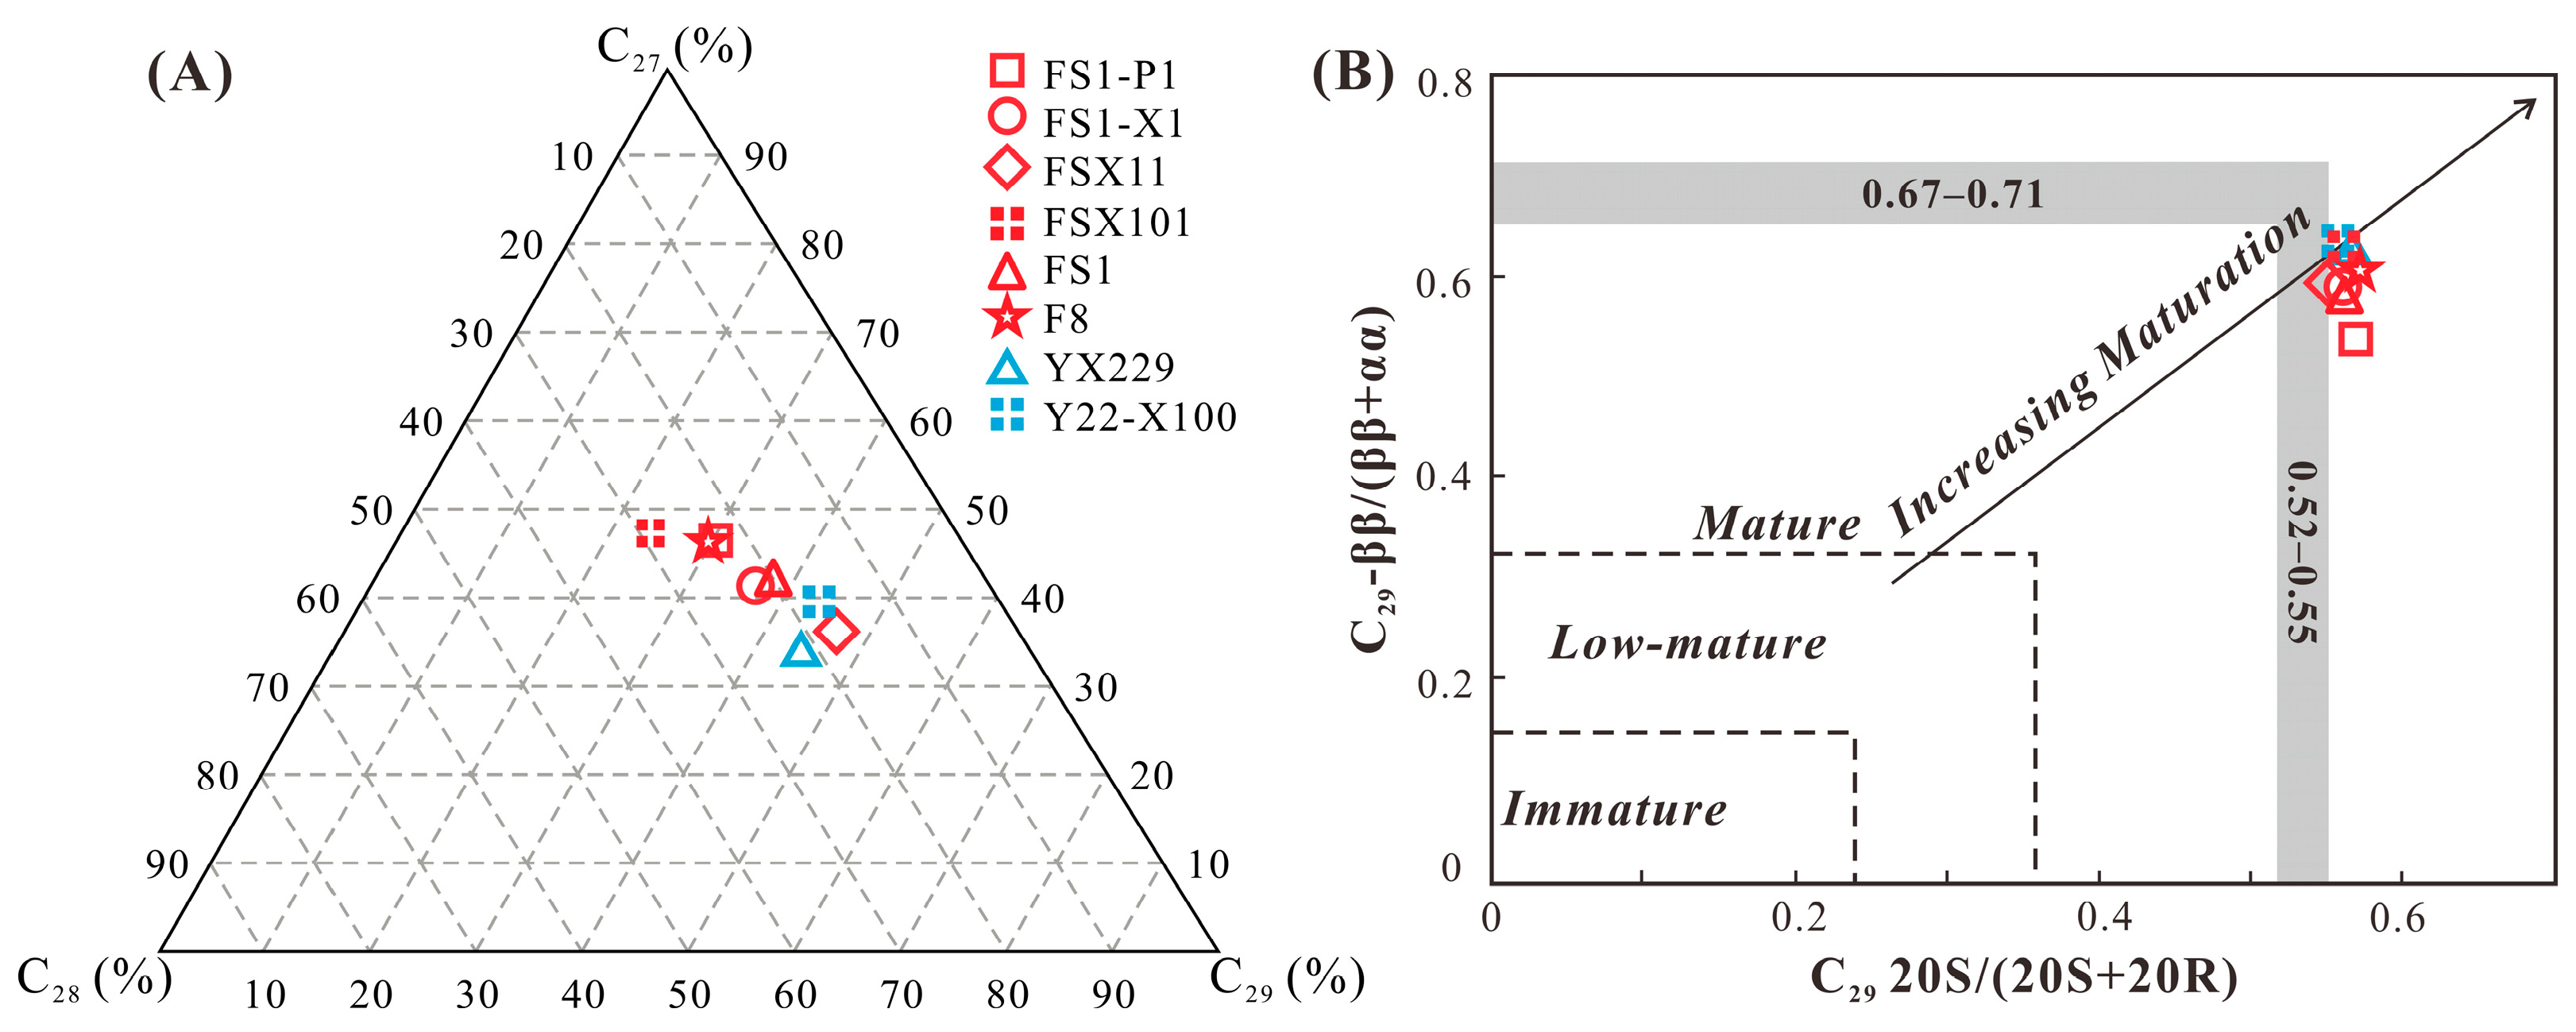
4.1.2. Characterization of Steranes and Terpanes

The GC-MS analysis of deep oil samples from the northern Dongying Depression reveals relatively low concentrations of total steranes and terpanes, with average absolute concentrations of 189.7 μg/g and 162.1 μg/g, respectively. These findings suggest that thermal evolution has led to the thermal cracking of steranes and terpane biomarkers, resulting in reduced absolute content (Figure 3) [41].
In the m/z 191 chromatograms, it is evident that short-chain tricyclic terpanes (C19–24) dominate, while long-chain pentacyclic triterpanes appear to be extensively cracked, indicating the high maturity of the oil (Figure 3).
Similarly, the m/z 217 chromatograms reveal a distinctive distribution pattern among C27–C29 regular steranes, with C27 regular steranes > C28 regular sterane < C29 regular steranes (Figure 3). Interestingly, the concentrations of C27 and C29 regular steranes are approximately equal, suggesting contributions from both terrigenous and aquatic organic matter to the oils derived from the Es4L source rock (Figure 4A) [43]. Furthermore, the calculated parameters of ββ/(ββ + αα) and 20S/(20S + 20R) from various isomers of C29 steranes fall within the ranges of 0.54–0.64 and 0.55–0.57, respectively (Figure 4B, Table 2). Notably, the parameters of 20S/(20S + 20R) have reached a state of thermal evolution equilibrium, typically ranging from 0.52 to 0.55. Consequently, it can be inferred that the oil has reached a high level of maturity [41].

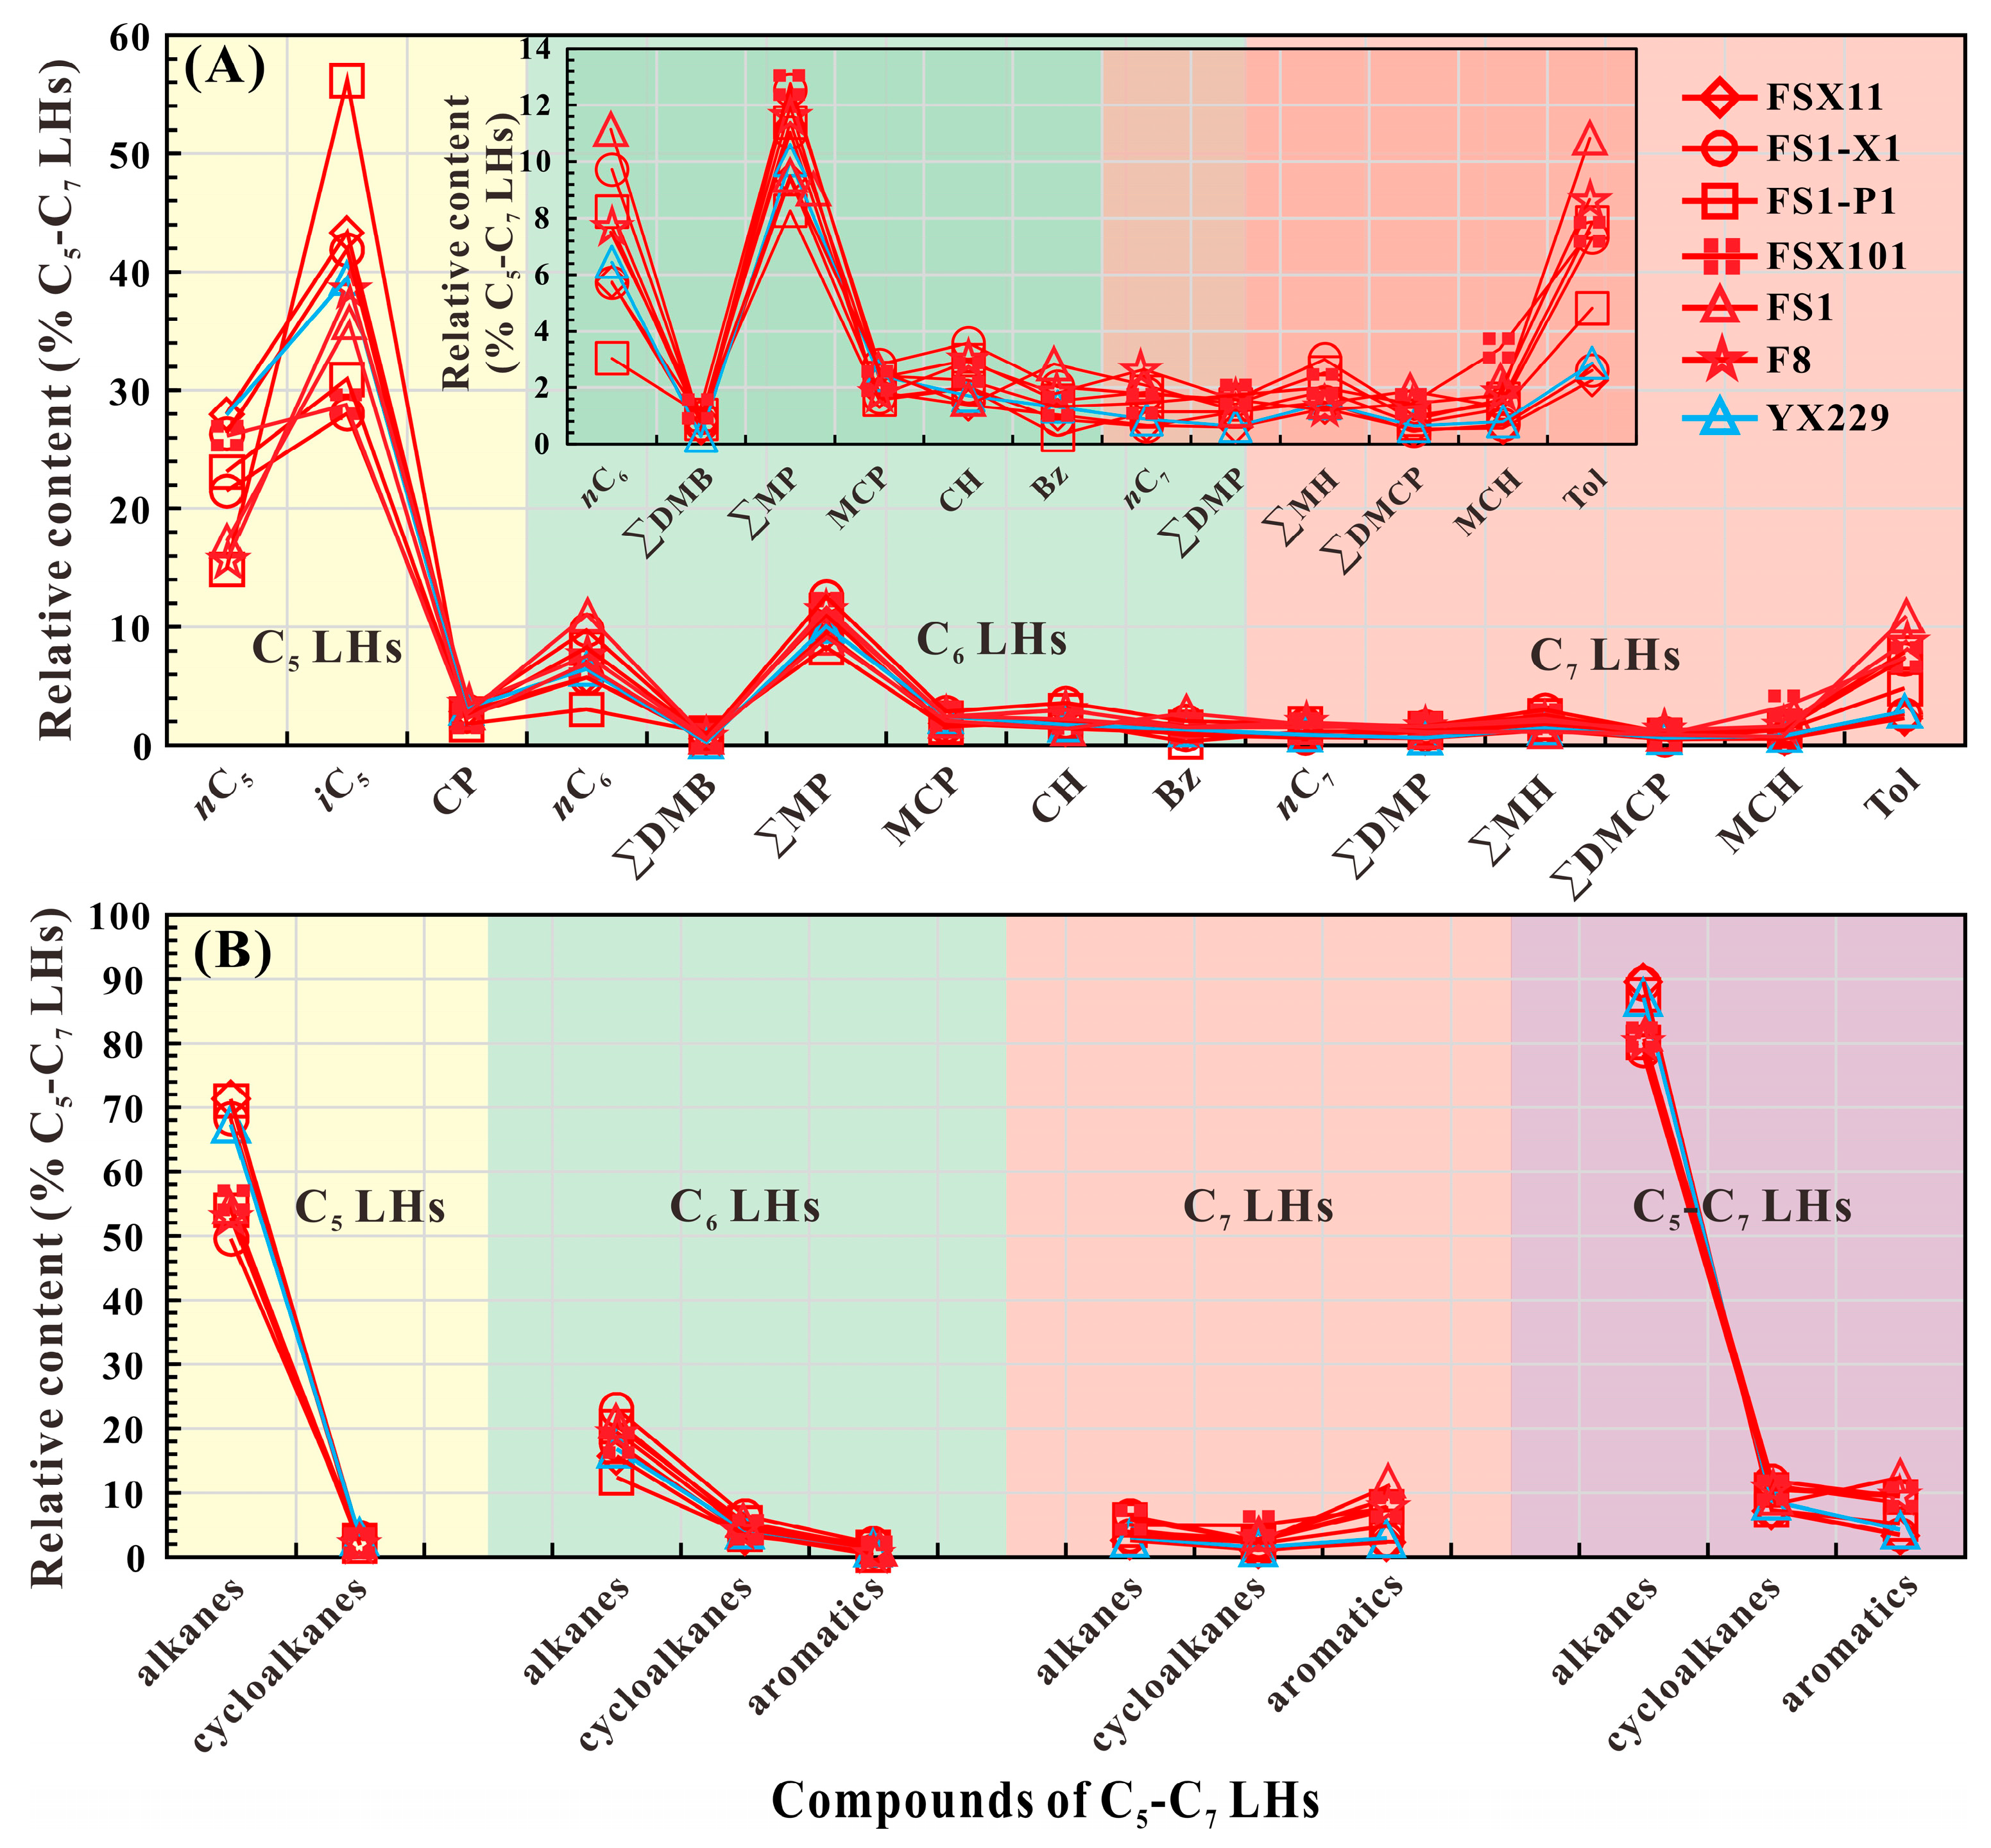
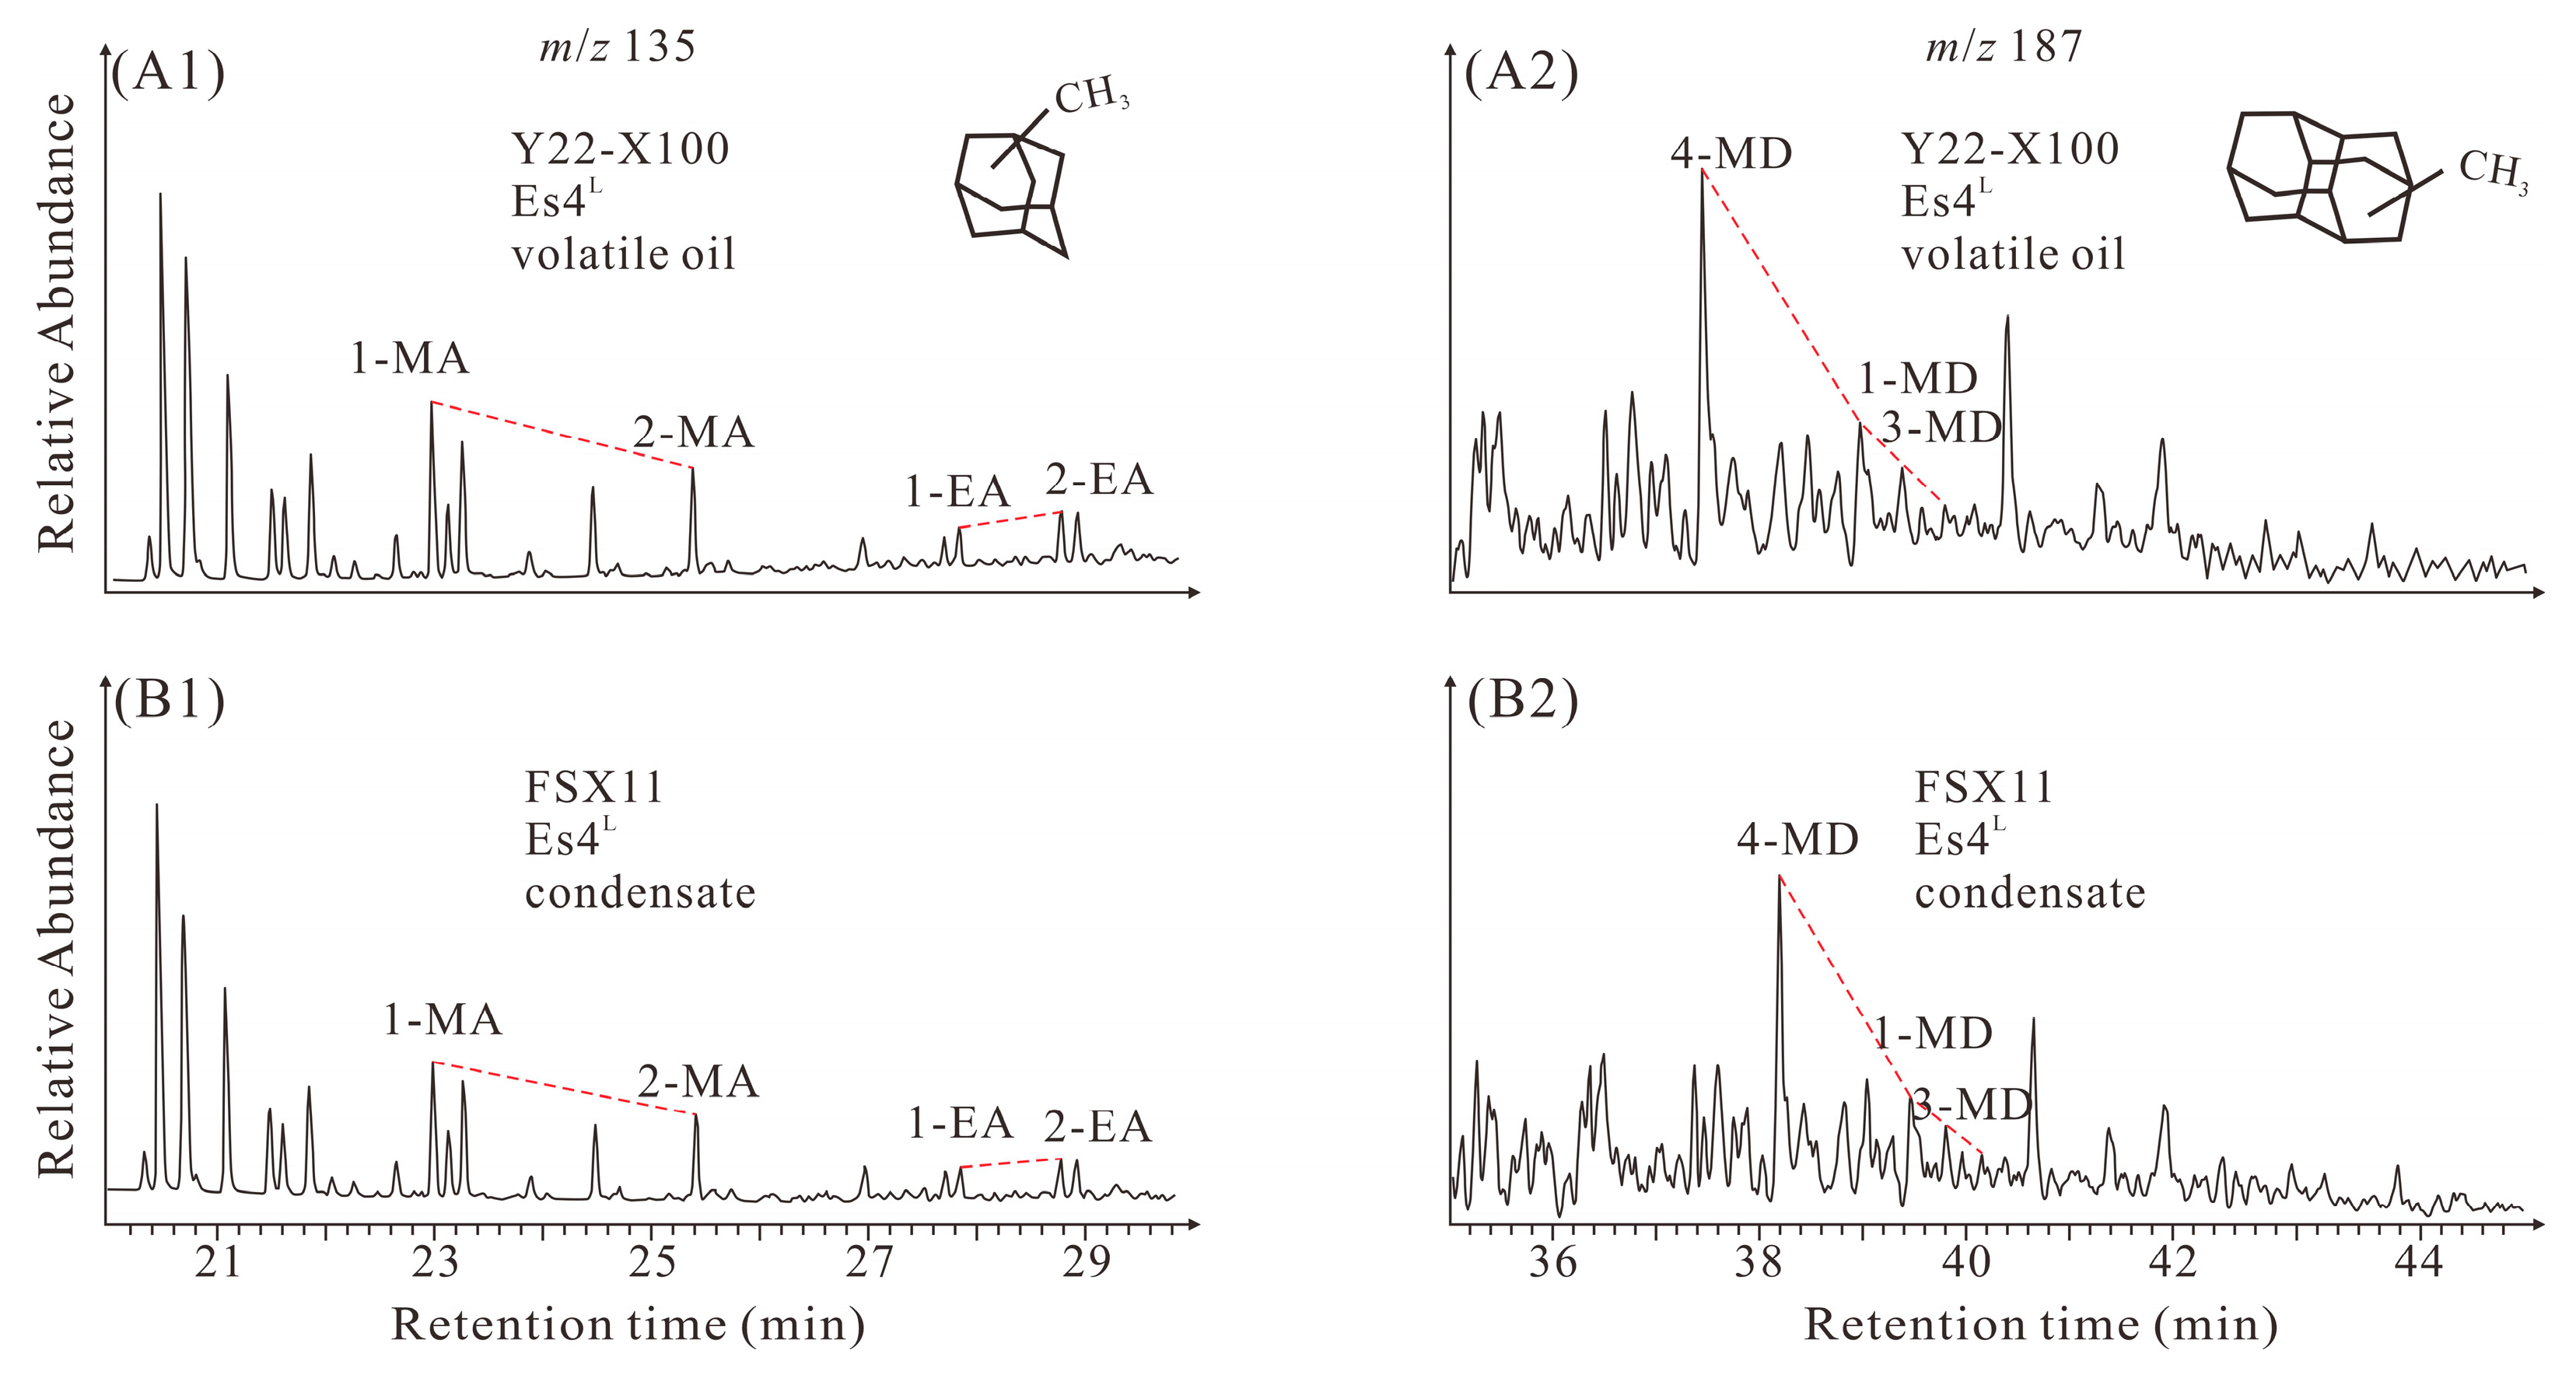
4.2. Light Hydrocarbon and Diamondoid Composition

Light hydrocarbons, which constitute a significant portion of petroleum, can comprise up to 90% of volatile oil and condensate [44,45]. In the case of volatile oil and condensate, the geochemical insights provided by light hydrocarbons hold particular significance. Among these, the C5–7 fraction plays a crucial role due to its substantial presence. Notably, the C5–7 distribution patterns of light hydrocarbons in this region exhibit remarkable similarity (Figure 5A), indicating a common source for these hydrocarbons [46,47]. Within the C5–7 range, n-alkanes (nC5–7) are the most abundant light hydrocarbons, constituting between 78.8% and 89.5% of the composition, with an average of 85.4% (Figure 5B, Table 3). Cycloalkanes and isomeric alkanes follow in relative abundance. The distribution characteristics of diamondoids in the oil samples are illustrated in Figure 6. While the concentrations of some oils exhibit significant differences, the overall distribution patterns of diamondoids in various oil samples remain similar (Figure 7). For specific concentrations of certain diamondoids in these oil samples, refer to Table 4.

4.3. Natural Gas Molecular Compositions

Molecular and stable isotopic compositions of natural gas can help identify its source [48,49,50]. Gas samples exhibit methane (CH4) contents ranging from 63.0% to 95.2%, averaging 79.1%, and dryness coefficients ranging from 71.0% to 95.2%, with an average of 84.3% (Table 5). These results indicate a predominance of wet gases in the area, characterized by low methane content and dryness coefficients.

5. Discussion

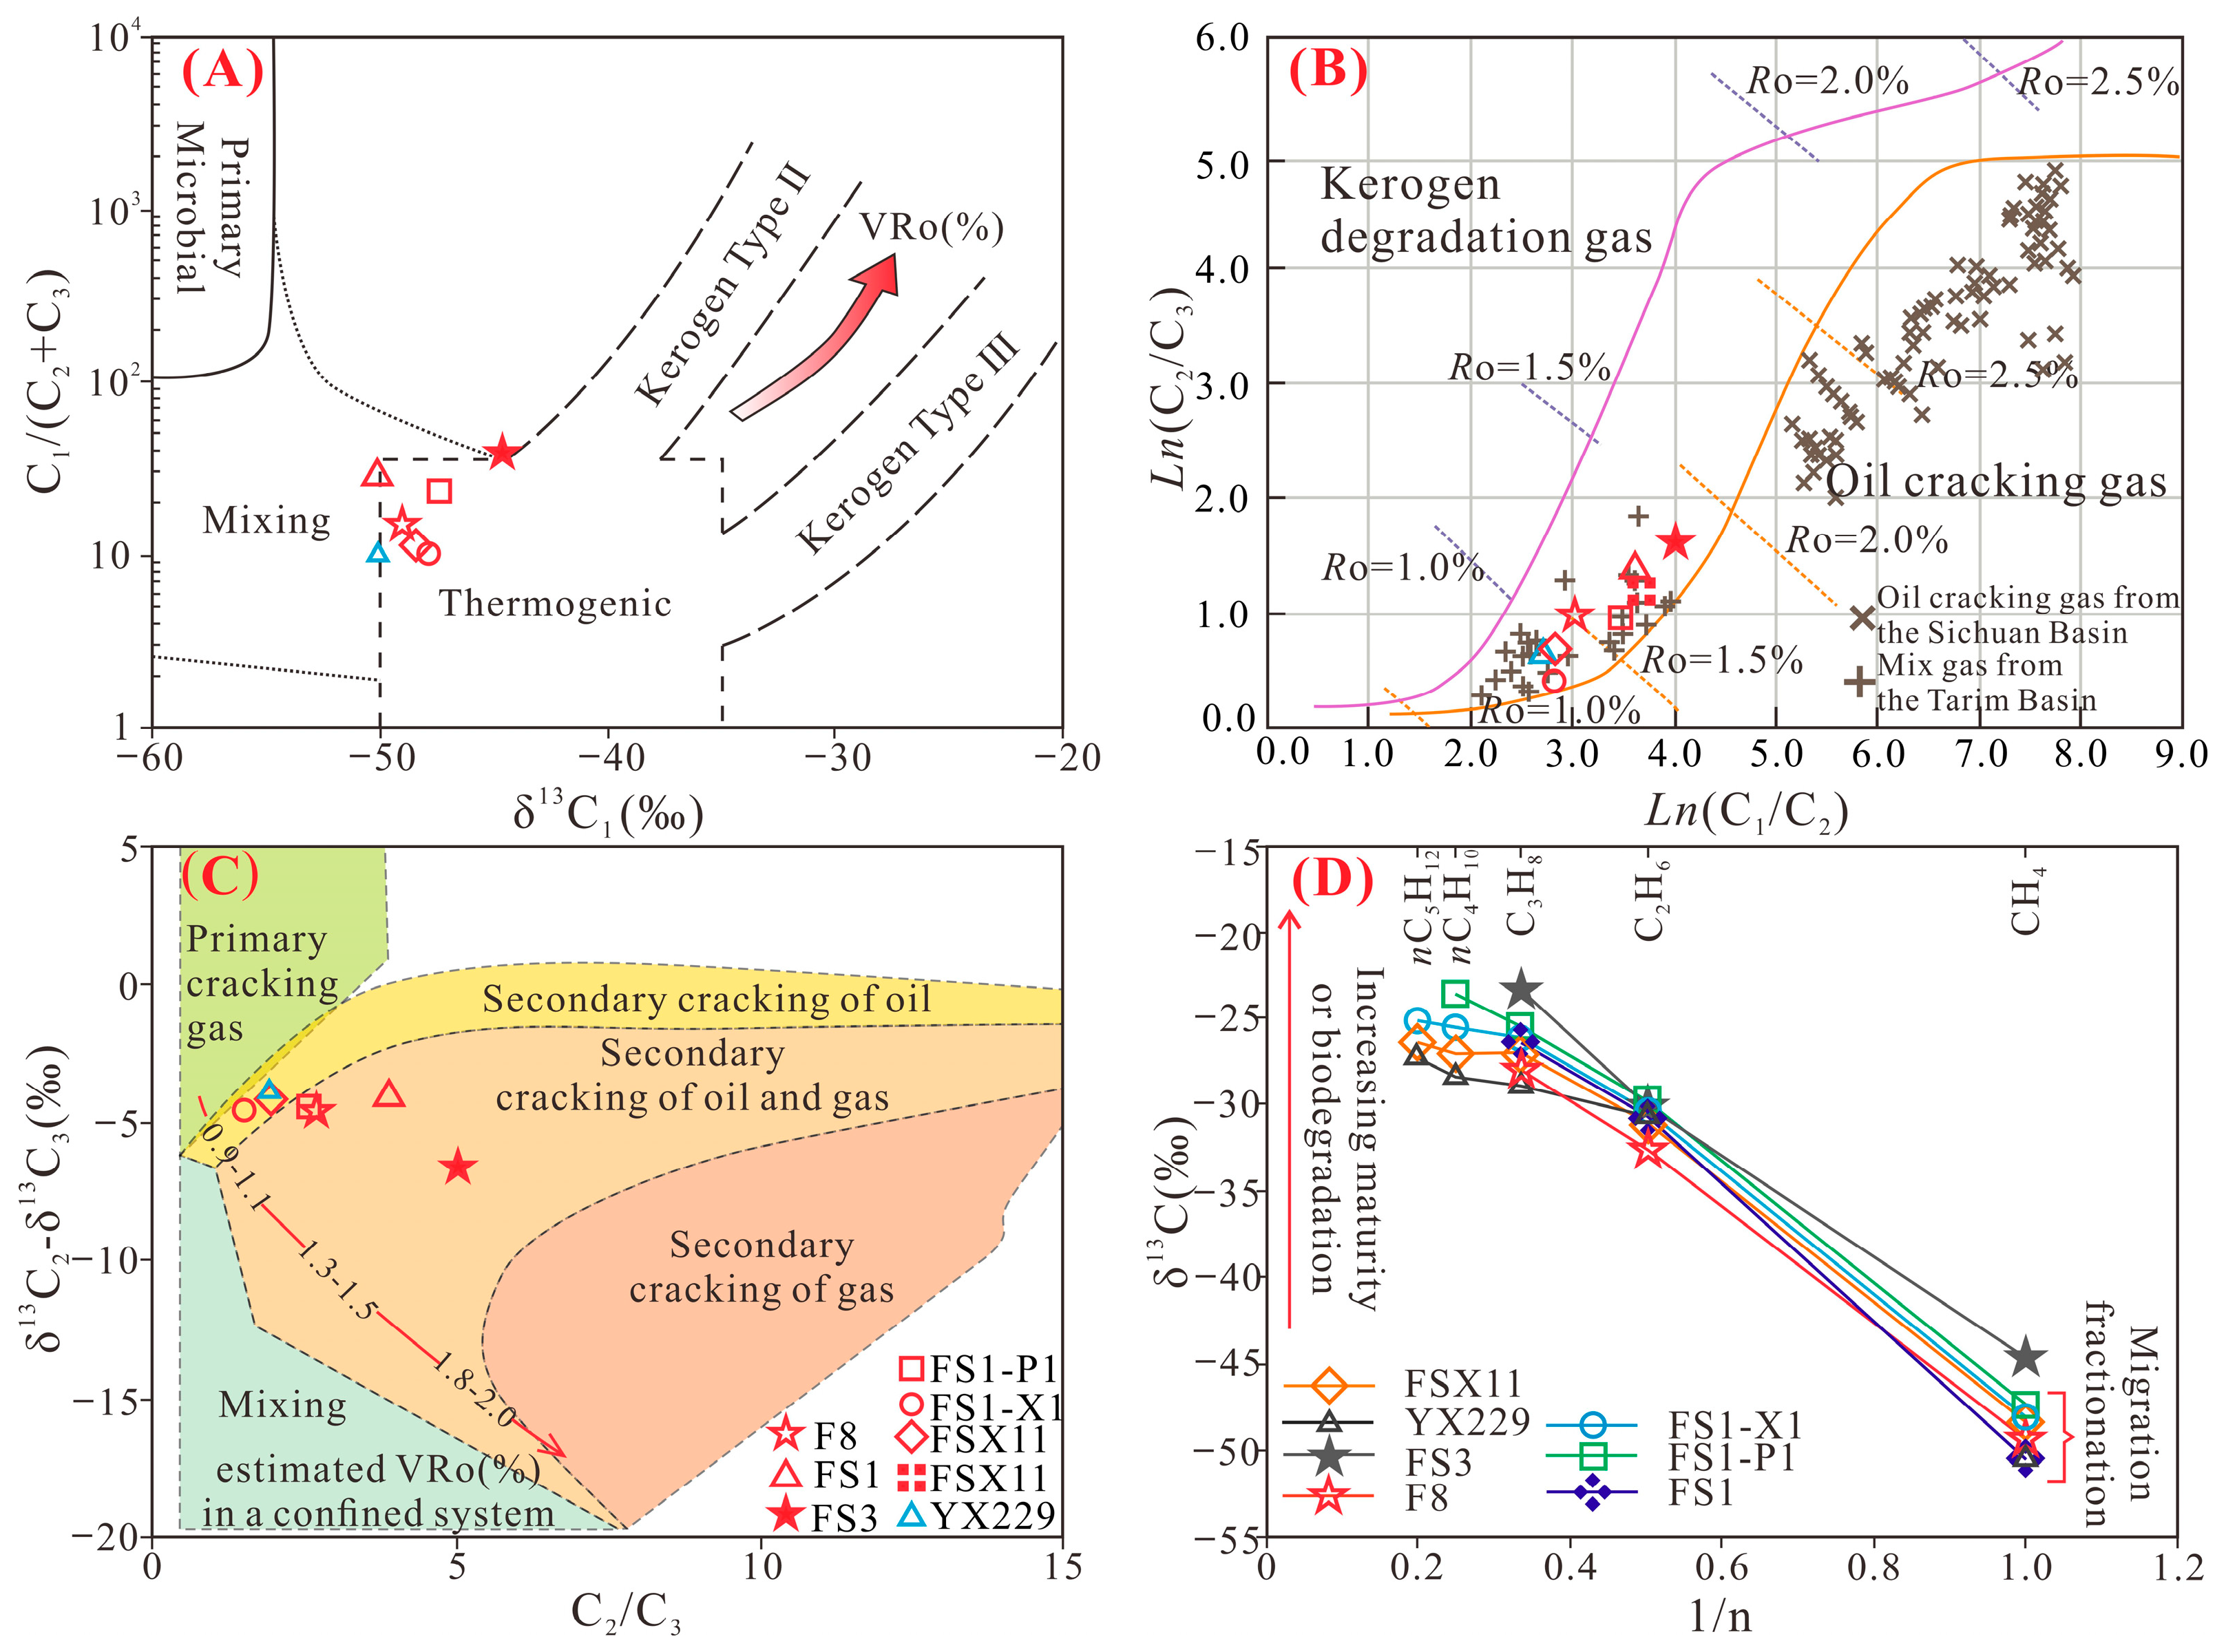
5.1. Genesis and Migration Fractionation of Natural Gas

Natural gas comprises two types: thermogenic and microbial. Microbial gas results from organic matter degradation at temperatures below 80 °C, while thermogenic gas forms when organic matter thermally matures at temperatures above 65 °C [51,52]. Qiao et al. (2022) found that the reservoir temperature exceeded 140 °C during two petroleum charging periods in the northern part of the Dongying Depression [35]. This indicates that the area is mainly thermogenic gas. This is further supported by the δ13C1 versus C1/(C2 + C3) cross-plot, which predominantly places the sample points within the thermogenic zone (Figure 8A).
Li et al. (2017) used measured natural gas data and experimental simulations to introduce a cross-plot of Ln (C1/C2) versus Ln (C2/C3) for distinguishing oil cracking gas from kerogen degradation gas at high maturity [53]. The gas samples exhibit Ln (C1/C2) and Ln (C2/C3) ratios ranging from 2.71 to 3.99 and 0.43 to 1.65, respectively. These values position the natural gas samples in the transitional zone between kerogen degradation gas and oil cracking gas (Figure 8B), indicating that they likely represent a mixture of late oil-cracking gas and early associated gas generated from organic matter.
Natural gas types can be distinguished using δ13C213C3 versus C2/C3 cross-plots, including primary gas cracking, secondary oil cracking, secondary oil and gas cracking, and secondary gas cracking [54]. The gas samples from Wells FS1-X1, FSX11, and YX229 align with the zone of secondary oil cracking, while samples from Wells FS3, FS1, F8, and FS1-P1 are situated in the zone of secondary oil and gas cracking, indicating a higher maturity (Figure 8C). The equivalent vitrinite reflectance (EqVRo) distribution of gas in this area ranges from 0.9% to 1.5%.
Differences in δ13C1–5 fractionation rates cause enrichment of low-molecular-weight isotopes as migration distance increases, leading to carbon isotope migration fractionation [55,56]. Generally, methane undergoes more pronounced carbon isotope fractionation during migration compared to C2–5 gas [57]. Cross-plots of carbon isotopes and the reciprocal of carbon number for natural gas (Figure 8D) reveal that the majority of samples exhibit a “convex type” distribution of methane isotopes, ranging from −50.4‰ to −47.4‰, indicating significant influence from migration fractionation [16]. Only the FS3 well exhibits a “concave type” isotope distribution, with the heaviest methane isotope value of −44.66‰. This divergence is attributed to the FS3 well’s depth of 4753 m, proximity to the source rock, and higher formation temperature, which have a greater impact on its isotope [58,59].
Furthermore, the analysis of other natural gas parameters, including the dryness coefficient, methane carbon isotope, and gas–oil ratio, reveals a depth-related decrease, indicating the presence of migration fractionation during the upward migration of natural gas (Figure 9 and Table 5) [20]. The phases of petroleum transition from deep to shallow include the gas phase, unsaturated condensate phase, and saturated condensate phase. During petroleum migration, the relevant parameters show corresponding changes: methane terminal enrichment and carbon isotope fractionation.

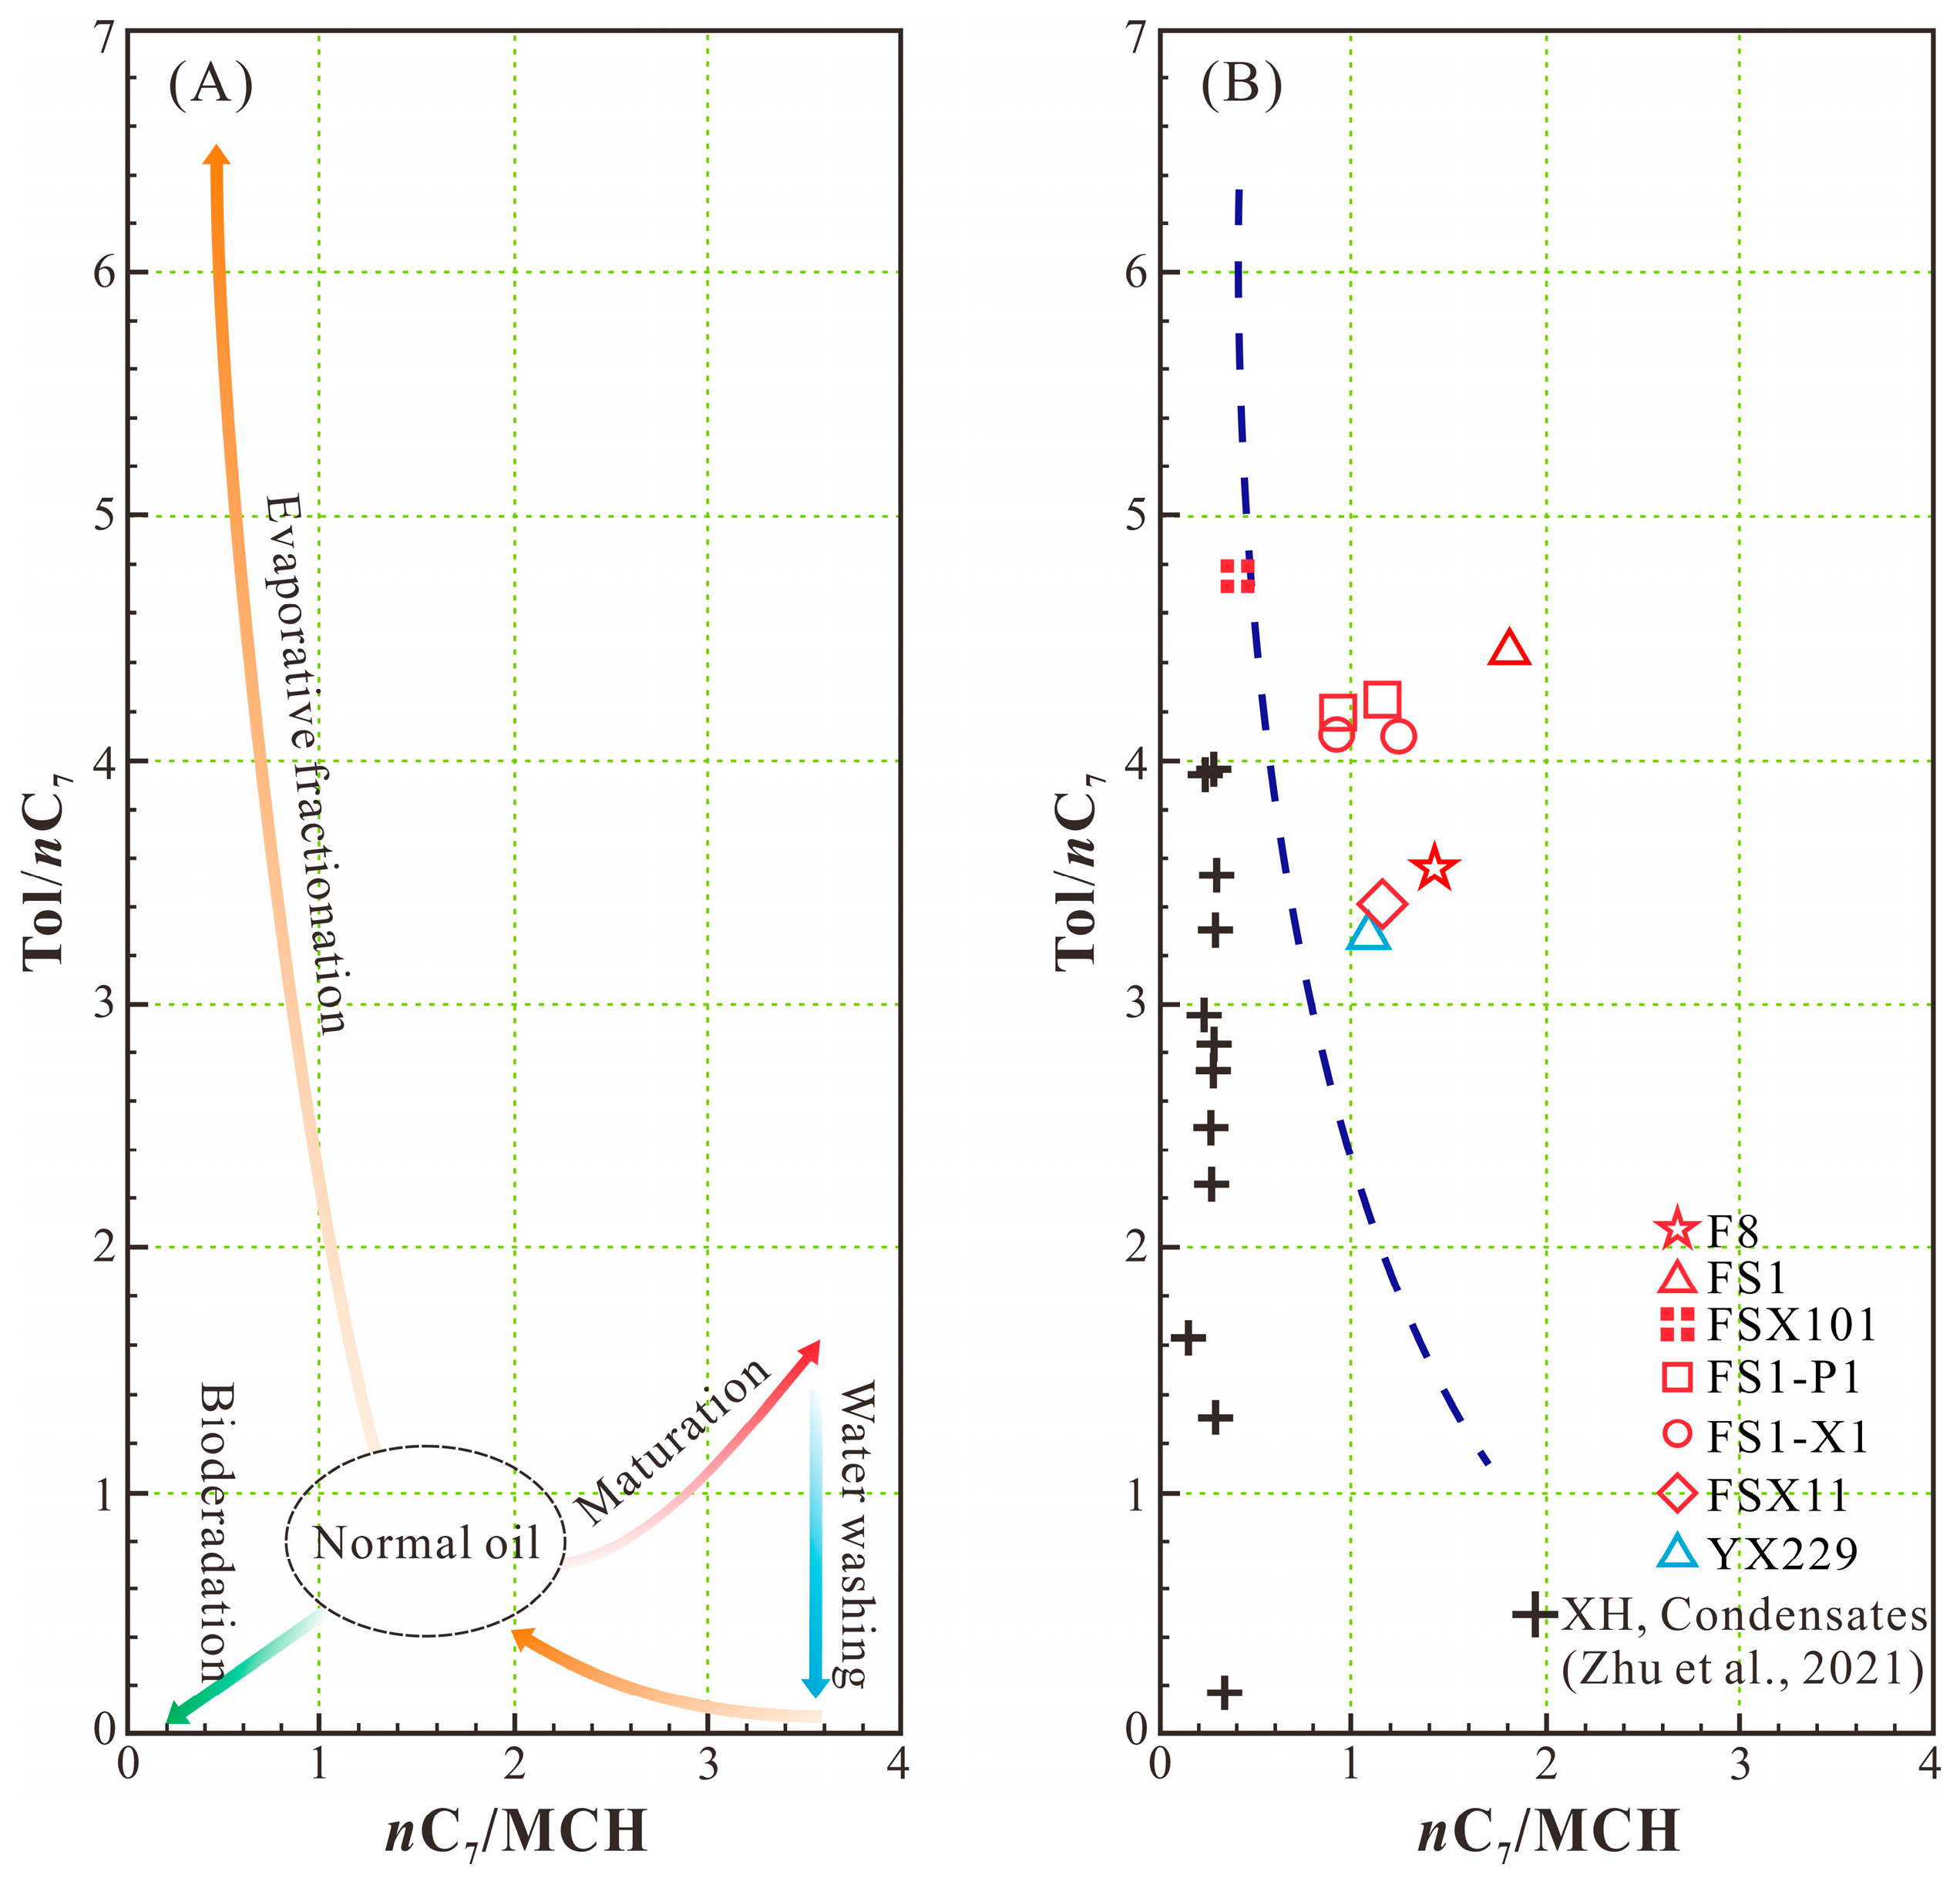
5.2. Evaporative Fractionation on the Oil

In the process of evaporative fractionation, medium and light oil components migrate out of the reservoir with the gas phase, leaving behind enriched heavy components in the residual oil. Normally, the carbon number distribution of n-alkanes in oil follows a linear pattern with the logarithm of the molar concentration of n-alkanes in the absence of evaporative fractionation [60]. Nevertheless, Figure 10 illustrates a substantial depletion of light n-alkanes, signaling evident evaporative fractionation in the reservoir.
Simulation experiments and geological sample analyses reveal that residual oil following evaporative fractionation exhibits a high aromatic index and a low paraffin index [2]. Thompson (1987) introduced a B-F model diagram (Figure 11A) that utilizes aromatic index (B, Tol/nC7) and paraffin index (F, nC7/MCH) to characterize diverse secondary actions in petroleum reservoirs, considering the impact of thermal maturity, biodegradation, and washing on these parameters [2]. The analyzed oil samples exhibit nC7/MCH values ranging from 0.92 to 1.83, averaging 1.13, and Tol/nC7 values ranging from 3.29 to 4.75, averaging 4.01 (Figure 11B, Table 3). In comparison to the analysis of condensate samples from the Xihu Depression in eastern China, an area with a similar geological background to the study site and known for significant evaporative fractionation, it can be concluded that the oil samples in this study have also experienced noticeable evaporative fractionation.

5.3. Evaporative Fractionation on the Oil

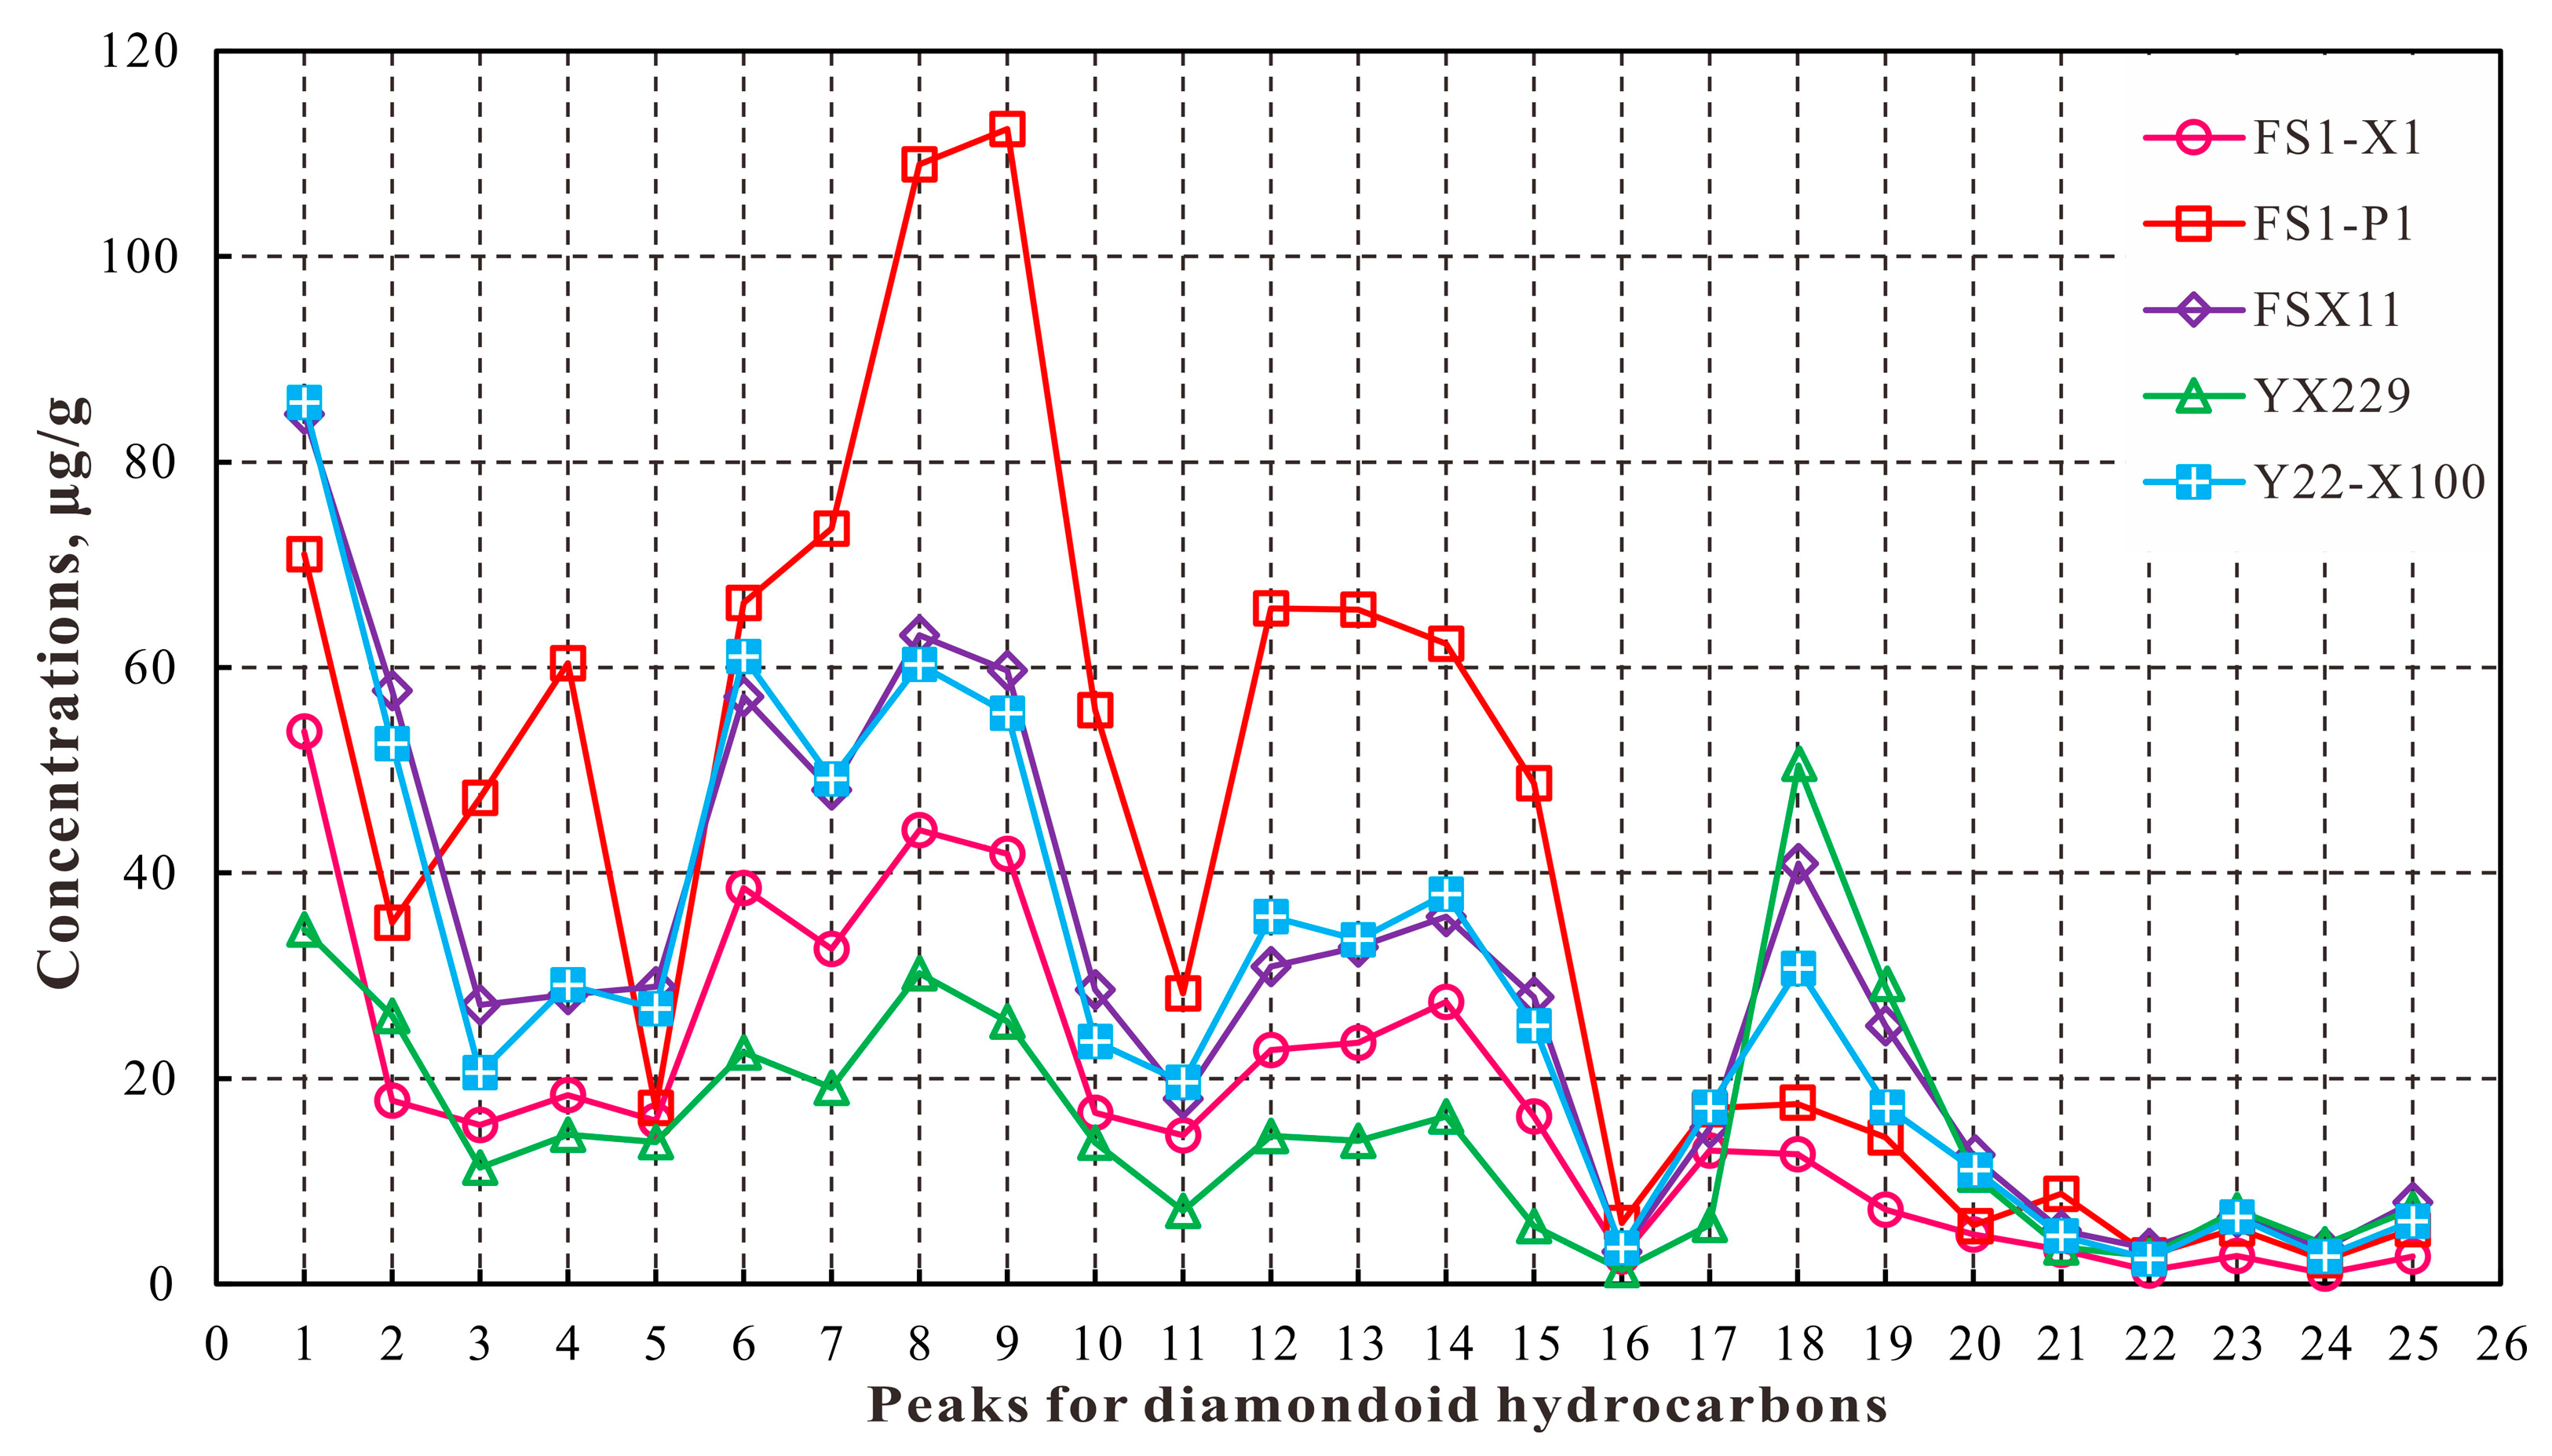
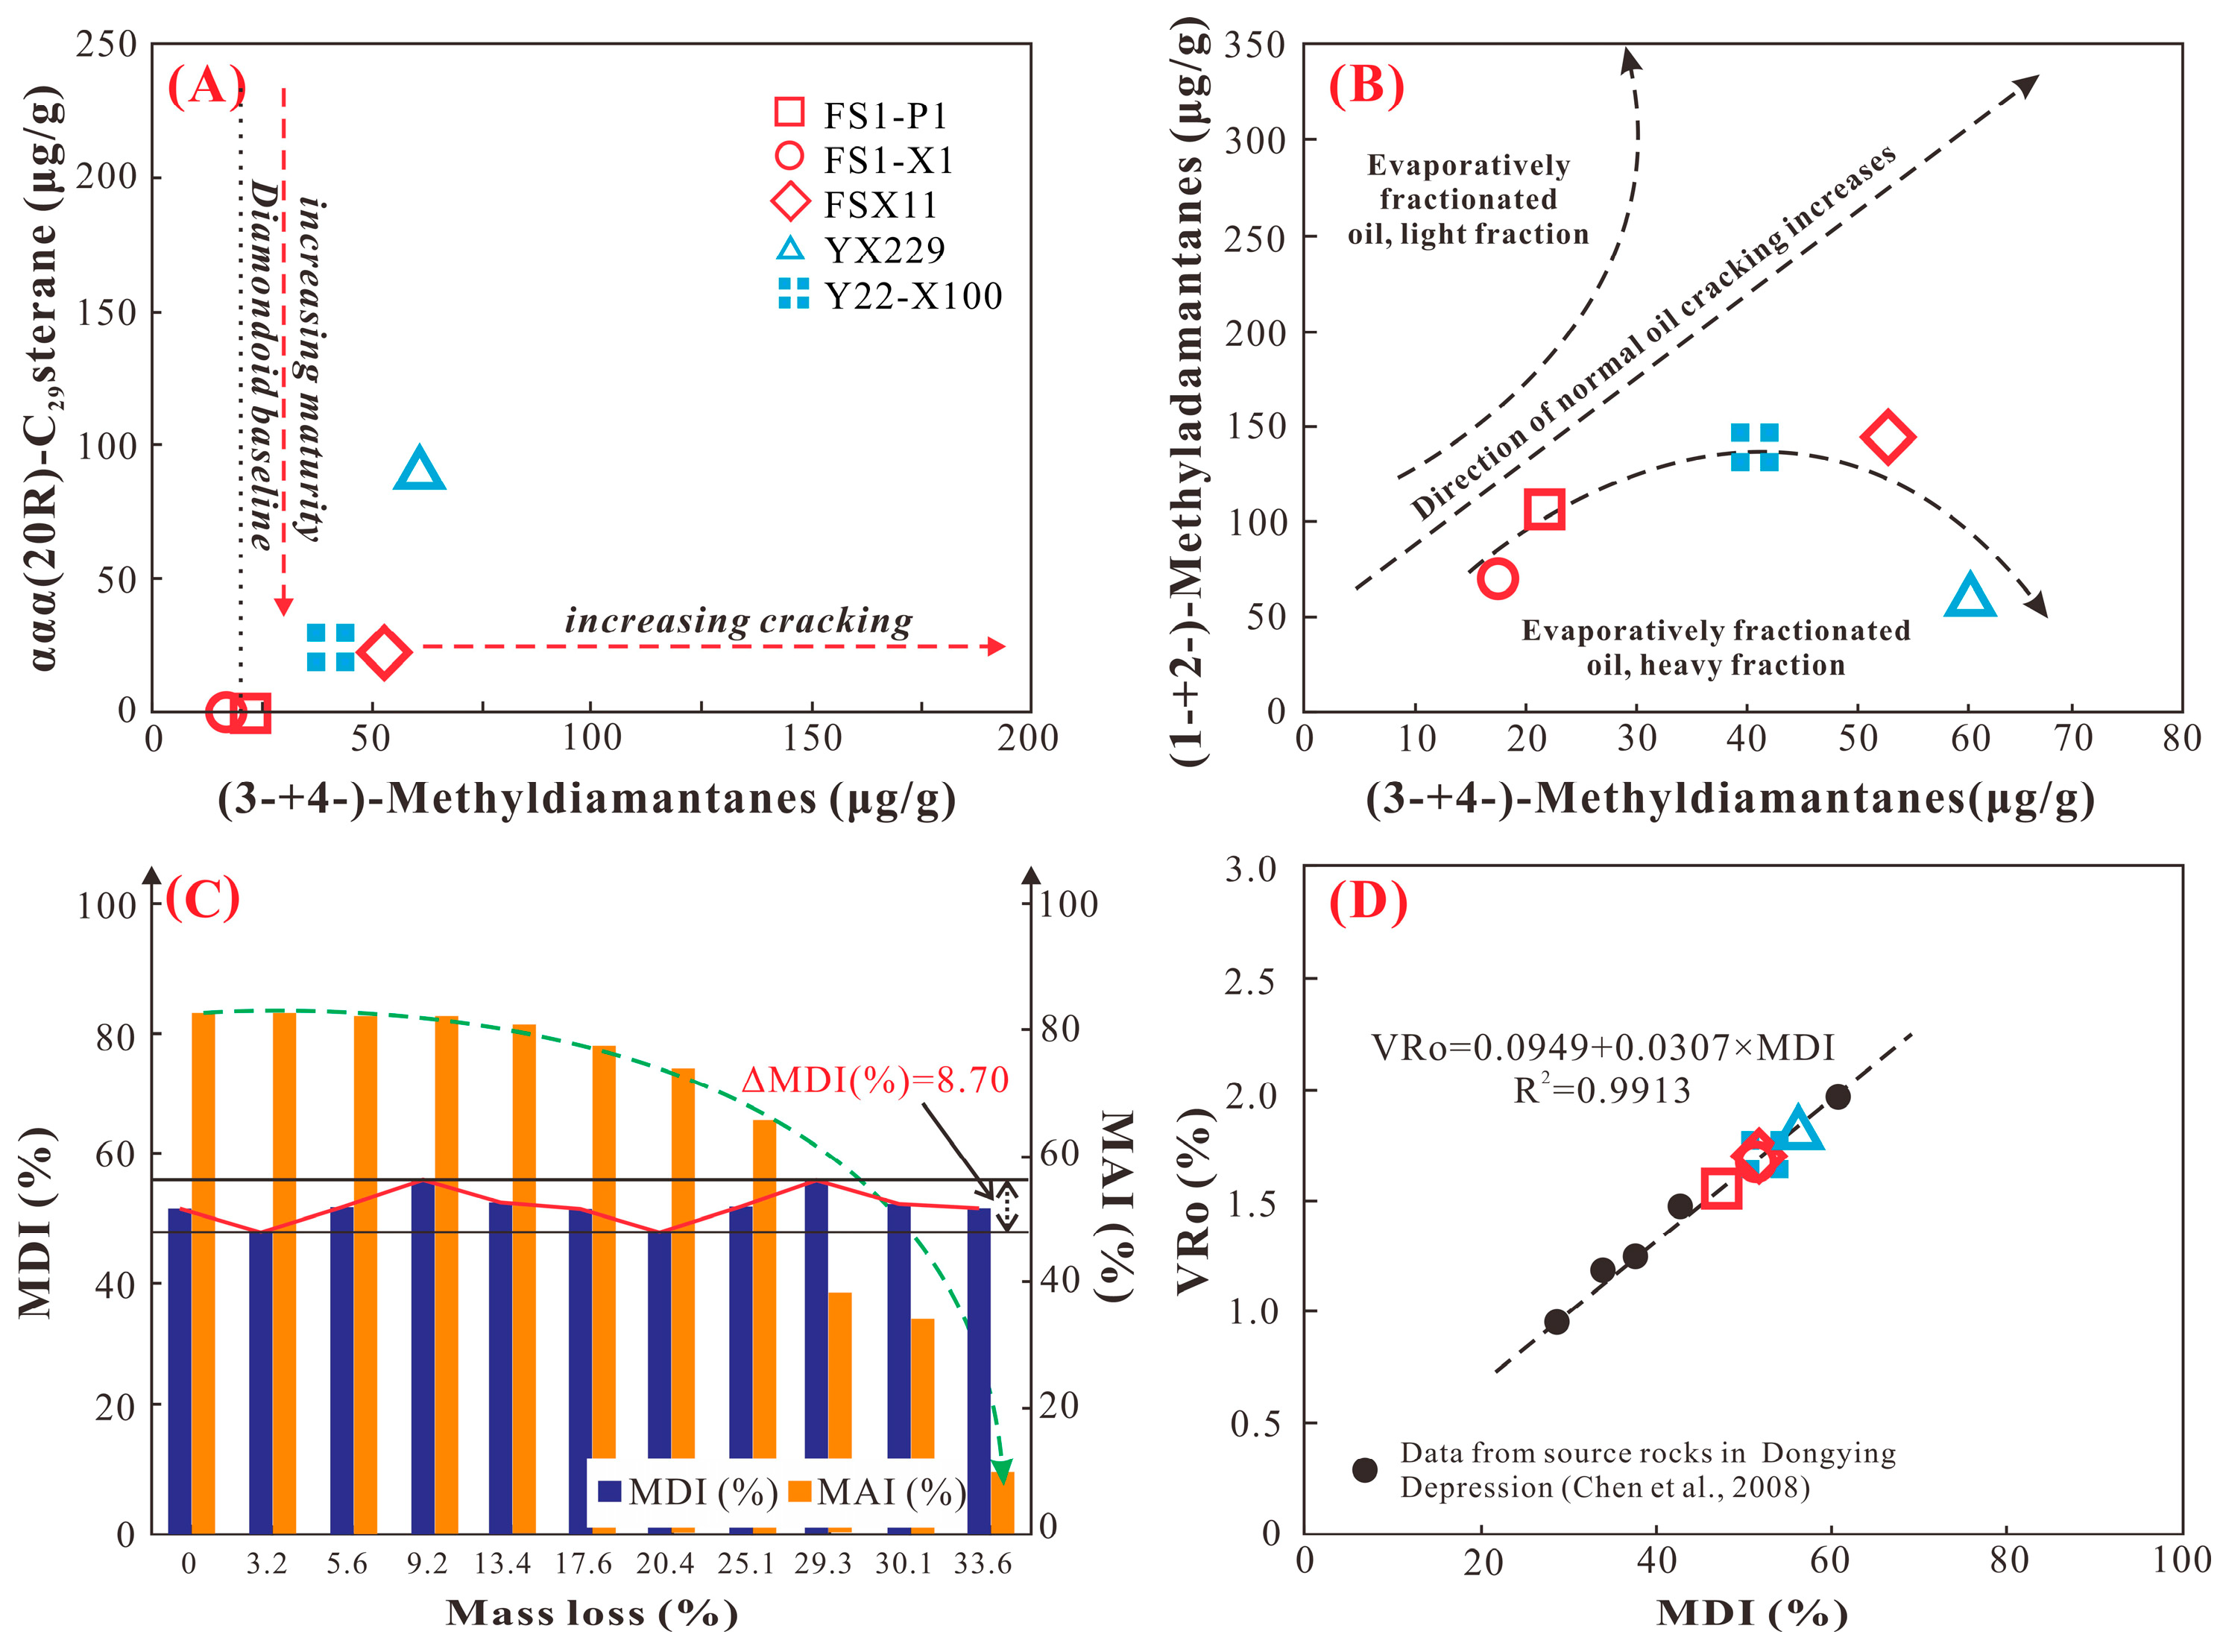
5.3.1. Effect of Evaporative Fractionation on the Diamondoid Concentrations

Diamondoids, characterized by their robust thermal stability owing to their unique carbon skeleton structures, find extensive utility in assessing oil maturity and cracking levels [61,62,63,64,65,66].
Dahl et al. (1999) noted that the concentration of 3- + 4-methyldiamantane (MD) increases with increased thermal cracking [63]. They utilized a cross-plot correlating 3- + 4-MD concentration versus ααα(20R)-C29 sterane concentration to evaluate oil cracking. In this cross-plot, the YX229 volatile oil exhibits a 3- + 4-MD concentration of 60.64 μg/g, higher than that of condensate from deeper reservoirs (Figure 12A). This phenomenon may be related to evaporative fractionation, supported by recent studies showing its significant impact on diamondoid concentrations in oil. During evaporative fractionation, diamondoids in the oil migrate out with light hydrocarbons [17,18,65,67]. Moldowan et al. (2015) found that oil without evaporative fractionation maintains a consistent ratio of 1- + 2-methyladamantane (MA) to 3- + 4-MD [65]. However, during evaporative fractionation, the gas carries more 1- + 2-MA than 3- + 4-MD as it escapes from the oil reservoirs and migrates. As shown in Figure 12B, FS1-X1 and FS1-P1 oils have ratios within the normal range of (1- + 2-MA) to (3- + 4-MD), while FSX11, YX229, and Y22-X100 show deviations, with YX229 having the most significant deviation. This suggests that the FS1-P1 oil reservoir, being deeper and closer to the source rocks, experienced the strongest evaporative fractionation, resulting in a lower concentration of diamondoid molecules.

5.3.2. Effect of Evaporative Fractionation on the Diamondoid Ratios

Chen et al. (1996) introduced the methyldiamondoid index (MAI) defined as 100 × 1-MA/[1-MA + 2-MA] and the methyldiamondoid index (MDI) defined as 100 × 4-MD/[1-MD + 3-MD + 4-MD] to serve as maturity indicators for highly mature oil [61]. They also established quantitative relationships between these indices and vitrinite reflectance (VRo). Subsequent studies have demonstrated the greater reliability of MDI during thermal evolution [69,70].
Li et al. (2014) conducted experiments related to evaporative fractionation in condensate reservoirs [67]. They calculated MAI and MDI values based on these experiments. The results revealed that MAI values decreased gradually with increasing levels of evaporative fractionation, whereas MDI values exhibited minor fluctuations (±8.7%) during the entire evaporative fractionation experiment (Figure 12C). Chen et al. (2008), in their examination of deep source rock samples from the Dongying Depression, established a correlation between MDI and vitrinite reflectance [68]. According to this relationship, the EqVRo values of the oil samples in this study fall within the range of 1.55–1.82% (Figure 12D), indicating their high maturity.

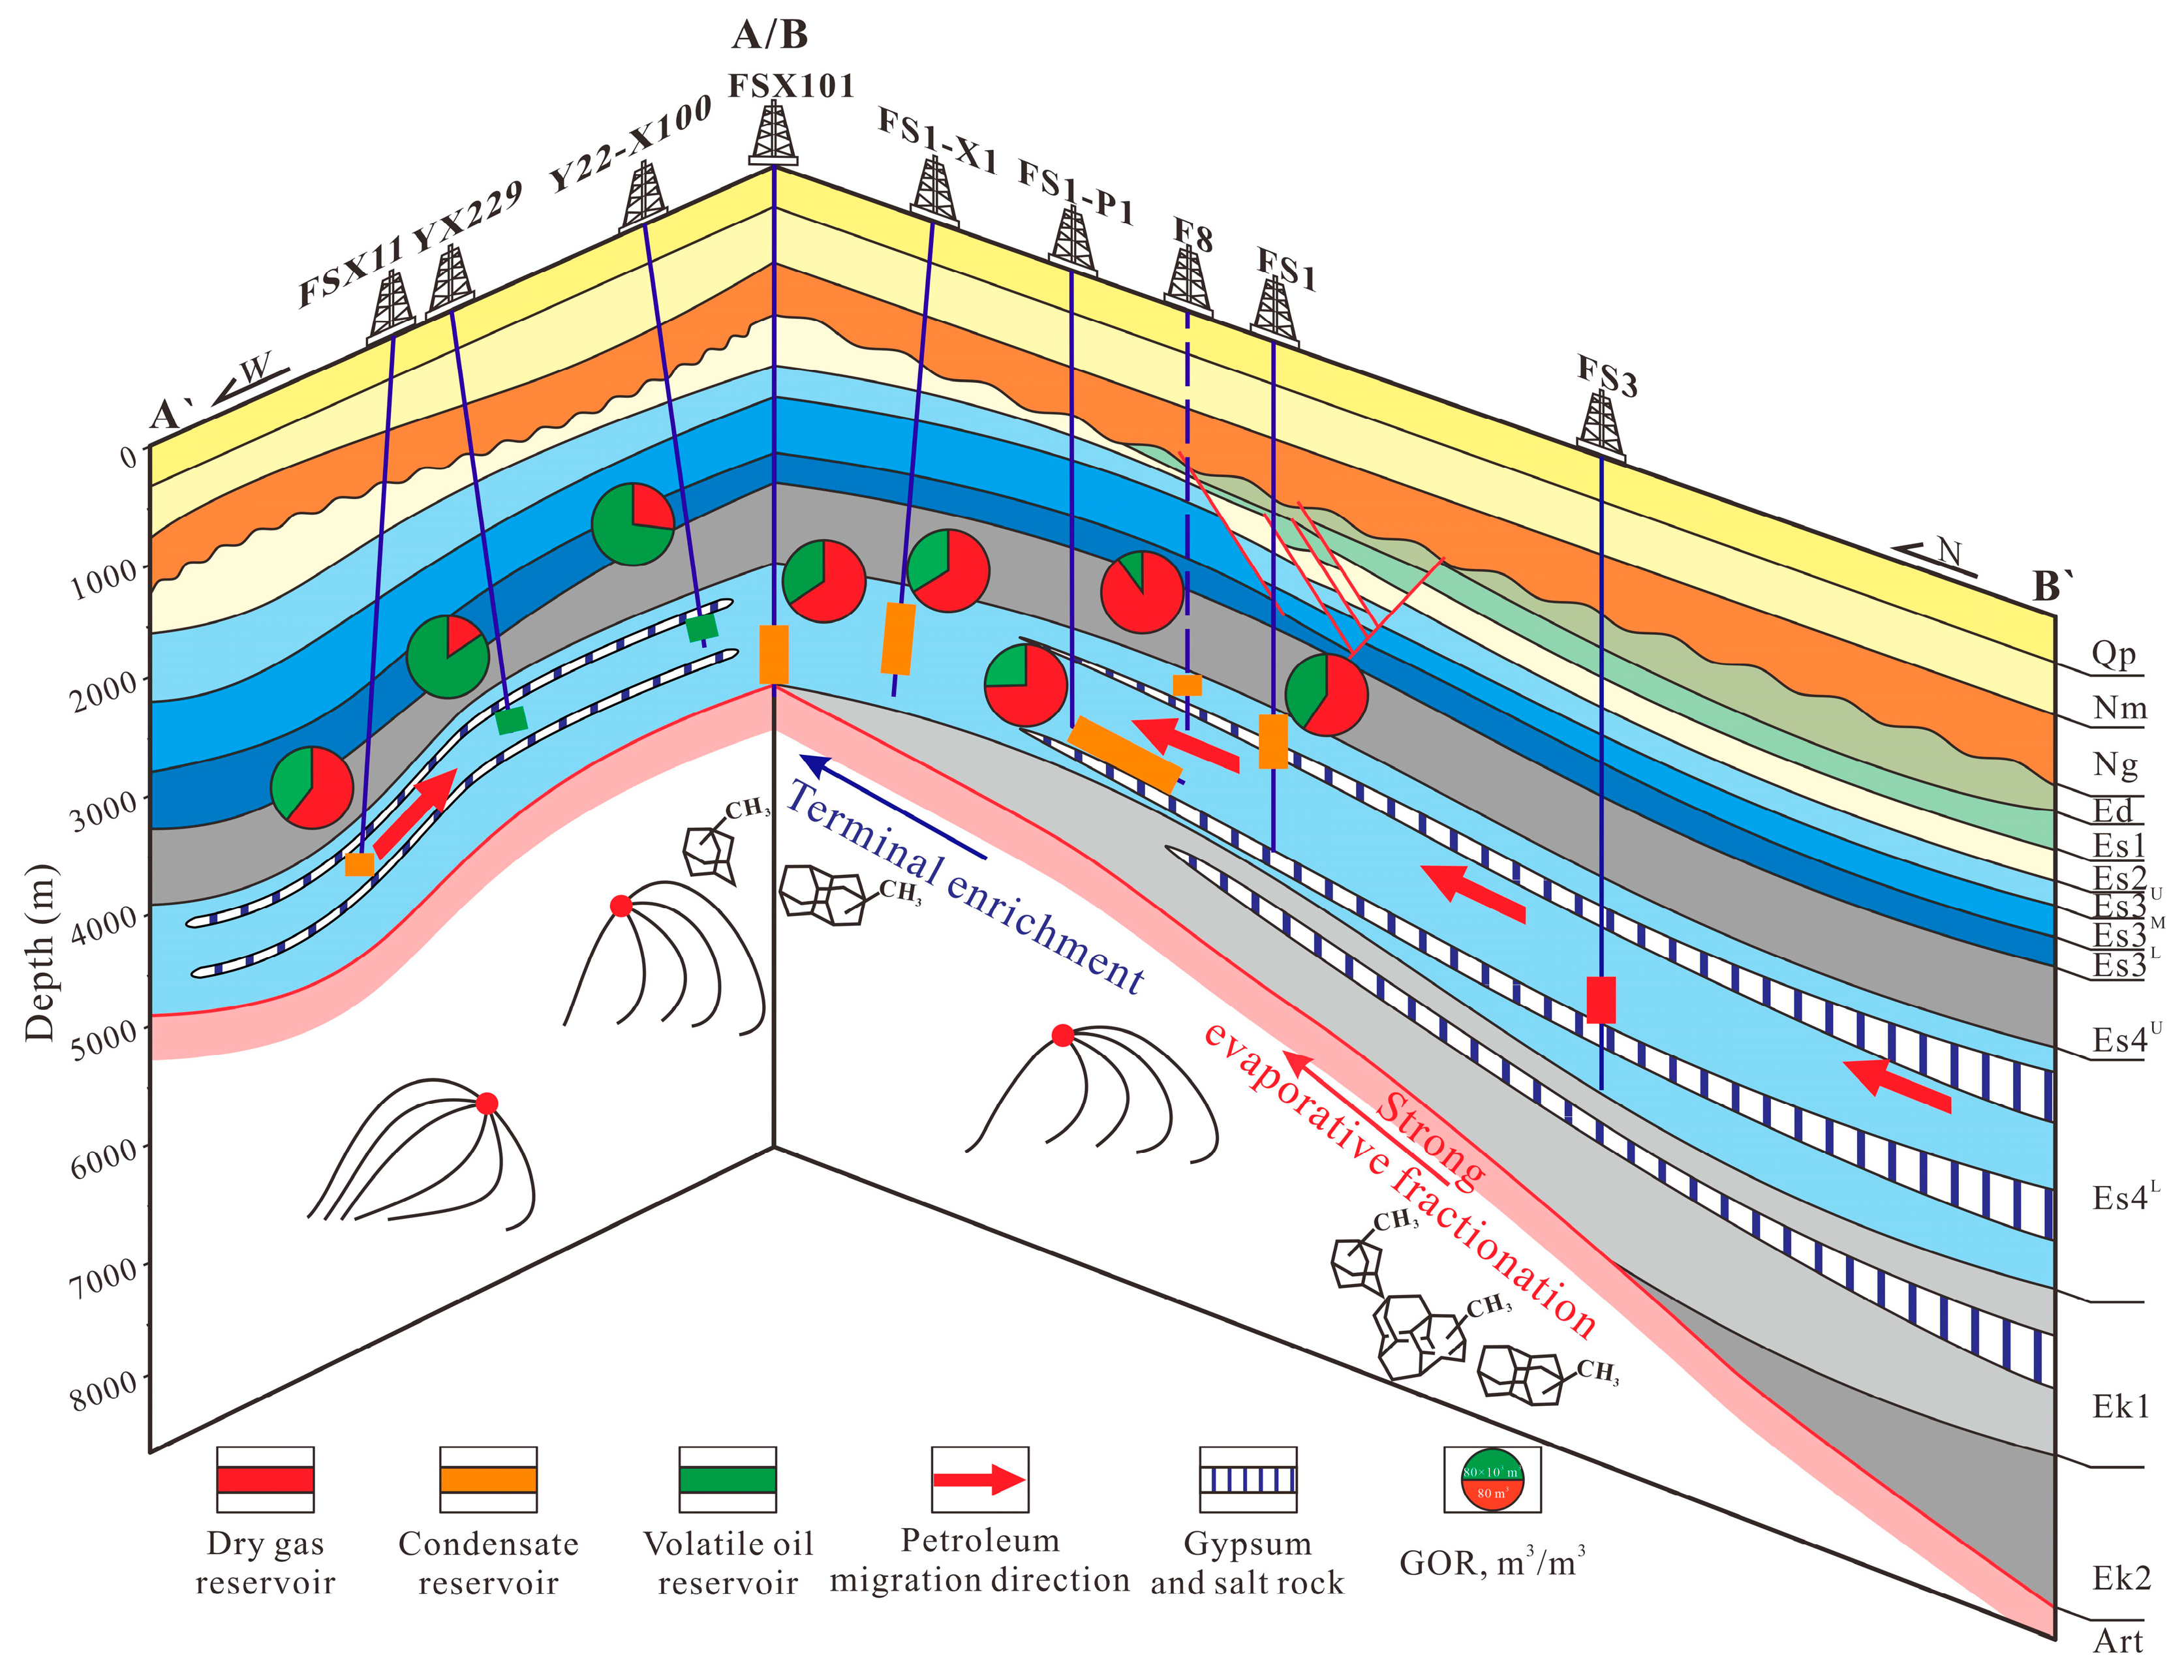
5.4. Genesis of Light Petroleum Reservoir in Dongying Depression

The mudstone in the Es4L of this study area primarily consists of types I and II organic matter, indicating a high potential for hydrocarbon generation [36]. It was suggested that the reservoir has undergone two oil filling events: the early filling of large amounts of petroleum when the source rocks enter the oil generation window and the late filling of high-maturity gas formed by the cracking of oil in deep reservoirs [35]. Drawing from previous petroleum research in the northern Dongying Depression, the genesis and accumulation patterns of various petroleum reservoir types in this region are summarized as follows:
Deep Dry Gas Reservoir: As reservoir depth and temperature increase, profound oil cracking occurs in deep reservoirs, generating a significant volume of highly mature oil cracking gas. Simultaneously, deep source rocks enter a high maturity stage, releasing a relatively smaller amount of highly mature kerogen pyrolysis gas. The combination of these two gas types gives rise to typical dry gas reservoirs, as exemplified by well FS3 (Figure 13A,B①). Methane exhibits a δ13C value of −44.7‰ and a methane percentage of 95.2%, indicating dry gas that has undergone substantial thermal cracking and fractionation. Severe oil cracking primarily governs its formation.
Deep Volatile and Condensate Reservoirs: Oil-cracking gas from deep reservoirs migrates into shallower oil reservoirs through fractures, resulting in the formation of light oil reservoirs (Figure 13A,B②–④). Variations in burial depth, associated pressure, and temperature give rise to the transformation of these oil reservoirs into condensate and volatile oil reservoirs. For example, F8 represents a condensate reservoir formed along a fault (Figure 13A,B②). It exhibits a CH4 percentage of 81.5%, a δ13CH4 value of −49.1‰, and an oil density of 0.72 g/cm3 (20 °C). FS1-P1 is another condensate reservoir formed along carry beds (Figure 13A,B③) with a CH4 percentage of 78.6%, a δ13CH4 value of −47.4‰, and an oil density of 0.82 g/cm3 (20 °C). YX229 represents a volatile oil reservoir (Figure 13A,B④) with a CH4 percentage of 69.1%, a δ13CH4 value of −50.2‰, and an oil density of 0.82 g/cm3 (20 °C).
Normal Oil Reservoir: Crude oil generated within the oil window migrates into traps, forming reservoirs with limited or no influence from gas intrusion or fractionation caused by deep oil cracking gas (Figure 13A,B⑤). An illustration of this is well Y228, situated at a depth of 4200 m and exhibiting an oil density of 0.84 g/cm3 (20 °C).
Heavy Oil Reservoir: Crude oil migrates along the filling pathway into shallow traps, accompanied by processes like strata uplift, denudation, biodegradation, oxidation, and water washing. These shallow traps cause the loss of LMWH, resulting in the thickening of crude oil (Figure 13A,B⑥). For example, the FS5 well exhibits an oil density of 1.47 g/cm3 (20 °C).
Shallow Gas Reservoirs: Shallow depths may give rise to shallow biogenic natural gas reservoirs. Additionally, poor preservation conditions within normal petroleum reservoirs can lead to natural gas leakage and migration to shallow traps, forming gas reservoirs. Tectonic uplift can reduce formation pressure, causing natural gas to be released from the original reservoir and migrate to shallow traps (Figure 13A,B⑦).

6. Conclusions

Analysis of molecular and stable isotopic compositions indicates that the gas primarily comprises late-filling oil-cracking gas, with a mixture of oil-associated gas generated during the source rock’s “oil window” maturity. Methane exhibits a δ13C range of −50.4‰ to −44.7‰, averaging −48.3‰. As natural gas migrated from deep to shallow, significant migration fractionation occurred, resulting in a consistently low δ13C value.
Conventional biomarker analysis indicates a 20S/(20S + 20R) isomer distribution of C29 steranes ranging from 0.55 to 0.57, signifying the attainment of thermal equilibrium and high oil maturity. The comparable contents of C27 and C29 steranes suggest a mixed source of terrestrial and aquatic organic matter. Further analysis of light hydrocarbon parameters (Tol/nC7, nC7/MCH) and the molar percentage of n-alkanes reveals the occurrence of evaporative fractionation in the hydrocarbon reservoirs of this region.
Analysis reveals that evaporative fractionation significantly impacts diamondoid concentrations. As evaporative fractionation intensifies, owing to differing gas solubilities between 1- + 2-MA and 3- + 4-MD, a substantial proportion of 1- + 2-MA migrates and re-aggregates, resulting in a relatively higher 3- + 4-MD concentration in the original reservoirs. This process leads to the formation of accumulations with elevated levels of 1- + 2-MA and 3- + 4-MD in certain relatively shallow reservoirs. Methyladamantane index (MAI) values decrease during evaporative fractionation, whereas the Methyldiamantane index (MDI) remains relatively stable. This indicates that MAI cannot be applied to evaluate oil maturity under the influence of strong evaporative fractionation. However, MDI can effectively evaluate oil maturity.
This study underscores the critical role of evaporative fractionation in the formation of deep condensate and volatile oil reservoirs. This is highly significant for deep and ultra-deep petroleum exploration.

Author Contributions

Conceptualization, R.Q. and Z.C.; methodology, R.Q.; software, R.Q. and D.Z.; validation, H.X.; formal analysis, R.Q.; investigation, D.Z.; resources, Z.C.; data curation, R.Q.; writing—original draft preparation, R.Q.; writing—review and editing, R.Q. and M.L.; visualization, M.L.; supervision, Z.C. and M.L.; project administration, Z.C.; funding acquisition, Z.C. All authors have read and agreed to the published version of the manuscript.

Funding

This work was funded by the National Natural Science Foundations of China (Grant No. 41972148).

Data Availability Statement

The original contributions presented in the study are included in the article. Further inquiries can be directed to the corresponding authors.

Conflicts of Interest

The authors declare no conflicts of interest.

References

  1. Nissenbaum, A.; Goldberg, M.; Aizenshtat, Z. Immature condensate from southeastern Mediterranean coastal plain, Israel. AAPG Bull. 1985, 69, 46–949. [Google Scholar]
  2. Thompson, K.F.M. Fractionated aromatic petroleums and the generation of gas-condensates. Org. Geochem. 1987, 11, 573–590. [Google Scholar] [CrossRef]
  3. Wever, H.E. Petroleum and Source Rock Characterization Based on C7 Star Plot Results: Examples from Egypt. AAPG Bull. 2000, 84, 1041–1054. [Google Scholar]
  4. Isaksen, G.H. Central North Sea hydrocarbon systems: Generation, migration, entrapment, and thermal degradation of oil and gas. AAPG Bull. 2004, 88, 1545–1572. [Google Scholar] [CrossRef]
  5. Saller, A.; Lin, R.; Dunham, J. Leaves in turbidite sands: The main source of oil and gas in the deep-water Kutei Basin, Indonesia. AAPG Bull. 2006, 90, 1585–1608. [Google Scholar] [CrossRef]
  6. Wang, Q.; Hao, F.; Niu, C.; Zou, H.; Miao, Q.; Yin, J.; Cao, Y.; Liu, M. Origins and deep petroleum dynamic accumulation in the southwest part of the Bozhong depression, Bohai Bay Basin: Insights from geochemical and geological evidences. Mar. Pet. Geol. 2021, 134, 105347. [Google Scholar] [CrossRef]
  7. Dow, W.G. Kerogen studies and geological interpretations. J. Geochem. Explor. 1977, 7, 79–99. [Google Scholar] [CrossRef]
  8. Tissot, B.P.; Welte, D.H. Petroleum Formation and Occurrence, 2nd ed.; Springer: Berlin/Heidelberg, Germany; New York, NY, USA, 1984. [Google Scholar]
  9. Snowdon, L.R.; Powell, T.G. Immature Oil and Condensate—Modification of Hydrocarbon Generation Model for Terrestrial Organic Matter. AAPG Bull. 1982, 66, 775–788. [Google Scholar]
  10. Connan, J.; Cassou, A.M. Properties of gases and petroleum liquids derived from terrestrial kerogen at various maturation levels. Geochim. Cosmochim. Acta 1980, 44, 1–23. [Google Scholar] [CrossRef]
  11. Horsfield, B.; Schenk, H.J.; Mills, N.; Welte, D.H. An investigation of the in-reservoir conversion of oil to gas: Compositional and kinetic findings from closed-system programmed-temperature pyrolysis. Org. Geochem. 1992, 19, 191–204. [Google Scholar] [CrossRef]
  12. Hill, R.J.; Tang, Y.; Kaplan, I.R. Insights into oil cracking based on laboratory experiments. Org. Geochem. 2003, 34, 1651–1672. [Google Scholar] [CrossRef]
  13. Hossain, M.A.; Suzuki, N.; Matsumoto, K.; Sakamoto, R.; Takeda, N. In-reservoir fractionation and the accumulation of oil and condensates in the Surma Basin, Ne Bangladesh. J. Pet. Geol. 2014, 37, 269–286. [Google Scholar] [CrossRef]
  14. Thompson, K.F.M. Gas-condensate migration and oil fractionation in deltaic systems. Mar. Pet. Geol. 1988, 5, 237–246. [Google Scholar] [CrossRef]
  15. Thompson, K.F.M. Aspects of petroleum basin evolution due to gas advection and evaporative fractionation. Org. Geochem. 2010, 41, 370–385. [Google Scholar] [CrossRef]
  16. Kotarba, M.J.; Bilkiewicz, E.; Więcław, D.; Radkovets, N.Y.; Koltun, Y.V.; Kowalski, A.; Kmiecik, N.; Romanowski, T. Origin and migration of oil and natural gas in the central part of the Ukrainian outer Carpathians: Geochemical and geological approach. AAPG Bull. 2020, 104, 1323–1356. [Google Scholar] [CrossRef]
  17. Zhu, X.; Chen, J.; Zhang, C.; Wang, Y.; Liu, K.; Zhang, T. Effects of evaporative fractionation on diamondoid hydrocarbons in condensates from the Xihu Sag, East China Sea Shelf Basin. Mar. Pet. Geol. 2021, 126, 104929. [Google Scholar] [CrossRef]
  18. Yu, Q.; Sun, P.; Cai, C.; Wang, D.; Peng, Y. Phase fractionation controlling regional distribution of diamondoids: A case study from the Halahatang oil field, Tarim Basin, China. Mar. Pet. Geol. 2022, 140, 105674. [Google Scholar]
  19. Zhang, Z.; Zhang, Y.; Zhu, G.; Han, J.; Cai, L. Variations of diamondoids distributions in petroleum fluids during migration induced phase fractionation: A case study from the Tazhong area, NW China. J. Pet. Sci. Eng. 2019, 179, 1012–1022. [Google Scholar] [CrossRef]
  20. Mehay, S.; Hashem, M.; Rouis, L.; Mollianiyazov, E.; Bennett, B.; Stankiewicz, A. Understanding lateral and vertical fluid variations in the Pliocene sandstone reservoirs in the eastern South Caspian Basin. AAPG Bull. 2021, 105, 2181–2205. [Google Scholar] [CrossRef]
  21. Huang, W.; Yu, S.; Zhang, H.; Xiao, Z.; Liu, D. Diamondoid fractionation and implications for the Kekeya condensate field in the Southwestern Depression of the Tarim Basin, NW China. Mar. Pet. Geol. 2022, 138, 105551. [Google Scholar] [CrossRef]
  22. Meulbroek, P.; Cathles, L.; Whelan, J. Phase fractionation at South Eugene Island Block 330. Org. Geochem. 1998, 29, 223–239. [Google Scholar] [CrossRef]
  23. Losh, S.; Walter, L.; Meulbroek, P.; Martini, A.; Cathles, L.; Whelan, J. Reservoir Fluids and Their Migration into the South Eugene Island Block 330 Reservoirs, Offshore Louisiana. AAPG Bull. 2002, 86, 1463–1488. [Google Scholar]
  24. Ulmishek, G.; Harrison, W. Oil and Gas Developments in USSR in 1982. AAPG Bull. 1983, 67, 1717–1722. [Google Scholar]
  25. Dzou, L.I.P. Kuparuk oil field, Alaska, a mixture of Kekiktuk gas condensate and Shublik oil. AAPG Bull. 2010, 94, 1761–1778. [Google Scholar] [CrossRef]
  26. Isaksen, G.H.; Patience, R.; Graas, G.V.; Jenssen, A.I. Hydrocarbon System Analysis in a Rift Basin with Mixed Marine and Nonmarine Source Rocks: The South Viking Graben, North Sea. AAPG Bull. 2004, 86, 557–591. [Google Scholar]
  27. Lerch, B.; Karlsen, D.A.; Abay, T.B.; Duggan, D.; Reinert Seland, R.; Backer-Owe, K. Regional petroleum alteration trends in Barents Sea oils and condensates as a clue to migration regimes and processes. AAPG Bull. 2016, 100, 165–190. [Google Scholar] [CrossRef]
  28. Jiang, W.; Li, Y.; Xiong, Y. Reservoir alteration of crude oils in the Junggar Basin, northwest China: Insights from diamondoid indices-ScienceDirect. Mar. Pet. Geol. 2020, 119, 104451. [Google Scholar] [CrossRef]
  29. Su, A.; Chen, H.; Zhao, J.; Zhang, T.; Feng, Y.; Wang, C. Natural gas washing induces condensate formation from coal measures in the Pinghu Slope Belt of the Xihu Depression, East China Sea Basin: Insights from fluid inclusion, geochemistry, and rock gold-tube pyrolysis. Mar. Pet. Geol. 2020, 118, 104450. [Google Scholar] [CrossRef]
  30. Gussow, W.C. Differential Entrapment of Oil and Gas: A Fundamental Principle. AAPG Bull. 1954, 38, 816–853. [Google Scholar]
  31. Silverman, S.R. Migration and Segregation of Oil and Gas. AAPG Bull. 1965, 49, 1766. [Google Scholar] [CrossRef]
  32. Larter, S.; Mills, N. Phase-controlled molecular fractionations in migrating petroleum charges. Geol. Soc. Lond. 1991, 59, 137–147. [Google Scholar] [CrossRef]
  33. Dzou, L.I.P.; Hughes, W.B. Geochemistry of oils and condensates K Field offshore Taiwan: A case study in migration fractionation. Org. Geochem. 1993, 20, 437–462. [Google Scholar] [CrossRef]
  34. Curiale, J.A.; Bromley, B.W. Migration induced compositional changes in oils and condensates of a single field. Org. Geochem. 1996, 24, 1097–1113. [Google Scholar] [CrossRef]
  35. Qiao, R.; Chen, Z.; Li, C.; Wang, D.; Gao, Y.; Zhao, L.; Li, U.; Liu, J. Geochemistry and accumulation of petroleum in deep lacustrine reservoirs: A case study of Dongying Depression, Bohai Bay Basin. J. Pet. Sci. Eng. 2022, 213, 110433. [Google Scholar] [CrossRef]
  36. Chen, Z.; Qiao, R.; Li, C.; Wang, D.; Gao, Y. Hydrocarbon generation potential and model of the deep lacustrine source rocks in the Dongying Depression, Bohai Bay Basin. Mar. Pet. Geol. 2022, 140, 105656. [Google Scholar] [CrossRef]
  37. Ping, H.; Chen, H.; Jia, G. Petroleum accumulation in the deeply buried reservoirs in the northern Dongying Depression, Bohai Bay Basin, China: New insights from fluid inclusions, natural gas geochemistry, and 1-D basin modeling. Mar. Pet. Geol. 2017, 80, 70–93. [Google Scholar] [CrossRef]
  38. Ping, H.; Chen, H.; Thiéry, R.; George, S.C. Effects of oil cracking on fluorescence color, homogenization temperature and trapping pressure reconstruction of oil inclusions from deeply buried reservoirs in the northern Dongying Depression, Bohai Bay Basin, China. Mar. Pet. Geol. 2017, 80, 538–562. [Google Scholar] [CrossRef]
  39. Qiao, R.; Chen, Z. Petroleum phase evolution at high temperature: A combined study of oil cracking experiment and deep oil in Dongying Depression, eastern China. Fuel 2022, 326, 124978. [Google Scholar] [CrossRef]
  40. Peters, K.E.; Moldowan, J.M.; McCaffrey, M.A.; Fago, F.J. Selective biodegradation of extended hopanes to 25-NHs in petroleum reservoirs. Insights from molecular mechanics. Org. Geochem. 1996, 24, 765–783. [Google Scholar] [CrossRef]
  41. Peters, K.E.; Walters, C.C.; Moldowan, J.M. The Biomarker Guide, 2nd ed.; Cambridge University Press: New York, NY, USA, 2005. [Google Scholar]
  42. Bennett, B.; Fustic, M.; Farrimond, P.; Huang, H.; Larter, S.R. 25-NHs: Formation during biodegradation of petroleum in the subsurface. Org. Geochem. 2006, 37, 787–797. [Google Scholar] [CrossRef]
  43. Volkman, J.K. A review of sterol markers for marine and terrigenous organic matter. Org. Geochem. 1986, 9, 83–99. [Google Scholar] [CrossRef]
  44. Hunt, J.M. Generation and migration of light hydrocarbons. Science 1984, 226, 1265–1270. [Google Scholar] [CrossRef] [PubMed]
  45. Hunt, J.M.; Huc, A.Y.; Whelan, J.K. Generation of light hydrocarbons in sedimentary rocks. Nature 1980, 288, 688–690. [Google Scholar] [CrossRef]
  46. Mango, F.D. An invariance in the isoheptanes of petroleum. Science 1987, 237, 514–517. [Google Scholar] [CrossRef] [PubMed]
  47. Mango, F.D. The origin of light hydrocarbons in petroleum: A kinetic test of the steady-state catalytic hypothesis. Geochim. Cosmochim. Acta 1990, 54, 1315–1323. [Google Scholar] [CrossRef]
  48. Whiticar, M.J. Carbon and hydrogen isotope systematics of bacterial formation and oxidation of methane. Chem. Geol. 1999, 161, 291–314. [Google Scholar] [CrossRef]
  49. Prinzhofer, A.; Girard, J.P.; Buschaert, S.; Huiban, Y.; Noirez, S. Chemical and isotopic characterization of hydrocarbon gas traces in porewater of very low permeability rocks: The example of the Callovo-Oxfordian argillites of the eastern part of the Paris Basin. Chem. Geol. 2009, 260, 269–277. [Google Scholar] [CrossRef]
  50. Pallasser, R.J. Recognising biodegradation in gas/oil accumulations through the d13C compositions of gas components. Org. Geochem. 2000, 31, 1363–1373. [Google Scholar] [CrossRef]
  51. Rice, D.D.; Claypool, G.E. Generation, accumulation, and resource potential of microbial gas. AAPG Bull. 1981, 65, 5–25. [Google Scholar]
  52. Schoell, M. Genetic characterization of natural gas. AAPG Bull. 1983, 67, 2225–2238. [Google Scholar]
  53. Li, J.; Li, Z.; Wang, X.; Wang, D.; Xie, Z. New indexes and charts for genesis identification of multiple natural gases. Pet. Explor. Dev. 2017, 44, 535–543. [Google Scholar] [CrossRef]
  54. Lorant, F.; Prinzhofer, A.; Behar, F.; Huc, A.Y. Carbon isotopic and molecular constraints on the formation and the expulsion of thermogenic hydrocarbon gases. Chem. Geol. 1998, 147, 249–264. [Google Scholar] [CrossRef]
  55. Galimov, E.M. Sources and mechanisms of formation of gaseous hydrocarbons in sedimentary rocks. Chem. Geol. 1998, 71, 77–95. [Google Scholar] [CrossRef]
  56. Xia, X.; Tang, Y. Isotope fractionation of methane during natural gas flow with coupled diffusion and adsorption/desorption. Geochim. Cosmochim. Acta 2012, 77, 489–503. [Google Scholar] [CrossRef]
  57. Prinzhofer, A.; Mello, M.R.; Freitas, L.C.; Takaki, T. New geochemical characterization of natural gas and its use in oil and gas evaluation. In Petroleum Systems of South Atlantic Margins; Mello, M.R., Katz, B.J., Eds.; AAPG Memoir: Tulsa, OK, USA, 2000; Volume 73, pp. 107–119. [Google Scholar]
  58. Chung, H.; Gormly, J.R.; Squires, R.M. Origin of gaseous hydrocarbons in subsurface environments: Theoretical considerations of carbon isotope distribution. Chem. Geol. 1988, 71, 91–103. [Google Scholar] [CrossRef]
  59. Galimov, E.M. Isotope organic geochemistry. Org. Geochem. 2006, 37, 1200–1262. [Google Scholar] [CrossRef]
  60. Kissin, Y.V. Catagenesis and composition of petroleum: Origin of n-alkanes and isoalkanes in petroleum crudes. Geochim. Et Cosmochim. Acta 1987, 51, 2445–2457. [Google Scholar] [CrossRef]
  61. Chen, J.; Fu, J.; Sheng, G.; Liu, D.; Zhang, J. Diamondoid hydrocarbon ratios: Novel maturity indices for highly mature crude oils. Org. Geochem. 1996, 25, 179–190. [Google Scholar] [CrossRef]
  62. Schulz, L.K.; Wilhelms, A.; Rein, E.; Steen, A.S. Application of diamondoids to distinguish source rock facies. Org. Geochem. 2001, 32, 365–375. [Google Scholar] [CrossRef]
  63. Dahl, J.E.; Moldowan, J.M.; Peters, K.E.; Claypool, G.E.; Rooney, M.A.; Michael, G.E.; Mello, M.R.; Kohnen, M.L. Diamondoid hydrocarbons as indicators of natural oil cracking. Nature 1999, 399, 54–57. [Google Scholar] [CrossRef]
  64. Gordaze, G.N. Geochemistry of cage hydrocarbon. Pet. Chem. 2008, 48, 241–253. [Google Scholar] [CrossRef]
  65. Moldowan, J.M.; Dahl, J.; Zinniker, D.; Barbanti, S.M. Underutilized advanced geochemical technologies for oil and gas exploration and production-1. The diamondoids. J. Pet. Sci. Eng. 2015, 126, 87–96. [Google Scholar] [CrossRef]
  66. Li, Y.; Xiong, Y.; Liang, Q.; Fang, C.; Chen, Y.; Wang, X.; Liao, Z.; Peng, P. The application of diamondoid indices in the Tarim oils. AAPG Bull. 2018, 102, 267–291. [Google Scholar] [CrossRef]
  67. Li, Y.; Xiong, Y.; Chen, Y.; Tang, Y. The effect of evaporation on the concentration and distribution of diamondoids in oils. Org. Geochem. 2014, 69, 88–97. [Google Scholar] [CrossRef]
  68. Chen, Z.; Liu, X.; Jin, H.; Wang, Z.; Zhang, L. Study on maturity and type of condensate in Jiyang depression by using diamantane index. Acta Sedimentol. Sin. 2008, 26, 705–708, (In Chinese with English abstract). [Google Scholar]
  69. Li, J.; Philp, R.P.; Cui, M. Methyl Diamantane Index (MDI) as a Maturity Parameter for Lower Palaeozoic Carbonate Rocks at High Maturity and Overmaturity. Org. Geochem. 2000, 31, 267–272. [Google Scholar]
  70. Guo, X.; He, S.; Chen, H. Discussion and Application of the Maturity Indicators of Methyl Double Diamantane Hydrocarbons. Bull. Geol. Sci. Technol. 2007, 1, 71–76, (In Chinese with English Abstract). [Google Scholar]
Figure 1. Locations and structure diagrams of Bohai Bay Basin (A), Dongying Depression (B), and the study area of northern Dongying Depression (C). Stratigraphic columns in the Cenozoic strata of Dongying Depression (D).
Energies 17 03734 g001
Figure 2. Representative pressure–volume–temperature phase diagram of the Dongying Depression condensate reservoir from well FSX101 (A) and volatile oil reservoir from well Y22-X100 (B). A triangle map for discriminating reservoir types according to molar percentage of petroleum components (C). C = critical point; Pm = cricondenbar; R = reservoir; Tm = cricondentherm.
Energies 17 03734 g002
Figure 3. The total ion chromatograms (TIC) of whole oil showing distributions of n-alkanes (A1D1) and isoalkanes such as the pristane and phytane, mass chromatograms showing distributions of terpane (A2D2) and steranes (A3D3) of saturated hydrocarbons, Ph = phytane, Pr = pristane, TT = tricyclic terpane, C27–C29 = C27–C29 regular steranes.
Energies 17 03734 g003
Figure 4. A ternary diagram showing the relative normalized abundance of C27, C28, and C29 regular steranes for the oil samples from the Es4L in Dongying Depression (A), variations of C29 20S/(20S + 20R) with C29 ββ/(ββ + αα) sterane ratios (B) (after [41]).
Energies 17 03734 g004
Figure 5. Distribution of compounds in C5–C7 LHs (A); relative contents of alkanes, cycloalkanes and aromatics in C5–C7 LHs (B).
Energies 17 03734 g005
Figure 6. Mass chromatograms of m/z 135 (A1B1) and m/z 187 (A2B2) showing the distribution of some diamondoid compounds. MA = methyladamantane, EA = ethyladamantane, MD = methyldiamantane.
Energies 17 03734 g006
Figure 7. Concentrations of individual diamondoid hydrocarbons in condensate samples. (The peak number corresponds to the ordinal numbers in column 1 of Table 4).
Energies 17 03734 g007
Figure 8. Several cross-plots of parameters related to compositions and carbon isotopes of natural gas indicating gas origin and maturity, δ13C1 vs. C1/(C2 + C3) (A), Ln(C1/C2) vs. Ln(C2/C3) (B) (after [53]), C2/C3 vs. δ13C213C3 (C) (after [54]), reciprocal intersection of carbon isotope and carbon number of natural gas (D).
Energies 17 03734 g008
Figure 9. The deep reservoir profiles showing the migration fractionation during the upward migration of deep natural gas in the northern part of the Dongying Depression.
Energies 17 03734 g009
Figure 10. Variations of the log of mole fraction for the C5–C35 n-alkanes with carbon number, FSX11 (A), FS1-X1 (B), FS1-P1 (C), FSX11 (D), FS1 (E), F8 (F), YX229 (G), Y22-X100 (H).
Energies 17 03734 g010
Figure 11. B-F model diagram (A) and cross-plot of B-F (B) for the oils in the Dongying Depression (after [2]; XH condensates data from [17]).
Energies 17 03734 g011
Figure 12. Diamondoid parameter cross-plot, concentration of ααα(20R)-C29 sterane versus concentration of (3- + 4-) MD (A) (after [63]), concentration of (1- + 2-) MA versus concentration of (3- + 4-) MD (B) (after [65]), Change of MAI and MDI with evaporation fractionation intensity (C) (after [67]), MDI versus VRo (D) (Source rocks data from [68]).
Energies 17 03734 g012
Figure 13. A diagram showing the gas invasion and fractionation model (A) and the dominant controlling factors (B) for the deep light oil reservoirs. In both maps, a sequence of oil and gas reservoirs that typically occur from deep to shallow in the basin is characterized.
Energies 17 03734 g013
Table 1. Basic information and physical properties of the oil samples in this study.
WellStrateDepth (m)Density, 20 °C, (g/cm3)Viscosity, 50 °C, (MPa·s)Sulfur, (%)Sat, %Aro, %Res, %Asp, %Reservoir Type *
F8Es4L4176–41910.720.820.5587.46.754.141.71COR
FS1Es4L4316–43430.780.880.0278.419.455.216.93COR
FS1-X1Es4L4402–44190.770.810.0971.2911.888.917.92COR
FS1-P1Es4L4599–47700.8212.80nd84.008.004.803.20COR
FSX11Es4L4309–44670.77ndnd74.8319.055.440.68COR
FSX101Es4L4525–45520.791.800.0382.008.206.403.40COR
YX229Es4L4171–42500.825.400.1377.9312.685.633.76VOR
Y22-X100Es4L4266–42730.884.47nd73.6713.515.747.08VOR
nd: no data; Sat: saturated hydrocarbon; Aro: aromatics hydrocarbon; Res: resin; Aro: asphaltene; VOR: volatile oil reservoirs; COR: condensate reservoirs; * referred to [39].
Table 2. Biomarker parameters related to alkanes and sterane of the oil samples in this study.
Welln-C10/n-C10+Relative Content (%)αααC2920RC29-ββ/(ββ + αα)C29-20S/(20S + 20R)
C27C28C29μg/g
F81.1242.6820.1637.16nd0.610.57
FS10.5746.5424.1229.34nd0.580.56
FS1-X11.0141.6822.1436.180.000.590.56
FS1-P10.1147.0923.1329.770.000.540.57
FSX110.6436.5617.0946.3517.910.600.55
FSX1010.9447.5429.1223.34nd0.630.56
YX2290.5934.6521.5443.8073.860.630.57
Y22-X1000.5239.9617.0143.0319.390.640.56
nd: not determined.
Table 3. Parameters derived from LHs of the samples in this study.
WellnC7MCHTolTol/nC7nC7/MCHnC5–7iC5–7CyC5–7
%
F80.240.160.843.551.4689.527.183.30
FS10.200.110.874.441.8387.098.724.18
FSX1010.130.320.644.750.4289.217.313.49
FSX110.060.050.213.401.1789.523.307.18
YX2290.100.090.313.291.0987.094.188.72
FS1-X10.100.110.414.110.9389.213.497.31
FS1-X10.440.351.804.091.2478.849.3511.82
FS1-P10.010.010.054.180.9287.555.137.32
FS1-P10.170.140.704.241.1580.179.3810.45
nC7: n-heptane; MCH: methylcyclohexane; Tol: toluene; nC5–7: C5–C7 n-alkanes; iC5–7: C5–C7 isoalkanes; CyC5–7: C5–C7 cycloalkanes.
Table 4. Concentrations of individual diamondoids in the light oil samples in this study (μg/g).
No.CompoundAbbreviationFS1-X1FS1-P1FSX11YX229Y22-X100
4402–44194599–47704309–44674171–42504266–4273
Es4LEs4LEs4LEs4LEs4L
1AdamantaneA15.9017.1528.9613.8626.8
21-Methyladamantane1-MA53.7671.0584.6834.5485.77
32-Methyladamantane2-MA17.8635.1657.7626.1352.61
41-Ethyladamantane1-EA15.5147.3127.1511.3220.59
52-Ethyladamantane2-EA18.4060.3928.2014.5729.10
61,3-Dimethyladamantane1,3-DMA38.5466.2957.1322.5561.06
71,4-Dimethyladamantane (cis)1,4-DMA32.6473.5048.1019.0949.15
81,4-Dimethyladamantane (trans)1,4-DMA44.15108.9463.1530.2360.31
91,2-Dimethyladamantane1,2-DMA41.84112.3959.7025.5655.55
101-Ethyl-3-methyladamantane1 Et,3-MA16.6655.8328.6413.8023.60
111,3,5Trimethyladamantane1,3,5-TMA14.4828.3218.037.1319.67
121,3,6-Trimethyladamantane1,3,6-TMA22.7665.7330.8914.4035.74
131,3,4-Trimethyladamantane (cis)1,3,4-TMA23.4765.6332.8113.9333.53
141,3,4-Trimethyladamantane (trans)1,3,4-TMA27.4462.2935.7616.337.98
15l-Ethyl-3,5-dimethyladamantane1 Et,3,5-DMA16.3448.7427.945.6725.14
161,3,5,7-Tetramethyladamantane1,3,5,7-TeMA2.685.963.151.403.51
171,2,5,7-Tetramethyladamantane1,2,5,7-TeMA13.0316.2015.225.7817.20
18DiamantaneD3.348.785.223.584.68
194-Methyldiamantane4-MD12.6217.0140.4450.1730.22
201-Methyldiamantane1-MD7.3513.9624.9628.6816.79
213-Methyldiamantane3-MD4.474.8112.5710.4710.82
224,9-Dimethyldiamantane4,9-DMD1.332.813.462.752.46
231,2- + 2,4-Dimethyldiamantane1,2 + 2,4-DMD2.785.416.487.216.57
244,8-Dimethyldiamantane4,8-DMD1.032.343.543.862.68
253,4-Dimethyldiamantane3,4-DMD2.695.357.997.306.13
26Total diamondoid hydrocarbons 451.071001.35751.93390.28717.66
Table 5. Molecular and stable isotopic compositions of gases from the Dongying Depression.
WellGOR, (m3/m3)DI, (%)Molecular Composition, mol %δ13C PDB, ‰
C1C2C3C4C5N2CO2δ13C1δ13C2δ13C3δ13C4δ13C5
F8880582.881.57.44.04.21.31.60.0−49.1−32.5−28ndnd
FS1144891.790.74.61.71.50.40.01.1−50.4−30.8−26.8ndnd
FS1–P1293788.478.64.62.52.01.38.62.4−47.4−30−25.6−23.7nd
FS1–X1204871.063.07.06.77.54.48.52.9−47.9−30.6−26.1−25.5−25.1
FSX11161977.567.77.55.64.71.99.03.6−48.5−31.3−27.3−27−26.6
YX22920875.969.18.66.64.82.03.55.4−50.2−32.9−29−28.3−27.2
FSX101211992.189.94.31.81.00.50.32.1ndndndndnd
FS3nd95.292.13.20.90.60.00.13.1−44.7−30−23.4ndnd
GOR: gas-to-oil ratio; DI: dryness index; nd: not determined.
Disclaimer/Publisher’s Note: The statements, opinions and data contained in all publications are solely those of the individual author(s) and contributor(s) and not of MDPI and/or the editor(s). MDPI and/or the editor(s) disclaim responsibility for any injury to people or property resulting from any ideas, methods, instructions or products referred to in the content.

