Abstract
The primary objective of this study is to examine the relationships between energy consumption in agriculture from renewable and non-renewable sources and the production levels in the agricultural sector across European Union countries. Additionally, this study aims to identify countries that differ in the development of their agricultural sector in terms of environmental care and to highlight the causes and consequences of these identified disparities. The classification of countries was conducted using the Principal Component Analysis method and a biplot. Panel data for the period 2000–2022, a VAR model, the impulse response function (IRF), and causality tests were used for this study. The results indicate two distinct groups of countries that significantly differ in adopting green agricultural practices. Only seven EU countries stand out for sustainable agriculture with low pesticide use, a significant share of organic farms, and high use of renewable energy in agriculture. Energy consumption affects agricultural production differently in the two groups of countries studied: in countries with sustainable agriculture, an increase in renewable energy consumption translates into a positive increase in agricultural production. On the other hand, an increase in non-renewable energy consumption shows a dampening effect on agricultural production growth, especially in countries with less sustainable agriculture. The results of this study highlight the need to promote renewable energy development in agriculture and raise awareness about the adverse environmental effects of intensive agriculture while emphasising the positive impact of organic agriculture on agricultural production.
1. Introduction
Agriculture is an important economic sector in the countries of the European Union (EU), employing nearly 9 million people and contributing on average 1.5% of gross domestic product (GDP). Furthermore, it ensures the continent’s food security [1]. A significant proportion of the population in many EU regions of the community derive their livelihood from agriculture, which represents a significant contributor to the local economy [2]. As with any economic activity, agriculture requires the commitment of resources [3]. In the context of contemporary, technologically sophisticated agricultural practice, the availability and utilisation of energy resources represent a critical factor in determining the efficiency and competitiveness of production [4].
Agricultural production, while utilising resources, provides food and generates environmental pollution. The agricultural sector is responsible for 10% of CO2 emissions in the EU [5]. The growing public awareness of climate change and direct experience of its effects have contributed to the fight against global warming and reducing non-renewable resource use in agriculture [6]. The concept of green agriculture was developed on the basis of sustainable agricultural practices that prioritise environmental protection, ecosystem conservation, and food security [7,8]. This agriculture involves reducing the use of pesticides and artificial fertilisers, developing organic agricultural production, and using renewable energy sources to move towards zero emissions [9,10]. Green agriculture uses modern technologies and innovations [11]. The concept is based on organising the agricultural sector in a way that ensures a sustainable and environmentally friendly approach to food production and ecosystem conservation.
The pursuit of implementing green agriculture is inextricably linked to the fight against global warming. Efforts to reduce CO2 emissions from agriculture have a relatively long history. The Kyoto Protocol, created in 1997 and entered into force in 2005, represents a significant advance in the global effort to combat global warming [12]. The document represents a pivotal global response to the challenge of greenhouse gas emissions from agriculture by establishing binding targets for industrialised countries to reduce emissions [13,14,15]. The commitments set out in the Kyoto Protocol obliged signatories to report information on CO2 emissions from crop production, land use, and animal husbandry (farming) [16]. Moreover, agriculture was identified as a significant source of greenhouse gas emissions, prompting a recommendation to develop research on reducing emissions in this sector [17].
Another significant milestone in the global effort to combat climate change was the Paris Agreement, which was adopted in 2015. This document explicitly stated in its provisions that agricultural activity impacts climate change [18]. The agreement’s authors also highlighted the bidirectional relationship between climate change and agriculture, noting that the agricultural sector is highly dependent on climatic conditions and contributes to global warming through CO2 emissions [19,20]. Concurrently, the Paris Agreement indicates that the fight against excessive CO2 emissions can be achieved through modern, ecological, and sustainable agriculture [21]. The realisation of these demands should occur through an increase in the share of organic farms as the target form of activity in crop and livestock production while reducing the use of pesticides, land reclamation, and renewable energy sources [22].
Four years later, the European Union adopted a comprehensive programme called the European Green Deal (EDG) to reduce CO2 emissions and restore natural resources significantly. The strategy of this programme aims to transform agriculture by promoting sustainability and reducing the resulting climate change [23]. The European Green Deal for climate policy in agriculture assumes several objectives, including reducing pesticides, increasing the share of organic crops, and boosting the overall contribution of renewable energy sources (RESs) to energy production. These assumptions include a 50% reduction in the use of pesticides by 2030, an increase in the share of organic crops to 25%, and an increase in the overall share of RESs in energy production to 32% by 2030 [24]. The modernisation of agriculture following the new EU climate policy will necessitate a significant energy transition, with the utilisation of renewable energy sources (RESs) playing a pivotal role [25]. Farms will be expected to use renewable energy sources (RESs) and operate as energy producers. The EGD presents a dual opportunity: firstly, to reduce agricultural production costs, and secondly, to actively engage the agricultural sector in the transition [26]. The development of renewable energy sources is also expected to contribute to the innovation of European agriculture through increased investment in research in this area [27]. Thus, the transition to sustainable agriculture as a target model can be crucial in increasing farm productivity, decreasing operating expenses, increasing product quality, and improving the economic performance of farms [28].
The energy transition process under the EGD policy in agriculture may also have negative aspects. These are mainly due to potential challenges during the transition period, such as significant investments in renewable energy, rising food prices, and competitiveness issues for European farmers [29]. Furthermore, significant reductions in the use of pesticides may result in yield losses and shortages of agricultural products on the world market [24]. Moreover, the transition to sustainable agricultural practices will affect the economic and social aspects of the operation of agri-food businesses, including the need to maintain competitive prices and consumer interest in organic products [30]. It can significantly burden farms in the short term and negatively impact the economy [31]. It is evident that, despite the ambitious goals of the European Green Deal, a comprehensive approach to agricultural policy is required that considers both environmental protection and the maintenance of agricultural sustainability through the support of the agricultural sector in the energy transition process [32].
The European Green Deal (EGD) assumptions have recently sparked protests within the agricultural sector across multiple member states, notably Germany and Poland. Considering both the positive and negative aspects of the energy transformation in agriculture, an important question remains regarding the impact of renewable and non-renewable energy consumption on agricultural sector production. Previous research has primarily focused on a macro scale, indicating that economic production growth is driven by increased energy consumption, assuming unidirectional relationships and highlighting the presence of bidirectional dependencies [33]. Consequently, many scientific studies provide arguments for the positive and negative impacts of RES development on the economy [34]. However, research to date on the economy as a whole does not consider the specifics of the agricultural sector [35].
Considering the above discussions, the primary objective of this study is to examine the relationships between energy consumption in agriculture from renewable and non-renewable sources and the production levels in the agricultural sector in EU countries. Additionally, this study aims to identify countries that differ in the development of their agricultural sector in terms of environmental care and to highlight the causes and consequences of these identified disparities. This analysis provides a better understanding of the impact of various energy sources on agricultural production and illustrates how the level of green agriculture influences these relationships. This study assumes that countries with a higher share of green agriculture benefit from the positive aspects of renewable energy. Based on these objectives, the following research hypotheses have been formulated:
Hypothesis H1:
In countries with a higher proportion of green agriculture, replacing non-renewable energy with renewable energy does not reduce agricultural production levels.
Hypothesis H2:
There is a bidirectional causal relationship that exists between agricultural production and renewable energy consumption. An increase in agricultural production leads to an increase in renewable energy consumption and vice versa.
This study was conducted in two stages, following the research procedure proposed by Papież et al. [36] and Liu et al. [37]. In the initial phase of this study, countries were divided based on the implementation of the main objectives of the European Green Deal (such as the share of renewable energy use in agriculture, pesticide use, and the share of organic farming) using the Principal Component Analysis (PCA) and k-means clustering methods. In this study’s second phase, the Vector Autoregression (VAR) model was employed to examine the impact of renewable and non-renewable energy consumption in agriculture on the agricultural sector’s output and to investigate differences across country groups.
This study can be considered innovative because it classifies countries based on the development of green agriculture. Consequently, the conclusions can serve as arguments supporting the energy transformation in agriculture, especially in the face of significant hostile reception by industries and societies. Additionally, there have been no previous studies on the effects of using renewable and non-renewable energy on agricultural sector production, thus providing new evidence for the theory of agricultural economics. Finally, this study enhances existing research on the connections between renewable energy and the economy, with additional findings for the agricultural sector.
This study is structured as follows: Section 2 reviews the existing literature on energy–economic relationships in EU countries. Section 3 outlines the method employed. Section 4 presents the data and exploratory data analysis. Section 5 discusses the empirical results. This article concludes with policy implications and overall conclusions.
2. Literature Review
A literature review reveals substantial evidence concerning the relationship between economic activity and energy consumption. Several literature reviews have synthesised this literature, including [33,38,39]. This research project builds upon the original consideration of the Environmental Kuznets Curve (EKC), which undertook comprehensive analyses of the causal relationships between economic development and environmental pollution [40,41,42]. A synthesis of the literature and conclusions of existing research related to the EKC curve has been provided by, for example, Pincheira and Zuniga [43], Kaika and Zervas [44] and Lau et al. [45]. From an analysis of the available literature, it can be concluded that, despite numerous studies, the relationship between economic development and environmental pollution and energy consumption remains unresolved [46]. The primary areas of discrepancy pertain to the nature of these interrelationships. Some authors propose an N-shaped nature of the relationship, while others suggest a U-shaped one [47]. Research into the intricate relationships implied by the EKC curve has led researchers to incorporate variables related to overall energy consumption in their models and consider the distribution of energy consumption from different energy sources [48].
In parallel, studies have been conducted on the relationship between economic growth and energy consumption [49], which have arisen from the growing interest of researchers in assessing the economic impact of the energy transition and the fight against CO2 emissions [50]. The above studies have used various methodological apparatuses such as OLS, VAR, Vector Error Correction Model (VECM), and Autoregressive Distributed Lag (ARDL) models [39]. As indicated by Papiez et al. [36], based on an extensive literature review, most country studies confirm the impact of energy consumption on GDP and the bidirectional influence of renewable and non-renewable energy consumption on GDP. These relationships vary depending on the countries studied and the methodologies employed. Furthermore, as part of its conclusions, the study finds that in countries with relatively well-developed renewable energy sectors, renewable electricity consumption boosts the economy and vice versa [36,51]. Nevertheless, numerous questions remain unanswered, and the outcomes of the studies depend on the models employed, the selection of countries, the study periods, and the variables analysed [33].
Despite extensive research on the relationship between energy use and the economy, there remains a dearth of published research on the broader impact of energy transition on the agricultural sector. As indicated by Rokicki et al. [52], energy is the primary factor of production in agriculture and is utilised both directly and indirectly in agricultural activities. Modern agriculture is a significant energy consumer worldwide, and different areas of the agricultural sector’s activities are characterised by different energy intensities [53]. Global agriculture consumes well over 1 billion tonnes of energy annually, mainly from fossil fuels [54]. Thus, the agricultural sector accounts for nearly 8% of global energy consumption, of which more than a third is consumed for food production [55]. The increase in agricultural production and global food security has increased agricultural energy consumption by 7% in 2023 compared to 1990 [54].
Paris et al. [56] estimate that the annual energy consumption of crop production accounts for about 3.7% of the total annual energy consumption in the EU, with most of the energy coming from non-renewable energy sources. The authors also point out that the production of mineral fertilisers is the most energy-intensive activity in EU agriculture, accounting for about 50% of all energy inputs, with 31% consumed in on-farm agricultural production and 8% in irrigation, storage, and drying. As shown by Rokicki et al. [52], oil and its derivatives are the most important in agriculture in EU countries, accounting for about 60% of the energy used in agriculture. Electricity and natural gas, as did renewable energy sources, accounted for several per cent of the total energy consumption.
Energy is required by both the crop and livestock production sectors and the processing, transport, and agricultural support sectors [57]. In particular, extensive energy resources are needed to produce fertilisers, which are massively used in expansive crop production [58]. Organic and organic fertiliser production also involves extensive energy resources, although renewable sources are more efficient [59]. Moreover, in certain European countries, energy is required for heating and lighting greenhouses and sheltered crops, particularly vegetables, due to their extended growing seasons. In addition, the storage of agricultural products, primarily under refrigeration conditions, requires consuming large amounts of energy resources [60]. Energy costs in agriculture can account for as much as 20–50% of total production costs [61]. Therefore, energy affects the efficiency of agricultural production and its cost intensity, which is vital due to market competition. Energy consumption in agriculture is a critical aspect that impacts economic development and sustainability. With energy consumption in the agricultural sector expected to increase significantly in the coming years, energy efficiency will be vital to meeting this demand [62].
The European Union has set itself the goal of changing its energy mix by increasing the share of renewable energy to 45% of gross final consumption by 2030. This change will have a significant impact on the functioning of the agricultural sector [63]. As Suwalski et al. [64] have shown, the role of renewable energy in European agriculture is still small, while its potential is relatively large. As Havrysh et al. [60] indicate, renewable energy in agriculture represents a significant opportunity to generate income for farms and improve their economic situation. Furthermore, in their studies, Sharma et al. [61] and Bhattacharyya et al. [62] indicate that renewable energy in agriculture increases agricultural employment and improves farmers’ financial situation. In addition, renewable energy can enhance the economic viability of agricultural production through cost savings, increased competitiveness, and reduced vulnerability to external shocks [8].
However, as highlighted by Roxani et al. [63], the construction of solar and wind power plants may harm food security due to reduced available arable land. In contrast, Rokicki et al. [52] highlight that the relationship between energy consumption and agriculture is a well-researched topic, although there is still a lack of clear evidence. Previous studies also indicate that the use of renewable energy in agriculture is highly variable across EU countries, with RES energy use being higher in the “old” EU countries [61].
It is important to note that despite numerous studies on the relationship between energy and economic growth, there has been less consideration of this relationship within the agricultural sector. Given the importance of renewable energy, there has been little investigation of its economic impacts on the production and income levels of the agricultural sector. Although energy is a crucial factor of production in agriculture, there is a notable scarcity of empirical research in this area. Zhang et al. [65], employing the ARDL model using China as an example, find that energy consumption in agriculture affects agriculture’s economic growth, but their work focuses on pollution. Song et al. [66] also use China as an example, showing that technological advances in renewable energy and energy use efficiency influence agricultural yield growth. Boltianska et al. [67], studying the agriculture of Ukraine, indicate that improvements in the efficiency and security of agricultural production can be achieved through an increase in renewable energy. Pei et al. [68], using the VECM/ARDL model for Malaysia, confirm the negative impact of renewable energy consumption in agriculture on CO2 emissions in the economy.
Jebli and Youssef [69], using the VECM model for Tunisia, show unidirectional relationships between energy consumption, including renewable energy, and value added from agriculture. The same authors also reach similar conclusions in a study of North African countries using Granger causality tests [70]. Liu et al. [37], using the VECM method for the BRICS countries, do not find a significant causal relationship between agricultural production and renewable energy. A study by Abbas et al. [71] using the ARDL model indicates that agricultural production growth in Pakistan is positively affected by gas and electricity consumption in both the long and short term. Aydoğan and Vardar [72], using Granger causality tests, determine a relationship between renewable energy and agricultural production growth in E7 countries. Suproń and Myszczyszyn [5], using the GMM model, indicate that in 3SI countries, renewable energy can be a factor in agricultural value-added growth. Conversely, Łącka et al. confirm that renewable and non-renewable energy consumption is a factor in the increase in cereal productivity in European agriculture, using the feasible generalised least squares (FGLSs) model.
In conclusion, studies on the relationship between agricultural production and energy consumption, including renewable energy, are limited in number and scope. A notable gap exists in empirical evidence. The studies identified in the review often focus on individual countries with specific economic characteristics, limiting the generalizability of their findings to European countries. To the best of the authors’ knowledge, econometric studies of the relationship between agricultural production and energy consumption have not been conducted for EU countries. Considering the community’s climate policy advocating for a significant energy transition, including within the agricultural sector, there is a critical need for new empirical evidence to inform decision-making. This study thus aims to address this gap in the literature.
3. Materials and Methods
In the first phase of this study, countries were classified according to their level of development of organic farming. This was achieved through the utilisation of the Principal Component Analysis and k-means methods. The Principal Component Analysis method was employed to reduce the dimensionality of the investigated variables [73]. Given the nature of the variables, an analysis based on a covariance matrix was employed. Following this, clustering based on the k-means method was performed to distinguish between the two analysis groups.
The variables presented in Table 1 were employed in the principal model. Following the assumptions formulated by Papież et al. [36], which were based on the work of Ozturk [74] for general models of the relationship between economic growth and energy consumption and Bolandnazar et al. [75] for models of energy consumption in agricultural production, the study employed a production model based on a Cobb–Douglas function of the following form:

Table 1.
Variables and description.
The data were examined for cross-sectional dependence in the first step of the empirical analysis. This was achieved by utilising the Breusch–Pagan LM test, which is appropriate for data sets comprising a relatively small number of cross-sectional units [76]. Subsequently, panel unit root tests of the first and second degrees were conducted. To achieve this, the Maddala, Wu, and Pesaran panel unit root tests were employed in the presence of Cross-sectional Dependence (CSD) [77]. Subsequently, the Westerlund panel test for cross-dependence series was utilised to test for cointegration in the data [78].
Since the series under study is characterised by a more significant number of cross-sector units concerning the periods, a short-run VAR model based on the generalised method of moments (GMMs) estimator was used to fulfil the stated aim of this study. The VAR model allows for endogenous and exogenous variables as instrumental variables (IVs). The model used lagged variables as instruments to address the endogeneity problem. The estimation process employed the Helmert transformation to remove panel-specific fixed effects. This avoided the difficulties of endogeneity and fixed effects, common in economic time series panel data. (See the Supplementary Materials). The choice of lags in the VAR model was determined based on the MAIC criterion developed by Andrews and Lu [79], which is based on J-Hansen statistics. The model was simultaneously parameterised according to the procedure proposed by Kiviet [80]. Given these considerations, the model was constructed following the methodology suggested by Abrigo and Love [81]. The following equation represents the fundamental form of the model:
where Yit is a (1 × k) vector of dependent variables, is a (1 × l) vector of exogenous covariates, and and are (1 × k) vectors of dependent variable-specific panel fixed effects and idiosyncratic errors, respectively. The (k × k) matrices A1, A2, …, , and Ap and the (l × k) matrix B are parameters that must be estimated. We assume that the innovations have the following characteristics: and
The estimated model’s stability was evaluated by applying eigenvalue stability condition tests. The inferences drawn from the model were based on Granger causality tests and cumulative orthogonalized IRFs. The confidence intervals of the IRFs were calculated with 200 Monte Carlo draws from the fitted panel distribution of the reduced-form VAR model.
4. Results
4.1. Clustering of the Countries Surveyed
In the first phase of this study, the countries of the European Union were divided into two groups according to their level of development of organic farming (green agriculture). For this purpose, the 2015–2020 average values of the following variables for each country from the Eurostat and FAO databases were obtained and used:
- -
- ARE: share of renewable energy consumption in agriculture (in %);
- -
- PSC: pesticide consumption (kg/h);
- -
- OFS: share of organic farming in total (in %).
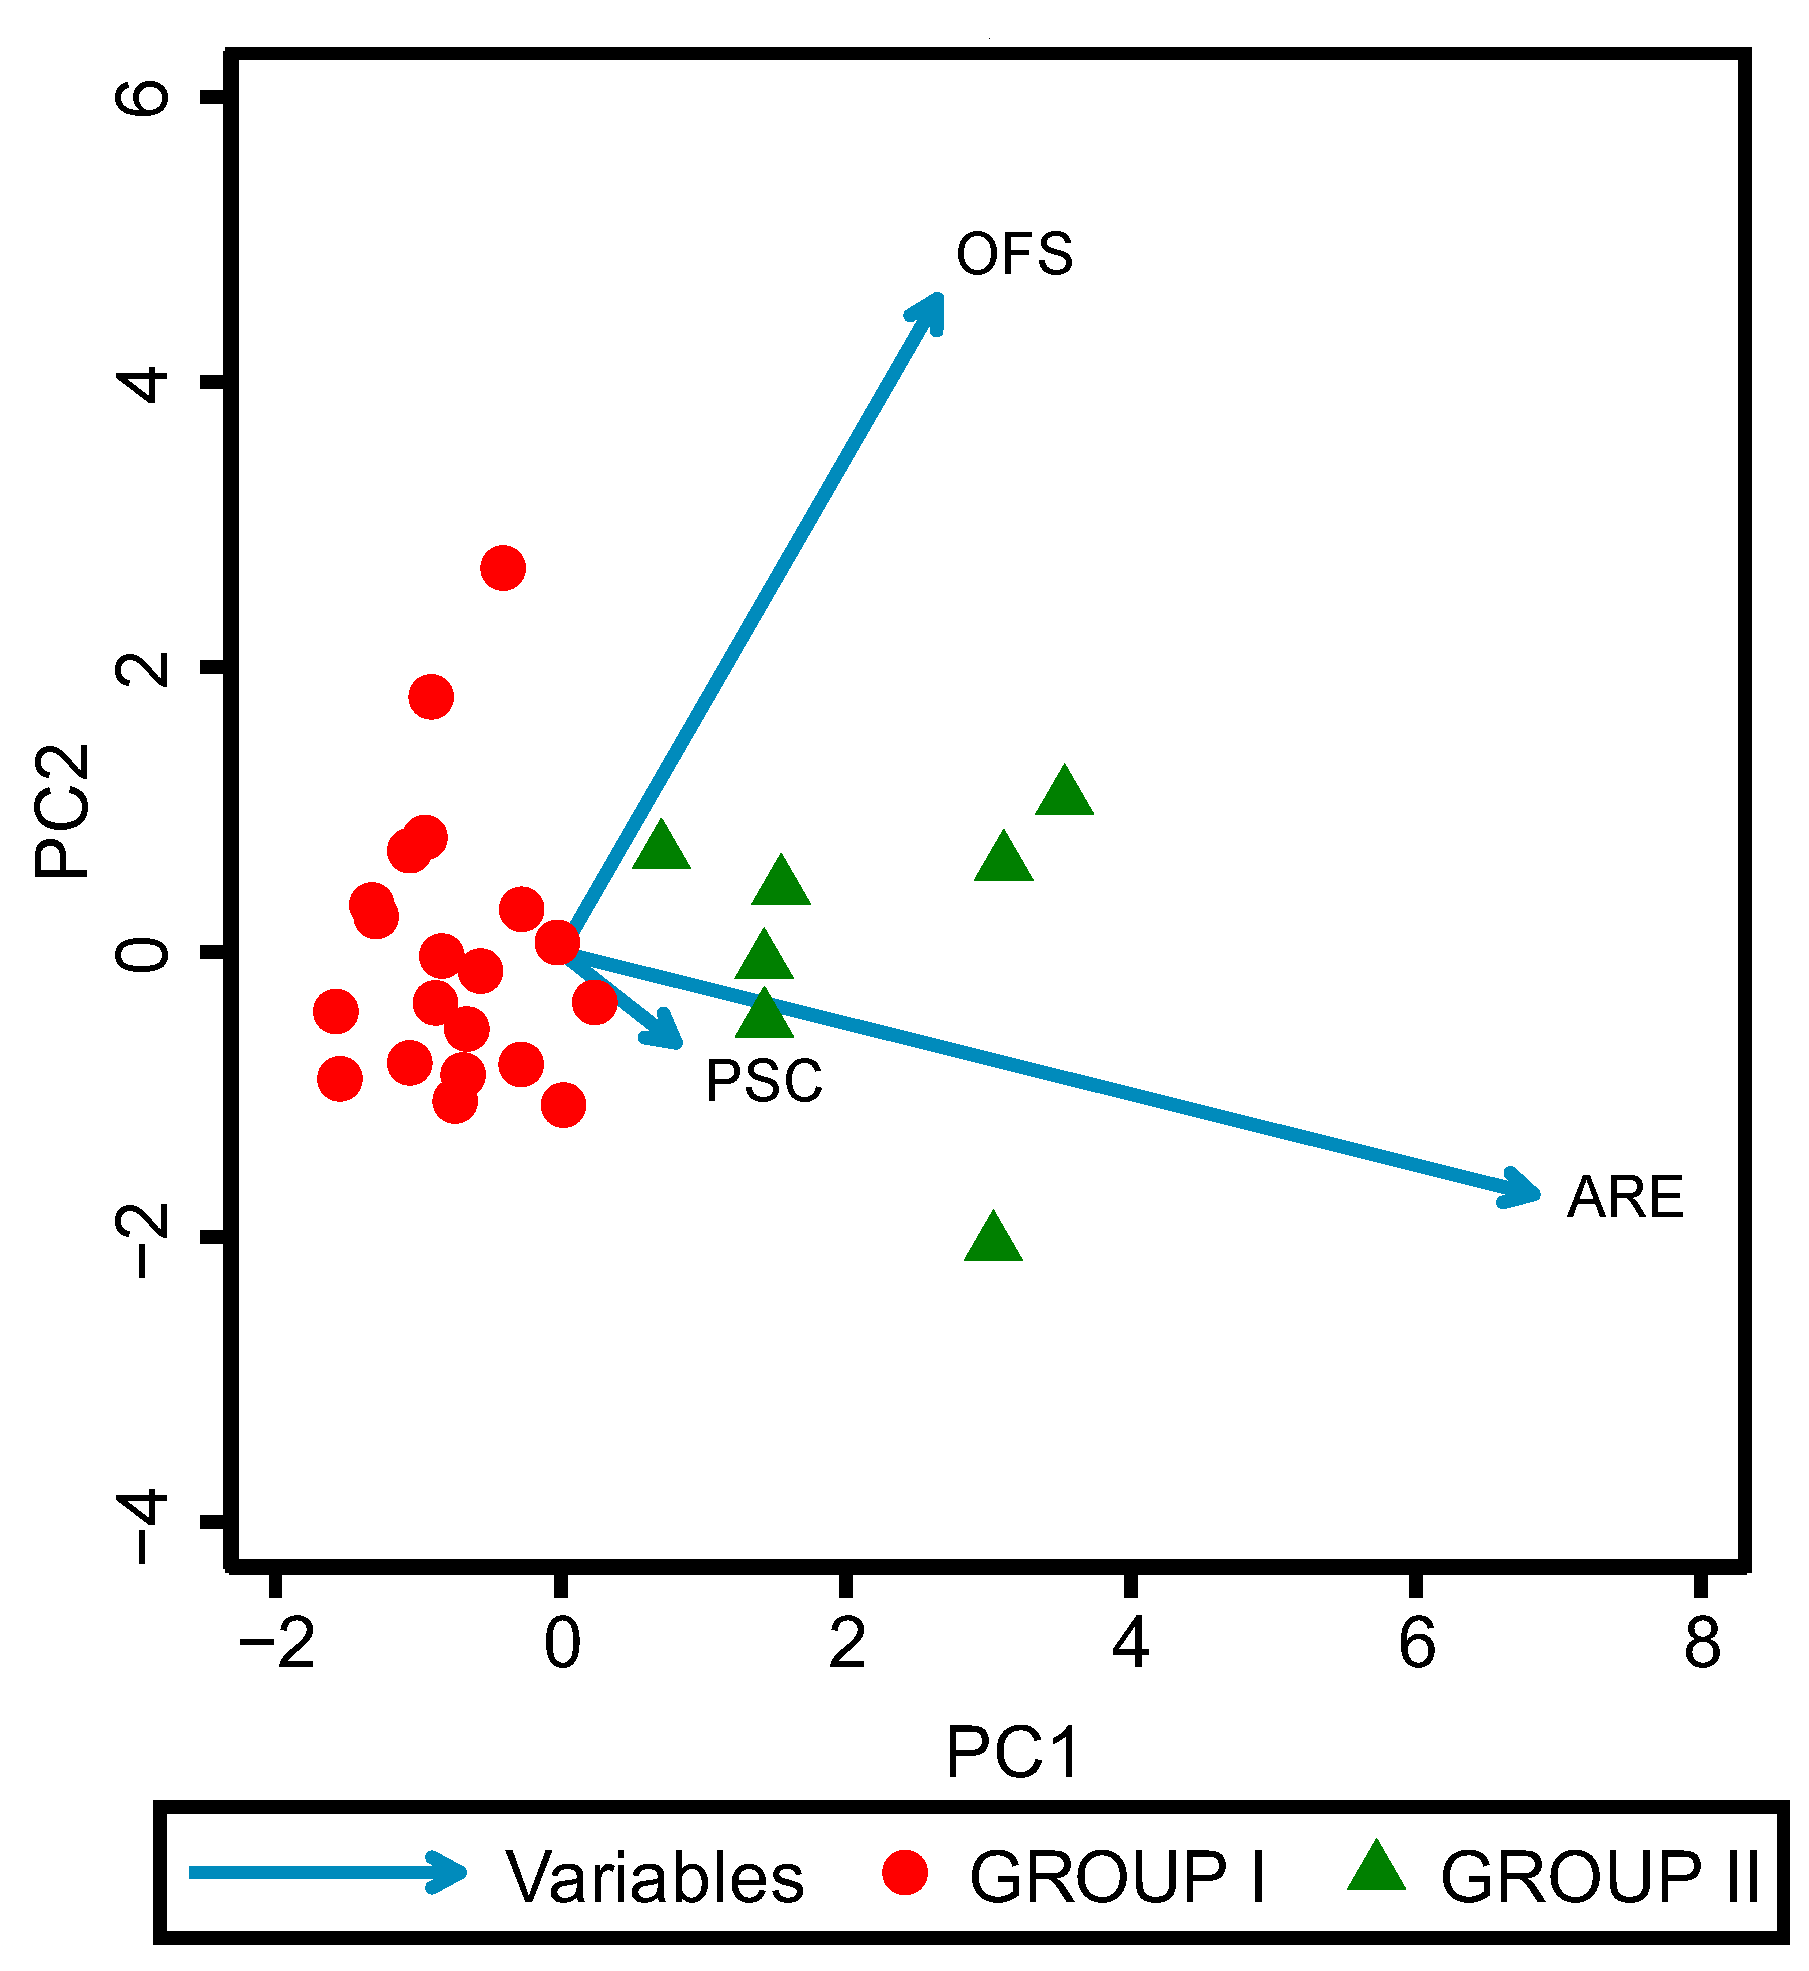
The choice of time horizon was dictated by the availability of data and the period following the implementation of the Paris Agreement in 2015, through which European Union countries committed to reducing CO2 emissions by promoting sustainable agricultural practices. To reduce the dimensionality of the data, a Principal Component Analysis (PCA) was carried out, the results of which can be found in Table 2. Using the k-means method, the countries under study were divided into two groups. Group I consisted of countries with less sustainable agricultural practices, which included Bulgaria, Croatia, Cyprus, Denmark, Estonia, France, Greece, Hungary, Ireland, Italy, Lithuania, Malta, Netherlands, Poland, Portugal, Romania, Slovenia, and Spain. Group II, in contrast, included Austria, Czech Republic, Finland, Germany, Latvia, Slovakia, and Sweden. The division of the surveyed countries is graphically presented in the form of a biplot in Figure 1. The obtained division is analogous to the division created by Kukuła and Luty [82] using the linear ordering method (based on the following indicators: average organic area, share of organic area in total agricultural area, value of retail sales, and expenditure on organic food).
Table 2.
PCA results.

Figure 1.
Biplot of studied countries. Source: own study.
Table 3 presents the descriptive characteristics of the studied country groups concerning the characteristics used in the clustering. For Group I countries, the share of organic farms is significantly lower than in Group II countries. On average, such holdings account for 7.15% of all holdings in Group I, while in Group II, they account for 14.38%. The smallest organic farms in Group I are in Malta (0.39%), while the largest are in Estonia (13.91%). In Group II, on the other hand, the highest number of organic farms is in Austria (23.34%), while the lowest is in Germany (7.44%).
Table 3.
Descriptive statistics.
Regarding the utilisation of renewable energy in agriculture, the mean value was 6.18% in Group I and 25.54% in Group II. Poland had the highest proportion of renewable energy in agriculture in Group I (13.48%), while Portugal had the lowest (6.87%). In contrast, in Group II, Lithuania had the lowest use of renewable energy in agriculture (13.95%), while Germany had the highest (35.07%). The group variation is less pronounced regarding the final variable, pesticide consumption. The average pesticide consumption in Group I was 5.69 kg/h, while in Group II, it was 5.37 kg/h. The lowest consumption was recorded in Romania (0.66 kg/h), while the highest was in the Netherlands (9.76 kg/h). In Group II, on the other hand, the highest consumption was in Austria (9.76 kg/h) and the lowest in Sweden (0.62 kg/h). Group I is more homogeneous when all variables are considered, with a lower standard deviation than Group II.
Based on general characteristics, specific features can be identified in both groups of countries, though there are exceptions to these patterns. In Group I countries, agriculture often has a long tradition characterized by small family farms and traditional farming methods. There is greater diversity in crops and livestock, influenced by varied climatic and historical conditions. The farm structure is more heterogeneous, with a predominance of small and medium-sized family farms that frequently combine agricultural production with other activities. The level of mechanization and the use of modern technologies vary, with some regions still relying heavily on traditional methods.
In contrast, Group II countries have undergone a more intensive modernization process, emphasizing large farms and mechanization. These countries often exhibit specialization in production, with larger farms dominating and focusing on specific groups of products. The level of mechanization and the adoption of modern agricultural technologies are high, including precision farming and advanced irrigation systems. Agricultural production in this group is more specialized and technologically advanced.
In summary, Group II countries demonstrate a more pronounced focus on agricultural sustainability compared to Group I, where practices range from medium to low levels of sustainability. The environmental impact of agriculture is significantly higher in Group I due to a lesser emphasis on sustainable practices. In contrast, Group II countries have a reduced environmental footprint owing to their commitment to sustainable practices. These countries have benefited from increased investments in agricultural technology and research, fostering the development of advanced and sustainable farming methods. Conversely, Group I countries exhibit greater heterogeneity in agricultural practices due to economic disparities and slower adoption of technological advancements. Group II countries also have a more robust policy framework supporting sustainable agriculture, while Group I countries tend to have less stringent or inconsistently applied environmental regulations.
4.2. Preliminary Data Analysis
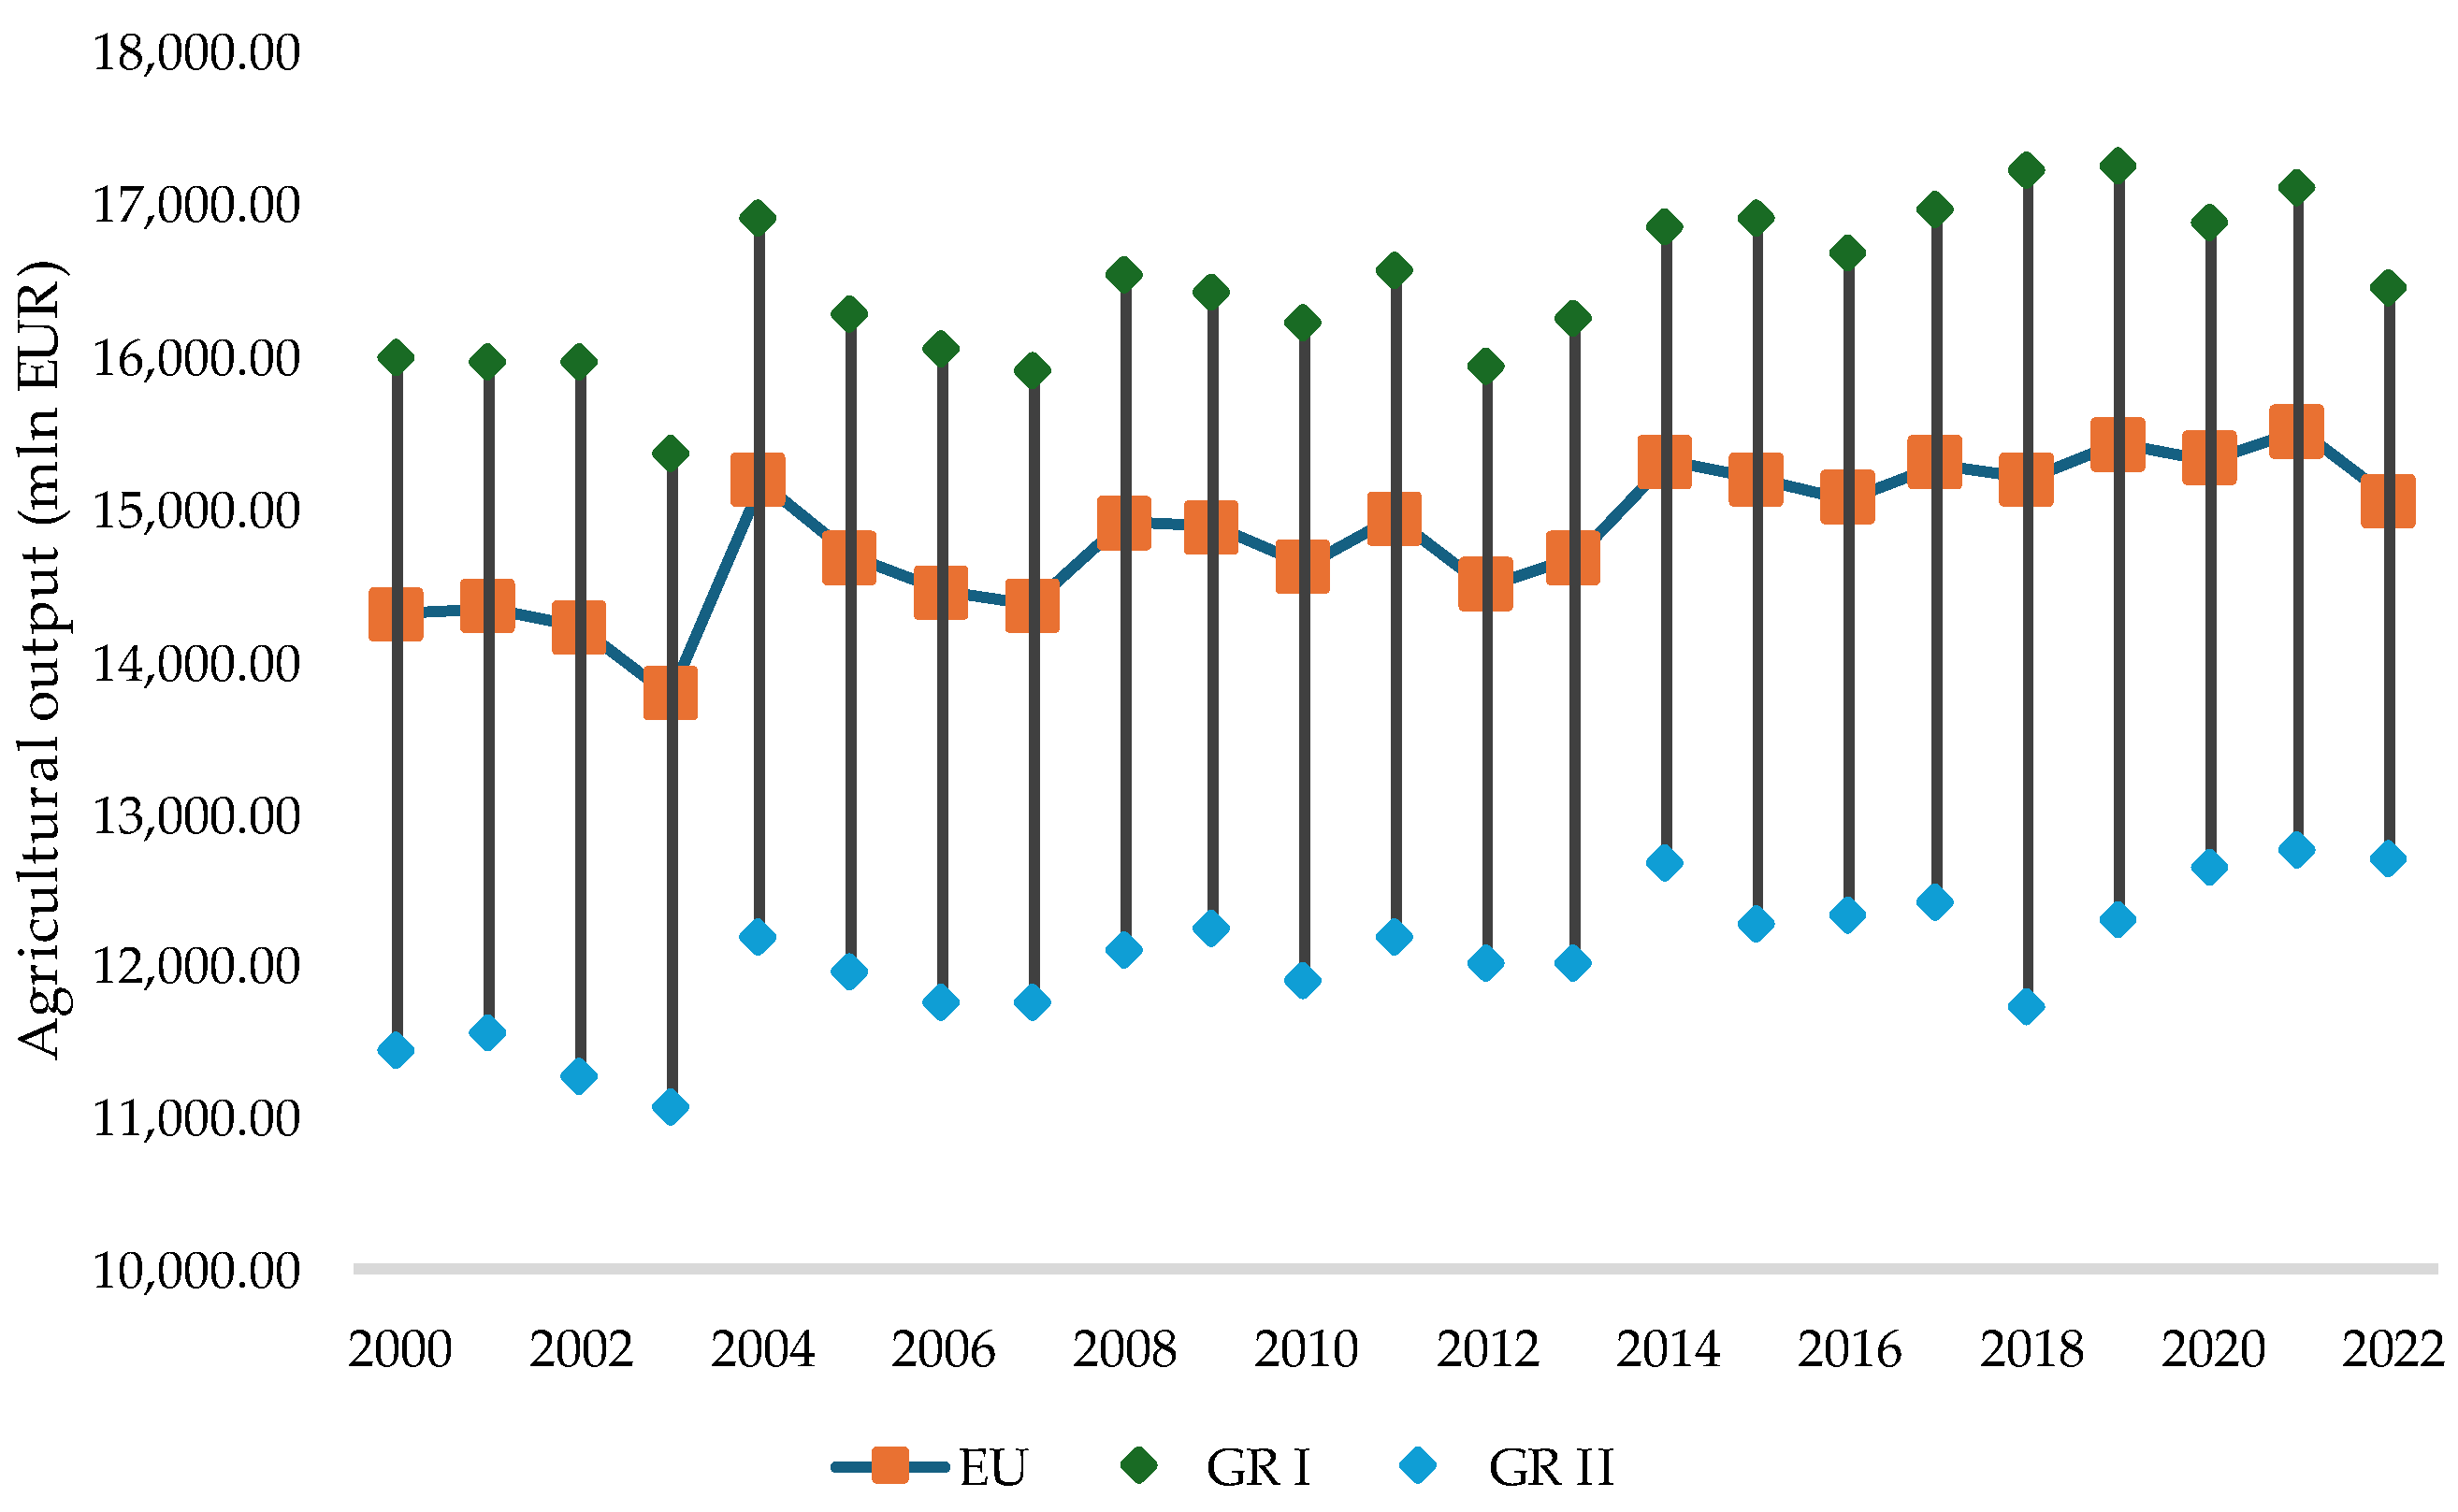
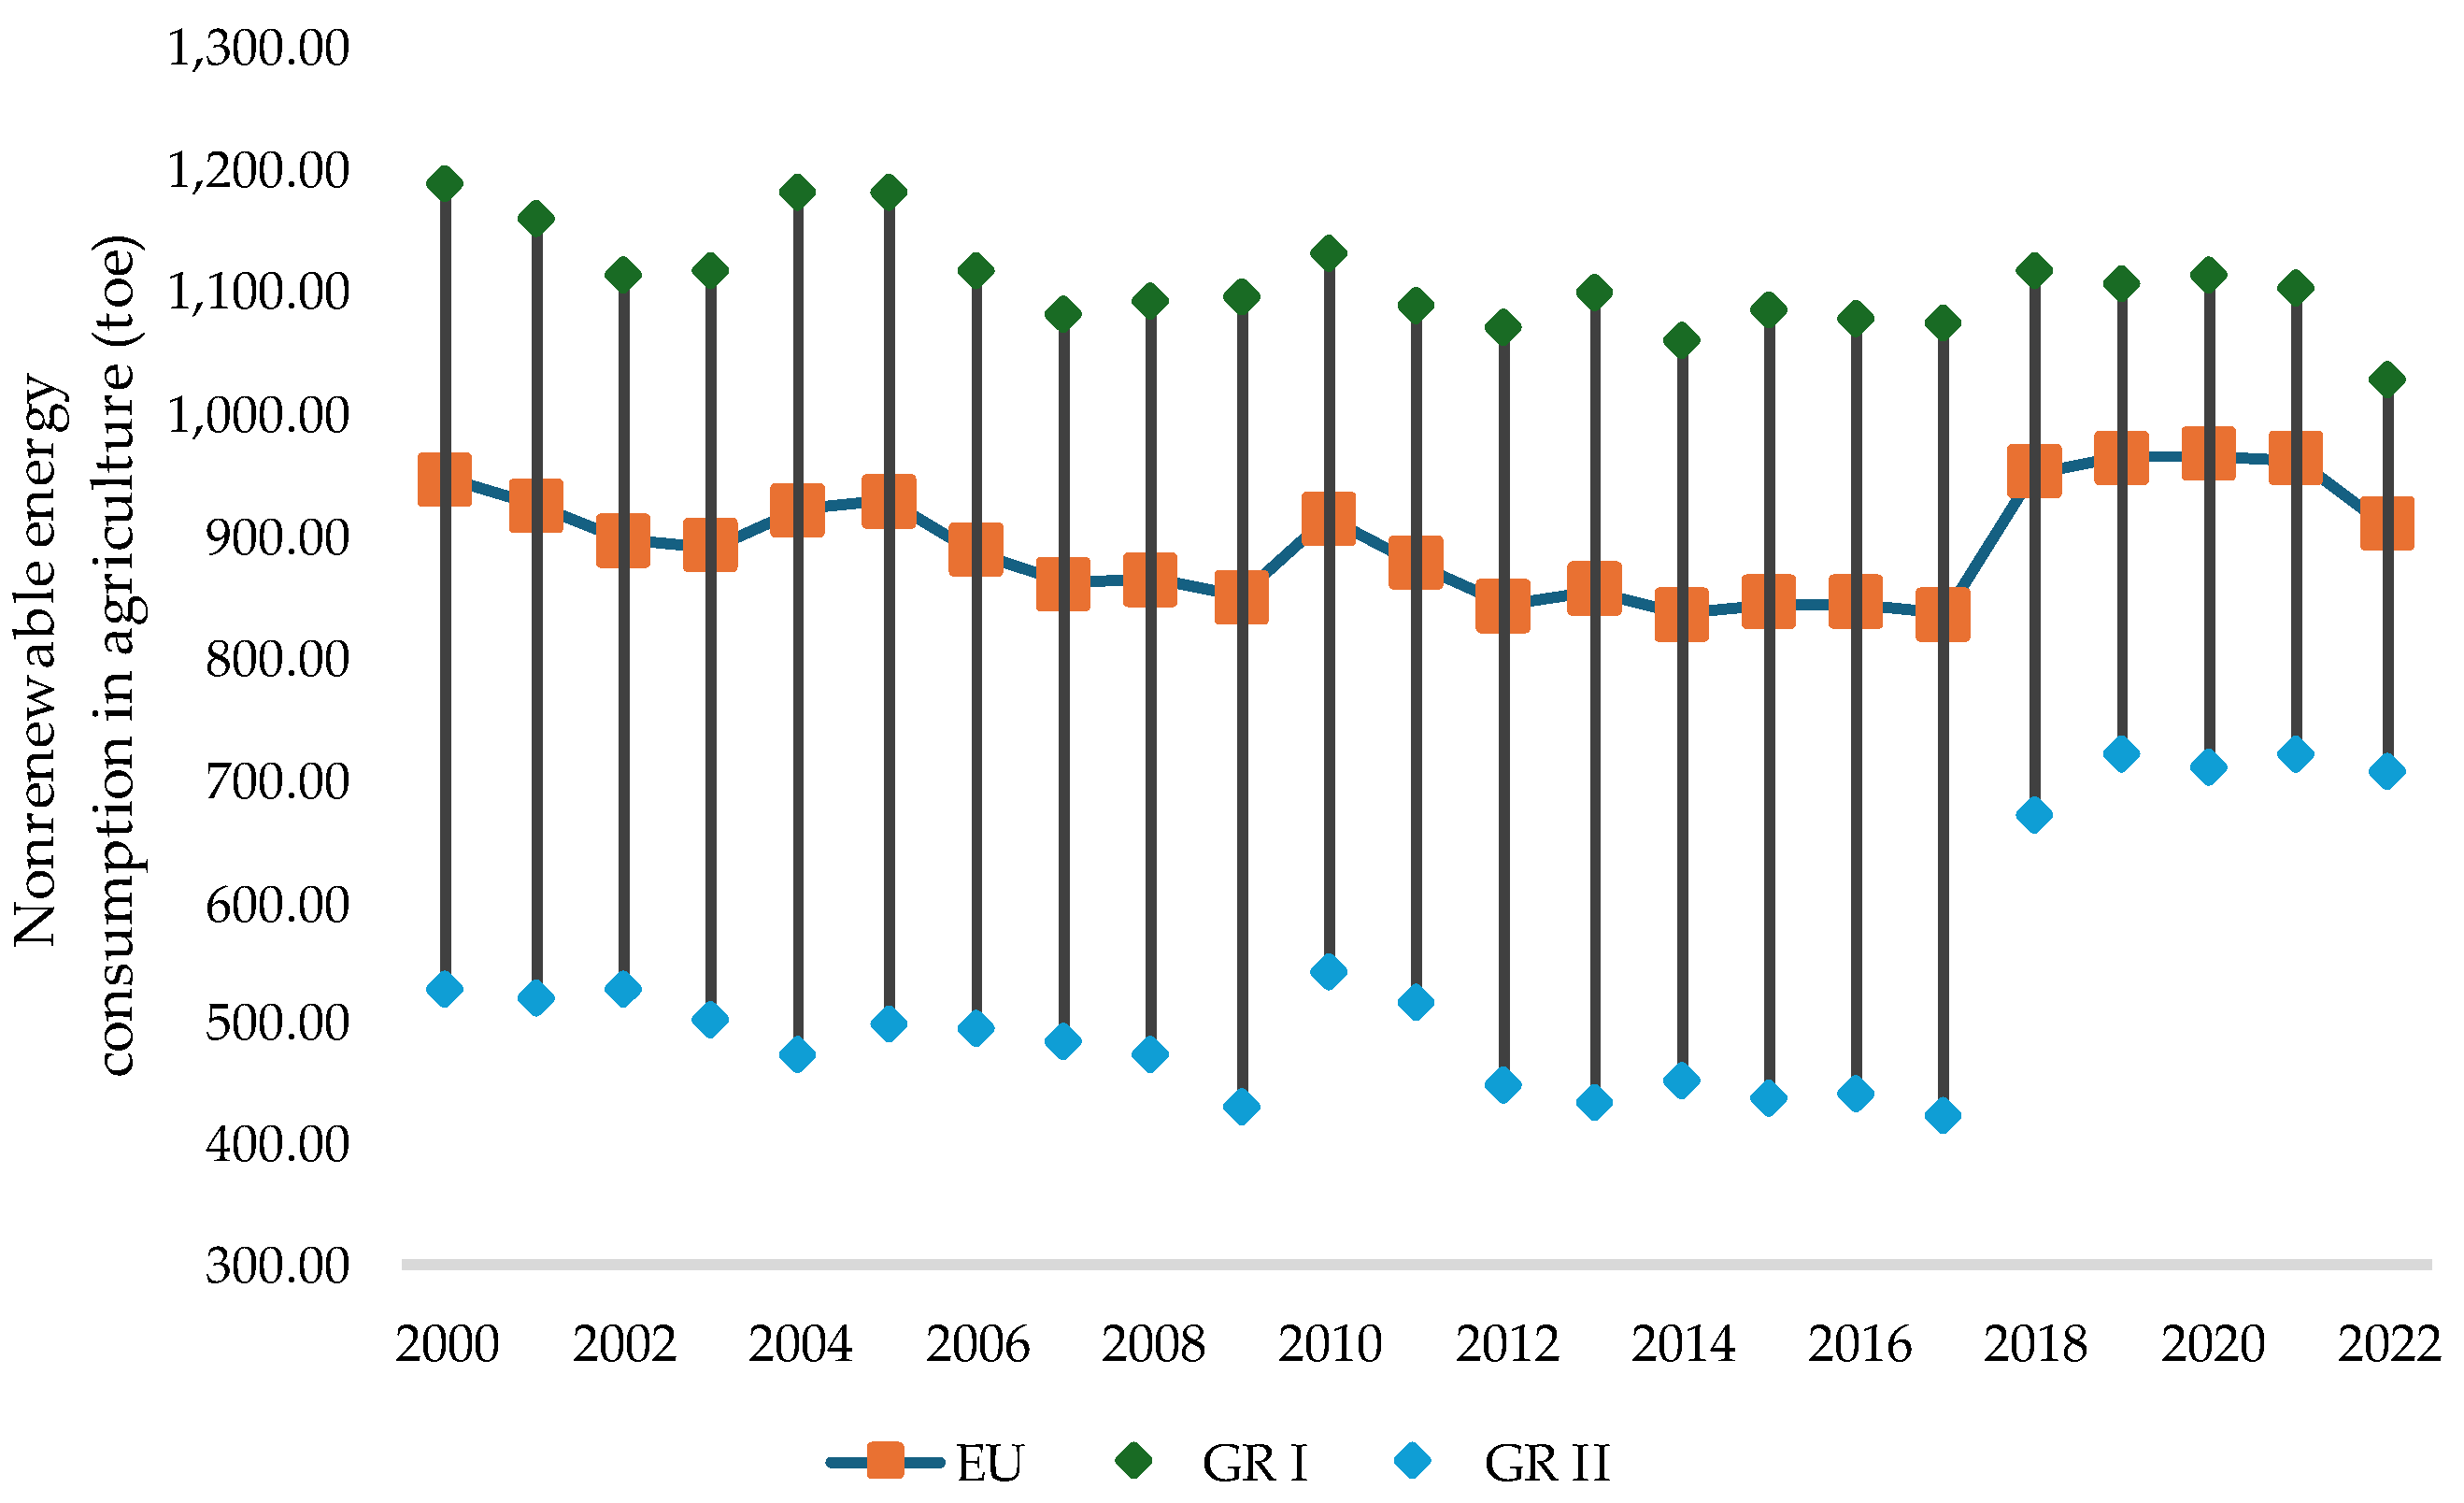
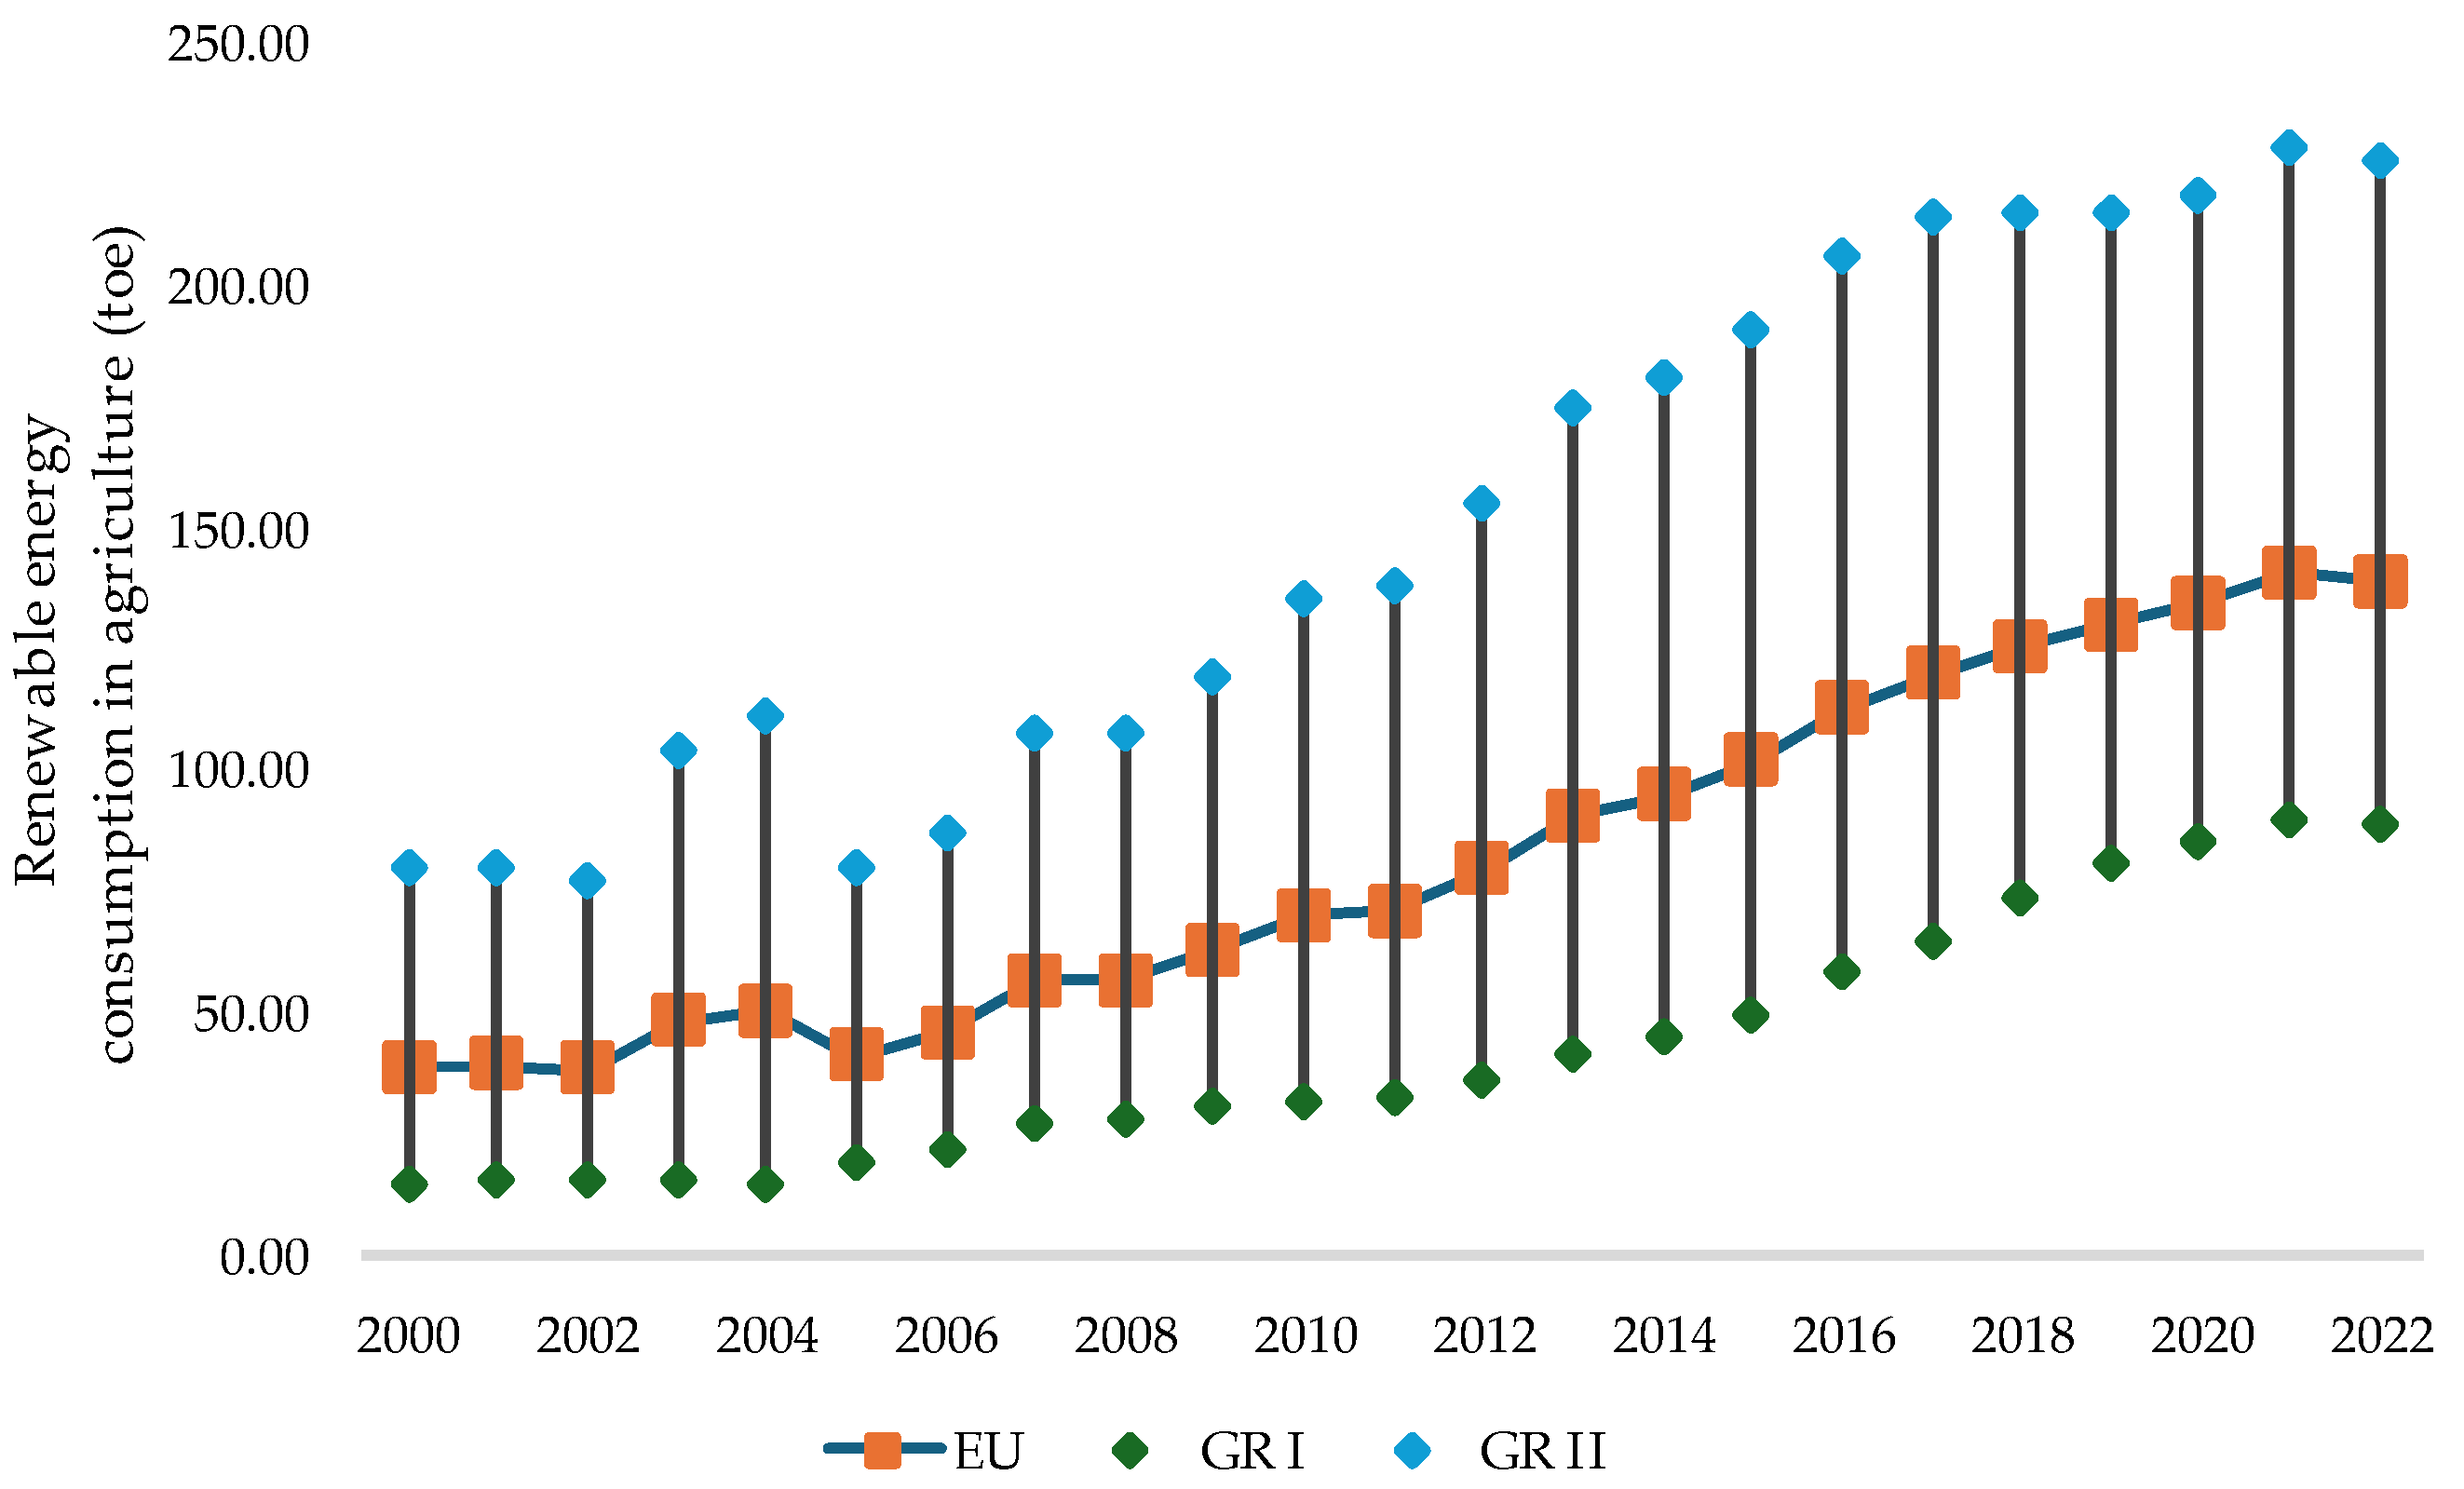
A graphical representation of the primary variables used in the model is shown in Figure 2, Figure 3 and Figure 4. Descriptive statistics for the series studied are shown in Table A1. Regarding the volume of agricultural production, it was relatively stable throughout the analysed period, characterised by minor fluctuations. In Group I countries, agricultural production was higher than in Group II countries. In the case of non-renewable energy consumption, this variable was also stable over the period studied. It was lower in Group II countries but also increased when the level of agricultural production increased. In contrast, non-renewable energy consumption in agriculture increased throughout the period studied in all groups, with a more significant increase in Group II countries. A preliminary analysis of the studied series reveals that while the share of renewable energy in European agriculture steadily increases, non-renewable energy plays a significant role. The demand for energy from fossil fuels increased mainly due to increased agricultural sector production.
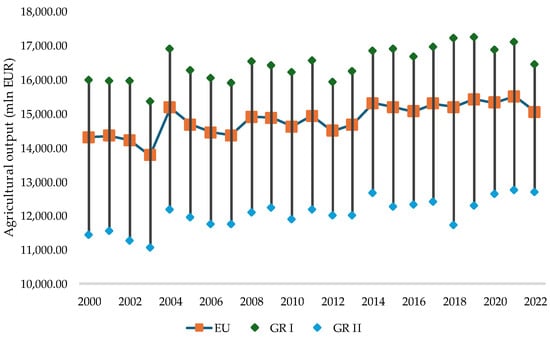
Figure 2.
Agricultural output in studied countries. Source Eurostat.
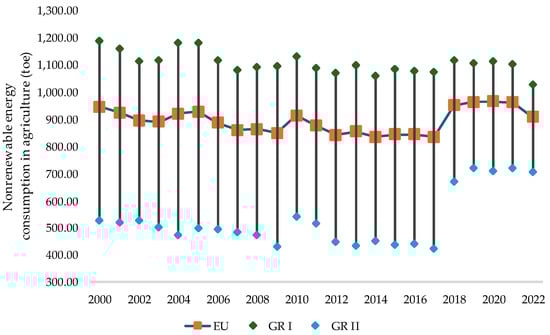
Figure 3.
Non-renewable energy consumption in agriculture in studied countries. Source Eurostat.
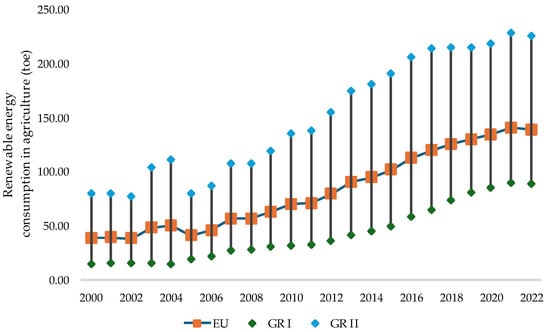
Figure 4.
Renewable energy consumption in agriculture. Source Eurostat.
After dividing the countries under study into two groups, a preliminary data analysis was undertaken to optimise the selection of estimation methods and models. The first step was the cross-sectional dependence analysis, for which the Lagrange Multiplier Breusch–Pagan test was employed. The findings of this analysis dictated the following research procedure steps. The results, presented in Table 4, indicate that all the studied series are characterised by cross-sectional dependence (CSD) across the set and within groups (Hypothesis H0: no correlation between the error terms of different cross-sectional units was rejected at the 0.1% significance level).
Table 4.
Cross-sectional-dependence test (Breusch–Pagan LM test).
The next step involved the implementation of a unit root test. Two first- and second-generation tests were employed to ensure the robustness of the results. In particular, the cross-sectional dependence robust CIPS test was applied. The findings from both tests indicated that all variables were stationary after being differenced once (Table 5).
Table 5.
Unit root test results.
Due to the presence of Cross-sectional Dependence (CSD), the cointegration test proposed by Westerlund, which is robust to such dependence, was conducted. The results obtained, as presented in Table 6, indicate that there is no basis to reject the test’s null hypothesis (H0: No cointegration). The results of the test indicate that there are no long-run correlations for the country groups studied. Therefore, considering the outcomes, an estimation methodology based on a panel Vector Autoregression (VAR) model was employed to model short-run relationships. To address the issue of endogeneity, the generalised method of moments (GMMs) estimator was employed, utilising lagged instruments to achieve consistent results for the VAR model.
Table 6.
Westerlund cointegration test for cross-dependence series.
4.3. Results of Model Estimation and Impulse Response Analysis
Table 7, Table 8 and Table 9 present the results of the panel VAR model estimation for all studied countries, Group I countries, and Group II countries. Table A2 displays the findings of the Granger panel causality tests. The model’s lags and instruments were selected based on the MAIC criterion and J-Hansen statistics. The results of the causality tests indicate a significant causal relationship between ΔlnNREW and ΔlnAP for all countries and individual groups studied. However, with respect to renewable energy consumption, the results show a causal relationship between ΔlnREW and ΔlnAP only in Group II. Additionally, there is a bidirectional causal relationship between the variables ΔlnNREW and ΔlnAP, as well as ΔlnREW and ΔlnAP, in Group II.
Table 7.
PVAR model of the European Union.
Table 8.
PVAR model Group I.
Table 9.
PVAR model Group II.
The data analysis for the models supports the findings of the causality tests. The VAR model results indicate that the impact of the variables ΔlnNREW and ΔlnREW, representing changes in the consumption of different types of energy on agricultural sector production, varies between groups. Specifically, non-renewable energy (ΔlnNREW) has a significant and negative impact on agricultural sector production (ΔlnAP) in all countries and groups. In contrast, the VAR model and causality tests confirm that renewable energy consumption (ΔlnREW) positively affects agricultural production in Group II countries.
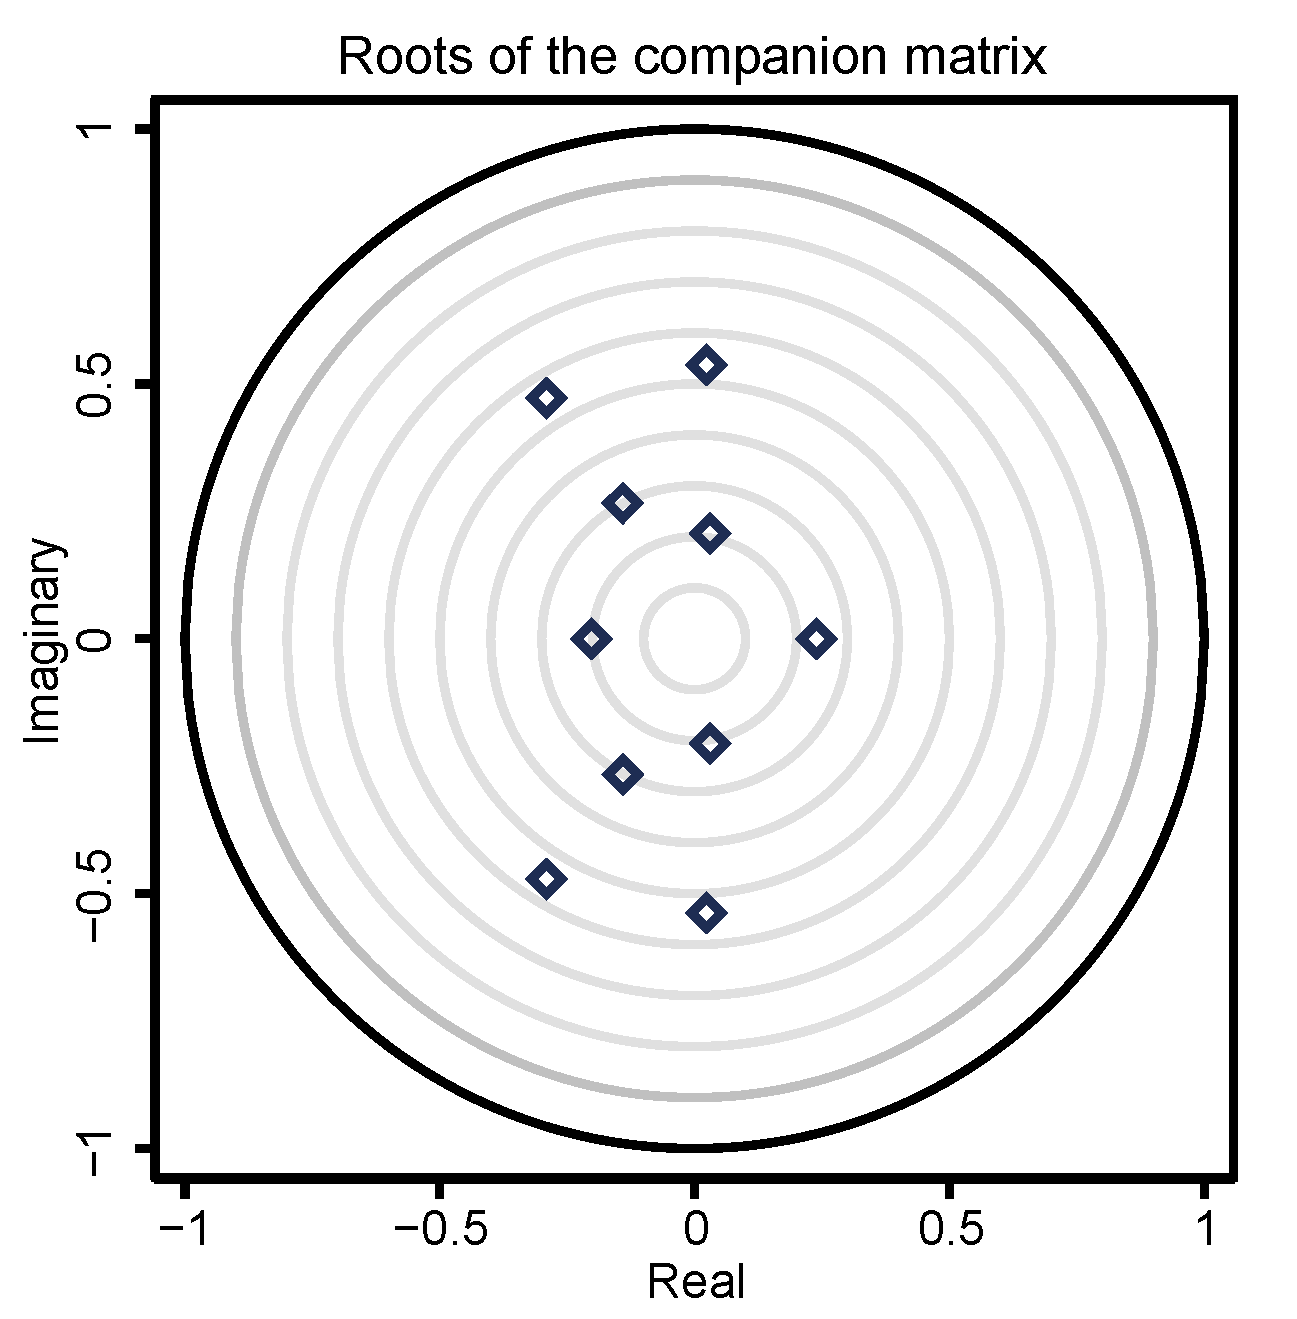
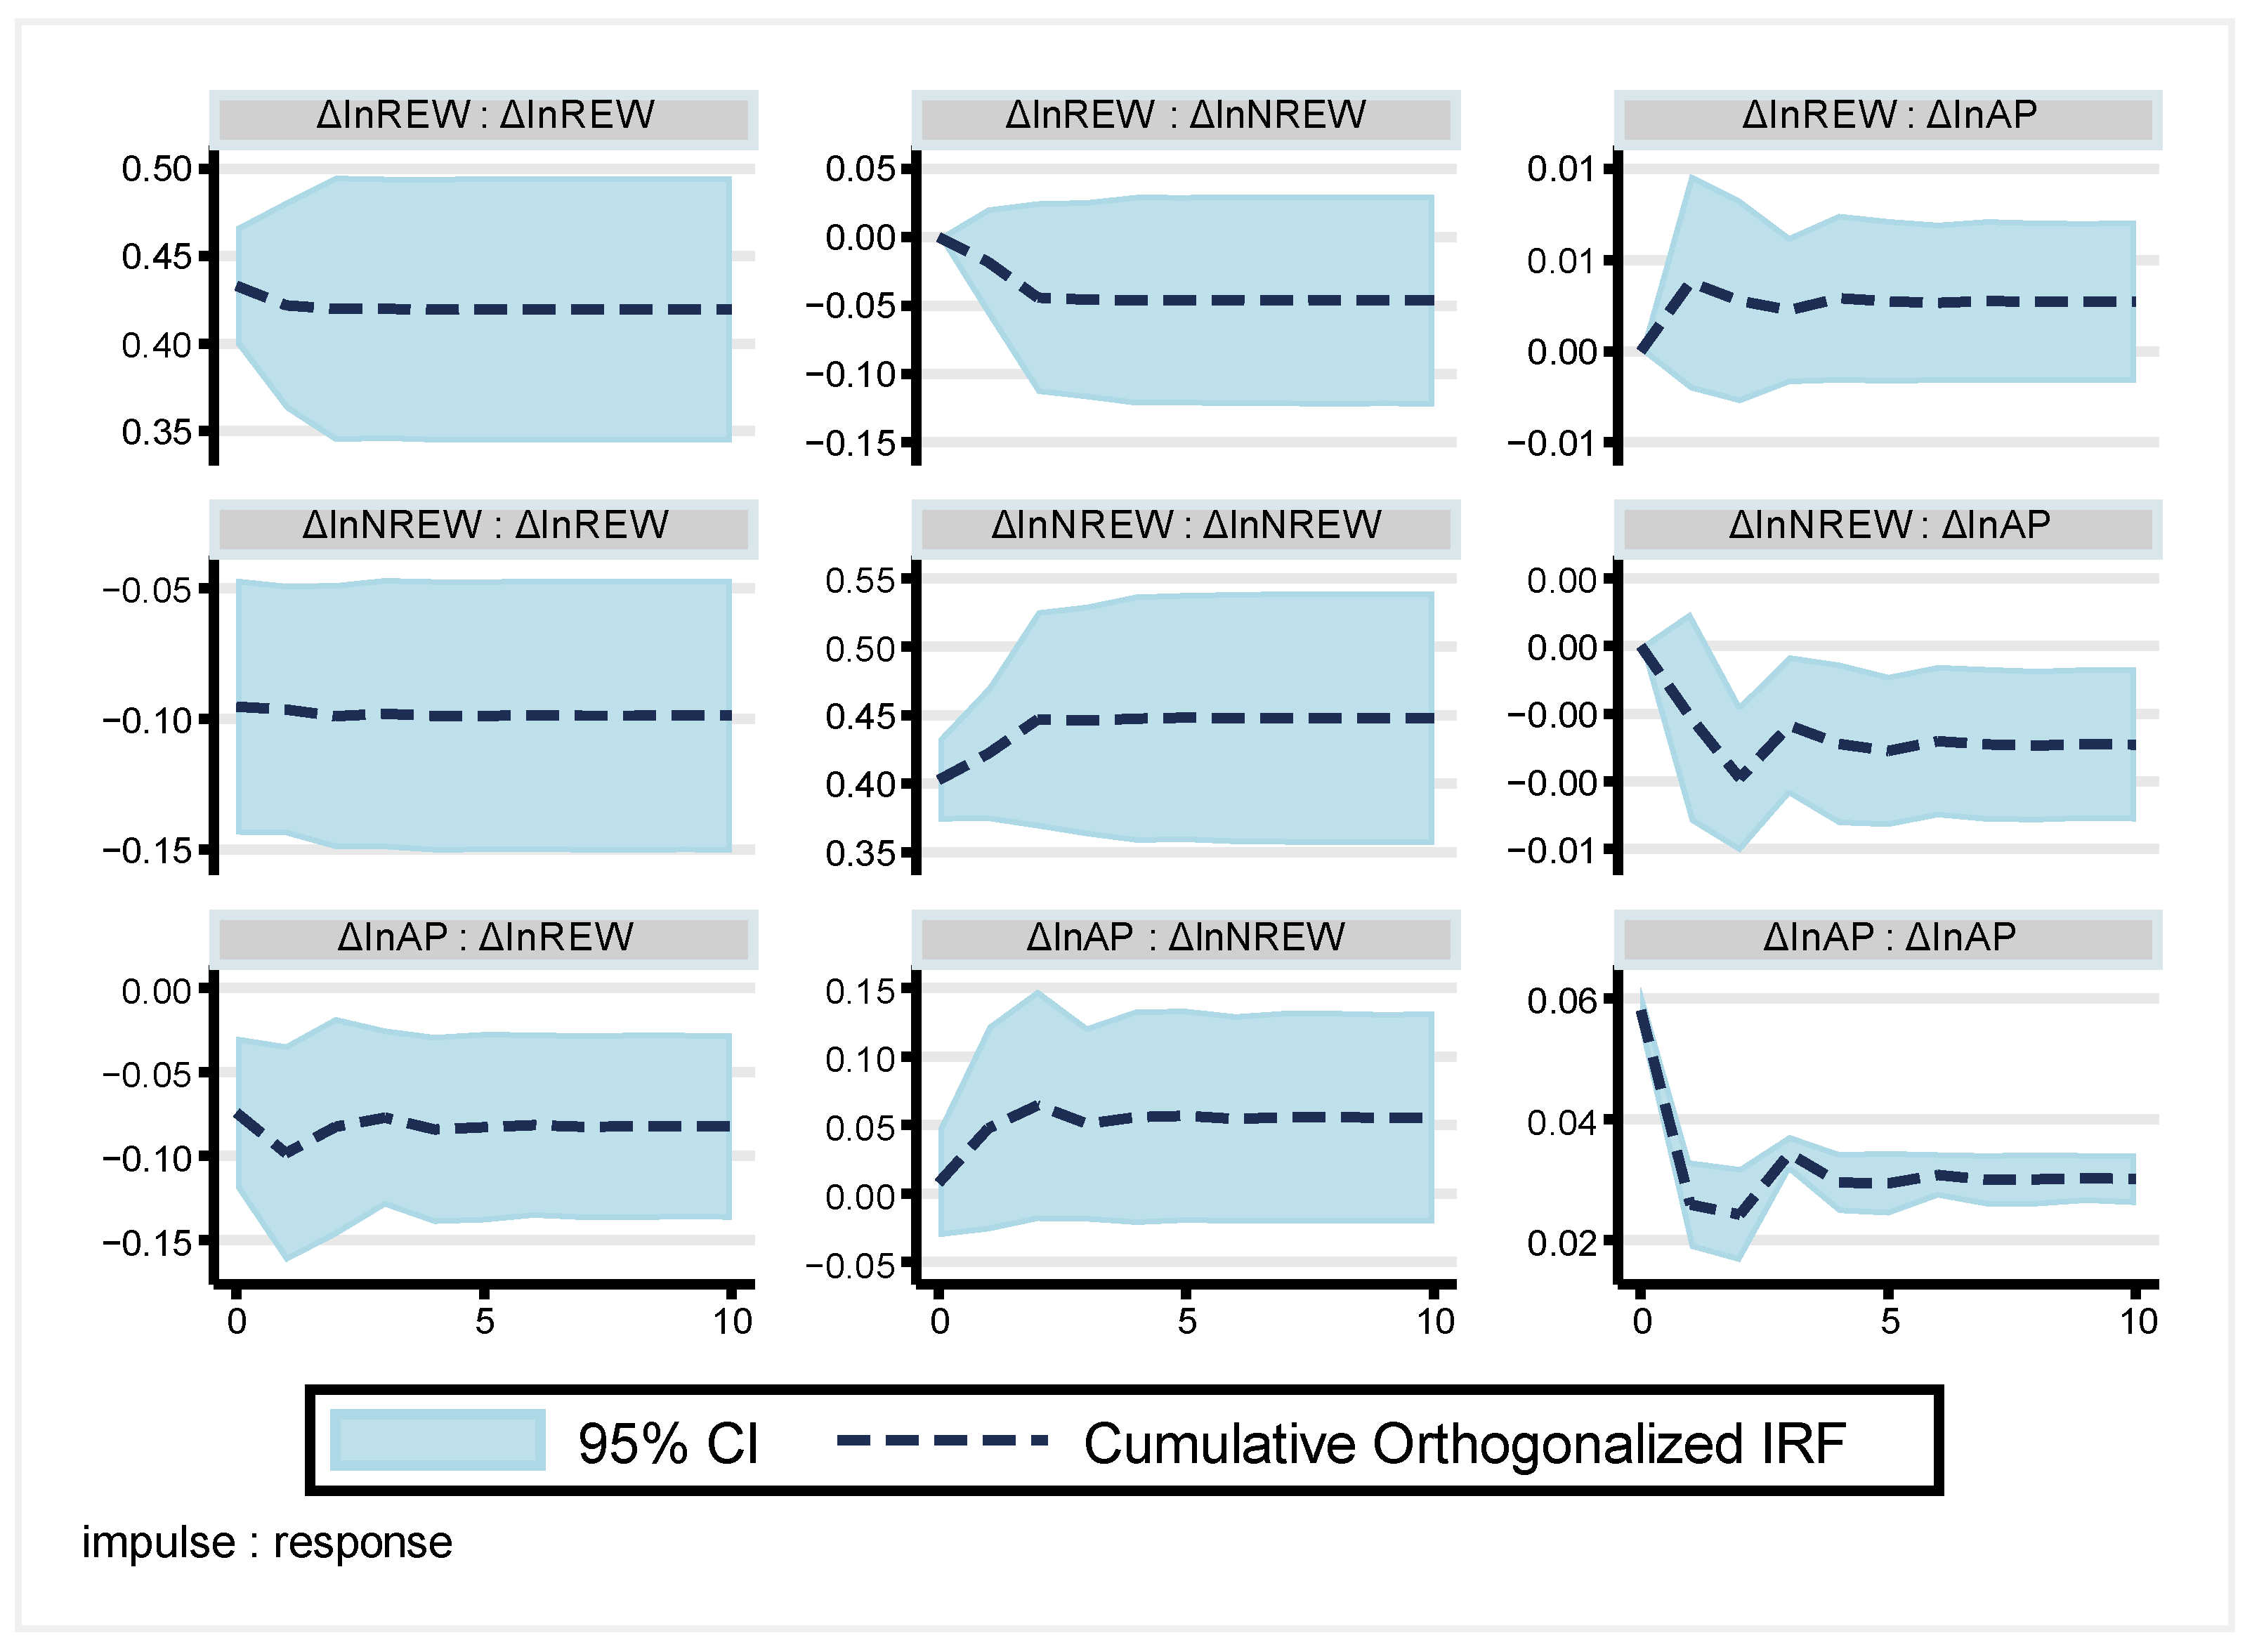
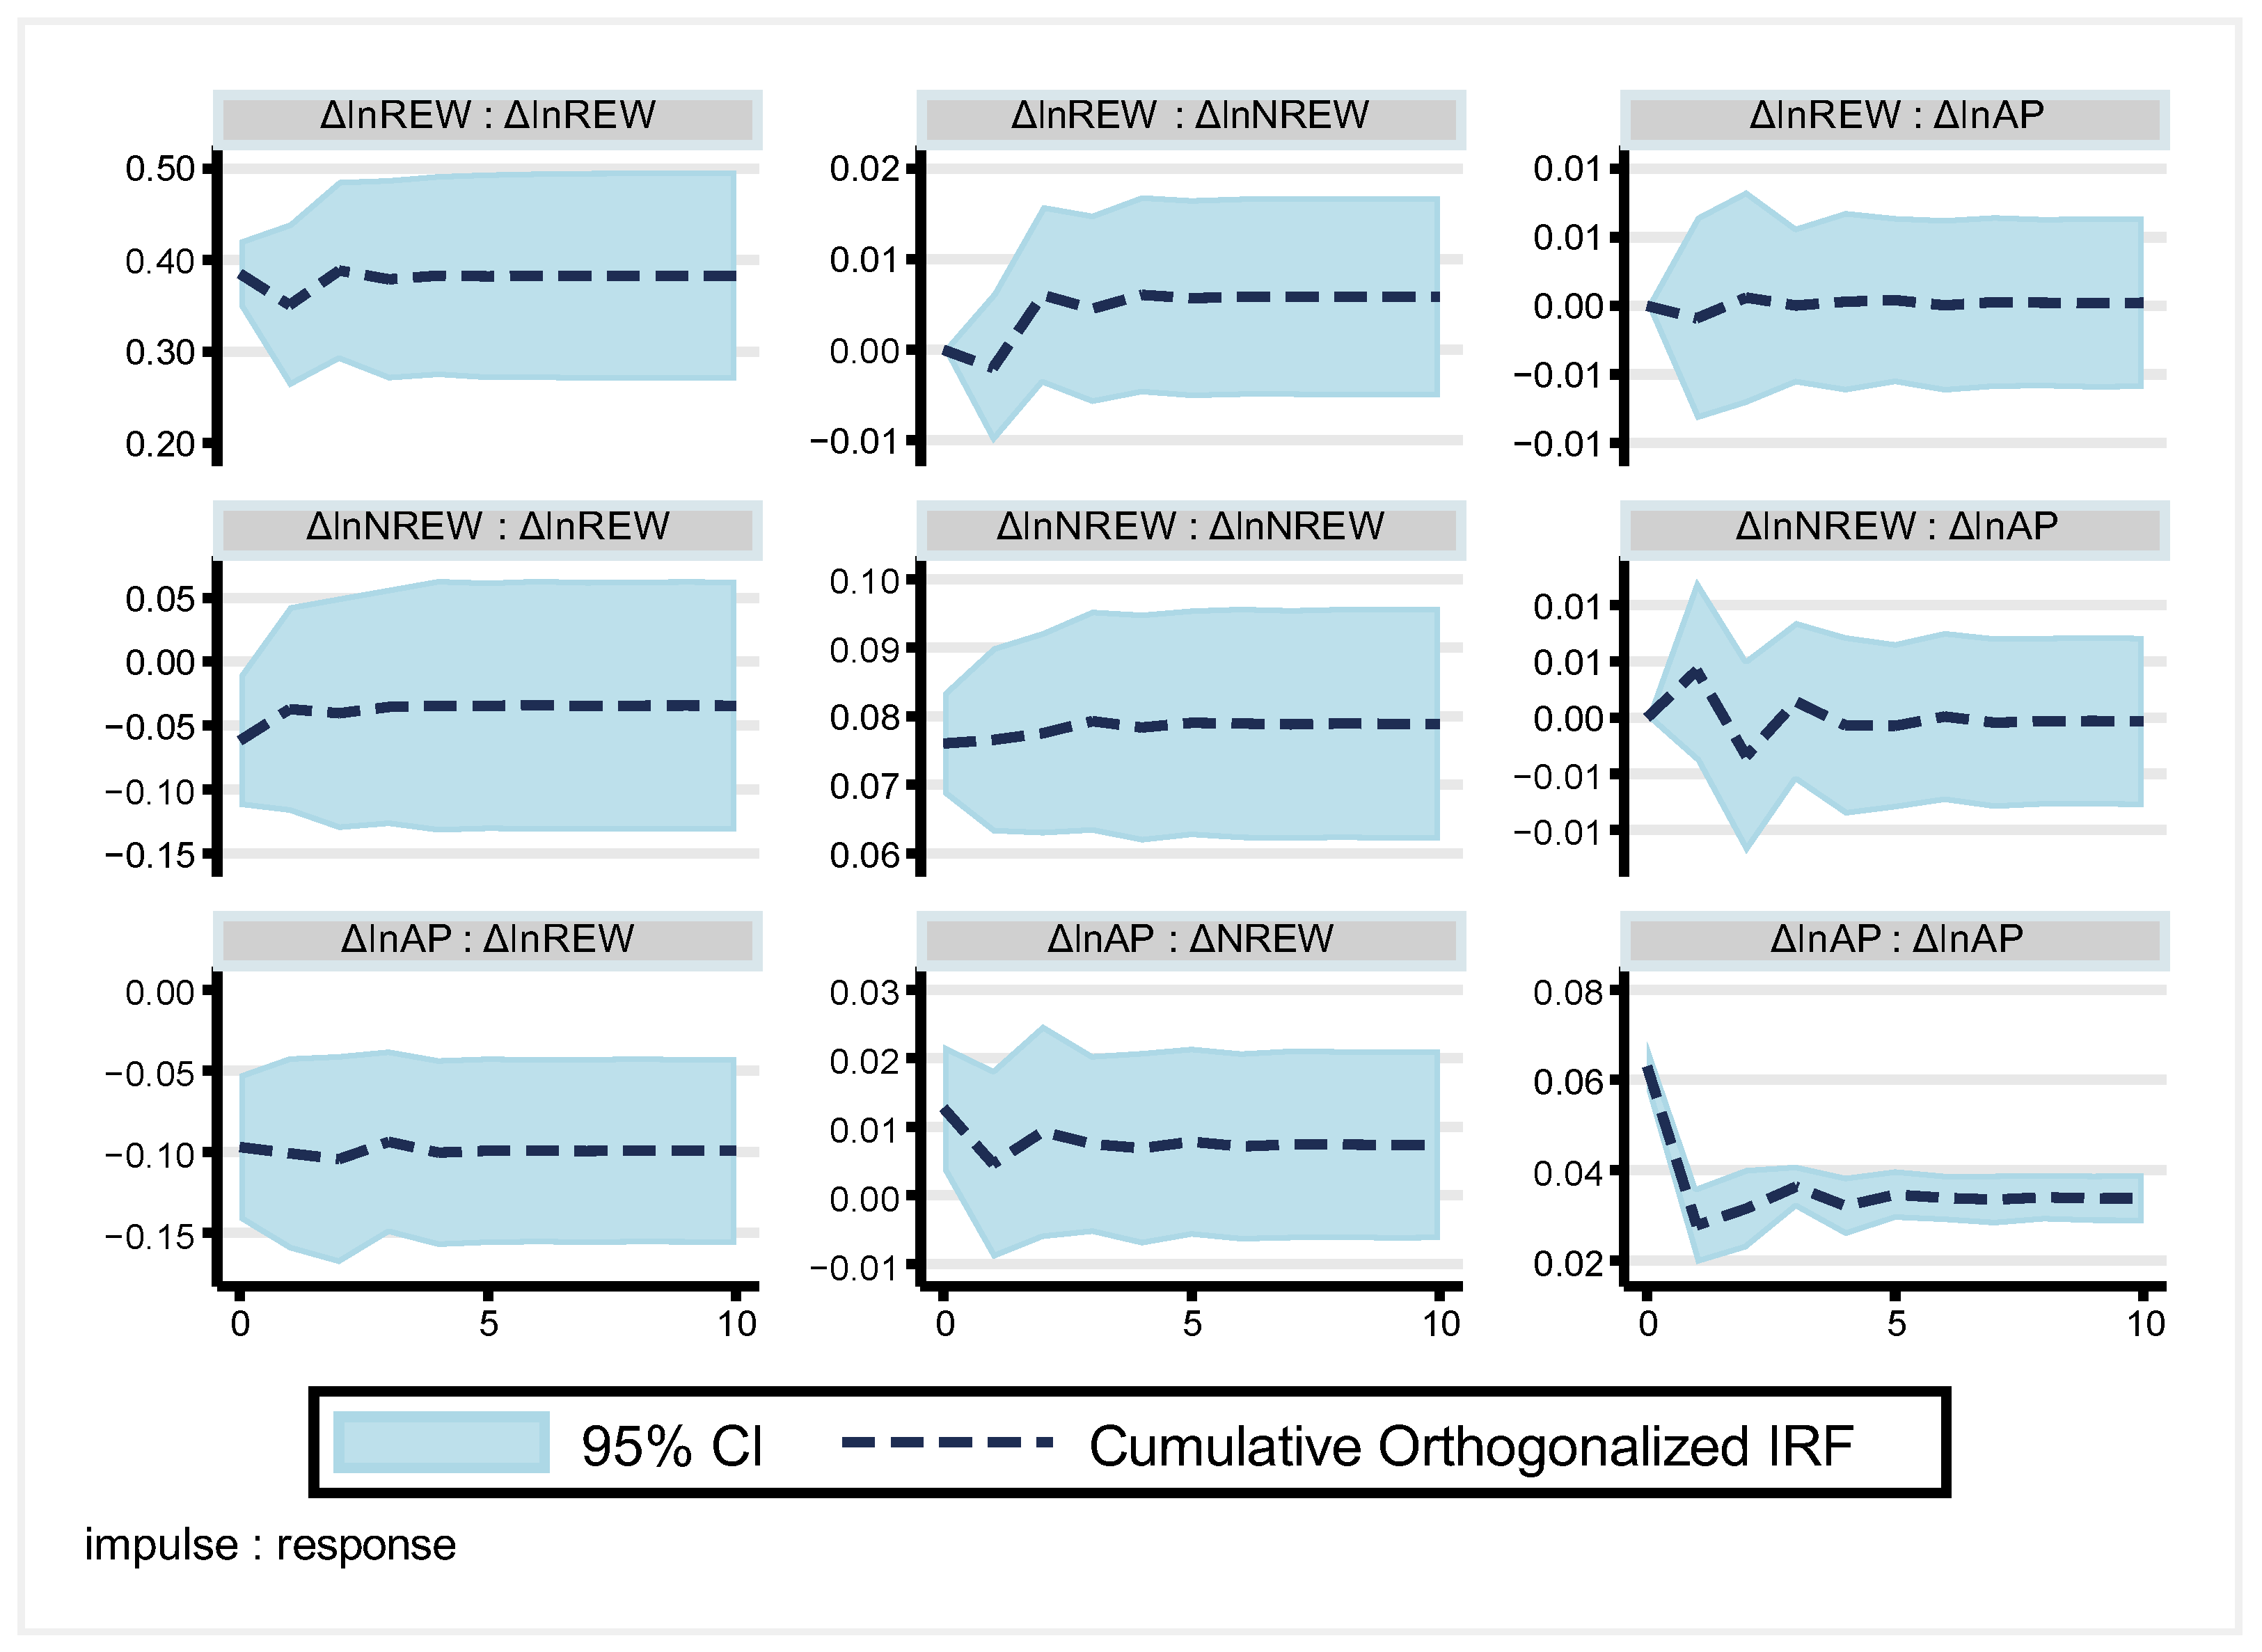
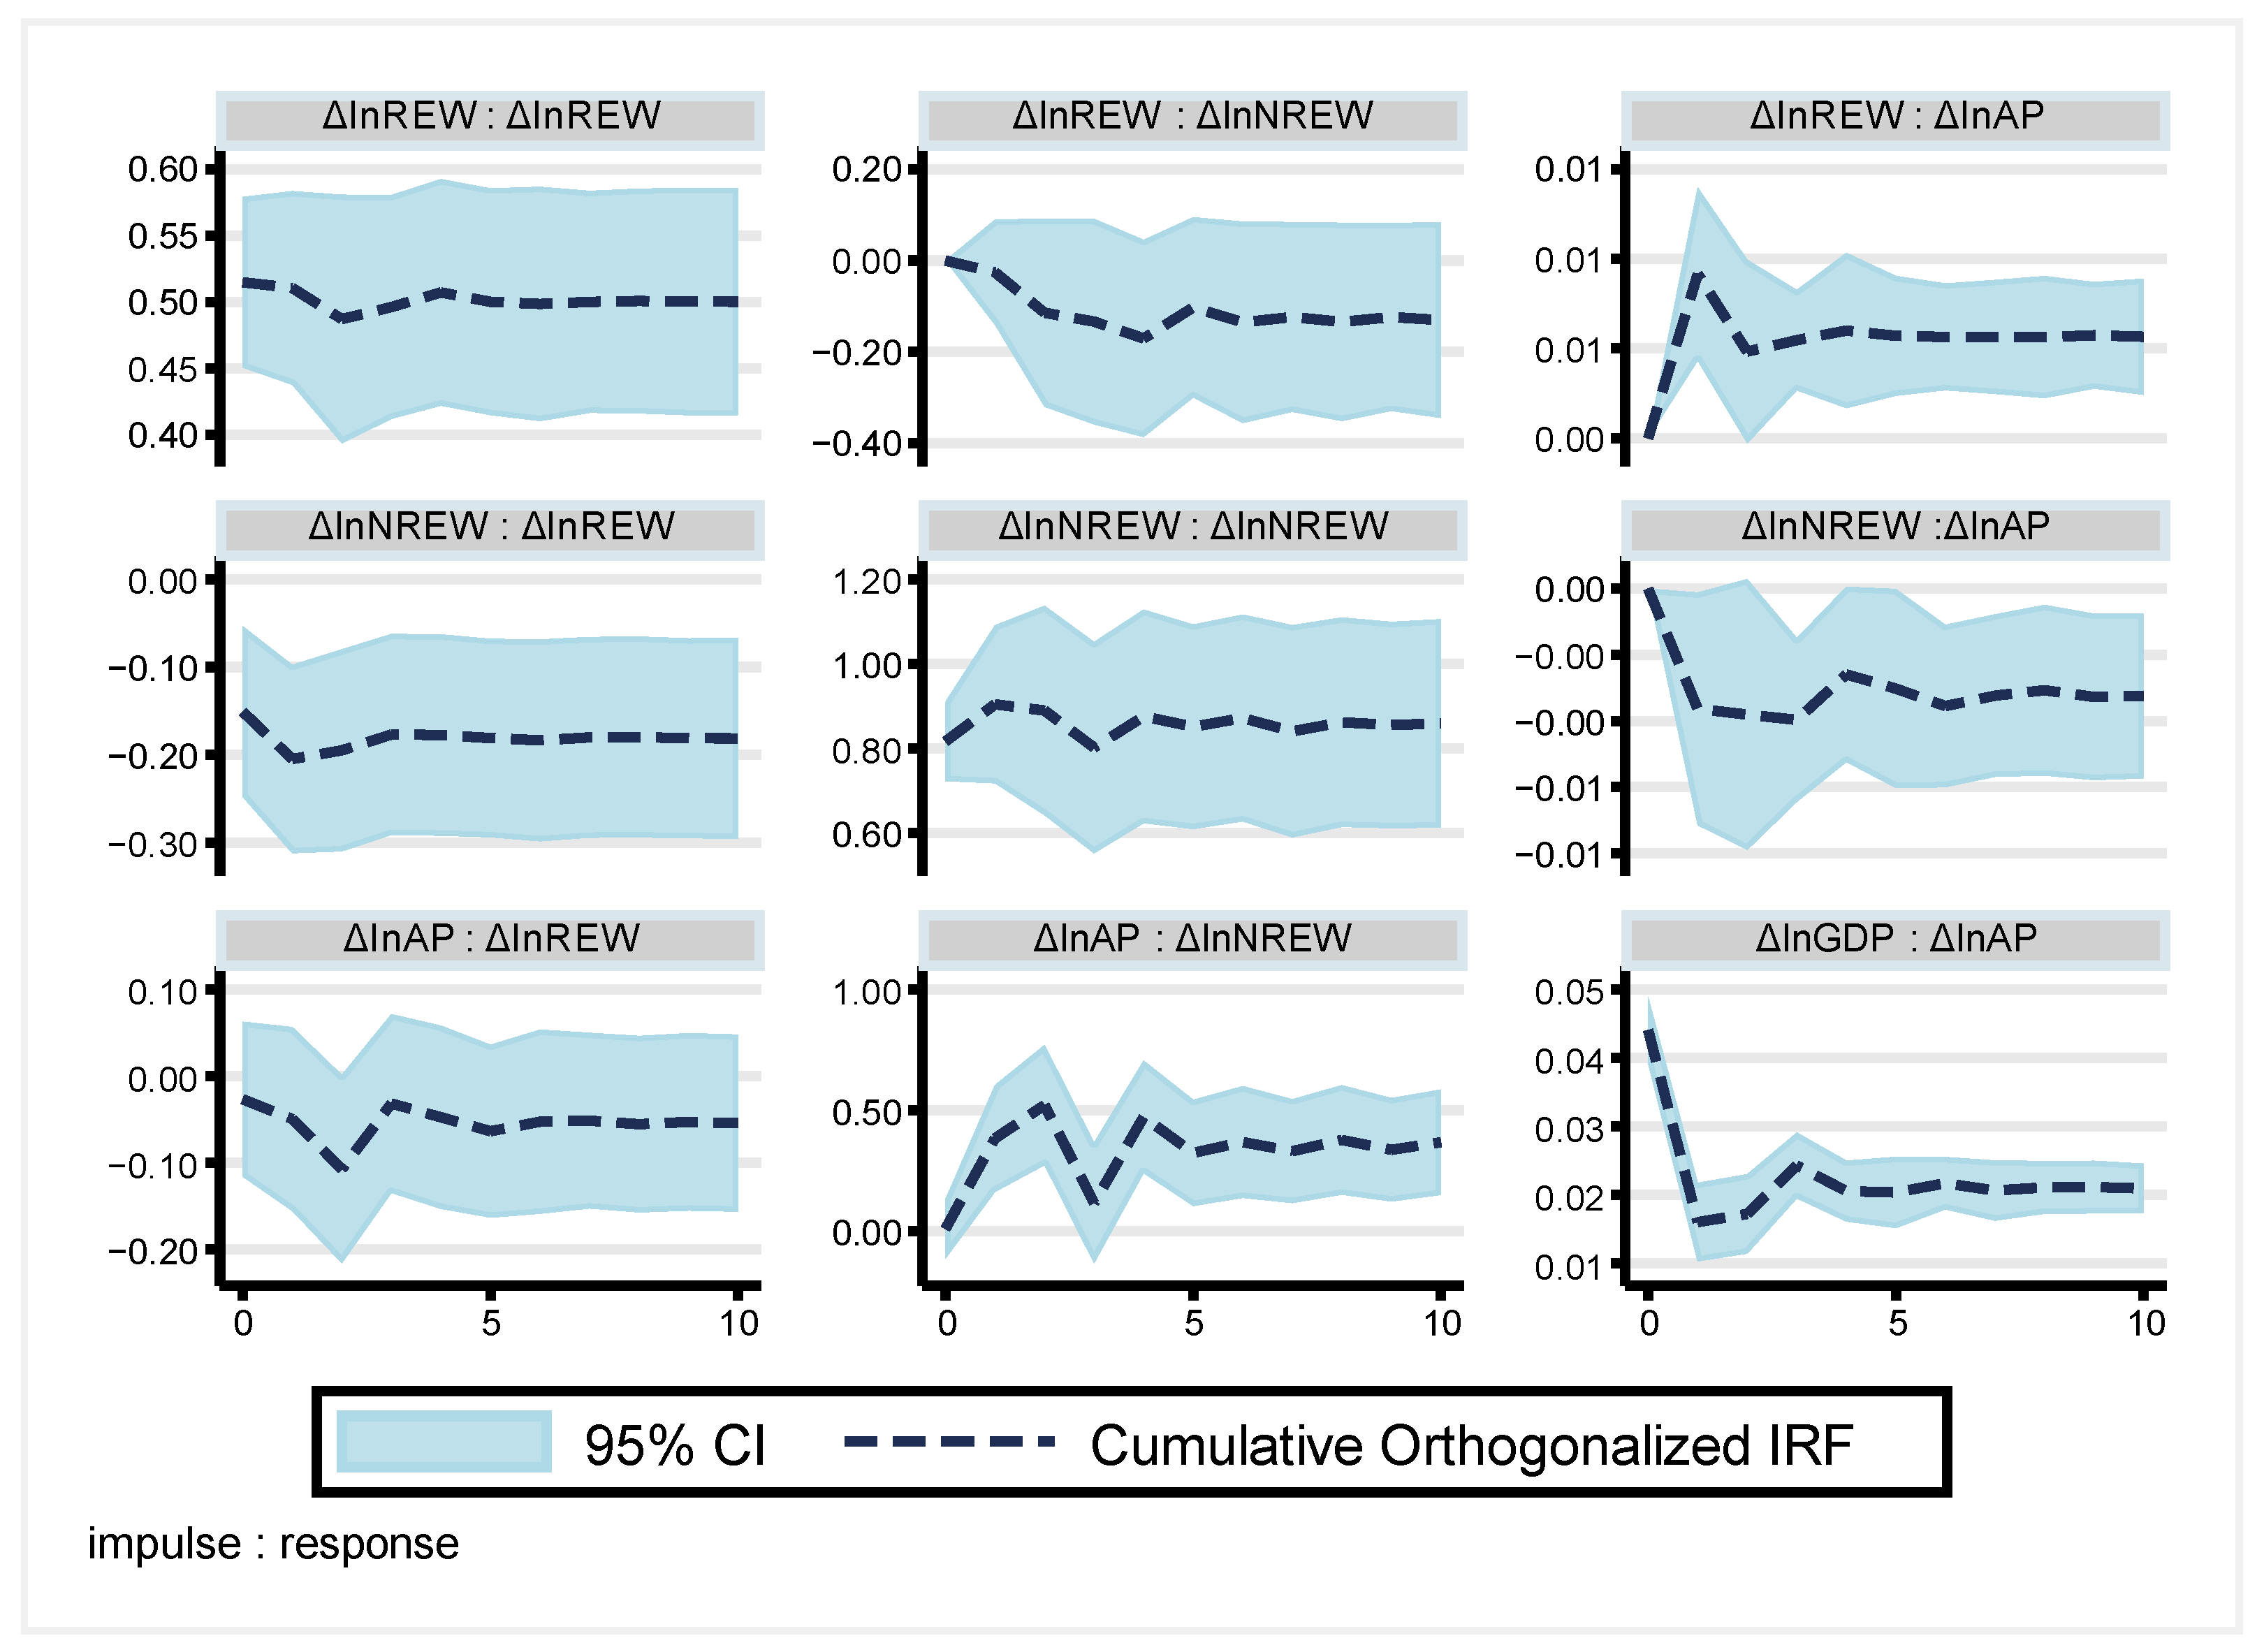
The results of the modulus test for each eigenvalue, presented in Figure A1, Figure A2 and Figure A3, indicate that all values are less than unity, thereby confirming the robustness of the estimation. Using the VAR model, an impulse response function (IRF) analysis was conducted, with results presented in Figure 5, Figure 6 and Figure 7. The horizontal axis represents the number of lags, and the dashed line represents the impulse response value of the response variable following a shock, given a standard deviation of a particular shock variable. The first variable illustrates the impulse affecting the second variable (i.e., the response of the second variable to the impulse).

Figure 5.
IRF analysis for all European Union countries. Source: own study.
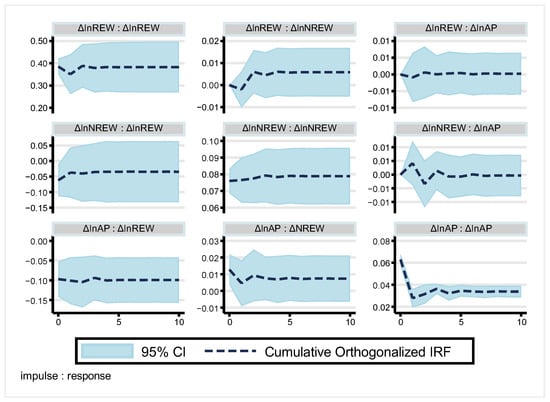
Figure 6.
IRF analysis for Group I. Source: own study.
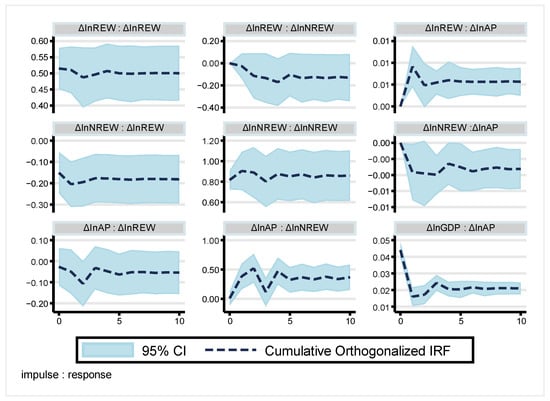
Figure 7.
IRF analysis for Group II. Source: own study.
The findings show that a positive shock in renewable energy consumption (ΔlnREW) leads to a positive response in agricultural sector production (ΔlnAP) across all European Union countries. Particularly notable is the positive response in agricultural sector production (ΔlnAP) associated with increased renewable energy consumption in countries with more sustainable agricultural practices (Group II). In this group, the results are also significant in terms of causality tests and VAR model results. In contrast, for countries with less sustainable agricultural practices (Group I), the response to a positive shock in renewable energy consumption (ΔlnREW) is not statistically significant for agricultural sector production (ΔlnAP).
A positive shock in non-renewable energy consumption (ΔlnNREW) leads to a statistically significant negative response in agricultural sector production (ΔlnAP) for all countries and for the group with sustainable agricultural practices. In countries with less sustainable agricultural practices, a positive shock in non-renewable energy consumption (ΔlnNREW) initially generates a positive response in agricultural production (ΔlnAP) levels but subsequently leads to a statistically significant negative response. The results also indicate interactions between agricultural production and the consumption of renewable and non-renewable energy sources. For all studied countries, a positive shock in agricultural production (ΔlnAP) leads to a positive response in non-renewable energy consumption (lnNREW). This response remains relatively stable in Group I, whereas in Group II, it initially rises and then declines. In countries with more sustainable agricultural practices (Group II), a positive shock in agricultural production (ΔlnAP) initially leads to a statistically significant negative response in renewable energy consumption (ΔlnREW), followed by a positive response in subsequent periods. Importantly, in Group II countries, a positive shock in renewable energy consumption (ΔlnREW) leads to a statistically significant negative response in non-renewable energy consumption (ΔlnNREW).
The impulse response functions for agricultural production to shocks in non-renewable and renewable energy consumption reveal clear patterns of impact over time. When non-renewable energy consumption experiences a shock, it initially causes a notable and significant response, which remains strong over time. This impact does not dissipate quickly; instead, it stabilizes and maintains a consistent level throughout the observed period, indicating that the effect of a shock on non-renewable energy consumption is both substantial and durable. On the other hand, shocks to renewable energy consumption result in a significant initial effect, which also remains substantial over time. Although there is a slight decrease in impact as time progresses, the response stabilizes at a high level, demonstrating that the effect of a shock to renewable energy consumption is enduring. Overall, both types of energy consumption exhibit a durable response to their respective shocks, with renewable energy consumption showing a more substantial and enduring impact compared to non-renewable energy consumption.
5. Discussion
The results indicated that an increase in renewable energy consumption in agriculture can positively impact agricultural sector production levels. However, this impact is significant in countries with more sustainable agriculture practices, a higher share of organic farms, and renewable energy in agricultural production. These findings suggest that energy transition and pursuing ecological practices in European agriculture can yield benefits, especially for the agricultural sector. Furthermore, according to the models obtained, renewable energy can effectively replace non-renewable energy in agriculture and improve production efficiency. Finally, increasing agricultural production requires increased energy consumption; therefore, considering simultaneous efforts to reduce CO2 emissions in the European Union, agriculture necessitates the development of renewable energy sources (RESs).
As previously stated in the literature review, studies of a similar nature and subject are scarce. Moreover, these studies focus on countries with economic characteristics that differ from those in the European Union. Additionally, the methodologies employed in these select studies diverge significantly from those employed in the present study. Consequently, it is imperative to interpret the obtained results cautiously, particularly concerning the overall results. Firstly, the results presented here are akin to those reported by Papież et al. [36] in their study on the relationship between renewable energy consumption and GDP in EU countries, though they did not specifically isolate the agricultural sector. The authors found that the larger the share of the renewable energy sector in the economy, the more noticeable the interdependence between economic growth and renewable electricity consumption. The results are, therefore, similar to those obtained in this study for the agricultural sector.
Secondly, the results obtained corroborate the conclusions of Rokicki et al. [52], who, in their study, indicated that the increase in energy consumption in European agriculture occurs as agricultural production intensifies. Thirdly, the results of this study confirm and extend the observations of Suproń and Myszczyszyn [5] for the Three Seas Initiative. and Łącka et al. for the EU countries. According to the research cited and the findings of this study, it can be confirmed that renewable energy in agriculture demonstrates a bidirectional causal relationship, not only responding to the increase in agricultural production but also generating it through the utilisation of agricultural raw materials for RES production. Conversely, the results obtained do not support the theses indicated by Liu et al. [37] about the lack of any impact of renewable energy on agriculture.
The results also indicate that non-renewable energy sources can have a negative impact on agricultural production due to their limited availability, environmental unfriendliness, and external costs [52,70,75]. Reliance on non-renewable energy in agriculture can lead to environmental pollution, contamination of agricultural products, and vulnerability to external shocks [37,83]. In addition, non-renewable energy in the European Union is subject to high environmental fees and charges, which translates into higher production costs in countries with a higher share of fossil fuels in the energy mix [84].
Considering previous research and the obtained results, it can be concluded that hypothesis H1, which states that renewable energy replaces non-renewable energy in countries with a higher share of green agriculture without negatively impacting agricultural production, has been positively verified. Likewise, hypothesis H2, which indicates a bidirectional causal relationship where an increase in agricultural production raises renewable energy consumption and an increase in renewable energy consumption boosts agricultural production, has also been positively verified in this study. Since this study employed a VAR model, the results should be interpreted in the context of short-term interactions.
6. Conclusions
The obtained results provide significant evidence in two areas. Firstly, European Union countries differ in their utilisation of sustainable agriculture, which has implications for energy use and agricultural production efficiency. This study identified two groups of countries, with seven countries significantly standing out from the rest of the community regarding the share of organic farming, low pesticide use, and renewable energy in agriculture. The remaining countries still need to strive to improve these aspects of agricultural production to meet European climate policy goals.
Secondly, renewable energy has a positive impact on agricultural sector production. However, the condition for such an effect is its relatively large share in agricultural production. This study indicates that renewable energy forms the basis for production growth in countries with more sustainable agriculture. Furthermore, the results suggest that in this group of countries, renewable energy can replace non-renewable energy sources in agriculture. It should be noted, however, that the positive aspects emerge as the share of sustainable agricultural practices increases.
Thus, based on this study’s results, it can be indicated that energy transformation and the green deal in agriculture can bring positive aspects in combating environmental pollution and providing tangible benefits for agricultural producers. Therefore, the development of renewable energy is a positive impetus for production growth. Importantly, non-renewable energy does not generate such an effect and may even harm agricultural production.
The obtained results have significant political implications. Primarily, the green energy transformation and the greening of agriculture, despite concerns and the potential decrease in competitiveness, do not solely produce adverse effects for the agricultural sector, including farmers. Instead, they act as positive stimuli for production growth and income growth. Unfortunately, in the short term, especially for small family farms with limited land area and low market sales ratios, the necessity to incur investment costs and change orientation may raise serious concerns. In this regard, active government involvement and a serious debate on the European Green Deal, currently being conducted within the EU, are essential.
Indeed, green agriculture is desirable from a social interest standpoint, as it can provide more valuable products while minimising environmental damage in the form of CO2 emissions. In addition, green energy in agriculture presents an opportunity for the agricultural sector. This is clear in developing biogas production and using poor soils for solar and wind installations. Consequently, the agricultural sector can receive help from cheaper energy for its needs and participate in its production. It also contributes to energy security and resilience, which are particularly important in geopolitical uncertainty. However, it should be noted that due to significant regional variations, agricultural producers may have serious concerns regarding costs and the necessity for new investments in the short term. This is especially relevant given the intense competition from other countries where conventional energy sources are relatively inexpensive.
Considering the political implications of the results obtained, policymakers should not withdraw from the main provisions of green transformation in agriculture but rather strive for its implementation while maintaining dialogue with agricultural producers. They must also be aware of the considerable diversity in agriculture resulting from historical, climatic, social, and geographical factors. Simultaneously, educational initiatives on the positive aspects of increased use of renewable energy in agriculture are necessary. Efforts should also be made to develop appropriate support programs for developing organic farming and renewable energy sources, which will be accessible to all participants in the agricultural sector. Furthermore, it is essential to create favourable legal and tax frameworks for agricultural producers developing their agricultural production based on renewable energy.
Supplementary Materials
The following supporting information can be downloaded at: https://www.mdpi.com/article/10.3390/en17153743/s1.
Author Contributions
Conceptualisation, B.S. and J.M.; methodology, B.S.; software, B.S.; validation, B.S. and J.M.; formal analysis, B.S. and J.M.; investigation, B.S. and J.M.; resources, B.S.; data curation, B.S.; writing—original draft preparation, B.S. and J.M.; writing—review and editing, B.S. and J.M.; supervision, B.S. and J.M.; project administration, B.S.; funding acquisition, B.S. and J.M. All authors have read and agreed to the published version of the manuscript.
Funding
This research was funded by a project within the framework of the Faculty of Economics, West Pomeranian University of Technology in Szczecin, Poland, under the name “Green-lab”.
Data Availability Statement
The data upon which this article is based are supported by different data portals such as national government pages, repositories, and other data sources.
Acknowledgments
The research results were presented at the international scientific conference “New sustainable economy—dilemmas and challenges”, Szczecin-Międzyzdroje on 9 May 2024.
Conflicts of Interest
The authors declare no conflicts of interest.
Appendix A
Table A1.
Descriptive statistics for the main variables of the model.
Table A1.
Descriptive statistics for the main variables of the model.
| European Union | ||||||
|---|---|---|---|---|---|---|
| 2000 | 2022 | |||||
| Variables | AP | REW | NREW | AP | REW | NREW |
| Mean | 14,306.64 | 38.41 | 945.10 | 15,059.93 | 139.09 | 908.09 |
| SD | 20,552.48 | 77.65 | 1232.20 | 19,950.65 | 205.30 | 1168.69 |
| Min | 376.79 | 0.18 | 17.37 | 408.10 | 2.05 | 25.84 |
| Max | 72,222.00 | 325.87 | 4080.20 | 67,764.92 | 804.32 | 3890.92 |
| Group I | ||||||
| Mean | 15,981.46 | 14.37 | 1189.32 | 16,439.46 | 88.66 | 1026.17 |
| SD | 23,106.84 | 19.18 | 1502.52 | 21,285.59 | 149.52 | 1302.87 |
| Min | 376.79 | 0.18 | 17.37 | 408.10 | 2.05 | 25.84 |
| Max | 72,222.00 | 55.41 | 4080.20 | 67,764.92 | 414.35 | 3890.92 |
| Group II | ||||||
| Mean | 11,435.52 | 79.62498 | 526.437 | 12,695.04 | 225.53 | 705.67 |
| SD | 16,526.38 | 119.478 | 303.8306 | 18,791.34 | 267.69 | 953.81 |
| Min | 1905.12 | 0.358008 | 206.6652 | 1825.85 | 22.05 | 101.92 |
| Max | 48,218.59 | 325.8705 | 1104.999 | 54,835.88 | 804.32 | 2844.38 |
Note: Group I: Bulgaria, Croatia, Cyprus, Denmark, Estonia, France, Greece, Hungary, Ireland, Italy, Lithuania, Malta, Netherlands, Poland, Portugal, Romania, Slovenia, and Spain. Group II: Austria, Czech Republic, Finland, Germany, Latvia, Slovakia, and Sweden. Source: own study.
Table A2.
Granger panel causality test.
Table A2.
Granger panel causality test.
| Causes | Effect | European Union | Group I | Group II | |||
|---|---|---|---|---|---|---|---|
| χ2 | p-Value | χ2 | p-Value | χ2 | p-Value | ||
| ΔlnAP | |||||||
| ΔlnNREW | 10.094 | 0.006 | 3.574 | 0.071 | 20.078 | 0.000 | |
| ΔlnREW | 1.723 | 0.423 | 0.182 | 0.913 | 15.253 | 0.000 | |
| ΔlnK | 0.430 | 0.807 | 4.913 | 0.086 | 31.842 | 0.000 | |
| ΔlnL | 6.095 | 0.047 | 4.605 | 0.100 | 1.474 | 0.478 | |
| ΔlnNREW | |||||||
| ΔlnAP | 1.639 | 0.441 | 3.723 | 0.155 | 29.371 | 0.000 | |
| ΔlnREW | 1.686 | 0.430 | 4.186 | 0.123 | 14.729 | 0.001 | |
| ΔlnK | 0.674 | 0.714 | 0.359 | 0.836 | 12.559 | 0.002 | |
| ΔlnL | 2.492 | 0.288 | 1.047 | 0.592 | 35.761 | 0.000 | |
| ΔlnREW | |||||||
| ΔlnAP | 1.124 | 0.570 | 0.582 | 0.748 | 6.100 | 0.047 | |
| ΔlnNREW | 0.555 | 0.758 | 0.705 | 0.703 | 4.269 | 0.118 | |
| ΔlnK | 1.246 | 0.536 | 3.845 | 0.146 | 6.258 | 0.044 | |
| ΔlnL | 0.495 | 0.781 | 0.052 | 0.975 | 49.649 | 0.000 | |
| ΔlnK | |||||||
| ΔlnAP | 9.176 | 0.010 | 6.630 | 0.036 | 5.514 | 0.063 | |
| ΔlnNREW | 0.529 | 0.768 | 11.917 | 0.003 | 3.085 | 0.214 | |
| ΔlnREW | 7.791 | 0.020 | 8.952 | 0.011 | 3.134 | 0.209 | |
| ΔlnL | 10.055 | 0.007 | 10.631 | 0.005 | 7.718 | 0.021 | |
| ΔlnL | |||||||
| ΔlnAP | 2.341 | 0.310 | 1.527 | 0.466 | 43.085 | 0.000 | |
| ΔlnNREW | 3.225 | 0.199 | 2.277 | 0.320 | 15.626 | 0.000 | |
| ΔlnREW | 0.405 | 0.817 | 0.073 | 0.964 | 1.467 | 0.480 | |
| ΔlnK | 1.010 | 0.603 | 1.158 | 0.560 | 9.246 | 0.010 | |
Source: own study.
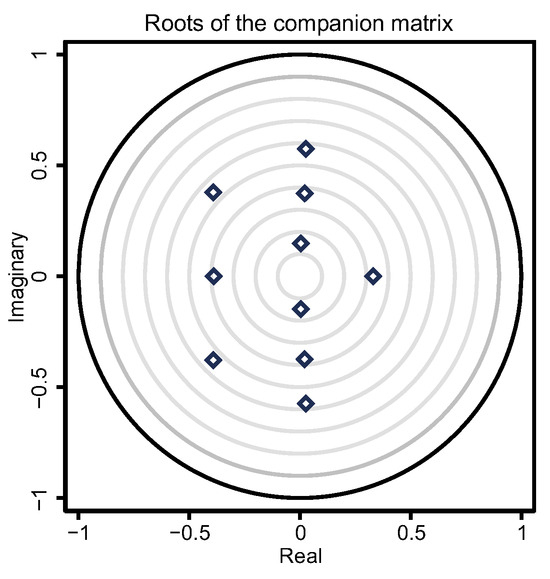
Figure A1.
Panel VAR stable test (Group I).
Figure A1.
Panel VAR stable test (Group I).

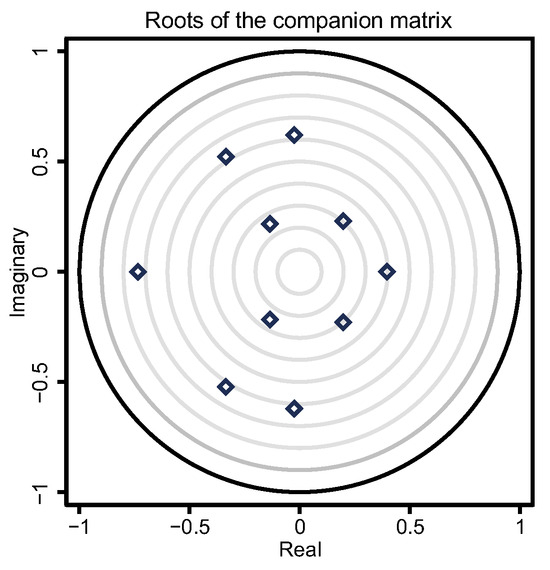
Figure A2.
Panel VAR stable test (Group II).
Figure A2.
Panel VAR stable test (Group II).
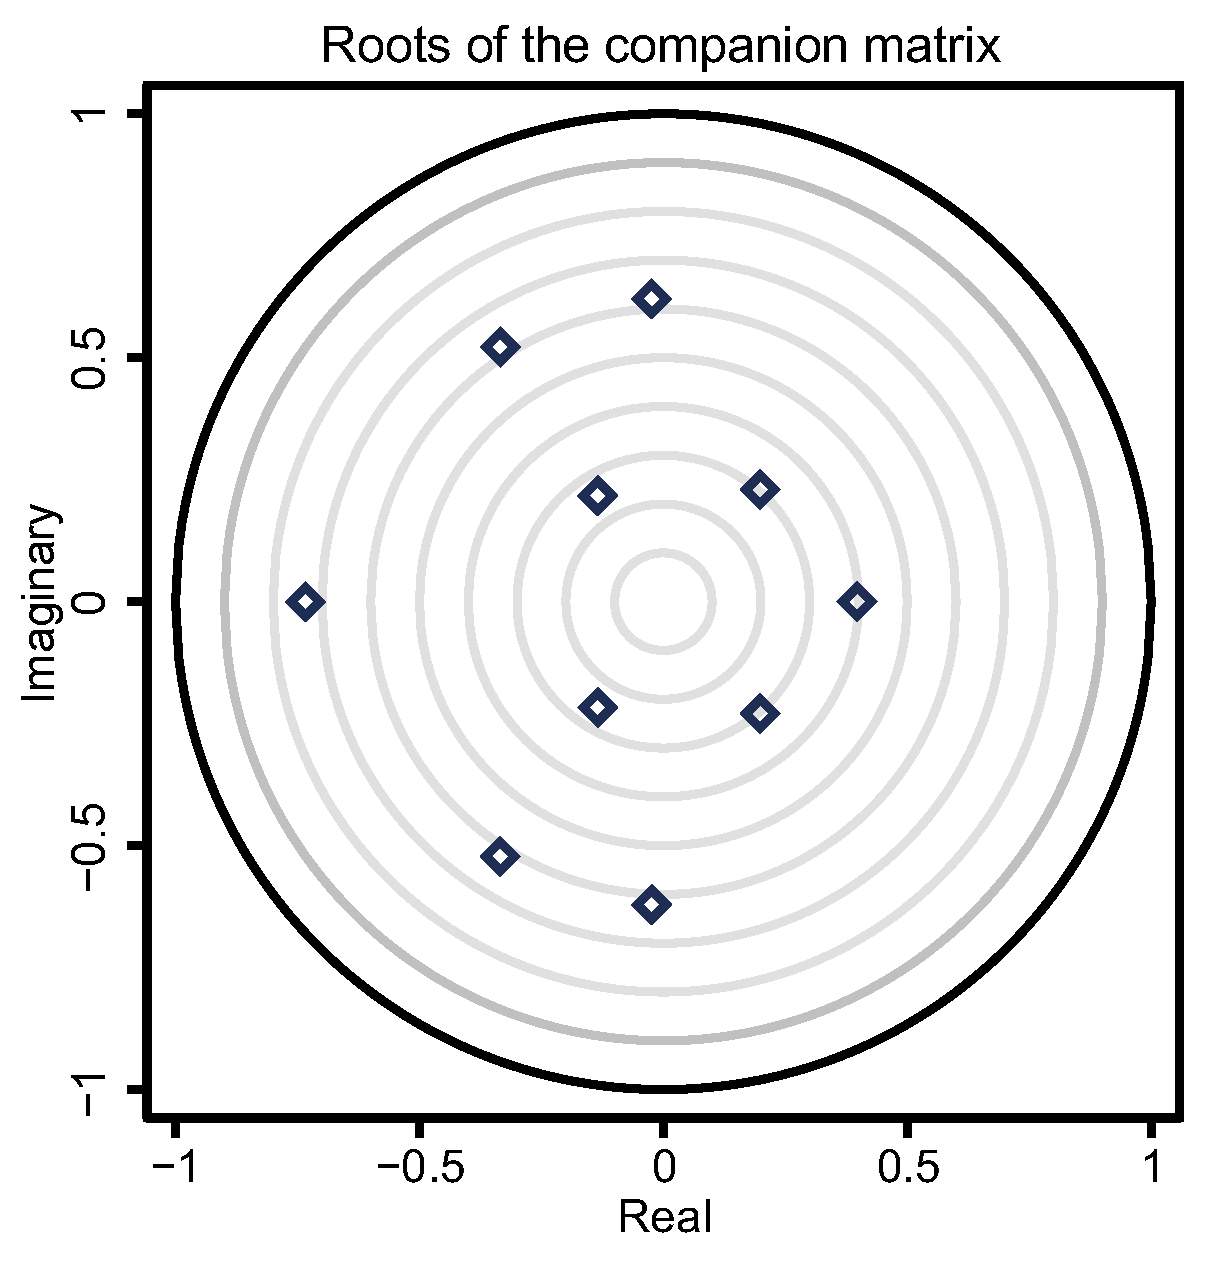
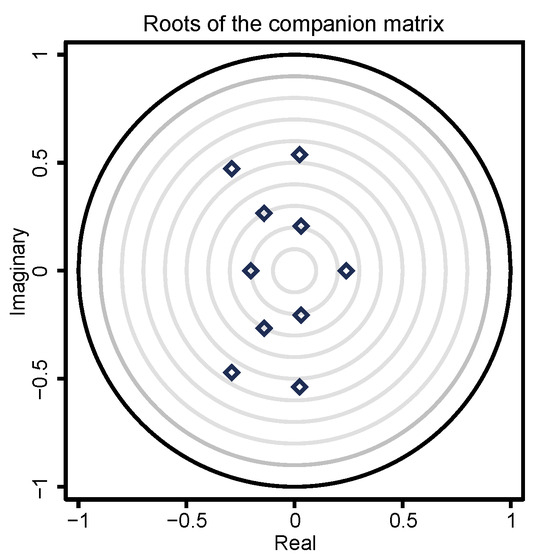
Figure A3.
Panel VAR stable test (European Union).
Figure A3.
Panel VAR stable test (European Union).
References
- Kołodziejczak, W. Employment and Gross Value Added in Agriculture Versus Other Sectors of the European Union Economy. Sustainability 2020, 12, 5518. [Google Scholar] [CrossRef]
- Kalinowski, S. Problem ubóstwa i wykluczenia społecznego w krajach Unii Europejskiej w kontekście zrównoważonego rozwoju. Wieś Rol. 2018, 3, 93–112. [Google Scholar] [CrossRef] [PubMed]
- Poczta, W. Przemiany w rolnictwie polskim w okresie transformacji ustrojowej i akcesji Polski do UE. Wieś Rol. 2020, 187, 57–77. [Google Scholar] [CrossRef] [PubMed]
- Ragazou, K.; Garefalakis, A.; Zafeiriou, E.; Passas, I. Agriculture 5.0: A New Strategic Management Mode for a Cut Cost and an Energy Efficient Agriculture Sector. Energies 2022, 15, 3113. [Google Scholar] [CrossRef]
- Suproń, B.; Myszczyszyn, J. Exploring the Dynamic Relationships between Agricultural Production and Environmental Pollution: Evidence from a GMM-SYS Model in the Three Seas Initiative (3SI). Sustainability 2024, 16, 3748. [Google Scholar] [CrossRef]
- Caldwell, C.D.; Smukler, S. Global Climate Change and Agriculture. In Introduction to Agroecology; Caldwell, C.D., Wang, S., Eds.; Springer: Singapore, 2020; pp. 119–135. ISBN 9789811588365. [Google Scholar]
- Nwachukwu, C.S. Green Agriculture and Food Security, a Review. IOP Conf. Ser. Earth Environ. Sci. 2023, 1178, 012005. [Google Scholar] [CrossRef]
- Chel, A.; Kaushik, G. Renewable Energy for Sustainable Agriculture. Agron. Sustain. Dev. 2011, 31, 91–118. [Google Scholar] [CrossRef]
- Koohafkan, P.; Altieri, M.A.; Gimenez, E.H. Green Agriculture: Foundations for Biodiverse, Resilient and Productive Agricultural Systems. Int. J. Agric. Sustain. 2012, 10, 61–75. [Google Scholar] [CrossRef]
- Martin-Guay, M.-O.; Paquette, A.; Dupras, J.; Rivest, D. The New Green Revolution: Sustainable Intensification of Agriculture by Intercropping. Sci. Total Environ. 2018, 615, 767–772. [Google Scholar] [CrossRef]
- Xin, Y.; Xu, Y.; Zheng, Y. A Study on Green Agricultural Production Decision-Making by Agricultural Cooperatives under Government Subsidies. Sustainability 2024, 16, 1219. [Google Scholar] [CrossRef]
- Böhringer, C. The Kyoto Protocol: A Review and Perspectives. Oxf. Rev. Econ. Policy 2003, 19, 451–466. [Google Scholar] [CrossRef]
- Savy, D.; Nebbioso, A.; Cóndor, R.D.; Vitullo, M. The Kyoto Protocol and European and Italian Regulations in Agriculture. In Carbon Sequestration in Agricultural Soils: A Multidisciplinary Approach to Innovative Methods; Piccolo, A., Ed.; Springer: Berlin/Heidelberg, Germany, 2012; pp. 21–37. ISBN 978-3-642-23385-2. [Google Scholar]
- Plume, H.; Lincoln, R.; Montgomery, H. An Overview of the International Context for Greenhouse Gas Reductions. Aust. J. Exp. Agric. 2008, 48, 251–254. [Google Scholar] [CrossRef]
- Bąk, I.; Cheba, K. Green Transformation: Applying Statistical Data Analysis to a Systematic Literature Review. Energies 2023, 16, 253. [Google Scholar] [CrossRef]
- Mielcarek-Bocheńska, P.; Rzeźnik, W. Greenhouse Gas Emissions from Agriculture in EU Countries—State and Perspectives. Atmosphere 2021, 12, 1396. [Google Scholar] [CrossRef]
- Pancoast, R.; Gaisford, J.D. Will the Kyoto Protocol Be Good for the Environment? Implications for Agriculture. CAFRI Curr. Agric. Food Resour. Issues 2005, 6, 95–104. [Google Scholar] [CrossRef]
- Dong, J. Impact of the Paris Agreement on Agriculture, Energy, and Economy. BCP Bus. Manag. 2022, 34, 1370–1379. [Google Scholar] [CrossRef]
- Verschuuren, J. Climate Change Adaptation under the United Nations Framework Convention on Climate Change and Related Documents. In Research Handbook on Climate Change Adaptation Law; Edward Elgar Publishing: Cheltenham, UK, 2013; pp. 16–31. ISBN 978-1-78100-008-3. [Google Scholar]
- Verschuuren, J. The Paris Agreement on Climate Change: Agriculture and Food Security. Eur. J. Risk Regul. 2016, 7, 54–57. [Google Scholar] [CrossRef]
- Johnson, H. Path-Breaking or History-Repeating? Analysing the Paris Agreement’s Research and Development Paradigm for Climate-Smart Agriculture. In Intellectual Property and Clean Energy: The Paris Agreement and Climate Justice; Rimmer, M., Ed.; Springer: Singapore, 2018; pp. 555–584. ISBN 9789811321559. [Google Scholar]
- Jacquet, J.; Jamieson, D. Soft but Significant Power in the Paris Agreement. Nat. Clim. Change 2016, 6, 643–646. [Google Scholar] [CrossRef]
- Rudnicki, R.; Biczkowski, M.; Wiśniewski, Ł.; Wiśniewski, P.; Bielski, S.; Marks-Bielska, R. Towards Green Agriculture and Sustainable Development: Pro-Environmental Activity of Farms under the Common Agricultural Policy. Energies 2023, 16, 1770. [Google Scholar] [CrossRef]
- Selwyn, B. A Green New Deal for Agriculture: Whither Capitalism? In Routledge Handbook on the Green New Deal; Routledge: London, UK, 2022; ISBN 978-1-00-311088-0. [Google Scholar]
- Szczepaniak, I.; Szajner, P. Challenges of Energy Management in the Food Industry in Poland in the Context of the Objectives of the European Green Deal and the “Farm to Fork” Strategy. Energies 2022, 15, 9090. [Google Scholar] [CrossRef]
- Ali, Q.; Raza, A.; Narjis, S.; Saeed, S.; Khan, M.T.I. Potential of Renewable Energy, Agriculture, and Financial Sector for the Economic Growth: Evidence from Politically Free, Partly Free and Not Free Countries. Renew. Energy 2020, 162, 934–947. [Google Scholar] [CrossRef]
- Ouru, L.; Mose, N. Impact of Agricultural R&D on Sectoral Economic Growth. Asian J. Econ. Bus. Account. 2021, 21, 41–46. [Google Scholar] [CrossRef]
- Martinho, V.J.P.D. Relationships between Agricultural Energy and Farming Indicators. Renew. Sustain. Energy Rev. 2020, 132, 110096. [Google Scholar] [CrossRef]
- Vegheș, C.; Strâmbu-Dima, A. Romanian Agri-Food Businesses and the European Green Deal: An Exploratory Approach. Amfiteatru Econ 2022, 24, 508–524. [Google Scholar] [CrossRef]
- Báldi, A.; Valkó, O.; Lengyel, S. Illúzió a Változás?: Válasz Az Európai Akadémiák Tudományos Tanácsadó Testülete (EASAC) Regenerative Agriculture Tanulmányával Kapcsolatos Cikkekre = Is Change an Illusion?: Response to the Papers Addressing the Regenerative Agriculture Report by the European Academies’ Science Advisory Council (EASAC). Magy. Tud. Magy. Tudományos Akad. Folyóirata 2023, 184, 1049–1058. [Google Scholar]
- Gielen, D.; Boshell, F.; Saygin, D.; Bazilian, M.D.; Wagner, N.; Gorini, R. The Role of Renewable Energy in the Global Energy Transformation. Energy Strategy Rev. 2019, 24, 38–50. [Google Scholar] [CrossRef]
- Wrzaszcz, W.; Prandecki, K. Agriculture and the European Green Deal. Zagadnienia Ekon. Rolnej 2020, 365, 156–179. [Google Scholar] [CrossRef]
- Bhuiyan, M.A.; Zhang, Q.; Khare, V.; Mikhaylov, A.; Pinter, G.; Huang, X. Renewable Energy Consumption and Economic Growth Nexus—A Systematic Literature Review. Front. Environ. Sci. 2022, 10, 878394. [Google Scholar] [CrossRef]
- Oliveira, H.; Moutinho, V. Renewable Energy, Economic Growth and Economic Development Nexus: A Bibliometric Analysis. Energies 2021, 14, 4578. [Google Scholar] [CrossRef]
- Prandecki, K.; Wrzaszcz, W.; Zieliński, M. Environmental and Climate Challenges to Agriculture in Poland in the Context of Objectives Adopted in the European Green Deal Strategy. Sustainability 2021, 13, 10318. [Google Scholar] [CrossRef]
- Papież, M.; Śmiech, S.; Frodyma, K. Effects of Renewable Energy Sector Development on Electricity Consumption—Growth Nexus in the European Union. Renew. Sustain. Energy Rev. 2019, 113, 109276. [Google Scholar] [CrossRef]
- Liu, X.; Zhang, S.; Bae, J. The Nexus of Renewable Energy-Agriculture-Environment in BRICS. Appl. Energy 2017, 204, 489–496. [Google Scholar] [CrossRef]
- Haberl, H.; Wiedenhofer, D.; Virág, D.; Kalt, G.; Plank, B.; Brockway, P.; Fishman, T.; Hausknost, D.; Krausmann, F.; Leon-Gruchalski, B.; et al. A Systematic Review of the Evidence on Decoupling of GDP, Resource Use and GHG Emissions, Part II: Synthesizing the Insights. Environ. Res. Lett. 2020, 15, 065003. [Google Scholar] [CrossRef]
- Aziz, S.; Maltese, I.; Marcucci, E.; Gatta, V.; Benmoussa, R.; Irhirane, E.H. Energy Consumption and Environmental Impact of E-Grocery: A Systematic Literature Review. Energies 2022, 15, 7289. [Google Scholar] [CrossRef]
- Panayotou, T. Empirical Tests and Policy Analysis of Environmental Degradation at Different Stages of Economic Development; International Labour Organization: Geneva, Switzerland, 1993. [Google Scholar]
- Grossman, G.M.; Krueger, A.B. Environmental Impacts of a North American Free Trade Agreement. NBER Work. Pap. 1991, 11, 13–53. [Google Scholar] [CrossRef]
- Dinda, S. Environmental Kuznets Curve Hypothesis: A Survey. Ecol. Econ. 2004, 49, 431–455. [Google Scholar] [CrossRef]
- Pincheira, R.; Zuniga, F. Environmental Kuznets Curve Bibliographic Map: A Systematic Literature Review. Account. Financ. 2021, 61, 1931–1956. [Google Scholar] [CrossRef]
- Kaika, D.; Zervas, E. The Environmental Kuznets Curve (EKC) Theory—Part A: Concept, Causes and the CO2 Emissions Case. Energy Policy 2013, 62, 1392–1402. [Google Scholar] [CrossRef]
- Lau, L.-S.; Yii, K.-J.; Ng, C.-F.; Tan, Y.-L.; Yiew, T.-H. Environmental Kuznets Curve (EKC) Hypothesis: A Bibliometric Review of the Last Three Decades. Energy Environ. 2023, 0958305X231177734. [Google Scholar] [CrossRef]
- Kaika, D.; Zervas, E. The Environmental Kuznets Curve (EKC) Theory. Part B: Critical Issues. Energy Policy 2013, 62, 1403–1411. [Google Scholar] [CrossRef]
- Al-Mulali, U.; Weng-Wai, C.; Sheau-Ting, L.; Mohammed, A.H. Investigating the Environmental Kuznets Curve (EKC) Hypothesis by Utilizing the Ecological Footprint as an Indicator of Environmental Degradation. Ecol. Indic. 2015, 48, 315–323. [Google Scholar] [CrossRef]
- Acaravci, A.; Ozturk, I. On the Relationship between Energy Consumption, CO2 Emissions and Economic Growth in Europe. Energy 2010, 35, 5412–5420. [Google Scholar] [CrossRef]
- Dogan, E.; Aslan, A. Exploring the Relationship among CO2 Emissions, Real GDP, Energy Consumption and Tourism in the EU and Candidate Countries: Evidence from Panel Models Robust to Heterogeneity and Cross-Sectional Dependence. Renew. Sustain. Energy Rev. 2017, 77, 239–245. [Google Scholar] [CrossRef]
- Hannesson, R. CO2 Intensity and GDP per Capita. Int. J. Energy Sect. Manag. 2019, 14, 372–388. [Google Scholar] [CrossRef]
- Frodyma, K.; Papież, M.; Śmiech, S. Revisiting the Environmental Kuznets Curve in the European Union Countries. Energy 2022, 241, 122899. [Google Scholar] [CrossRef]
- Rokicki, T.; Perkowska, A.; Klepacki, B.; Bórawski, P.; Bełdycka-Bórawska, A.; Michalski, K. Changes in Energy Consumption in Agriculture in the EU Countries. Energies 2021, 14, 1570. [Google Scholar] [CrossRef]
- Sowby, R.B.; Dicataldo, E. The Energy Footprint of U.S. Irrigation: A First Estimate from Open Data. Energy Nexus 2022, 6, 100066. [Google Scholar] [CrossRef]
- Flammini, A.; Pan, X.; Tubiello, F.N.; Qiu, S.Y.; Rocha Souza, L.; Quadrelli, R.; Bracco, S.; Benoit, P.; Sims, R. Emissions of Greenhouse Gases from Energy Use in Agriculture, Forestry and Fisheries: 1970–2019. Earth Syst. Sci. Data Discuss. 2022, 14, 811. [Google Scholar] [CrossRef]
- Cuellar, A.D.; Webber, M.E. An Updated Estimate for Energy Use in U.S. Food Production and Policy Implications; American Society of Mechanical Engineers Digital Collection: Phoenix, AZ, USA, 17–22 May 2010; pp. 35–44. [Google Scholar] [CrossRef]
- Paris, B.; Vandorou, F.; Balafoutis, A.T.; Vaiopoulos, K.; Kyriakarakos, G.; Manolakos, D.; Papadakis, G. Energy Use in Open-Field Agriculture in the EU: A Critical Review Recommending Energy Efficiency Measures and Renewable Energy Sources Adoption. Renew. Sustain. Energy Rev. 2022, 158, 112098. [Google Scholar] [CrossRef]
- Ceylan, Z. Assessment of Agricultural Energy Consumption of Turkey by MLR and Bayesian Optimized SVR and GPR Models. J. Forecast. 2020, 39, 944–956. [Google Scholar] [CrossRef]
- Koondhar, M.A.; Udemba, E.N.; Cheng, Y.; Khan, Z.A.; Koondhar, M.A.; Batool, M.; Kong, R. Asymmetric Causality among Carbon Emission from Agriculture, Energy Consumption, Fertilizer, and Cereal Food Production—A Nonlinear Analysis for Pakistan. Sustain. Energy Technol. Assess. 2021, 45, 101099. [Google Scholar] [CrossRef]
- Šarauskis, E.; Naujokienė, V.; Lekavičienė, K.; Kriaučiūnienė, Z.; Jotautienė, E.; Jasinskas, A.; Zinkevičienė, R. Application of Granular and Non-Granular Organic Fertilizers in Terms of Energy, Environmental and Economic Efficiency. Sustainability 2021, 13, 9740. [Google Scholar] [CrossRef]
- Ntinas, G.K.; Neumair, M.; Tsadilas, C.D.; Meyer, J. Carbon Footprint and Cumulative Energy Demand of Greenhouse and Open-Field Tomato Cultivation Systems under Southern and Central European Climatic Conditions. J. Clean. Prod. 2017, 142, 3617–3626. [Google Scholar] [CrossRef]
- Tutak, M.; Brodny, J. Renewable Energy Consumption in Economic Sectors in the EU-27. The Impact on Economics, Environment and Conventional Energy Sources. A 20-Year Perspective. J. Clean. Prod. 2022, 345, 131076. [Google Scholar] [CrossRef]
- Vijayakumar, S.; Chatterjee, D.; Subramanian, E.; Ramesh, K.; Saravanane, P. Efficient Management of Energy in Agriculture. In Handbook of Energy Management in Agriculture; Rakshit, A., Biswas, A., Sarkar, D., Meena, V.S., Datta, R., Eds.; Springer Nature: Singapore, 2023; pp. 1–28. ISBN 978-981-19773-6-7. [Google Scholar]
- Roxani, A.; Zisos, A.; Sakki, G.-K.; Efstratiadis, A. Multidimensional Role of Agrovoltaics in Era of EU Green Deal: Current Status and Analysis of Water–Energy–Food–Land Dependencies. Land 2023, 12, 1069. [Google Scholar] [CrossRef]
- Sulewski, P.; Majewski, E.; Was, A. Miejsce i rola rolnictwa w produkcji energii odnawialnej w Polsce i UE. Zagadnienia Ekon. Rolnej 2017, 1, 50–74. [Google Scholar]
- Zhang, L.; Pang, J.; Chen, X.; Lu, Z. Carbon Emissions, Energy Consumption and Economic Growth: Evidence from the Agricultural Sector of China’s Main Grain-Producing Areas. Sci. Total Environ. 2019, 665, 1017–1025. [Google Scholar] [CrossRef] [PubMed]
- Song, S.; Zhang, L.; Ma, Y. Evaluating the Impacts of Technological Progress on Agricultural Energy Consumption and Carbon Emissions Based on Multi-Scenario Analysis. Environ. Sci. Pollut. Res. 2023, 30, 16673–16686. [Google Scholar] [CrossRef] [PubMed]
- Boltianska, N.I.; Manita, I.Y.; Komar, A.S. Justification of the Energy Saving Mechanism in the Agricultural Sector. Обoснoвание механизма энергoсбережения в аграрнoм сектoре 2021, 1, 7–12. [Google Scholar]
- Pei, T.L.; Shaari, M.S.; Ahmad, T.S.T. The Effects of Electricity Consumption on Agriculture, Service and Manufacturing Sectors in Malaysia. Int. J. Energy Econ. Policy 2016, 6, 401–407. [Google Scholar]
- Ben Jebli, M.; Ben Youssef, S. Renewable Energy Consumption and Agriculture: Evidence for Cointegration and Granger Causality for Tunisian Economy. Int. J. Sustain. Dev. World Ecol. 2017, 24, 149–158. [Google Scholar] [CrossRef]
- Ben Jebli, M.; Ben Youssef, S. The Role of Renewable Energy and Agriculture in Reducing CO2 Emissions: Evidence for North Africa Countries. Ecol. Indic. 2017, 74, 295–301. [Google Scholar] [CrossRef]
- Ahsan, F.; Chandio, A.A.; Fang, W. Climate Change Impacts on Cereal Crops Production in Pakistan: Evidence from Cointegration Analysis. Int. J. Clim. Change Strateg. Manag. 2020, 12, 257–269. [Google Scholar] [CrossRef]
- Aydoğan, B.; Vardar, G. Evaluating the Role of Renewable Energy, Economic Growth and Agriculture on CO2 Emission in E7 Countries. Int. J. Sustain. Energy 2020, 39, 335–348. [Google Scholar] [CrossRef]
- Hasan, B.M.S.; Abdulazeez, A.M. A Review of Principal Component Analysis Algorithm for Dimensionality Reduction. J. Soft Comput. Data Min. 2021, 2, 20–30. [Google Scholar]
- Ozturk, I. A Literature Survey on Energy–Growth Nexus. Energy Policy 2010, 38, 340–349. [Google Scholar] [CrossRef]
- Bolandnazar, E.; Rohani, A.; Taki, M. Energy Consumption Forecasting in Agriculture by Artificial Intelligence and Mathematical Models. Energy Sources Part Recovery Util. Environ. Eff. 2020, 42, 1618–1632. [Google Scholar] [CrossRef]
- De Hoyos, R.E.; Sarafidis, V. Testing for Cross-Sectional Dependence in Panel-Data Models. Stata J. 2006, 6, 482–496. [Google Scholar] [CrossRef]
- Im, K.S.; Pesaran, M.H.; Shin, Y. Testing for Unit Roots in Heterogeneous Panels. J. Econom. 2003, 115, 53–74. [Google Scholar] [CrossRef]
- Westerlund, J. Testing for Error Correction in Panel Data*. Oxf. Bull. Econ. Stat. 2007, 69, 709–748. [Google Scholar] [CrossRef]
- Andrews, D.W.K.; Lu, B. Consistent Model and Moment Selection Procedures for GMM Estimation with Application to Dynamic Panel Data Models. J. Econom. 2001, 101, 123–164. [Google Scholar] [CrossRef]
- Kiviet, J.F. Microeconometric Dynamic Panel Data Methods: Model Specification and Selection Issues. Econom. Stat. 2020, 13, 16–45. [Google Scholar] [CrossRef]
- Abrigo, M.R.M.; Love, I. Estimation of Panel Vector Autoregression in Stata. Stata J. 2016, 16, 778–804. [Google Scholar] [CrossRef]
- Kukuła, K.; Luty, L. Ranking Państw UE Ze Względu Na Wybrane Wskaźniki Charakteryzujące Rolnictwo Ekologiczne. Metod. Ilościowe W Badaniach Ekon. 2015, 16, 225–236. [Google Scholar]
- Rahman, M.M.; Khan, I.; Field, D.L.; Techato, K.; Alameh, K. Powering Agriculture: Present Status, Future Potential, and Challenges of Renewable Energy Applications. Renew. Energy 2022, 188, 731–749. [Google Scholar] [CrossRef]
- Alola, A.A.; Muoneke, O.B.; Okere, K.I.; Obekpa, H.O. Analysing the Co-Benefit of Environmental Tax amidst Clean Energy Development in Europe’s Largest Agrarian Economies. J. Environ. Manag. 2023, 326, 116748. [Google Scholar] [CrossRef]
Disclaimer/Publisher’s Note: The statements, opinions and data contained in all publications are solely those of the individual author(s) and contributor(s) and not of MDPI and/or the editor(s). MDPI and/or the editor(s) disclaim responsibility for any injury to people or property resulting from any ideas, methods, instructions or products referred to in the content. |
© 2024 by the authors. Licensee MDPI, Basel, Switzerland. This article is an open access article distributed under the terms and conditions of the Creative Commons Attribution (CC BY) license (https://creativecommons.org/licenses/by/4.0/).