Abstract
The Double Diaphragm Preforming (DDPF) process uses vacuum pressure and heat to pre-shape dry carbon fabric reinforcements between flexible diaphragms in liquid composite molding (LCM). Accurate modeling of heat transfer within DDPF requires knowledge of the thermophysical properties of the constituent materials under processing conditions. This study investigates the thermal conductivity of silicone diaphragms and carbon fabrics with embedded thermoplastic binder webs, utilizing transient plane source (TPS) and modified transient plane source (MTPS) methods, respectively. Additionally, the specific heat of silicone, carbon fibers (both chopped and powdered), and binder were measured using differential scanning calorimetry (DSC). Mixed samples comprising chopped fibers with 1.8 wt% binder and powdered fibers with 3.6 wt% binder was also analyzed with DSC. This study also examined the influence of reheating cycles on the specific heat of carbon fiber—3.6 wt% binder samples—and the effect of compaction and vacuum on the thermal conductivity of carbon fabrics with an embedded binder. While silicone exhibited linear-specific heat behavior, the thermoplastic binder showed non-linearity due to phase change. The combined carbon fiber-binder samples demonstrated slight non-linear specific heat variations depending on reheating cycles. The thermal conductivity of the fabric preforms decreased with the addition of thermoplastic binder and under vacuum-compaction conditions. The established temperature-dependent specific heat relationships and thermal conductivity provide valuable data for optimizing DDPF preforming parameters and enhancing energy efficiency in composite manufacturing.
1. Introduction
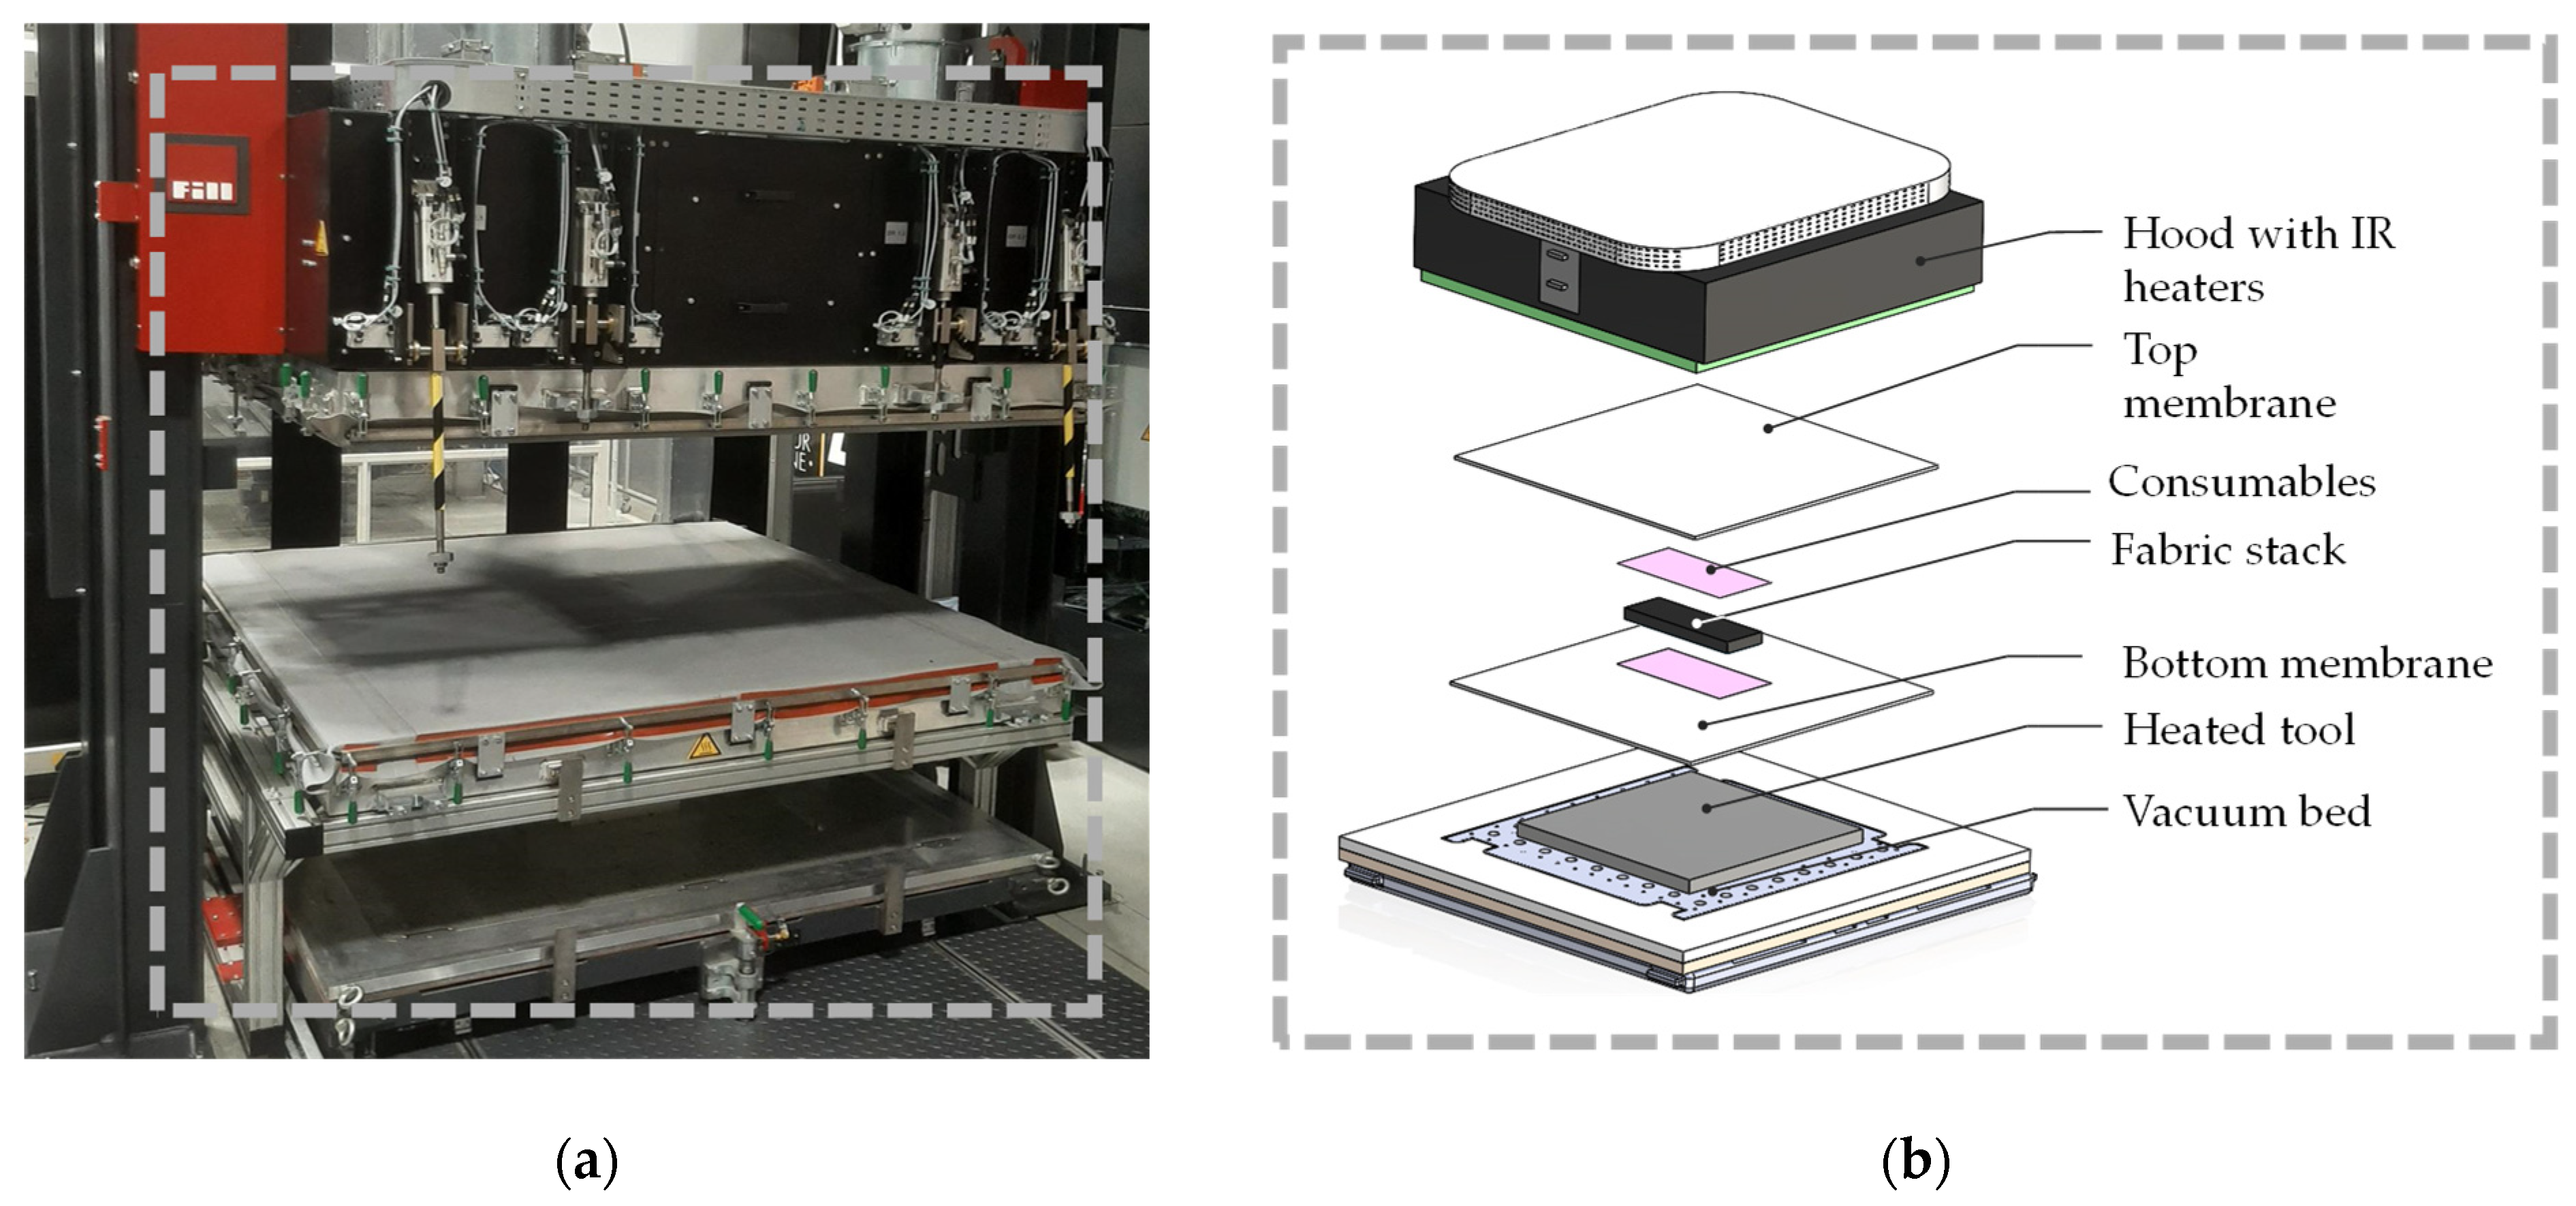
The double diaphragm forming (DDF) process offers a cost-effective solution for shaping fabric plies in liquid composite molding (LCM) [1]. Unlike traditional autoclave molding, DDF allows for producing dry fabrics outside an autoclave environment, significantly reducing costs. The use of dry fabrics provides better handling, flexibility, and formability, enabling the production of complex-shaped structural parts. This approach not only enhances production rates but also lowers overall energy consumption [2,3,4]. In the DDF process, silicone diaphragm membranes apply hydrostatic pressure to carbon fiber reinforcements, forming net-shaped 3D geometries from 2D layups. Heat is then applied to activate the binder material between the fabric layers, tacking them together and maintaining the desired shape after cooling. However, uneven binder heating during this stage can lead to defects such as incompletely compacted preforms and irregular composite sheets [5,6]. These defects may arise from the shape of the formed product, uneven heating, or variations in preform thickness, which depend on process temperature, heating source type, and degree of compaction [7]. Furthermore, preform compaction behavior varies based on the binder system type, content, and preforming parameters. Higher binder content tends to increase thickness while decreasing elastic recovery and increasing permanent deformation. Managing these factors is crucial for improving the DDF process and producing high-quality dry preforms [8,9,10]. Figure 1 illustrates the DDF process setup using the FILL DDF former, Austria. Multi-layer fabrics are assembled between two diaphragms, and a vacuum is initially applied to compact them. A second vacuum molds the compacted stack with silicone onto the tool to achieve the required shape. The final stage involves applying heat via heated tools, infrared (IR), or a combination of both and cooling to retain the shape.
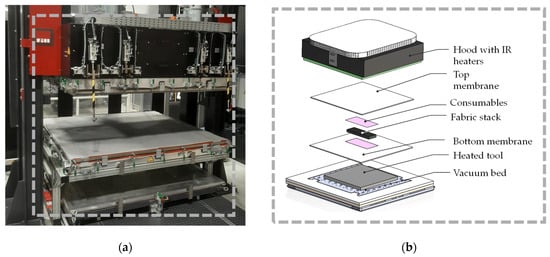
Figure 1.
Double diaphragm forming (DDF) machine (a) machine set up; (b) schematic of the DDF process elements.
In DDF studies, researchers aim to understand how materials behave under varying temperature conditions. They heavily rely on finite element (FE) models, supported by experiments, to compare processing methods such as thermoforming and isothermal approaches [11,12] and investigate temperature variation effects on final part quality and defects [13]. Advanced thermomechanical modeling techniques have been employed to better understand the influence of transient temperature on deformation behavior, considering phase transition effects [14]. Additionally, some approaches have focused on defining model-based material definitions (MBMDs) that encompass chemistry, processing, and structure-property relationships at different scales, tailored to the location and orientation specifics of preforming [15,16,17]. While previous research has utilized numerical simulations to explore various DDF process aspects, a notable gap remains in understanding the heat transfer process involving woven dry carbon fiber reinforcements during preform heating [18]. Despite this, no numerical studies address this heat transfer process to accurately predict temperatures. Moreover, temperature-dependent DDF studies have neglected crucial thermophysical properties such as thermal conductivity and specific heat, focusing solely on mechanical properties. Considering these properties is vital for accurately modeling heat transfer during preforming under vacuum compaction conditions alongside the binder material.
Under vacuum conditions for dry preforms, the primary heat transfer mode is conduction between woven carbon fiber tows, with minor contributions from gap radiation through pores [19]. Since the system operates under full vacuum, convection is negligible due to air absence. The anisotropic nature of fibers and woven structure imparts directional heat flow within the fabric. To measure this direction-dependent thermal conductivity, standard equipment such as Hukseflux THISYS and THASYS devices are commonly used for textiles and structural polymer composites [20,21]. However, the use of glycol can significantly affect measurements by influencing multi-layer contact. To avoid this issue, infrared thermal mapping without binders is also employed to evaluate the heat transfer properties of woven and non-woven carbon fabrics [22]. Apart from carbon fabric studies, other material investigations include woven ceramic composites under compression (experimental and numerical) [23], aramid fabrics [24], unit 3D textile structure [25], numerical particle embedded textiles [26], and other numerical techniques [20,25,27,28,29,30] along with measurement techniques to determine conductivity [31].
For conductivity studies, laser flash analysis (LFA) has been used to determine conductivity by enhancing the thermal conductivity of carbon fiber epoxy composites with embedded copper wire [32]. LFA has also determined the through-thickness and in-plane conductivity of composites with orthogonal fibers [33], while an in-house device investigated the high-temperature conductivity, specific heat, and thermal diffusivity of individual fibers [34]. However, this method is unsuitable for dry fabric testing due to limitations in fabric porosity and compaction load application. Furthermore, LFA is primarily for isotropic homogeneous solids with diffusivity ranging from 0.1 to 1000 mm2 s−1 and has limited applicability to porous anisotropic materials [35]. For dry fabric conductivity under preforming conditions, an MTPS sensor under vacuum replicated preforming compaction to study compaction load effects on thermal conductivity [36]. This study determined compaction load-dependent through-thickness thermal conductivity, showing fabric conductivity plateaued with increasing compaction load without binders. Existing studies have mainly focused on geometric heat transfer aspects in composites and dry textiles without considering the impact of preforming process conditions, such as binder presence, on thermal conductivity. To bridge this gap, the present study aims to characterize the heat transfer properties of woven carbon fiber fabrics with binder and silicone membrane, critical for heat energy transfer in the DDF material system.
This study comprehensively investigates the thermal conductivity and specific heat capacity of materials crucial to the DDPF process. Utilizing advanced techniques such as transient plane source (TPS), modified transient plane source (MTPS), and differential scanning calorimetry (DSC), the behavior of silicone diaphragms, carbon fibers, and thermoplastic binders is explored under varying conditions of compaction, vacuum, and temperature cycles. The findings aim to predict and optimize heat transfer simulation temperatures, enhance energy efficiency, and reduce energy consumption for preforming.
2. Materials and Method
2.1. Materials
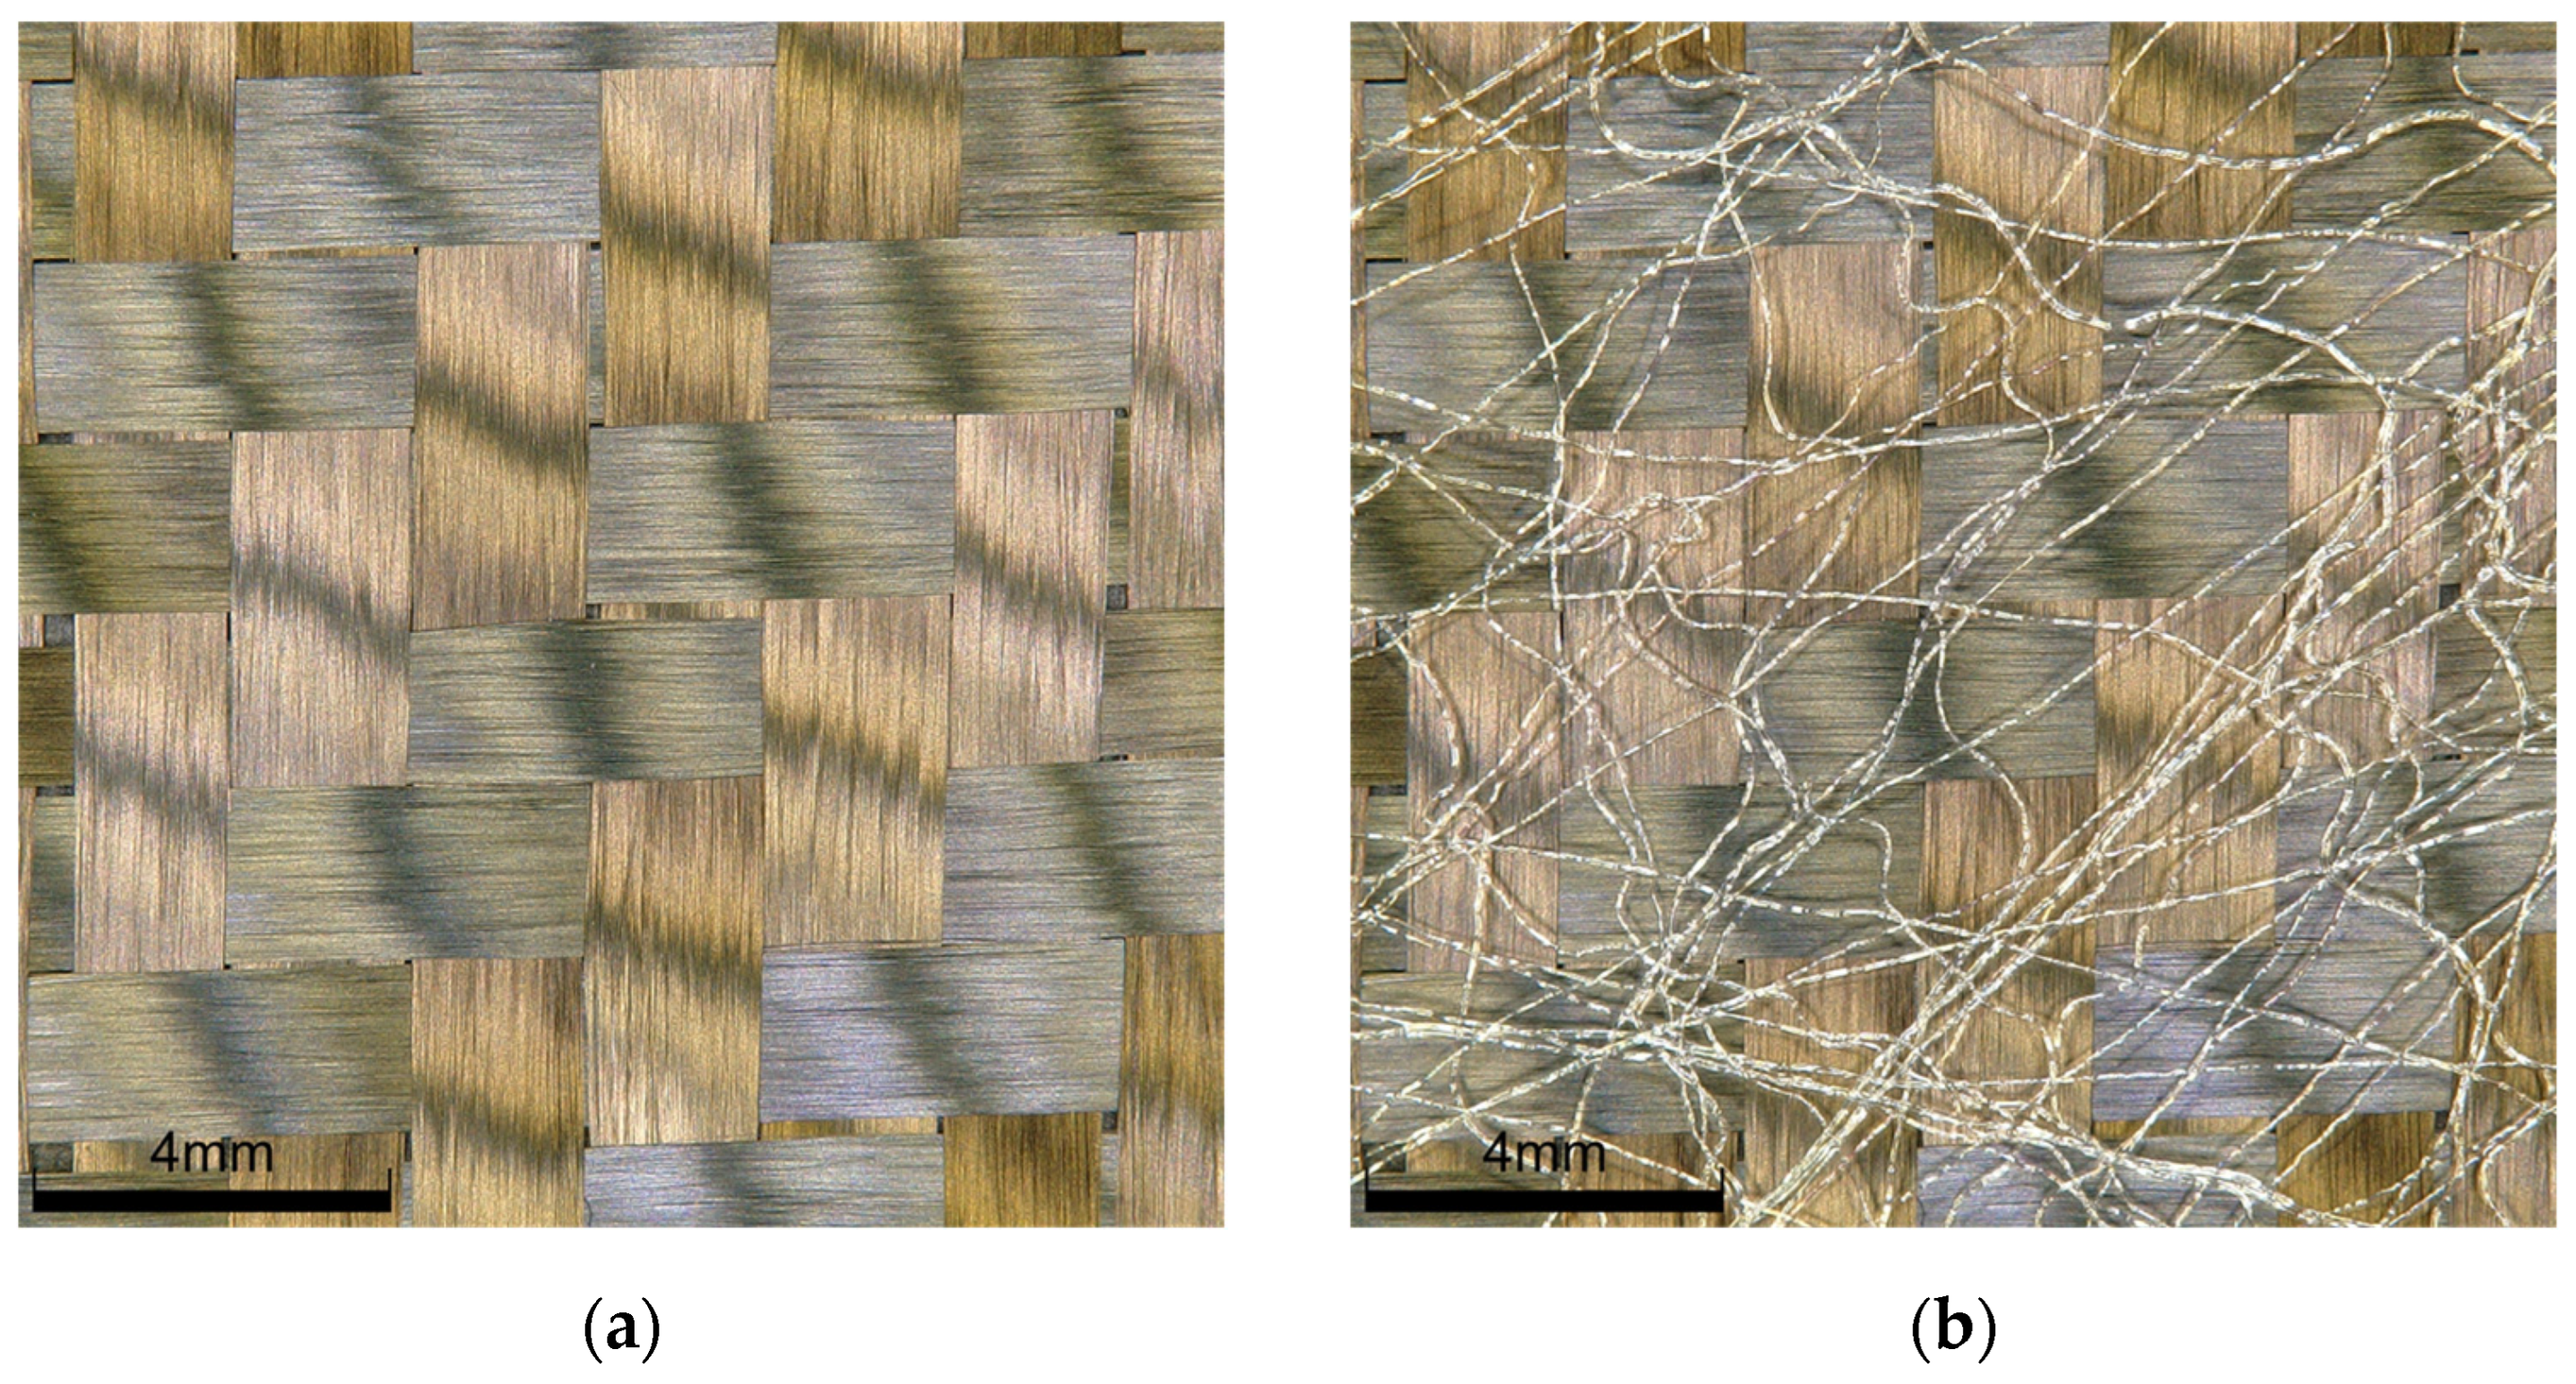
A 3-k aerospace-grade 2 × 2 twill weave carbon fabric with an aerial weight of 204 g m−2 (Style 452-5) from Engineered Cramer Composites (ECCs), Heek, Germany (Figure 2a) was utilized. The fibers in the warp and weft directions of the fabric have a linear density of 200 tex, a fiber density of 1800 kg m−3, and a fiber diameter of 7 µm. Additionally, portions of a silicone diaphragm membrane (Mosites #1453–D) from Mosites Rubber Company, Fort Worth, TX, USA, were used. This membrane has a density of 1150 kg m−3 and an aerial weight of 1840 g m−2. The binder material used was Spunfab PA1203, a copolyimide adhesive web from Spunfab Ltd., Cuyahoga Falls, OH, USA. This binder has a melting range of 85–98 °C, an aerial weight of 7.4 g m−2, medium viscosity, and a melt volume rate of 30–50 cm3 per 10 min (as shown on top of carbon fabric in Figure 2b).

Figure 2.
Optical images: (a) carbon fabric and (b) carbon fabric with embedded thermoplastic binder web.
The carbon fabric thickness is 0.38 mm in the loom state, and it reduces to 0.204 mm in the laminate as specified by the manufacturer. The silicone membrane maintained a consistent thickness of 1.52 mm, except in bridging regions during the DDPF, and has an operating temperature range of −72–232 °C. The experimental trials were conducted at an ambient temperature of 21–24 °C and a humidity level of 43%.
2.2. Through Thickness Thermal Conductivity of Carbon Fabrics with Binder
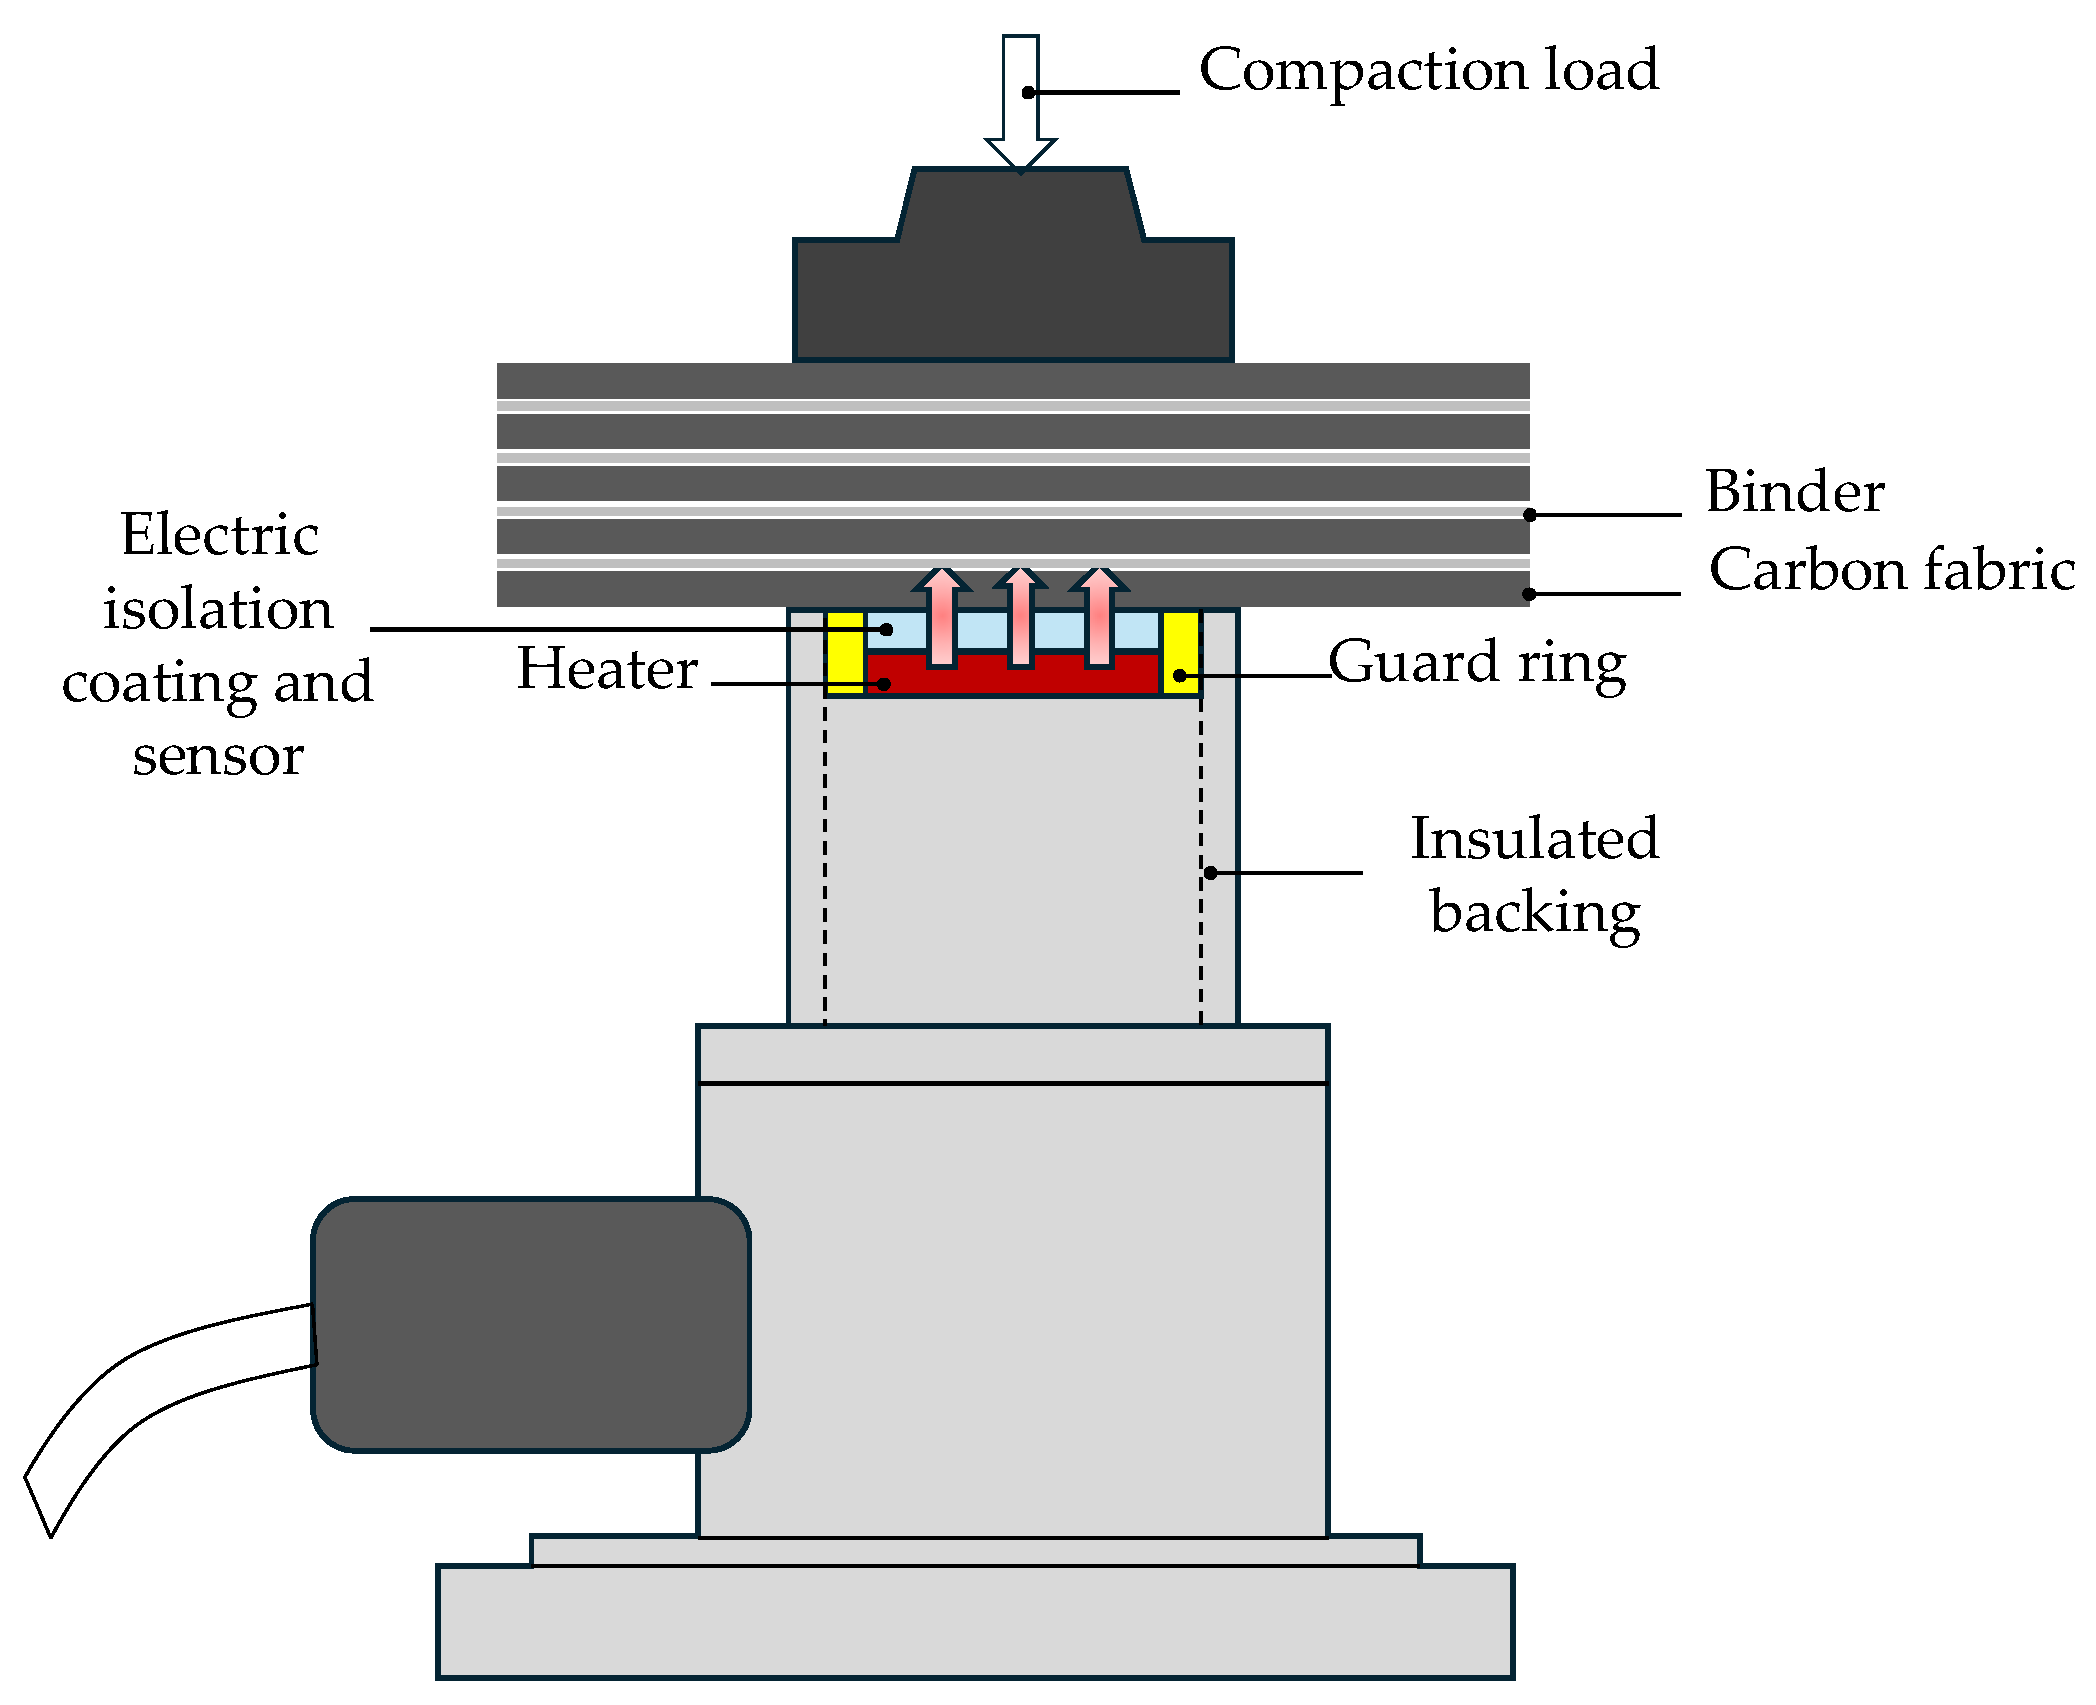
The thermal conductivity (TC) of the fabric (200 mm × 200 mm) with binder through its thickness was determined using the modified transient plane source (MTPS) method (Trident module, C-Therm Technologies Ltd., Fredericton, NB, Canada), in accordance with ASTM D7984 [37]. This testing methodology was based on the experimental setup developed by Mojdeh et al., which was designed to measure the through-thickness TC of fabrics under preforming compaction conditions [36]. Given that the TC of fabrics plateaus after a 3000 gf compaction load, a compaction load of 3365 gf was chosen for testing the mixture of carbon fabrics with binder. In the present testing configuration (see Figure 3), ten layers of carbon fabrics were selected with nine layers of binder placed alternately between them, consistent with preforming process requirements. To ensure accurate temperature calibration and sensor stability, the MTPS textiles module was employed using a poly felt reference material at ambient conditions. The entire stack was placed on the MTPS sensor, where a one-sided inter-facial heater/sensor within a guard ring applied a heat pulse.
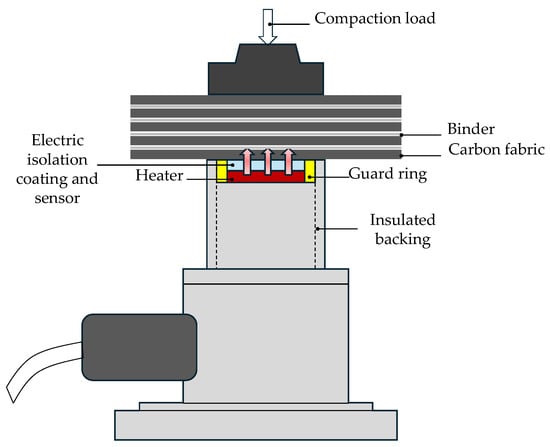
Figure 3.
Schematic of the experimental setup using the MTPS sensor.
This setup measured the thermal effusivity of the stack over time to determine its TC. Two test cases were conducted to measure the TC of the fabrics with embedded binders. In the first test case, the sample was tested under ambient conditions following ASTM D7984, with a 500 gf compaction load and no vacuum environment. In the second test case, the compaction load was increased to 3365 gf, and a vacuum was applied within a vacuum chamber. Both tests were carried out in a 0/90 layup orientation.
2.3. Thermal Conductivity of Silicone Membrane
The thermal conductivity of the silicone membrane was measured using the transient plane source (TPS) technique with the C-Therm Thermal Conductivity Analyzer Flex Configuration. This method employs a double-sided sensor placed between two identical samples, utilizing an iterative process to determine the optimal testing parameters. The sensor features a bifilar nickel spiral that applies a consistent power pulse. The dynamic temperature response and changes in the temperature resistance of the sensor circuit are analyzed using Equation (1):
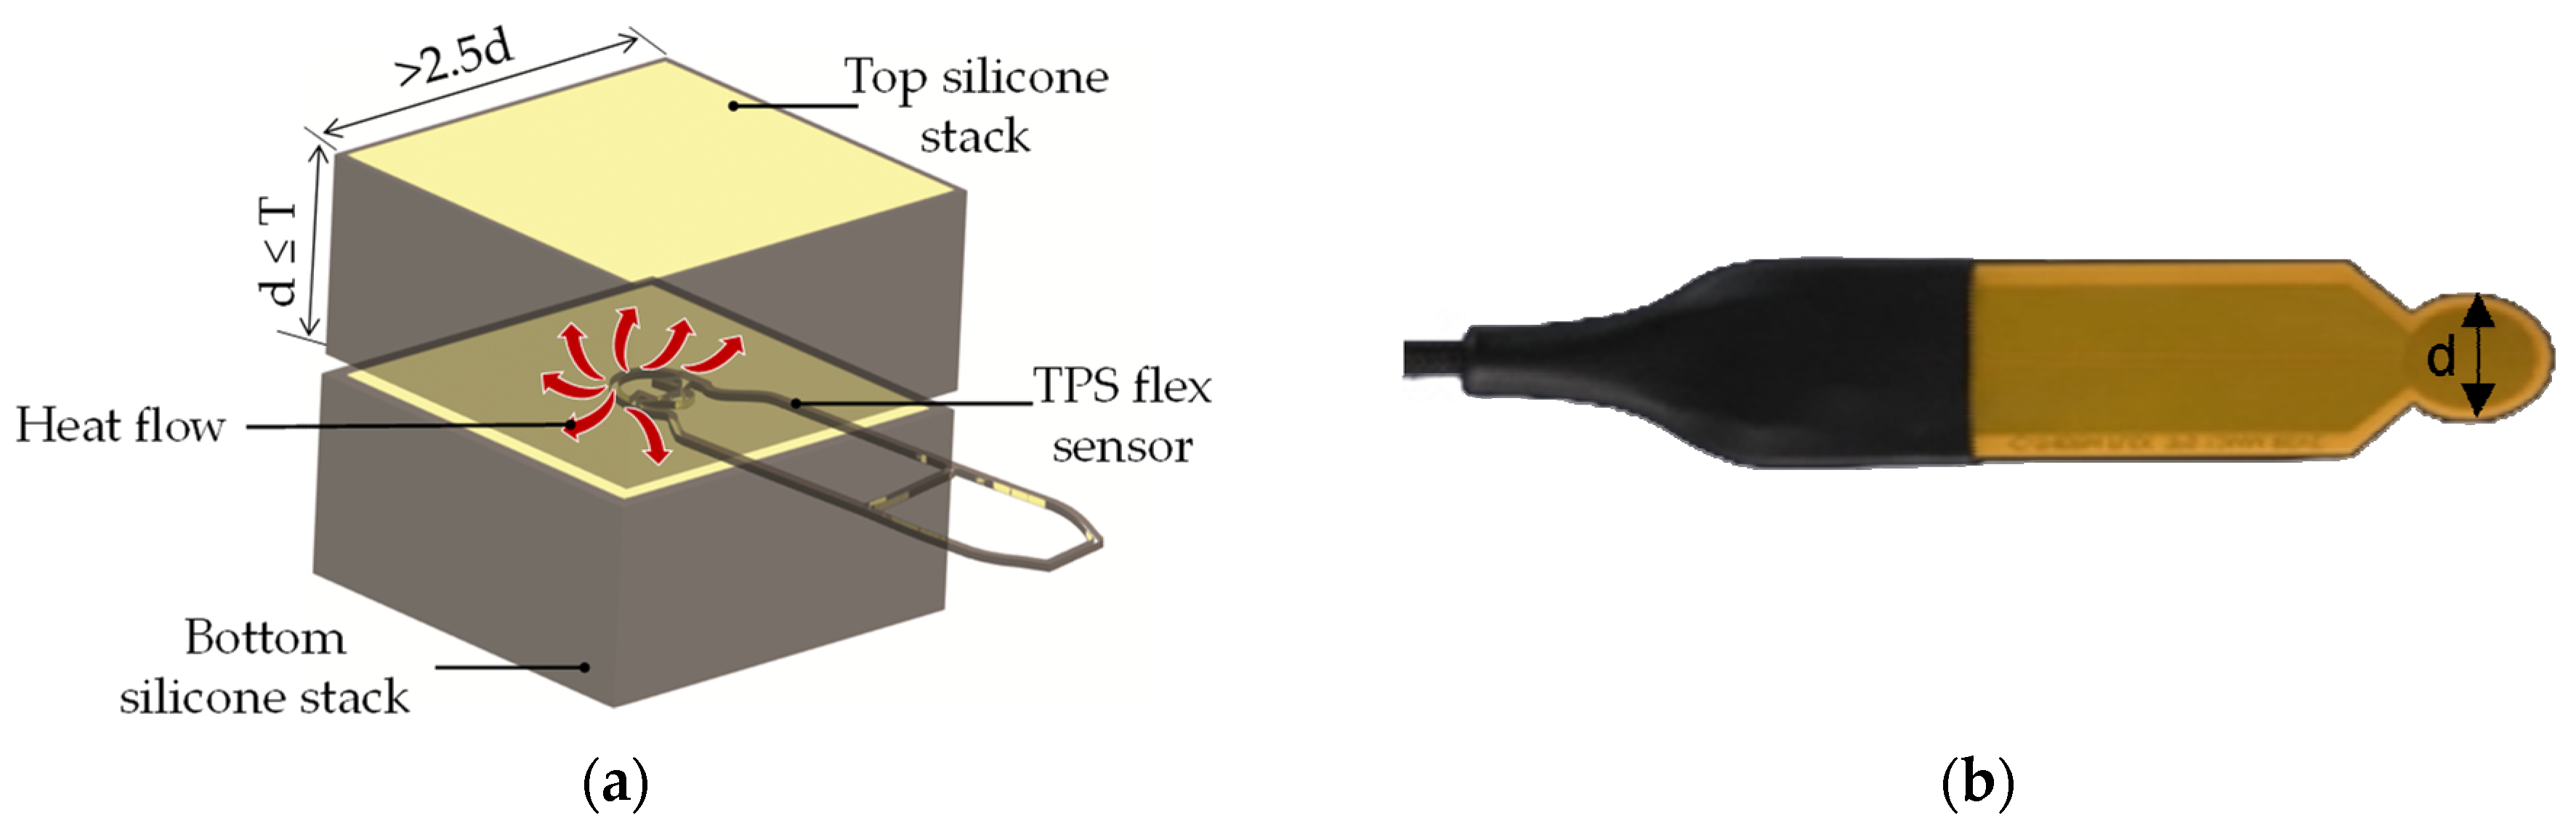
where is time-dependent resistance, is the initial resistance of TPS, is the temperature coefficient of resistance (1/°C), and is the mean time-dependent temperature rise. The requirements for the testing sample, along with the operating principle and sensor diameter, are illustrated in Figure 4. To achieve the required thickness, five layers of silicone membrane, each measuring 100 mm × 100 mm × 1.52 mm, were stacked on each side of the sensor. The entire assembly was then slightly compacted using a supporting rig to ensure better contact. The required testing time is established using the initial default settings, and subsequent trials are executed using this specified time. This testing time was computed using the formula outlined in Equation (2):

Figure 4.
(a) Schematic representation of the experimental setup, operating principle, and sample requirements for the TPS method; (b) TPS sensor [38].
The initial step in this methodology involves conducting preliminary tests to identify the optimal testing conditions. These conditions include determining the testing time, the depth to which the heating signal penetrates the sample, and the linear variation of ΔT in relation to D(t), a shape function for the respective sensor. For this experiment, a sensor with a 6 mm diameter (serial F461, eight rings) was used at a power level of 0.02 W.
Table 1 presents the parameters utilised to optimize the conditions and ensure valid results.

Table 1.
Experimental parameters for optimizing the testing conditions for valid TPS measurements.
In this optimization process, the initial five runs were used to fine-tune the testing parameters, including optimizing the testing time and probing depth to reduce the temperature difference to less than 2 °C. Next, the ∆T variation with respect to D(τ) was verified to be linear, as indicated by the software, to confirm the accurate temperature evolution of the sensor. D(τ) forms the basis of the identification procedure to obtain thermal properties in the hot disk TPS measurement [39]. Subsequently, the random residual distribution was checked to ensure an R-squared value greater than 0.999. Optimization trials indicated that a testing time of 70 s was ideal, which was repeated for five measurements to ensure accuracy and consistency.
2.4. Specific Heat Capacity of Materials
Differential Scanning Calorimetry (DSC) was conducted using a Netzsch DSC 214 Polyma machine, manufactured by NETZSCH-Gerätebau GmbH, Selb, Germany to characterize the specific heat capacity of the carbon fabric, silicone membrane, and binder materials, following the ASTM E1269 standard [37]. This technique relies on three measurements for each trial: baseline, sapphire, and the sample material, all conducted with a closed-lid configuration [40,41]. To accurately measure the specific heat of silicone and preforms, the materials should be placed inside an aluminum crucible with dimensions of 4.75 mm in diameter and 2.25 mm in depth. For this purpose, silicone, chopped binder (CB), chopped carbon fibers (CCFs), and powdered carbon fibers (PCFs) with a size range of 5–7 µm were placed individually inside the crucibles, and testing was carried out.
Additionally, two mixed samples were tested to replicate two preforming conditions with binder: one containing CCF and 1.8 wt% CB, and the other containing PCF and 3.6 wt% binders. In these samples, the binder was placed on top of the carbon fibers and randomly distributed on top to closely represent the preforming configuration, as the adhesive web used does not have a specific structure. Furthermore, the PCF samples with 3.6 wt% binder were subjected to two consecutive heating and cooling cycles after the first heating cycle to observe the effect of reheating on the samples. The weights of the samples, crucible, and sapphire standard, along with the number of samples tested for each material type, are presented in Table 2. All samples in this testing configuration were weighed multiple times using a milligram scale with precision to two decimal places to assess the variability in both the sample and crucible masses.
Table 2.
Sample and crucible masses used in DSC analysis, along with the number of samples tested and sapphire mass employed as reference.
The testing procedure involved equilibrating the specimens at 0 °C for 35–45 min, followed by incrementally raising the temperature in a dynamic step to 220 °C with a heating rate of 20 K min−1. The set temperature of 220 °C was chosen to encompass the range of temperatures that materials might be exposed to during the preforming and curing processes. Another equilibration period of 35–45 min at 220 °C followed. Heat flow data were collected during the dynamic step, and the analysis was conducted using NETZSCH Proteus analysis software to determine the specific heat capacity of the samples.
3. Results and Discussion
3.1. Through Thickness Thermal Conductivity of Fabrics with Binder
The results presented in Figure 5 provide valuable insights into the through-thickness thermal conductivity of carbon fabric and binder mixture samples, particularly under different test conditions in a 0/90 layup orientation. When tested without vacuum and under a 500 gf load, the thermal conductivity was measured at 0.091 W m−1 K−1. Under full vacuum and a 3365 gf load, the thermal conductivity notably decreased to 0.0836 W m−1 K−1, indicating an 8% reduction in heat energy transfer.
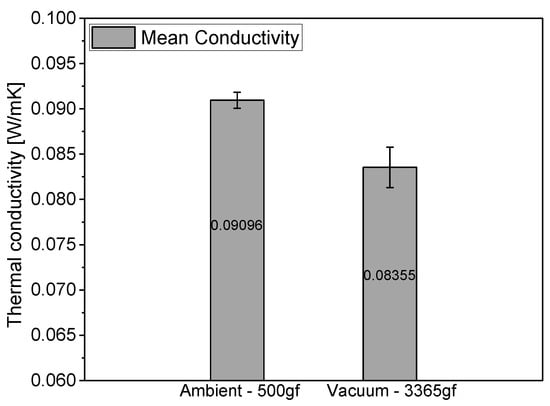
Figure 5.
Through-thickness thermal conductivity of carbon fiber fabrics with binders under two conditions: no vacuum with 500 gf compaction load, and full vacuum with 3365 gf compaction load.
For comparison, the thermal conductivity of carbon fabrics without binder under ambient conditions is reported at 0.127 W m−1 K−1 [36]. The addition of 3.6 wt% binders under similar conditions resulted in a significant 28.3% decrease in thermal conductivity, affecting energy transfer.
Under compaction load and vacuum, simulating preforming conditions, the thermal conductivity of the fabrics alone is reported to be 0.14 W m−1 K−1 [36]. However, with the inclusion of binder material, the thermal conductivity decreases by approximately 40%. This significant reduction in both scenarios is primarily due to altered contact interactions between fabric layers caused by the uneven and random morphology of the binder material. This morphology creates additional voids between adjacent layers. Additionally, the combination of the woven nature and the continuous random web structure further prevents any penetration of the fibers at the interface during compaction.
The reduction in thermal conductivity under vacuum conditions is enhanced upon adding the binder. This is attributed to the voids created by the binder at the interface, coupled with the removal of air from these voids. In ambient conditions, air can aid in heat transfer, but its absence under vacuum leads to a more significant decrease in thermal conductivity. This underscores the critical role of air in thermal performance and the more significant impact of binder addition when air is removed.
These findings emphasize the substantial impact of both preforming conditions and binder addition on the thermal performance of dry carbon fabrics, highlighting the need to carefully consider these factors in the design and manufacturing processes.
3.2. Thermal Conductivity of Silicone Membrane
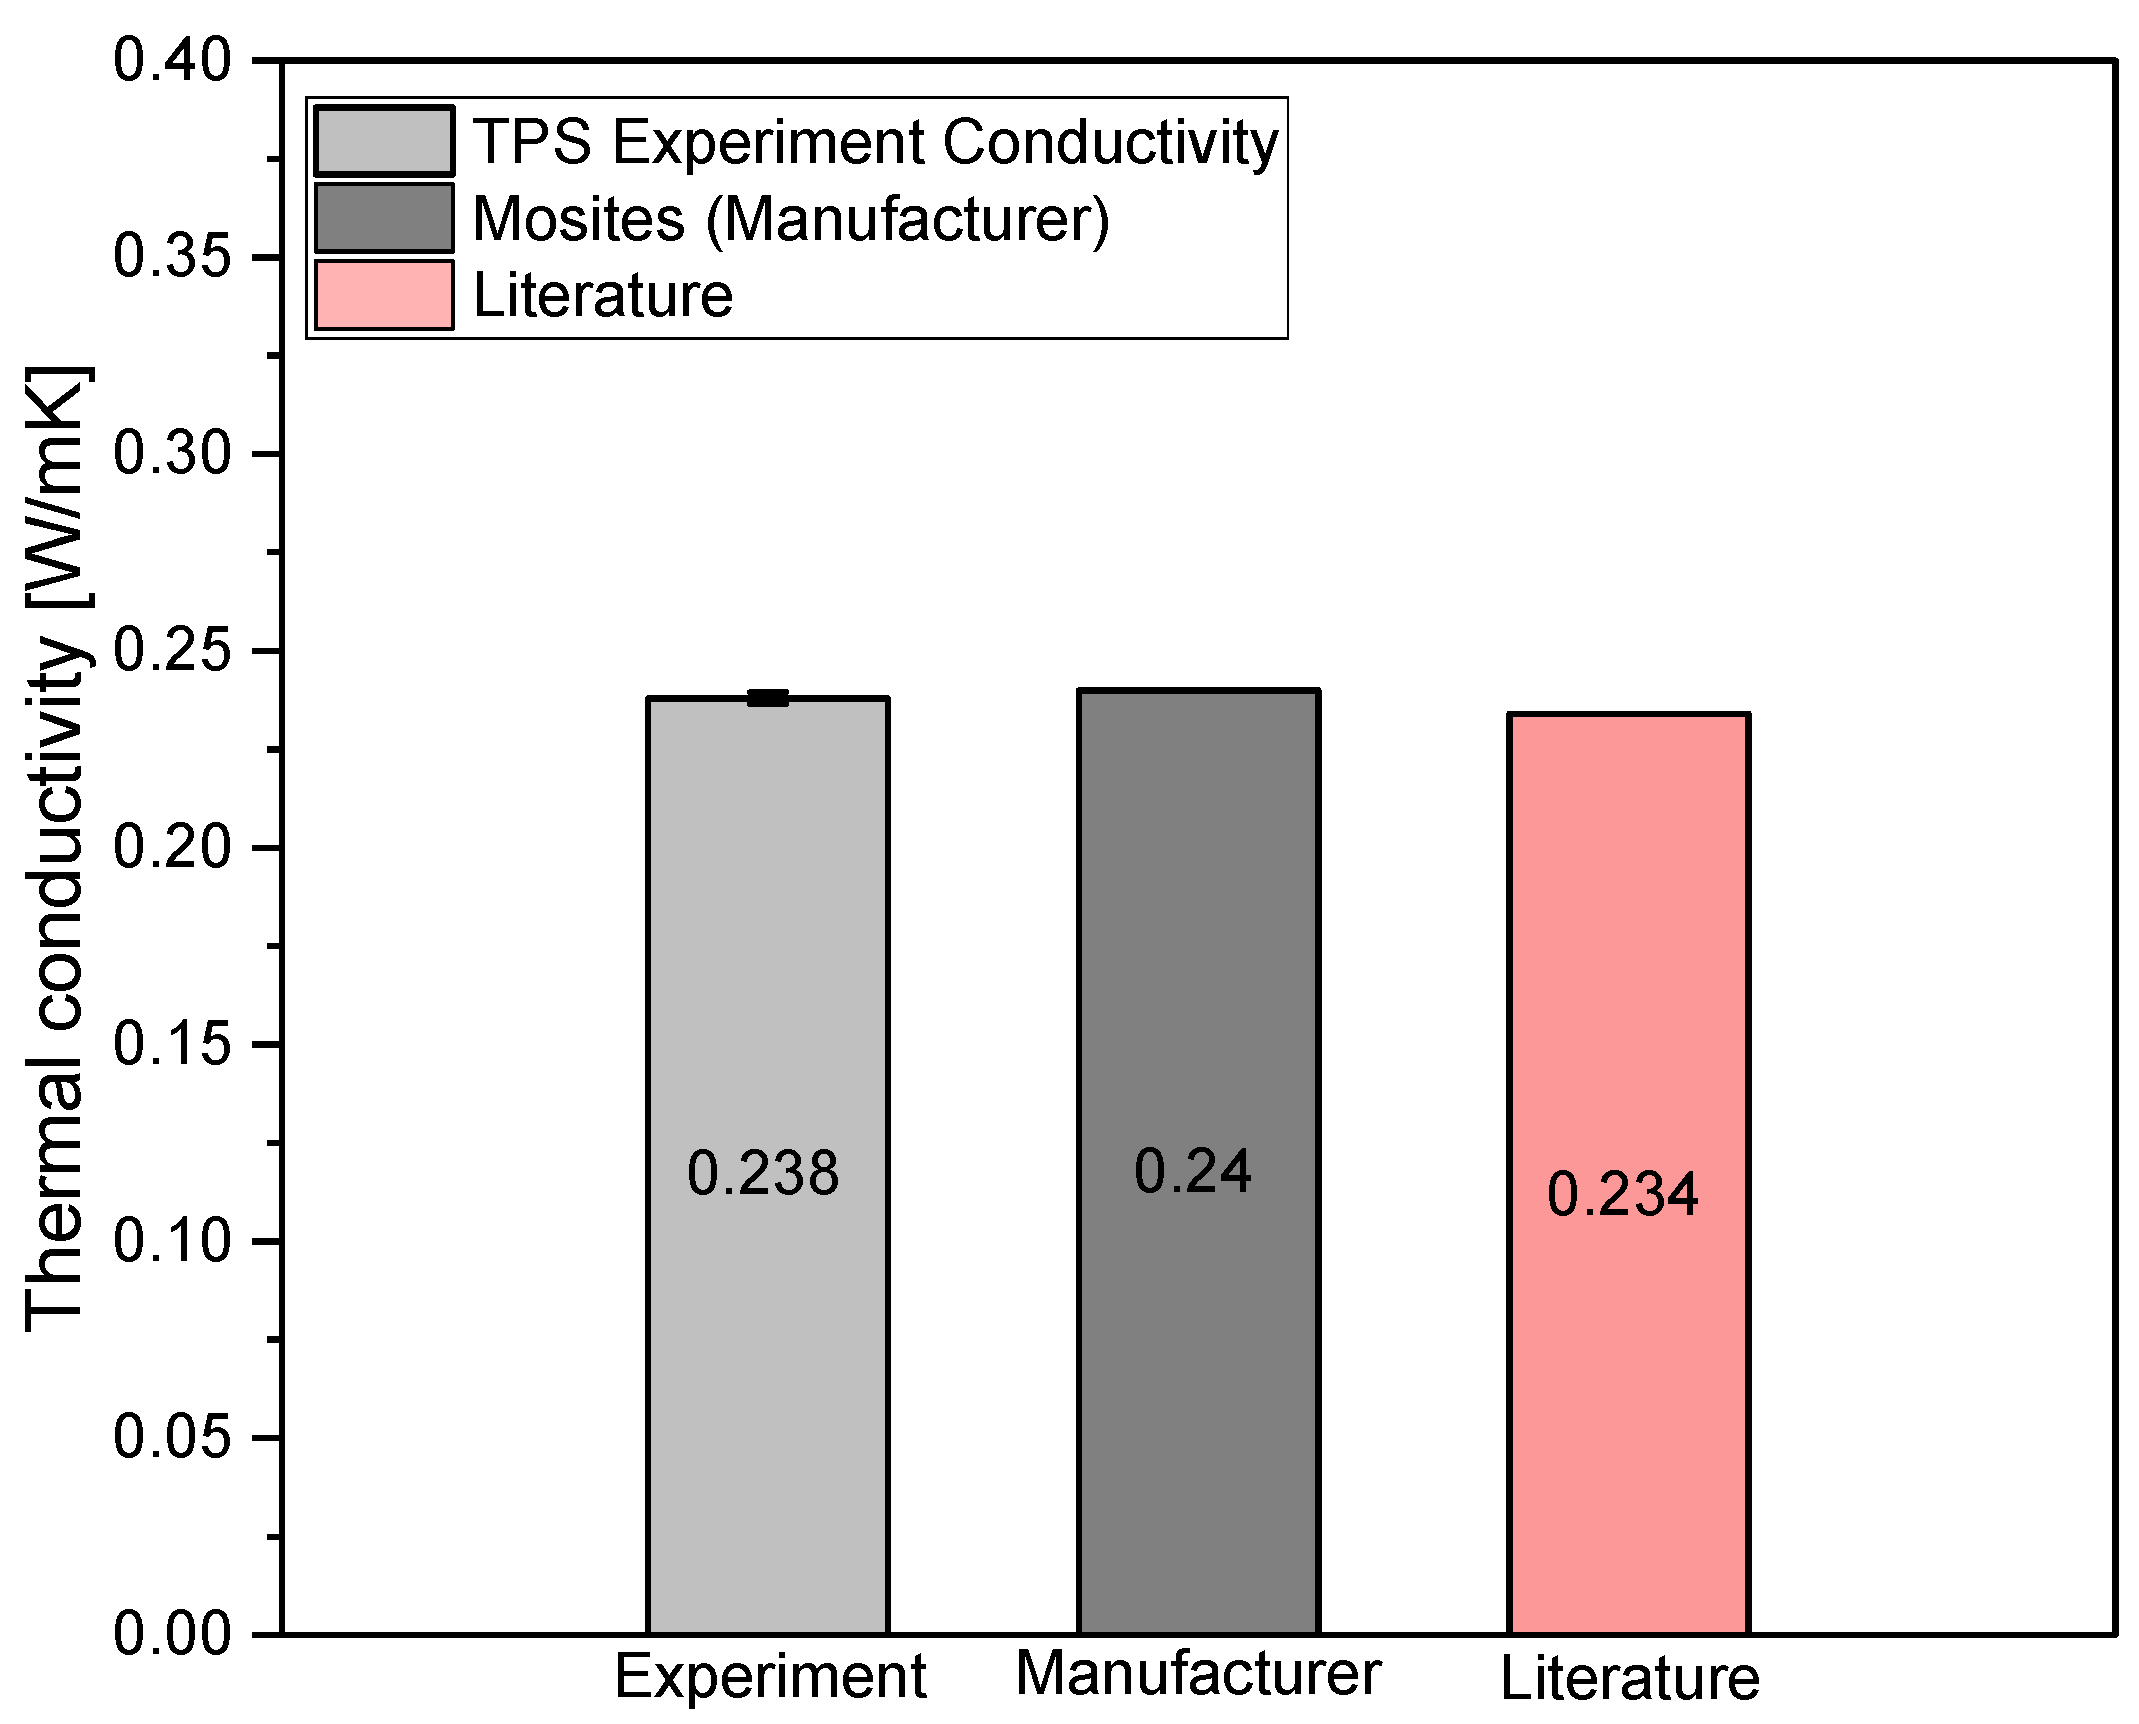
Figure 6 presents the thermal conductivity measurements for the silicone membrane. The data indicates that silicone exhibits higher thermal conductivity compared to carbon fiber fabric. This disparity is primarily due to the porous nature of the fabric material, which reduces the frequency of fiber-to-fiber contacts necessary for efficient heat transfer. In contrast, the silicone membrane provides a more consistent and homogeneous solid medium, thereby enhancing heat transfer efficiency.

Figure 6.
Thermal conductivity of silicone membrane and comparison with manufacturer (Mosites) [42] and literature values [39].
In fabric systems, thermal conductivity is highly dependent on fiber contacts to facilitate heat transfer. The silicone membrane, however, offers a uniform structure (isotropic) that supports more efficient thermal conductivity. These findings corroborate the accuracy and reliability of the measurements, aligning well with established information from the literature and confirming the consistency of the experimental results.
3.3. Specific Heat Capacity of the Materials
The specific heat capacity of various materials was analyzed using differential scanning calorimetry (DSC) with the Proteus analysis software. This process segmented the heat flow data into isothermal, dynamic, and subsequent isothermal steps. The data were then correlated against the measured sapphire standard data and the prerecorded sapphire data from the software. Calibration utilized the most repeatable baseline data obtained by comparing three baseline measurements of empty crucibles. The results for all measurements up to 150 °C, which are critical for the preforming process, are presented below.
3.3.1. Chopped Carbon Fibers (CCF), Binder, and CCF—Binder Mixture
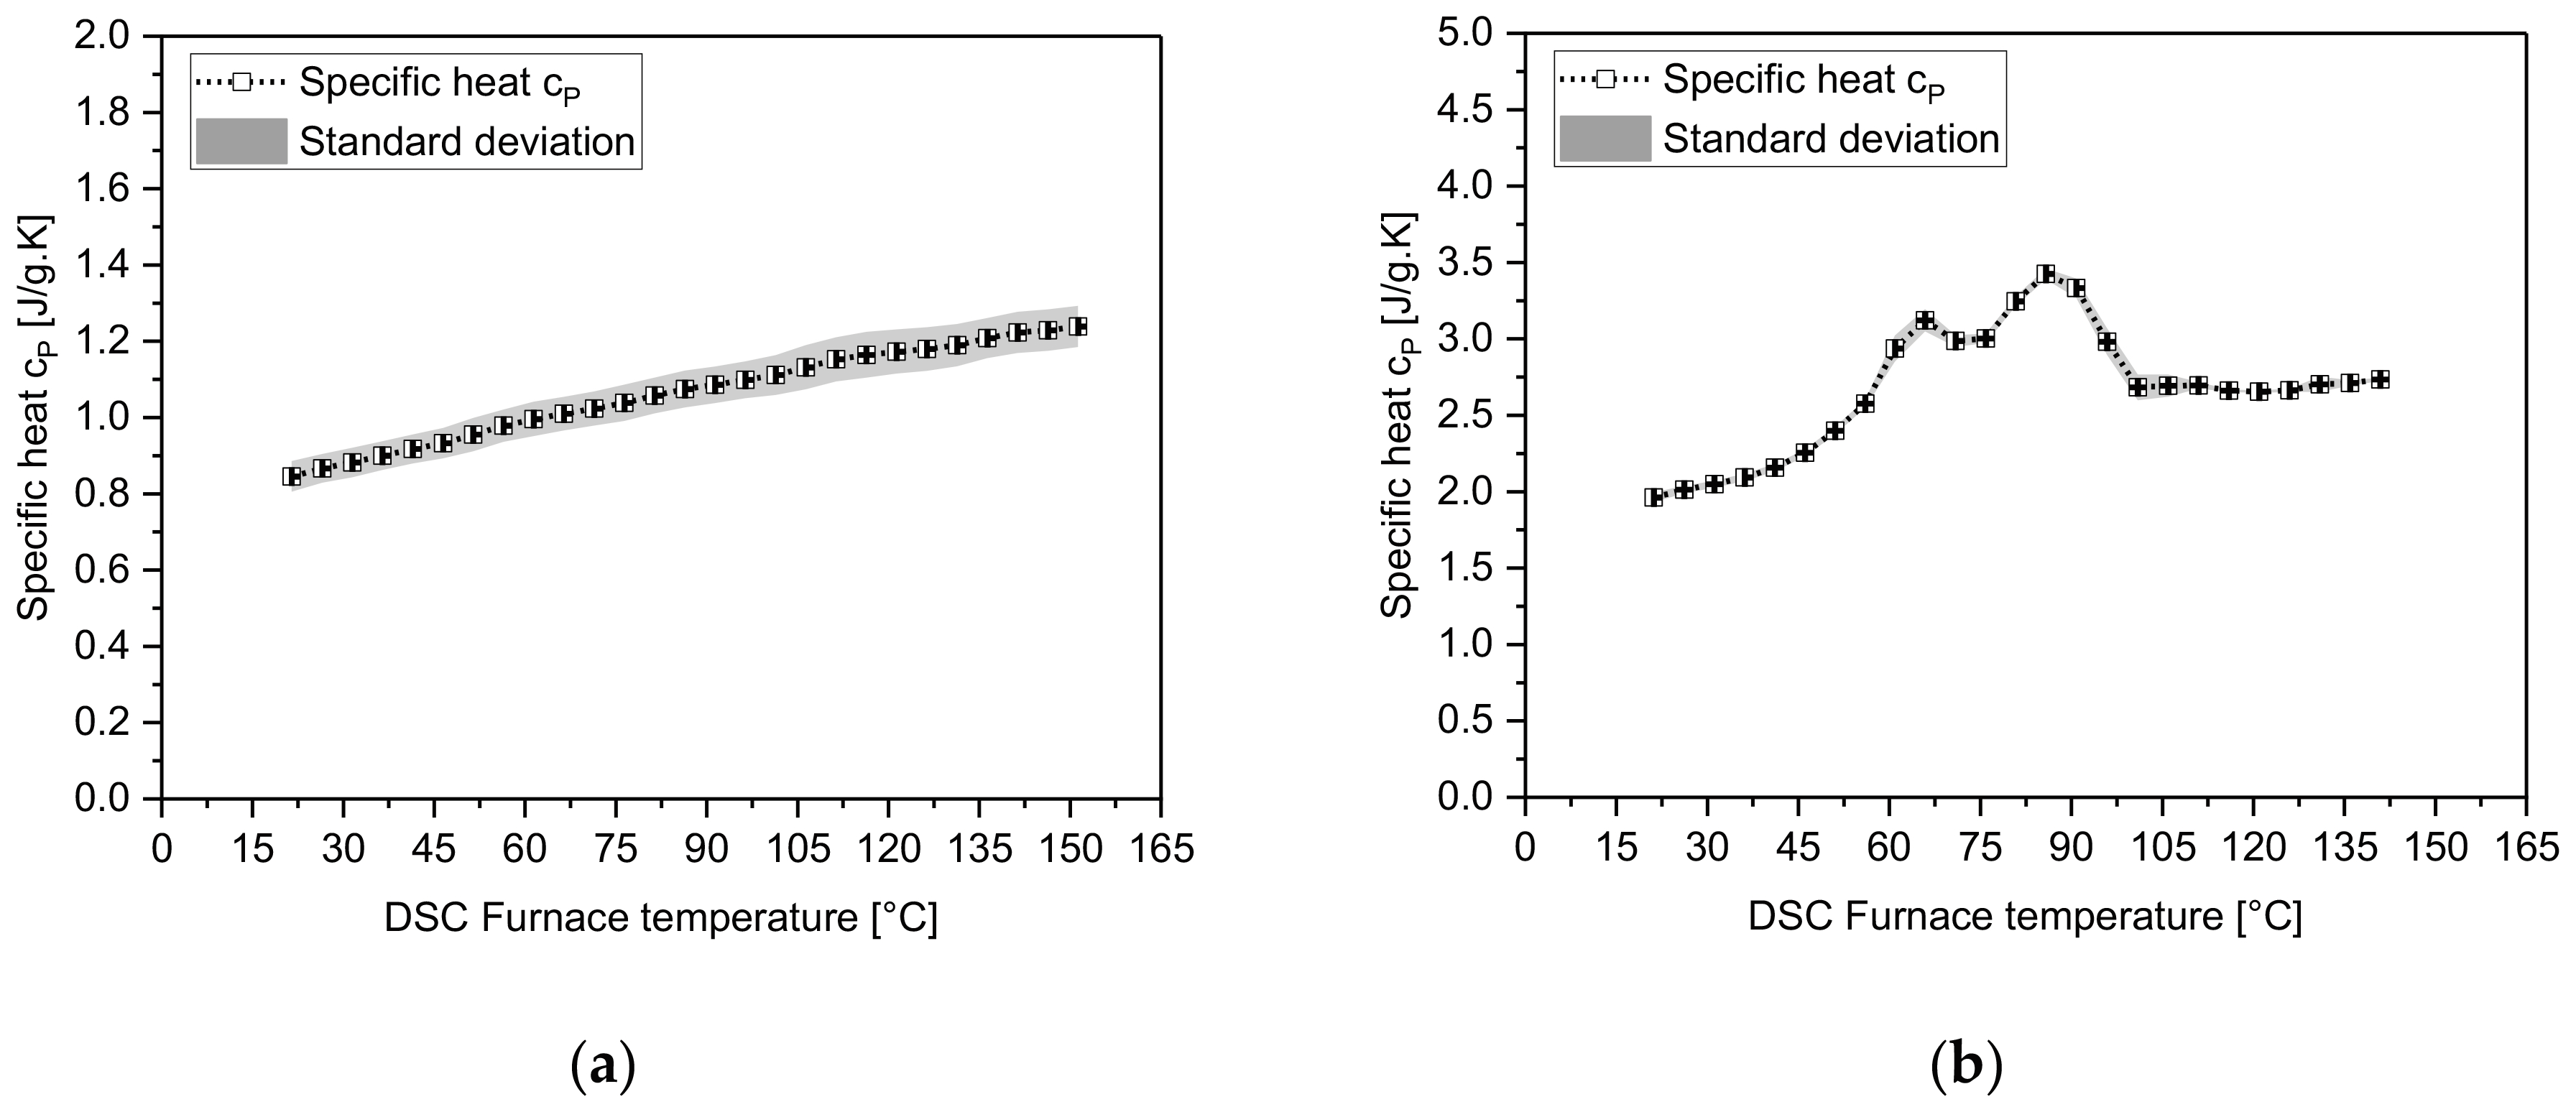
Figure 7 displays the specific heat capacity of chopped fibers and binder as a function of temperature. For chopped fibers, the specific heat capacity was measured as 0.84 J g−1 K−1 at 24 °C and increased to 1.238 J g−1 K−1 at 150 °C (see Figure 7a). For thermoplastic binders, the specific heat capacity was 1.96 J g−1 K−1 at 21 °C and rose to 2.73 J g−1 K−1 at 140 °C, with peaks observed at 65 °C and 85 °C due to phase changes in the binder (see Figure 7b).
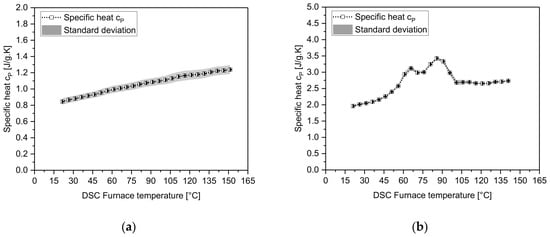
Figure 7.
DSC results of specific heat capacity for (a) chopped fibers, and (b) thermoplastic binder, as a function of DSC furnace temperature.
Beyond 150 °C, the binder samples demonstrated highly nonlinear behavior, characterized by inconsistent peaks and a significant increase in standard deviation. This variability is attributed to the thermal degradation of the binder. Both samples exhibited temperature-dependent behavior, with the binders showing Gaussian behavior around their peak points due to phase transitions.
The temperature-dependent specific heat capacity for chopped fibers is described by Equation (3):
The specific heat capacity for the binder is detailed in Equations (4) through (7). For binders, the non-linear behavior is divided into four segments based on temperature to accurately capture the specific heat capacity’s temperature dependency. Equation (4) represents the temperature range from 20–65 °C, while Equation (5) covers the range from 65–75 °C, with R-squared values of 0.999. Equation (6) and Equation (7) represent temperature ranges from 75–101 °C and 101–140 °C respectively, with an R squared value of 0.999:
For the third case of the CCF-binder mixture, the specific heat results are presented in Figure 8. The mix of CCF and 1.8 wt% binder also showed temperature-dependent behavior. The specific heat capacity at 21 °C was 0.83 J g−1 K−1 and increased to 1.235 J g−1 K−1 at 150 °C. However, there was a slight nonlinear behavior in the melting temperature range, with a 7% increase in specific heat at 80 °C. The temperature-dependent relationship for the CCF-binder samples with 1.8% binder content is described by Equations (8) and (9) for the temperature ranges of 15–77 °C and 77.86–150 °C, respectively. The curve fitting for these equations yields an R-squared value of 0.999:
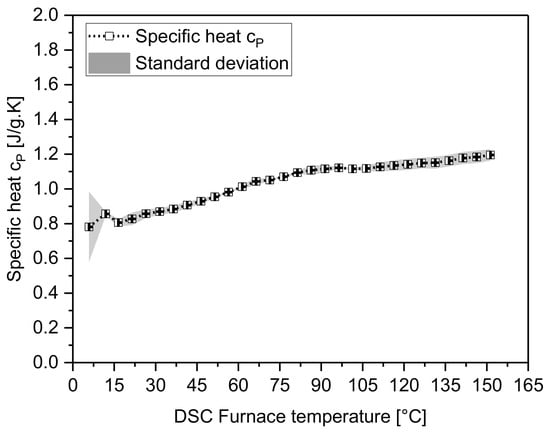
Figure 8.
Specific heat capacity of chopped fibers containing 1.8 wt% binder as a function of DSC furnace temperature.
All samples exhibited slight standard deviations due to the packing of chopped fibers into the crucibles, which created uncontrolled contact between the fibers. High standard deviations were also noted at the starting temperature regions due to the chosen ASTM standard ramp rate of 20 K min−1.
3.3.2. Powdered Carbon Fibers (PCFs) and PCF—Binder Mixture
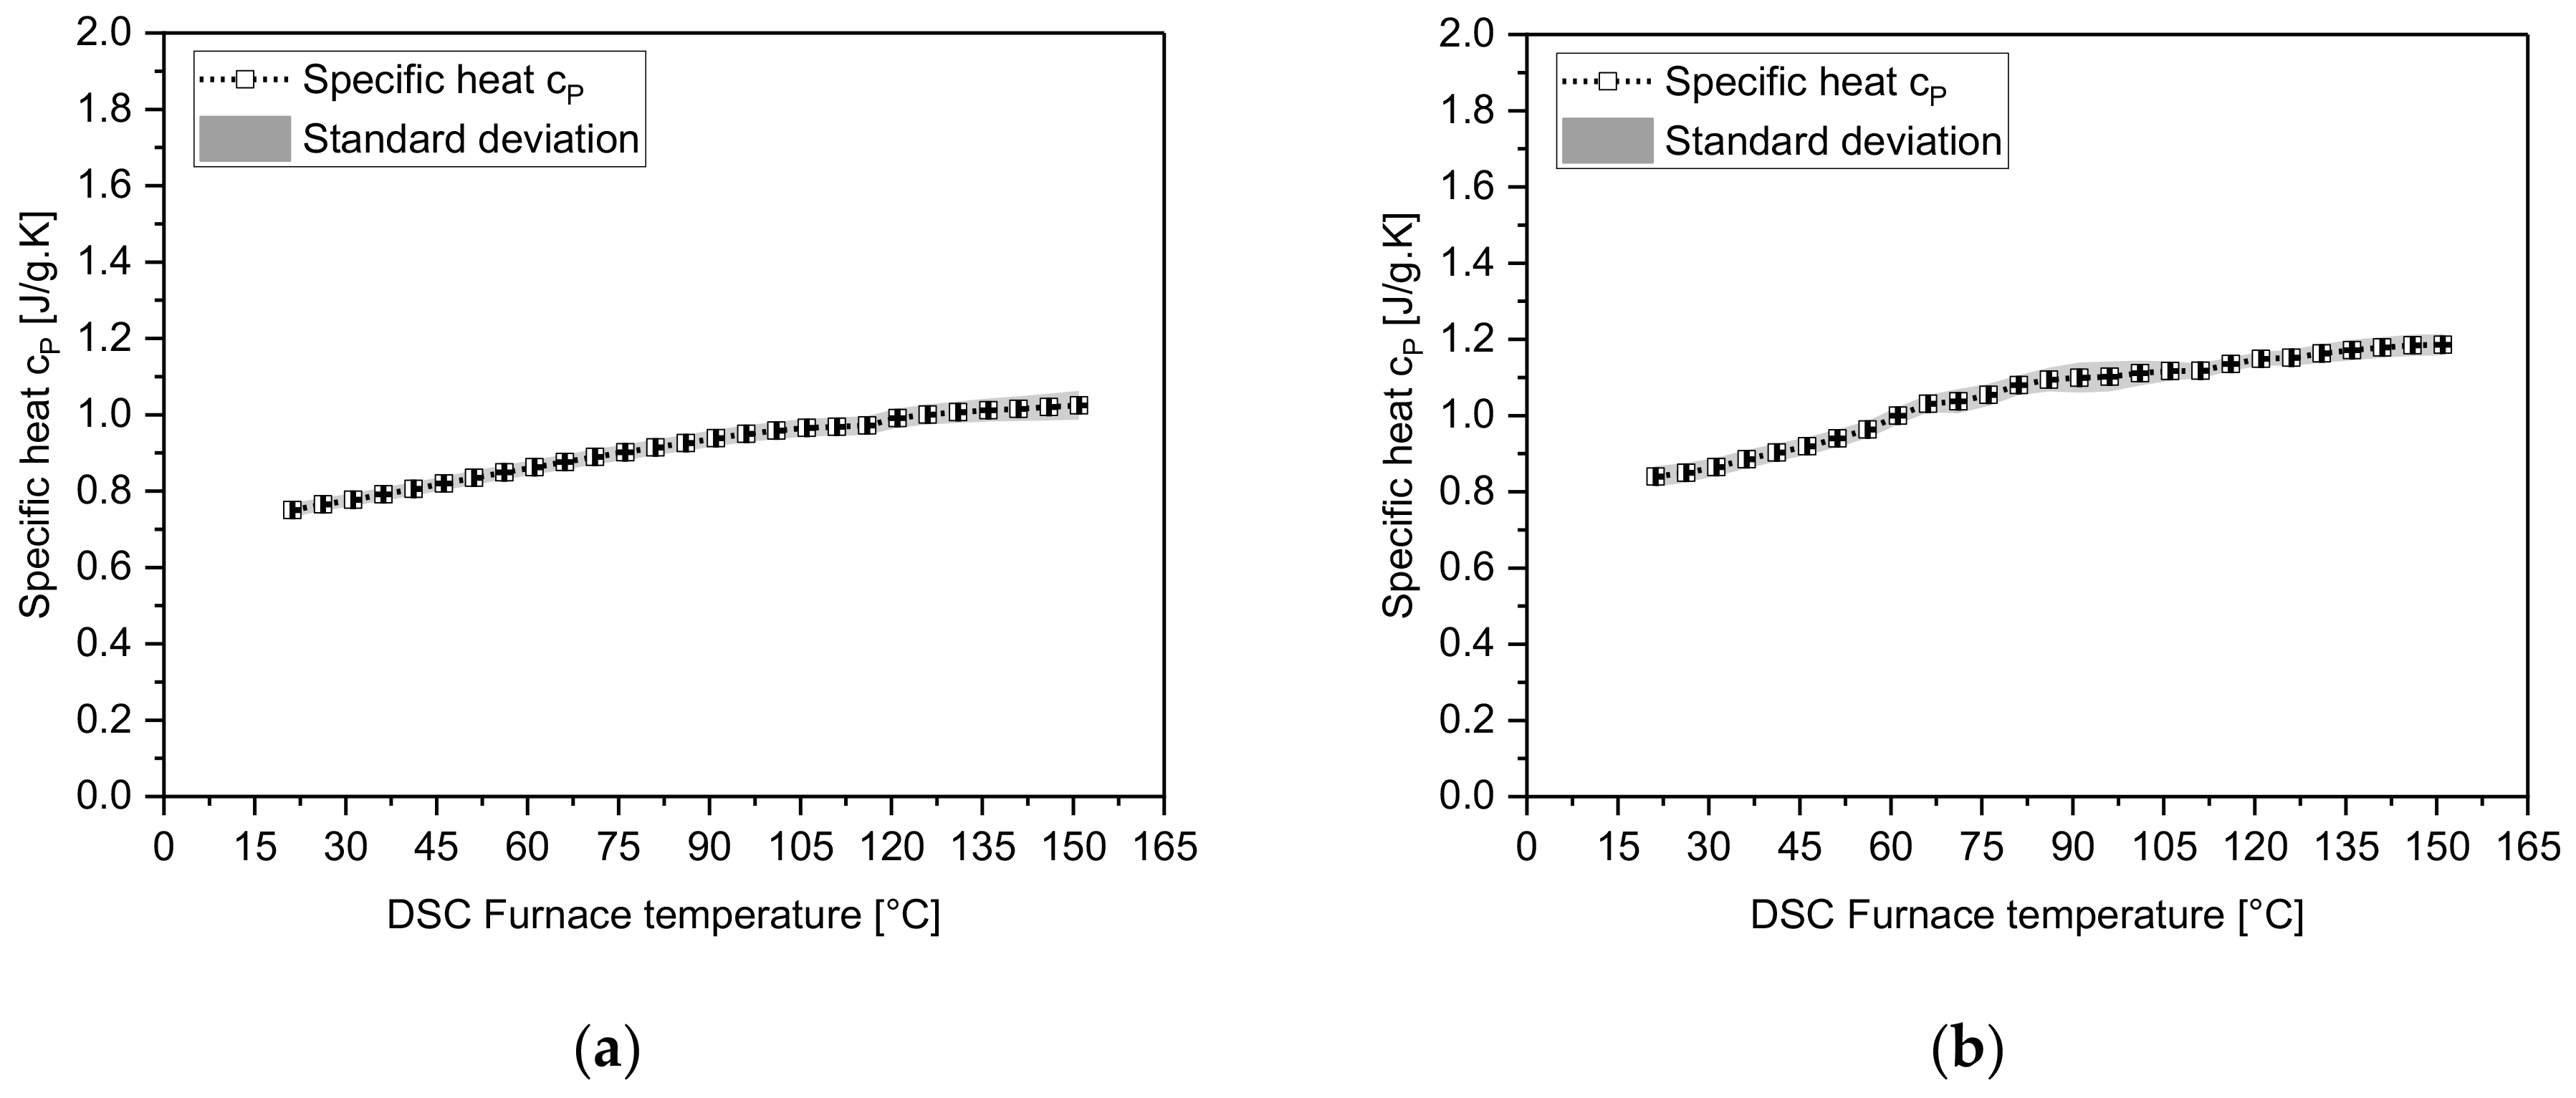
In the second testing configuration, powdered carbon fibers (5–7 µm) were tested in their pure form and as part of a mixture containing 3.5 wt% binder. The results, shown in Figure 9, indicated that the specific heat capacity of PCF was 0.749 J g−1 K−1 at 21 °C and 1.024 J g−1 K−1 at 150 °C (see Figure 9a). Compared to chopped fibers, powdered fibers showed a 10% and 17% reduction in specific heat values at 21 °C and 150 °C, respectively. The standard deviation was slightly reduced, and the powdered fibers exhibited a more linear behavior over the tested temperature range. This can arise due to contamination of air and moisture in the samples, with porous chopped fibers entrapping more in the sample than in the powdered samples. Additionally, possible experimental errors from weight measurements of chopped fibers may occur, as the sample masses have a high standard deviation. The temperature-dependent relation for the specific heat of PCF samples, as represented by Equation (10), is applicable within the temperature ranges of 15–150 °C. The curve fitting process yielded an R-squared value of 0.998, indicating a high degree of accuracy in modeling the specific heat behavior over this temperature range.
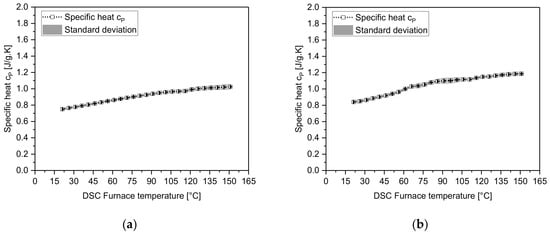
Figure 9.
Specific heat capacity measured by DSC for (a) powdered carbon fibers and (b) powdered carbon fibers with 3.6 wt% binder as a function of DSC furnace temperature.
For the PCF-Binder mixture samples, the specific heat values were 0.84 J g−1 K−1 at 21 °C and 1.18 J g−1 K−1 at 150 °C. The additional 3.6 wt% binder resulted in a 10.8% and 13.2% increase in specific heat at 21 °C and 150 °C, respectively, with a nonlinear variation of 14.6% in the melting region due to the binder’s phase change. To further analyze the temperature-dependent specific heat, curve fitting was performed. Equation (11) applies for temperatures up to 85 °C, while Equation (12) is suitable for temperatures ranging from 85 to 150 °C. The R-squared value for this fit is 0.994, indicating a strong correlation between the experimental data and the fitted model.
3.3.3. Effect of Reheating on Specific Heat for Powdered PCF and Binder Mixture
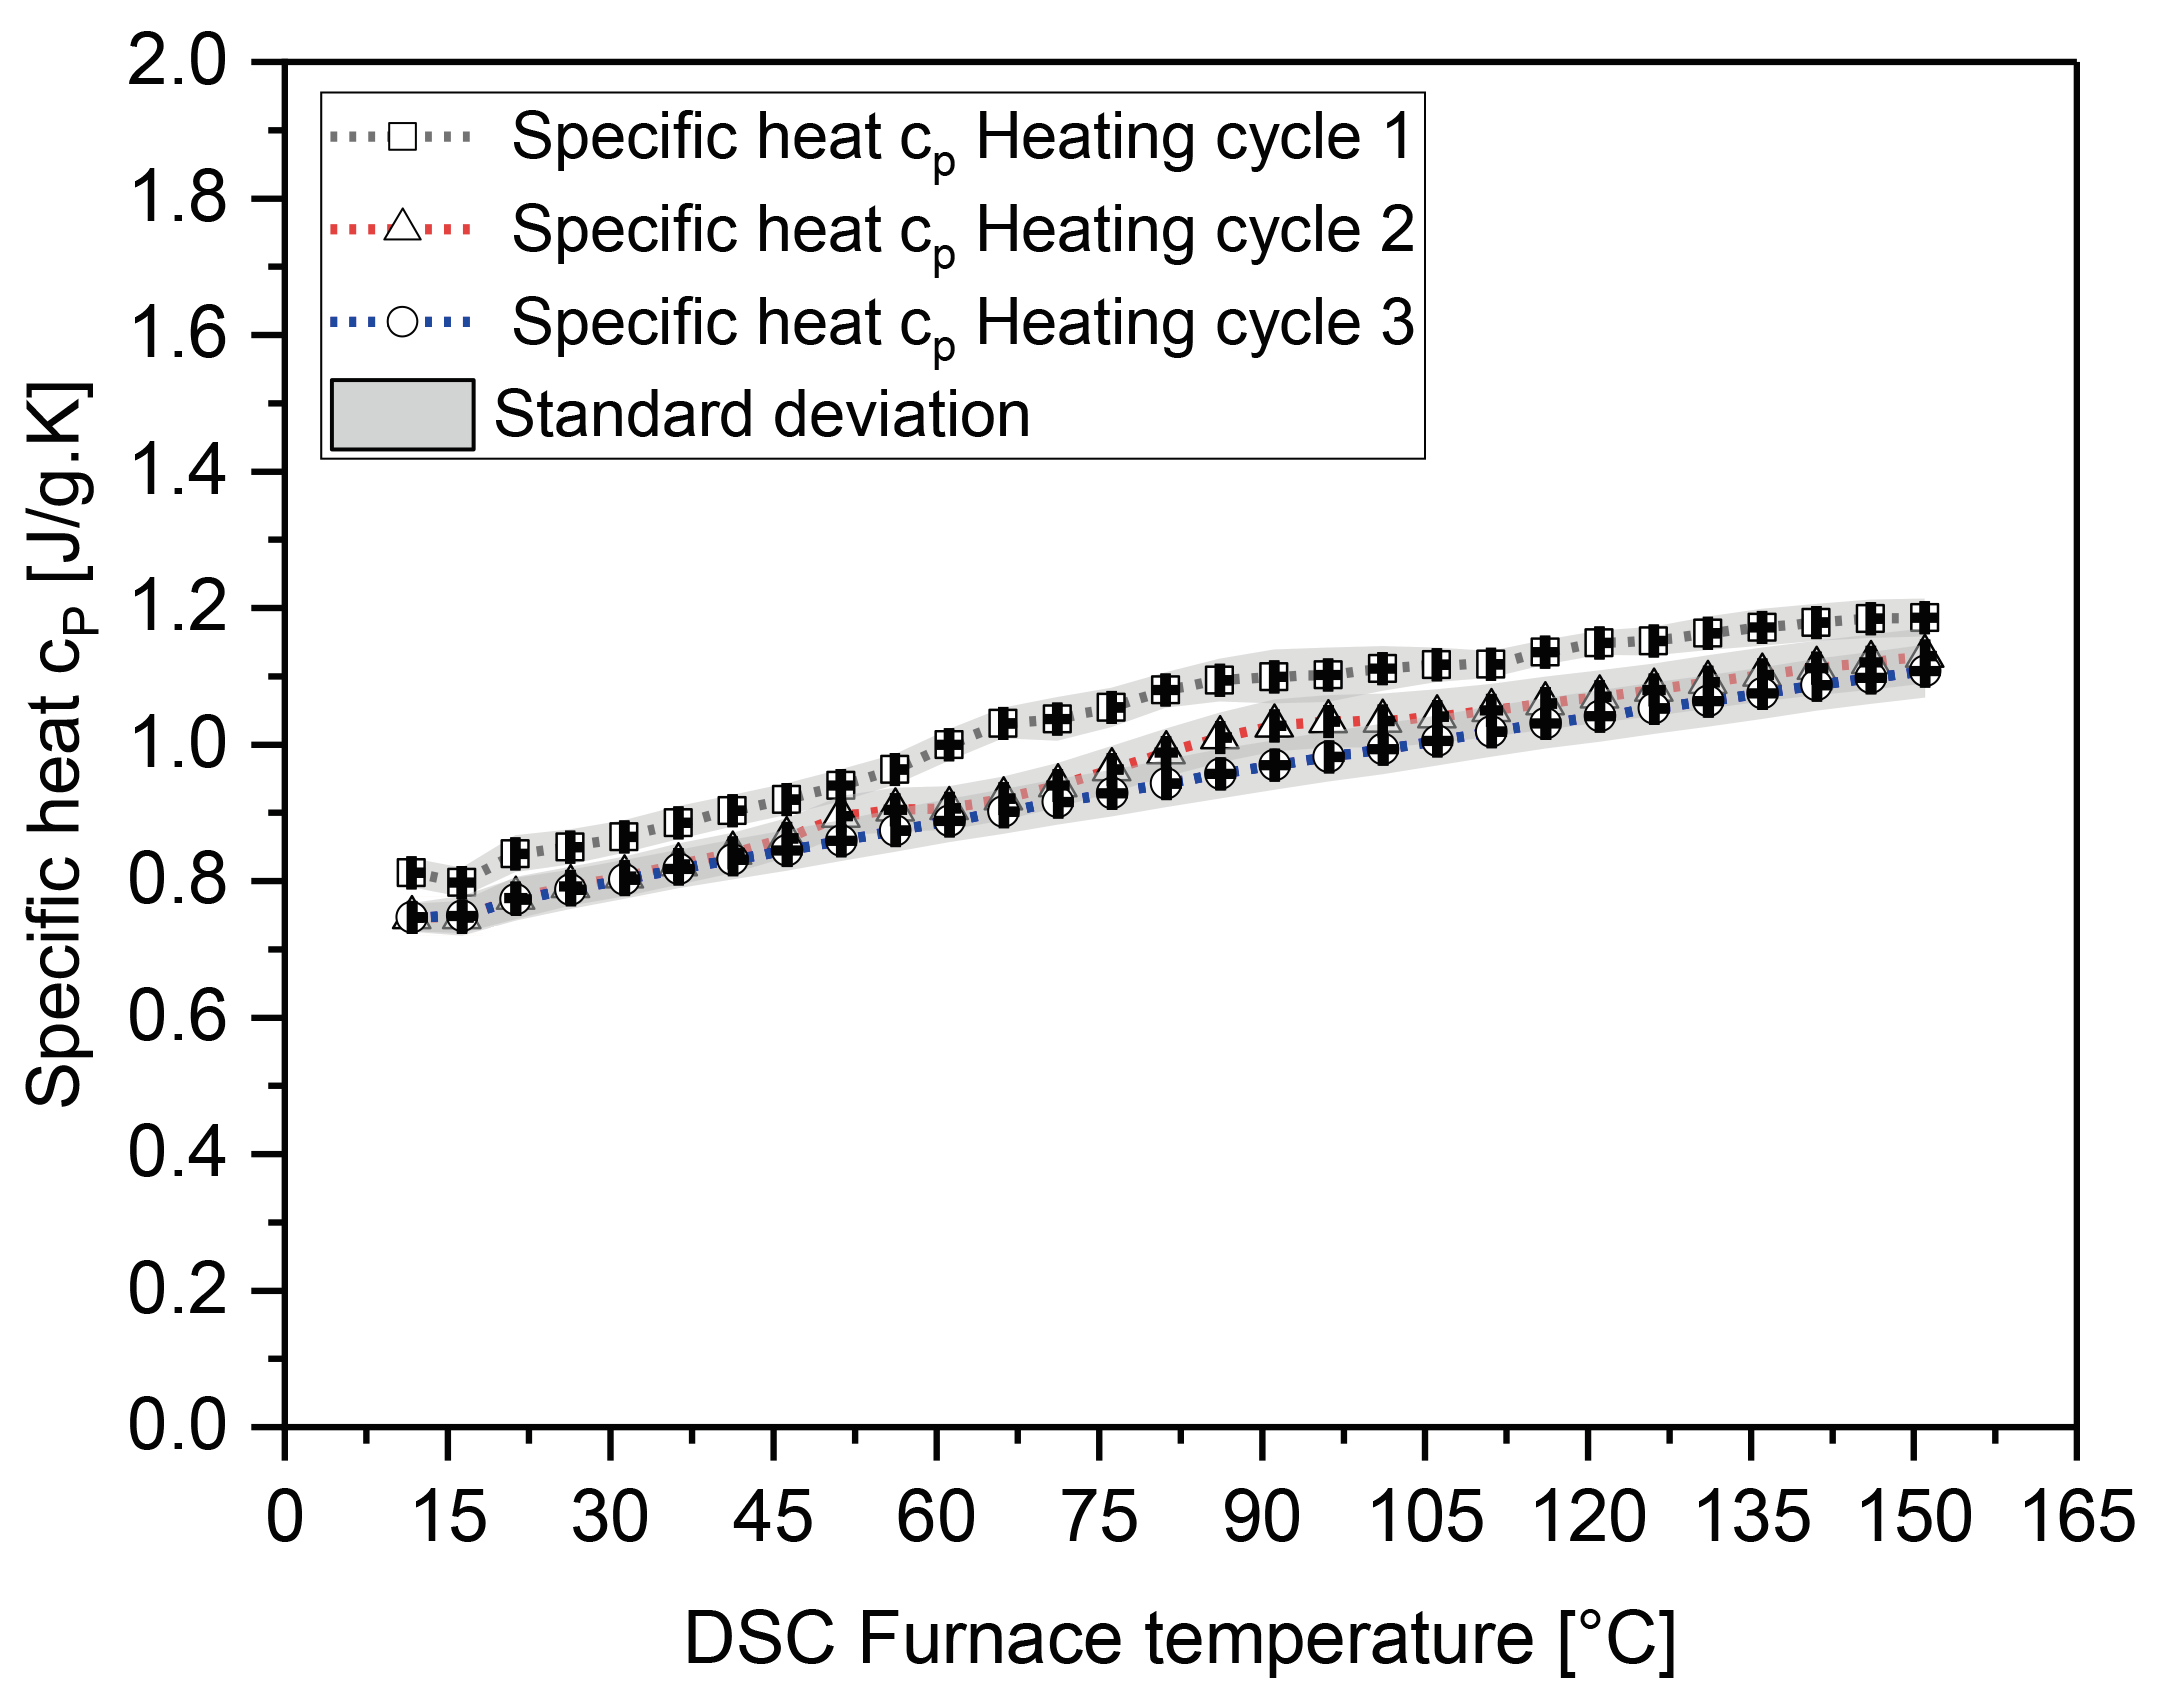
The effect of reheating on the specific heat capacity of the powdered CF and binder mixture was tested over three heating cycles, as some infusion processes occur at elevated temperatures. Figure 10 compares the specific heat across these cycles. In the first heating cycle, the specific heat was 8.8% higher at 21 °C compared to subsequent cycles and showed a 1.12% variation at 150 °C.
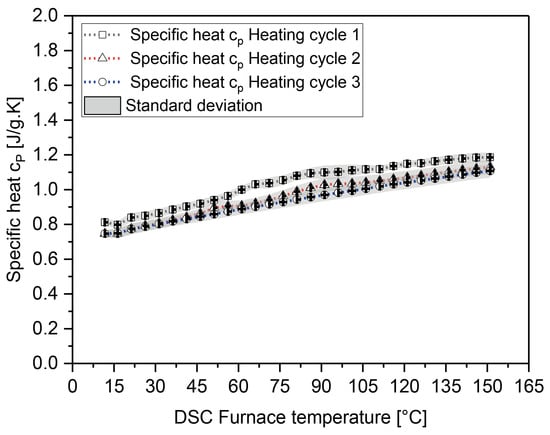
Figure 10.
Comparison of specific heat measurements for powdered carbon fiber samples with 3.6 wt% binder across heating cycles one, two, and three.
The nonlinear behavior in the melting region became more linear in the second and third cycles, with a 9.2% reduction in the second cycle and a 12.93% reduction in the third cycle at 80 °C. Comparing the second and third cycles, only a 4.08% reduction at 80 °C was observed, indicating a stabilization of specific heat behavior across cycles. This stabilization can be attributed to the degradation behavior of the binder in the samples beyond 150 °C, which is observed only in the first heating cycle and does not repeat in the subsequent heating cycles.
3.3.4. Specific Heat Capacity of Silicone Membrane
The specific heat capacity (cp) of silicone membrane samples was measured across a temperature range of 20–220 °C. Data from 60 to 171 °C were selected for analysis due to significant fluctuations observed outside this broader temperature range. The results, presented in Figure 11, showed that cp increased from 1.460 J g−1 K−1 at 60.75 °C to 1.613 J g−1 K−1 at 146.04 °C. A slight deviation in the trend was observed around 171 °C. The standard deviation was relatively low, indicating consistent measurements. There was slightly higher variability at the temperature extremes, likely due to the temperature ramp rate of 20 K min−1 used in the experiment. These variations suggest that the temperature ramp rate can significantly impact measurement accuracy at the beginning and end of the tested temperature range.
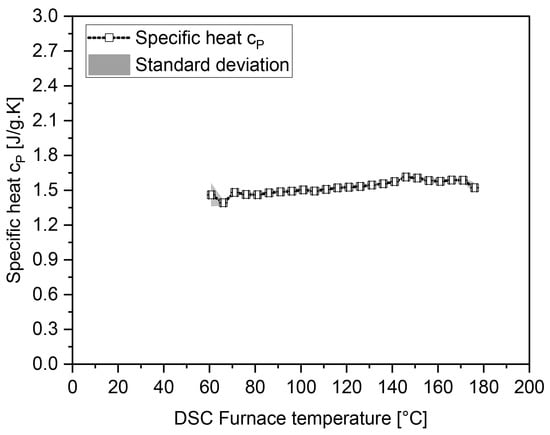
Figure 11.
Temperature-dependent specific heat capacity of silicone membrane obtained from DSC experiments.
The linear curve fitting shown in Equation (13) yielded an error of ±2.26 × 10⁻² J g−1 K−1 for the intercept and ±1.619 × 10⁻⁴ J g−1 K−1 per °C for the slope:
These error values provide confidence intervals, indicating the reliability of the linear model in describing the relationship between cp and the temperature within the analyzed range.
4. Conclusions
This study aims to comprehensively investigate the thermal conductivity and specific heat capacity of materials used in the DDF process, including silicone diaphragms, carbon fibers (chopped and powdered), thermoplastic binders, and their combinations. The findings reveal significant insights into thermal behavior under varying conditions, which is crucial for predicting and optimizing simulation temperatures, enhancing process efficiency, and reducing energy consumption.
The thermal conductivity of carbon fabric samples with the binder in a 0/90 layup orientation decreased under preforming conditions involving the application of full vacuum. The addition of a 3.6 wt% binder significantly reduced thermal conductivity by decreasing fiber-to-fiber contact and creating more voids at the interface between two fabric layers. Silicone demonstrated higher thermal conductivity compared to carbon fiber fabric, attributed to its homogeneous solid medium facilitating efficient heat transfer.
Specific heat capacity measurements highlighted the temperature-dependent behavior of the materials. Chopped carbon fibers and thermoplastic binders exhibited increasing specific heat with temperature, with binders showing Gaussian behavior around phase change points and degradation behavior beyond 150 °C. Mixed samples of chopped fibers and binder also displayed temperature-dependent specific heat with slight non-linear behavior in the melting range. Powdered carbon fibers showed a reduction in specific heat compared to chopped fibers, and the inclusion of binders increased specific heat, particularly in the melting region. Reheating cycles affected the specific heat of powdered carbon fiber and binder mixtures, with subsequent cycles leading to more linear behavior and reduced variations in specific heat due to binder degradation at 150 °C in the first heating cycle.
These measurements provide essential data for accurate numerical modeling of heat transfer in the DDF process. The established temperature-dependent relationships for the specific heat of each material will aid in optimizing preforming parameters, enhancing the energy efficiency and overall effectiveness of composite manufacturing. The study underscores the importance of understanding the thermophysical properties of materials to improve the DDF process.
Author Contributions
S.D.: Writing—original draft, Methodology, Investigation, Formal analysis, Data curation. M.R.: Writing—review and editing, Validation, Supervision, Methodology, Investigation, Formal analysis, Conceptualization. J.N.: Writing—review and editing, Methodology, Formal analysis, Supervision. A.D.P.: Writing—review and editing, Funding acquisition. All authors have read and agreed to the published version of the manuscript.
Funding
This research was funded by the Victorian Higher Education State Investment Fund (VHESIF) through the Aerostructures Innovation Research Hub (AIR Hub).
Data Availability Statement
Data will be made available on request.
Acknowledgments
The authors acknowledge the support of the Victorian Government through the Victorian Higher Education State Investment Fund (VHESIF) as well as the Swinburne/CSIRO Industry 4.0 Test Lab. Special thanks are extended to the digitalization team of the AIR Hub at Swinburne University of Technology for their invaluable support throughout this project. The authors would like to express their gratitude to Victoria Zinnecker and Mojdeh Rehgat for their invaluable support and critical insights, which greatly contributed to the success of this study.
Conflicts of Interest
The authors declare that they have no known competing financial interests or personal relationships that could have appeared to influence the work reported in this paper.
References
- Luby, S.; Bernardon, E. Design of Fabric Preforms for Double Diaphragm Forming. In Proceedings of the FAA, Ninth DOD (NASA) FAA Conference on Fibrous Composites in Structural Design; Draper (Charles Stark) Lab., Inc.: Cambridge, MA, USA, 1992. [Google Scholar]
- Chen, S.; McGregor, O.P.L.; Endruweit, A.; Elsmore, M.T.; De Focatiis, D.S.A.; Harper, L.T.; Warrior, N.A. Double Diaphragm Forming Simulation for Complex Composite Structures. Compos. Part A Appl. Sci. Manuf. 2017, 95, 346–358. [Google Scholar] [CrossRef]
- Verpoest, I. Composite Preforming Techniques. In Comprehensive Composite Materials; Kelly, A., Zweben, C., Eds.; Pergamon: Oxford, UK, 2000; Volume 2, pp. 623–669. [Google Scholar]
- Lomov, S.V.; Verpoest, I. Textile Composite Materials: Polymer Matrix Composites. In Encyclopedia of Aerospace Engineering; Blockley, R., Shyy, W., Eds.; John Wiley & Sons, Ltd.: Hoboken, NJ, USA, 2010; pp. 2159–2176. [Google Scholar]
- Widmaier, N.; Radjef, R.; Middendorf, P.; Fox, B. Double Diaphragm Forming of Bindered Unidirectional Dry-Fibre Tapes: Experimental Analysis of Forming Temperature. In Proceedings of the 20th Australian International Aerospace Congress, Melbourne, Australia, 27 February–1 March 2023; Engineers Australia: Melbourne, Australia, 2023. [Google Scholar]
- Cunningham, J.E.; Monaghan, P.F.; Brogan, M.T. Predictions of the Temperature Profile within Composite Sheets during Pre-Heating. Compos. Part A Appl. Sci. Manuf. 1998, 29, 51–61. [Google Scholar] [CrossRef]
- Aranda, S.; Klunker, F.; Ziegmann, G. Compaction Response of Fibre Reinforcements Depending on Processing Temperature. In Proceedings of the ICCM17-17th International Conference on Composite Materials, Edinburgh, Scotland, 27–31 July 2009. [Google Scholar]
- Aranda, S.; Klunker, F.; Ziegmann, G. Influence of the Binding System on the Compaction Behaviour of NCF Carbon Fibre Reinforcements. In Proceedings of the ICCM 18: International Conferences on Composite Materials, Jeju, Republic of Korea, 21–26 August 2011; ICCM: Jeju, Republic of Korea, 2011. [Google Scholar]
- Wu, W.; Jiang, B.; Xie, L.; Klunker, F.; Aranda, S.; Ziegmann, G. Effect of Compaction and Preforming Parameters on the Compaction Behavior of Bindered Textile Preforms for Automated Composite Manufacturing. Appl. Compos. Mater. 2013, 20, 907–926. [Google Scholar] [CrossRef]
- Wei, K.; Liang, D.; Mei, M.; Wang, D.; Yang, X.; Qu, Z. Preforming Behaviors of Carbon Fiber Fabrics with Different Contents of Binder and under Various Process Parameters. Compos. Part B Eng. 2019, 166, 221–232. [Google Scholar] [CrossRef]
- Bussetta, P.; Correia, N. Numerical Forming of Continuous Fibre Reinforced Composite Material: A Review. Compos. Part A Appl. Sci. Manuf. 2018, 113, 12–31. [Google Scholar] [CrossRef]
- Chai, B.X.; Eisenbart, B.; Nikzad, M.; Fox, B.; Wang, Y.; Bwar, K.H.; Zhang, K. Review of Approaches to Minimise the Cost of Simulation-Based Optimisation for Liquid Composite Moulding Processes. Materials 2023, 16, 7580. [Google Scholar] [CrossRef]
- Boisse, P.; Akkerman, R.; Carlone, P.; Kärger, L.; Lomov, S.V.; Sherwood, J.A. Advances in Composite Forming through 25 Years of ESAFORM. Int. J. Mater. Form. 2022, 15, 39. [Google Scholar] [CrossRef]
- Bigot, N.; Guzman-Maldonado, E.; Boutaous, M.; Xin, S.; Hamila, N. A Coupled Thermo-Mechanical Modelling Strategy Based on Alternating Direction Implicit Formulation for the Simulation of Multilayered CFRTP Thermo-Stamping Process. Appl. Compos. Mater. 2022, 29, 2321–2341. [Google Scholar] [CrossRef]
- Furrer, D.U.; Dimiduk, D.M.; Cotton, J.D.; Ward, C.H. Making the Case for a Model-Based Definition of Engineering Materials. Integr. Mater. Manuf. Innov. 2017, 6, 249–263. [Google Scholar] [CrossRef]
- Baran, I.; Cinar, K.; Ersoy, N.; Akkerman, R.; Hattel, J.H. A Review on the Mechanical Modeling of Composite Manufacturing Processes. Arch. Comput. Methods Eng. 2016, 24, 365–395. [Google Scholar] [CrossRef]
- Schnurr, R.; Gabriel, F.; Beuscher, J.; Dröder, K. Model-Based Heating and Handling Strategy for Pre-Assembled Hybrid Fibre-Reinforced Metal-Thermoplastic Preforms. In Proceedings of the 2nd CIRP Conference on Composite Material Parts Manufacturing, Catcliffe, UK, 10–11 October 2019; Advanced Manufacturing Research Centre: Catcliffe, UK, 2019. [Google Scholar]
- Borgwardt, H. Continuous Preforming with Variable Web Height Adjustment. In Adaptive, Tolerant and Efficient Composite Structures; Wiedemann, M., Sinapius, M., Eds.; Springer: Berlin/Heidelberg, Germany, 2013; pp. 317–324. [Google Scholar]
- Codau, E.; Codau, T.-C.; Lupu, I.-G.; Raru, A.; Farima, D. Heat Transfer Simulation through Textile Porous Media. J. Text. Inst. 2023, 114, 257–264. [Google Scholar] [CrossRef]
- Yang, Y. Thermal Conductivity of Carbon Fibre Fabrics and Multi-Scale Composites with Heat Transfer Simulations for RFI Manufacturing. Masters Thesis, Université d’Ottawa/University of Ottawa, Ottawa, Canada, 2013. [Google Scholar]
- Hind, S.; Robitaille, F. Measurement, Modeling, and Variability of Thermal Conductivity for Structural Polymer Composites. Polym. Compos. 2010, 31, 847–857. [Google Scholar] [CrossRef]
- Kearney, P.; Lekakou, C.; Belcher, S. Measurement of the Heat Transfer Properties of Carbon Fabrics via Infrared Thermal Mapping. J. Compos. Sci. 2022, 6, 155. [Google Scholar] [CrossRef]
- Penide-Fernandez, R.; Sansoz, F. Anisotropic Thermal Conductivity under Compression in Two-Dimensional Woven Ceramic Fibers for Flexible Thermal Protection Systems. Int. J. Heat Mass Transf. 2019, 145, 118721. [Google Scholar] [CrossRef]
- Liu, X.; Wang, T.; Zhuang, M.; Xin, B.; Liu, W. Investigation of the Thermal Transfer Behavior of Single Layer Woven Fabrics at Different Temperatures. J. Eng. Fibers Fabr. 2016, 11, 155892501601100202. [Google Scholar] [CrossRef]
- Shen, H.; Yokoyama, A.; Sukigara, S. Modeling of Heterogeneous Heat Transfer in Fabrics. Text. Res. J. 2018, 88, 1164–1172. [Google Scholar] [CrossRef]
- Yu, H.; Heider, D.; Advani, S. Comparison of Two Finite Element Homogenization Prediction Approaches for through Thickness Thermal Conductivity of Particle Embedded Textile Composites. Compos. Struct. 2015, 133, 719–726. [Google Scholar] [CrossRef]
- Siddiqui, M.O.R.; Sun, D.; Butler, I.B. Geometrical Modelling and Thermal Analysis of Nonwoven Fabrics. J. Ind. Text. 2018, 48, 405–431. [Google Scholar] [CrossRef]
- Yang, Y.; Qian, J.; Chen, Y. Multi-Scale Modeling and Thermal Transfer Properties of Electric Heating Fabrics System. Int. J. Cloth. Sci. Technol. 2019, 31, 825–838. [Google Scholar] [CrossRef]
- Liu, T.; Chen, M.; Dong, J.; Sun, R.; Yao, M. Numerical Simulation and Experiment Verified for Heat Transfer Processes of High-Property Inorganic Fiber Woven Fabrics. Text. Res. J. 2022, 92, 2368–2378. [Google Scholar] [CrossRef]
- Siddiqui, M.O.R.; Sun, D. Thermal Analysis of Conventional and Performance Plain Woven Fabrics by Finite Element Method. J. Ind. Text. 2018, 48, 685–712. [Google Scholar] [CrossRef]
- Zhao, D.; Qian, X.; Gu, X.; Jajja, S.A.; Yang, R. Measurement Techniques for Thermal Conductivity and Interfacial Thermal Conductance of Bulk and Thin Film Materials. J. Electron. Packag. Trans. ASME 2016, 138, 040802. [Google Scholar] [CrossRef]
- Li, Y.; Li, L.; Li, Y.; Wang, H.; Wang, P.; Zhang, Y. The Through-Thickness Thermal Conductivity and Heat Transport Mechanism of Carbon Fiber Three-Dimensional Orthogonal Woven Fabric Composite. J. Text. Inst. 2024, 115, 308–315. [Google Scholar] [CrossRef]
- Macías, J.D.; Bante-Guerra, J.; Cervantes-Alvarez, F.; Rodrìguez-Gattorno, G.; Arés-Muzio, O.; Romero-Paredes, H.; Arancibia-Bulnes, C.A.; Ramos-Sánchez, V.; Villafán-Vidales, H.I.; Ordonez- Miranda, J.; et al. Thermal Characterization of Carbon Fiber-Reinforced Carbon Composites (C/C). Appl. Compos. Mater. 2019, 26, 321–337. [Google Scholar] [CrossRef]
- Pradere, C.; Batsale, J.C.; Goyhénèche, J.M.; Pailler, R.; Dilhaire, S. Thermal Properties of Carbon Fibers at Very High Temperature. Carbon 2009, 47, 737–743. [Google Scholar] [CrossRef]
- ASTM E1461-13; Standard Test Method for Thermal Diffusivity by the Flash Method. ASTM International: West Conshohocken, PA, USA, 2022.
- Reghat, M.; Ravandi, M.; Zinnecker, V.; Di Pietro, A. Through-Thickness Thermal Conductivity Characterisation of Dry Carbon Fibre Fabric. Mater. Lett. 2024, 361, 136116. [Google Scholar] [CrossRef]
- ASTM D7984; Standard Test Method for Measurement of Thermal Effusivity of Fabrics Using a Modified Transient Plane Source (MTPS) Instrument. ASTM International: West Conshohocken, PA, USA, 2021.
- C-Therm Technologies, Ltd. Thermal Conductivity Instrument-Transient Plane Source (TPS) Flex: ISO 22007-2, GB/T 32064. Available online: https://ctherm.com/thermal-conductivity-instruments/trident/ (accessed on 13 July 2024).
- Zheng, Q.; Kaur, S.; Dames, C.; Prasher, R.S. Analysis and Improvement of the Hot Disk Transient Plane Source Method for Low Thermal Conductivity Materials. Int. J. Heat Mass Transf. 2020, 151, 119331. [Google Scholar] [CrossRef]
- NETZSCH-Geraetebau GmbH: Determine the Specific Heat Capacity during an Isothermal Measurement–Use the Temperature-Modulated DSC 214 Polyma. Available online: https://analyzing-testing.netzsch.com/_Resources/Persistent/1/1/3/a/113a82aa25c66d466843e79a134e449ecb15ac00/DSC_214_Polyma_en_web.pdf (accessed on 28 March 2023).
- ASTM E1269-11; Standard Test Method for Measuring the Heat Capacity and Thermal Conductivity by Modulated Temperature Differential Scanning Calorimetry. ASTM International: West Conshohocken, PA, USA, 2011.
- Thermal Properties of Mosites #1453 Silicone | Silicone Rubber Data. Available online: https://www.mositesrubber.com/technical-resources/silicone-rubber-technical-info/thermal-properties-of-mosites-1453-silicone/ (accessed on 22 February 2024).


Disclaimer/Publisher’s Note: The statements, opinions and data contained in all publications are solely those of the individual author(s) and contributor(s) and not of MDPI and/or the editor(s). MDPI and/or the editor(s) disclaim responsibility for any injury to people or property resulting from any ideas, methods, instructions or products referred to in the content. |
© 2024 by the authors. Licensee MDPI, Basel, Switzerland. This article is an open access article distributed under the terms and conditions of the Creative Commons Attribution (CC BY) license (https://creativecommons.org/licenses/by/4.0/).