Abstract
In order to reveal the migration and evolution of gas molecules in the actual oil–paper insulation composite system of transformer from the molecular level, the diffusion behavior of seven gas molecules (H2, CO, CO2, CH4, C2H2, C2H4, C2H6) generated during the operation and aging of oil-immersed transformers in the oil–paper composite insulation system is studied by molecular dynamics. Firstly, based on the molecular dynamics software, the model of the oil–paper composite insulation system and the gas molecule model is constructed. In order to compare and analyze the diffusion properties of gas molecules in a single medium, a single model of insulating oil and cellulose is also constructed. Then, the diffusion coefficients of gas molecules in the insulating oil, cellulose, and oil–paper insulating composite system are simulated and calculated. And the differences in the diffusion properties of gas molecules in the three insulating mediums are discussed. Finally, the microscopic mechanism of diffusion of different gas molecules in the three mediums is analyzed. The simulation results show that among the three mediums, the diffusion coefficient of H2 is the largest, while the diffusion coefficients of the other gas molecules are not very different. The diffusion coefficients of the seven gas molecules are the smallest in the oil-immersed paper composite insulation system, followed by cellulose, while the diffusion coefficients are the largest in mineral oil. It indicates that the diffusion of gas molecules is inhibited in oil–paper insulation systems where the insulating paper is completely immersed in oil. This is mainly due to the fact that the insulating oil completely penetrates into the paper, filling the pores and voids between the fibers, resulting in a reduction in the transition vacancies of the intermediate gas molecules, which hinders the diffusion of the gas molecules.
1. Introduction
A power transformer is one of the utmost critical and expensive pieces of equipment for power system utility. Oil-immersed power transformers are widely used in ultra-high transmission systems due to their ability to handle higher voltage levels than dry-type transformers [1]. Mineral oil–paper insulation structure has been used in transformers for more than a century because of its good performance and low price [2]. The insulation structure of an oil-immersed transformer mainly consists of mineral oil and cellulose pressboard. There will be defects such as bubbles, cracks, suspended particles, and burrs during the manufacturing of transformers. These defects will cause the electric field strength in some areas inside or on the surface of the insulator to be higher than the average electric field strength. When the breakdown field strength in these areas is lower than the average breakdown field strength, the discharge will occur first, while other areas will still maintain insulating properties, resulting in the formation of partial discharge. The partial discharge will release a certain amount of energy to destroy the structure of the oil–paper insulation, resulting in the breakage of the chemical bonds of the oil–paper insulation, causing the insulating material to crack and produce characteristic gases (H2, CO, CO2, CH4, C2H2, C2H4, C2H6). Currently, the most effective and common way of determining the running status of oil-immersed transformers is by the real-time monitoring of the dissolved gas content in the transformer oil. However, with the rapid development of the power grid and the continuous rise of voltage levels, the number of sudden short-circuit faults is also increasing, resulting in the characteristic parameters monitored by the dissolved gases in the oil, which cannot reflect the operational status of the transformer in time. Therefore, the method of dissolved gas analysis (DGA) in the oil to determine the operating status of Ultra-High Voltage (UHV) transformers has certain shortcomings [3,4].
At present, regarding the problem of sudden fault judgment inside the transformer, X. Zhou et al. have studied the creeping discharge model in the oil–paper insulation system and concluded that there are two types of discharge mechanisms inside the transformer: one is the phenomenon of the slow development of partial discharges, and the other is the phenomenon of rapid and violent discharges occurring in a short period of time. Compared with slowly developing discharge faults, the rapid and severe partial discharge will produce large amounts of characteristic gases such as CO and H2 [5]. In [6], the monitoring method of gas dissolved in oil can be used to identify rapid and intense discharge defects, where the ratio of C2H4/C2H6 will significantly increase. Additionally, in [7], the continuous increase in discharge repetition rate can also serve as a diagnostic indicator for the development of sudden discharge defects to the terminal stage. According to [8], based on the variations in the voltage withstand index (n) exhibited by oil–paper insulation in different voltage and field strength regions, the threshold voltage and threshold field strength for rapid and intense discharges are determined. However, for extra-high-voltage (UHV) transformers with larger volumes, complex structures, and greater oil capacity, the measured dissolved gas content in the oil is the characteristic gas generated at the fault point and then reaches the sampling location after dissolving and diffusing inside the oil tank. Therefore, fault diagnosis of large power transformers based on the DGA method is inseparable from the gas diffusion process. Due to the relatively long diffusion paths within the oil tank, the measured gas content in the oil at monitoring points may not promptly correspond to the fault status. This lack of a timely response may lead to misjudgments or omissions in detecting sudden faults.
Traditional experimental methods often only focus on the study of macroscopic phenomena. The analysis and judgment guidelines for dissolved gases in transformer oil are also based on empirical data. Previous research results have shown that the migration phenomenon in the oil–paper insulation of power transformers can be explained using diffusion equations, and relevant parameters have been obtained [9,10]. Previous studies have been conducted on both macroscopic analysis and microscopic mechanisms. In [11], optical equipment was utilized to monitor the dynamic dissolution of hydrogen bubbles in de-aerated oil to determine the diffusion coefficient of hydrogen in transformer oil. References [12,13] employed molecular dynamics modeling to reveal the diffusion coefficients of characteristic small molecular gases in mineral oil–paper insulation systems at a microscopic level. Similarly, references [14,15] used molecular dynamics methods to investigate the diffusion characteristics of characteristic gas molecules in camellia seed oil insulation. Reference [16] conducted a study on the diffusion characteristics of characteristic gas molecules in a natural ester insulation oil under typical transformer faults using molecular dynamics methods and compared them with the diffusion characteristics in mineral oil.
However, current studies on the diffusion environment of characteristic gas molecules typically consider a single medium (oil/insulation paper). In practical applications, insulation paper is fully immersed in insulating oil, constituting a multi-medium environment. Therefore, according to actual production needs, this paper constructed an oil–paper insulation system and seven gas molecules based on molecular dynamics and explored the diffusion properties of characteristic gas molecules in the oil–paper composite insulation system in the actual situation. The nature of the diffusion phenomenon of characteristic gas molecules in the oil–paper insulation system was studied from a microscopic perspective. And a comparative analysis was conducted with the diffusion characteristics of gas molecules in insulating oil and cellulose. The results revealed the diffusion properties of gas molecules in actual oil–paper insulation systems at the molecular level. This work provided a theoretical reference for the layout of oil sample monitoring points in large power transformers and the accurate monitoring of transformer operating status based on dissolved gas methods in oil.
2. Molecular Dynamics Simulation
2.1. Model Establishment
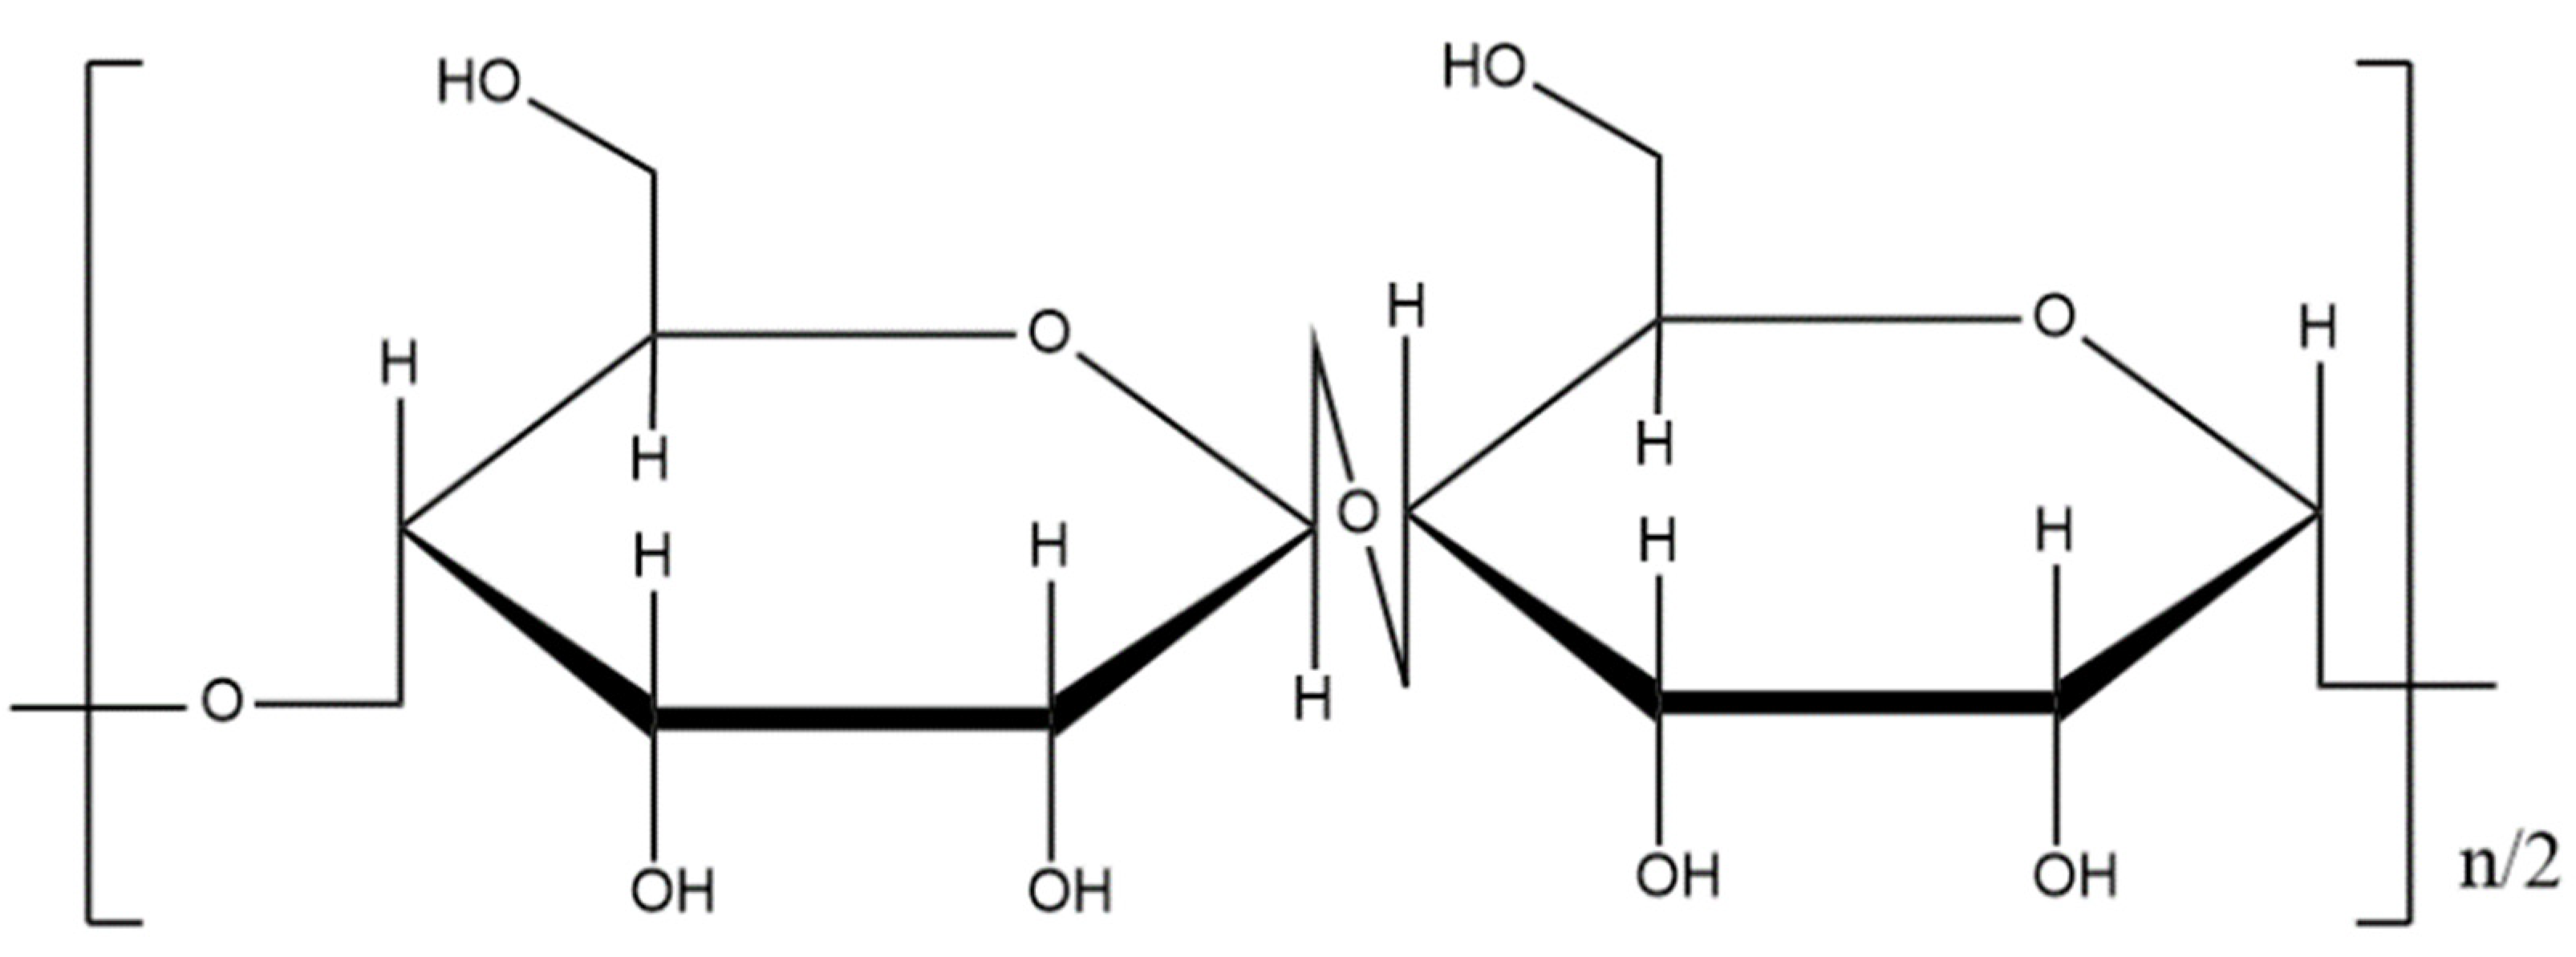
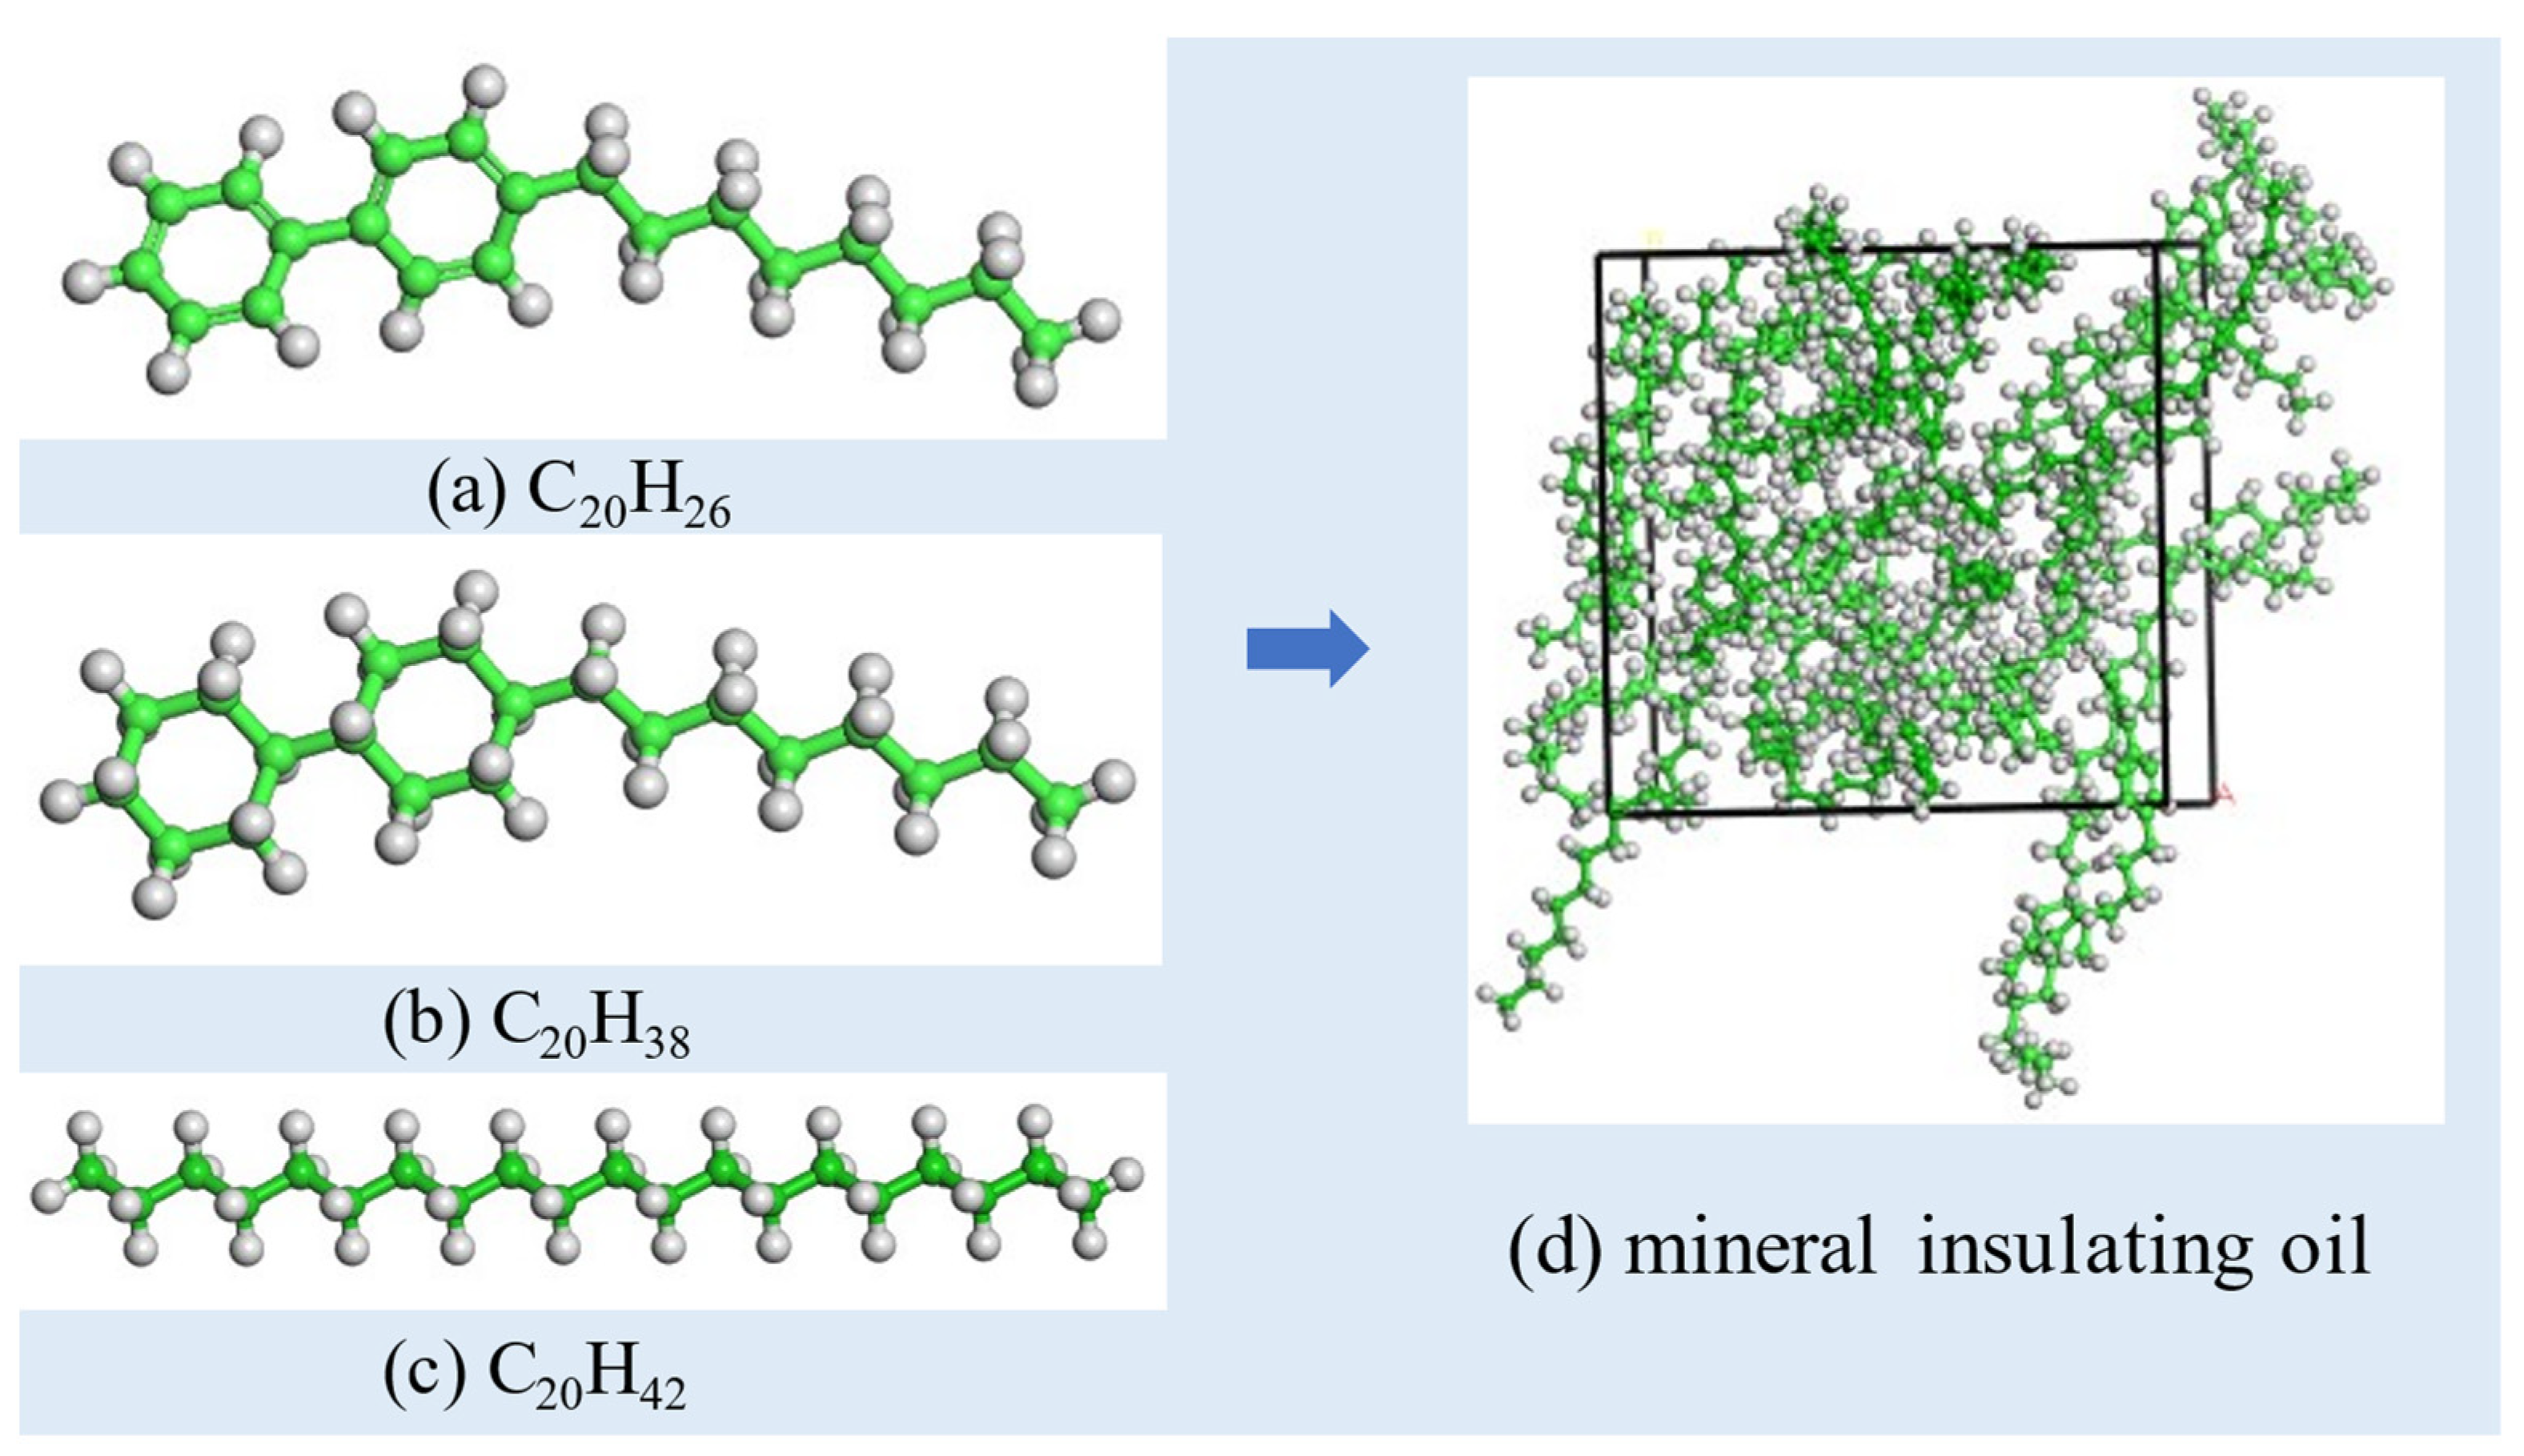
Currently, mineral oil serves as the predominant insulation oil in large power transformers. The main materials of transformer insulating oil in China are naphthenic oils and paraffinic-based oils. The difference is that paraffinic-based oils have a higher content of chain alkanes, while naphthenic oils have a higher content of cycloalkanes. The paraffin-based oil is selected as the simulation object in this paper. Refer to Table 1 for the detailed chemical composition. The average number of carbon atoms per molecule is approximately 19~23, with an average of 20 carbon atoms [17]. In this study, an average carbon atom count of 20 is selected as a typical or representative reference for investigating the insulation performance of transformer oil. This choice not only provides sufficient representativeness for relevant research but also simplifies the model, reducing computational complexity for easier simulation and theoretical studies. The basic composition of insulation paper is cellulose, an organic insulation material formed by glucose monomers connected by glycosidic bonds, with the repeating unit being cellobiose, as illustrated in Figure 1. Mazeau et al., through simulated experiments with cellulose chains of different lengths, found that amorphous models composed of cellulose chains of different lengths did not exhibit significant differences in molecular conformation or physicochemical properties [18]. Therefore, there is no need to use very long cellulose chains when constructing amorphous models.

Table 1.
Main chemical composition of transformer oil.

Figure 1.
The model of glucobiose.
Following the composition of the oil-immersed transformer oil–paper insulation system described above, models for alkanes (C20H42), cycloalkanes (C20H38), aromatic hydrocarbons (C20H26), characteristic gas molecules (H2, CO, CO2, CH4, C2H2, C2H4, C2H6), and cellulose (C6H10O5) monomers are constructed, as depicted in Figure 2. The gas molecule model, insulation oil model, insulation paper model, and oil–paper insulation system model are established based on the ratio of individual molecules (10 gas molecules, 18 alkane chain molecules, 9 cycloalkane molecules, 3 polycyclic aromatic hydrocarbon molecules). The initial density is set to 0.4 g/cm3. The specific simulation method is as follows:

Figure 2.
Equilibrium model of transformer oil.
- (1)
- The Forcite/Geometry Optimization module is used to perform geometric optimization on each unit. The cutoff radius was set to 12.5 Å.
- (2)
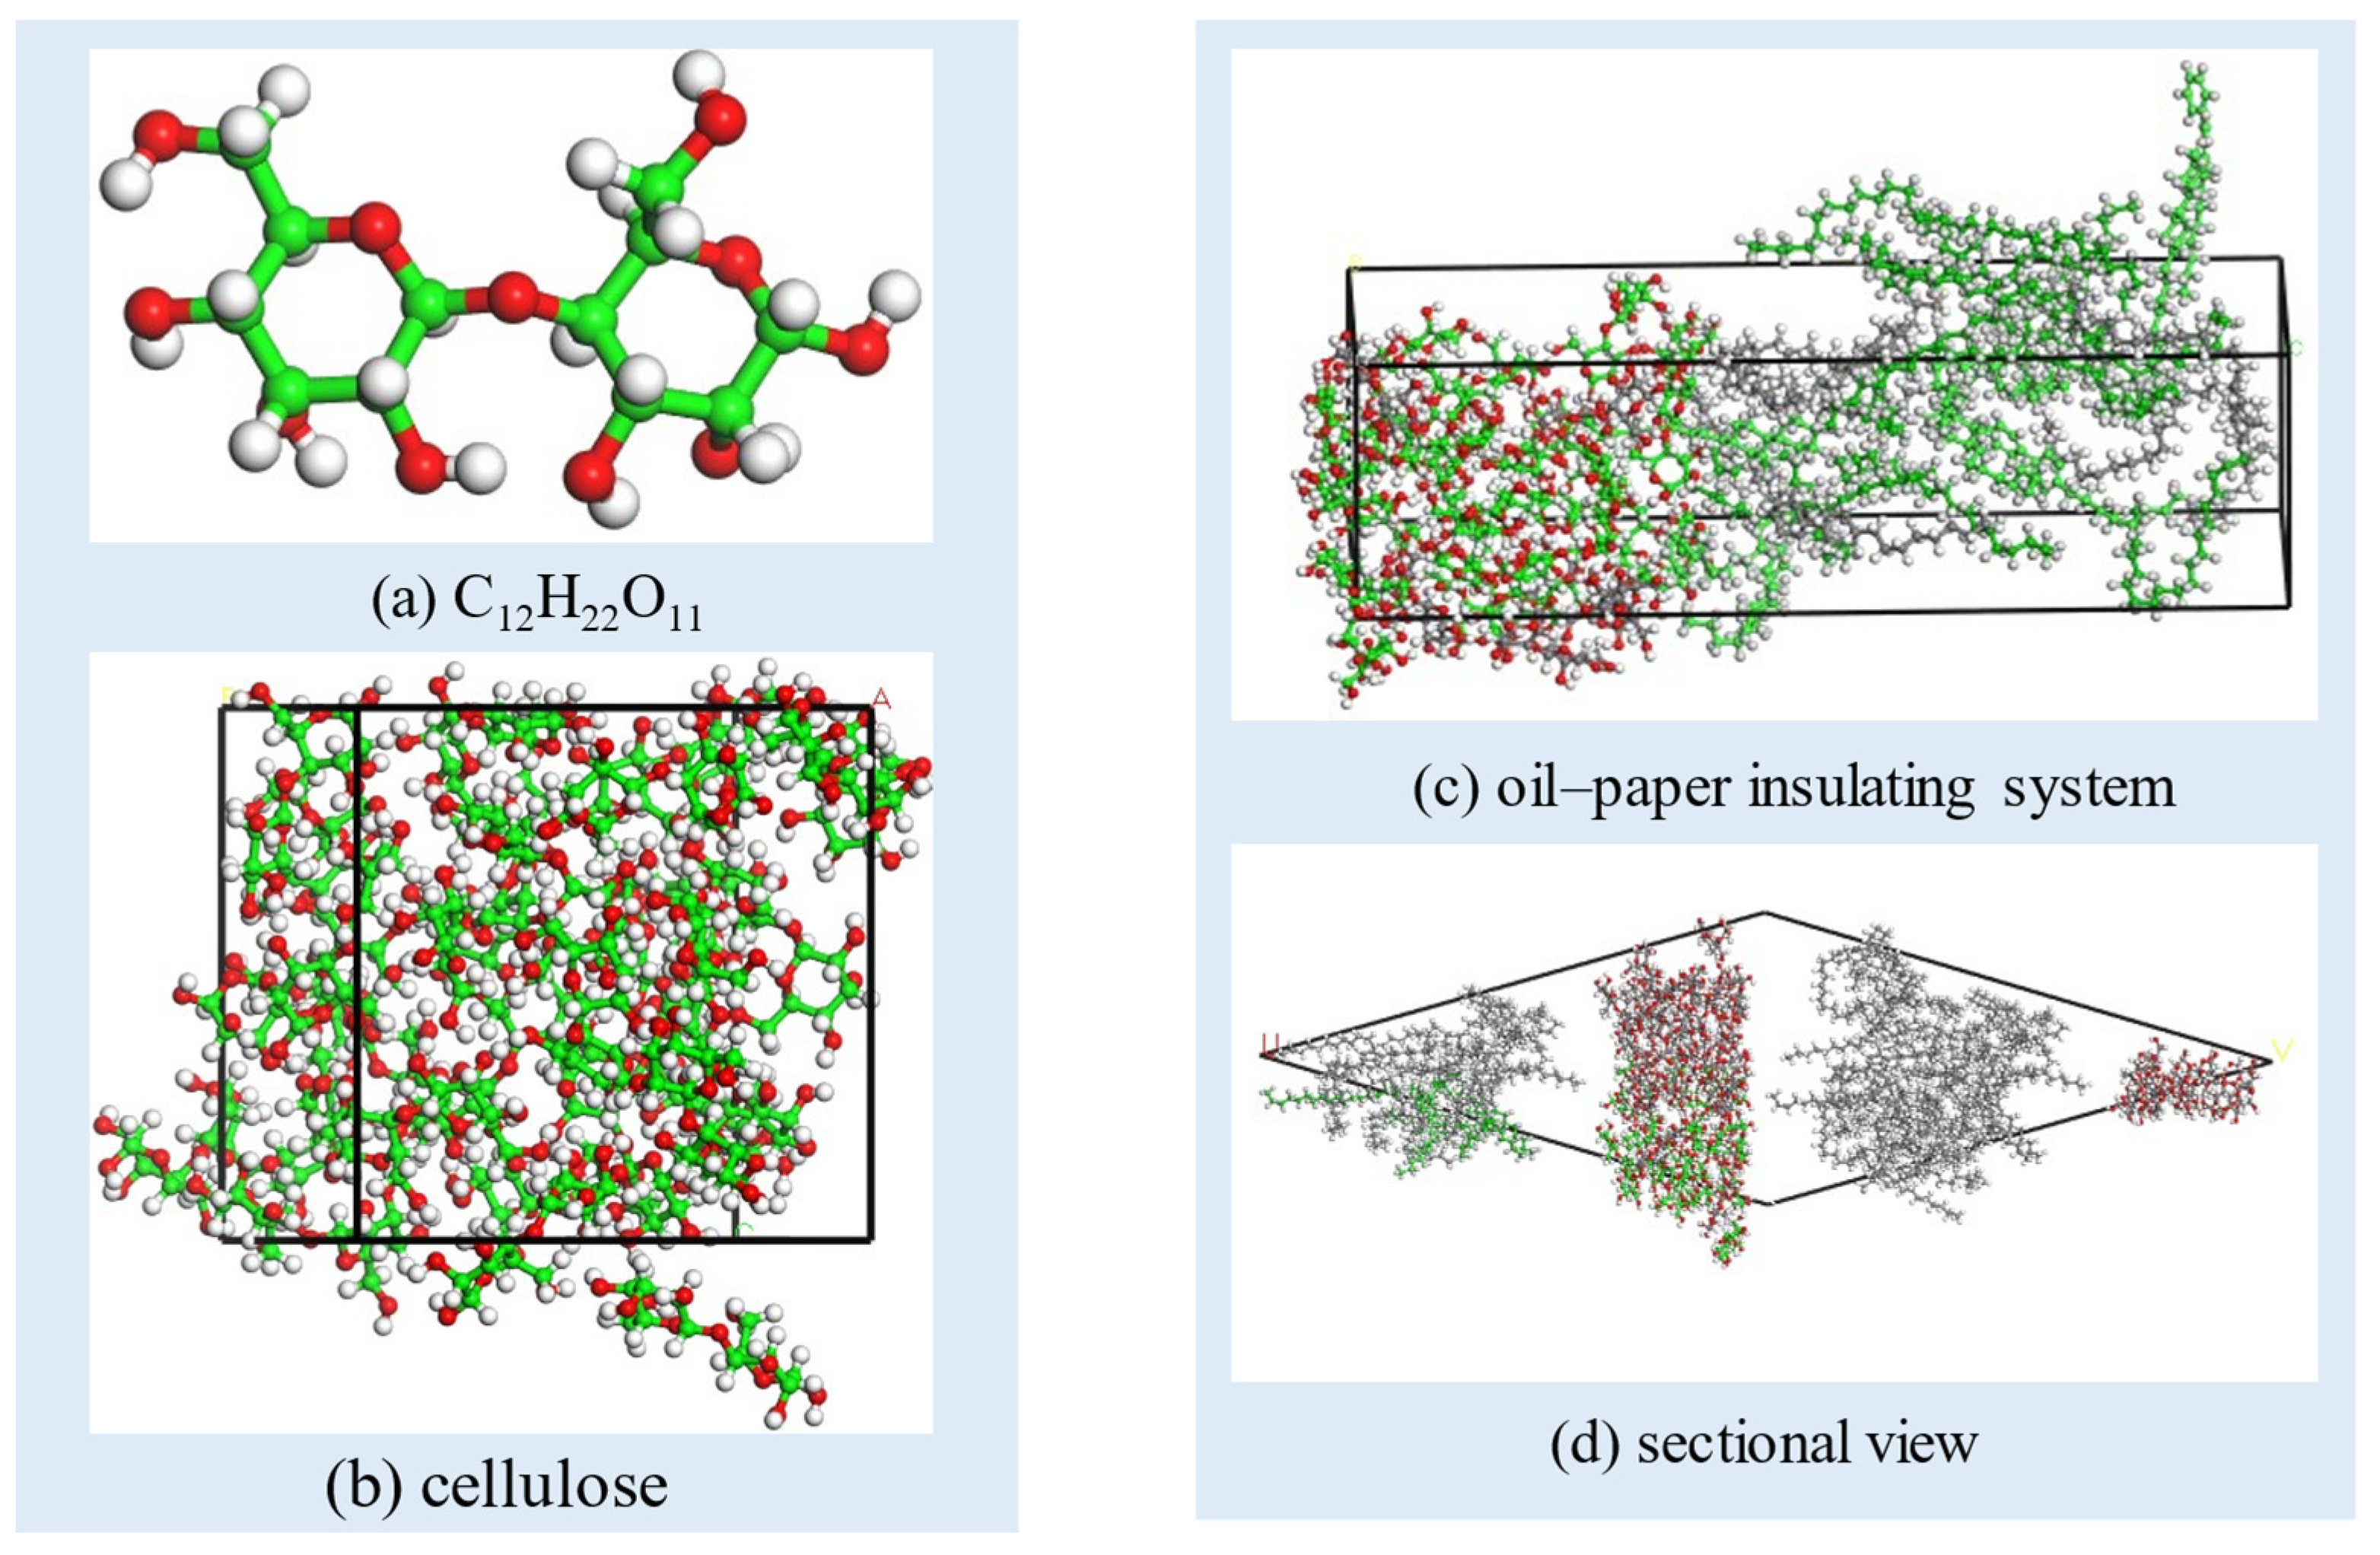
- The internal relaxation of the model. In the first place, the Forcite/Geometry Optimization module is used to minimize the energy of the entire system. Then, in order to stabilize the total energy of the model and adjust the density of the model, the Forcite/Dynamics is used under the isothermal and isobaric ensemble (NPT) at 298 K, the processing time is set as 100 ps and the pressure is set as 0.01 Gpa–0.0001 GPa. After the entire model system reaches stability, the optimized density of the insulation oil molecule model is approximately 0.83 g/cm3, the insulation paper model’s density is around 1.2 g/cm3, and the oil–paper insulation system model’s density is approximately 0.95 g/cm3, all close to the actual densities. This result proves that the whole simulation process is effective. The equilibrium state oil–paper insulation model before molecular dynamics processing is shown in Figure 2, Figure 3 and Figure 4.
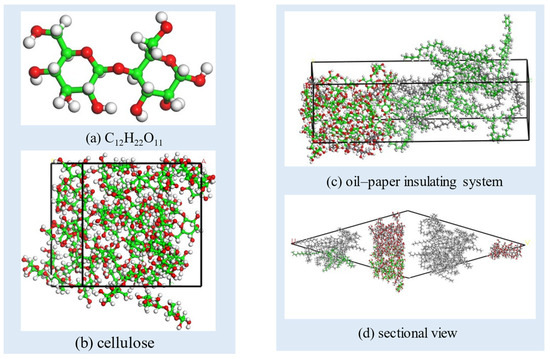 Figure 3. Equilibrium model of oil–paper insulation system.
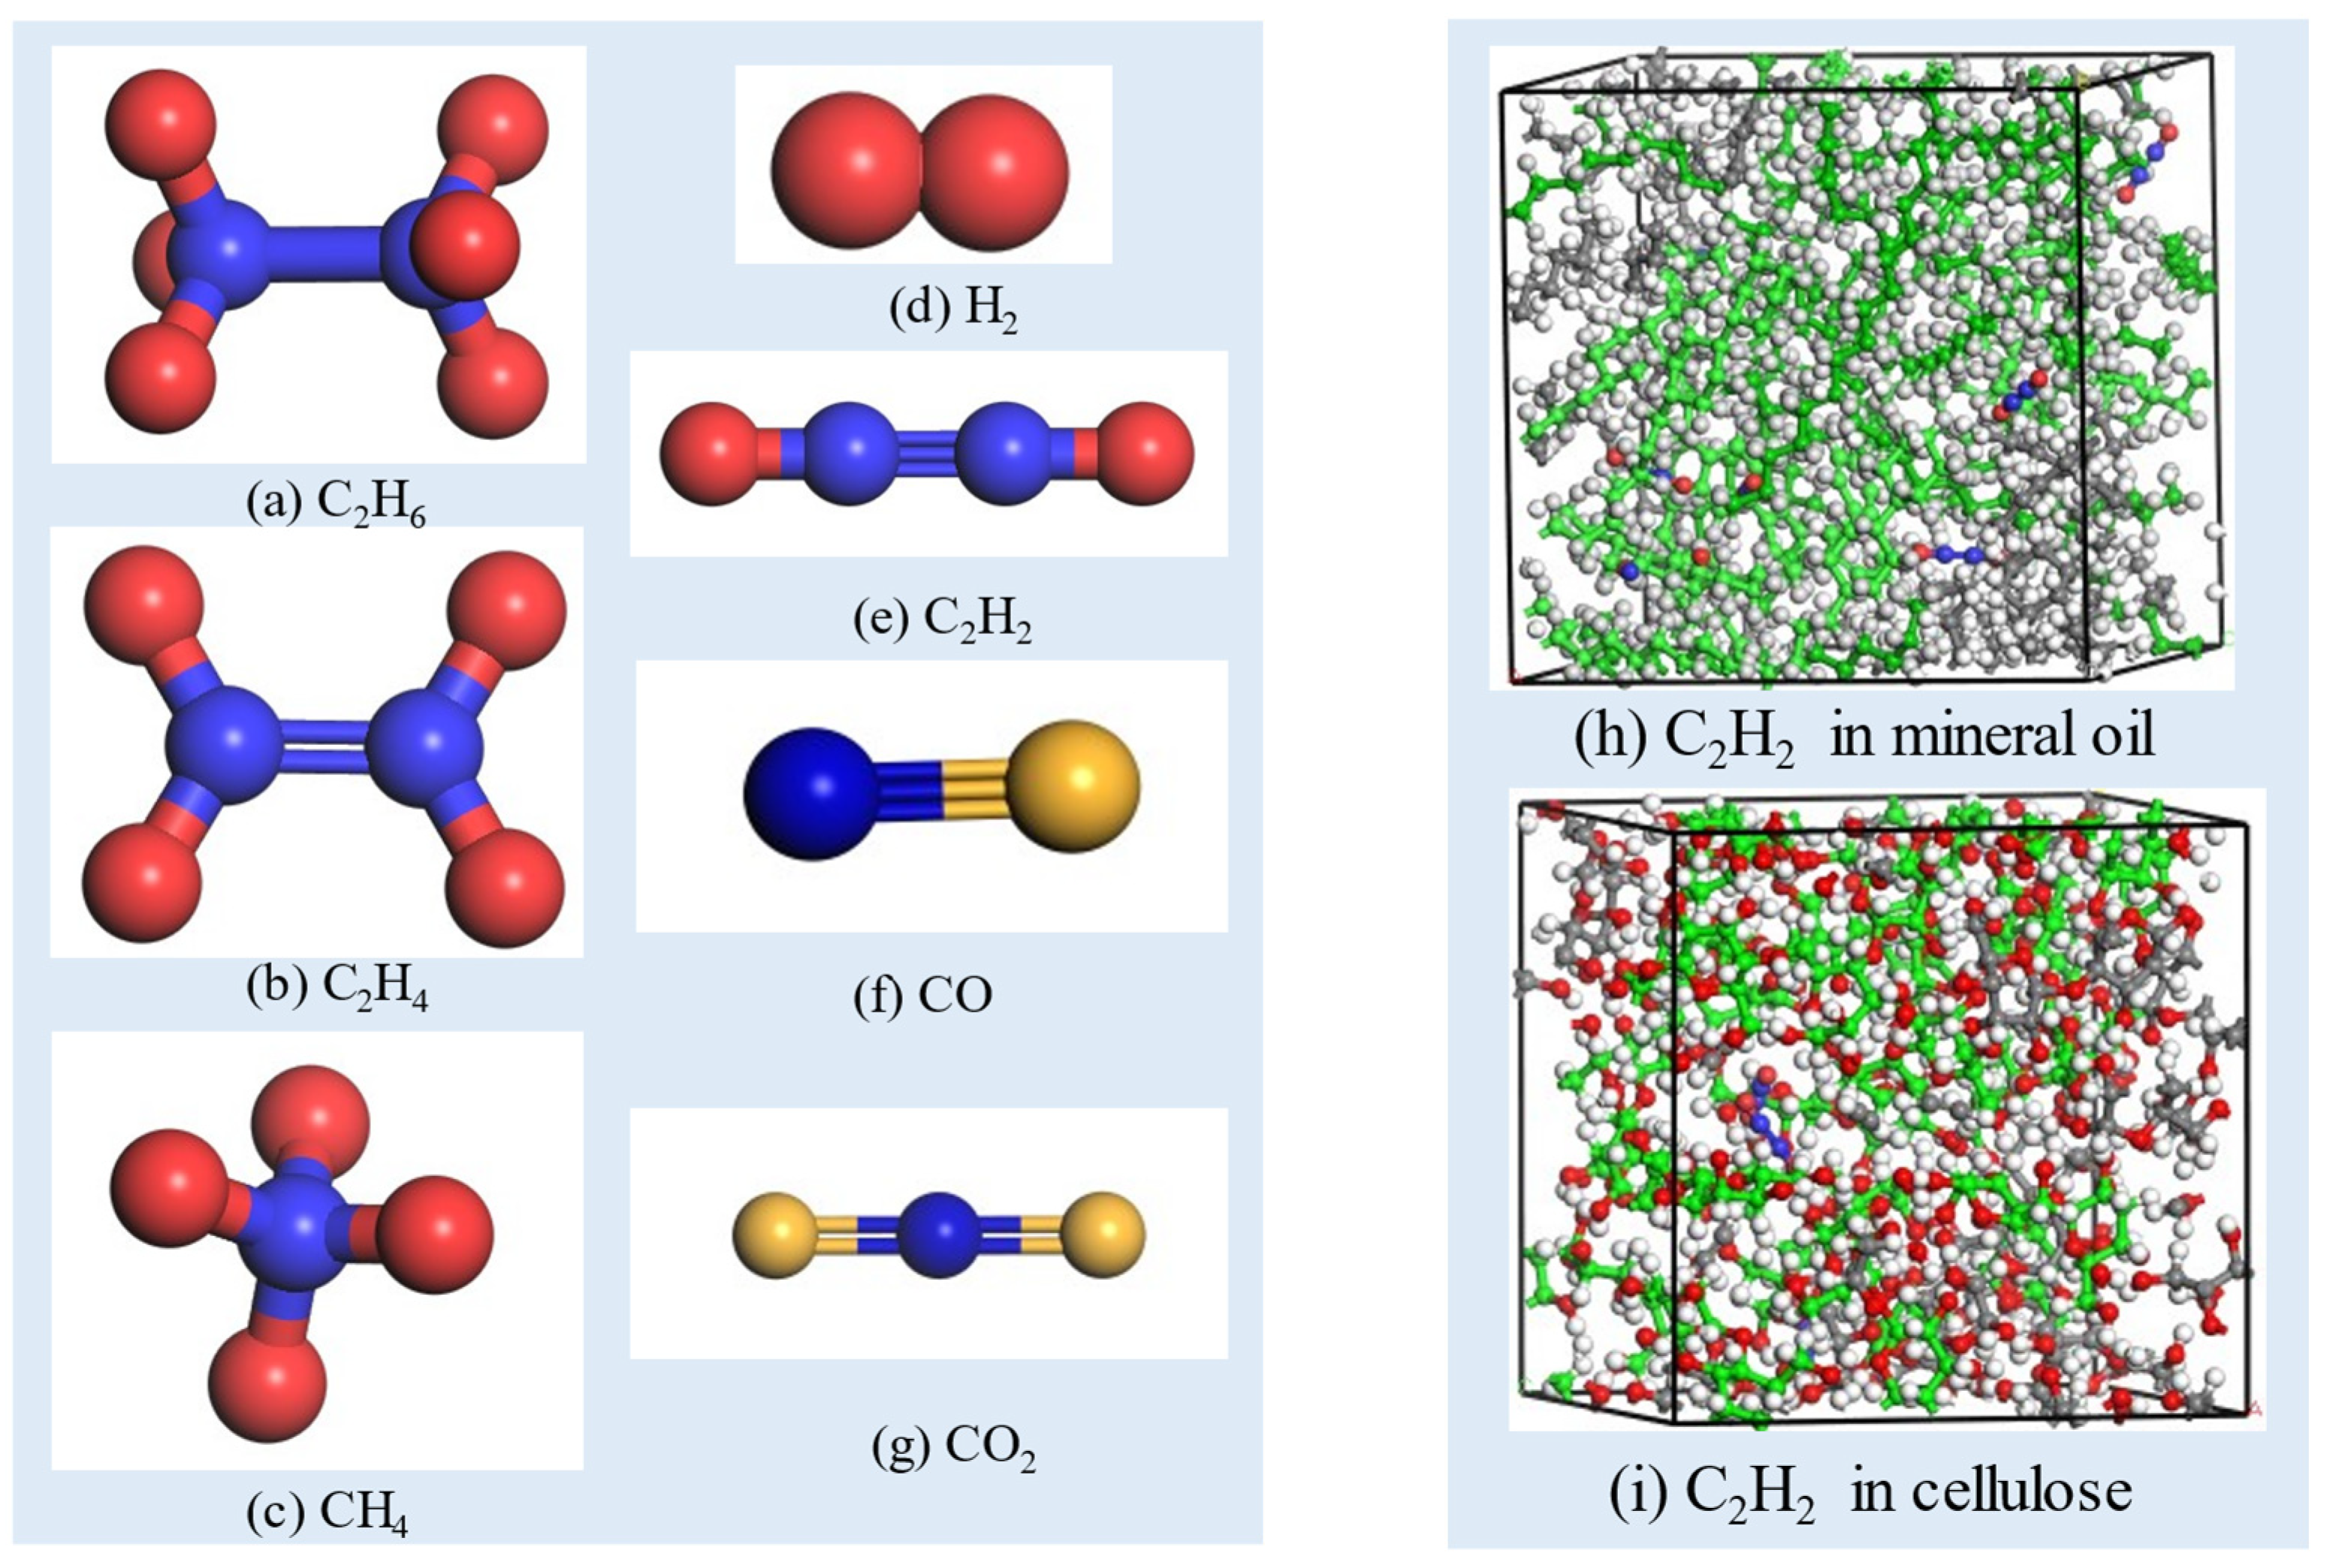
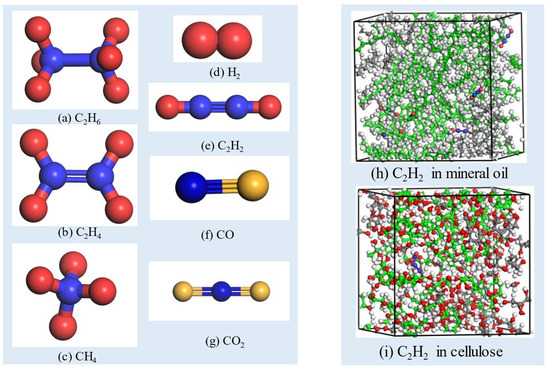 Figure 4. Molecular model of gases in oil.
 - (3)
- The Forcite/Dynamics module is used to perform molecular dynamics simulations of liquid systems. Electrostatic and Van der Waals, respectively, are set to Ewald- and Atom-based calculations. The temperature is set to the normal operating temperature of the transformer, which is 343 K. The canonical ensemble (NVT) is used in molecular dynamics and the simulation time is 100 ps, with data collected every 1 ps for the entire trajectory of molecular dynamics.
2.2. Simulation Results and Analysis
The diffusion of gas molecules in oil is a process of substance transfer, mainly diffusing from high-concentration areas to low-concentration areas. This is a spontaneous process until equilibrium is reached. Molecules continuously move from their initial positions, and at each moment, the positions of the molecules are different. Using to denote the position of molecule i at time t, the mean square displacement (MSD) can be represented by the average of the square of the molecular displacement, as shown in Equation (1):
According to Einstein’s diffusion law, the calculation method for the diffusion coefficient of gas molecules is given by Formula (2):
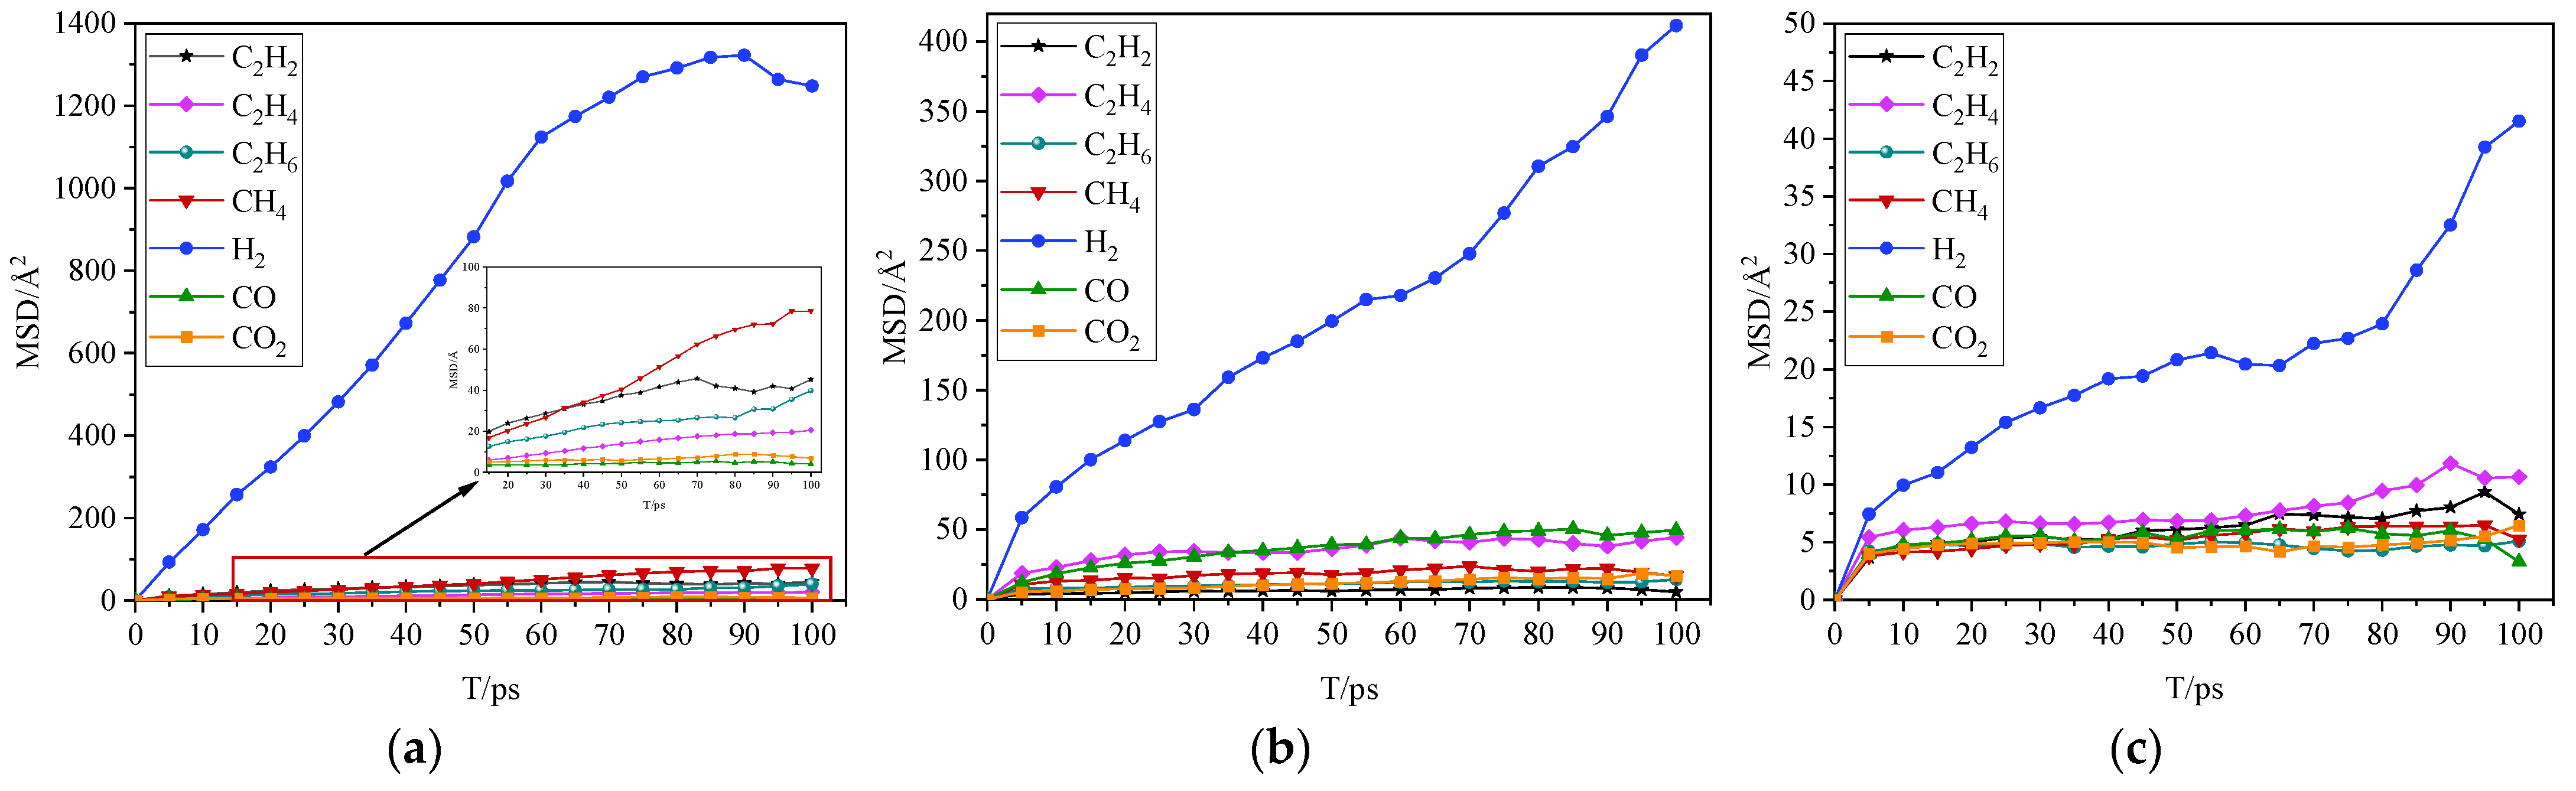
where “D” is the diffusion coefficient, and “N” is the atomic number; ri(t) and ri(0), respectively, represent the position vectors of the i atom at time t and time 0. Finally, after 100 ps molecular dynamics simulation of the system, the mean square displacement (MSD) of gas molecules in oil, paper, and oil–paper insulation can be obtained, and the diffusion coefficients of characteristic gas molecules in oil, paper, and oil–paper insulation can be obtained according to Formula (2). As shown in Figure 5, the MSDs of seven types of gas molecules in insulating oil, insulating paper, and oil–paper insulation systems are presented. The horizontal coordinate is the simulation time T/ps, and the ordinate is MSD/Å2 of the gas molecule.
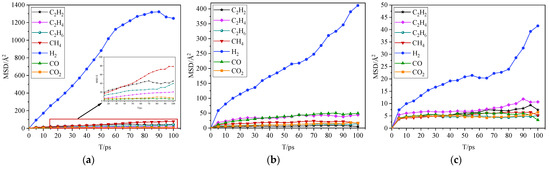
Figure 5.
MSDs of gas molecules results. (a) MSDs of gas molecules in oil; (b) MSDs of gas molecules in cellulose; (c) MSDs of gas molecules in oil–paper insulation system.
From the MSDs of characteristic gases diffusing in the three mediums in Figure 5, it can be observed that the trend of the movement and displacement of small gas molecules in three different insulating mediums over time varies. The shapes of the displacement curves show that all gas molecules exhibit continuous “jumping” motion characteristics in the three insulating mediums. The gas molecules are able to diffuse continuously between the cavities of the medium in a leapfrog fashion. The migration displacement of gas molecules in an oil–paper composite insulation is generally smaller than that in cellulose, and the motion migration displacement in insulating oil is the largest. This difference is most obvious in the motion displacement trajectory of H2. The transition displacement of gas molecules in oil–paper composite insulation is generally an order of magnitude smaller than that in oil. The transition displacements of the six gas molecules except H2 are not significantly different in the same insulating medium, and the MSD curves of the gas molecules intersect. However, the motion displacement of the same gas molecule in the three mediums is still the smallest among the oil–paper insulation systems, followed by cellulose, and the largest among insulating oil. The slope ‘a’ and the fitting correlation coefficient of the MSD curves for these gas molecules are obtained through fitting. Based on Equation (2), the diffusion coefficients ‘D’ of gas molecules in the three substances are calculated, as shown in Table 2, Table 3 and Table 4.
Table 2.
Diffusion coefficient of gas molecules in mineral oil.
Table 3.
Diffusion coefficient of gas molecules in cellulose.
Table 4.
Diffusion coefficient of gas molecules in oil–paper insulation system.
According to the data in the tables, the diffusion coefficients of H2 in the three insulating media are much larger than those of the other six gas molecules. The order of diffusion coefficients in insulating oil for the seven molecules from largest to smallest is H2 > CH4 > C2H2 > C2H6 > C2H4 > CO2 > CO. In cellulose, the arrangement from largest to smallest diffusion coefficients is H2 > CO > C2H4 > CH4 > CO2 > C2H6 > C2H2. In the oil–paper insulation system, the arrangement from largest to smallest diffusion coefficients is H2 > C2H2 > C2H4 > CH4 > CO > CO2 > C2H6. The diffusion coefficients do not show a specific regularity. Among the seven gas molecules, H2 has the strongest diffusion capacity, its diffusion capacity in insulating oil is greater than that of cellulose, and its diffusion capacity in cellulose is greater than that in the oil–paper composite insulation system. The diffusion ability of seven gas molecules in the cellulose medium and oil–paper insulation systems is obviously hindered, and the obstruction is greater in the oil–paper insulation system. The diffusion coefficients of the remaining gas molecules do not show specific regularity except H2. The flexibility of paraffin molecules is good according to the molecular structure. When sufficient molecular relaxation equilibrium is carried out, the free volume fraction of the molecules is small. And the cellulose chain is longer and less flexible, so the free volume fraction is larger, which makes it more difficult for small gas molecules to transition, resulting in a poor diffusion ability of gas molecules in cellulose.
The diffusion coefficient (D) is derived indirectly from the MSD, i.e., the diffusion coefficient is one-sixth of the slope k of the mean-square displacement curve. From the fitting values of D in Figure 6, the three sets of diffusion coefficients can be analyzed; the diffusion coefficients of gas molecules in cellulose are approximately one order of magnitude smaller than those in insulating oil, and the diffusion coefficients in the oil–paper insulation system are approximately one order of magnitude smaller than those in cellulose. This clearly shows that the hindrance effect on the diffusion of gas molecules in insulating oil is smaller than that in cellulose. From a molecular level analysis, it can be seen that the insulating oil simulated in this paper consists of alkane molecules, while cellulose is a polymer. The chain length of alkanes is shorter than that of polymers, making the chain less prone to bending. When the alkane molecular chains are stacked together, there will be a large number of gaps, and there will be a better connectivity between the gaps. This allows small gas molecules to move more freely within the structure. Consequently, the binding effect of the oil on the small gas molecules is reduced, resulting in a stronger diffusion ability. In contrast, polymer chains have strong flexibility and are prone to stacking and interlacing. Under the influence of intramolecular rotation and intermolecular interaction forces, the polymer chains are prone to bending and deformation. Simultaneously, the polymer chains create multiple small gaps within the structure. These small gaps significantly impede gas molecule diffusion due to their limited capacity to contain them. Furthermore, in the oil–paper insulation system where insulating paper is fully immersed in oil, there is an inhibitory effect on the diffusion of gas molecules. This is primarily because insulating oil fully permeates the paper, filling the pores and gaps between fibers, resulting in fewer transition vacancies for gas molecules in the medium and thereby hindering their diffusion.
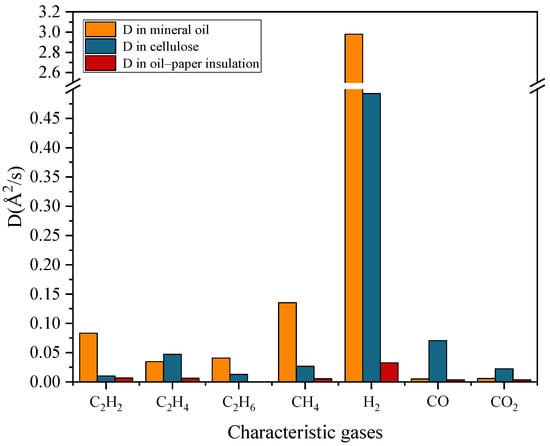
Figure 6.
The fitting values of D in different insulating media.
3. Discussions
In this paper, the diffusion characteristics of seven gas molecules in insulating oil, cellulose, and oil–paper composite insulation systems were discussed, through the use of molecular dynamics simulation combined with the practical application requirements of oil-immersed transformers. The main conclusions are shown as follows:
- (1)
- The gas molecules exhibit continuous “jumping” motion characteristics in three insulating mediums. The migration displacement of gas molecules in the oil–paper composite insulation is generally smaller than that in cellulose, and the motion migration displacement in insulating oil is the largest. This difference is most obvious in the motion displacement trajectory of H2. The transition displacement of the six gas molecules except H2 are not significantly different in the same insulating medium, and the MSD curves have crossovers. The different properties of insulating materials have an important impact on the transition motion of gas molecules.
- (2)
- The diffusion coefficient of characteristic gas molecules is highest in insulating oil, followed by cellulose. In oil–paper composite insulation systems, the diffusion coefficient is minimal. The diffusion coefficient of H2 is the largest among the three insulating mediums. The differences in diffusion coefficients of other gas molecules among various mediums are relatively small, and there is no absolute regularity in the ranking of diffusion coefficients among different mediums. Due to differences in molecular structure, different insulating materials will hinder the diffusion of gas molecules to varying degrees.
Author Contributions
Conceptualization, J.T. and X.D.; methodology, X.D., J.T. and M.L.; software, J.T.; validation, X.D. and J.T.; formal analysis, C.L.; investigation, X.D.; resources, H.Z. and S.H.; data curation, C.L. and S.H.; writing—original draft preparation, J.T. and X.D.; writing—review and editing, J.T., H.Z., C.L., S.H., X.D. and M.L.; visualization, J.T. and X.D.; supervision, X.D.; project administration, X.D. All authors have read and agreed to the published version of the manuscript.
Funding
This paper was funded by the Natural Science Foundation, Grant/Award Number: 92366205; State Grid Corporation of China’s Science and Technology, Grant/Award Number: 5108-202218208A-2-3350-XG.
Data Availability Statement
Data are contained within the paper.
Conflicts of Interest
Authors Hao Zhan, Chuanxian Luo, Shengnan Hu were employed by the company NARI Group Corporation (State Grid Electric Power Research Institute) and company State Grid Electric Power Research Institute Wuhan Nari Co., Ltd. The remaining authors declare that the research was conducted in the absence of any commercial or financial relationships that could be construed as a potential conflict of interest.
References
- Liu, G.; Hu, W.; Hao, S.; Gao, C.; Liu, Y.; Wu, W.; Li, L. A fast computational method for internal temperature field in Oil-Immersed power transformers. Appl. Therm. Eng. 2024, 236, 121558. [Google Scholar] [CrossRef]
- Feng, D.; Chen, G.; Yan, X.; Hao, J.; Liao, R. Molecular pyrolysis process and gas production characteristics of 3-element mixed insulation oil under thermal fault. High Volt. 2022, 7, 1130–1140. [Google Scholar] [CrossRef]
- Rangel Bessa, A.; Farias Fardin, J.; Marques Ciarelli, P.; Frizera Encarnação, L. Conventional Dissolved Gases Analysis in Power Transformers: Review. Energies 2023, 16, 7219. [Google Scholar] [CrossRef]
- Ali, M.S.; Bakar, A.H.A.; Omar, A.; Jaafar, A.S.A.; Mohamed, S.H. Conventional methods of dissolved gas analysis using oil-immersed power transformer for fault diagnosis: A review. Electr. Power Syst. Res. 2023, 216, 109064. [Google Scholar] [CrossRef]
- Zhou, X.; Shi, H.B.; Kuhnke, M.; Werle, P.; Gockenbach, E.; Borsi, H. Evolution and discharge pattern of creeping discharge at aged oil/pressboard interface. In Proceedings of the IEEE Conference on Electrical Insulation and Dielectric Phenomena (CEIDP), Toronto, ON, Canada, 16–19 October 2016; pp. 1053–1056. [Google Scholar]
- Kulyk, S.O.; Shutenko, V.O. Analysis of Gas Content in Oil-Filled Equipment with Spark Discharges and Discharges with High Energy Density. Trans. Electr. Electron. Mater. 2019, 20, 437–447. [Google Scholar] [CrossRef]
- Wei, Y.; Xu, Z.; Cheng, H.; Yang, L.; Meng, X. Study on Relationship between Cumulative Discharge Energy and Discharge Marks on Pressboard under High Field Strength. In Proceedings of the IEEE 1st China International Youth Conference on Electrical Engineering (CIYCEE), Wuhan, China, 1–4 November 2020; pp. 1–5. [Google Scholar]
- Xu, Z.; Yang, L.; Wei, Y. Partial Discharge Characteristics of Fast Developing Discharge in Oil-pressboard Insulation. Proc. CSEE 2021, 41, 7529–7540. [Google Scholar]
- Shahsiah, A. Modeling Dynamic Propagation of Characteristic Gases in Transformer Oil/Paper Insulation and Transformer Fault Diagnostics. Ph.D. Thesis, Rensselaer Polytechnic Institute, Troy, NY, USA, 2006; pp. 81–93. [Google Scholar]
- Shahsiah, A.; Degeneff, R.C.; Nelson, J.K. A study of the temperature based dynamic nature of characteristic gases in oil-cellulose insulation systems. IEEE Trans. Dielectr. Electr. Insul. 2007, 14, 471–479. [Google Scholar] [CrossRef]
- Bychkov, A.L.; Korobeynikov, S.M.; Ryzhkina, A.Y. Determination of the hydrogen diffusion coefficient in transformer oil. Tech. Phys. 2011, 56, 421–422. [Google Scholar] [CrossRef]
- Yang, L.; Qi, C.; Wu, G.; Liao, R.; Wang, Q.; Gong, C.; Gao, J. Molecular dynamics simulation of diffusion behaviour of gas molecules within oil–paper insulation system. Mol. Simul. 2013, 39, 988–999. [Google Scholar] [CrossRef]
- Zhao, Z.; Wang, G.; Li, Z.; Lin, H. Diffusion Motion Analysis of gas Molecules in Oil—Paper Insulation System Based on Molecular Dynamics Simulation. In Proceedings of the 2022 IEEE 5th International Electrical and Energy Conference (CIEEC), Nangjing, China, 27–29 May 2022; pp. 4205–4210. [Google Scholar]
- Huang, Z.; He, J.; Xiang, C.; Li, J.; Wang, F.; Zhou, J.; Jiang, T. Gas diffusion behavior in green camellia insulating oils. AIP Adv. 2018, 8, 115127. [Google Scholar] [CrossRef]
- He, J.; Li, J.; Zhou, J.; Wu, G.; Wang, Q.; Li, Y.; Li, Y.; Wang, Q.; Han, L.; Wu, X. Dissolved Gas Diffusion Coefficients and Properties in Camellia Insulating Oil. In Proceedings of the 2018 IEEE International Conference on High Voltage Engineering and Application (ICHVE), IEEE, Athens, Greece, 10–13 September 2018; pp. 1–4. [Google Scholar]
- Ye, W.; Hao, J.; Chen, Y.; Zhu, M.; Pan, Z.; Hou, F. Difference analysis of gas molecules diffusion behavior in natural ester and mineral oil based on molecular dynamic simulation. Molecules 2019, 24, 4463. [Google Scholar] [CrossRef] [PubMed]
- Kaplan, I.R.; Rasco, J.; Lu, S.T. Chemical characterization of transformer mineral-insulating oils. Environ. Forensics 2010, 11, 117–145. [Google Scholar] [CrossRef]
- Mazeau, K.; Heux, L. Molecular dynamics simulations of bulk native crystalline and amorphous structures of cellulose. J. Phys. Chem. B 2003, 107, 23942403. [Google Scholar] [CrossRef]

Disclaimer/Publisher’s Note: The statements, opinions and data contained in all publications are solely those of the individual author(s) and contributor(s) and not of MDPI and/or the editor(s). MDPI and/or the editor(s) disclaim responsibility for any injury to people or property resulting from any ideas, methods, instructions or products referred to in the content. |
© 2024 by the authors. Licensee MDPI, Basel, Switzerland. This article is an open access article distributed under the terms and conditions of the Creative Commons Attribution (CC BY) license (https://creativecommons.org/licenses/by/4.0/).