Abstract
Ecuador, like every country in the world, urgently requires a conversion of transportation to electric power, both for economic and environmental reasons. This paper focuses on the technical and economic feasibility of a solar-powered electric charging station equipped with battery storage in Cuenca, Ecuador. By reviewing current literature, we assess the environmental impact of electric mobility and its potential to reduce fossil fuel dependence and generate energy savings. The analysis encompasses various factors, including EV energy consumption, solar energy system sizing, energy production, and battery storage capacity. Key findings indicate that integrating solar PV systems with EV charging stations efficiently supports a reliable and sustainable energy supply. Simulation results reveal seasonal variations in solar generation, highlighting the importance of proper system sizing to maintain charging supply reliability and manage surplus generation. The economic analysis of three scenarios underscores the financial viability of implementing PV systems without battery storage, yielding a positive Internal Rate of Return (IRR) and Net Present Value (NPV). However, scenarios with battery storage present negative NPV and long investment return periods, impacting economic viability negatively. These insights underscore the need for a balanced design to ensure sustainability and economic feasibility in the transition to electric mobility.
1. Introduction
The economic and environmental need to reduce dependence on oil has led to an increased implementation of renewable technologies [1]. The shift in the energy matrix is a social necessity to reduce fuel consumption [2]. EVs have become an exponentially growing alternative in economies that have decisively promoted their development [3]. To achieve this, the planning of charging stations is necessary. Introducing them poses a challenge in a market where, due to economic reasons, the momentum of combustion vehicle transport is maintained with subsidies. The initial absence of electric charging stations represents a significant barrier to the change in technology.
Worldwide, there is an increase in the number of electric charging stations. China stands out as the country with the highest number of charging points, with 1.15 million, including 677,000 slow-charging and 470,000 fast-charging points. The United States follows with 113,527 charging points [4], while other countries in Europe, Asia, and Latin America also contribute significantly to the expansion of charging stations. In Ecuador, 65 available charging points were identified up to the first semester of 2022 [5]. As an Ecuadorian city in this analysis, Cuenca is also beginning to incorporate charging locations. In the future, the growth of EVs will bring challenges to the distribution network and electricity production; to ensure a sustainable alternative, generation from clean and renewable sources must be sought [6,7].
Ferrer [8] studied public transportation in Ecuador and the environmental benefits of transitioning from diesel buses to electric ones. The results reveal a reduction in emissions into the environment due to the technological shift towards electromobility. According to the findings presented in [9], the carbon footprint of an internal combustion engine vehicle in Ecuador is 236.16 , compared to the 63.14 emitted by an electric vehicle. Similarly, Messagie [10] determined that the carbon footprint of an internal combustion engine vehicle in Europe is 215, whereas an EV emits 95 Furthermore, in [11], it was revealed that, due to the high participation of renewable and nuclear generation in the central and southern regions of China, EVs achieve an efficiency of 16 with emissions close to 140 .
1.1. Importance and Justification
In Ecuador, during the first quarter of 2023, according to data from VARUS Ecuador [12], sales of electric vehicles (EVs) showed an increase compared to the same period of the previous year, reaching a total of 1899 EVs circulating in the country. Charging stations constitute a fundamental factor in driving this growth [13]. Charging for EVs can take various forms, depending on several factors: the power level of the charging station, the electric current, the type of connector, and the size of the battery [14].
Among these aspects, it can range from charging stations for EVs, typically in the form of fast charging, to individual charging at slow-charging stations, usually deployed in parking lots or at homes. This setup can be highly advantageous from various perspectives, and can even be powered by self-generated clean energy, effectively turning the vehicle into another household appliance [15].
The Organic Law of the Public Electricity Service [16] introduces changes in the legislation regarding the public electricity service by creating a charging service for electric vehicles (EVs). It delegates the authority to establish the maximum charging cost to the ARCERNNR, considering that these activities will be carried out by natural or legal persons authorized through the signing of a contract [17]. Through resolution ARCONEL 038/15, it approved the electric tariff scheme for EV charging in households. This scheme establishes a preferential energy price of 0.05 USD/kWh for charging carried out during the period from 22 h 00 to 08 h 00, eliminating additional charges such as garbage collection, donations to firefighters, and other charges related to electricity consumption [17].
According to the tariff structure for providers of energy charging services for electric vehicles (EVs) [18], four charging modalities are identified by the regulation established by the International Electrotechnical Commission (IEC) in standard IEC 61851-1 [19]. Currently, in Ecuador, there are no specific regulations for the infrastructure and charging elements intended for EVs. In this context, international regulations are relied upon, which have been adjusted to meet the established objectives to ensure the safety and operation of the charging system.
On the other hand, for self-supply distributed generation systems (SGDA), the regulations are governed by regulation No. ARCERNNR 008/23 [20]. This regulation establishes provisions for the authorization, installation, connection, operation, and maintenance of SGDA for self-supply. Likewise, provisions are defined for the measurement and billing of electric energy for regulated consumers with SGDA for self-consumption. The promotion of clean technologies and alternative energies is emphasized, as well as the preference for electricity generated from renewable sources.
1.2. Study of Charging Stations with Photovoltaic System
Relevant studies on the implementation of charging stations with solar energy have been reviewed, emphasizing the commitment of various research efforts in the field of electric mobility and sustainability. In [21], the focus is on integrating photovoltaic (PV) systems and electric vehicles (EVs) as a solution to address challenges in electric mobility. The most prominent aspect of this analysis is the evaluation of self-consumption, aiming to optimize the interaction between the proposed systems. Aspects related to the production of the PV system, EV charging, and the energy absorbed and injected into the electrical grids highlight the technical sustainability of the project.
Y. Ledmaoui et al. [22] propose a comprehensive solution for electric vehicle charging using solar energy. The design of a 7.4 kW AC-type station is complemented by an analysis of the available solar resources in Paris, France. Additionally, the development of a datalogger using IoT technology for efficient real-time monitoring of solar energy production, with data stored in the cloud and accessed through a web interface, highlights the importance of continuous monitoring and optimization of energy efficiency in electric vehicle charging systems.
P. Saranya et al. [23] present a solution for electric vehicle charging stations that operate independently of the conventional electrical grid. The proposal specifically addresses energy storage and the challenges of power factors in renewable sources. These aspects are essential for identifying deficiencies in the integration of energy storage systems and for exploring how to improve the stability and efficiency of EV charging stations that rely solely on renewable energy sources. On the other hand, S. Qadir et al. [24] provide a perspective on electric vehicle charging stations. They propose a hybrid charging station that utilizes solar energy, then the electrical grid, and reserve batteries in case of emergencies. The article introduces a prototype and a control unit that selects the most economical energy source based on its unit cost in kWh. These aspects are essential for identifying deficiencies in the implementation of hybrid charging stations and for exploring how to optimize the use of multiple energy sources to improve the efficiency and economy of EV stations.
Y. Zhang [25] analyzes the possibility of a distributed energy management system in a 1.5 MW solar-powered charging station with 2.5 MWh of battery storage. The study was based on the different behavioural responses of electric vehicle (EV) drivers using supervised learning. The charging station and the EVs are modelled as independent actors with diverse preferences depending on whether they provide or consume energy. These aspects are essential for identifying deficiencies in the implementation of distributed energy management systems and for exploring how to optimize the interaction between charging stations and EV users to improve efficiency.
Turan and Gokalp [26] analyze the optimal sizing and integration studies for electric vehicle (EV) charging and solar power plants located in the distribution network. The study includes 12 solar plants with a total installed capacity of 6.228 kW. The proposed network is equipped with a protection system to ensure the stability and reliability of the grid, improving voltage profiles with the integration of EVs. These aspects are essential for identifying deficiencies in the integration of EV charging stations into existing distribution networks and exploring how protection systems and optimal sizing can improve the stability and performance of the electrical grid.
B. Guany et al. [27] also focus on analyzing the energy consumption characteristics of an elevated metro station and evaluating the photovoltaic (PV) potential on its roof. This study examines the energy consumption profile of a metro station and proposes a multi-objective model to investigate the energy flexibility of the station with the integration of battery energy storage to maximize the use of renewable electricity.
A. Allouhi and S. Rehman [28] address the implementation of hybrid renewable energy systems (solar/wind/battery) connected to the grid for supermarkets in Morocco that have EV charging platforms in their parking areas. The study focuses on the optimization and sensitivity analysis of these systems. This helps to identify gaps in the integration of multiple renewable energy sources and to explore how optimization and sensitivity analysis can improve the efficiency and economic viability of EV charging stations using hybrid renewable energy systems.
Although many studies have developed dynamic electric vehicle charging prediction and scheduling models, few of them have linked photovoltaic generation with spatiotemporal electric vehicle charging demands at the urban scale. Thus, [29] develops a research framework with three interconnected modules to investigate the feasibility of EV charging. The framework is constructed from time-series EV charging demand statistics at each station, the planning of PV installations associated with all charging stations, and the development of a dynamic dispatch algorithm to transmit surplus electricity from one station to another. The experiment uses a complete electric vehicle charging dataset containing 5574 charging stacks with more than 9.7 million records in June and July in Guangzhou, China. The results show that rooftop PV installations can supply more than 90% of the charging demand. These aspects are essential for identifying deficiencies in the dynamic management of charging demand and the efficient integration of large-scale PV installations in the urban context, which is crucial for the optimization of EV charging infrastructure.
Various scientific studies have analyzed the contribution of solar energy to EV charging. Table 1 presents a summary of the main characteristics of relevant cases.

Table 1.
Summary of studies on charging stations with PV system.
The integration of photovoltaic (PV) systems into electrical grids has been significantly driven by the increasing demand for renewable and sustainable energy sources. In this context, maximum power point tracking (MPPT) plays a crucial role in maximizing the efficiency and performance of PV systems. Over the past decades, various MPPT algorithms and techniques have been developed to enhance solar energy capture and optimize the operation of the power converters used in these systems.
Rekioua D [30] uses controllers to efficiently operate maximum power point tracking (MPPT) algorithms, optimizing the overall system performance and minimizing stress on energy storage components. Specifically, in the photovoltaic generator, the provided method integrates Perturb & Observe (P&O) and Fuzzy Logic Control (FLC) methods. The article presents a new energy management algorithm designed for efficient control. Additionally, it focuses on managing storage systems to maintain their state of charge (SOC) within a defined range.
Mai C. [31] proposes a new maximum power point tracking (MPPT) technique for photovoltaic systems based on the Dung Beetle Optimization (DBO) algorithm to maximize the output power of photovoltaic systems. The experimental validation is carried out on the HIL + RCP physical platform, which fully demonstrates the advantages of the DBO technique in terms of tracking speed and accuracy.
K. Kumar [32] presents a comprehensive comparative analysis of the performance of the hybrid system with traditional control algorithms, such as Perturb & Observe controllers and Radial Basis Function Network. The success of the converter prototype validates the feasibility of the proposed approach.
Mariem Mallat [33] applies a genetic algorithm (GA)-based MPPT algorithm to adjust the duty cycle of the boost converter to achieve the MPP operation of PV modules. Additionally, she develops a numerical model of the entire photovoltaic conversion platform using Matlab/Simulink software. The results obtained confirm the feasibility of the proposed technique and its effectiveness in controlling a system.
1.3. Current Challenges in Charging Stations
The expansion of charging infrastructure for electric vehicles (EVs) plays a fundamental role in the transition to electric mobility; however, this progress faces significant challenges. The increase in demand for EV charging poses a series of technical obstacles such as capacity and charging speed. The interoperability of systems emerges as an essential element to ensure the efficiency of this infrastructure. C. Rodríguez et al. [34] address the issue of interoperability with the electrical grid; currently, there is no concrete answer regarding when and how to integrate Vehicle-to-Grid (V2G) technology. V2G technology allows vehicles to communicate with the electrical grid and even return electricity to the grid in case of a blackout, but its implementation depends on several key parameters, such as available capacity in the distribution system and the deployment of distributed energy resources, among others.
The deployment of EV fast-charging stations is a crucial component for the mass adoption of electric mobility. This process involves various strategies and planning considerations to ensure that the charging infrastructure is efficient, accessible, and sustainable. In [35], their dual role as charging and storage units is highlighted; in addition, the review highlights the significant opportunity for the integration of renewable energy sources. The potential of renewable resources, such as wind and solar energy, to power these charging stations is investigated while exploring energy storage systems to minimize environmental impact and boost sustainability.
The proliferation of electric vehicles (EVs) leads to an increase in demand for the electrical system [36]. While EVs contribute to this demand, the energy they store could prove to be highly valuable. By the end of 2020, there were 10 million EVs worldwide, translating to an installed energy capacity of 296 GWh in lithium-ion batteries [37]. When considering the nominal energy available in EV batteries along with the energy stored in electric bus fleets, the total reaches 394 GWh. E. Bravo [38] analyzes the daily energy consumption during the testing phase of the tram system in Cuenca. It demonstrates a regular consumption pattern reaching 5.86 MWh, which represents only 0.0015% of the nominal energy in EV and electric bus batteries.
Cervantes and Prado [39] discuss the development of software to manage and control energy supply, highlighting that the billing process at charging stations is the main challenge. Locally, no provider has developed a comprehensive tool to efficiently execute these processes. Other charging stations have a charging system using cards that allow customers to charge their vehicle batteries at the same place where they pay for the service, with payment options including cash. This often leads to conventional queues for charging turns.
The implementation of charging stations through the integration of renewable energy technologies and energy storage will ensure a continuous and sustainable supply even during power outages. A future challenge is to develop strategies to manage demand efficiently, especially during periods of high demand, aiming to prevent congestion at charging stations.
Predicting energy demand can help optimize operations, avoid grid overloads and power outages, and help companies estimate the number of charging stations needed to meet the demand for charging stations. In [39], three time-series models, ARMA, ARIMA, and SARIMA, are used to forecast future values from historical data; the experiment results show that the SARIMA model is the best at predicting energy usage in all three datasets.
The performance of electric vehicles (EVs) can be adversely affected if charging stations are not properly sited and connected to the grid. In [40], a reliability, availability, and operability (RAO-3) methodology is introduced, employing a fuzzy ranking technique to identify the most efficient dimensions and locations for EV charging stations, distributed generators, and supercapacitors in radial bus distribution systems with grid reconfiguration. The fuzzy multi-objective function is used to simultaneously optimize the positioning of charging stations, distributed generators, and storage capacities, with or without grid reconfiguration. According to simulation results, the concurrent placement technique improves performance by reducing power loss and improving voltage profile.
1.4. Contribution of the Present Work
The present work makes several significant contributions to the field of electric vehicle (EV) infrastructure and renewable energy integration:
Technical and Economic Feasibility Analysis: This study provides a comprehensive technical and economic assessment of implementing a solar-powered electric charging station with battery storage in Cuenca, Ecuador. By evaluating various scenarios, the research highlights the potential for sustainable and economically viable EV infrastructure.
Environmental Impact Evaluation: This work emphasizes the environmental benefits of transitioning to electric mobility, particularly the potential for reducing fossil fuel dependence and lowering greenhouse gas emissions using renewable energy sources. It stresses that for EVs to significantly contribute to greenhouse gas reduction, the energy used for recharging must come from renewable sources.
System Design Insights: This research offers valuable insights into the optimal design of solar PV systems for EV charging stations. It underscores the importance of appropriately sizing the solar energy system and battery storage to ensure a reliable and sustainable energy supply, considering seasonal variations in solar generation and the direct impact of EV integration on energy demand.
Holistic Approach: This study integrates technical, economic, environmental, and social perspectives, presenting a holistic approach to achieving sustainable electric mobility in Ecuador. This comprehensive view aids in understanding the multifaceted challenges and benefits of transitioning to renewable energy-powered EV infrastructure.
2. Materials and Methods
This article analyzes the parking lot of the Universidad Politécnica Salesiana as a potential charging location. This site provides conditions of use, such as frequency, duration, and availability, among others, to understand the demand for electric energy when introducing electric vehicles (EVs) in different scenarios. To estimate the energy demand of vehicles, data stored by the university’s access control system over two working weeks were utilized. The previous data are analyzed during the hours established by the tariff schedule, which are 08 h 00–18 h 00, 18 h 00–22 h 00, and 22 h 00–08 h 00 [18]. During the 22 h 00–08 h 00 timeframe, only the period from 06 h 00 to 08 h 00 is considered, as it remains unoccupied during the nights and early mornings.
To determine the travel patterns of vehicles entering the campus parking lot and establish the range in a scenario where these vehicles replace combustion vehicles, a survey was conducted. The survey aimed to determine the average mileage travelled by parking lot users’ vehicles on the university campus during a week. Based on the data recorded by the access control system, it was determined that 348 users enter per day, and on average, a user travels 274 km per week and makes 2 daily entries, as shown in Figure 1.
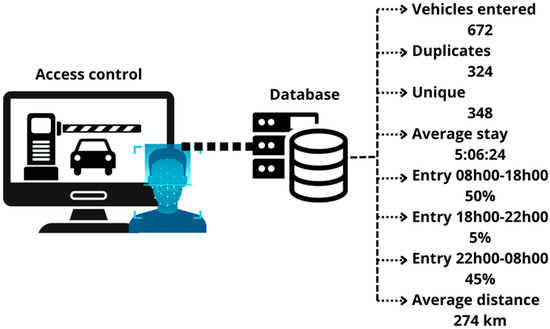
Figure 1.
Data process.
To comprehensively address the electric demand due to the new proposed charges, various electric vehicle (EV) penetration scenarios are analyzed. The evaluation will be conducted using the data of the single average of entered vehicles shown in Figure 1. They are analyzed for different scenarios where 10%, 20%, and 30% of the vehicles in the parking lot are electric, as shown in Figure 2.
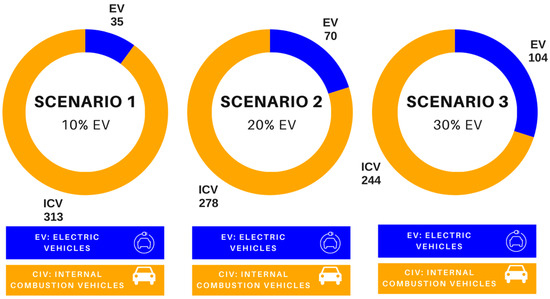
Figure 2.
Electric vehicle penetration scenarios.
2.1. Energy Demand Estimation
For the demand estimation, two of the most prominent electric vehicles (EVs) in the Ecuadorian market were selected [41], the KIA Soul EV and the Nissan Leaf. Their prices range between USD 30,000 and USD 35,000. Below, Table 2 presents information on the electrical charging specifications of the analyzed vehicles.
Table 2.
Charging specifications of the vehicles.
According to Table 2, the Kia Soul and the Nissan Leaf have ranges of 276 km and 280 km, respectively. Given that the average vehicle travel distance is 274 km per week, it can be deduced that a car will require a full charge on average once a week. The energy consumption for charging EVs varies depending on the vehicle model and the type of charger used. Additionally, these vehicles utilize the charging standards CHArge de MOve (CHAdeMO) and Combined Charging System (CCS). Generally, CHAdeMO covers relatively low-voltage batteries up to around 500 V, while CHAdeMO 2.0 and CCS cover relatively high-voltage batteries up to approximately 1000 V [42]. In Table 3, the main characteristics of CHAdeMO and CCS fast-charging connectors are shown.
Table 3.
Types of connectors.
To determine the optimal number of charging points needed to supply electric power, a charging plan for EVs has been developed, as shown in Table 4. Each vehicle requires a charging power of 77 kW and 100 kW, with an average time of 0.5 and 0.7 h, respectively, according to Table 2.
Table 4.
Charging plan for electric vehicles.
In Table 4, it was observed that for a 10% penetration of EVs, it is recommended to have two charging points. For a 20% penetration, the suggestion is to install four charging points, and for a 30% penetration, a charging station with five charging points is advised. The charging times for the proposed scenarios vary between 10 and 14 h depending on the type of charger used, and it is important to highlight that these times are within the time limit during which the university campus parking lot remains open.
To calculate the demand for electrical energy, Equation (1) was used. In the case of Scenario 1, two types of chargers are used: one for the Kia Soul (CCS) with 77 kW and another for the Nissan Leaf (CHAdeMO) with 100 kW. In Scenario 2, four types of chargers are used: two for the Kia Soul (CCS) with 77 kW and two for the Nissan Leaf (CHAdeMO) with 100 kW. In Scenario 3, five types of chargers are used: two for the Kia Soul (CCS) with 77 kW and three for the Nissan Leaf (CHAdeMO) with 100 kW. This is considering a fast charging time between 0.5 and 0.7 h for all three scenarios, and also considering maintenance measures to charge up to 80% of their capacity to extend the lifespan of the batteries. Figure 3a presents the weekly energy demand, and Figure 3b shows the monthly energy demand.
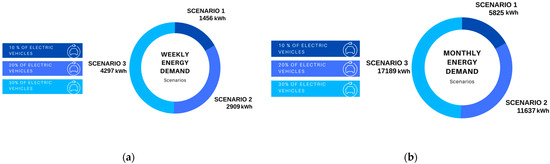
Figure 3.
(a) Weekly energy demand; (b) monthly energy demand.
Considering the results, a comparison was made with other studies regarding the electric energy consumption required for an electric vehicle to travel 100 km for each model. In Table 5, it can be observed that the obtained results vary slightly, which can be attributed to the model year and its range.
Table 5.
Comparison of electric energy consumption.
Calculations are performed according to the assessment of the weekly energy consumption required for the incorporation of 10% of EVs (35 units) with a range of 274 km. In previous research [35,36], a consumption of 1392.74 kWh/week was recorded, contrasted with the results of the present study revealing an increase of 4.55% in consumption, reaching a total of 1456.16 kWh/week, considering that the recharging of these vehicles was exclusively conducted on campus.
2.2. Photovoltaic System
To calculate the power required by the PV system, the equation derived from the capacity factor will be used. This factor is calculated as the ratio of the total energy produced during a specific period to the energy that could have been generated at maximum capacity during the same period. Using the equation for the capacity factor, the power is derived as shown in Equation (2).
For the calculation, the capacity factor from a previous study [44] is considered, which is 16.55%. This factor is applied to the previously calculated monthly energy demand. Next, the required power for the three scenarios is calculated as follows:
2.3. Solar Potential Determination
To provide a concrete perspective, global and diffuse solar irradiation levels incident in Cuenca are compiled. These data were obtained through Meteonorm 8.1 (2016–2021) software from PVsyst. Figure 4a presents a detailed summary of the irradiation parameters, while Figure 4b depicts a heat map illustrating the patterns of average irradiance behaviour per hour during the month.
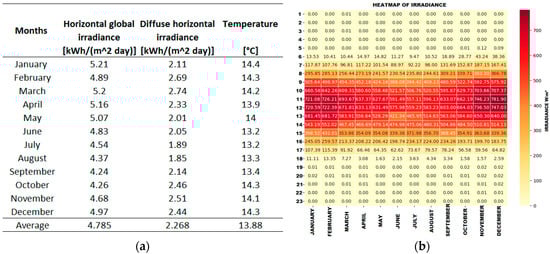
Figure 4.
(a) Parameters of irradiation obtained from PVsyst; (b) average irradiance per hour during the month.
2.4. Factors to Consider for the Photovoltaic System
For the minimum () and maximum number of modules in the series of the PV system, Equations (3) and (4) are used. The minimum number in series is linked to the relationship between the minimum DC voltage of the inverter (Vmin DC) and the maximum power point voltage () of the module. Meanwhile, the maximum number in series is related to the maximum DC voltage of the inverter and the open-circuit voltage () of the module.
The number of parallel strings () is determined by Equation (5), which is calculated from the relationship between the peak power of the inverter () and the number of modules in series () multiplied by the module’s power (). With this result, the total number of modules () can be obtained using Equation (6).
Additionally, the voltage at the maximum power point () at the output of the string is determined using Equation (7), where the maximum power voltage of the module () is multiplied by the number of modules in series (). The peak power of the PV array is determined by Equation (8), multiplying the total number of modules () by the power of the module ().
The DC input voltage of the PV system varies with the operating temperature of the PV modules. Equation (9) [45] models how temperature affects the open-circuit voltage. As the temperature increases or decreases from the standard test condition temperature, the open-circuit voltage experiences proportional changes.
Open-circuit voltage;
Open-circuit voltage under standard conditions;
Number of modules in series;
Temperature coefficient of voltage variation;
Module temperature.
In Cuenca, the average minimum and maximum temperatures for the modules range between 11 °C and 20.9 °C [46]. Considering the temperature under standard conditions of 25 °C, Equation (9) allows us to calculate the voltage variation of a photovoltaic module.
- Voltage without maximum load:
- Minimum MPP voltage:
- Maximum MPP voltage:
The conditions to ensure the proper arrangement of the PV system. Firstly, it must meet condition A, where it is verified that the open-circuit voltage () at the output of each string at minimum temperature (11 °C) is less than or equal to the maximum voltage () that the inverter can withstand, as expressed in Inequality (13).
Given that the voltage at the output of the modules is temperature-dependent, it is necessary to verify that under the expected operating conditions (11 °C and 20.9 °C), the inverter operates within the declared voltage range. Therefore, condition B must be met using Inequality (14), where the minimum voltage at the output of the modules () must be greater than or equal to the minimum voltage at the input of the inverter (), and condition C through Inequality (15), where the maximum voltage at the output of the modules () must be less or equal than the maximum voltage at the input of the inverter ().
In addition to meeting the three voltage conditions, the total maximum short-circuit current () of the PV generator strings operating at the maximum power point must not exceed the maximum current supported by the inverter (). Therefore, condition D must satisfy Inequality (16).
For the correct connection of the inverter–string, it is necessary to verify if the open-circuit voltage at the end of the string is lower than the maximum input voltage allowed by the inverter. Additionally, the minimum voltage of the string’s maximum power point (MPP) should not be lower than the minimum MPPT voltage of the inverter, and the maximum voltage of the string’s MPP should not be higher than the maximum MPPT voltage of the inverter. Table 6 shows the compliance of these conditions for the three scenarios.
Table 6.
Compliance with the conditions for the three scenarios.
2.5. Battery Storage Capacity
The storage capacity required for the system is determined based on the assessment of energy demand, system voltage, days of autonomy, and depth of discharge. Additionally, the maximum value for battery capacity is determined by choosing the highest value between daily nominal capacity and seasonal nominal capacity.
To calculate the daily and seasonal nominal storage capacity required for the photovoltaic system, Equation (17) is used. The maximum daily depth of the discharge cycle is 15%, while for the seasonal depth of discharge, 70% is utilized [47]. For the seasonal cycle, the maximum range of days that a battery can be discharged without receiving solar irradiation is 3–10 days [48].
The model to be used is a battery of 880.6 V–296.40 Ah. This specific battery model was chosen due to its ability to handle the required system voltage, its capacity to meet the energy demand, and its compatibility with the photovoltaic system. Additionally, its technical specifications align well with the operational requirements of the EV charging station, ensuring reliable performance and longevity.
Calculated battery capacity required for the system [Ah];
Energy demand [kWh/día];
Days of autonomy;
System voltage [V];
Depth of discharge.
Then, the number of batteries required to meet the energy demand needs to be determined, for which Equation (18) is utilized.
Number of batteries;
Actual capacity of an individual battery [Ah].
3. Results
3.1. System Simulation
The simulation of photovoltaic solar energy generation was conducted in PVsyst. The number of solar panels in series, the number of strings, and the number of inverters are entered, following the specifications established in Table 7, which summarizes the series–parallel configuration of the photovoltaic modules for the three established scenarios.
Table 7.
Series–parallel configuration.
Below are the results of the simulation with and without battery storage for the three scenarios studied.
3.1.1. Scenario with 10% of EVs
- A system without battery storage
In the scenario considering the incorporation of 10% EVs, Figure 5 presents the corresponding energy results. For the PV system, two inverters of 30 kW are used, along with 108 solar panels of 450 Wp, configured with 18 modules in series and 3 in parallel. For the electric charging station, a 77 kW CCS connector and a 100 kW CHAdeMO connector are used.
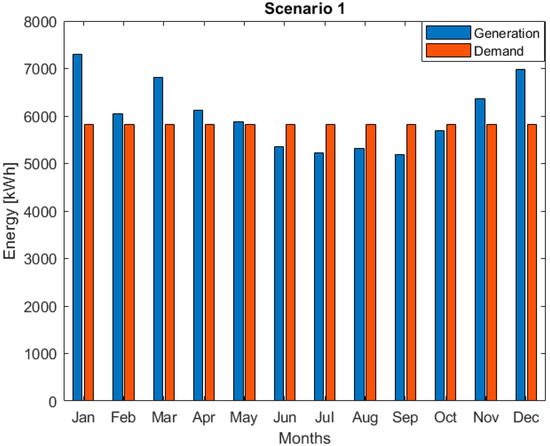
Figure 5.
Generation and demand of the system for 10% EVs.
It can be observed that the PV system will supply electrical energy, except in June (5355 kWh), July (5222 kWh), August (5327 kWh), September (5196 kWh), and October (5693 kWh), where generation is below the demand of 5824.64 kWh. It is worth noting that energy balance is considered; when there are situations where the generation of the PV system is lower than the demand, the distributor will verify if the consumer has an accumulated energy balance in their favour. If so, the distributor will proceed to debit part of said balance to cover the energy corresponding to the month in which the demand is exceeded.
- The system with Battery Storage
According to the energy produced by the 48.60 kWp PV system and the energy demand it has to supply of 291.23 kWh/day, it is considered to work with a seasonal nominal capacity of 2698.09 Ah. The batteries are connected in parallel, achieving a capacity of 719.6 V–2698.09 Ah.
Battery storage provides fast-response services to stabilize the electrical grid, improving the quality and reliability of the energy supply. Below are the results obtained using battery storage. Figure 6a shows the daily profile when solar generation is minimal, while Figure 6b shows the daily profile when solar generation is maximum. Additionally, in Figure 6b, it can be observed that due to maximum generation, excess energy is injected into the grid.
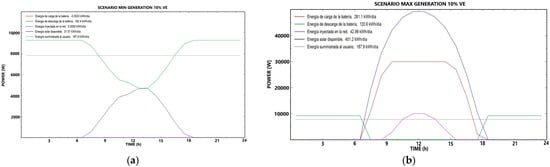
Figure 6.
(a) Daily profiles when generation is minimal (10% EV scenario); (b) daily profiles when generation is maximum (10% EV scenario).
3.1.2. Scenario with 20% of EVs
- The system without battery storage
For the scenario in which a 20% penetration of EVs is considered, Figure 7 shows the energy-related results. The PV system utilizes three inverters of 30 kW each, along with 216 modules of 450 Wp configured with 18 modules in series and 4 in parallel. For the charging station, two CCS connectors of 77 kW and two CHAdeMO connectors of 100 kW each are used.
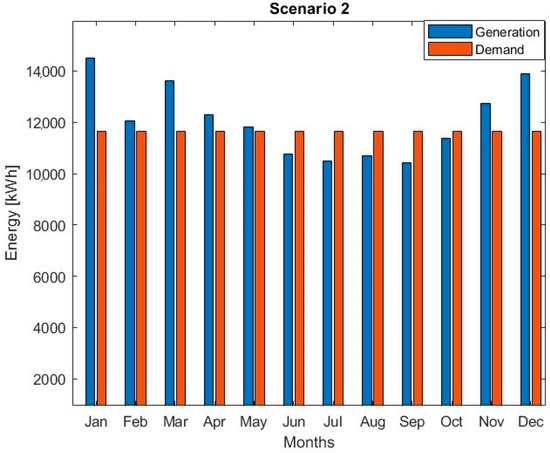
Figure 7.
Generation and demand of the system for 20% EVs.
As the EV penetration increases to 20%, it requires more generation capacity. The sized PV system proves capable of efficiently meeting the energy demand, except during months of low irradiation, where it experiences a decrease in performance (June 10,755 kWh, July 10,499 kWh, August 10,710 kWh, September 10,434 kWh, and October 11,392 kWh), where the generation is below the demand of 11,637 kWh.
- The system with Battery Storage
According to the energy produced by the 97.2 kWp photovoltaic system and the energy demand it has to meet of 581.84 kWh/day, it is considered to operate with a seasonal nominal capacity of 5390.40 Ah. The batteries are connected in parallel, achieving a capacity of 719.6 V–5034.14 Ah.
Below are the results obtained using battery storage. Figure 8a illustrates the daily profile when solar generation is at its minimum, while Figure 8b shows the daily profile during maximum solar generation.
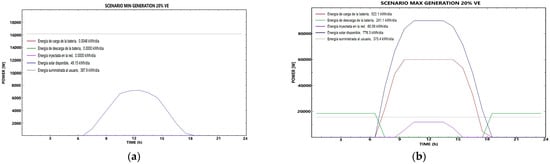
Figure 8.
(a) Daily profiles when generation is minimal (20% EV scenario); (b) daily profiles when generation is maximum (20% EV scenario).
3.1.3. Scenario with 30% of EVs
- The system without battery storage
For the scenario where a 30% insertion of EVs is considered, Figure 9 shows the energy results. The PV system uses five inverters of 30 kW each, with 16 modules in series and 4 in parallel. For the EV charging station, two 77 kW CC2 connectors and three 100 kW CHAdeMO connectors are used.
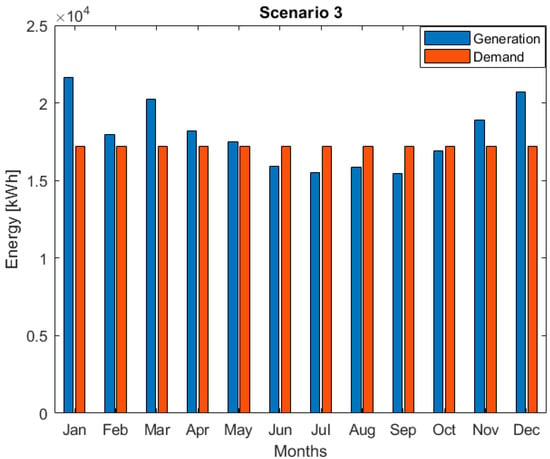
Figure 9.
Generation and demand of the system for 30% EVs.
The sized PV system demonstrates effectiveness in meeting the energy demand, except during months of lower irradiation, where a reduction in its performance is observed (June: 15,916 kWh, July: 15,529 kWh, August: 15,842 kWh, September: 15,445 kWh, and October: 16,920 kWh), with the generation falling below the demand of 17,189 kWh.
- The system with Battery Storage
According to the energy produced by the 144 kWp photovoltaic system and the energy demand it needs to supply of 859.46 kWh/day, it is considered to work with a seasonal nominal capacity of 7962.34 Ah. The batteries are connected in parallel, achieving a capacity of 719.6 V–7962.34 Ah.
Similarly to the previous results, the use of battery storage will be very useful in situations where generation is below demand. Below are the results obtained using battery storage. Figure 10a illustrates the daily profile when solar generation is at its minimum, while Figure 10b shows the daily profile during maximum solar generation.
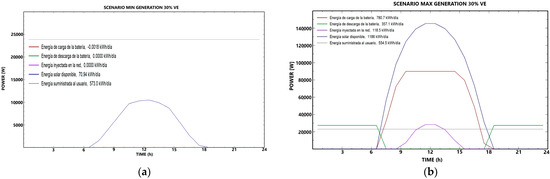
Figure 10.
(a) Daily profiles when generation is minimal (30% EV scenario); (b) daily profiles when generation is maximum (30% EV scenario).
3.2. Economic Analysis
An economic analysis is conducted to evaluate the feasibility of the project for the three scenarios studied. Parameters such as operating costs, maintenance, and investment for the development of this project are considered. The analysis is carried out for storage with batteries and without considering batteries.
3.2.1. Economic Analysis of the System without Considering Battery Storage
Investment Costs
In Figure 11, a summary of the investment costs corresponding to the three studied scenarios is presented. This analysis was carried out for a fast-charging station equipped with two DC connectors (CHAdeMO + CCS) from CIRCUTOR. In addition to the components of the solar system are solar panels, the inverter, and associated labour costs.
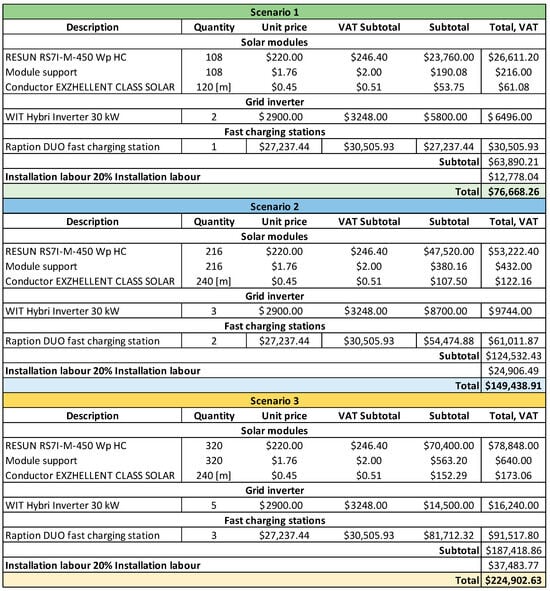
Figure 11.
Investment costs for the 3 scenarios with photovoltaic system.
For this evaluation, a cash flow analysis is conducted, which constitutes a representation of the financial inflows and outflows, to assess the viability of a project. The cash flow evaluation is performed for three different scenarios over 25 years, which is the established useful life of a PV system according to regulation Nro. ARCERNNR-008/23 [34]. During this analysis, the cash flow considers the initial investment, the energy savings generated over the 25 years with the photovoltaic system, and the annual expenses (annual maintenance). Additionally, key financial indicators such as the Internal Rate of Return (IRR), the Net Present Value (NPV), and the payback period are included. Figure 12 below presents the parameters considered in the cash flow analysis for this study.
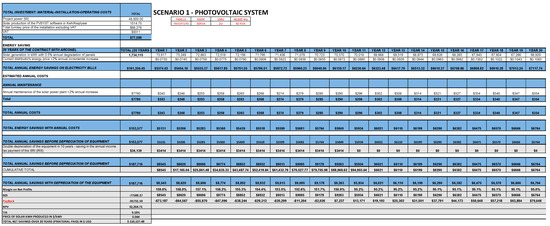
Figure 12.
Parameters used for cash flow analysis.
NPV allows us to calculate the present value of a certain number of future cash flows generated by an investment [49]. According to the decision rule associated with NPV, the investment is accepted if the NPV is greater than zero (>0) and rejected if the NPV is less than zero (<0). If n is the number of cash flows in the list of values, Equation (19) represents the NPV:
On the other hand, the IRR is defined as the rate that discounts the value of expected future net incomes to equal the initial investment outlay. The IRR is closely related to NPV, as it represents the interest rate corresponding to an NPV of 0 (zero). Equation (20) demonstrates the relationship between NPV and IRR. Meanwhile, the payback period represents the time needed to recoup the initial investment.
Table 8 summarizes the cash flow results for each of the three scenarios. For this analysis, the NPV is positive, and the IRR is greater than zero in all three scenarios, indicating that the project is financially acceptable. The payback period analysis is addressed in Section 3.2.3, where the payback period is compared in two scenarios: one with batteries and one without batteries.
Table 8.
Cash flow results.
3.2.2. Economic Analysis of the System Considering Battery Storage
Investment Costs
Regarding this criterion, Figure 13 provides a summary of the investment costs for the three studied scenarios. Unlike the previous section, this one includes the battery costs analyzed in this section.
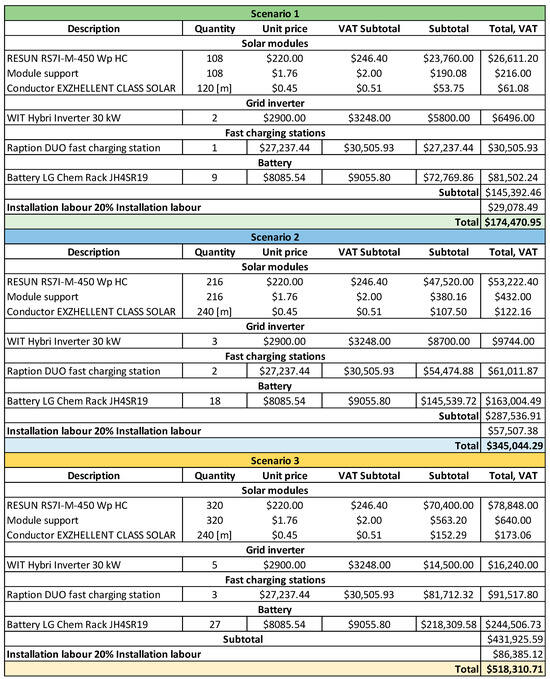
Figure 13.
Investment costs for the 3 scenarios with photovoltaic system and batteries.
For the cash flow, a new value for the total investment is introduced due to the addition of batteries. Furthermore, the previously calculated operating and maintenance costs are included. Next, the cash flow analysis is carried out for the three scenarios. Table 9 summarizes the cash flow results for the photovoltaic system with battery storage.
Table 9.
Cash flow results.
The Net Present Value (NPV) reflects a negative outcome in all three analyzed scenarios, indicating that the NPV rule is not met. Consequently, from a financial perspective, this project is considered not viable. The Internal Rate of Return (IRR) exceeds 0% in all evaluated scenarios, indicating limited profitability.
3.2.3. Comparison of Return on Investment (Payback)
To put the previously conducted analyses into perspective, a comparison of the return on investment for Scenario 1 is performed. The return on investment for Scenario 1 is depicted in Figure 14a, and the return on investment for Scenario 1 considering battery storage is shown in Figure 14b.
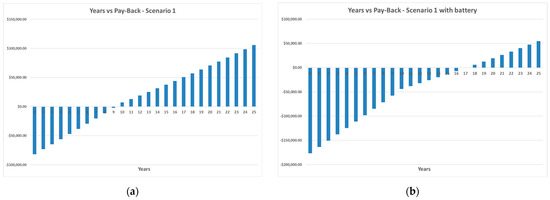
Figure 14.
(a) Return on investment for Scenario 1; (b) return on investment for Scenario 1 with battery storage.
Observing the images presented above, the return on investment for an electric charging station with a PV system without battery storage for Scenario 1 may be of interest. The return on investment starts from the ninth year when the economic benefits exceed the initial investments. In contrast, in the case of an electric charging station with a PV system with battery storage, concerning the return on investment, it is notable that at least 17 years are needed to recover the investment. This investment payback period is very high, considering that the useful life of a PV project is 25 years. This analysis applies to the three scenarios studied, as the increase in power entails a proportional increase in investment costs.
4. Discussion
To conduct the present analysis, the specific energy consumption for the electric charging station has been determined. To evaluate this consumption, a survey was conducted to gather data on the current mileage of users, and subsequently, after a week of tracking, the distances travelled by users were recorded. According to the results, it was determined that, on average, a vehicle covers 274 km weekly, equivalent to 39.14 km daily, resulting in a consumption of 6.16 kWh. In [50], it is established that vehicles travel, on average, between 10 km and 50 km daily in the city of Cuenca. Energy consumption is determined based on charging and refuelling patterns by users who own internal combustion engine vehicles.
In [38], the energy consumption of a taxi company in the city of Loja (Electric Loja Ecolosur S.A. “Ecotaxi”) is evaluated, which consists of 51 taxis, 35 of the BYD E5 brand, and 16 of the Kia Soul EV brands. According to the study, a vehicle of the Kia Soul EV brand consumes 13.26 [kWh/100 km]. In contrast, for this project, an analysis was conducted on the electric energy consumption required by the Kia Soul EV, which was based on the average distance travelled by users. For the study, the vehicle’s range and electrical characteristics were considered, and it was found that this vehicle has a consumption rate of 15.73 [kWh/100 km]. Furthermore, [8] provides information about the efficiency of EVs in the central and southern regions of China. EVs in that region have an energy consumption of 16 kWh/100 km. This variation may be due to differences in driving conditions, user habits, terrain, or methodologies employed in each study.
In [38], during the testing phase of Cuenca’s tram system, the daily energy consumption reaches 5.86 MWh for 14 units accommodating 300 passengers each. With a 10% vehicle insertion (35 units), the weekly energy demand totals 1456.16 kWh. For a 20% insertion (70 units), it rises to 2909.20 kWh, and for a 30% insertion (104 units), it reaches 4297.28 kWh. This comparison offers valuable insights into energy demands for different electric traction transport infrastructures and their relationship with EV charging needs in urban settings. It underscores the importance of considering capacity and energy requirements when planning transport infrastructure and EV adoption in urban areas.
In [51], a cost analysis of kWh by country revealed that Chile has the lowest cost for EV charging, at USD 0.07 per kWh. This is attributed to its abundant hydroelectric, geothermal, and solar energy sources. A full recharge costs USD 7.35 in Chile. In Ecuador, as per the tariff schedule for EV charging service providers, the maximum cost per kWh is USD 0.20. For the Kia Soul EV, a full recharge totals USD 10.74, and for the Nissan Leaf, it is USD 9.74. The monthly savings generated by the PV system for the three proposed scenarios would be USD 1161.43, USD 2320.17, and USD 3427.50, respectively.
For the PV system, component selection was based on the power required by the system, calculated from the energy consumed by vehicles in different scenarios. In the first scenario, with a 10% vehicle insertion (35 units), the system’s power will be 48,211 kW, featuring two charging points. In the second scenario, with a 20% insertion (70 units), the system’s nominal power will be 96,319 kW, with four charging points. Lastly, for the third scenario, with a 30% insertion (104 units), the system’s nominal power will be 142,276 kW, with five charging points. In all cases, the system will be grid-connected so that during periods of low solar irradiation, electric vehicles can utilize both the grid and energy storage. Comparatively, in [26], there are 12 solar plants with a total installed capacity of 6228 kW to meet the demand of 1894 vehicles, with multiple charging points on the distribution grid. Conversely, in [52], the total power is 303 kW, and the charging station has four chargers with three connectors each. Local charging strategies must be designed to effectively meet the specific needs of electric mobility, considering the unique characteristics of each local environment.
In this study, based on generation results obtained from simulations conducted in PVsyst, the capacity factor for the three scenarios was calculated. The simulation considers not only the required power of the PV system but also factors such as the tilt and orientation of the solar panels, which significantly influence the amount of captured solar energy. In the first scenario, the capacity factor is 16.98%, in the second scenario, it is 16.99%, and in the third scenario, it is 17.03%. This is compared to the existing 12.6 kW PV system at the Universidad Politécnica Salesiana, which achieved a capacity factor of 15.2% in 2019 according to [53]. The results indicate that the PV system evaluated in this study has the potential to be highly efficient and effective in generating electrical energy from renewable sources. This supports its viability as a sustainable and cost-effective option for EV charging.
In [9], the carbon footprint comparison between an internal combustion engine vehicle (KIA Soul) and a battery electric vehicle (KIA Soul EV) is explored within the energy landscape of Ecuador, which largely relies on hydroelectric and petroleum energy. The greenhouse gas emissions from an ICE vehicle are determined to be 236.16 , while the EV emits only 63.14 . For this project, considering a 10% EV insertion (35 EVs), the carbon footprint generated is 220.990 compared to the carbon footprint for 35 ICE vehicles, which is 826.560 ; this represents a 73.3% reduction in emissions. In comparison with [5], which studies Ecuador’s public transportation system and the environmental benefits of migrating 25%, 50%, and 100% of diesel buses to electric mobility systems by 2025, the carbon footprint with a 25% penetration of electric mobility will be 21.370 compared to the 723.783 emitted by the diesel bus fleet, resulting in a 97.05% reduction. Table 10 below shows the amount of CO2 saved with the photovoltaic system and the electric vehicles.
Table 10.
CO2 emissions saved by SFVs and EVs.
From an economic perspective in [54], the costs associated with the installation and maintenance of an FV system are considered, with an investment of USD 120,024.72. By conducting a cash flow analysis for 20 years and evaluating economic indicators, it was determined that the NPV is positive with a value of USD 634.667. Additionally, the IRR shows a return on investment of 21% from the second year, stabilizing at 112% from the 15th year onwards, thus determining the project’s viability. In [55], an economic study using the HOMER programme is conducted, considering two hypotheses: one where all expenses are covered by an entrepreneur and another where expenses are subsidized. Without subsidies, an initial investment of EUR 147,795 results in a Net Present Value (NPV) of EUR 231,422 and an Internal Rate of Return (IRR) of 14.78%. The investment recovery period, or payback, begins in the seventh year. Conversely, with partial subsidies, the initial investment decreases to 84,688 euros. In this scenario, the NPV increases to EUR 294,529, the IRR rises to 31.64%, and payback is achieved from the fourth year onwards. Both hypotheses are viable, but due to the subsidy in the second hypothesis, the investment is recovered in fewer years. In this project, an economic analysis was conducted for a solar-powered electric charging station, considering and not considering battery storage. A cash flow analysis was carried out for 25 years, considering economic indicators such as NPV, IRR, and payback. Without battery storage, in the first scenario with an investment of USD 77,588.27, the NPV is USD 32,264.70 with an IRR of 9.18%. In the second scenario with an investment of USD 151,232.18, the NPV is USD 67,134.00 with an IRR of 9.43%. In the third scenario with an investment of USD 227,601.46, the NPV is USD 87,741.74 with an IRR of 8.79%. Payback for all scenarios occurs from the ninth year onwards. When considering battery storage, in the first scenario with an investment of USD 176,564.60, the NPV is −USD 33,083.78 with an IRR of 2.65%. In the second scenario with an investment of USD 349,184.83, the NPV is −USD 63,563.31 with an IRR of 2.72%. In the third scenario with an investment of USD 524,530.43, the NPV is USD 98,934.56 with an IRR of 2.63%. Payback for all scenarios occurs from the 17th year onwards. This demonstrates that the project is viable without including battery storage in the grid-connected system. Table 11 below shows important parameters of the study compared to other similar studies.
Table 11.
Parameters discussed.
5. Recommendations
It is recommended to carry out a detailed and customized design of photovoltaic systems, considering seasonal variations in solar generation. This involves properly sizing the solar panels and considering battery storage strategies. A balanced approach will ensure the reliability of the power supply and cover demand even in months with lower solar radiation.
Given the lack of financial viability in scenarios with battery storage, consider optimizing costs or seeking alternative solutions to make the project more profitable. It is recommended to thoroughly evaluate the costs associated with batteries and explore possible subsidies or incentives that could improve the project’s profitability.
Although scenarios without battery storage present economic advantages, it is urged to conduct detailed analyses of the financial impact of introducing storage systems. This includes considering emerging technologies and the decreasing costs of batteries.
It is recommended to establish awareness and community participation programmes to support the transition to electric mobility. Education on the environmental and economic benefits of photovoltaic systems and electric vehicles can generate local support and contribute to the sustainable success of the project.
6. Conclusions
This article examines the integration of solar PV systems with EV charging stations, exploring various scenarios including potential battery storage. Understanding EV energy consumption guides system adaptation to specific study area needs. Evaluating solar and storage potential underscores the need for a balanced design for a reliable, sustainable energy supply.
Solar PV systems efficiently power EV stations, but seasonal solar variations necessitate properly sized systems for reliability and surplus management. EV integration impacts energy demand, crucial for designing PV systems to meet charging capacity needs across different regions. To enhance EVs’ environmental benefits, recharging from renewable sources is vital, offsetting emissions from non-renewable energy.
Economic analysis favours scenarios without battery storage, showing positive returns with IRR and NPV, influenced by incentive policies like off-peak charging rates. While battery storage enhances system stability, its introduction requires careful consideration due to potential profitability impacts.
Successful implementation hinges on holistic approaches integrating economic, environmental, and social factors to foster sustainable electric mobility. Long-term cost–benefit analyses of varied energy management strategies, including smart grids, further inform effective charging station designs.
A promising area of research would be to explore how electric vehicle charging impacts the demand and stability of local and regional electrical grids. This study could focus on identifying strategies to mitigate adverse effects and capitalize on emerging opportunities for the effective integration of EV charging. Additionally, investigating advanced energy management technologies, such as smart grids and active demand management, would be crucial to optimize the operation of electric vehicle charging stations powered by photovoltaic systems, thus ensuring an efficient and sustainable integration of renewable energy sources in electric mobility.
Author Contributions
Conceptualization, E.B.-M., S.F.-C. and A.B.-E.; methodology, E.B.-M. and S.F.-C.; software, E.B.-M., S.F.-C.; validation, A.B.-E. and E.Z.-L.; formal analysis, A.B.-E., E.Z.-L. and X.S.-G.; investigation, E.B.-M. and S.F.-C.; resources, A.B.-E.; data curation, E.Z.-L.; writing—original draft preparation, E.B.-M., S.F.-C. and E.Z-L.; writing—review and editing, E.B.-M., S.F.-C., A.B.-E., X.S.-G. and E.Z.-L. All authors have read and agreed to the published version of the manuscript.
Funding
This work is part of the “Planificación Energética Territorial: Situación actual y metodología para integración de generación y redes eléctricas en el territorio y PDOTs” research project. It has received support of the Salesian Polythecnic University of Ecuador and the Research Vicerectorate of the Cuenca University (VIUC), Ecuador.
Data Availability Statement
The data presented in this study are available on request from the corresponding author due to data security and confidentiality requirements.
Conflicts of Interest
The authors declare no conflict of interest.
References
- Dormido, L.; Garrido, I.; L’Hotellerie-Fallois, P.; Santillán, J. El Cambio Climático y la Sostenibilidad del Crecimiento: Iniciativas Internacionales y Polí Ticas Europeas; Documentos Ocasionales; Banco de España: Madrid, Spain, 2022. [Google Scholar]
- Guamán, J.; García, M.; Guevara, D.; Ríos, A. Evaluación del Impacto Económico en Diferentes Escenarios de Implementación de Tecnologías Eficientes de Calentamiento de Agua en el Ecuador. Rev. Técnica “Energía” 2016, 12, 270–283. [Google Scholar] [CrossRef]
- Verma, A.; Singh, B. A Solar PV, BES, Grid and DG Set Based Hybrid Charging Station for Uninterruptible Charging at Minimized Charging Cost. In Proceedings of the 2018 IEEE Industry Applications Society Annual Meeting (IAS), Portland, OR, USA, 23–27 September 2018; pp. 1–8. [Google Scholar]
- Latinoamérica, M.P. China Concentra el 65% de Estaciones de Carga Públicas Para Vehículos Eléctricos en el Mundo. Available online: https://portalmovilidad.com/china-concentra-el-65-de-estaciones-de-carga-publicas-para-vehiculos-electricos-en-el-mundo (accessed on 18 July 2024).
- Camarillo, B. Costa Rica es el Cuarto País de Latinoamérica Con Más Puntos de Recarga Para Carros Eléctricos. 2022. Available online: https://www.larepublica.net/noticia/costa-rica-es-el-cuarto-pais-de-latinoamerica-con-mas-puntos-de-recarga-para-carros-electricos (accessed on 18 July 2024).
- Soria Lara, J.A.; Valenzuela Montes, L.M. Dimensiones relevantes para la evaluación ambiental proactiva de la movilidad urbana. Investig. Geográficas 2015, 87, 5–24. [Google Scholar] [CrossRef][Green Version]
- Kougias, I.; Nikitas, A.; Thiel, C.; Szabó, S. Clean energy and transport pathways for islands: A stakeholder analysis using Q method. Transp. Res. D Transp. Environ. 2020, 78, 102180. [Google Scholar] [CrossRef]
- Felipe, V.F. Estudio de la Reducción de las Emisiones de CO2 Debido a la Sustitución de Vehículos de Combustión por Vehículos Eléctricos en la Distribución de la Ultima Milla de un Comercio Electrónico al por Menor de Alimentos. Ph.D. Thesis, Universitat Politécnica de Valéncia, Valencia, Spain, 2020. [Google Scholar]
- Alvarado, J.; Fernández, R.; Mora, A.; Hernandez-Ambato, J. Evaluación de la huella de carbono de vehículos con motor eléctrico y de combustión interna según la matriz energética de Ecuador: Caso de estudio KIA Soul vs KIA Soul EV. Rev. Digit. Novasinergia 2022, 5, 58–75. [Google Scholar]
- Messagie, M. Life cycle analysis of the climate impact of electric vehicles. J. Life Cycle Assess. 2014, 2014, 14. [Google Scholar]
- Shen, W.; Han, W.; Wallington, T.J. Current and future greenhouse gas emissions associated with electricity generation in China: Implications for electric vehicles. Environ. Sci. Technol. 2014, 48, 7069–7075. [Google Scholar] [CrossRef] [PubMed]
- VARUS. Historial de Ventas en Ecuador. 2023. Available online: https://varusecuador.com/estadisticas-historial-de-ventas (accessed on 18 July 2024).
- Ozores, J.M.S.; María, J. Diseño de la Instalación Eléctrica de Una Electrolinera; Universidad Carlos III de Madrid: Getafe, Spain, 2012. [Google Scholar]
- Torregrosa, B.O. Modelo de Negocio y Análisis Financiero de la Start-up E-Plug. Tecnología IoT. 2020. Available online: http://hdl.handle.net/11531/37222 (accessed on 18 July 2024).
- Doroudchi, E.; Alanne, K.; Okur, Ö.; Kyyrä, J.; Lehtonen, M. Approaching net zero energy housing through integrated EV. Sustain. Cities Soc. 2018, 38, 534–542. [Google Scholar] [CrossRef]
- Ministerio de Energía y Recursos Naturales No Renovables. Ley Orgánica de Eficiencia Energética. 2019. Available online: https://www.recursosyenergia.gob.ec/wp-content/uploads/2022/12/20190319-S_R_O_449_19_MARZO_LEY-ORGANICA-DE-EFICIENCIA-ENERGETICA.pdf (accessed on 18 July 2024).
- Gómez, J. Revista Panorama Eléctrico. Panor. Eléctr. 2021, 5, 42. Available online: https://www.controlrecursosyenergia.gob.ec/wp-content/uploads/downloads/2021/09/PanoramaElectricoV-Julio-Baja.pdf (accessed on 18 July 2024).
- ARCERNNR, Pliego Tarifario Para los Proveedores Del Servicio de Carga de Energía a Vehículos Eléctricos Límites Máximo Del Costo. 2023. Available online: https://www.controlrecursosyenergia.gob.ec/wp-content/uploads/downloads/2023/02/Pliego-Tarifario-SCVE-Ano-2023_Certificado.pdf (accessed on 18 July 2024).
- IEC Technical Committee 69. IEC 61851-1 Electric Vehicle Conductive Charging System—Part 1: General requirements. Available online: https://webstore.iec.ch/en/publication/33644 (accessed on 18 July 2024).
- ARCERNNR. Regulación Nro. ARCERNNR-008-23. Available online: https://www.controlrecursosyenergia.gob.ec/wp-content/uploads/downloads/2023/11/Regulacion-Nro.-ARCERNNR-008-23-signed1.pdf (accessed on 29 July 2024).
- Brenna, M.; Dolara, A.; Foiadelli, F.; Leva, S.; Longo, M. Urban Scale Photovoltaic Charging Stations for Electric Vehicles. IEEE Trans. Sustain. Energy 2014, 5, 1234–1241. [Google Scholar] [CrossRef]
- Ledmaoui, Y.; El Maghraoui, A.; Chebak, A. Solar Charging Station for Electric Vehicles with IoT Solution for Monitoring Energy Production. In Smart Applications and Data Analysis; Hamlich, M., Bellatreche, L., Siadat, A., Ventura, S., Eds.; Springer International Publishing: Berlin/Heidelberg, Germany, 2022. [Google Scholar]
- Saranya, P.; Madhulikha, K.S.; Yamini, C.; Sri, P.T.; Chander, A.H. Design of Grid Independent EV Charging Station. In Proceedings of the 2021 IEEE International Conference on Intelligent Systems, Smart and Green Technologies (ICISSGT), Visakhapatnam, India, 13–14 November 2021; pp. 144–149. [Google Scholar]
- Qadir, S.; Khan, M.A.; Idress, O.; Akhtar, S. Design and Analysis of On-Campus Hybrid Charging Station for Electric Vehicles. In Proceedings of the 2022 International Conference on Recent Advances in Electrical Engineering & Computer Sciences (RAEE & CS), Islamabad, Pakistan, 18–20 October 2022; pp. 1–5. [Google Scholar]
- Zhang, Y.; Jiang, B.; Yan, H.; Li, T.; Zhang, J.; Liu, Y.; Xiao, Y. Distributed Power Control Considering Different Behavioural Responses of Electric Vehicle Drivers in Photovoltaic Charging Station. J. Shanghai Jiaotong Univ. (Sci.) 2019, 24, 597–604. Available online: https://bibliotecas.ups.edu.ec:2582/10.1007/s12204-019-2100-8 (accessed on 18 July 2024). [CrossRef]
- Turan, M.T.; Gökalp, E. Integration Analysis of Electric Vehicle Charging Station Equipped with Solar Power Plant to Distribution Network and Protection System Design. J. Electr. Eng. Technol. 2022, 17, 903–912. [Google Scholar] [CrossRef]
- Guan, B.; Yang, H.; Li, H.; Gao, H.; Zhang, T.; Liu, X. Energy consumption characteristics and rooftop photovoltaic potential assessment of elevated metro station. Sustain. Cities Soc. 2023, 99, 104928. [Google Scholar] [CrossRef]
- Allouhi, A.; Rehman, S. Grid-connected hybrid renewable energy systems for supermarkets with electric vehicle charging platforms: Optimization and sensitivity analyses. Energy Rep. 2023, 9, 3305–3318. Available online: https://www.scopus.com/inward/record.uri?eid=2-s2.0-85150391617&doi=10.1016%2fj.egyr.2023.02.005&partnerID=40&md5=42fb8f37c4b76bd33f7cda94d32ef80e (accessed on 18 July 2024). [CrossRef]
- Ji, N.; Zhu, R.; Huang, Z.; You, L. An urban-scale spatiotemporal optimisation of rooftop photovoltaic charging of electric vehicles. Urban Inform. 2024, 3, 4. [Google Scholar] [CrossRef]
- Rekioua, D.; Mokrani, Z.; Kakouche, K.; Oubelaid, A.; Rekioua, T.; Alhazmi, M.; Ali, E.; Bajaj, M.; Dost Mohammadi, S.A.; Ghoneim, S.S. Coordinated power management strategy for reliable hybridisation of multi-source systems using hybrid MPPT algorithms. Sci. Rep. 2024, 14, 10267. [Google Scholar] [CrossRef] [PubMed]
- Mai, C.; Zhang, L.; Chao, X.; Hu, X.; Wei, X.; Li, J. A novel MPPT technology based on dung beetle optimisation algorithm for PV systems under complex partial shade conditions. Sci. Rep. 2024, 14, 6471. [Google Scholar] [CrossRef] [PubMed]
- Kumar, K.; Devi, V.L.; Dhanamjayulu, C.; Kotb, H.; ELrashidi, A. Evaluation and deployment of a unified MPPT controller for hybrid Luo converter in combined PV and wind energy systems. Sci. Rep. 2024, 14, 3248. [Google Scholar] [CrossRef] [PubMed]
- Mallat, M.; Kechiche, O.B.H.B.; Ezzeddine, K.; Hamouda, M. AN Optimized Genetic Algorithm (GA)-Based MPPT for Off-Grid Solar Photovoltaic System. In Proceedings of the 2023 IEEE International Conference on Artificial Intelligence & Green Energy (ICAIGE), Sousse, Tunisia, 12–14 October 2023; IEEE: Piscataway, NJ, USA, 2023; pp. 1–5. [Google Scholar] [CrossRef]
- Rodríguez, C.; Vidal, C.; Díaz, M.; Contreras, E.; Guggisberg, G.; Rivas, I. An overview of challenges and benefits associated to the development of vehicle to grid technology. In Proceedings of the 2021 IEEE CHILEAN Conference on Electrical, Electronics Engineering, Information and Communication Technologies (CHILECON), Valparaíso, Chile, 6–9 December 2021; pp. 1–6. [Google Scholar]
- Mohammed, A.; Saif, O.; Abo-Adma, M.; Fahmy, A.; Elazab, R. Strategies and sustainability in fast charging station deployment for electric vehicles. Sci. Rep. 2024, 14, 283. [Google Scholar] [CrossRef] [PubMed]
- Moghe, R.; Kreikebaum, F.; Hernandez, J.E.; Kandula, R.P.; Divan, D. Mitigating distribution transformer lifetime degradation caused by grid-enabled vehicle (GEV) charging. In Proceedings of the 2011 IEEE Energy Conversion Congress and Exposition, Phoenix, AZ, USA, 17–22 September 2011; pp. 835–842. [Google Scholar]
- BloombergNEF, More EVs Are Being Designed to Push Power to The Electrical Grid—Bloomberg. 2021. Available online: https://www.bloomberg.com/news/newsletters/2021-04-27/moreevs-are-being-designed-to-push-power-to-the-electrical-grid (accessed on 18 July 2024).
- Padilla, E.G.B. Estudio de Factibilidad de un Sistema Integral de Transporte Público Eléctrico. Caso de Estudio: Integración de Electrolineras a la Infraestructura Eléctrica del Tranvía de Cuenca. Master’s Thesis, Universidad de Cuenca, Cuenca, Ecuador, 2020. Available online: http://dspace.ucuenca.edu.ec/handle/123456789/34430 (accessed on 18 July 2024).
- Akshay, K.C.; Grace, G.H.; Gunasekaran, K.; Samikannu, R. Power consumption prediction for electric vehicle charging stations and forecasting income. Sci. Rep. 2024, 14, 6497. [Google Scholar] [CrossRef] [PubMed]
- Bhattacharjee, B.; Sadhu, P.K.; Ganguly, A.; Naskar, A.K. Using fuzzy systems for optimal network reconfiguration of a distribution system with electric vehicle charging stations and renewable generation. Microsyst. Technol. 2023. [Google Scholar] [CrossRef]
- Primicias. Estos Son los Carros Eléctricos e Híbridos Más Vendidos en Ecuador. 2023. Available online: https://www.primicias.ec/noticias/economia/carros-electricos-hibridos-ventas-precios (accessed on 18 July 2024).
- Kim, J.-W.; Barbosa, P. PWM Controlled Series Resonant Converter for CHAdeMo/CCS Combo Electric Vehicle Charger. In Proceedings of the 2021 IEEE Applied Power Electronics Conference and Exposition (APEC), Phoenix, AZ, USA, 14–17 June 2021; pp. 1171–1177. [Google Scholar]
- Espinoza, C.L. Desarrollo de un Gemelo Digital de Nissan Leaf Eléctrico Basado en Modelos y Datos Operacionales. 2021. Available online: https://repositorio.uchile.cl/handle/2250/182174 (accessed on 18 July 2024).
- Barragán-Escandón, A.; Zalamea-León, E.; Terrados-Cepeda, J. Incidence of Photovoltaics in Cities Based on Indicators of Occupancy and Urban Sustainability. Energies 2019, 12, 810. [Google Scholar] [CrossRef]
- CEI. CEI 82-25: Guide to the Implementation of Photovoltaic Generation Systems. 2011. Available online: http://www.die.ing.unibo.it/pers/grandi/bologna/fv/2011/CEI-82-25-mod.pdf (accessed on 18 July 2024).
- Wikipedia. Cuenca (Ecuador). Available online: https://es.wikipedia.org/wiki/Cuenca_(Ecuador)#Clima (accessed on 25 February 2024).
- Silva, H.S.N.; Guerrero, D.J.P.; Martinez, J.J.M. Energía solar en paradas de bus una aplicación moderna y vanguardista. Rev. InGenio 2021, 4, 58–68. [Google Scholar] [CrossRef]
- Malhaber, C.D.O.; Romero, I.D.O. Diseño e Implementación de un Sistema Fotovoltaico Modular Aplicado a la Iluminación Ornamental en la Ciudad de Cuenca. Bachelor’s Thesis, Universidad Politécnica Salesiana Ecuador, Guayaquil, Ecuador, 2021. [Google Scholar]
- Barrientos, C.I. Lógica multivaluada en evaluación de proyectos de inversión. Rev. Investig. Neg. 2023, 16, 51–61. [Google Scholar] [CrossRef]
- Martı, L.M.; Jara, H.P.Q. Gestión de la Demanda Para la Recarga de Vehículos Eléctricos Aplicada a la Regulación Ecuatoriana con Generación Solar Fotovoltaica. Bachelor’s Thesis, Universidad Politécnica Salesiana Ecuador, Guayaquil, Ecuador, 2022. [Google Scholar]
- Viñán, W.M.; Garcı, E.M. Mercados Eléctricos para Nano-Redes Inteligentes. Ing. Compet. 2019, 21, 1–9. [Google Scholar]
- Martı, J.H. Diseño del Sistema Eléctrico de Una Electrolinera Conectada a Red Con Aporte de Energía Solar Fotovoltaica. Ph.D. Thesis, Universitat Politècnica de València, Valencia, Spain, 2022. [Google Scholar]
- Salesiana, U.P. Sede Cuenca se Beneficia de la Planta de Energía Solar Fotovoltaica. 2020. Available online: https://www.ups.edu.ec/noticias?articleId=576914&byid (accessed on 18 July 2024).
- Erick, M.C.G. Análisis Técnico, Económico y Ambiental Para Definir las Condiciones Para la Implementación de Electrolineras, Estudio de Caso en la Ciudad de Azogues. Bachelor’s Thesis, Universidad Politécnica Salesiana Ecuador, Guayaquil, Ecuador, 2023. Available online: http://dspace.ups.edu.ec/handle/123456789/24607 (accessed on 18 July 2024).
- López, D.A. Proyecto de Una Instalación Fotovoltaica Para Autoconsumo Conectada a Red Integrando una Electrolinera Para una Estación Servicio que Consume Anualmente 430 MWh Ubicada en Tébar, Cuenca. Master’s Thesis, Universitat Politècnica de València, Valencia, Spain, 2023. [Google Scholar]


Disclaimer/Publisher’s Note: The statements, opinions and data contained in all publications are solely those of the individual author(s) and contributor(s) and not of MDPI and/or the editor(s). MDPI and/or the editor(s) disclaim responsibility for any injury to people or property resulting from any ideas, methods, instructions or products referred to in the content. |
© 2024 by the authors. Licensee MDPI, Basel, Switzerland. This article is an open access article distributed under the terms and conditions of the Creative Commons Attribution (CC BY) license (https://creativecommons.org/licenses/by/4.0/).