Article

Turbulent Boundary Layer Control with Multi-Scale Riblet Design

Department of Mechanical Engineering, The University of Texas at Dallas, Richardson, TX 75080, USA
*
Author to whom correspondence should be addressed.
Energies 2024, 17(15), 3827; https://doi.org/10.3390/en17153827
Submission received: 22 June 2024 / Revised: 26 July 2024 / Accepted: 26 July 2024 / Published: 2 August 2024
(This article belongs to the Special Issue Computational and Experimental Fluid Dynamics for Wind Energy)

Abstract

:
Motivated by the saturation of drag reduction effectiveness at high non-dimensional riblet spacing in turbulent boundary layer flows, this study seeks to investigate the influence of a secondary blade riblet structure on flow statistics and friction drag reduction effectiveness in comparison to the widely explored single-scale blade riblet surface. The turbulent flow dynamics and drag reduction performance over single- and multi-scale blade riblet surfaces were experimentally examined in a flow visualization channel across various non-dimensional riblet spacings. The shear velocity was quantified by the streamwise velocity distributions from the logarithmic layer via planar Particle Image Velocimetry (PIV) measurements, whereas the near-wall flow dynamics were characterized by a Micro Particle Image Velocimetry (micro-PIV) system. The results highlighted that although both riblet surfaces exhibited similar drag reduction performances at low non-dimensional riblet spacings, the presence of a secondary riblet blade structure can effectively extend the drag reduction region with the non-dimensional riblet spacing up to 32 and achieve approximately 10% lower friction drag in comparison to the single-scale riblet surface when the non-dimensional riblet spacing increases to 44.2. The average number of uniform momentum zones (UMZs) on the multi-scaled blade riblet has also reduced by 9% compared to the single-scaled riblet which indicates the reduction of strong shear layers within a turbulent boundary layer. The inspection of near-wall flow statistics demonstrated that at high non-dimensional riblet spacings, the multi-scale riblet surface produces reduced wall-normal velocity fluctuations and Reynolds shear stresses. Quadrant analysis revealed that this design allows for the suppression of both the sweep and ejection events. This experimental result demonstrated that surfaces with spanwise variations of riblet heights have the potential to maintain drag reduction effectiveness across a wider range of flow speeds.

1. Introduction

The aerodynamic performance of wind turbines is highly influenced by the dynamics of turbulent flows in the near-wall regions across the blade surface. In the last decades, various active and passive flow control methods have been invented and investigated for enhancing the blade’s aerodynamic performance, including air blowing/suction [1,2,3], plasma actuator [4,5], synthetic jet [6,7], slotted airfoil [8,9], phononic materials [10,11,12], and riblets [13,14,15,16,17,18]. Among these flow control approaches, riblet surface treatment, which was inspired by shark skins, has garnered growing attention in recent decades due to its passive nature, low-weight addition, and cost-effectiveness, making it a compelling choice for achieving drag reduction in various applications [19,20,21]. By impeding the translation of streamwise vortices and lifting the vortices off the surface, riblet surface treatments are known to reduce fluid drag within turbulent boundary layers by approximately 10% with an optimal riblet structure design [22,23,24,25,26,27].
Numerous experimental and numerical investigations have been performed to comprehend the working principle and drag reduction (hereafter referred to as DR) effect of riblet surfaces within turbulent boundary layer flows [19,22,23,28,29,30]. Several investigations have linked the DR achieved by riblets to the displacement of streamwise vortices, which are known to contribute to turbulent production, away from the surface and a decrease in their spanwise meandering [31]. Lee et al. [29] employed PIV and PTV to demonstrate riblets’ ability to lift large-scale streamwise vortices and maintain sufficiently a low cross-stream velocity within the valleys, resulting in reduced wall shear stress. A subsequent study by Lee [27], utilizing PIV analysis, illustrated a decrease in small-scale spanwise vortices over riblet surfaces. A Direct Numerical Analysis (DNS) by Goldstein et al. [32] suggested that riblets’ principal beneficiary effect is the damping of cross-flow fluctuations. Similarly, other studies [33,34] concluded that the momentum transport over riblet surfaces is mitigated by impeding the cross-flow, and the strength of streamwise vortices also decreases. The capability of riblet structures to mitigate friction drag is reflected in boundary layer flow statistics. Using the hot wire anemometry and smoke wire technique, Choi et al. [22] observed the upward-shifiting of the mean velocity profile and the growth of the viscous sublayer thickness. Their subsequent work [35] also explained that a riblet surface produces a larger shape factor of the boundary layer, indicating a delayed transition to turbulence. Suzuki and Kasagi [36] reported that the reduction of streamwise vortices leads to a hindrance in the transfer from streamwise to spanwise turbulent kinetic energy. This observation aligns with the mitigation of ejection and sweeping motions over riblet surfaces reported by Choi et al. [33]. Hou et al. [37] demonstrated lower near-wall velocity fluctuations and vorticity strength compared to smooth surfaces via three-dimensional measurements of turbulent flow. A smaller number of prograde vortices and uniform momentum zones over riblet surfaces were observed in recent experimental studies [38,39]. Overall, the drag reduction effectiveness of riblet structures highly depends on a non-dimensional riblet spacing s + = s u τ 0 / ν , where s is the distance between successive riblet tips, u τ 0 is the friction velocity over the smooth surface under the same flow rate, and ν is fluid kinematic viscosity. Bechert and Bartenwerfer [40] and Luchini et al. [41] pointed out that with negligible nonlinear interactions between riblet structures and near-wall flows, the drag reduction ratio is proportional to s + for s + 8 , and the maximum drag reduction is observed at s + 15–20. It is worth noting that although the non-dimensional spacing s + is dominant in determining the optimal riblet design for drag reduction, the riblet geometry also highly influences the near-wall turbulent flow statistics and the associated drag reduction performance. Bechert et al. [23] demonstrated that blade riblets offer a higher level of DR compared to sawtooth, scalloped, and trapezoidal riblets. They further pointed out that the highest drag reduction ratio is achieved when the riblet blade height is half of the riblet spacing. A number of experimental and numerical works have demonstrated that riblets with spanwise converging and diverging arrangements facilitate the control of large-scale turbulence structures in the outer layer [42,43,44,45,46,47].
The mechanism behind the saturation of drag reduction beyond the optimal range of s + remains incompletely understood, primarily due to the complex interaction of near-surface turbulence over riblet structures. One such mechanism involves the relocation of quasi-streamwise vortices (QSVs), which was investigated both experimentally and numerically by Lee and Lee [29] and Martin and Bhushan [48]. At low riblet spacings ( s + < 15 ), QSVs with a diameter of approximately 30 wall units occur solely above riblet structures, interacting only with the protruding tips and impeding momentum transfer. Goldstein and Tuan [49] noted that at larger riblet spacings ( s + > 20 ), QSVs form inside the riblet grooves, which transports additional momentum towards the wall and produces additional drag. With large-spacing riblets, a substantial portion of the riblet surface is influenced by the downward flow produced by the QSVs. Consequently, the friction drag over riblet surfaces can surpass that over smooth walls, resulting in a drag increase (hereafter referred to as DI) at s + > 40 . Another mechanism for DI is linked to the emergence of large-scale spanwise vortical structures related to the Kelvin–Helmholtz (K-H) instability. Due to the influences of the wall-normal velocity fluctuations and flow mixing layer near the riblet tips, K-H rollers can be developed with additional Reynolds stresses and contribute to the drag over blade-shaped riblets. It is worth noting that a recent DNS study with a minimal-span channel approach pointed out that the drag penalty induced by K-H rollers was observed only for large sharp-triangular and blade riblets, whereas this phenomenon was absent for surfaces with blunt-triangular and trapezoidal riblets [50,51,52].
As discussed above, the majority of studies up to date have concentrated on single-scale riblet surfaces with consistent riblet sizes. However, the comprehensive understanding of fluid-surface interactions involving multi-scale riblet designs, which may result from manufacturing imperfections or be intentionally implemented to enhance drag reduction, is still limited. Recent investigations by Endrikat et al. [53] utilizing DNS have demonstrated that multi-scale riblets with half-height trapezoids between primary ones can shift turbulence upwards compared to single-scale trapezoidal riblets, thereby extending the critical s + between drag reduction (DR) and drag increase (DI) regions. Furthermore, the optimal riblet spacing for multi-scale riblets achieves a maximum DR comparable to that of their single-scale counterparts, corroborating the findings of Wong et al. [54]. Wilkinson et al. [55] investigated compound and unconventional riblet geometries, noting an improved turbulence alteration at higher wavelengths but no improvement in DR. Despite these efforts, experimental evidence for the effectiveness of a multi-scale riblet surface in friction drag reduction and the knowledge of its impact on flow statistics across turbulent boundary layer remain lacking. The present study aims to fill this knowledge gap and examine the fundamental interaction mechanisms between turbulent boundary layer flows and multi-scale blade riblet surfaces across a range of non-dimensional riblet spacings. Leveraging the newly developed experimental platform with particle image velocimetry (PIV) measurements of flow dynamics within both the logarithmic layer and near-wall regions, the results highlight the distinctive influence of multi-scale riblet structures in modulating turbulence structures and reducing friction drag in the DI regions in comparison to their single-scale counterpart. This manuscript is organized in the following way: the experimental setup is elaborated in Section 2; results and discussions of drag reduction effectiveness and flow dynamics are presented in Section 3; finally, the limitations and conclusions are summarized in Section 4 and Section 5.

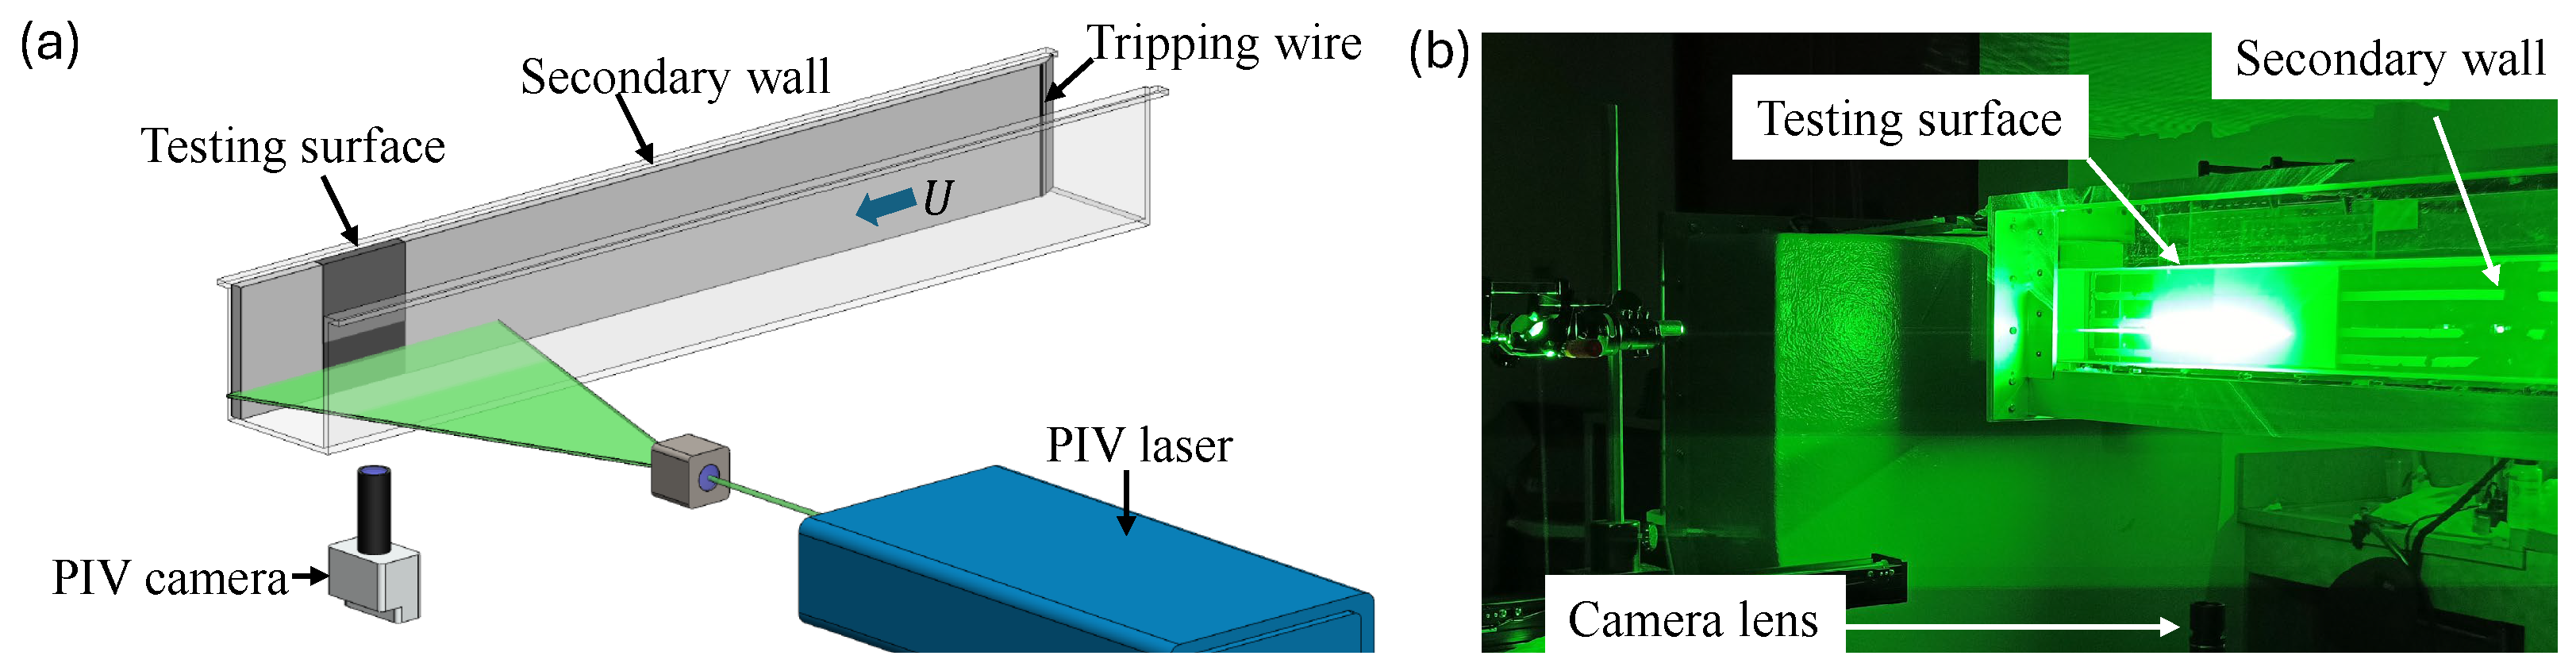
2. Experimental Setup

Experiments were conducted in the water channel at the Fluids, Turbulence Control, and Renewable Energy Lab in the University of Texas at Dallas. This water channel comprises a test section with 2 meters length, 0.2 meters width, and 0.2 meters depth [56,57]. In this work, a secondary wall with a tripping wire fixed at its leading edge was used to generate turbulent boundary layer (TBL) flow. The 200 mm-long testing surfaces were inserted into the secondary wall located 1.5 m downstream of the tripping wire to produce a well-developed TBL flow. The TBL over different riblet surfaces was characterized under four free-stream water flow velocities at U = 0.20 , 0.26 , 0.36 and 0.44 m s−1. Details of the boundary layer thickness δ , friction velocity u τ 0 , friction Reynolds number R e δ = u τ 0 δ / ν , and friction coefficient C f = 2 u τ 0 2 / U 2 at the location of the testing surfaces are illustrated in Table 1. The friction velocity u τ 0 under each U was estimated based on the Clauser method from the logarithmic layer of the velocity profile (see details in Section 3.1).
Three testing samples, including one single-scale blade riblet surface, one multi-scale blade riblet surface, and one smooth surface as the baseline case, were investigated in this work. Both riblet surfaces were fabricated by Bantam Tools desktop CNC milling machine over an acrylic plate with 25 μm tolerance. The single-scale riblet surface was featured with a riblet spacing of s = 2 mm and blade height of h = 1 mm; this riblet design with an optimized h / s = 0.5 allows us to achieve optimal drag reduction performance as demonstrated in previous studies [23,24]. The multi-scale riblet surface shared the same blade height and riblet spacing as the single-scale counterpart, whereas a secondary riblet blade with a height of h s = 0.5 mm was fabricated in the middle of each neighboring primary riblet blade. A photograph of the riblet testing samples and the associated riblet dimensions is presented in Figure 1. Based on the u τ 0 estimated from the TBL, the designed riblet surface produced a wide range of s + [ 20.6 , 44.2 ] (see Table 1), within which the riblet surface was performed from DR to DI regimes. The schematic of this experimental setup is depicted in Figure 2.
The TBL velocity profiles over different surface treatments were quantified by a particle image velocimetry (PIV) system in two scales. This system consisted of a 4MP (2560 × 1600) resolution phantom VEO440 camera, where the flow fields were illuminated by a double-pulsed YLF laser synchronized with the camera. The velocity profiles within the logarithmic layer were captured with 105 mm Nikon lenses, which produced a field of view (FOV) of 130 mm × 81 mm and covered the boundary layer flow within x / δ [ 3 , 6.7 ] and y / δ [ 0 , 2 ] . Here, the origin of the axis was located on the leading edge of the testing sample at the wall surface. In this work, the velocity profile at x / δ = 6 was used to assess the impact of the riblet in modulating the TBL flow. It is worth pointing out that due to the limited distance from the testing sample’s leading edge, the velocity profile in the logarithmic layer may not fully adjust to the near-wall shear stresses produced by the riblets. To further assess the impacts of the riblet surface in modulating near-wall turbulent flow dynamics with a high spatial resolution, an Infinity K2 long-distance microscope was implemented as a micro-PIV system. This micro-PIV measurement had a FOV of 8 mm × 5 mm and focused on turbulent flow statistics within y 0.1 δ . The center of this FOV was located at 6 δ downstream of the testing sample’s leading edge (i.e., same as the flow measurement within the logarithmic layer). For both the logarithmic layer and near-wall flow measurements, 1800 image pairs were recorded at a frequency of 60 Hz. The captured image pairs were used to obtain instantaneous TBL velocities via the INSIGHT 4G software (Version: 11.1.1.0) developed by TSI. The processed flow field led to a vector grid spacing of Δ x = Δ y = 0.41 mm within the logarithmic layer with the 105 mm Nikon lenses, and Δ x = Δ y = 0.06 mm in the near-wall region with the Infinity K2 long-distance microscope. The uncertainty of the flow field measurements was estimated by that of Gaussian fit in the identification of particle locations, which was ∼0.1 pixel. With a bulk particle movement of 8 pixels between two successive images, the overall velocity measurement uncertainty was ∼1.25%.

3. Results and Discussion

The friction drag and flow statistics over different testing samples within the TBL are analyzed in detail in this section. Velocity profiles within the logarithmic layer, the surface friction drag, and the associated large-scale turbulent flow structures are presented in Section 3.1. The near-wall flow statistics via micro-PIV measurements, including Reynolds shear stress, Probability Density Function of velocity fluctuations, and quadrant analysis are detailed in Section 3.2.

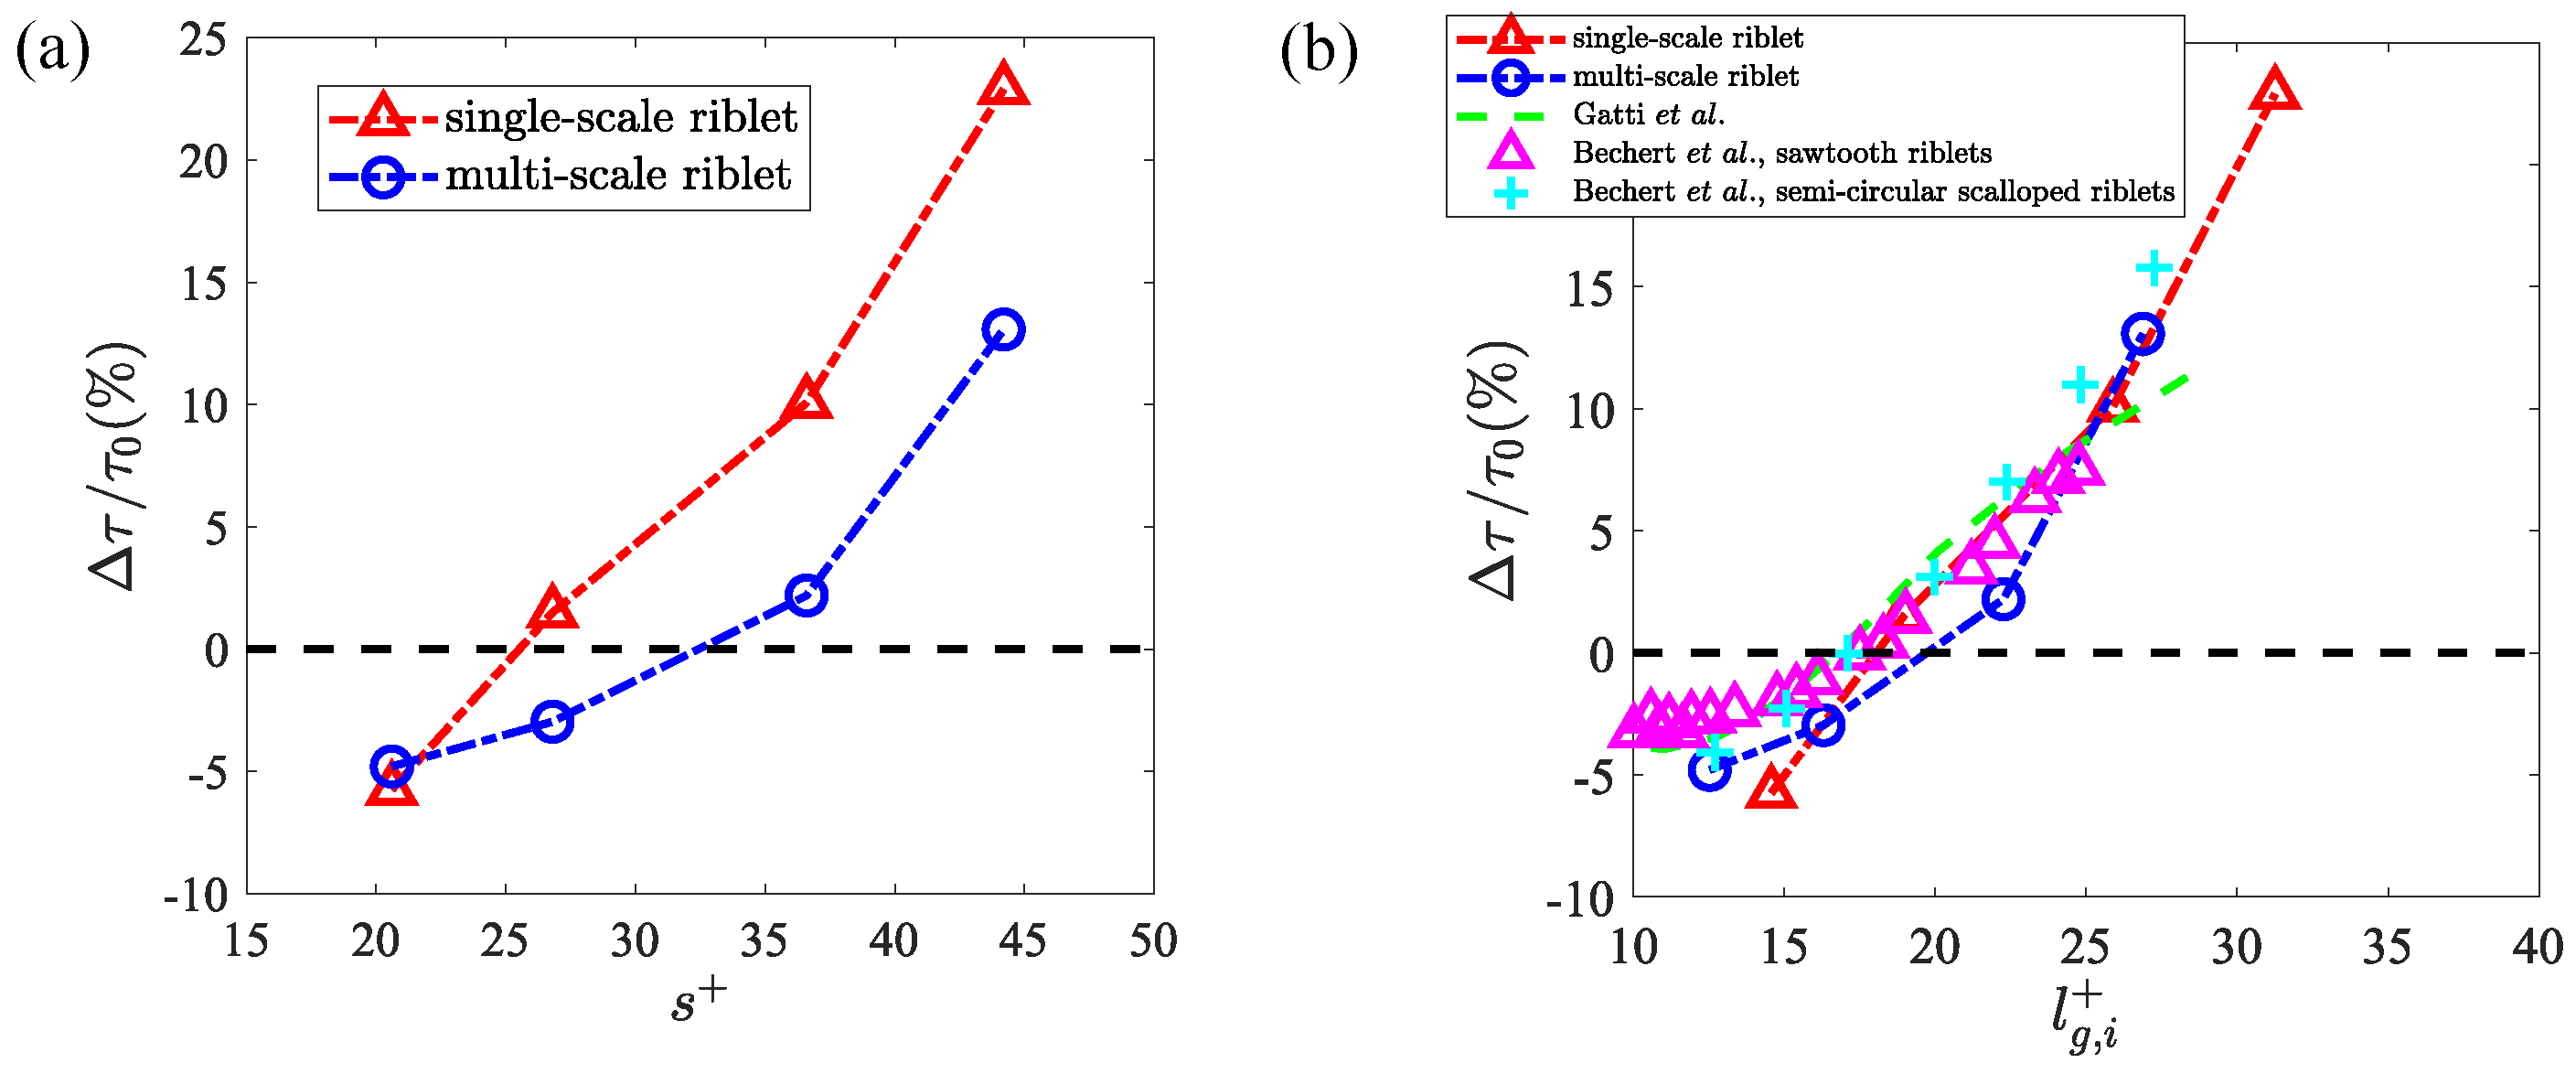
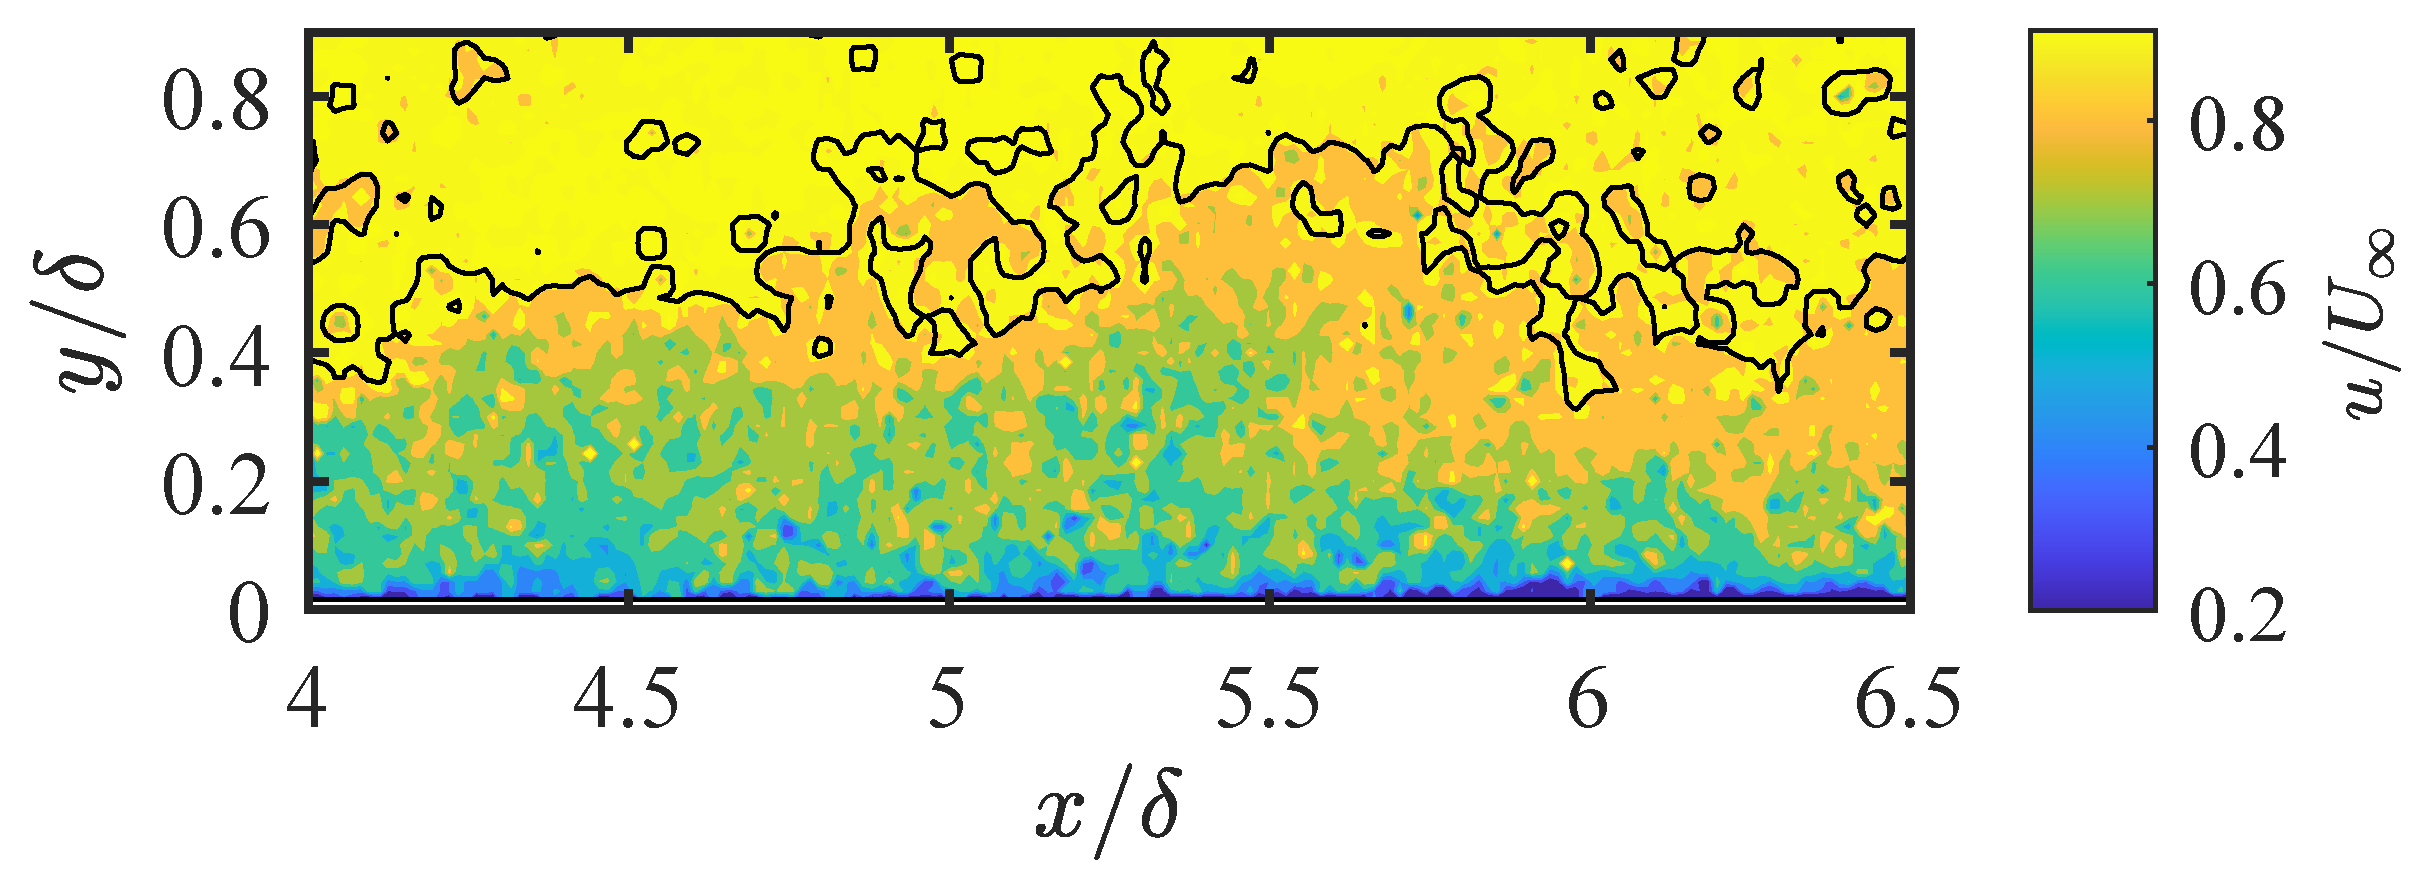
3.1. Drag Reduction Effectiveness and Large-Scale Structures

PIV flow measurements employing the 105 mm Nikon lenses were conducted on all three testing surfaces to ascertain the streamwise velocity profile and determine the associated shear velocity from the logarithmic layer within the TBL. Representative normalized streamwise velocity profiles within 10 y + 300 are shown in Figure 3. Here, the shear velocities u τ corresponding to each velocity profile were calculated using the Clauser method. This method entails estimating the log region slope of the velocity profile by fitting it to a logarithmic equation in the form of
u + = 1 κ ln y + + A Δ U + .
where u + = U / u τ , y + = y u τ / ν , κ is the von Kármán coefficient, A is the log law intercept on the flat surface, and Δ U + is the roughness function. For each configuration investigated in this work, the values of u τ and Δ U + were determined by the least-square fitting of the local velocity profile to Equation (1). It is worth noting that the location of y = 0 for riblet surfaces was determined according to the concept of a virtual origin [23] to facilitate the comparison of velocity profiles between riblets and smooth surfaces. Here, the virtual origin for both single- and multi-scale riblets was estimated utilizing the protrusion height h p with y = 0 located at a distance of h p below the riblet blade tip (see the subplot of Figure 3a). For blade riblets, h p can be determined as [40]
h p = 1 π ln ( 1 + tanh π h s ) s = 0.21 s .
The presence of the secondary riblet structure modifies the boundary layer velocity profiles across s + . In Figure 3a, at the lowest s + = 20.6 , the non-dimensional streamwise velocity u + over both single- and multi-scale riblet surfaces exhibit an upward shift compared to the smooth surface counterpart, which indicates lower u τ and, therefore, a skin friction reduction effect. The growth of s + reduces the scales of near-wall streamwise vortices, where the interactions between TBL flow and riblet surfaces shift from the ‘DR’ to ‘DI’ regions in Figure 3b,c. This phenomenon is clearly reflected via the velocity profiles in the logarithmic layer, where Δ U + (marked in the subplot of Figure 3b) of the single-scale riblet surface increases to 0.55 at s + = 26.8 , and finally reaches 1.7 at s + = 44.2 . While the velocity profiles over the multi-scale riblet surface exhibit a similar trend, the growth rate of Δ U + is lower compared to the single-scale cases. Δ U + = 0.3 remains negative over this surface (and, therefore, retains drag reduction effectiveness) at s + = 26.8 , and at the highest s + = 44.2 , its Δ U + = 1.15 is still lower than that of the single-scale case. The capability of the multi-scale riblet surface in maintaining a smaller growth rate of Δ U + indicates that this design allows us to achieve drag reduction effectiveness across a wider range of s + than the single-scale counterpart.
To further quantify the impacts of multi-scale riblet surfaces in modulating the drag reduction effectiveness, the shear velocity determined by the Clauser method is utilized to calculate the wall shear stress τ = ρ u τ 2 across different s + and testing samples. Then, the percentage of drag reduction is quantified in the form of
D R ( % ) = τ R i b l e t τ 0 τ 0 × 100 .
where τ 0 is the shear stress on the smooth surface. Figure 4a summarizes the drag reduction achieved by both riblet surfaces. At s + = 20.6 , they demonstrate comparable drag reduction capabilities with D R = 5 % . The growth of s + results in the increase in D R over both riblet surfaces, where approximately a 23 % drag enhancement in comparison to smooth surface is observed over the single-scale riblet at s + = 44.2 ; however, this value reduces to approximately 13 % over the multi-scale counterpart at the same s + . It is worth noting that compared to a single-scale riblet surface, the multi-scale one extends the drag reduction region from s + 26 to 32. Indeed, a recent study by Endrikat et al. [53] pointed out that for surfaces with non-uniform riblet designs in the spanwise direction, the dominating parameter that governs their drag reduction performance can be determined by a modified non-dimensional riblet size l g , i + = A g ( 0.5 A g ) ( h s / h ) , where A g is the groove cross-section area. The drag reduction percentage as a function of l g , i + for both single- and multi-scale riblet surfaces are demonstrated in Figure 4b. Overall, the datasets exhibit improved collapsing across l g , i + when compared to the widely used s + . The drag reduction curve also shows good agreements with those reported from previous studies [23,58]. The small discrepancy of drag reduction performance over these two riblet surfaces as a function of l g , i + can be attributed to the estimation of friction drag from the logarithmic layer, whereas the variation of near-wall shear stress may not yet be fully transferred to the flow dynamics in the logarithmic layer due to the relatively short distance from the leading edge of the riblet surfaces to the sample area.
The distinctive impacts of riblet structures also modulate the large-scale flow structures over surfaces. This phenomenon is analyzed via the distribution of uniform momentum zones (UMZs). Figure 5 illustrates an instantaneous normalized streamwise velocity distribution at s + = 44.2 above the smooth surface, where the flow structures are featured by a number of thin layers with a relatively uniform flow within each zone. It is worth noting that the non-turbulent region with u U is not included in the analysis of UMZs. Similar to previous works [59,60], the non-turbulent region is defined by the turbulent/non-turbulent interface (TNTI) marked by the solid black line in Figure 5, where the location of the TNTI is determined by a threshold on the defect in kinetic energy. This approach allows us to highlight the modal velocities at the vicinity of U .
The Probability Density Function (PDF) of a representative instantaneous streamwise flow velocity within a detection window of x / δ [ 5 , 5.7 ] is shown in Figure 6a,b. The modal velocity, which is characterized by the local maximum in the PDF, is highlighted by black arrows. The vertical dashed lines indicate the threshold velocity demarcating each UMZ, which is determined by averaging the neighboring modal velocities. The corresponding instantaneous streamwise velocity fields are presented in Figure 6c,d, where the edges of detected UMZs and the location of TNTI are marked by solid black lines. In general, the detected edges of UMZs highlight the evident change in the streamwise velocity magnitude along the wall-normal direction, which indicates the occurrence of a high local velocity shear. The time-averaged numbers of UMZs (hereafter referred to as N u m z ) above all testing surfaces across various s + and detection window length L x / δ are summarized in Figure 7. For consistency, all the detection window begins at x / δ = 5 . Overall, despite some variation of N u m z as a function of L x / δ , the riblet structures exhibit a distinctive trend in modulating boundary layer flow dynamics. Specifically, at the lowest s + = 20.6 where both riblet surfaces reduce the friction drag (Figure 7a), the mean UMZs are consistently lower than the smooth surface counterpart across various L x / δ values, indicating the reduction in strong shear layers within the TBL. A similar phenomenon was reported in previous experimental works by [38,39] where the decrease in UMZs occurs with drag reduction within TBL. When s + increases to 26.8 (Figure 7b), the single-scale riblet surface starts to lose the drag reduction functionality and produces similar N u m z with the smooth surface. On the other hand, the N u m z of a multi-scale riblet surface remains lower across L x / δ . Finally, at the highest s + = 44.2 (Figure 7c), both riblet surfaces increase friction drag and lead to a higher N u m z in comparison to the smooth surface, whereas the mean value of N u m z averaged across L x / δ for the multi-scale riblet surface is approximately 9 % lower than the single-scale counterpart. The results highlight that multi-scale riblet structures allow us to mitigate the population of shear layers within the TBL and enhance the coherence of turbulent flow structures under a high s + region when compared to traditional single-scale structures, which corresponds to their capability for maintaining drag reduction effectiveness across a wider range of incoming flow speeds shown in Figure 4.

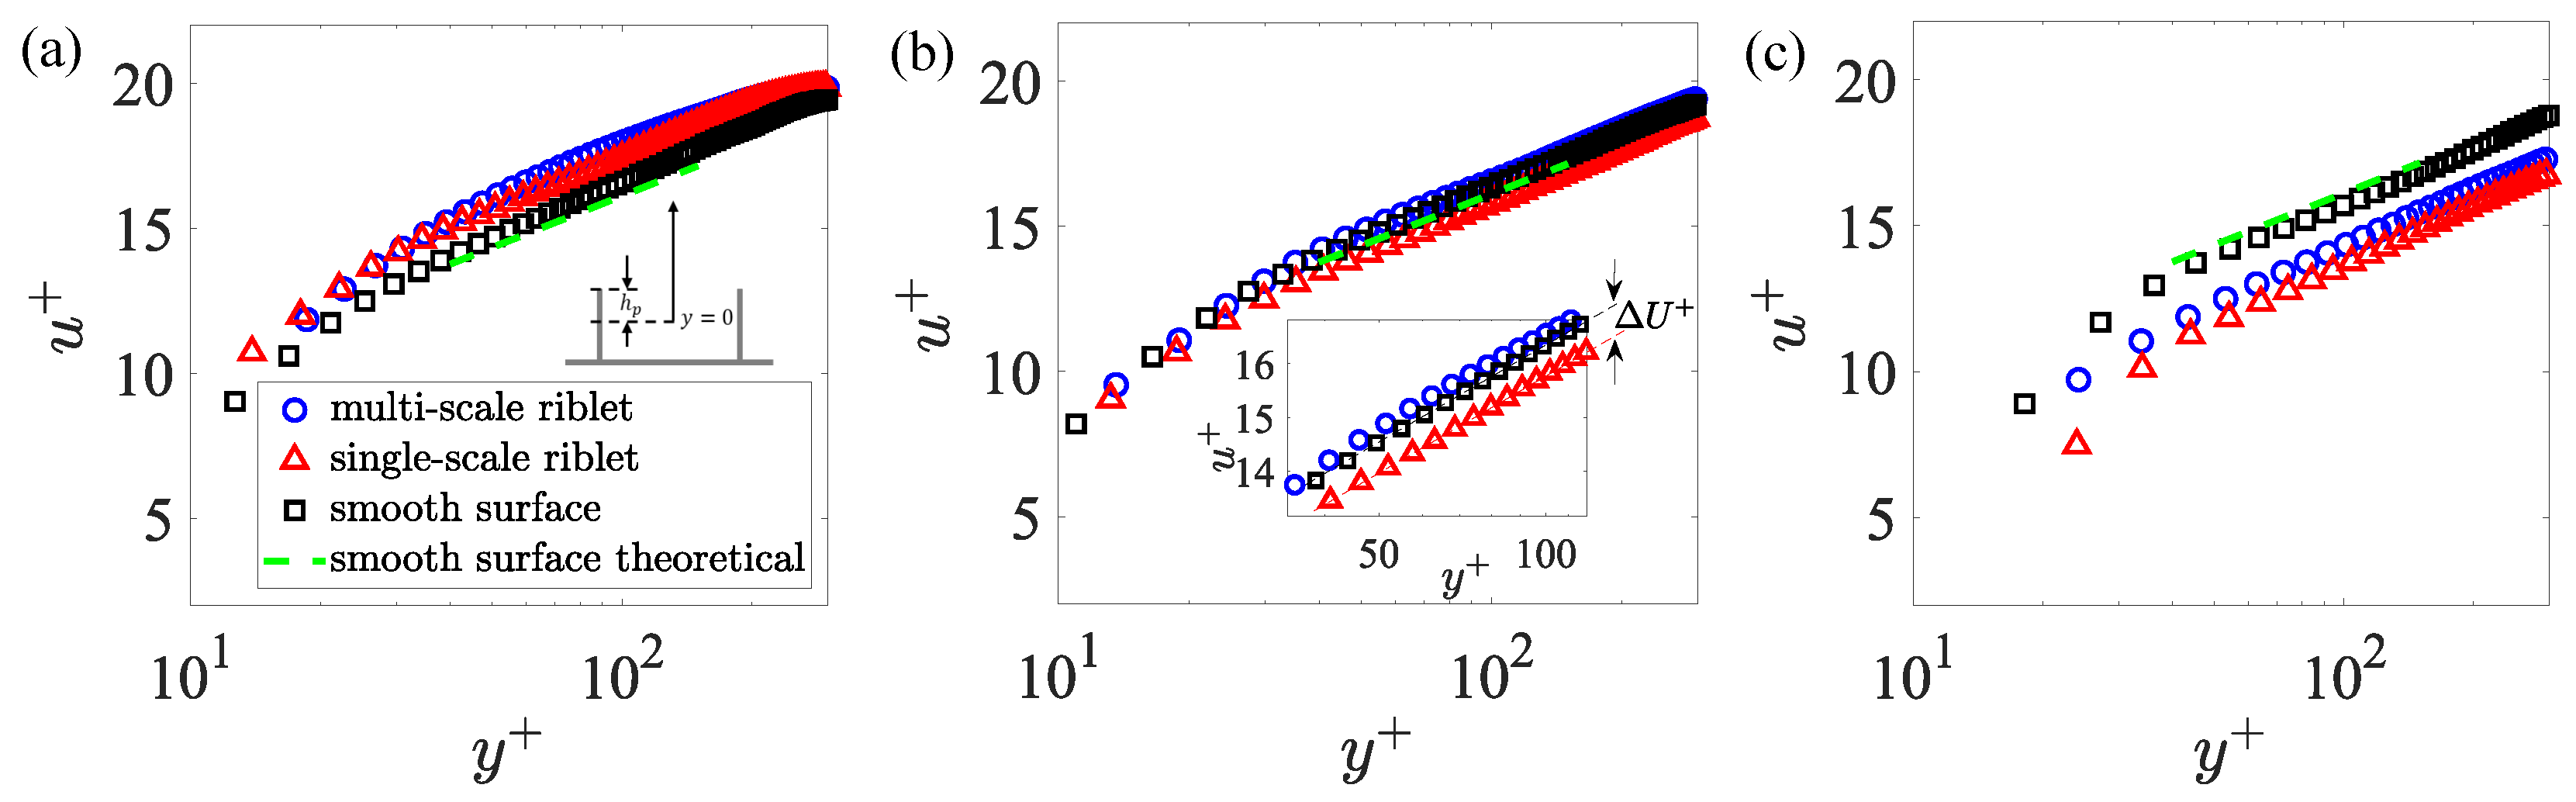
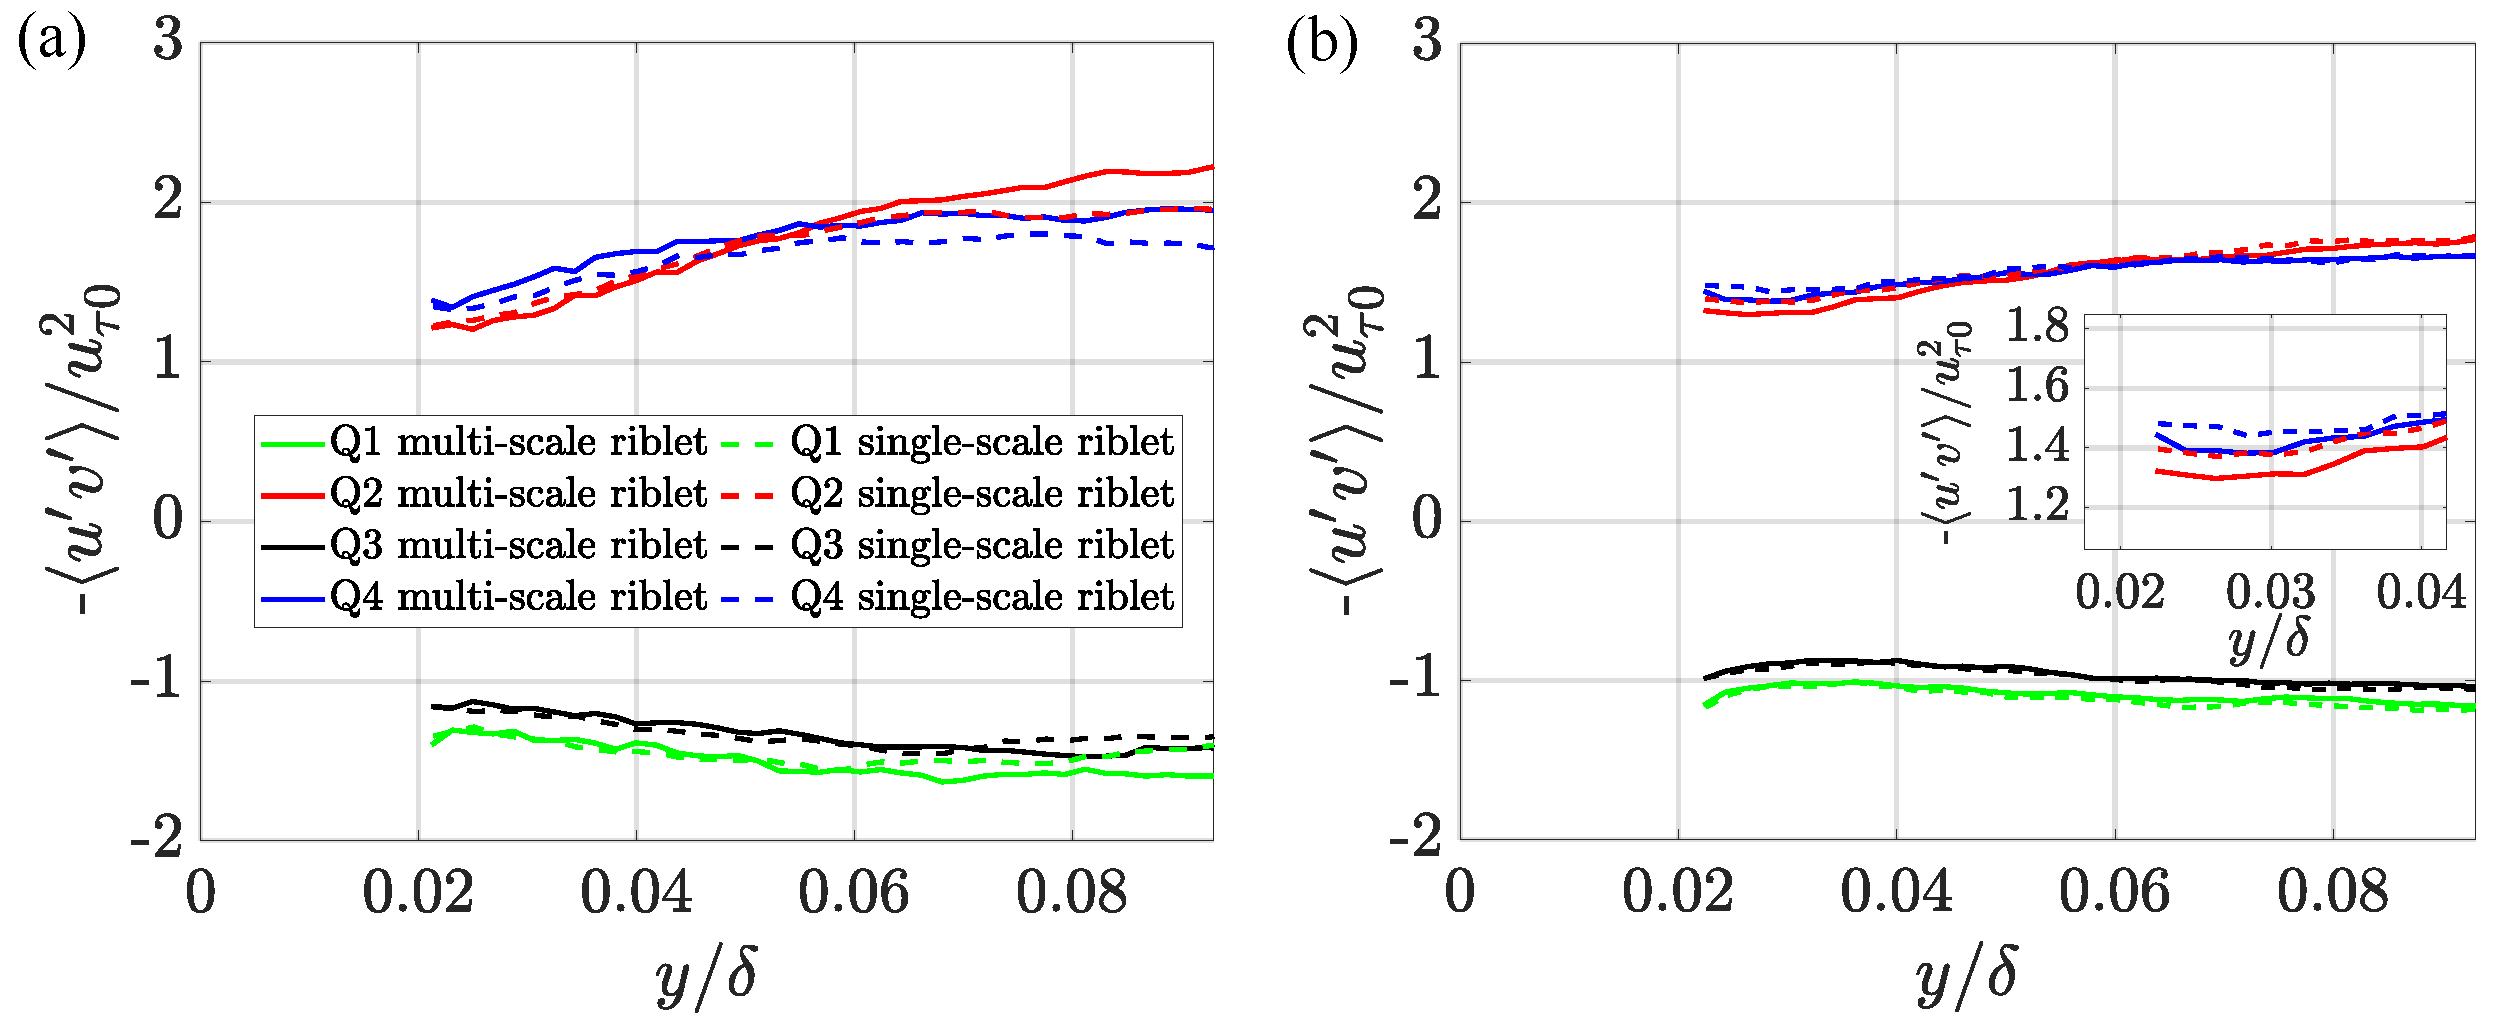
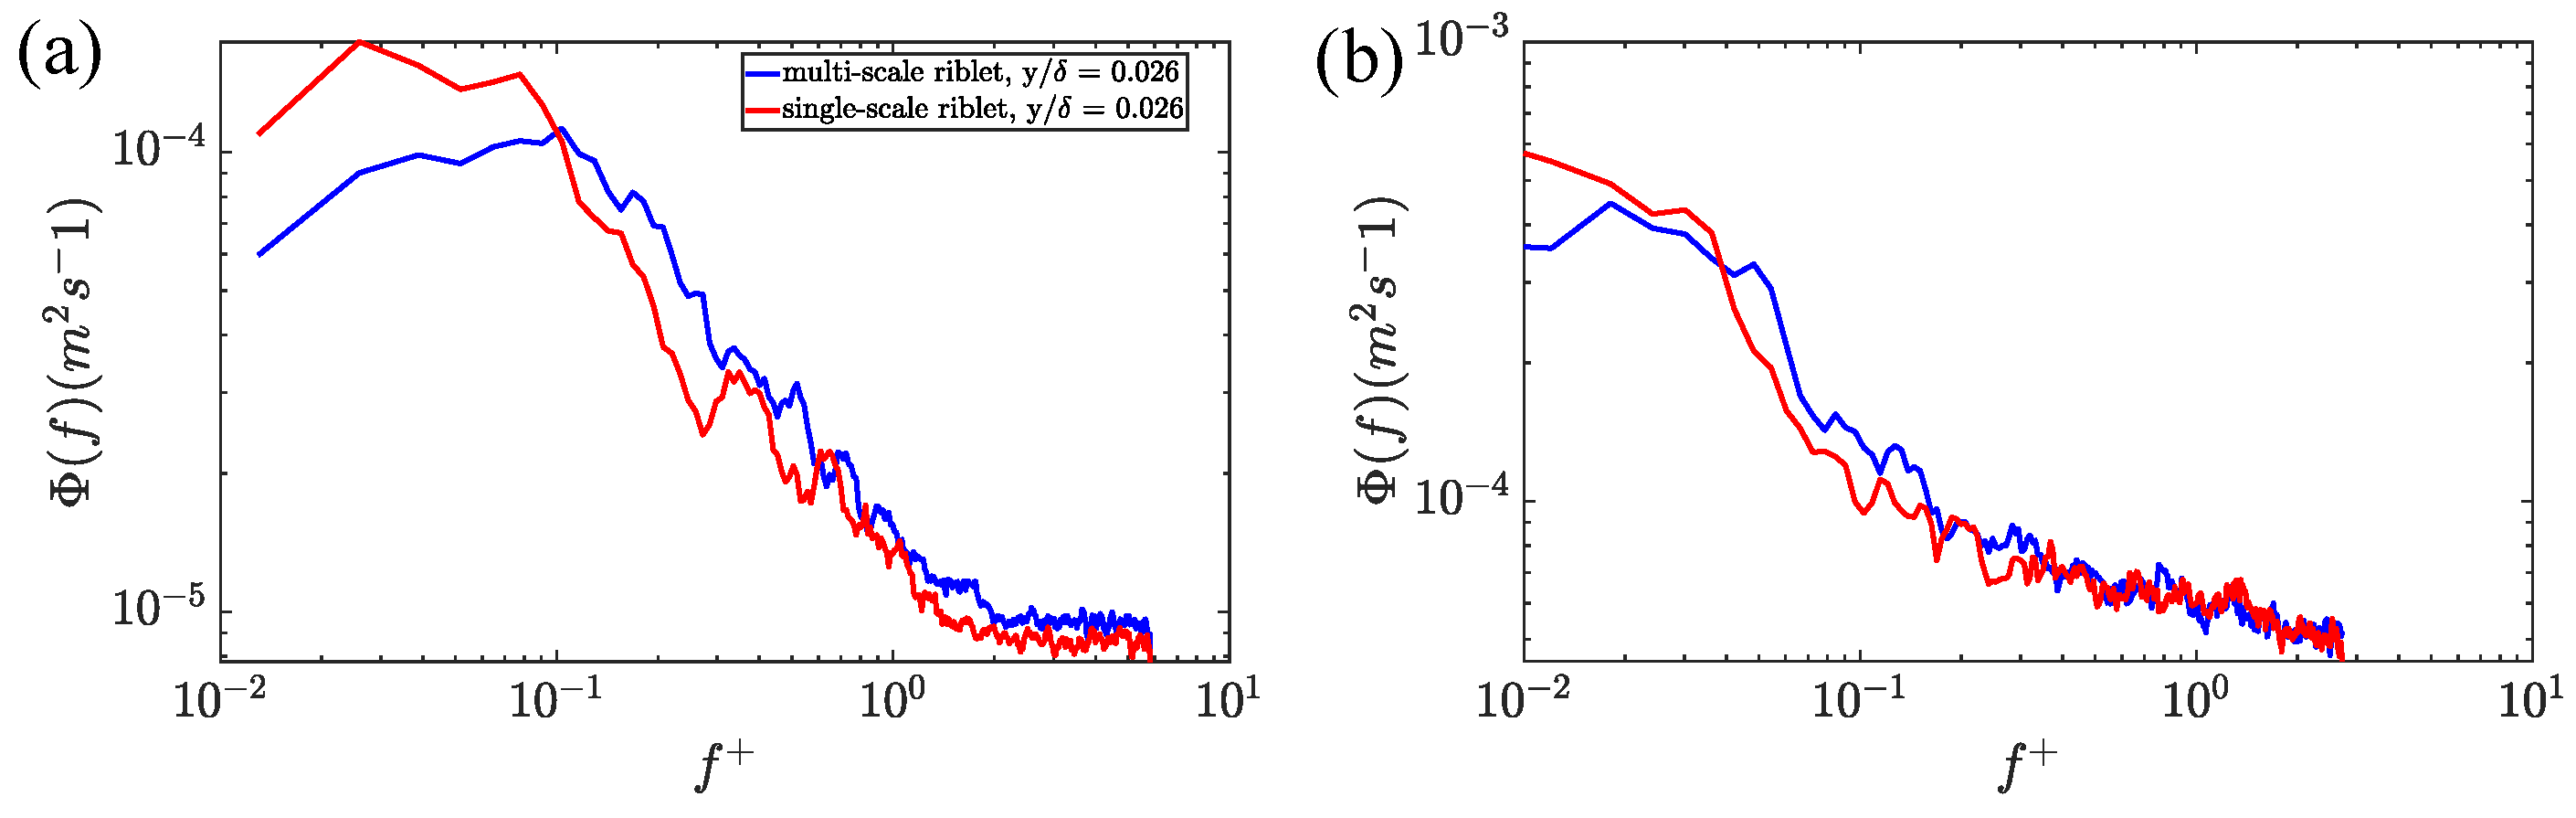
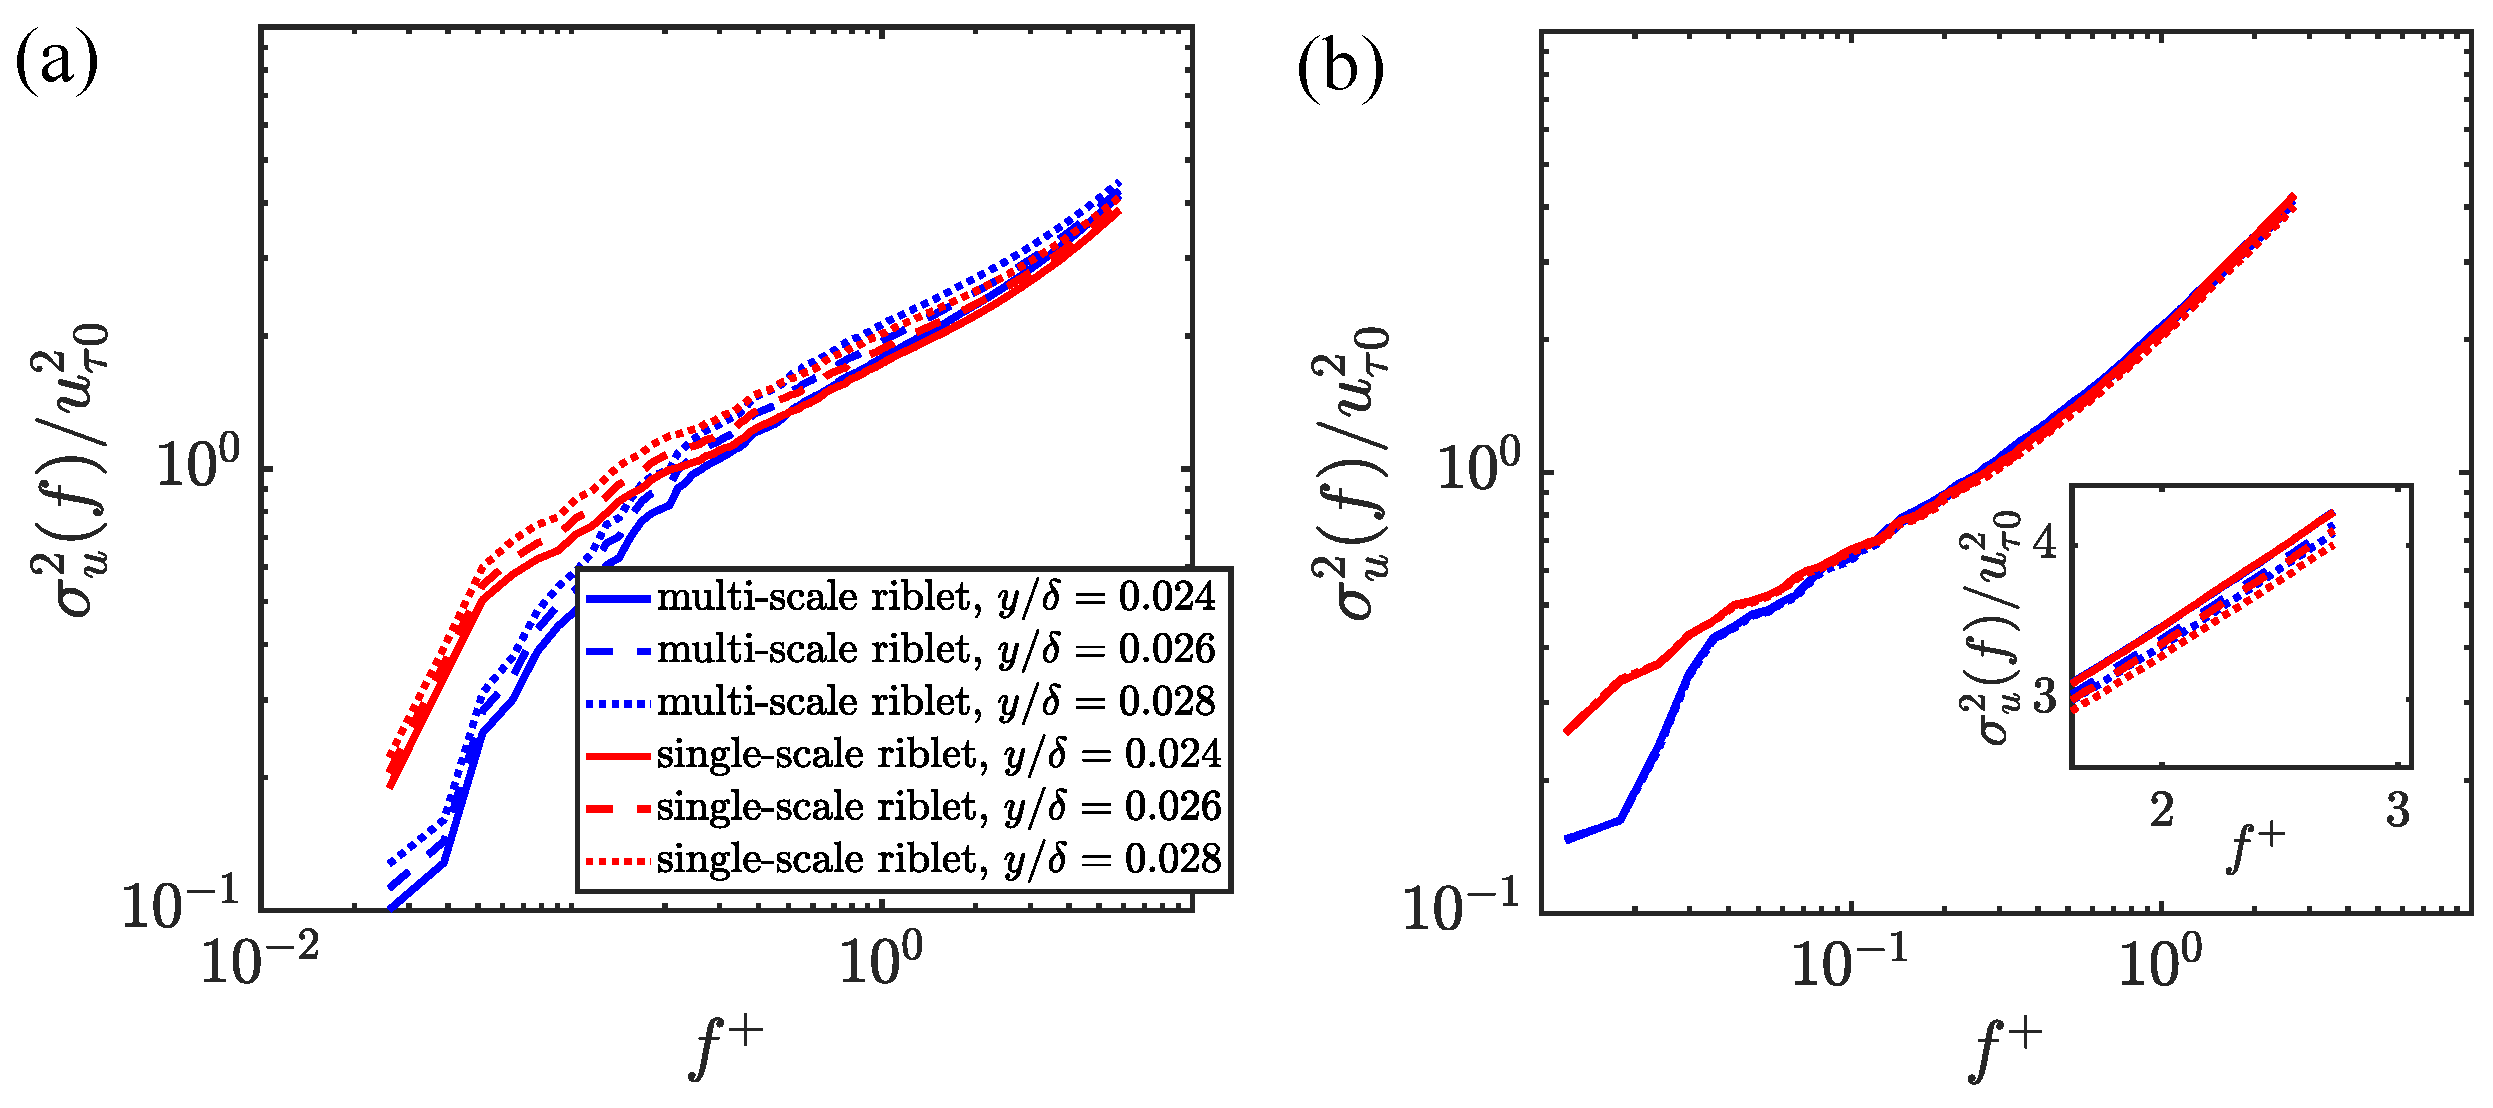
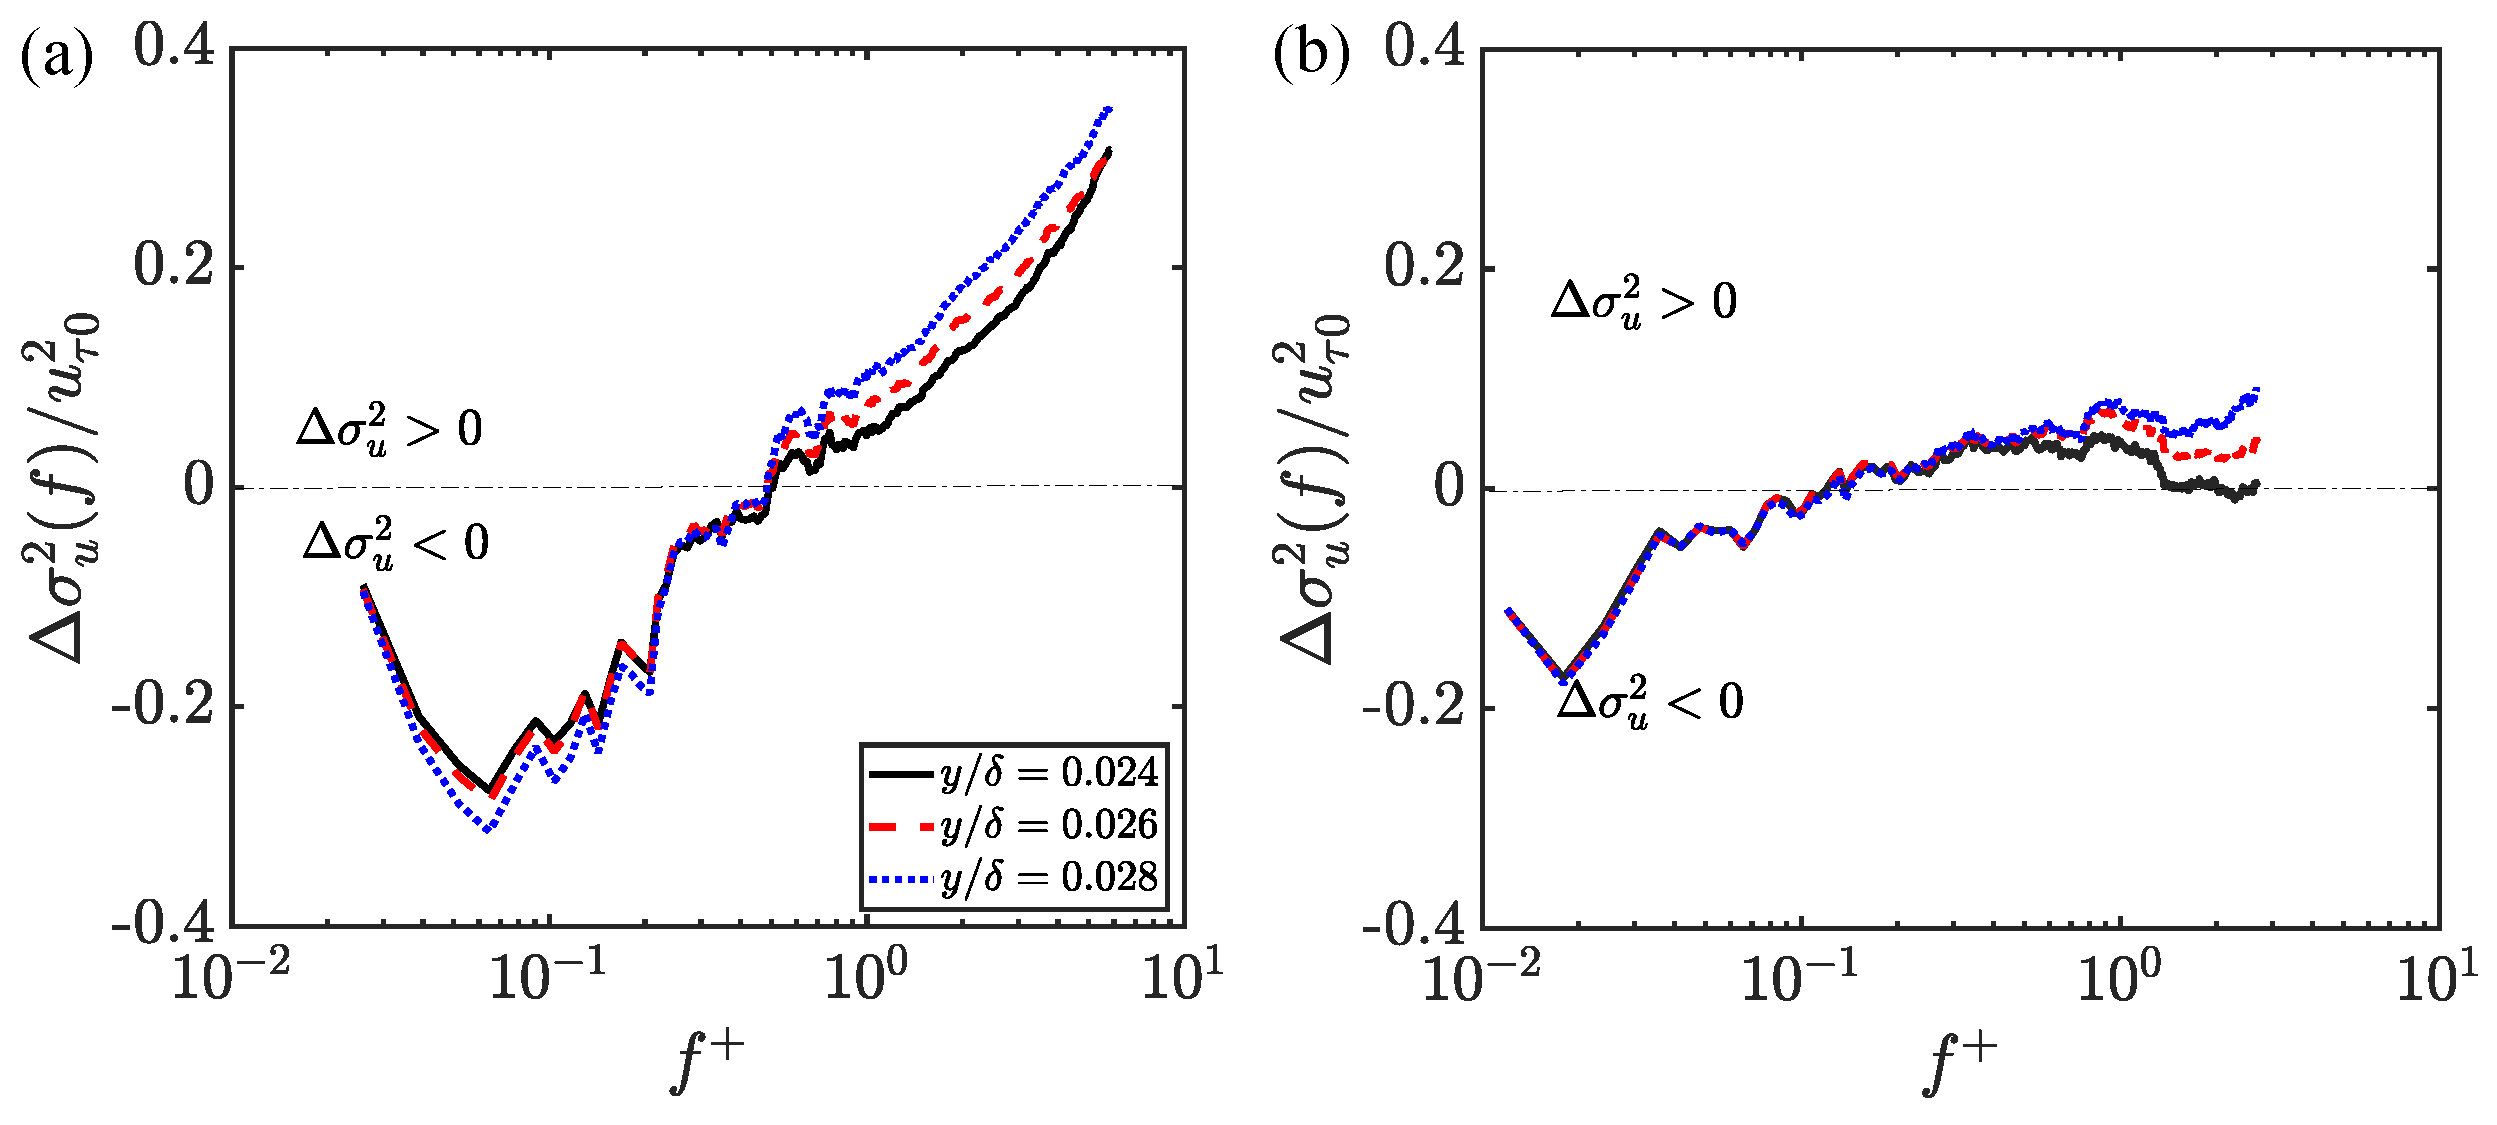
3.2. Near-Wall Flow Dynamics

As discussed in Section 3.1, the secondary riblet blade modulates the TBL in the logarithmic layer and the surface friction drag. To gain deeper insights into the mechanisms underlying the modulation of near-wall flow dynamics by different riblet designs and their correlation with variations in wall frictions, Micro-PIV analysis was performed over both single- and multi-scale riblet surfaces. Specifically, this analysis focused on scenarios with the lowest (i.e., s + = 20.6 ) and highest (i.e., s + = 44.2 ) non-dimensional riblet spacings, where the two riblet designs exhibited distinct drag reduction performances. First, profiles of Reynolds shear stresses are shown in Figure 8. In each plot, the shear stresses are normalized by the shear velocity of the smooth surface u τ 0 determined from the velocity profile in the logarithmic layer as discussed in Section 3.1. It is worth noting that in proximity to the virtual origin, micro-PIV measurements encountered challenges in reliably capturing particle displacement due to the blocking of the riblet blade on the FOV below the riblet tip and laser reflection. Therefore, the profiles of shear stresses are demonstrated within y > 650 μm (i.e., y / δ 0.02 ). The results in Figure 8 illustrate that within the near-wall region, the Reynolds stresses increase monotonically with the wall distance under both riblet surfaces and s + . Specifically, in the DR region (i.e., s + = 20.6 , Figure 8a), both riblet surfaces lead to similar Reynolds shear stresses at y / δ 0.036 , and the multi-scale riblet exhibits higher Reynolds stress levels with the further growth of the wall distance. Note that the Reynolds shear stress reaches close to 0 at y / δ = 0.02 over both riblet surfaces, which corresponds to y + 6 above the virtual origin. A similar phenomenon was also observed in previous studies for the evolution of Reynolds stress in DR scenarios over riblet surfaces [19,51]. On the contrary, when s + increases to the DI region (Figure 8b), the multi-scale riblet demonstrates a lower Reynolds stress at y / δ 0.04 , beyond which both surfaces yield comparable results. The lower near-wall Reynolds stress produced by the multi-scale riblet surface at s + = 44.2 indicates that the existence of the secondary riblet blade mitigates the near-wall velocity fluctuations and dampens the energy of the turbulent flow. This aligns with the conclusion from the logarithmic layer velocity profiles that the multi-scale riblet surface produces a lower friction drag than the single-scale counterpart within the DI region.
To reveal the impacts of multi-scale riblet surface in modulating the near-wall turbulence structures, the streamwise and wall-normal velocity fluctuation intensities, u 2 and v 2 , normalized by u τ 0 , are presented in Figure 9. Here, denotes the time average. Overall, the multi-scale riblet surface produces lower wall-normal velocity fluctuations at the vicinity of the riblet tip at both s + values within y / δ 0.04 . Considering that the intensity of the wall-normal velocity fluctuation is correlated with the streamwise vortices, the reduction in v 2 indicates that the multi-scale riblet mitigates the formation of near-wall streamwise vortices. Meanwhile, the multi-scale riblet surface leads to stronger streamwise velocity fluctuations within the DR region at s + = 20.6 , whereas this discrepancy diminishes in the DI region at s + = 44.2 . The reduction in the difference of u 2 between the two riblet surfaces in the DI region leads to the predominance of v 2 in influencing the Reynolds shear stress, which corresponds to the decreased near-wall u v over the multi-scale riblet surface observed in Figure 8b. It is worth noting that at s + = 20.6 , the profiles of u 2 over both riblet surfaces reach the local maximum at y / δ 0.05 , whereas u 2 exhibits a monotonic decrease with a wall-normal distance at s + = 44.2 . This is attributed to the variation of u τ , which results in different ranges of y + within the investigated flow field. Specifically, at s + = 20.6 , the local maximum of u 2 occurs at y + = 15 ; this phenomenon agrees well with the observations from previous studies that the streamwise velocity fluctuation intensity reaches the maximum in a range of 10 y + 20 [22,27,33,39]. However, when s + increases to 44.2, the minimum y + from the FOV reaches 17, and the local maximum of u 2 is expected to occur at a smaller wall-normal distance from the virtual origin, which is beyond the FOV of this PIV measurement.
Quadrant analysis serves as a valuable tool to further discern the magnitude and correlation between velocity fluctuations in the streamwise and wall-normal components. The delineation into four quadrants—Q1 ( u > 0 and v > 0 ), Q2 ( u < 0 and v > 0 ), Q3 ( u < 0 and v < 0 ), and Q4 ( u > 0 and v < 0 )—offers insights into distinct fluid motions based on the direction of their respective fluctuations. Particularly, quadrants Q2 and Q4 provide crucial indications of ejection and sweep events, which are instrumental in identifying turbulent structures such as hairpin vortices within a turbulent boundary layer. The identification of these quadrants involves conditional averaging of Reynolds stress normalized by the shear velocity of the smooth surface, as illustrated in Figure 10.
The drag-reducing scenario ( s + = 20.6 ) for both single- and multi-scale riblets, as depicted in Figure 10a, reveals that the sweep event dominates in the near-wall region ( y / δ 0.05 ), whereas the ejection event surpasses the sweeping event with the further growth of the wall distance. This observation aligns with findings by Wallace et al. [61], where it was demonstrated that the contributions of the ejection phenomenon exert a more pronounced influence on Reynolds shear stress at a sufficiently high wall-normal distance within the TBL flow. In general, at the near-wall region where the sweeping event dominates, the multi-scale riblet leads to higher sweeping events. This phenomenon is also reflected via the joint Probability Density Function (PDF) distribution of u and v at y / δ = 0.028 in Figure 11a, where the multi-scale riblet surface produces a more dispersed distribution of u in Q4 compared to the single-scale riblet counterpart. Meanwhile, the multi-scale riblet surface produces slightly lower ejection events, which corresponds to its slightly more concentrated distribution of v in Q2, especially for the area of 0.05% probability contour.
The evolution of Reynolds shear stresses along wall-normal distances in each quadrant exhibits an analogous trend to those observed in the DR region when s + increases to 44.2, as shown in Figure 10b. However, the multi-scale riblet surface mitigates the magnitude of both sweep and ejection events, especially in the near-wall region where the sweep event dominates (see subplot of Figure 10b). As shown in the joint PDF of near-wall velocity fluctuations in Figure 11b, the multi-scale riblet results in similar distributions of streamwise velocity fluctuations u but a slightly more concentrated distribution of v in both the v > 0 and v < 0 regions when compared to the single-scale counterpart. This leads to smaller magnitudes of | u v | in both Q2 and Q4 and corresponds to the observed lower Reynolds shear stress (Figure 8) and friction drag (Figure 4) in the DI region.
Finally, to understand the impacts of multi-scale riblets in modulating near-wall turbulent flow dynamics at different scales, the streamwise velocity fluctuations are analyzed in the frequency domain. Figure 12 shows the representative spectra of streamwise velocity at y / δ = 0.026 over both riblet surfaces, where f + = f s / u τ 0 is the non-dimensional frequency. For both DR and DI cases, the power spectra of the single-scale riblet surface are higher in the low frequency domain, which indicates stronger large-scale turbulence structures in the near-wall region. With the growth of f + , the difference in velocity power spectra between two riblet surfaces starts to diminish, and their energy cascade decay exhibits similar trends at a high frequency domain. To further illustrate the influence of the secondary riblet structure on small-scale flow velocity fluctuations, the integrated energy was calculated in a form of
σ u 2 ( f ) = 0 f Φ ( ϵ ) d ϵ
where Φ is the power spectra of streamwise velocity fluctuations. For both the DR and DI cases, the existence of the secondary riblet blade significantly influences the growth of σ u 2 ( f ) as shown in Figure 13. In general, a noticeable reduction in σ u 2 ( f ) in the low-frequency region is observed over the multi-scale riblet surface regardless of whether it is within the DR or DI cases, which corresponds to the smaller Φ ( f ) observed in Figure 12. However, in the high-frequency region, the multi-scale riblet surface exhibits different roles in modulating turbulent flows between DR and DI cases. Specifically, for the DR case at s + = 20.6 , σ u 2 ( f ) over the multi-scale riblet surface surpasses that of the single-scale counterpart at f + 0.4 , whereas for the DI case at s + = 44.2 , the σ u 2 ( f ) over both surfaces exhibits minor discrepancies in this frequency region. Close inspection of the difference between the integrated energy across the frequency domain in Figure 14, Δ σ u 2 ( f ) = σ u , m u l t i 2 ( f ) σ u , s i n g l e 2 ( f ) , demonstrates that Δ σ u 2 ( f ) shifts from negative to positive with the growth of f + for the DR case (Figure 14a) but remains close to 0 in the high-frequency domain when s + increases to the DI region (Figure 14b). This result indicates that the multi-scale riblets can better suppress near-wall small-scale turbulence structures in the DI cases than in the DR cases, which corresponds to its stronger drag reduction effectiveness compared to the single-scale counterpart in the high s + region.

4. Limitations

The experimental measurements with a PIV system at two scales in this work enabled the quantification of flow dynamics through the turbulent boundary layer and the achievement of high-resolution measurements in the near-wall regions. Due to the influence of the laser light reflection and blocking of the riblet blade on the FOV below riblet tips, the flow dynamics close to the virtual origin within the riblet valley was not captured. Meanwhile, the frequency of flow velocity measurement at 60 Hz limited the quantification of very small-scale turbulent vortex dynamics induced by riblet structures. This limitation will be addressed in future studies with the usage of hotwire anemometry in wind tunnel experiments.

5. Conclusions

The study provides new experimental evidence for the influence of multi-scale riblet structures in modulating surface drag reduction effectiveness and turbulent boundary layer flow dynamics within both the logarithmic layer and near-wall regions across different non-dimensional riblet spacings. In the drag-reducing case with a non-dimensional riblet spacing of s + = 20.6 , both riblet surfaces exhibit a similar reduction in skin friction of approximately 5%. However, in the drag-increasing case ( s + = 44.2 ), the multi-scale riblet structure generates 9% fewer uniform momentum zones within the turbulent boundary layer, resulting in an approximately 10% reduction in friction drag compared to the single-scale riblet surface. This finding highlights the capacity of multi-scale riblets in mitigating velocity shears within TBL and achieving improved flow control performance under high non-dimensional riblet spacing conditions. Close inspection of the near-wall flow dynamics reveals that in the drag-increasing case, the multi-scale riblet surface mitigates the intensity of wall-normal velocity fluctuations, which leads to a smaller Reynolds shear stress and, therefore, a smaller friction drag in comparison to the single-scale riblet counterpart. The quadrant analysis of flow dynamics indicates that for the drag-increasing case, the multi-scale riblet surface suppresses both the sweep and ejection events near the riblet surface. Overall, the drag reduction ratio over the multi-scale riblet surface is well quantified by the modified non-dimensional riblet size l g , i + proposed by Endrikat et al. [53] from Direct Numerical Simulations, which exhibits a good consistency with previous studies over single-scale riblet surfaces. This study demonstrates the potential of multi-scale riblet surfaces in reducing friction drag at a high s + region when compared to the single-scale counterpart, which provides insights for enhancing the aerodynamic performance of wind turbine blades with passive flow control approaches. Future investigations will focus on systematic studies on the impact of multi-scale riblet structure geometries on turbulent boundary layer flow dynamics and drag reduction effectiveness.

Author Contributions

M.R.Z.: Conceptualization (equal); Data curation (lead); Methodology (lead); Writing—original draft (lead). N.S.M.: Data curation (supporting); Methodology (supporting). D.B.S.: Methodology (supporting); Writing—original draft (supporting). Y.J.: Conceptualization (equal); Project administration (lead); Supervision (lead); Writing—review and editing (lead). All authors have read and agreed to the published version of the manuscript.

Funding

This paper is based upon work partially supported by the National Science Foundation under award numbers 1916715 and 1916776 (I/UCRC for Wind Energy, Science, Technology, and Research) and from the industrial members of WindSTAR I/UCRC. Any opinions, findings, and conclusions or recommendations expressed in this material are those of the author(s) and do not necessarily reflect the views of the National Science Foundation or the sponsors.

Data Availability Statement

The data that support the findings of this study are available from the corresponding author upon reasonable request.

Acknowledgments

The authors would like to acknowledge the industrial advisory members of the WindSTAR NSF IUCRC for their feedback.

Conflicts of Interest

The authors declare no conflicts of interest.

References

  1. Huang, L.; Huang, P.; LeBeau, R.; Hauser, T. Numerical study of blowing and suction control mechanism on NACA0012 airfoil. J. Aircr. 2004, 41, 1005–1013. [Google Scholar] [CrossRef]
  2. Chng, T.; Rachman, A.; Tsai, H.; Zha, G.C. Flow control of an airfoil via injection and suction. J. Aircr. 2009, 46, 291–300. [Google Scholar] [CrossRef]
  3. Moussavi, S.A.; Ghaznavi, A. Effect of boundary layer suction on performance of a 2 MW wind turbine. Energy 2021, 232, 121072. [Google Scholar] [CrossRef]
  4. Greenblatt, D.; Schulman, M.; Ben-Harav, A. Vertical axis wind turbine performance enhancement using plasma actuators. Renew. Energy 2012, 37, 345–354. [Google Scholar] [CrossRef]
  5. Guoqiang, L.; Weiguo, Z.; Yubiao, J.; Pengyu, Y. Experimental investigation of dynamic stall flow control for wind turbine airfoils using a plasma actuator. Energy 2019, 185, 90–101. [Google Scholar] [CrossRef]
  6. You, D.; Moin, P. Active control of flow separation over an airfoil using synthetic jets. J. Fluids Struct. 2008, 24, 1349–1357. [Google Scholar] [CrossRef]
  7. Tang, H.; Salunkhe, P.; Zheng, Y.; Du, J.; Wu, Y. On the use of synthetic jet actuator arrays for active flow separation control. Exp. Therm. Fluid Sci. 2014, 57, 1–10. [Google Scholar] [CrossRef]
  8. Belamadi, R.; Djemili, A.; Ilinca, A.; Mdouki, R. Aerodynamic performance analysis of slotted airfoils for application to wind turbine blades. J. Wind Eng. Ind. Aerodyn. 2016, 151, 79–99. [Google Scholar] [CrossRef]
  9. Beyhaghi, S.; Amano, R.S. A parametric study on leading-edge slots used on wind turbine airfoils at various angles of attack. J. Wind Eng. Ind. Aerodyn. 2018, 175, 43–52. [Google Scholar] [CrossRef]
  10. Park, S.; Hristov, G.; Balasubramanian, S.; Goza, A.; Ansell, P.J.; Matlack, K. Design and analysis of phononic material for passive flow control. In Proceedings of the AIAA AVIATION 2022 Forum, Chicago, IL, USA, 27 June–1 July 2022; p. 3330. [Google Scholar]
  11. Hussein, M.I.; Biringen, S.; Bilal, O.R.; Kucala, A. Flow stabilization by subsurface phonons. Proc. R. Soc. A Math. Phys. Eng. Sci. 2015, 471, 20140928. [Google Scholar] [CrossRef]
  12. Willey, C.L.; Barnes, C.J.; Chen, V.W.; Rosenberg, K.; Medina, A.; Juhl, A.T. Multi-input multi-output phononic subsurfaces for passive boundary layer transition delay. J. Fluids Struct. 2023, 121, 103936. [Google Scholar] [CrossRef]
  13. Chamorro, L.P.; Arndt, R.; Sotiropoulos, F. Drag reduction of large wind turbine blades through riblets: Evaluation of riblet geometry and application strategies. Renew. Energy 2013, 50, 1095–1105. [Google Scholar] [CrossRef]
  14. Sareen, A.; Deters, R.W.; Henry, S.P.; Selig, M.S. Drag reduction using riblet film applied to airfoils for wind turbines. J. Sol. Energy Eng. 2014, 136, 021007. [Google Scholar] [CrossRef]
  15. Viswanath, P. Aircraft viscous drag reduction using riblets. Prog. Aerosp. Sci. 2002, 38, 571–600. [Google Scholar] [CrossRef]
  16. Modesti, D.; Endrikat, S.; Hutchins, N.; Chung, D. Dispersive stresses in turbulent flow over riblets. J. Fluid Mech. 2021, 917, A55. [Google Scholar] [CrossRef]
  17. Chavarin, A.; Luhar, M. Resolvent analysis for turbulent channel flow with riblets. AIAA J. 2020, 58, 589–599. [Google Scholar] [CrossRef]
  18. Tubije, J.; Jin, Y.; Leonardi, S. Numerical investigation of effects of riblets on wind turbine performance. J. Phys. Conf. Ser. 2024, 2767, 022023. [Google Scholar] [CrossRef]
  19. Park, S.R.; Wallace, J.M. Flow alteration and drag reduction by riblets in a turbulent boundary layer. AIAA J. 1994, 32, 31–38. [Google Scholar] [CrossRef]
  20. Bechert, D.; Hage, W. Drag reduction with riblets in nature and engineering. In WIT Transactions on State-of-the-Art in Science and Engineering; WIT Press: Southampton, UK, 2006; Volume 4. [Google Scholar]
  21. Buttner, C.C.; Schulz, U. Shark skin inspired riblet structures as aerodynamically optimized high temperature coatings for blades of aeroengines. Smart Mater. Struct. 2011, 20, 094016. [Google Scholar] [CrossRef]
  22. Choi, K.S. Near-wall structure of a turbulent boundary layer with riblets. J. Fluid Mech. 1989, 208, 417–458. [Google Scholar] [CrossRef]
  23. Bechert, D.W.; Bruse, M.; Hage, W.v.; Van der Hoeven, J.T.; Hoppe, G. Experiments on drag-reducing surfaces and their optimization with an adjustable geometry. J. Fluid Mech. 1997, 338, 59–87. [Google Scholar] [CrossRef]
  24. Dean, B.; Bhushan, B. Shark-skin surfaces for fluid-drag reduction in turbulent flow: A review. Philos. Trans. R. Soc. A Math. Phys. Eng. Sci. 2010, 368, 4775–4806. [Google Scholar] [CrossRef]
  25. Walsh, M.J. Riblets as a viscous drag reduction technique. AIAA J. 1983, 21, 485–486. [Google Scholar] [CrossRef]
  26. Garcia-Mayoral, R.; Jiménez, J. Hydrodynamic stability and breakdown of the viscous regime over riblets. J. Fluid Mech. 2011, 678, 317–347. [Google Scholar] [CrossRef]
  27. Lee, S.J.; Choi, Y.S. Decrement of spanwise vortices by a drag-reducing riblet surface. J. Turbul. 2008, 9, N23. [Google Scholar] [CrossRef]
  28. Walsh, M. Turbulent Boundary Layer Drag Reduction Using Riblets. In Proceedings of the 20th Aerospace Sciences Meeting, Orlando, FL, USA, 11–14 January 1982; p. 169. [Google Scholar]
  29. Lee, S.J.; Lee, S.H. Flow field analysis of a turbulent boundary layer over a riblet surface. Exp. Fluids 2001, 30, 153–166. [Google Scholar] [CrossRef]
  30. Wang, J.j.; Lan, S.l.; Chen, G. Experimental study on the turbulent boundary layer flow over riblets surface. Fluid Dyn. Res. 2000, 27, 217–229. [Google Scholar] [CrossRef]
  31. Robinson, S.K. Coherent motions in the turbulent boundary layer. Annu. Rev. Fluid Mech. 1991, 23, 601–639. [Google Scholar] [CrossRef]
  32. Goldstein, D.; Handler, R.; Sirovich, L. Direct numerical simulation of turbulent flow over a modeled riblet covered surface. J. Fluid Mech. 1995, 302, 333–376. [Google Scholar] [CrossRef]
  33. Choi, H.; Moin, P.; Kim, J. Direct numerical simulation of turbulent flow over riblets. J. Fluid Mech. 1993, 255, 503–539. [Google Scholar] [CrossRef]
  34. El-Samni, O.; Chun, H.; Yoon, H. Drag reduction of turbulent flow over thin rectangular riblets. Int. J. Eng. Sci. 2007, 45, 436–454. [Google Scholar] [CrossRef]
  35. Choi, K.S. European drag-reduction research—Recent developments and current status. Fluid Dyn. Res. 2000, 26, 325. [Google Scholar] [CrossRef]
  36. Suzuki, Y.; Kasagi, N. Turbulent drag reduction mechanism above a riblet surface. AIAA J. 1994, 32, 1781–1790. [Google Scholar] [CrossRef]
  37. Hou, J.; Hokmabad, B.V.; Ghaemi, S. Three-dimensional measurement of turbulent flow over a riblet surface. Exp. Therm. Fluid Sci. 2017, 85, 229–239. [Google Scholar] [CrossRef]
  38. Guangyao, C.; Chong, P.; Di, W.; Qingqing, Y.; Jinjun, W. Effect of drag reducing riblet surface on coherent structure in turbulent boundary layer. Chin. J. Aeronaut. 2019, 32, 2433–2442. [Google Scholar]
  39. Li, W.; Peng, S.; Xi, H.; Schröder, W. Experimental investigation on the degradation of turbulent friction drag reduction over semi-circular riblets. Exp. Fluids 2022, 63, 190. [Google Scholar] [CrossRef]
  40. Bechert, D.; Bartenwerfer, M. The viscous flow on surfaces with longitudinal ribs. J. Fluid Mech. 1989, 206, 105–129. [Google Scholar] [CrossRef]
  41. Luchini, P.; Manzo, F.; Pozzi, A. Resistance of a grooved surface to parallel flow and cross-flow. J. Fluid Mech. 1991, 228, 87–109. [Google Scholar] [CrossRef]
  42. Wang, H.; Fan, Y.; Yan, Z.; Li, W. Direct numerical simulations of turbulent flow over the converging and diverging riblets. Phys. Fluids 2023, 35, 075121. [Google Scholar]
  43. Koeltzsch, K.; Dinkelacker, A.; Grundmann, R. Flow over convergent and divergent wall riblets. Exp. Fluids 2002, 33, 346–350. [Google Scholar] [CrossRef]
  44. Xu, F.; Zhong, S.; Zhang, S. Statistical analysis of vortical structures in turbulent boundary layer over directional grooved surface pattern with spanwise heterogeneity. Phys. Fluids 2019, 31, 085110. [Google Scholar] [CrossRef]
  45. Xu, F.; Zhong, S.; Zhang, S. Experimental study on secondary flow in turbulent boundary layer over spanwise heterogeneous microgrooves. Phys. Fluids 2020, 32, 035109. [Google Scholar] [CrossRef]
  46. Bai, H.; Gong, J.; Lu, Z. Energetic structures in the turbulent boundary layer over a spanwise-heterogeneous converging/diverging riblets wall. Phys. Fluids 2021, 33, 075113. [Google Scholar] [CrossRef]
  47. Guo, T.; Fang, J.; Zhong, S.; Moulinec, C. Energy-based drag decomposition analyses for a turbulent channel flow developing over convergent–divergent riblets. Phys. Fluids 2022, 34, 025115. [Google Scholar] [CrossRef]
  48. Martin, S.; Bhushan, B. Modeling and optimization of shark-inspired riblet geometries for low drag applications. J. Colloid Interface Sci. 2016, 474, 206–215. [Google Scholar] [CrossRef] [PubMed]
  49. Goldstein, D.; Tuan, T.C. Secondary flow induced by riblets. J. Fluid Mech. 1998, 363, 115–151. [Google Scholar] [CrossRef]
  50. Endrikat, S.; Modesti, D.; MacDonald, M.; García-Mayoral, R.; Hutchins, N.; Chung, D. Direct numerical simulations of turbulent flow over various riblet shapes in minimal-span channels. Flow Turbul. Combust. 2021, 107, 1–29. [Google Scholar] [CrossRef]
  51. Endrikat, S.; Modesti, D.; García-Mayoral, R.; Hutchins, N.; Chung, D. Influence of riblet shapes on the occurrence of Kelvin–Helmholtz rollers. J. Fluid Mech. 2021, 913, A37. [Google Scholar] [CrossRef]
  52. Endrikat, S.; Modesti, D.; Garcia-Mayoral, R.; Hutchins, N.; Chung, D. Only certain riblets experience the Kelvin-Helmholtz instability. In Proceedings of the APS Division of Fluid Dynamics Meeting Abstracts, Virtual, 22–24 November 2020; p. G07-008. [Google Scholar]
  53. Endrikat, S.; Newton, R.; Modesti, D.; García-Mayoral, R.; Hutchins, N.; Chung, D. Reorganisation of turbulence by large and spanwise-varying riblets. J. Fluid Mech. 2022, 952, A27. [Google Scholar] [CrossRef]
  54. Wong, J.; Camobreco, C.; García-Mayoral, R.; Hutchins, N.; Chung, D. A viscous vortex model for predicting the drag reduction of riblet surfaces. J. Fluid Mech. 2024, 978, A18. [Google Scholar] [CrossRef]
  55. Wilkinson, S.; Anders, J.; Lazos, B.; Bushnell, D. Turbulent drag reduction research at NASA langley: Progress and plans. Int. J. Heat Fluid Flow 1988, 9, 266–277. [Google Scholar] [CrossRef]
  56. Bhamitipadi Suresh, D.; Aju, E.J.; Pham, D.T.; Jin, Y. On the incipient sediment suspension downstream of three-dimensional wall-mounted obstacles. Phys. Fluids 2021, 33, 083307. [Google Scholar] [CrossRef]
  57. Aju, E.J.; Gong, P.; Pham, D.T.; Kaushik, K.; Jin, Y. On the wake dynamics and thrust generation of a foil flapping over solid and sedimentary beds. Exp. Fluids 2022, 63, 32. [Google Scholar] [CrossRef]
  58. Gatti, D.; von Deyn, L.; Forooghi, P.; Frohnapfel, B. Do riblets exhibit fully rough behaviour? Exp. Fluids 2020, 61, 81. [Google Scholar] [CrossRef]
  59. Chauhan, K.; Philip, J.; De Silva, C.M.; Hutchins, N.; Marusic, I. The turbulent/non-turbulent interface and entrainment in a boundary layer. J. Fluid Mech. 2014, 742, 119–151. [Google Scholar] [CrossRef]
  60. de Silva, C.M.; Hutchins, N.; Marusic, I. Uniform momentum zones in turbulent boundary layers. J. Fluid Mech. 2016, 786, 309–331. [Google Scholar] [CrossRef]
  61. Wallace, J.M.; Eckelmann, H.; Brodkey, R.S. The wall region in turbulent shear flow. J. Fluid Mech. 1972, 54, 39–48. [Google Scholar] [CrossRef]
Figure 1. Images of the cross-section of the riblets: (a) single-scale riblet design; (b) multi-scale riblet design.
Energies 17 03827 g001
Figure 2. (a) Schematic of the experimental setup and (b) photograph of the PIV measurement in the water channel.
Energies 17 03827 g002
Figure 3. Normalized streamwise velocity profiles over smooth, single-scale, and multi-scale riblet surfaces at (a) s + = 20.6 , (b) s + = 26.8 , and (c) s + = 44.2 . The green dashed line represents the theoretical distribution of the velocity profile for the smooth wall within the ‘log-law region’.
Energies 17 03827 g003
Figure 4. (a) Drag increase curve by single-scale and multi-scale riblet surfaces as a function of s + ; (b) same as (a) but as a function of l g , i + . Experimental data from Gatti et al. (green dashed line) [58] and Bechert et al. (triangles and crosses) [23] are included for comparison. A positive value indicates a net increase in friction drag.
Energies 17 03827 g004
Figure 5. Snapshot of normalized streamwise velocity u / U over a smooth surface at s + = 44.2 superimposed with the outline of the TNTI.
Energies 17 03827 g005
Figure 6. (a,b): PDF of instantaneous streamwise velocity distribution in the detection window of x / δ [ 5 , 5.7 ] over (a) smooth and (b) single-scale riblet surfaces at s + = 44.2 ; (c,d) are the corresponding snapshots of the normalized streamwise velocity u / U superimposed with the edges of UMZ and location of TNTI. The vertical dashed lines indicate the detection window.
Energies 17 03827 g006
Figure 7. Comparison of the mean number of UMZs as a function of the surface treatment and the detection window size at (a) s + = 20.6 ; (b) s + = 26.8 ; (c) s + = 44.2 .
Energies 17 03827 g007
Figure 8. Profiles of Reynolds shear stress over single- and multi-scale riblet surfaces in the near-wall region at (a) s + = 20.6 and (b) s + = 44.2 .
Energies 17 03827 g008
Figure 9. (a) Profiles of normalized streamwise velocity fluctuations over two riblet surfaces at s + = 20.6 ; (b) same as (a) at s + = 44.2 ; (c) profiles of normalized wall-normal velocity fluctuations over two riblet surfaces at s + = 20.6 ; (d) same as (c) at s + = 44.2 .
Energies 17 03827 g009
Figure 10. Amplitude of normalized Reynolds shear stress at each quadrant at (a) s + = 20.6 and (b) s + = 44.2 .
Energies 17 03827 g010
Figure 11. The normalized joint probability density function distribution of streamwise and wall-normal velocity fluctuations at y / δ = 0.028 at (a) s + = 20.6 and (b) s + = 44.2 .
Energies 17 03827 g011
Figure 12. Spectra of near-wall streamwise velocity fluctuations at (a) s + = 20.6 and (b) s + = 44.2 .
Energies 17 03827 g012
Figure 13. Integrated streamwise velocity spectra σ 2 ( f ) over single- and multi-scale riblet surfaces at different heights at (a) s + = 20.6 and (b) s + = 44.2 .
Energies 17 03827 g013
Figure 14. Difference between the integrated energy over two riblet surfaces Δ σ u 2 ( f ) = σ u , m u l t i 2 ( f ) σ u , s i n g l e 2 ( f ) at (a) s + = 20.6 and (b) s + = 44.2 .
Energies 17 03827 g014
Table 1. Characteristic parameters of turbulent boundary layers under various values of U .
U (m s−1) δ (mm) u τ 0 (m s−1) s + R e δ C f
0.2032.400.010320.63340.0053
0.2631.900.013426.84270.0053
0.3630.350.018336.65550.0052
0.4430.760.022144.26860.0051
Disclaimer/Publisher’s Note: The statements, opinions and data contained in all publications are solely those of the individual author(s) and contributor(s) and not of MDPI and/or the editor(s). MDPI and/or the editor(s) disclaim responsibility for any injury to people or property resulting from any ideas, methods, instructions or products referred to in the content.

