1. Introduction
The global Wind Turbine (WT) installed capacity is rapidly increasing, driven by government and private investments to decarbonize the energy sector. The technological maturity of WT design and manufacturing has been pushing down their Levelized Cost of Energy (LCOE), thus contributing to consolidating this renewable source in the global energy mix [
1]. Enhanced Operation and Maintenance (O&M) strategies contribute to achieving high availability and reliability and an overall cost-effective operation. Manufacturers, operators, analysts, and maintenance practitioners work to ensure WTs fulfill their objectives correctly and in the long term [
2].
Optimal O&M strategies include decision-making and planning guided by the continuous monitoring of the WT health condition. These strategies aim at limiting abnormal or faulty conditions and, as a result, minimize production losses and maintenance expenditures. This subject is within the scope of Performance Monitoring (PM) [
3], Condition Monitoring (CM) [
4], detection and diagnosis of abnormal conditions [
5], Condition Based Maintenance (CBM) [
6], and Prognosis and Health Management (PHM) [
7]. These analyses of a system’s health condition involve identifying and characterizing abnormal, degraded, or faulty conditions.
The WT health condition analyses aim to provide actionable information from measured data, especially from the Supervisory Control and Data Acquisition (SCADA) system [
8,
9]. Modern WTs’ SCADA system embeds dozens of sensors measuring geometrical, kinematic, thermal, and electrical variables [
10]. SCADA data-based analyses of the WT health condition have an intrinsic and sometimes overlooked challenge: the imbalance of datasets, with significantly more data representing the healthy condition than abnormal or degraded states. This imbalance toward the healthy condition is related to the high availability and reliability of modern WTs, with typical availability ranging over 95% [
11].
The SCADA data imbalance can hinder data-driven analyses, as highlighted in the review papers listed in
Table 1. These reviews highlight that classical imbalance-unaware approaches tend to be biased toward the majority class (healthy data), leading to poor representation of the minority classes (degraded or faulty conditions). According to reviews from
Table 1, the SCADA data imbalance is due to multiple factors. Moreover, addressing the imbalanced SCADA data is necessary to improve the accuracy of wind turbine data-based fault detection, diagnosis, and prognosis.
Supervised and unsupervised models require different strategies when dealing with imbalanced data. Indeed, supervised learning requires a deeper characterization of the data before the model training, while unsupervised models integrate some level of representation learning [
18]. Pandit et al. [
19] highlight that most of the data-driven techniques for WTs are regression and classification, which are supervised learning models. Nevertheless, labeling complex data is costly, time-consuming, and influenced by experts’ sensitivity. Labeling the SCAD data is particularly challenging due to its high dimensionality and the large number of WT operational states [
20]. Emerging research on unsupervised learning models aims at overcoming the need for SCADA data labeling [
21].
The research addressing the impact of SCADA data imbalance in data-based approaches is still limited and often overlooked. To our knowledge, no previous literature review has specifically addressed the problem of SCADA data imbalance in the context of WT health condition analysis. Filling this gap is the primary motivation for the present review. It also includes the following contributions:
Characterization of WT SCADA data imbalance and its impact on various WT health condition analyses such as detection, CM, diagnosis, and prognosis;
Review of the strategies used to deal with data imbalance in a general context;
Presentation of previous WT health condition analyses. The reviewed papers are organized according to the strategies to address the SCADA data imbalance.
The present review is organized as follows:
Section 2 presents the data imbalance problem in a general framework. Then,
Section 3 characterizes specifically the SCADA data imbalance.
Section 4 reviews the methods dealing with SCADA data imbalance.
Section 6 summarizes the findings and outlines future directions in WT health condition analyses.
2. The Class Imbalance Problem Across Multiple Application Domains
The imbalance of datasets impacts diverse application domains. Strategies to deal with data imbalance constitute a very active research topic, mainly because of the recurrence of this condition in real-world problems and its impacts. Data imbalance has implications in tasks such as anomaly detection, classification, diagnosis, and prognosis [
22,
23,
24,
25,
26,
27,
28,
29,
30].
2.1. Characterization of Imbalanced Datasets
Characterizing the severity of the imbalance is important for choosing suitable methods and correctly evaluating its performance. The poor performance of imbalance-unaware classification approaches is due to three main factors: (i) Lack of minority class data when the corresponding datasets are too small, (ii) overlapping between majority and minority classes, and (iii) minority classes with complex behavior [
24].
The class imbalance can be in a two-class problem or a multi-class problem, as depicted in
Figure 1b and
Figure 1c, respectively. The latter eventually includes different levels of data imbalance, as depicted in
Figure 1d. The imbalance ratio measures the level of class imbalance. It can be defined as the ratio of the number of data points in the majority class to those in the minority class (majority class number of points:minority class number of points) or the ratio between the datasets’ duration (duration covered by the majority class dataset:duration covered by the minority class dataset) [
24,
26].
The literature distinguishes two levels of information in multiple class systems: within-class information and between-class information [
16]. Within-class information refers to the distribution of data points belonging to each particular class, be it the healthy condition dataset or a degraded condition dataset. Such characterization involves understanding the system behavior within a given class. On the other hand, between-class information is about the relationships and differences between classes. The clustering of different datasets can give indications of relative dispersion and eventual intersections between the corresponding classes. The scarcity of the minority class can hinder the characterization of within-minority-class information. Assuming enough points are available for each dataset of interest, the issue of data imbalance impacts mainly the between-class information [
16].
2.2. Categories of Strategies for Addressing Data Imbalance
Multiple strategies aim to address data imbalance, notably Normal Behavior Models (NBMs), data-level strategies, algorithm-level strategies, cost-sensitive learning, data augmentation techniques, and transfer learning.
Table 2 describes the different classes of balancing strategies and their advantages and disadvantages. The difference between these strategies mostly relates to how they tackle between-class and within-class information [
24].
The choice of an adequate strategy to deal with the data imbalance requires assessing the properties of the interest datasets and delimiting the goal of the analysis. The possibility of labeling an imbalanced dataset is an important criterion. NBMs, data-level approaches, and cost-sensitive learning might require labeled datasets. An unsupervised approach should be prioritized if data labeling costs are impeditive for a given system or application.
Section 4 of the present review analyzes the strategies addressing the SCADA data imbalance.
2.3. Performance Metrics for Imbalanced Data
The problem of data imbalance requires special attention when selecting classification performance metrics. Model training based on classical evaluation criteria such as accuracy can lead the model to ignore the minority class entirely. For instance, classification accuracy may be high even when the minority class is completely misclassified. For example, given a two-class dataset with a 1:100 imbalance ratio, a classifier would obtain a 99% accuracy by simply categorizing all instances as the majority class.
Modeling imbalanced datasets requires performance metrics focusing on the minority class, typically precision, recall, F1-score, and negative predictive value [
37]. The classification task is usually performed on an extensive set of reference case studies to evaluate its performance. In the confusion matrix, each classification is compared against the actual class and counts as true positive
, true negative
, false positive
, or false negative
. The main performance metrics are presented below for context [
37].
Precision, also known as the positive predictive value (
):
Recall, also referred to as sensitivity or true positive rate (
):
The
-score balances precision and recall, and is generalized by the
score given by Equation (
4), where
weights the importance between precision and recall. The choice of
(
-score) gives equal importance to the two metrics.
Negative Predictive Value (
), as given in Equation (
5)
Other metrics can be found in the literature addressing imbalanced datasets. The Receiver Operating Characteristic curve (ROC) plots the True Positive Rate (y-axis) against the False Positive Rate (x-axis). The Area Under Curve (AUC) derives a scalar metric for the ROC plot [
38]. The Geometric mean (G-mean) evaluates the balance between classification sensitivity and specificity [
12]. The Matthews Correlation Coefficient (MCC) is a robust metric that takes all elements of the confusion matrix into account [
12].
3. SCADA Data Imbalance and Its Impact on Wind Turbine Health Condition Analyses
Obtaining actionable insights from the raw SCADA data involves multiple steps, including data acquisition, preprocessing, and handling of its imbalanced nature.
3.1. SCADA Data Acquisition and Preprocessing
The SCADA system consists of multiple sensors measuring geometrical, kinematic, thermal, and electrical variables. The set of sensors includes anemometers, wind vanes, pressure sensors, RPM sensors, voltage sensors, current sensors, power sensors, and position sensors, as well as temperature sensors positioned in various locations: ambient temperature, nacelle, main bearing, gearbox, generator, generator bearings, cabinets, cooling systems, pitch systems, blades, and the tower. The SCADA data can be used to analyze the WT health condition because degradation modes on WT components have signatures in the SCADA measures.
Table 3 indicates potentially informative measures for some kinds of WT degradation.
The SCADA system aggregates measures acquired by its sensors as float-values time series with a 10 min time step. Each value is the mean of the measured signal over 10 min intervals. The 10 min aggregation industrial standard suits performance monitoring of WTs and spare storage and computational resources [
3]. Eventually, the SCADA system also stores other 10 min statistics such as maximum value, minimum value, and standard deviation [
52].
Moreover, the SCADA system produces log files listing messages about the WT status, including error messages, exceptions to nominal functioning, control protocol messages, fault codes, warnings, and alarms. These SCADA status messages are produced mostly by built-in threshold-based CM and safety protocols. For example, persistent overtemperature at critical components (e.g., main bearing, gearbox, generator, critical cooling systems) could trigger a shutdown protocol, and the SCADA system would record this succession of events in the SCADA log files [
53]. In addition, O&M reports manually filled by maintenance practitioners are available for some wind farms. The existing entries can complement status information from the SCADA log files.
For a given WT, the availability of SCADA data depends on the sensors embedded within the SCADA system and is subjected to contractual constraints between the WT manufacturer and operators. The SCADA time series may be accessed by analysts directly from the SCADA system but are more likely provided once the data have flowed through different steps of the data pipeline. The SCADA system time series can present data quality issues due to sensor defaults and data transmission issues. In practice, a combination of preprocessing steps is implemented to eliminate these data quality issues and prepare the data for the targeted approaches. Different kinds of analysis require different preprocessing steps [
9]. Selecting appropriate preprocessing steps is paramount, given it can influence the health analysis outcome [
54].
SCADA data preprocessing steps include filtering out inconsistent values, filtering specific operational conditions, normalization, correlation analysis, feature engineering, data imputation, sliding overlapping time segmentation, and labeling [
8]. Filtering out inconsistent physical measures, non-numerical values (
NaN reading), and nonexistent entries (
None) is among the first of the SCADA data preprocessing steps. Typically, the percentage of SCADA data concerned by this step remains below 3% [
54]. Normalization techniques should be chosen according to the modeling approach. For example, Min-Max normalization is suitable for Deep Neural Networks (DNN) models. Statistics can be performed over large SCADA databases to estimate lower and upper bounds for the normalization.
Table 4 illustrates such a definition for a large North American wind farm comprising over a hundred 1.84 MW-rated power WTs [
55].
Correlation analysis and feature engineering allow for defining features with high informative power for a given analysis [
56]. Works from diverse domains report that selecting highly informative features enhances the overall performance of DNN models [
57].
Analyses based on time series often consider run-to-failure scenarios. In such cases, depending on the hypothesis for the degradation mode, data imputation can be used to complete missing data; sliding overlapping time segmentation allows for producing samples [
58]. On the other hand, in analyses based on models trained with datasets regardless of the timeline, it is common practice to filter out data points corresponding to the WT at conditions that bring very little or no information, such as standby and shutdown modes [
55]. The WT standby mode may be due to wind speed outside the operational interval or because of grid control requirements. The WT shutdown protocol can be triggered for reasons such as extreme weather conditions and inside-nacelle interventions [
59].
Approaches comprising supervised or semi-supervised learning require labeling the datasets. Information from the SCADA log files and O&M reports can guide the labeling of datasets. Indeed, these textual data identify abnormal operating conditions with the respective time intervals. Data points and time series can be selected within the reported intervals.
3.2. Imbalanced SCADA Data
The SCADA data imbalance can be analyzed at three levels: imbalance between healthy and degraded datasets, imbalance between different degradation classes, and imbalance due to the scarcity of degraded data points in newly commissioned wind farms.
The predominance of the healthy condition data over degraded condition data is a positive outcome, as it indicates that wind turbines operate mainly in healthy conditions. The high cost of wind turbines makes preventive or systematic maintenance strategies better suited than curative repairs. In practice, this choice of more conservative maintenance strategies implies that any confident evidence of abnormal conditions would motivate the operators to take prompt action, e.g., curtail or shut down the WT, making run-to-failure instances rare.
SCADA data are also imbalanced within the minority classes, as most data points for cost-critical issues relate to only a few abnormal conditions [
17,
60]. Based on an extensive database with a total of 35,000 WT component failure events from over 13 years of operation of 1400 large onshore pitch-controlled WTs, Santelo et al. [
61] estimated that 80% of maintenance costs are associated with just 20% of the components.
The database’s acquisition period influences the class imbalance, with shorter acquisition periods potentially lacking data points for most of the degraded conditions. This shortcoming might limit some analyses on newly commissioned wind farms. The acquisition of data within the wind farm lifetime allows for the characterization of diverse operation conditions, including much less frequent degradation modes. In practice, to analyze a newly commissioned wind farm, operators and analysts can overcome the scarcity or absence of data by analyzing the historical degradation of the specific WT model or a similar configuration [
17]. For instance, the health condition analyses might target recurrent degradation conditions within the historical data, which indicates flaws in the WT model [
62].
The combination of the factors mentioned in this section implies the imbalance ratio of SCADA datasets depends on each wind farm’s characteristics and operational history. To illustrate the order of imbalance ratio, we considered SCADA data covering two years of operation of the abovementioned North American wind farm [
55].
Table 5 gives the statistics of SCADA alarms concerning three critical components, the gearbox, the generator, and the main bearing. For this order estimation, the wind farm availability rate of 97% leads to the approximate average period in the healthy condition of
h. The imbalance ratio is estimated with respect to the periods, i.e., period of availability: period with active degradation SCADA alarm.
In
Table 5, the gearbox degradation includes the SCADA alarms of
Gearbox bearing overtemperature,
Gearbox oil overtemperature,
Gearbox oil overtemperature from thermal switch, and
Gearbox oil pressure too low. Generator degradation includes
Generator bearings overtemperature,
Generator stator windings overtemperature,
Generator over-speed,
Generator brush wear shutdown, and
Generator cooling air overtemperature. Bearing degradation corresponds to the SCADA alarm
Shaft bearing overtemperature.
4. Review of Strategies for Handling SCADA Data Imbalance
The present review investigates WT health condition analyses, focusing on papers addressing the imbalance of SCADA data. An exploratory approach with structured scoping principles was adopted to identify and compare strategies to address the SCADA data imbalance. The methodological workflow presented below aimed at balancing systematic search strategies with the flexibility to uncover citation connections in the recent literature. The selection of interest papers follows the criteria C1–C3:
- C1.
In this query, the specifier “[data]” ensures the selection of instances of the words “imbalance,” “disbalance,” or “unbalance” related to data, thereby excluding terms like “rotor imbalance” and “blade imbalance”.
- C2.
Time Frame: This review considers papers published within the period (2019–2024), therefore, focusing on recent advancements.
- C3.
Exclusion Criteria: Review and conference papers were excluded to avoid redundancy and prioritize citation relation between papers.
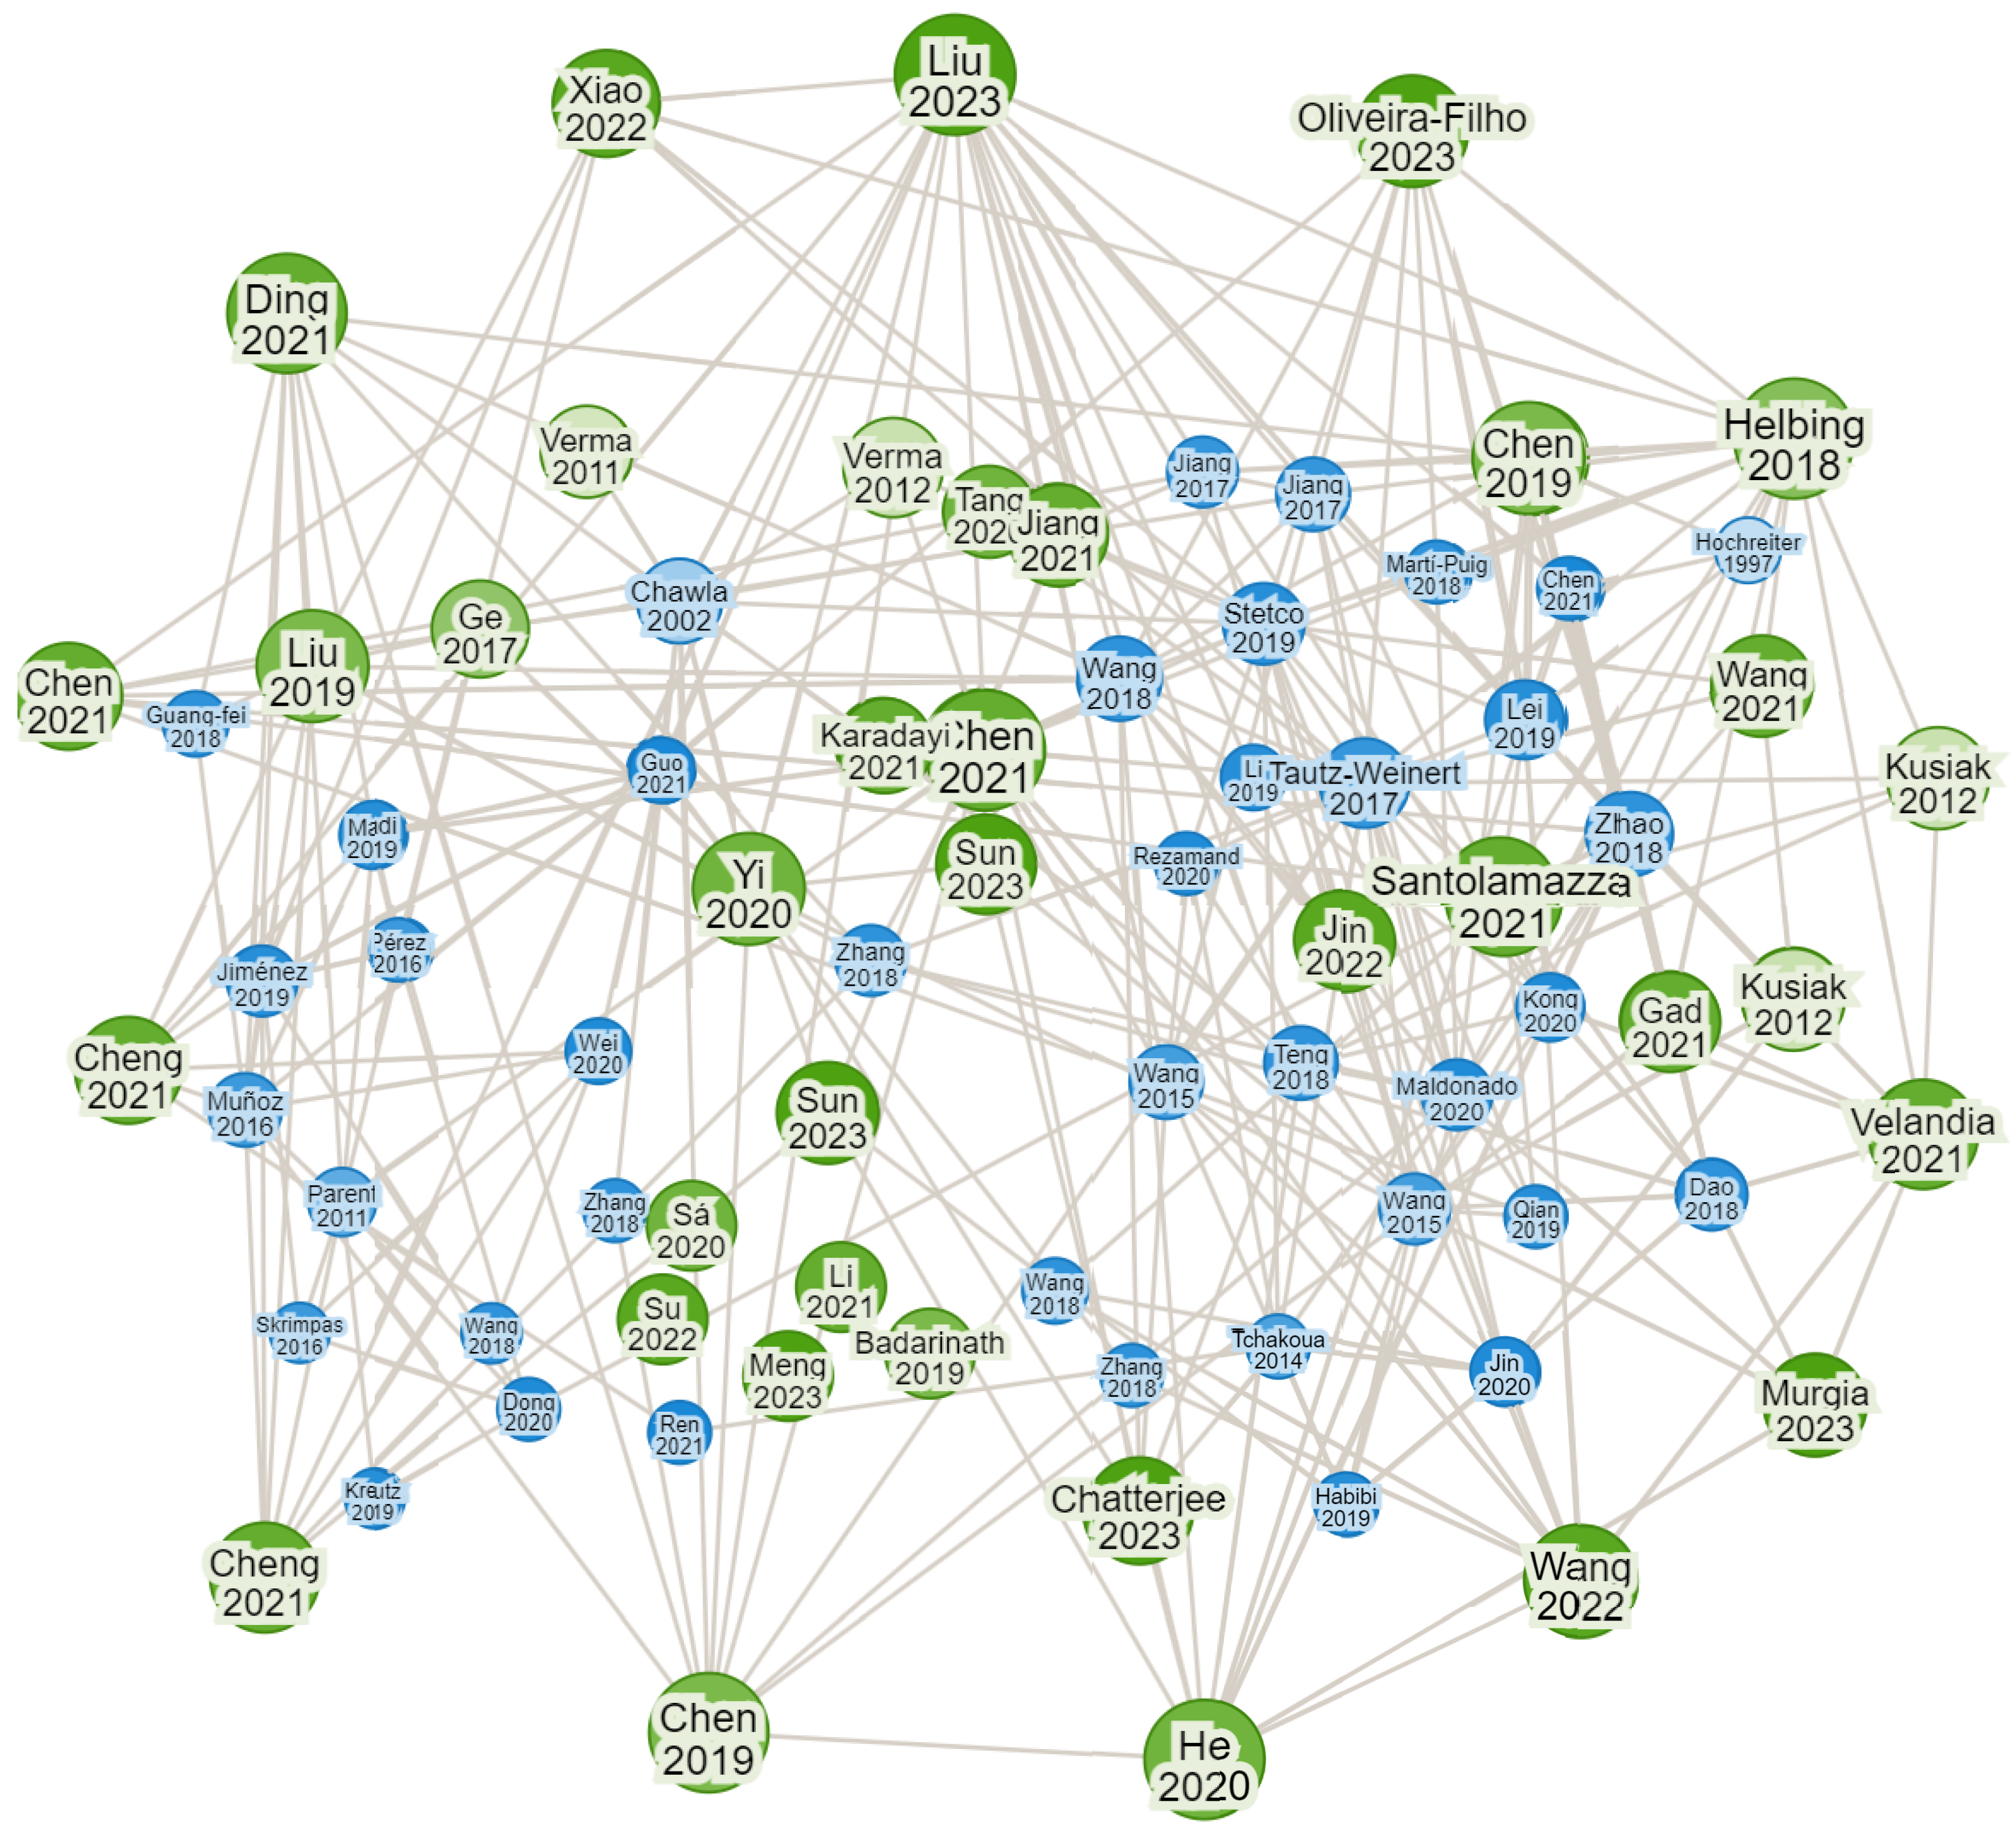
The methodological workflow comprises two steps. First, a targeted bibliographic search step within Web of Science (WoS) and Google Scholar aims to select the initial corpus of papers. The second step uses the citation-oriented exploratory tool ResearchRabbit [
63] to broaden and consolidate the corpus of papers. This tool exploits the citation links between papers (paper A cites paper B) to highlight the relation between works. Papers were screened within the ResearchRabbit categories of “Similar Work” and “Earlier Work” [
63], and the ones with multiple citation links in the citation graph verifying the criteria C1–C3 were retained
The first step of the bibliographic research led to a primary corpus of 30 papers, 9 from WoS and 21 pertinent papers retained from Google Scholar. This corpus was then broadened and consolidated using ResearchRabbit, resulting in the selection of 56 papers reviewed in the present section.
Figure 2 depicts the graph representation provided by ResearchRabbit.
This hybrid methodology is oriented by relevance and connectivity. It allowed for uncovering and comparing different strategies used in SCADA-based WT health condition analyses. However, this review does not comply with the PRISMA framework for systematic reviews and does not aim for exhaustive coverage [
64,
65].
4.1. Normal Behavior Models
Table 6 lists papers using NBMs on SCADA data-based WT health condition analyses.
NBMs listed in
Table 6 use various algorithms to analyze the SCADA data. It is worth mentioning that WT’s normal or healthy condition comprises significantly heterogeneous operating conditions. For example, the active power can be a cubic or a constant function of the wind speed, and the nacelle temperature varies greatly under the influence of daily and seasonal variations. Consequently, creating NBMs for the overall healthy WTs can be challenging. Instead, most of the reviewed NBMs focus on the health condition analysis of a particular subsystem or component, thus limiting the healthy/unhealthy classification to the level of the component or subsystem. Regression-based NBMs model specific SCADA measures such as main bearing temperature [
40] or gearbox bearing temperature [
67]. The residue between NBM prediction and actual measures allows for detecting changes in the system’s behavior. Alternatively, NBMs can target health indexes, with detection based on thresholds [
70].
NBMs at the wind farm level assume that WTs from the same model behave similarly. In particular, their degradation follows similar patterns. This assumption might be coherent for most WTs from a large wind farm but may not hold for WTs after major repairs and component replacements [
72].
A priori, NBMs would be trained solely on healthy data [
73]. Nevertheless, in cases with severe imbalance toward the majority healthy class, such as the SCADA imbalance for some less frequent abnormal conditions, the NBM could eventually be trained with all data regardless of the condition provided that the modeling approach has low sensitivity to outliers [
74].
4.2. Data-Level Methods
Table 7 presents an overview of data-level methods for dealing with SCADA data imbalance.
Data-level strategies derive from approaches that use undersampling of the majority class and oversampling of the minority class. They require explicit identification of the majority and minority classes, hence labeling.
4.3. Algorithm-Level Methods
Table 8 lists papers introducing algorithm-level approaches suitable for analyzing highly imbalanced SCADA data.
The algorithm-level methods listed in
Table 8 are mostly DNNs designed to ensure or enhance learning from the minority class from the SCADA data through techniques involving appropriate loss functions (e.g., FL), attention mechanisms (e.g., TACNN and MT-STAN), ensemble learning (e.g., MK-FCNN), and hybrid architectures (e.g., CNN-RNN, 1D-CNN-SBiGRU, and MWGCN).
4.4. Cost-Sensitive Learning and Hybrid Strategies
Cost-sensitive strategies attribute weights according to the data classification and often require labeling the datasets. These learning strategies can be seen as a combination of the data-level and the algorithm-level approaches, where the loss function is set differently for majority and minority classes [
24].
Table 9 lists papers using cost-sensitive learning strategies to analyze imbalanced SCADA data.
Among hybrid strategies, ensemble classification models combine multiple classifiers to obtain better accuracy compared to individual classifiers [
24]. Examples of such strategies include AdaBoot [
109,
110] and Bagging [
111]. Implementing hybrid strategies tends to be more complex than data-level or algorithm-level strategies taken alone.
4.5. Data Augmentation
Table 10 presents papers from a broad class of works, including generative models, synthetic data generated from simulation, and transfer learning.
Generative models used to generate synthetic data for WT operation include Variational Autoencoders [
120], Generative Adversarial Networks (GAN) [
121], Wasserstein Generative Adversarial Networks (WGAN) [
122], Least Squares Generative Adversarial Networks (LSGAN) [
123], among others. The implementation of a transfer learning model for WTs may use data from other units of the same WT model, i.e., the same manufacturer and specifications [
14]. The general deep learning model can be built for a WT model and then be trained or updated considering data from one specific WT unit [
124,
125,
126].
5. Discussion
Most papers reviewed in
Section 4 use specific strategies to deal with the SCADA data imbalance without further evaluation or comparison with alternative methods. The choice of one particular strategy can be linked to the characteristics of the SCADA data and the interest analyses.
The extent of SCADA data available is a determinant factor influencing the choice of the balancing strategy. NBMs only require healthy data and, in cases of severe imbalance, can use all available data regardless of the class, provided that the chosen model is not sensitive to outliers. Data-level, algorithm-level, and cost-sensitive strategies are suitable for imbalanced datasets, provided that enough minority-class data are available. Such data allow modeling within minority-class information. Generative models, simulation-based data generation, and transfer learning allow using information from other WTs of the same model, eventually from other wind farms. These data augmentation techniques are particularly suitable to overcome data scarcity, such as in newly commissioned wind farms.
The second factor is the possibility and cost of labeling the available data. Unsupervised learning strategies have the advantage of not requiring SCADA data labeling, which is time-consuming, costly, and prone to errors. NBMs can use unsupervised training and are easier to implement than the other modeling approaches. Data-level and hybrid strategies require labeling the SCADA database. When multiple degraded conditions are analyzed, it might be necessary to label multiple conditions, which is challenging. Algorithm-level strategies involve unsupervised learning, which makes them appropriate for analyzing imbalanced SCADA data without labels.
A third factor concerns the purpose of the analysis, as different data balancing strategies suit different kinds of WT health condition analysis. NBMs are suitable for anomaly detection and CM, but their binary characterization (normal behavior or not) limits their use for diagnosis and prognosis. Data-level, algorithm-level, and hybrid strategies are used in approaches aiming at the early detection of abnormal conditions, CM, diagnosis, and prognosis. Finally, data augmentation techniques are often combined with other models, which allows for WT health condition analyses even when data are scarce. Detection and CM are less sensitive to data imbalance than diagnosis since the latter involves distinguishing among various degradation states. The specificity of prognosis is the need for run-to-failure time series from the imbalanced SCADA database.
Forecasts for the wind energy sector suggest the WT global fleet is shifting toward larger WTs in the coming decades and anticipate significant growth in offshore installed capacity [
127]. Advancements in wind turbine technologies, maturity of the wind energy sector, and scale factor may benefit strategies tackling the problem of SCADA data imbalance. Indeed, future-generation WTs are expected to include captors from enhanced SCADA systems and diverse Condition Monitoring System (CMS) captors. The CMS can provide various types of data, including vibratory measurements, lubricant or grease condition analysis, and strain gauge stress measurements. These characterizations favor physical-based CM approaches, potentially complementing or overcoming data-based approaches. At the system level, the availability of finer-scale measurements paves the way for digital twin modeling [
114,
128].
In closing this discussion, building and maintaining an extensive public SCADA database remains among the perspectives for the future of the wind energy sector. Such a database could ease the problem of abnormal data scarcity, thereby contributing to handling the SCADA data imbalance. However, only a few datasets have been made public to date, and these are limited to relatively short periods and a few classes of degradation or failure conditions [
17].
6. Conclusions and Perspectives
Reviews highlighted in the Introduction (
Table 1) state the importance of assessing and addressing the imbalance of SCADA data while implementing WT health condition analyses such as detection, CM, diagnosis, and prognosis. Nevertheless, the literature is limited in its appreciation of the impact of the SCADA data imbalance, and little attention is given to the specifics of balancing strategies.
This paper presented strategies to mitigate the imbalance of SCADA data within five categories: NBMs, data-level strategies, algorithm-level strategies, cost-sensitive learning, and data augmentation techniques. This review identified three key factors influencing the choice among the balancing strategies: (i) the extent of SCADA data availability, (ii) the possibility and cost of data labeling, and (iii) the purpose and level of the desired WT health condition analysis.
The present review suggests that unsupervised learning models were predominant among the targeted works—papers published from 2019 to 2024 explicitly mentioning the SCADA data imbalance. Unsupervised learning strategies motivate intense research activity and industrial interest because these models overcome the need to label the SCADA database, which is time-consuming, costly, and error-prone.
Some aspects of SCADA data analysis remain to be comprehensively addressed to fully assess the impact of SCADA data imbalance. The present review considered papers that explicitly mentioned the problem of SCADA data imbalance. A comprehensive review could be defined by relaxing this criterion to include other pertinent strategies for SCADA data balancing. The balancing strategies serve different kinds of health condition analysis, which makes direct comparisons challenging. This review’s authors believe the two following open questions are worth further investigation. The first question concerns the impact of feature selection. Analyzing the impact of the number and kind of SCADA measures selected as features could enhance the understanding of feature importance and optimize model performance. More complex models, such as graph neural networks, allow for integrating multiple subsystems or component variables under the assumption that a graph model is appropriate. The second recommended research question is whether analyzing multiple abnormal conditions (instead of a single degraded condition) can improve diagnostic accuracy. The multi-class modeling approach gathers information from different datasets in the same model. Addressing these aspects of SCADA-based analyses will potentially benefit the implementation of WT health condition analyses in operating wind farms.
Author Contributions
Conceptualization, methodology, and investigation: A.O.-F. and A.T.; Formal analysis: A.O.-F., M.C., P.C., J.C. and C.N.; Data curation: A.O.-F., J.C. and C.N.; Writing—original draft preparation: A.O.-F., J.C. and C.N.; Writing—review and editing: A.O.-F., J.C., C.N., M.C., P.C. and A.T.; Resources, supervision, and funding acquisition: A.T., M.C. and P.C.; Project administration: A.O.-F. and A.T.; All authors have read and agreed to the published version of the manuscript.
Funding
This research was funded by the Natural Sciences and Engineering Research Council of Canada (NSERC) with the Alliance Grant number 580853–22.
Acknowledgments
The authors acknowledge Power Factors for providing the database used in the work.
Conflicts of Interest
Authors Monelle Comeau and Pavel Côté are employed by Power Factors. The remaining authors declare that this research was conducted without any commercial or financial relationships that could be perceived as a potential conflict of interest.
References
- Lee, J.; Zhao, F. Global Wind Report 2024; Global Wind Energy Council (GWEC): Brussels, Belgium, 2024. [Google Scholar]
- Bošnjaković, M.; Katinić, M.; Santa, R.; Marić, D. Wind turbine technology trends. Appl. Sci. 2022, 12, 8653. [Google Scholar] [CrossRef]
- Gonzalez, E.; Stephen, B.; Infield, D.; Melero, J.J. Using high-frequency SCADA data for wind turbine performance monitoring: A sensitivity study. Renew. Energy 2019, 131, 841–853. [Google Scholar] [CrossRef]
- Astolfi, D.; De Caro, F.; Vaccaro, A. Condition monitoring of wind turbine systems by explainable artificial intelligence techniques. Sensors 2023, 23, 5376. [Google Scholar] [CrossRef] [PubMed]
- Chen, W.; Qiu, Y.; Feng, Y.; Li, Y.; Kusiak, A. Diagnosis of wind turbine faults with transfer learning algorithms. Renew. Energy 2021, 163, 2053–2067. [Google Scholar] [CrossRef]
- Oh, S.Y.; Joung, C.; Lee, S.; Shim, Y.B.; Lee, D.; Cho, G.E.; Jang, J.; Lee, I.Y.; Park, Y.B. Condition-based maintenance of wind turbine structures: A state-of-the-art review. Renew. Sustain. Energy Rev. 2024, 204, 114799. [Google Scholar] [CrossRef]
- Cuesta, J.; Leturiondo, U.; Vidal, Y.; Pozo, F. Challenges on prognostics and health management for wind turbine components. J. Phys. Conf. Ser. 2024, 2745, 012003. [Google Scholar] [CrossRef]
- Pandit, R.; Wang, J. A comprehensive review on enhancing wind turbine applications with advanced SCADA data analytics and practical insights. IET Renew. Power Gener. 2024, 18, 722–742. [Google Scholar] [CrossRef]
- Badihi, H.; Zhang, Y.; Jiang, B.; Pillay, P.; Rakheja, S. A comprehensive review on signal-based and model-based condition monitoring of wind turbines: Fault diagnosis and lifetime prognosis. Proc. IEEE 2022, 110, 754–806. [Google Scholar] [CrossRef]
- Santiago, R.A.d.F.; Barbosa, N.B.; Mergulhão, H.G.; Carvalho, T.F.d.; Santos, A.A.B.; Medrado, R.C.; Filho, J.B.d.M.; Pinheiro, O.R.; Nascimento, E.G.S. Data-driven models applied to predictive and prescriptive maintenance of wind turbine: A systematic review of approaches based on failure detection, diagnosis, and prognosis. Energies 2024, 17, 1010. [Google Scholar] [CrossRef]
- Pfaffel, S.; Faulstich, S.; Rohrig, K. Performance and reliability of wind turbines: A review. Energies 2017, 10, 1904. [Google Scholar] [CrossRef]
- Maldonado-Correa, J.; Valdiviezo-Condolo, M.; Artigao, E.; Martín-Martínez, S.; Gómez-Lázaro, E. Classification of highly imbalanced supervisory control and data acquisition data for fault detection of wind turbine generators. Energies 2024, 17, 1590. [Google Scholar] [CrossRef]
- Ma, J.; Yuan, Y. Application of SCADA data in wind turbine fault detection—A review. Sens. Rev. 2023, 43, 1–11. [Google Scholar] [CrossRef]
- Nunes, A.R.; Morais, H.; Sardinha, A. Use of learning mechanisms to improve the condition monitoring of wind turbine generators: A review. Energies 2021, 14, 7129. [Google Scholar] [CrossRef]
- Stetco, A.; Dinmohammadi, F.; Zhao, X.; Robu, V.; Flynn, D.; Barnes, M.; Keane, J.; Nenadic, G. Machine learning methods for wind turbine condition monitoring: A review. Renew. Energy 2019, 133, 620–635. [Google Scholar] [CrossRef]
- Chen, L.; Xu, G.; Zhang, Q.; Zhang, X. Learning deep representation of imbalanced SCADA data for fault detection of wind turbines. Measurement 2019, 139, 370–379. [Google Scholar] [CrossRef]
- Helbing, G.; Ritter, M. Deep learning for fault detection in wind turbines. Renew. Sustain. Energy Rev. 2018, 98, 189–198. [Google Scholar] [CrossRef]
- Alloghani, M.; Al-Jumeily, D.; Mustafina, J.; Hussain, A.; Aljaaf, A.J. A Systematic Review on Supervised and Unsupervised Machine Learning Algorithms for Data Science. In Supervised and Unsupervised Learning for Data Science; Springer International Publishing: Cham, Germany, 2020; pp. 3–21. [Google Scholar] [CrossRef]
- Pandit, R.; Astolfi, D.; Hong, J.; Infield, D.; Santos, M. SCADA data for wind turbine data-driven condition/performance monitoring: A review on state-of-art, challenges and future trends. Wind Eng. 2023, 47, 422–441. [Google Scholar] [CrossRef]
- Zheng, M.; Man, J.; Wang, D.; Chen, Y.; Li, Q.; Liu, Y. Semi-supervised multivariate time series anomaly detection for wind turbines using generator SCADA data. Reliab. Eng. Syst. Saf. 2023, 235, 109235. [Google Scholar] [CrossRef]
- Vásquez-Rodríguez, G.; Maldonado-Correa, J. Anomaly-based fault detection in wind turbines using unsupervised learning: A comparative study. Iop Conf. Ser. Earth Environ. Sci. 2024, 1370, 012005. [Google Scholar] [CrossRef]
- Rezvani, S.; Wang, X. A broad review on class imbalance learning techniques. Appl. Soft Comput. 2023, 143, 110415. [Google Scholar] [CrossRef]
- Megahed, F.M.; Chen, Y.J.; Megahed, A.; Ong, Y.; Altman, N.; Krzywinski, M. The class imbalance problem. Nat. Methods 2021, 18, 1270–1272. [Google Scholar] [CrossRef]
- Galar, M.; Fernandez, A.; Barrenechea, E.; Bustince, H.; Herrera, F. A review on ensembles for the class imbalance problem: Bagging-, boosting-, and hybrid-based approaches. IEEE Trans. Syst. Man Cybern. Part C (Appl. Rev.) 2011, 42, 463–484. [Google Scholar] [CrossRef]
- Japkowicz, N.; Stephen, S. The class imbalance problem: A systematic study. Intell. Data Anal. 2002, 6, 429–449. [Google Scholar] [CrossRef]
- Buda, M.; Maki, A.; Mazurowski, M.A. A systematic study of the class imbalance problem in convolutional neural networks. Neural Netw. 2018, 106, 249–259. [Google Scholar] [CrossRef]
- Ren, Z.; Lin, T.; Feng, K.; Zhu, Y.; Liu, Z.; Yan, K. A systematic review on imbalanced learning methods in intelligent fault diagnosis. IEEE Trans. Instrum. Meas. 2023, 72, 1–35. [Google Scholar] [CrossRef]
- Wu, Z.; Lin, W.; Ji, Y. An integrated ensemble learning model for imbalanced fault diagnostics and prognostics. IEEE Access 2018, 6, 8394–8402. [Google Scholar] [CrossRef]
- Owusu-Adjei, M.; Ben Hayfron-Acquah, J.; Frimpong, T.; Abdul-Salaam, G. Imbalanced class distribution and performance evaluation metrics: A systematic review of prediction accuracy for determining model performance in healthcare systems. PLoS Digit. Health 2023, 2, e0000290. [Google Scholar] [CrossRef]
- Yang, Y.; Khorshidi, H.A.; Aickelin, U. A review on over-sampling techniques in classification of multi-class imbalanced datasets: Insights for medical problems. Front. Digit. Health 2024, 6, 1430245. [Google Scholar] [CrossRef]
- Zaher, A.; McArthur, S.; Infield, D.; Patel, Y. Online wind turbine fault detection through automated SCADA data analysis. Wind Energy 2009, 12, 574–593. [Google Scholar] [CrossRef]
- Meyer, A. Multi-target normal behaviour models for wind farm condition monitoring. Appl. Energy 2021, 300, 117342. [Google Scholar] [CrossRef]
- Chawla, N.V.; Bowyer, K.W.; Hall, L.O.; Kegelmeyer, W.P. SMOTE: Synthetic minority over-sampling technique. J. Artif. Intell. Res. 2002, 16, 321–357. [Google Scholar] [CrossRef]
- Mohammed, R.; Rawashdeh, J.; Abdullah, M. Machine learning with oversampling and undersampling techniques: Overview study and experimental results. In Proceedings of the 2020 11th International Conference on Information and Communication Systems (ICICS), Irbid, Jordan, 7–9 April 2020; pp. 243–248. [Google Scholar] [CrossRef]
- Tian, J.; Jiang, Y.; Zhang, J.; Luo, H.; Yin, S. A novel data augmentation approach to fault diagnosis with class-imbalance problem. Reliab. Eng. Syst. Saf. 2024, 243, 109832. [Google Scholar] [CrossRef]
- Hsu, M.C.; Akkerman, I.; Bazilevs, Y. Finite element simulation of wind turbine aerodynamics: Validation study using NREL Phase VI experiment. Wind Energy 2014, 17, 461–481. [Google Scholar] [CrossRef]
- Johnson, J.M.; Khoshgoftaar, T.M. Survey on deep learning with class imbalance. J. Big Data 2019, 6, 1–54. [Google Scholar] [CrossRef]
- Bradley, A.P. The use of the area under the ROC curve in the evaluation of machine learning algorithms. Pattern Recognit. 1997, 30, 1145–1159. [Google Scholar] [CrossRef]
- Cambron, P.; Tahan, A.; Masson, C.; Pelletier, F. Bearing temperature monitoring of a wind turbine using physics-based model. J. Qual. Maint. Eng. 2017, 23, 479–488. [Google Scholar] [CrossRef]
- Tutivén, C.; Vidal, Y.; Insuasty, A.; Campoverde-Vilela, L.; Achicanoy, W. Early fault diagnosis strategy for WT main bearings based on SCADA data and one-class SVM. Energies 2022, 15, 4381. [Google Scholar] [CrossRef]
- Bai, X.; Han, S.; Kang, Z.; Tao, T.; Pang, C.; Dai, S.; Liu, Y. Wind turbine gearbox oil temperature feature extraction and condition monitoring based on energy flow. Appl. Energy 2024, 371, 123687. [Google Scholar] [CrossRef]
- Yan, J.; Liu, Y.; Meng, H.; Li, L.; Ren, X. Wind turbine generator early fault diagnosis using LSTM-based stacked denoising autoencoder network and stacking algorithm. Int. J. Green Energy 2024, 21, 2477–2492. [Google Scholar] [CrossRef]
- Zhang, Y.; Kehtarnavaz, N.; Rotea, M.; Dasari, T. Prediction of Icing on Wind Turbines Based on SCADA Data via Temporal Convolutional Network. Energies 2024, 17, 2175. [Google Scholar] [CrossRef]
- Ye, F.; Ezzat, A.A. Icing detection and prediction for wind turbines using multivariate sensor data and machine learning. Renew. Energy 2024, 231, 120879. [Google Scholar] [CrossRef]
- Astolfi, D.; Pasetti, M.; Lombardi, A.; Terzi, L.; Girard, N.; Poncet, P.; Masson, J.; Dieudegard, T.; Castellani, F. A General Method For The Diagnosis Of Wind Turbine Systematic Yaw Error Based Solely On SCADA Data. J. Physics Conf. Ser. 2024, 2767, 042007. [Google Scholar] [CrossRef]
- McKinnon, C.; Carroll, J.; McDonald, A.; Koukoura, S.; Plumley, C. Investigation of isolation forest for wind turbine pitch system condition monitoring using SCADA data. Energies 2021, 14, 6601. [Google Scholar] [CrossRef]
- Zheng, Y.; Wang, C.; Huang, C.; Li, K.; Yang, J.; Xie, N.; Liu, B.; Zhang, Y. Hierarchical spatial–temporal autocorrelation graph neural network for online wind turbine pitch system fault detection. Neurocomputing 2024, 586, 127574. [Google Scholar] [CrossRef]
- Mehlan, F.C.; Nejad, A.R. Rotor imbalance detection and diagnosis in floating wind turbines by means of drivetrain condition monitoring. Renew. Energy 2023, 212, 70–81. [Google Scholar] [CrossRef]
- Elorza, I.; Arrizabalaga, I.; Zubizarreta, A.; Martín-Aguilar, H.; Pujana-Arrese, A.; Calleja, C. A sensor data processing algorithm for wind turbine hydraulic pitch system diagnosis. Energies 2021, 15, 33. [Google Scholar] [CrossRef]
- Zhou, L.; Zhao, Q.; Wang, X.; Zhu, A. Fault diagnosis and reconstruction of wind turbine anemometer based on RWSSA-AANN. Energies 2021, 14, 6905. [Google Scholar] [CrossRef]
- Entezami, M.; Hillmansen, S.; Weston, P.; Papaelias, M.P. Fault detection and diagnosis within a wind turbine mechanical braking system using condition monitoring. Renew. Energy 2012, 47, 175–182. [Google Scholar] [CrossRef]
- Tautz-Weinert, J.; Watson, S.J. Using SCADA data for wind turbine condition monitoring—A review. Iet Renew. Power Gener. 2017, 11, 382–394. [Google Scholar] [CrossRef]
- Zhang, D.; Tian, W.; Cheng, X.; Shi, F.; Qiu, H.; Liu, X.; Chen, S. FedBIP: A federated learning-based model for wind turbine blade icing prediction. IEEE Trans. Instrum. Meas. 2023, 72, 1–11. [Google Scholar] [CrossRef]
- Marti-Puig, P.; Blanco-M, A.; Cárdenas, J.J.; Cusidó, J.; Solé-Casals, J. Effects of the pre-processing algorithms in fault diagnosis of wind turbines. Environ. Model. Softw. 2018, 110, 119–128. [Google Scholar] [CrossRef]
- Oliveira-Filho, A.; Zemouri, R.; Pelletier, F.; Tahan, A. System Condition Monitoring Based on a Standardized Latent Space and the Nataf Transform. IEEE Access 2024, 12, 32637–32659. [Google Scholar] [CrossRef]
- Du, M.; Yi, J.; Mazidi, P.; Cheng, L.; Guo, J. A parameter selection method for wind turbine health management through SCADA data. Energies 2017, 10, 253. [Google Scholar] [CrossRef]
- Cheng, R.C.; Chen, K.S. Ball bearing multiple failure diagnosis using feature-selected autoencoder model. Int. J. Adv. Manuf. Technol. 2022, 120, 4803–4819. [Google Scholar] [CrossRef]
- Costa, N.; Sánchez, L. Variational encoding approach for interpretable assessment of remaining useful life estimation. Reliab. Eng. Syst. Saf. 2022, 222, 108353. [Google Scholar] [CrossRef]
- Menezes, E.J.N.; Araújo, A.M.; Da Silva, N.S.B. A review on wind turbine control and its associated methods. J. Clean. Prod. 2018, 174, 945–953. [Google Scholar] [CrossRef]
- Artigao, E.; Martín-Martínez, S.; Honrubia-Escribano, A.; Gómez-Lázaro, E. Wind turbine reliability: A comprehensive review towards effective condition monitoring development. Appl. Energy 2018, 228, 1569–1583. [Google Scholar] [CrossRef]
- Santelo, T.N.; de Oliveira, C.M.R.; Maciel, C.D.; de A. Monteiro, J.R.B. Wind turbine failures review and trends. J. Control Autom. Electr. Syst. 2022, 33, 1–17. [Google Scholar] [CrossRef]
- Chestney, N.; Steitz, C. What Are the Issues with Siemens Gamesa’s Wind Turbines? 2023. Available online: https://www.reuters.com/business/energy/what-are-issues-with-siemens-gamesas-wind-turbines-2023-06-23/ (accessed on 16 October 2024).
- Cole, V.; Boutet, M. ResearchRabbit. J. Can. Health Libr. Assoc. 2023, 44, 43. [Google Scholar] [CrossRef]
- Takkouche, B.; Norman, G. PRISMA statement. Epidemiology 2011, 22, 128. [Google Scholar] [CrossRef]
- Moher, D.; Stewart, L.; Shekelle, P. Implementing PRISMA-P: Recommendations for prospective authors. Syst. Rev. 2016, 5, 1–2. [Google Scholar] [CrossRef] [PubMed]
- Murgia, A.; Verbeke, R.; Tsiporkova, E.; Terzi, L.; Astolfi, D. Discussion on the suitability of SCADA-based condition monitoring for wind turbine fault diagnosis through temperature data analysis. Energies 2023, 16, 620. [Google Scholar] [CrossRef]
- Bilendo, F.; Lu, N.; Badihi, H.; Meyer, A.; Cali, Ü.; Cambron, P. Multitarget normal behavior model based on heterogeneous stacked regressions and change-point detection for wind turbine condition monitoring. IEEE Trans. Ind. Inform. 2023, 20, 5171–5181. [Google Scholar] [CrossRef]
- Yi, H.; Jiang, Q. Discriminative feature learning for blade icing fault detection of wind turbine. Meas. Sci. Technol. 2020, 31, 115102. [Google Scholar] [CrossRef]
- Wei, L.; Qian, Z.; Zareipour, H. Wind turbine pitch system condition monitoring and fault detection based on optimized relevance vector machine regression. IEEE Trans. Sustain. Energy 2019, 11, 2326–2336. [Google Scholar] [CrossRef]
- Lebranchu, A.; Charbonnier, S.; Bérenguer, C.; Prevost, F. A combined mono-and multi-turbine approach for fault indicator synthesis and wind turbine monitoring using SCADA data. ISA Trans. 2019, 87, 272–281. [Google Scholar] [CrossRef]
- Saari, J.; Strömbergsson, D.; Lundberg, J.; Thomson, A. Detection and identification of windmill bearing faults using a one-class support vector machine (SVM). Measurement 2019, 137, 287–301. [Google Scholar] [CrossRef]
- Soltani, M.; Kharoufeh, J.P.; Khademi, A. Structured replacement policies for offshore wind turbines. Probab. Eng. Informational Sci. 2024, 38, 355–386. [Google Scholar] [CrossRef]
- Wang, A.; Qian, Z.; Pei, Y.; Jing, B. A de-ambiguous condition monitoring scheme for wind turbines using least squares generative adversarial networks. Renew. Energy 2022, 185, 267–279. [Google Scholar] [CrossRef]
- Chesterman, X.; Verstraeten, T.; Daems, P.J.; Nowé, A.; Helsen, J. Overview of normal behavior modeling approaches for SCADA-based wind turbine condition monitoring demonstrated on data from operational wind farms. Wind Energy Sci. 2023, 8, 893–924. [Google Scholar] [CrossRef]
- Fazli, A.; Poshtan, J. Wind turbine fault detection and isolation robust against data imbalance using KNN. Energy Sci. Eng. 2024, 12, 1174–1186. [Google Scholar] [CrossRef]
- Li, S.; Peng, Y.; Bin, G. Prediction of wind turbine blades icing based on CJBM with imbalanced data. IEEE Sens. J. 2023, 23, 19726–19736. [Google Scholar] [CrossRef]
- Jin, X.; Zhang, X.; Cheng, X.; Jiang, G.; Masisi, L.; Huang, W. A physics-based and data-driven feature extraction model for blades icing detection of wind turbines. IEEE Sens. J. 2023, 23, 3944–3954. [Google Scholar] [CrossRef]
- Chen, W.; Cheng, L.; Chang, Z.; Wen, B.; Li, P. Wind turbine blade icing detection using a novel bidirectional gated recurrent unit with temporal pattern attention and improved coot optimization algorithm. Meas. Sci. Technol. 2022, 34, 014004. [Google Scholar] [CrossRef]
- Jiang, G.; Fan, W.; Li, W.; Wang, L.; He, Q.; Xie, P.; Li, X. DeepFedWT: A federated deep learning framework for fault detection of wind turbines. Measurement 2022, 199, 111529. [Google Scholar] [CrossRef]
- Wang, X.; Zheng, Z.; Jiang, G.; He, Q.; Xie, P. Detecting wind turbine blade icing with a multiscale long short-term memory network. Energies 2022, 15, 2864. [Google Scholar] [CrossRef]
- Tian, W.; Cheng, X.; Li, G.; Shi, F.; Chen, S.; Zhang, H. A multilevel convolutional recurrent neural network for blade icing detection of wind turbine. IEEE Sens. J. 2021, 21, 20311–20323. [Google Scholar] [CrossRef]
- Jiang, N.; Li, N. A wind turbine frequent principal fault detection and localization approach with imbalanced data using an improved synthetic oversampling technique. Int. J. Electr. Power Energy Syst. 2021, 126, 106595. [Google Scholar] [CrossRef]
- Ding, S.; Wang, Z.; Zhang, J.; Han, F.; Gu, X.; Song, G. A PCC-Ensemble-TCN model for wind turbine icing detection using class-imbalanced and label-missing SCADA data. Int. J. Distrib. Sens. Netw. 2021, 17, 15501477211057737. [Google Scholar] [CrossRef]
- Yi, H.; Jiang, Q.; Yan, X.; Wang, B. Imbalanced classification based on minority clustering synthetic minority oversampling technique with wind turbine fault detection application. IEEE Trans. Ind. Inform. 2020, 17, 5867–5875. [Google Scholar] [CrossRef]
- Liu, J.; Qu, F.; Hong, X.; Zhang, H. A small-sample wind turbine fault detection method with synthetic fault data using generative adversarial nets. IEEE Trans. Ind. Inform. 2018, 15, 3877–3888. [Google Scholar] [CrossRef]
- Li, Y.; Liu, S.; Shu, L. Wind turbine fault diagnosis based on Gaussian process classifiers applied to operational data. Renew. Energy 2019, 134, 357–366. [Google Scholar] [CrossRef]
- Sun, S.; Hu, W.; Liu, Y.; Wang, T.; Chu, F. Matching contrastive learning: An effective and intelligent method for wind turbine fault diagnosis with imbalanced SCADA data. Expert Syst. Appl. 2023, 223, 119891. [Google Scholar] [CrossRef]
- Liu, J.; Yang, G.; Li, X.; Wang, Q.; He, Y.; Yang, X. Wind turbine anomaly detection based on SCADA: A deep autoencoder enhanced by fault instances. ISA Trans. 2023, 139, 586–605. [Google Scholar] [CrossRef]
- Sun, S.; Wang, T.; Chu, F. A multi-learner neural network approach to wind turbine fault diagnosis with imbalanced data. Renew. Energy 2023, 208, 420–430. [Google Scholar] [CrossRef]
- Jiang, G.; Li, W.; Bai, J.; He, Q.; Xie, P. SCADA data-driven blade icing detection for wind turbines: An enhanced spatio-temporal feature learning approach. Meas. Sci. Technol. 2023, 34, 054004. [Google Scholar] [CrossRef]
- Man, J.; Wang, F.; Li, Q.; Wang, D.; Qiu, Y. Semi-supervised blade icing detection method based on tri-XGBoost. Actuators 2023, 12, 58. [Google Scholar] [CrossRef]
- Lai, Z.; Cheng, X.; Liu, X.; Huang, L.; Liu, Y. Multiscale wavelet-driven graph convolutional network for blade icing detection of wind turbines. IEEE Sens. J. 2022, 22, 21974–21985. [Google Scholar] [CrossRef]
- Tong, R.; Li, P.; Gao, L.; Lang, X.; Miao, A.; Shen, X. A novel ellipsoidal semisupervised extreme learning machine algorithm and its application in wind turbine blade icing fault detection. IEEE Trans. Instrum. Meas. 2022, 71, 1–16. [Google Scholar] [CrossRef]
- Cheng, X.; Tian, W.; Shi, F.; Zhao, M.; Chen, S.; Wang, H. A blockchain-empowered cluster-based federated learning model for blade icing estimation on IoT-enabled wind turbine. IEEE Trans. Ind. Inform. 2022, 18, 9184–9195. [Google Scholar] [CrossRef]
- Xiao, J.; Li, C.; Liu, B.; Huang, J.; Xie, L. Prediction of wind turbine blade icing fault based on selective deep ensemble model. Knowl.-Based Syst. 2022, 242, 108290. [Google Scholar] [CrossRef]
- Li, Y.; Hou, L.; Tang, M.; Sun, Q.; Chen, J.; Song, W.; Yao, W.; Cao, L. Prediction of wind turbine blades icing based on feature Selection and 1D-CNN-SBiGRU. Multimed. Tools Appl. 2022, 81, 4365–4385. [Google Scholar] [CrossRef]
- Cheng, X.; Shi, F.; Liu, X.; Zhao, M.; Chen, S. A novel deep class-imbalanced semisupervised model for wind turbine blade icing detection. IEEE Trans. Neural Netw. Learn. Syst. 2021, 33, 2558–2570. [Google Scholar] [CrossRef] [PubMed]
- Cheng, X.; Shi, F.; Zhao, M.; Li, G.; Zhang, H.; Chen, S. Temporal attention convolutional neural network for estimation of icing probability on wind turbine blades. IEEE Trans. Ind. Electron. 2021, 69, 6371–6380. [Google Scholar] [CrossRef]
- Pang, Y.; He, Q.; Jiang, G.; Xie, P. Spatio-temporal fusion neural network for multi-class fault diagnosis of wind turbines based on SCADA data. Renew. Energy 2020, 161, 510–524. [Google Scholar] [CrossRef]
- Tang, M.; Kuang, Z.; Zhao, Q.; Wu, H.; Yang, X. Fault detection of wind turbine pitch system based on multiclass optimal margin distribution machine. Math. Probl. Eng. 2020, 2020, 2091382. [Google Scholar] [CrossRef]
- Sá, F.P.d.; Brandão, D.N.; Ogasawara, E.; Coutinho, R.d.C.; Toso, R.F. Wind turbine fault detection: A semi-supervised learning approach with automatic evolutionary feature selection. In Proceedings of the 2020 International Conference on Systems, Signals and Image Processing (IWSSIP), Niterói, Brazil, 1–3 July 2020; pp. 323–328. [Google Scholar]
- Chen, J.; Hu, W.; Cao, D.; Zhang, B.; Huang, Q.; Chen, Z.; Blaabjerg, F. An imbalance fault detection algorithm for variable-speed wind turbines: A deep learning approach. Energies 2019, 12, 2764. [Google Scholar] [CrossRef]
- Karim, F.; Majumdar, S.; Darabi, H.; Harford, S. Multivariate LSTM-FCNs for time series classification. Neural Netw. 2019, 116, 237–245. [Google Scholar] [CrossRef]
- Jiang, G.; Yue, R.; He, Q.; Xie, P.; Liu, Y. Imbalanced learning for wind turbine blade icing detection via spatio-temporal attention model with a self-adaptive weight loss function. Expert Syst. Appl. 2023, 229, 120428. [Google Scholar] [CrossRef]
- Chatterjee, S. Highly imbalanced fault classification of wind turbines using data resampling and hybrid ensemble method approach. Eng. Appl. Artif. Intell. 2023, 126, 107104. [Google Scholar] [CrossRef]
- Meng, A.; Xian, Z.; Yin, H.; Luo, J.; Wang, X.; Zhang, H.; Jiayu, R.; Li, C.; Zhen-bin, W.; Xie, Z.; et al. A novel network training approach for solving sample imbalance problem in wind power prediction. Energy Convers. Manag. 2023, 283, 116935. [Google Scholar] [CrossRef]
- Tong, R.; Li, P.; Lang, X.; Liang, J.; Cao, M. A novel adaptive weighted kernel extreme learning machine algorithm and its application in wind turbine blade icing fault detection. Measurement 2021, 185, 110009. [Google Scholar] [CrossRef]
- He, Q.; Pang, Y.; Jiang, G.; Xie, P. A spatio-temporal multiscale neural network approach for wind turbine fault diagnosis with imbalanced SCADA data. IEEE Trans. Ind. Inform. 2020, 17, 6875–6884. [Google Scholar] [CrossRef]
- Schapire, R.E. The strength of weak learnability. Mach. Learn. 1990, 5, 197–227. [Google Scholar] [CrossRef]
- Freund, Y.; Schapire, R.E. A decision-theoretic generalization of on-line learning and an application to boosting. J. Comput. Syst. Sci. 1997, 55, 119–139. [Google Scholar] [CrossRef]
- Breiman, L. Bagging predictors. Mach. Learn. 1996, 24, 123–140. [Google Scholar] [CrossRef]
- Wang, X.; Chen, H.; Zhao, J.; Song, C.; Zhang, Y.; Yang, Z.X.; Wong, P.K. Wind turbine fault diagnosis for class-imbalance and small-size data based on stacked capsule autoencoder. IEEE Trans. Ind. Inform. 2024, 20, 12694–12704. [Google Scholar] [CrossRef]
- Oliveira-Filho, A.; Zemouri, R.; Cambron, P.; Tahan, A. Early detection and diagnosis of wind turbine abnormal conditions using an interpretable supervised variational autoencoder model. Energies 2023, 16, 4544. [Google Scholar] [CrossRef]
- Pujana, A.; Esteras, M.; Perea, E.; Maqueda, E.; Calvez, P. Hybrid-model-based digital twin of the drivetrain of a wind turbine and its application for failure synthetic data generation. Energies 2023, 16, 861. [Google Scholar] [CrossRef]
- Su, Y.; Meng, L.; Kong, X.; Xu, T.; Lan, X.; Li, Y. Generative adversarial networks for gearbox of wind turbine with unbalanced data sets in fault diagnosis. IEEE Sens. J. 2022, 22, 13285–13298. [Google Scholar] [CrossRef]
- Jin, X.; Pan, H.; Ying, C.; Kong, Z.; Xu, Z.; Zhang, B. Condition monitoring of wind turbine generator based on transfer learning and one-class classifier. IEEE Sens. J. 2022, 22, 24130–24139. [Google Scholar] [CrossRef]
- Chen, P.; Li, Y.; Wang, K.; Zuo, M.J.; Heyns, P.S.; Baggeröhr, S. A threshold self-setting condition monitoring scheme for wind turbine generator bearings based on deep convolutional generative adversarial networks. Measurement 2021, 167, 108234. [Google Scholar] [CrossRef]
- Velandia-Cardenas, C.; Vidal, Y.; Pozo, F. Wind turbine fault detection using highly imbalanced real SCADA data. Energies 2021, 14, 1728. [Google Scholar] [CrossRef]
- Xu, J.; Tan, W.; Li, T. Predicting fan blade icing by using particle swarm optimization and support vector machine algorithm. Comput. Electr. Eng. 2020, 87, 106751. [Google Scholar] [CrossRef]
- Kingma, D.P. Auto-encoding variational bayes. arXiv 2013, arXiv:1312.6114. [Google Scholar]
- Goodfellow, I.; Pouget-Abadie, J.; Mirza, M.; Xu, B.; Warde-Farley, D.; Ozair, S.; Courville, A.; Bengio, Y. Generative adversarial nets. Adv. Neural Inf. Process. Syst. 2014, 27. [Google Scholar]
- Arjovsky, M.; Chintala, S.; Bottou, L. Wasserstein generative adversarial networks. In Proceedings of the International Conference on Machine Learning, Sydney, Australia, 6–11 August 2017; pp. 214–223. [Google Scholar]
- Mao, X.; Li, Q.; Xie, H.; Lau, R.Y.; Wang, Z.; Paul Smolley, S. Least squares generative adversarial networks. In Proceedings of the IEEE International Conference on Computer Vision, Venice, Italy, 22–29 October 2017; pp. 2794–2802. [Google Scholar]
- Zhang, T.; Chen, J.; Li, F.; Zhang, K.; Lv, H.; He, S.; Xu, E. Intelligent fault diagnosis of machines with small & imbalanced data: A state-of-the-art review and possible extensions. ISA Trans. 2022, 119, 152–171. [Google Scholar]
- Yun, H.; Zhang, C.; Hou, C.; Liu, Z. An adaptive approach for ice detection in wind turbine with inductive transfer learning. IEEE Access 2019, 7, 122205–122213. [Google Scholar] [CrossRef]
- Li, Y.; Jiang, W.; Zhang, G.; Shu, L. Wind turbine fault diagnosis based on transfer learning and convolutional autoencoder with small-scale data. Renew. Energy 2021, 171, 103–115. [Google Scholar] [CrossRef]
- DNV. Energy Transition Outlook 2024—A Global and Regional Forecast to 2050; Technical Report; DNV: Hovik, Norway, 2024. [Google Scholar]
- Branlard, E.; Jonkman, J.; Brown, C.; Zhang, J. A digital twin solution for floating offshore wind turbines validated using a full-scale prototype. Wind Energy Sci. 2024, 9, 1–24. [Google Scholar] [CrossRef]
| Disclaimer/Publisher’s Note: The statements, opinions and data contained in all publications are solely those of the individual author(s) and contributor(s) and not of MDPI and/or the editor(s). MDPI and/or the editor(s) disclaim responsibility for any injury to people or property resulting from any ideas, methods, instructions or products referred to in the content. |
© 2024 by the authors. Licensee MDPI, Basel, Switzerland. This article is an open access article distributed under the terms and conditions of the Creative Commons Attribution (CC BY) license (https://creativecommons.org/licenses/by/4.0/).


 ,
, 
