Abstract
The high carbon emissions and pollution of China’s thermal power industry chain have exacerbated environmental and climate degradation. Therefore, accelerating the green transformation process is of great significance in promoting the sustainable development of enterprises. This study selected 30 listed thermal power enterprises in China as research objects, analyzed their data from 2018 to 2022, set targeted input–output indicators for different stages, and used a two-stage dynamic data envelopment analysis (DEA) model to evaluate and measure the efficiency of the green transformation of Chinese thermal power enterprises. In addition, this study also uses the logarithmic mean Divisia index (LMDI) method to analyze the driving effects of green transformation. The results indicate that in terms of overall efficiency, there is a significant difference in the overall performance of these 30 thermal power enterprises, with a large difference in average efficiency values. Efficiency values are related to enterprise size. In terms of stage efficiency, the average efficiency value of thermal power enterprises in the profit stage was significantly higher than that in the transformation stage, and the profitability of Chinese thermal power enterprises was better. In terms of sub-indicator efficiency, the efficiency of each indicator shows a “U”-shaped trend, and there is a certain correlation between the operating costs and revenue of thermal power enterprises, the market value of green transformation, and related indicators. In addition, the most important factor affecting the efficiency of green transformation is the sewage cost they face, whereas their operational capabilities have the least impact on their green transformation. In this regard, thermal power enterprises should increase their investment in the research and development of key technologies for thermal power transformation and continuously optimize their energy structure. The government will increase financial support for thermal power green transformation enterprises and correspondingly increase emission costs.
1. Introduction
According to the report State of the Global Climate in 2023 released by the World Meteorological Organization (WMO), 2023 is the warmest year on record, and the average surface temperature worldwide has reached a new high, which will continue to rise in the future. This will largely affect people’s daily society and harm the social economies of countries and regions. The most important reason for accelerating global warming is the excessive emission of greenhouse gasses, mainly carbon dioxide. Mitigating and dealing with the impact of carbon emissions has become the focus of attention in countries around the world. By the end of 2023, carbon dioxide emissions in China were 12.6 billion tons, making China the world’s largest carbon emitter.
According to a relevant report by the International Energy Agency, the emissions of global energy-related carbon dioxide will reach 37.4 billion tons in 2023, an increase of 410 million tons or 1.1% from the previous year. The energy industry, as the driving force of China’s economic development, has also exacerbated the excessive emissions of carbon dioxide largely affecting people’s daily lives, among which the most important is the combustion of fossil fuels based on coal. As a responsible internal power, China needs to pay attention to the balance with environmental governance while vigorously developing its economy to promote the sustainable development of its national society.
As an important part of the energy supply industry chain, thermal power enterprises mainly use coal for power generation, and the combustion of coal greatly increases carbon emissions and accelerates global warming. In this case, clean, efficient, and safe renewable energy generation is favored and has gradually become an important part of the power supply. Traditional thermal power enterprises actively perform structural transformations for clean and low-carbon energy power generation. Accelerating the process of green transformation is of great significance in promoting the sustainable development of enterprises.
The contributions of this article are as follows: (1) Most of the previous studies on the evaluation of the green transformation efficiency of the thermal power industry start from a regional perspective, such as national and provincial areas, and rarely involve the perspective of enterprises. In this study, starting from the listed thermal power enterprises in China, 30 listed thermal power enterprises in China were selected as the research objects, and the research was more targeted; (2) This study adopts a two-stage dynamic data envelopment analysis (DEA) model to set representative input–output indicators for different stages of green transformation in thermal power enterprises, which can better restore their actual operating conditions. At the same time, it can provide reference for thermal power enterprise managers to balance enterprise performance and green transformation management behavior based on changes in the efficiency values; (3) Due to the characteristics of zero residuals and strong applicability of the logarithmic mean Divisia index (LMDI) method in energy and environmental policy evaluation, this paper adopts the LMDI method to evaluate the factors that affect the green transformation efficiency of Chinese thermal power enterprises, providing a basis for dynamic monitoring of the green transformation process of thermal power enterprise managers.
2. Literature Review
2.1. Factors Affecting the Transformation of Energy Enterprises
In the previous research on the factors related to the transformation of energy enterprises, it was found that the traditional economic growth mode has little effect on alleviating the rigid constraints of resources and environment. The contradiction between resources and development is becoming more and more prominent, which makes energy enterprises gradually carry out transformation and development to adapt to the mode of economic development at the present stage. The impact of the development of green economic growth mode is comprehensive and macro, which can not only promote the development of environmental protection technology within enterprises and bring value added in the field of research and development but also accelerate energy conservation and emission reduction and drive the sustainability of the overall economy [1]. The essence of the transformation of energy enterprises is to change from the traditional material economy to the green economy and from the unsustainable development model to the sustainable development model. As governments around the world vigorously promote green economy, and in the face of efficient and green economic growth mode, energy enterprises must also transform in time and regard green innovation as an important factor for enterprises to achieve efficient and stable development [2]. Although the economic activities of enterprises have negative externalities on the environment—for example, economic activities such as energy production and transportation bring greater costs to the society (such as pollution and congestion)—these enterprises often do not voluntarily bear these costs to promote the sustainable development of society. Currently, the promotion of government policies has become an important reason to promote the transformation of enterprises [3]. The successful realization of green transformation requires the continuous enrichment of policy instruments in terms of technology, capital, and trading mechanisms. For example, the government constantly encourages industrial enterprises to take green innovation as the driving force, formulate green strategies, and minimize industrial emissions through the greening of the whole process of industrial production, so as to achieve the balance between environmental benefits and economic benefits [4]. Meanwhile, for some specific industries, enterprise barriers have a direct negative impact on environmental innovation investment decisions, but some energy companies have shortcomings in technology and management and need certain policy support from the government. Under such circumstances, whether energy enterprises can objectively and accurately disclose their financial situation and decision-making deficiencies and obtain policy support is also one of the factors determining the success of their transformation [5]. Therefore, in the case of increasing carbon constraints in the future, banks need to pay special attention to whether enterprises with high carbon emission risks can reasonably disclose their carbon-related financial risks in their credit reports when choosing whether to make loans [6].
In addition, many scholars who have also narrowed the scope of research, studying and analyzing the factors of power enterprise transformation, have said that the influence of the internal factors of enterprises is dominant. Pressure and uncertainty within energy companies are also important factors driving the green transformation [7]. How to reduce the uncertainty in the development of enterprises, maximize the reasonable balance between cost and price, so as to effectively resolve the internal financial risks, is the key to promote the power enterprises to achieve green transformation [8,9,10]. In addition, global warming is becoming more and more serious, and the environmental protection values, attitudes, and concepts of corporate managers will affect the formulation of corporate green transformation strategies [11]. Increasing the innovation and upgrading of renewable energy technologies to achieve efficient and stable power generation will affect the speed of the green transformation of enterprises [12]. In addition to the internal factors of the enterprise itself, the external environmental factors will also affect the transformation and upgrading of electric power enterprises. The most important external factors are the development cycle of the power industry and external market conditions [13,14].
In summary, the analysis of factors related to energy enterprise transformation in previous studies can mostly start from a single perspective of internal and external enterprises, but mostly focus on internal factors, ignoring the possible synergistic effect of internal and external factors. The influence of both on energy enterprise transformation is intertwined and complementary. In addition, there is a gap in the research and analysis of the segmentation of energy enterprises (such as thermal power enterprises, wind power enterprises, and photovoltaic enterprises), which cannot reflect the characteristics of different types of energy enterprises.
2.2. The Application of DEA in Efficiency Evaluation of Energy Enterprises
At present, many scholars at home and abroad use the DEA model to study the efficiency of energy enterprises in a region from three levels: national, provincial, and industrial. In terms of the study on the efficiency of Chinese energy enterprises, the non-radial DEA model is used to evaluate the resource utilization efficiency of energy enterprises and take CO2 as the undesirable output, so as to study the energy-saving potential and CO2 emission reduction potential of Chinese provinces, and provide theoretical suggestions for the Chinese government’s environmental governance [15]. The DEA model is improved and upgraded, and a DEA model containing non-homogeneous, input–output factors is constructed to study the environmental efficiency of China’s industrial sector [16,17]. In addition, the thermal power industry of China’s provinces is taken as the research object; the power generation is expected, SO2, NOx and soot are not expected, and the DEA method is used to evaluate and analyze the energy efficiency. The conclusion is that the green performance of China’s thermal power industry is generally low, the difference between provinces and cities is large, and the regional characteristics are obvious [18].
Some scholars also use the DEA model to conduct research on the energy efficiency of enterprises in many countries around the world and put forward relevant suggestions. The non-radial directional distance function was used to measure the energy efficiency of the national power sector, and then the efficiency differences among countries were compared [19]. At the same time, through efficiency comparison, it can be observed that per capita energy consumption and per capita gross domestic product (GDP) growth will have a positive impact on energy intensity, and environmental regulation can restrict the entry of high-pollution and high-emission enterprises, thereby promoting the improvement of energy efficiency [20].
In addition, some scholars take EU member states as research objects and use the DEA model to study the efficiency of energy enterprises. For example, taking the relationship between economic development, energy efficiency and natural gas consumption of EU member states as the research object, and taking total fixed capital and total labor force as the independent variable analysis indicators in the DEA model, it is concluded that the efficiency of energy enterprises in European Allies is related to the policy system and energy intensity [21], and the efficiency differentiation between the countries and regions is also relatively serious. In addition, through the efficiency evaluation and analysis of energy enterprises, it is also concluded that the appropriate adjustment and guidance of energy prices are of great benefit to improving energy efficiency. This plays an important role in improving government policy [22,23].
In sum, previous scholars mostly used the DEA model to complete research on national-, provincial-, and industry-related efficiency and lacked research on relevant efficiency values of energy enterprises (such as investment efficiency, innovation efficiency, and promotion efficiency, etc.) and specific energy enterprises (traditional energy enterprises or clean energy enterprises). In addition, most scholars only use the traditional DEA model to study the efficiency of energy enterprises.
2.3. Application of LMDI in Enterprise Factor Analysis
The LMDI model can gradually decompose the contribution rate of each factor to the increase in energy consumption and then build a complete decomposition model of the energy consumption level and analyze the main factors of energy consumption [24]. Taking China as an example, through the study of the changing trend in coal consumption, it is found that the per capita GDP has a positive impact on coal demand [25]. Reducing the output scale and adjusting the industrial structure can restrain coal demand and greatly slow down carbon dioxide emissions [26].
Moreover, the LMDI decomposition method is also used to analyze the influencing factors of energy extraction and use level and the change in the carbon emissions of industries and sectors. When the LMDI decomposition method was used to study the factors affecting carbon dioxide emissions in China’s industrial sector, population size, GDP, industrial structure, and energy structure were taken as the research factors, and it was found that reducing the energy intensity and improving the energy structure can greatly reduce carbon emissions [27,28]. But the energy intensity effect is a key driver of reducing CO2 emissions in some regions [29].
In addition to the Ministry of Industry, the LMDI decomposition method can also be applied to the study of carbon emission factors in different industries. In manufacturing, an increase in economic output is an important measure to slow down carbon emissions in the manufacturing industry [30,31]. In the service industry, taking energy demand data as samples, the LMDI model was used to classify the influencing factors into economic growth, energy efficiency, alternative energy, industrial structure, and energy intensity. The study found that the most important factor affecting energy demand in France’s services sector is economic growth [32]. In the transport sector, by assessing the contribution of each of the major factors that contribute to carbon emissions, it was found that the rapid growth of carbon emissions in Tunisia is mainly due to the increasing level of transport, of which road transport is dominant [33].
For the power industry, the LMDI model is also one of the important methods to explore the factors affecting the change in greenhouse gas emissions. From a national perspective, the power generation industry of seven major countries in Asia Pacific and North America was studied, and it was found that the power structure also has a positive effect on the rise of carbon emissions, and that the change in energy intensity is a factor that inhibits the growth of carbon emission [34]. By incorporating more influential factors into the LMDI model for verification, it was further found that economic growth and GDP increase are also the most important driving factors for the rise of carbon emissions in the power generation industry [35]. From a regional perspective, it was found that the carbon emission intensities of 30 provinces in China show a downward trend [36]. For specific thermal power industries, the LMDI model can be used to determine the change in regional thermal power carbon emissions [37]. Based on China’s regional power grid division standard, it can be found that reducing the thermal power energy intensity and changing the thermal power energy structure have a positive impact on reducing China’s thermal power carbon emissions [38]. In addition, it was found that the eastern coastal region significantly improved thermal power energy efficiency during the study period, and the western region performed well in clean energy development and power structure optimization [39].
In general, current studies on the application of the LMDI model mainly focus on the influencing factors of energy consumption and carbon emissions, and most of the influencing factors are energy structure, energy intensity, and population economic scale. There are many research gaps in the relevant influencing factors of green transformation, and even fewer studies on the driving effects of green transformation in the energy industry or enterprises.
2.4. Summary
In previous studies, most scholars only used regression analysis to determine the factors affecting the green transformation of energy enterprises, but failed to analyze the types of energy enterprises and the dynamic change degree of each influencing factor. At the same time, in the past, when the DEA method was used to measure the efficiency of energy enterprises, it was mostly based on a regional perspective and ignored the differences in various links in the daily operation process of enterprises as operating entities. Therefore, this study adopts a dynamic, two-stage, network DEA method to evaluate the efficiency of different links in the operation of thermal power enterprises, respectively. At the same time, the LMDI method is used for dynamic analysis of different factors affecting the green transformation of enterprises, filling the gap of existing research in this direction.
3. Method and Data
3.1. Dynamic Two-Stage Network DEA Method
This study aims to address the issues arising from static analyses and regional disparities by segmenting the approach into two stages: the first is the profit stage, and the second is the transformation stage. Assuming that there are n decision-making units (DMUs) (g = 1, …, n), each with k partitions (k = 1, …, k) and n time periods (T = 1, …, T), each DMU has an input and an output in time period T and a carry-over (link) in the next time period T + 1 to the next time period (g = 1, …, n). The inputs and outputs of each partition K by K (K, h) i denote the divisions from k to h, and n and Lhk denote the set of divisions from k and h. We show the inputs and outputs, links, and carry-over definitions as follows:
Inputs and outputs:
. This refers to input at time period for division .
. This refers to output in time period for division .
Links:
. This refers to the period links from (b) the process of time during which the scheme is to be implemented. The following is a conclusion of the period of the scheme of work . Here, represents the number of links from one division to another, while h links refer to the quantity.
.
Carry-overs:
. This refers to the carry-over from time period (t) to period (t + 1). This includes division to division , where represents the number of carry-over items in division . The quantity of input links for every division is represented by link . Similarly, link signifies the quantity of output links for every division . Each division has a certain number of favorable carry-overs, represented by . Conversely, the number of unfavorable carry-overs for each division is represented by the quantity of output links for each division, denoted by n .
What follows is the model that is non-oriented.
- (a)
- Goal function
Overall efficiency:
Subject to
- (b)
- Efficiencies of period and divisionEfficiencies of period and division are as follows:
- Period efficiency:
- Division efficiency:
Division period efficiency:
- (c)
- Input, desirable output, and undesirable output efficiencies:
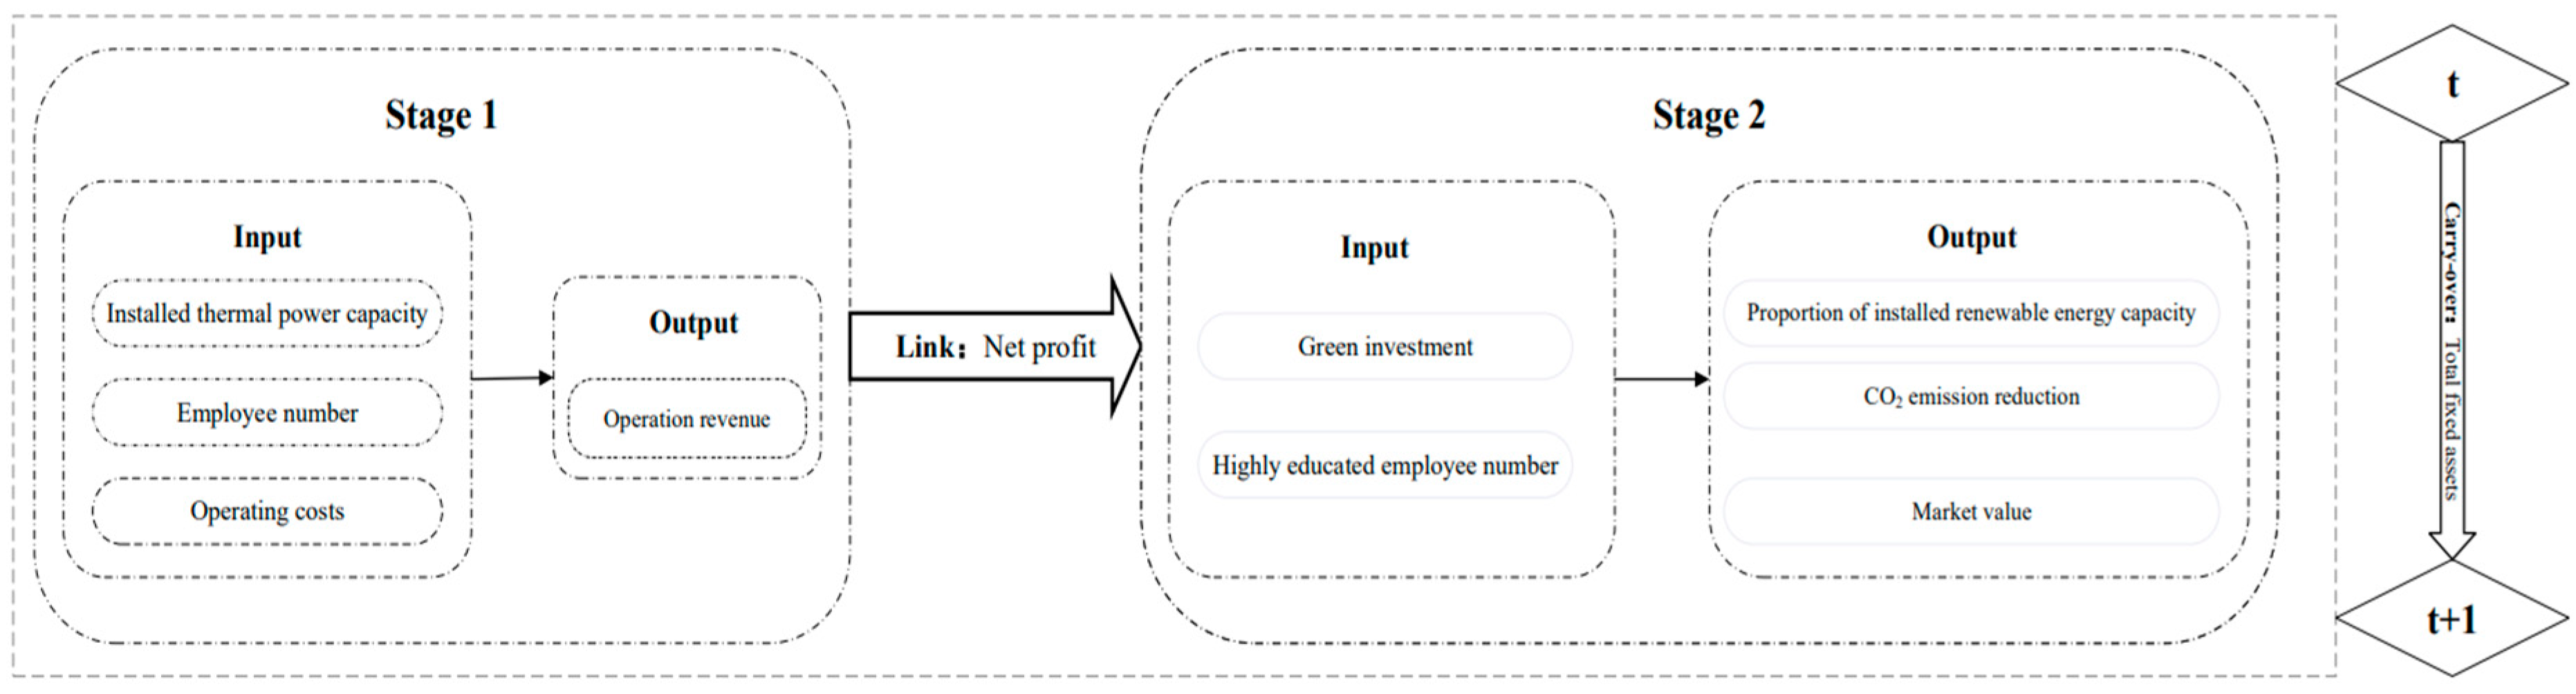
To address any potential bias in traditional efficiency indicators, we used the total factor energy efficiency index. When the planned investment is consistent with the actual investment, efficiency equals 1, indicating complete efficiency. When the planned investment is less than the actual investment, the efficiency drops below 1, indicating overall low efficiency. This article selects data from 30 listed thermal power companies in China from 2018 to 2022, mainly based on the top 50 thermal power companies in the A-share market in 2022, excluding thermal power companies that have been listed for less than five years. Appendix A summarizes the specific names and locations of thermal power enterprises in the research sample. Figure 1 shows the research framework and related indicators for evaluating the green transformation efficiency of thermal power enterprises based on the dynamic, two-stage, network DEA model. The main design idea of the dynamic, two-stage, network DEA model is as follows: The evaluation process of green transformation efficiency of Chinese thermal power enterprises is divided into profit stage (S1) and transformation stage (S2). The first stage is the profit stage, during which Chinese thermal power enterprises operate normally, laying a solid foundation for subsequent green transformation. At this stage, we choose the installed thermal power capacity, number of employees, and operating costs as inputs, operating income as output, and net profit as the correlation with the second stage. The second stage is the transformation stage, with green investment and the number of highly educated employees as inputs, and the proportion of renewable energy installed capacity, carbon dioxide emissions reduction, and market value as outputs. The T period and T + 1 period are connected by the carry-over variable of total fixed assets. The specific explanations of each indicator are shown in Table 1 below.
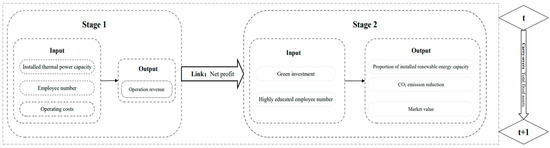
Figure 1.
Research framework and related indicators of green transformation efficiency evaluation of thermal power enterprises based on dynamic two-stage network DEA model.

Table 1.
Descriptions of model variables.
3.2. LMDI Method
As shown in Table 2, based on the existing original data indicators, the green transformation efficiency is decomposed into the following:
Table 2.
Construction indicators of Kaya identity of green transformation efficiency of Chinese thermal power enterprises.
The change in the green transformation efficiency from the base period to year t is called , which is composed of the following five parts: sewage cost effect (), traditional dependence effect (), production capacity effect (), operation capacity (), and tax pressure effect ().
Note: The lower corners t and 0 of the variables in the formula represent year t and the base period, respectively.
3.3. Descriptive Statistics of Typical Indicators
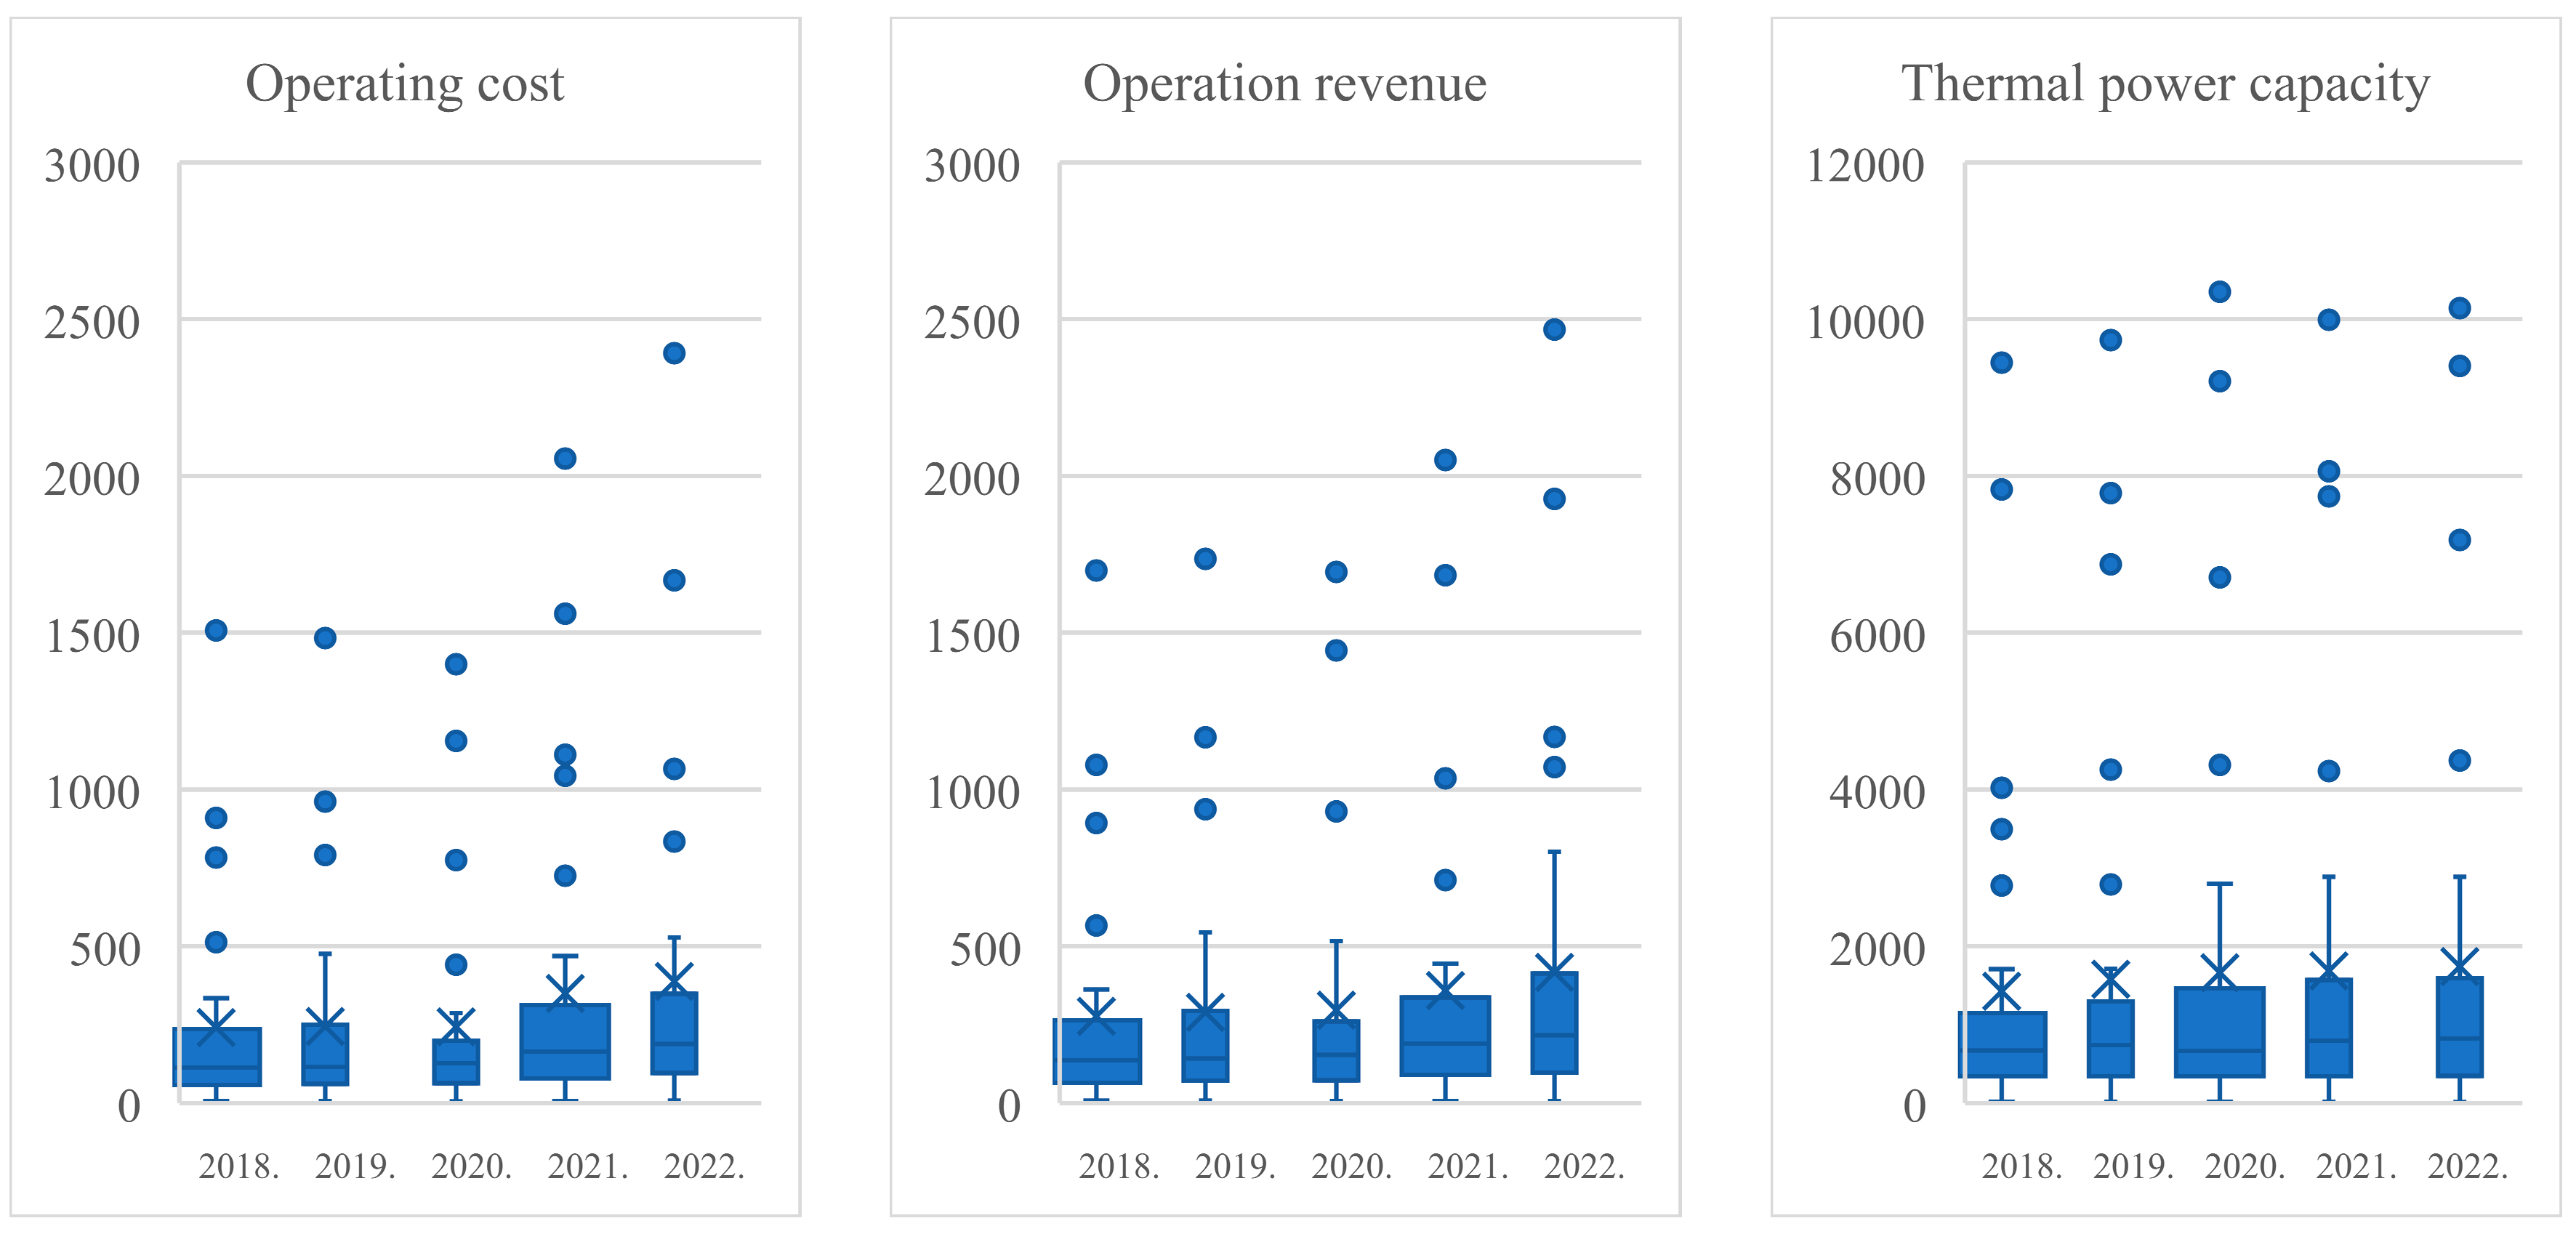
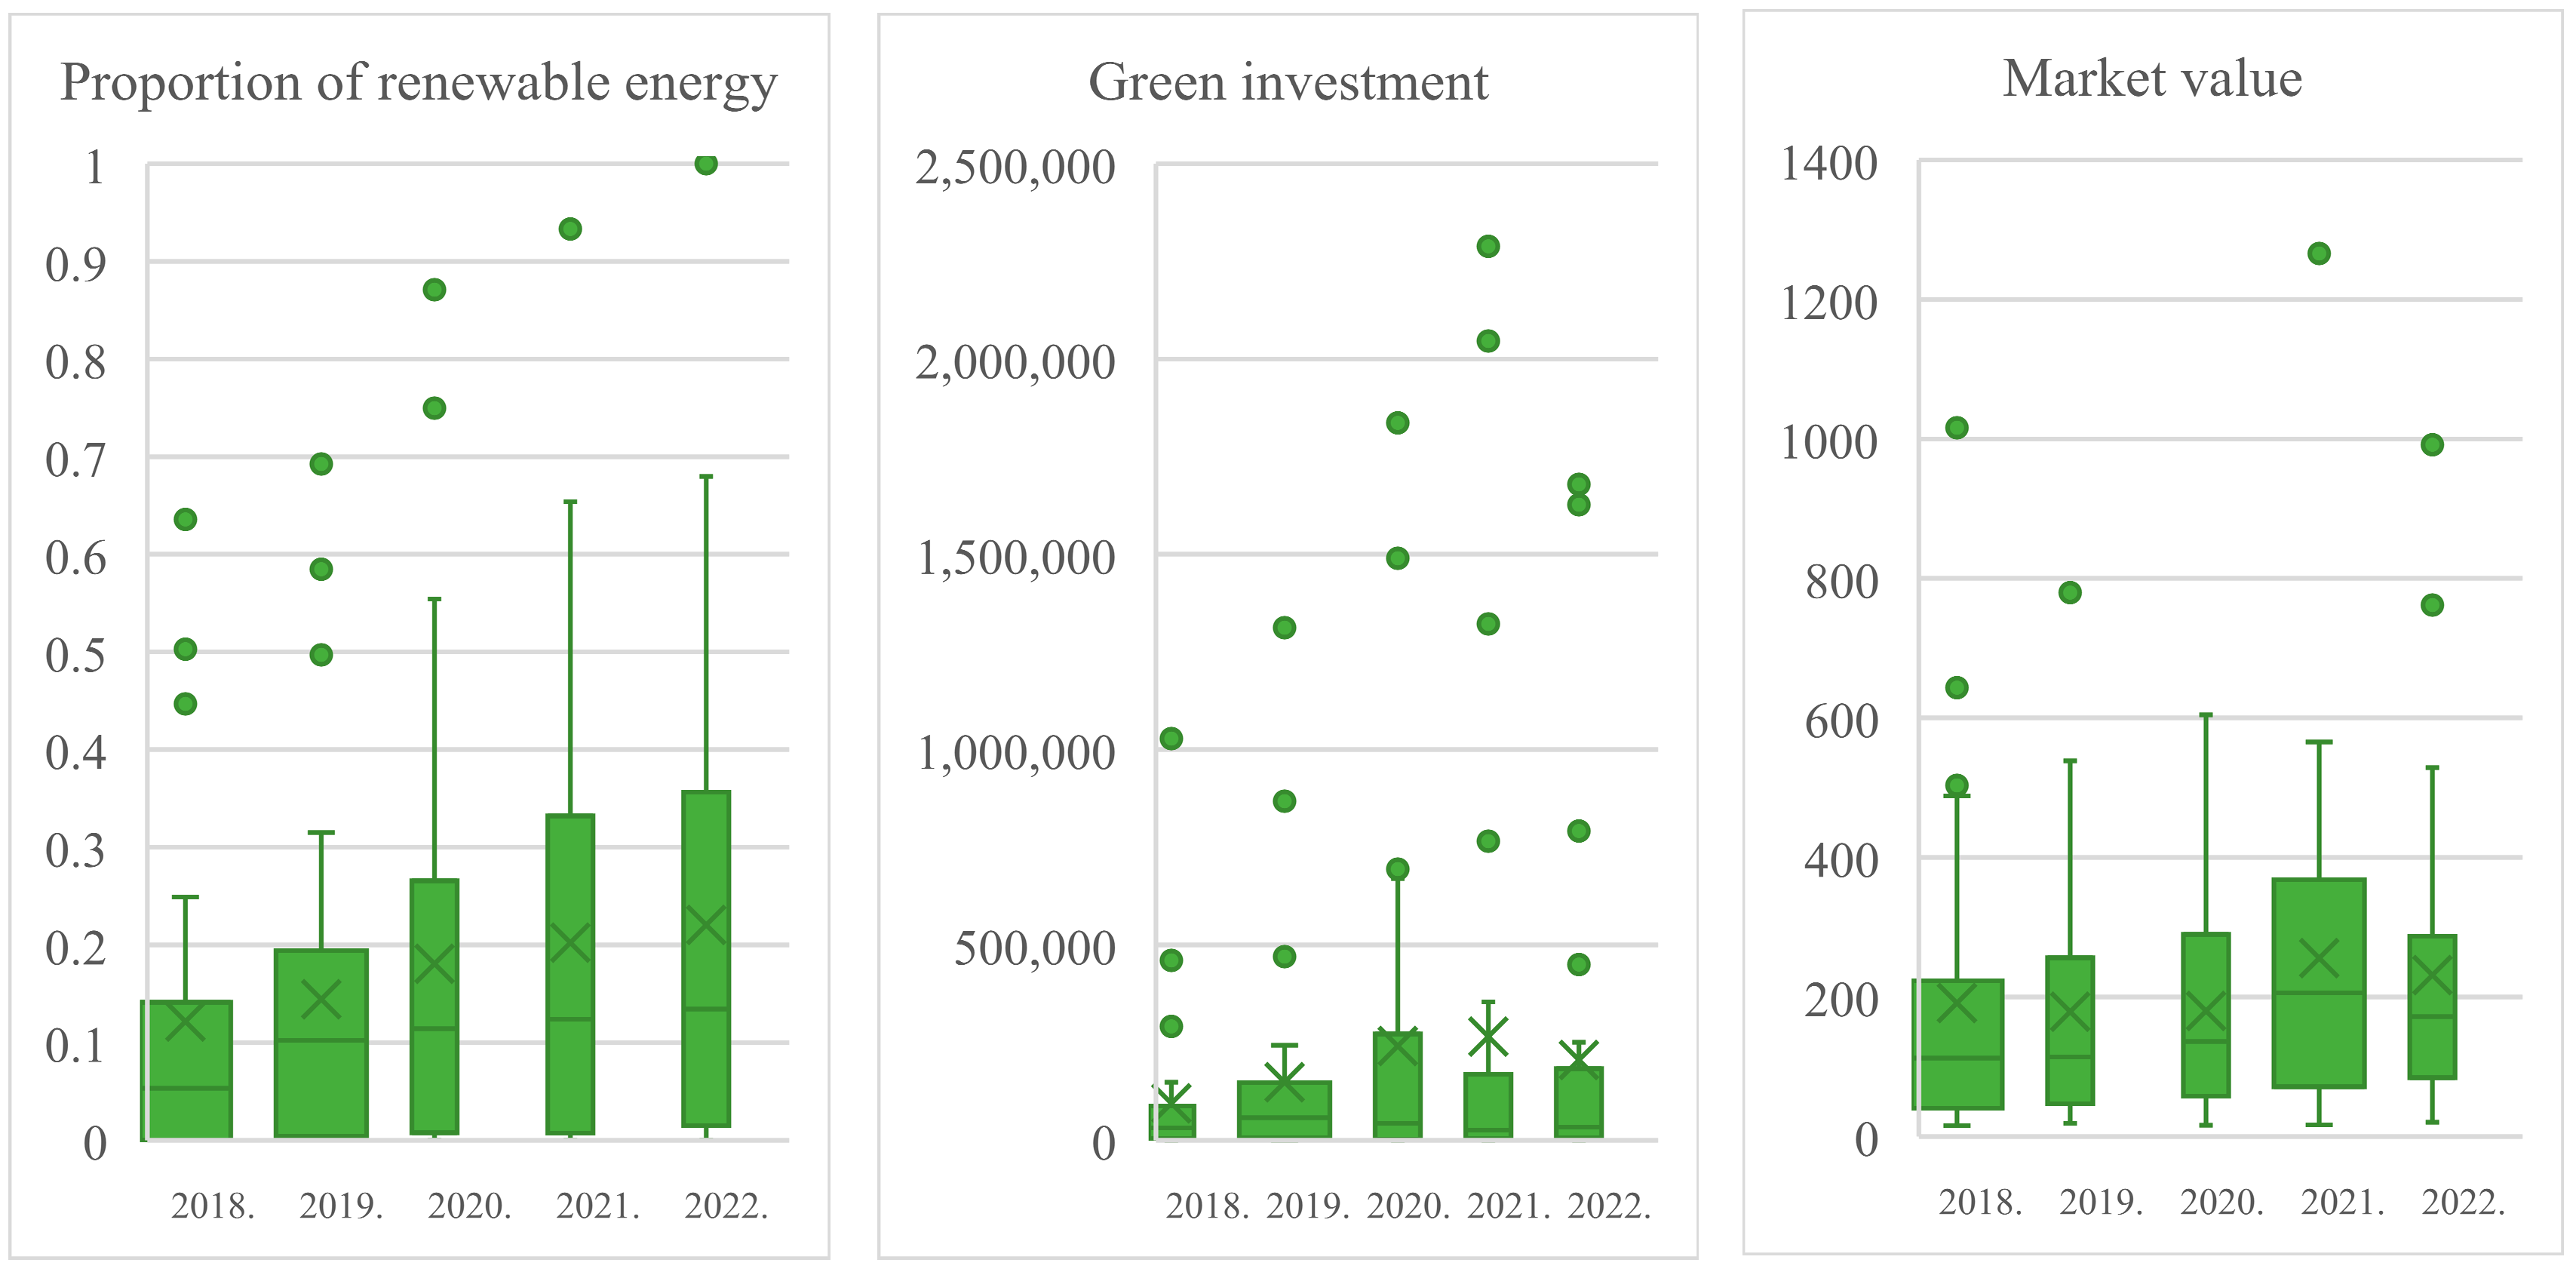
This study selects the average value and maximum value of typical input–output indicator data in the first stage (profit stage) and the second stage (transformation stage) and analyzes the data change trend. See Figure 2 and Figure 3 for details.

Figure 2.
Changes in the first-stage indicators from 2018 to 2022.
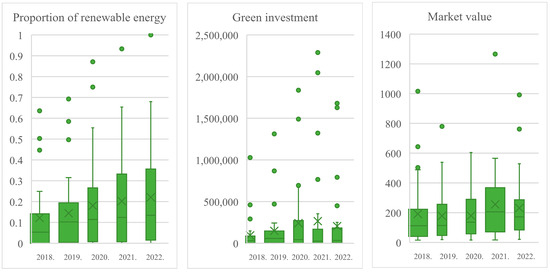
Figure 3.
Changes in the second-stage indicators from 2018 to 2022.
In stage 1, the installed thermal power capacity, operating cost, and operating revenue are selected. As shown in Figure 2, the installed thermal power capacity has been growing over the study period, but the growth rate in 2018–2020 is significantly higher than the growth rate in 2020–2022. However, the quantitative change trend in operating cost and operation revenue is basically the same, which first increases in 2018–2019, then reaches the minimum in 2020, and finally increases year by year to 2022. And the operation revenue does not increase with operating costs.
In stage 2, the green investment, the proportion of installed renewable energy capacity, and the market value were selected. As shown in Figure 3, green investment shows a rapid growth trend from 2018 to 2020, while it suddenly decreases in 2021 and shows a slow growth in 2021–2022. The proportion of installed renewable energy is increasing year by year, but there are still enterprises that have not cleaned up their installed capacity in 2018–2021, and one company has cleaned up all its installed capacity in 2022. The market value of thermal power enterprises also showed a trend of first increasing and then decreasing and reached a peak in 2021.
4. Empirical Analysis
4.1. Analysis of Green Transformation Efficiency of Thermal Power Enterprises in China
4.1.1. Total Efficiency Analysis
From 2018 to 2022, as shown in Figure 4, the average total efficiency value of these 30 thermal power enterprises was 0.6165, and the overall performance was fair. Moreover, the internal differentiation degree of the total efficiency value was relatively high, with only 17% of the enterprises in the excellent range of efficiency value higher than 0.85, and 57% in the poor range of efficiency value lower than 0.6. However, thermal power enterprises with excellent efficiency value generally have the characteristics of being small-scale, and their installed capacity is basically less than 5 million kilowatts (kW). At the same time, the installed capacity of thermal power enterprises with poor efficiency values is usually larger, generally higher than 25 million kW. This indicates that managers of large thermal power enterprises should pay more attention to the efficiency of their green transformation and try to avoid excessive reliance on old traditional energy equipment to ensure the stability of power supply, which ultimately leads to low efficiency.
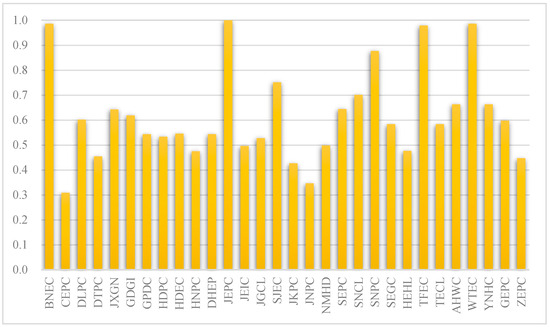
Figure 4.
Comparison of green transformation efficiency of China’s listed thermal power enterprises from 2018 to 2022.
4.1.2. Stage Efficiency Analysis
Table 3 and Table 4 present the efficiency values of Chinese thermal power enterprises in the profit stage and the transformation stage, respectively. Among them, the average efficiency value of thermal power enterprises in the profit stage is 0.8708, which is higher than the efficiency value of 0.3738 in the transformation stage. This indicates that the profitability of Chinese thermal power enterprises is significantly higher than their own transformation ability.
Table 3.
Efficiency changes in Chinese thermal power enterprises at the profit stage.
Table 4.
Efficiency changes in Chinese thermal power enterprises in the transformation stage.
As shown in Table 3, the profit stage efficiency value of 5 enterprises always remains unchanged at 1, and the profit stage efficiency value of 23% thermal power enterprises keeps increasing during the study period, while the profit stage efficiency of more than 60% thermal power enterprises shows a decreasing trend. However, from the perspective of the average efficiency value in the profit stage, it shows an inverted “U” shape, which reaches the highest value of 0.8897 in 2020.
As shown in Table 4, the efficiency value of four enterprises in the transformation stage always remains unchanged at 1, and the efficiency value of 26% keeps increasing during the study period, while the efficiency of most of the remaining thermal power enterprises fluctuates in the transformation stage. From the perspective of the change in the average efficiency in the transformation stage, the study period shows a “U”-shaped pattern, which decreased sharply from 0.4602 in 2018–2019 to 0.2185 in 2019, recovered year by year after 2019, and recovered to more than 0.4 in 2022.
The changes in efficiency values during the two stages provide the following insights for managers of thermal power enterprises. Managers should pay attention to their own profit efficiency while ensuring their own green transformation efficiency and try to avoid the loss of profit efficiency caused by excessive investment of enterprise resources in the green transformation process.
4.1.3. Sub-Index Efficiency Analysis
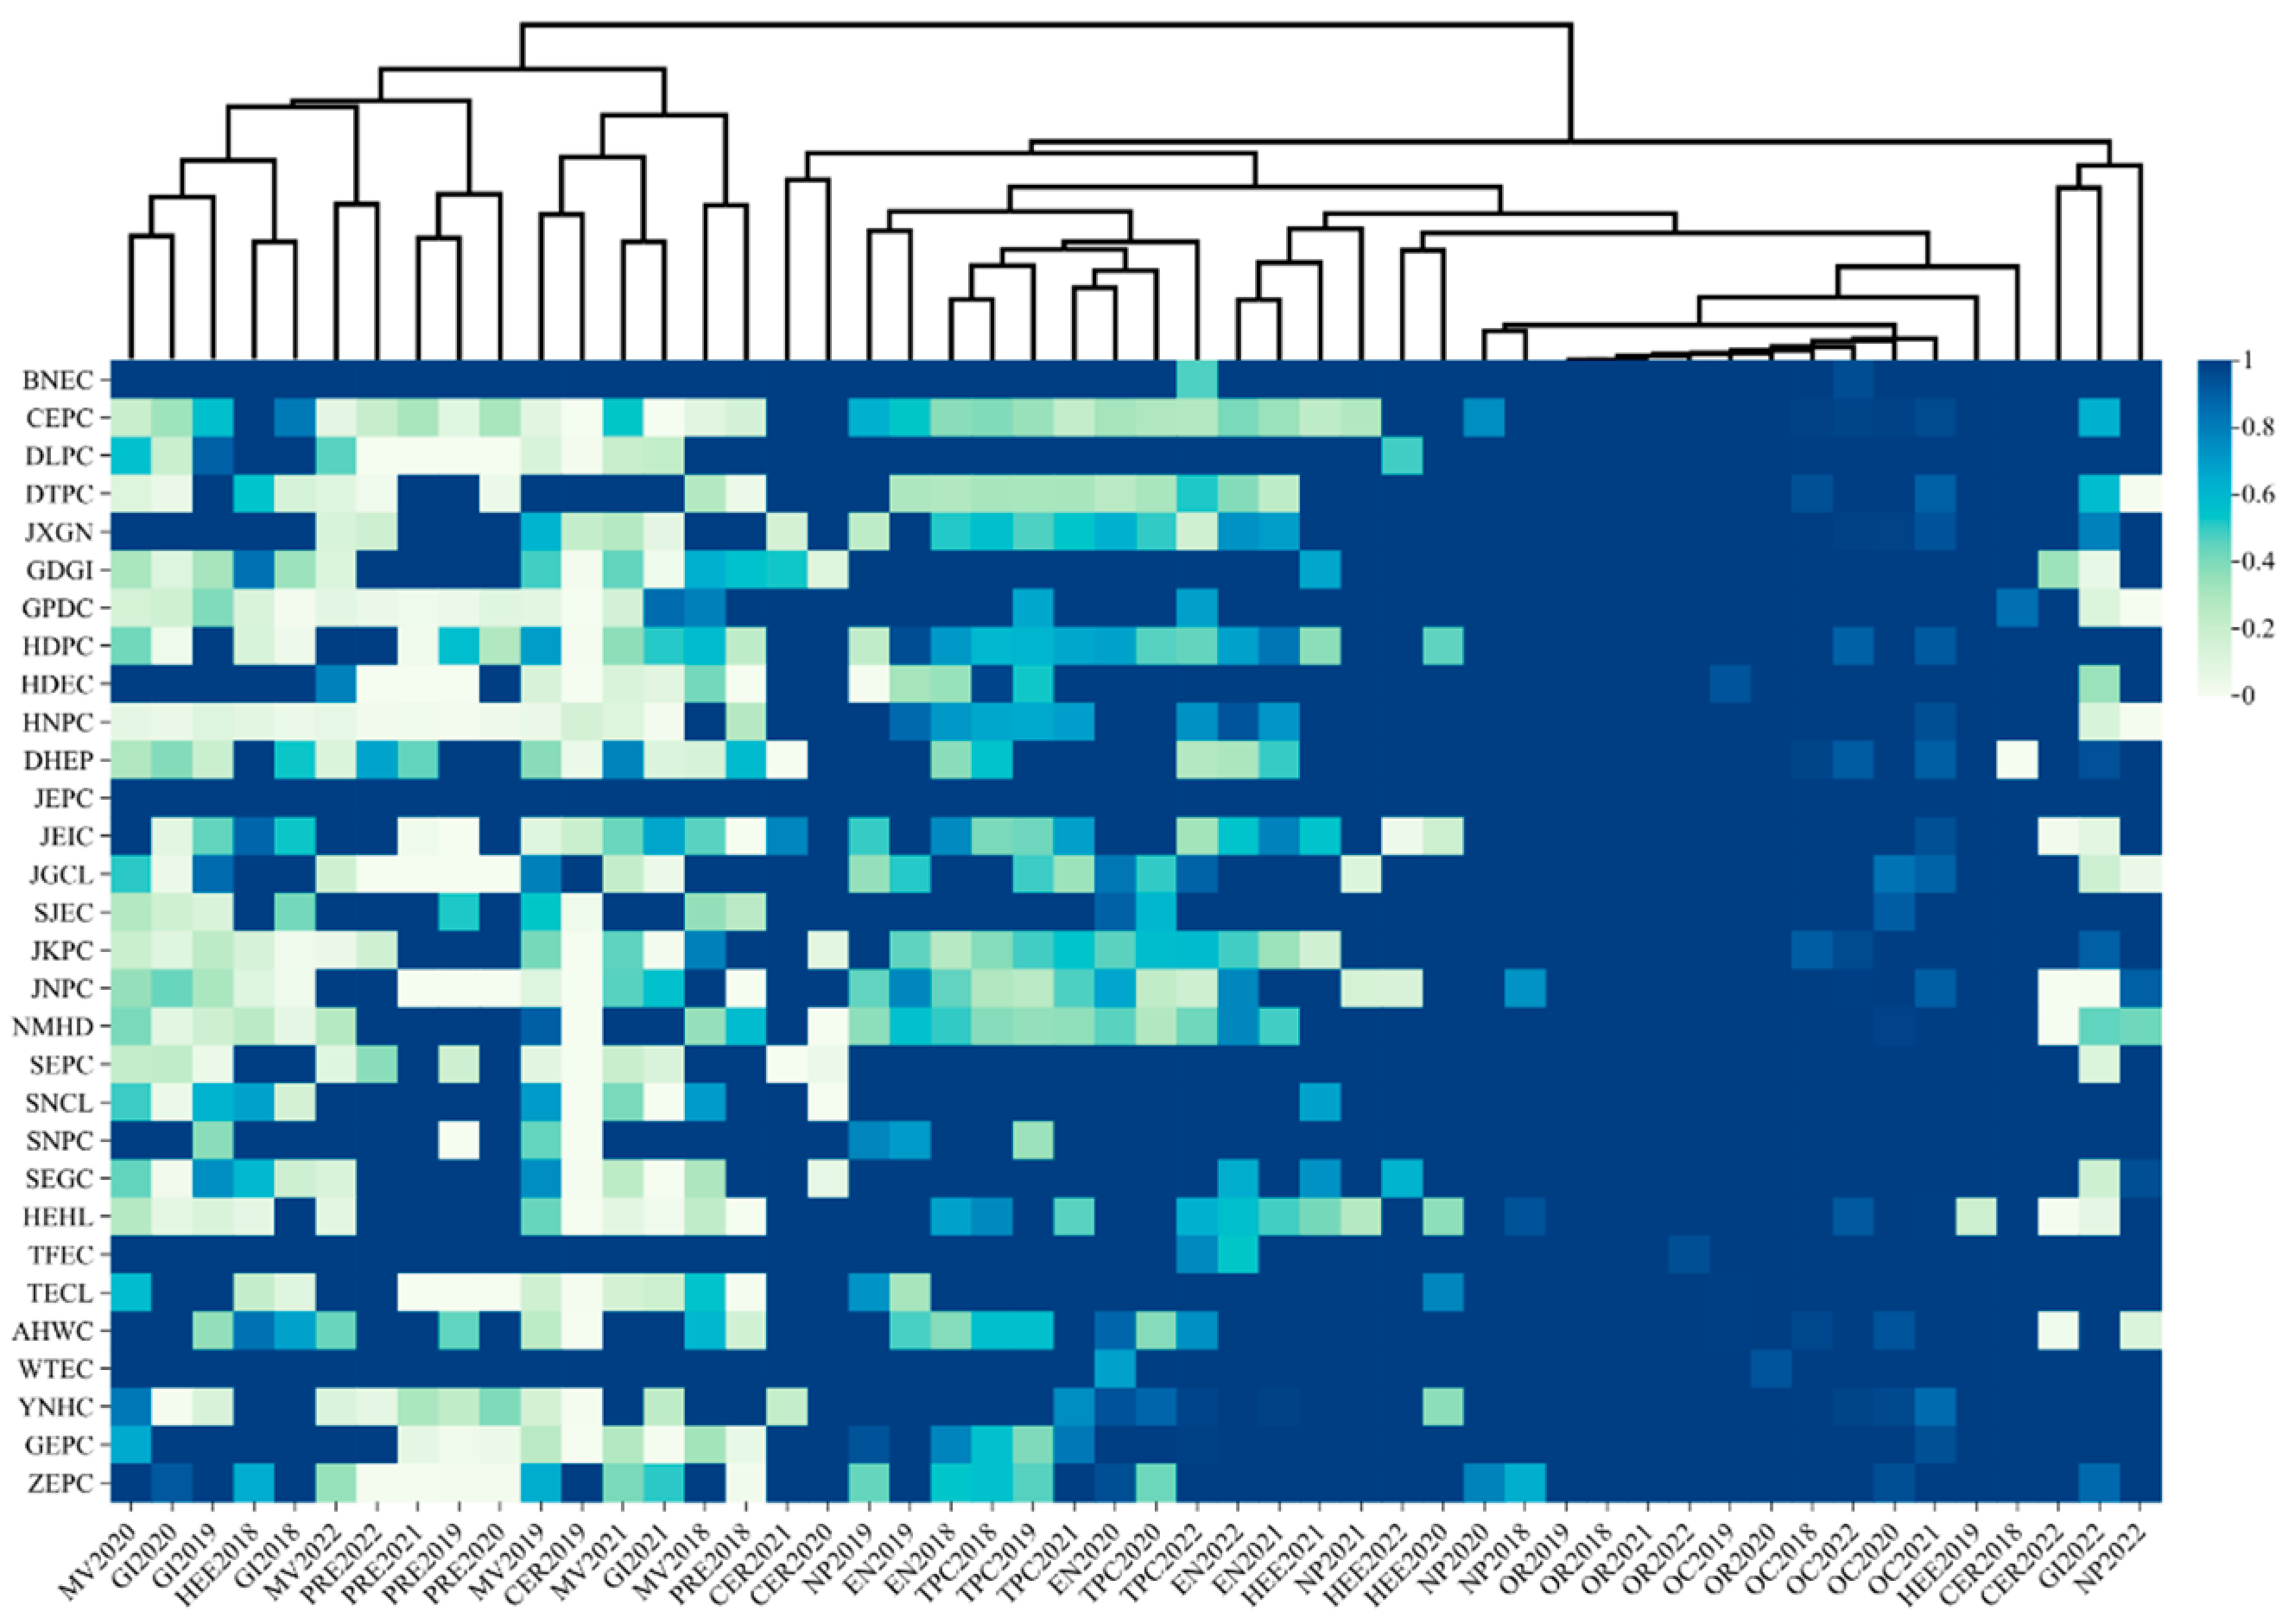
In terms of sub-index efficiency, the index efficiency shows a “U”-shaped trend, and the lowest point of its efficiency value occurs in 2019 or 2020, that is, during the period when China was affected by COVID-19. This shows that although the efficiency of various sub-indicators has been reduced due to COVID-19, they have quickly recovered. Figure 5 shows the sub-index efficiency clustering of all indicators based on the European distance method clustering.

Figure 5.
Clustering of sub-index efficiency based on the Euclidean distance method clustering.
According to the clustering results, it can be found that operating costs (OCs) and operation revenue (OR) show a strong correlation, indicating that the income level of Chinese thermal power enterprises depends only on their own investment cost level and is almost unaffected by other factors such as market competition. This may be due to the state-owned monopoly position of Chinese thermal power enterprises in their respective regions. Although its market value (MV) is related to two indicators of the transformation phase, it has a strong correlation with proportion of installed renewable energy capacity (PRE) in 2018 and 2022. However, in the remaining years, it has a strong correlation with green investment. This indicates that the green transformation process of Chinese thermal power enterprises can effectively enhance the confidence of investors and the market in their future development, thereby increasing their market value. However, other input indicators such as employee number (EN) and highly educated employee number (HEE) did not show correlation with the MV of thermal power enterprises. This indicates that thermal power enterprises can moderately reduce the investment of technical talent resources and invest more enterprise resources in green transformation equipment to improve their own green transformation efficiency. However, CO2 emission reduction (CER) did not show a significant correlation with any of the indicators, indicating that the green transformation of thermal power enterprises does not necessarily reduce their carbon dioxide emissions. The reduction in carbon dioxide emissions may be influenced by multiple factors, especially when companies must use thermal power generation facilities to ensure the stability of electricity generation during peak periods; this viewpoint is also supported by Li’s research findings [40].
Managers of thermal power enterprises should be aware of the following facts: Conducting green investments in existing thermal power units of enterprises can help improve their performance in the capital market. Although the above research reflects that the green transformation of enterprises will affect their normal profits, from a long-term perspective, the green transformation of thermal power enterprises can increase their market value.
4.2. Analysis on Driving Effect of Green Transformation Efficiency of Chinese Thermal Power Enterprises
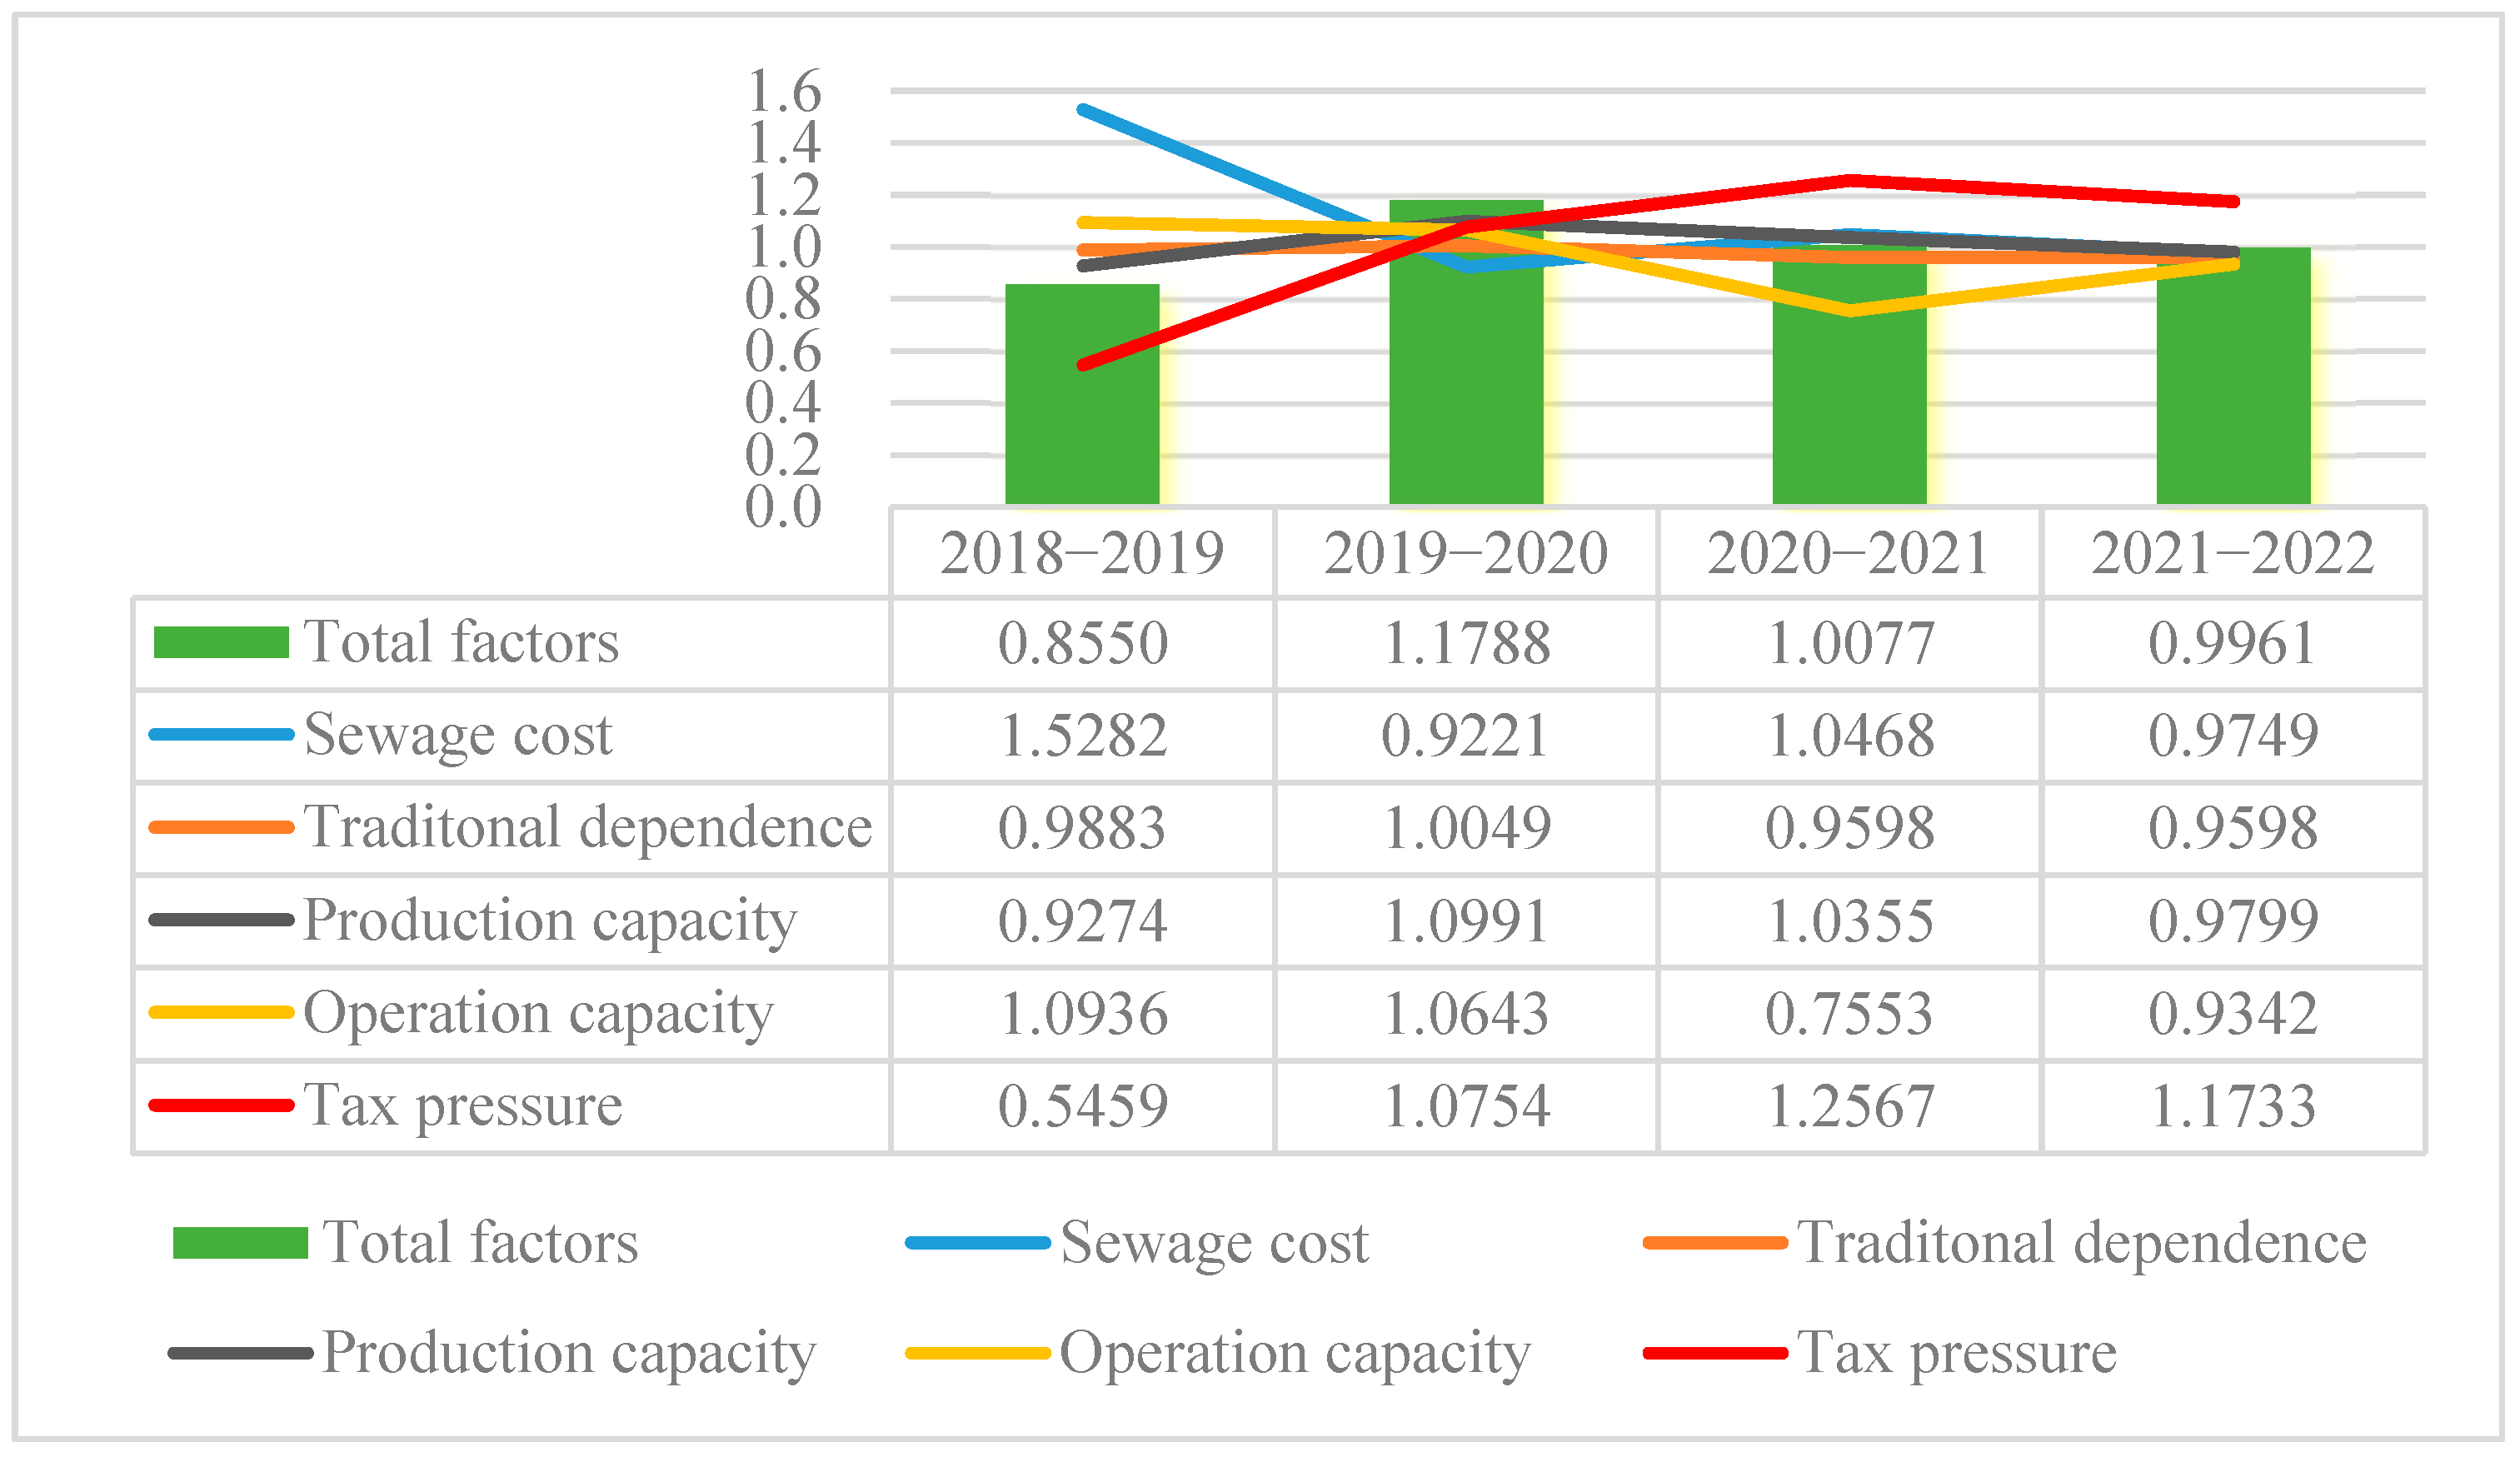
It can be seen from Figure 6 that the main influencing factors of the change in green transformation efficiency from 2018 to 2022 have basically the same degree of influence, among which the most important influencing factor is sewage cost, and the least important influencing factor is the operation capacity of the enterprises. Among them, the tax pressure factor changes the most during the study period, jumping from the factor with the least proportion in 2018–2019 to the factor with the highest proportion in 2021–2022. This shows that the increase in tax pressure is mainly due to the continuous growth of thermal power generation in the case that China’s sewage cost does not rise. However, the dependence of each thermal power enterprise on thermal power generation remains basically unchanged, which indicates that while increasing thermal power generation, thermal power enterprises are also constantly developing their renewable energy power generation capacity to achieve their own green transformation.
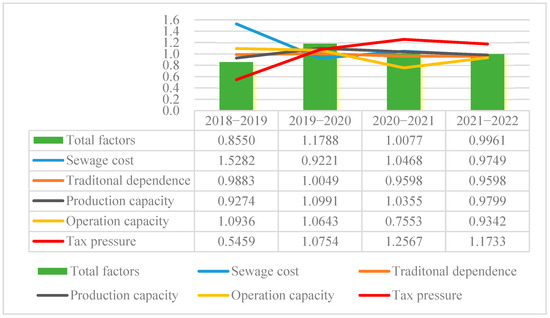
Figure 6.
Decomposition effect of changes in green transformation efficiency of Chinese thermal power enterprises.
5. Conclusions and Suggestions
5.1. Conclusions and Discussion
1. In terms of total efficiency, the average efficiency value of the Chinese thermal power enterprises was 0.6165, and the overall performance was relatively good. Among them, the efficiency value of enterprises with large installed scales is generally low, while that of enterprises with relatively low installed scales is high. This may be because thermal power enterprises with a high installed capacity need to be responsible for ensuring local power supply, while the current consumption capacity of renewable energy power generation in China is insufficient; therefore, thermal power generation is needed to ensure the stability of the power supply. This conclusion is consistent with the findings of Xu et al. and Dai et al., who found that small-scale thermal power enterprises have higher green transformation efficiency. However, this study believes that the larger the scale of thermal power enterprises, the lower the green transformation efficiency. This is different from Xu et al.’s conclusion that medium-sized thermal power enterprises have the lowest efficiency [41,42]. Future research can use mediation and threshold effect methods to determine the relationship between green transformation efficiency and the scale of thermal power enterprises more accurately.
2. In terms of stage efficiency, the profit stage efficiency of Chinese thermal power companies is generally higher than their transformation stage efficiency. Among them, the efficiency value in the profit stage shows an inverted-U-shaped trend, with the extreme value in 2020, while the efficiency value in the transformation stage is completely opposite, showing a “U”-shaped trend, with the extreme value in 2019. This may be because the transformation process of thermal power enterprises affects their profitability to some extent. This is similar to Bai et al.’s conclusion, which points out that the green transformation efficiency of thermal power enterprises is related to their own enterprise scale; however, there is no monotonic positive or negative relationship, which is also related to the above conclusion of this study [43].
3. In terms of sub-index efficiency, the efficiency index shows a “U”-shaped trend. Among them, the operating cost and revenue show a strong correlation, while the market value shows a certain correlation with the related indicators of green transformation. This indicates that the performance of thermal power enterprises is almost unaffected by other environmental factors, whereas the transformation process of thermal power enterprises helps improve their performance. This is consistent with Meng et al.’s finding that thermal power companies promoting their own green transformation performance can improve their financial performance and gain investors’ confidence in their future performance [44]. However, the existing findings are based only on the clustering results. To further determine the relationship between indicators, regression models can be used in the future to determine the significance of the indicators.
4. According to the decomposition of the influencing factors of the green transformation efficiency of Chinese thermal power enterprises by the LMDI, the most important factor affecting the green transformation efficiency of Chinese thermal power enterprises is the sewage cost they face, while their own operational capacity has the lowest impact on their green transformation. This shows that the main objective for thermal power enterprises to carry out green transformation is the pollutant discharge cost that they must bear. This is consistent with Huang et al.’s conclusion that when electricity prices are stable, the increase in pollution costs forces thermal power companies to carry out green transformations to reduce their operating costs [45]. However, this is contrary to the conclusion of Li et al. Li et al. believes that sufficient funding space can be provided for the green transformation process of thermal power enterprises by reducing pollution costs, while this study argues in the opposite direction that increasing pollution costs can force thermal power enterprises to accelerate their green transformation process [46].
5.2. Suggestions
For one thing, thermal power enterprises need to improve their independent innovation capabilities, increase R&D investment in key technologies of thermal power transformation, and constantly optimize their own energy structure. For another, the national government needs to improve the market mechanism, increase the financial support for the thermal power green transformation enterprises, provide policy support and financial guarantee for the low-carbon development, and increase the sewage costs to force thermal power enterprises to carry out green transformation.
Author Contributions
H.Z.: formal analysis and writing—original draft preparation. Y.B.: investigation and project administration. F.R.: conceptualization, methodology, and software resources. X.L.: data visualization and curation. All authors read and contributed to the manuscript. All authors have read and agreed to the published version of the manuscript.
Funding
This study was supported by Jiangsu Province Social Science Foundation Project (22GLD019), Major Project of Philosophy and Social Science Research in Universities of Jiangsu Province (2022SJZD053).
Data Availability Statement
The original contributions presented in the study are included in the article, further inquiries can be directed to the corresponding author.
Conflicts of Interest
The authors declare that the research was conducted in the absence of any commercial or financial relationships that could be construed as a potential conflict of interest.
Appendix A
| NO. | DMU | Abbreviation |
| 1 | Jointo Energy Investment Co., Ltd. Hebei. | JEIC |
| 2 | Xinjiang Tianfu Energy Co., Ltd. | TFEC |
| 3 | Huadian Power International Corporation Limited | HDPC |
| 4 | Beijing Jingneng Power Co., Ltd. | JNPC |
| 5 | Wintime Energy Group Co., Ltd. | WTEC |
| 6 | Huadian Energy Company Limited | HDEC |
| 7 | Huaneng Power International, Inc. | HNPC |
| 8 | Inner Mongolia MengDianHuaNeng Thermal Power Corporation Limited | NMHD |
| 9 | Shanghai Electric Group Company Limited | SEPC |
| 10 | Datang International Power Generation Co., Ltd. | DTPC |
| 11 | Shenyang Jinshan Energy Co., Ltd. | SJEC |
| 12 | Jinneng Holding Shanxi Electric Power Co., Ltd. | JKPC |
| 13 | Henan Yuneng Holdings Co., Ltd. | YNHC |
| 14 | Jiangsu Guoxin Corp., Ltd. | JGCL |
| 15 | GD Power Development Co., Ltd. | GPDC |
| 16 | Shenergy Company Limited | SNCL |
| 17 | Shenzhen Energy Group Co., Ltd. | SEGC |
| 18 | Guangdong Electric Power Development Co., Ltd. | GEPC |
| 19 | Datang Huayin Electric Power Co., Ltd. | DHEP |
| 20 | Zhejiang Zheneng Electric Power Co., Ltd. | ZEPC |
| 21 | CHN Energy Changyuan Electric Power Co., Ltd. | CEPC |
| 22 | Guangzhou Hengyun Enterprises Holdings Ltd. | HEHL |
| 23 | AnHui Wenergy Company Limited | AHWC |
| 24 | Top Energy Company Ltd. Shanxi | TECL |
| 25 | Dalian Thermal Power Co., Ltd. | DLPC |
| 26 | Jiangxi Ganneng Co., Ltd. | JXGN |
| 27 | Jilin Electric Power Co., Ltd. | JEPC |
| 28 | Shenzhen Nanshan Power Co., Ltd. | SNPC |
| 29 | Guangdong Baolihua New Energy Stock Co., Ltd. | BNEC |
| 30 | Guangzhou Development Group Incorporated | GDGI |
References
- Morgera, E.; Savaresi, A. A Conceptual and Legal Perspective on the Green Economy. Rev. Eur. Community Int. Environ. Law 2013, 22, 14–28. [Google Scholar] [CrossRef]
- Ferguson, P. The green economy agenda: Business as usual or transformational discourse? Environ. Politics 2015, 24, 17–37. [Google Scholar] [CrossRef]
- Parry, I. Encyclopedia of Energy, Natural Resource, and Environmental Economics; Elsevier: Amsterdam, The Netherlands, 2013; p. 3. [Google Scholar]
- Dalia, D.; Nils, D. Green, circular, bio economy: A comparative analysis of sustainability avenues. J. Clean. Prod. 2017, 168, 716–734. [Google Scholar]
- Claudia, G.; Susanna, M.; Massimiliano, M.; Mariangela, Z. Financial barriers and environmental innovations: Evidence from EU manufacturing firms. Clim. Policy 2017, 17, S131–S147. [Google Scholar]
- Kathleen, H.; Ru, G.; Peter, C. Evidence on whether banks consider carbon risk in their lending decisions. J. Bus. Ethics 2019, 158, 155–175. [Google Scholar]
- Davis, G.; Owens, B. Optimizing the level of renewable electric R&D expenditure using real options analysis. Energy Policy 2003, 31, 1589–1608. [Google Scholar]
- Maeda, M.; Watts, D. The unnoticed impact of long-term cost information on wind farms’ economic value in the USA-A real option analysis. Appl. Energy 2019, 241, 540–547. [Google Scholar] [CrossRef]
- Hooman, K.; Amjad, A.; Javier, C.; Pierluigi, S. Risk-involved optimal operating strategy of a hybrid power generation company: A mixed interval-CVaR model. Energy 2021, 232, 120975. [Google Scholar]
- Sun, Y.; Jiang, J.; Yang, Y. Climate change risks and financial performance of the electric power sector: Evidence from listed companies in China. Clim. Risk Manag. 2023, 39, 100474. [Google Scholar] [CrossRef]
- Giorgos, P.; Spyros, L. Values, attitudes and perceptions of managers as predictors of corporate environmental responsiveness. J. Environ. Manag. 2012, 100, 41–51. [Google Scholar]
- Gielen, D.; Boshell, F.; Saygin, D. The role of renewable energy in the global energy transformation. Energy Strategy Rev. 2019, 24, 38–50. [Google Scholar] [CrossRef]
- Kenc, T.; Ekinci, M. Business Cycles and Energy Real Options Valuation; Springer eBooks: Berlin/Heidelberg, Germany, 2021; pp. 173–200. [Google Scholar]
- Nunes, L.; Marcus, V.; Matt, D. Switch and defer option in renewable energy projects: Evidences from Brazil. Energy 2021, 231, 120972. [Google Scholar] [CrossRef]
- Bian, Y.; He, P.; Xu, H. Estimation of potential energy saving and carbon dioxide emission reduction in China based on an extended non-radial DEA approach. Energy Policy 2013, 63, 962–971. [Google Scholar] [CrossRef]
- Liu, Y.; Wang, K. Energy efficiency of China’s industry sector: An adjusted network DEA (data envelopment analysis)-based decomposition analysis. Energy 2015, 93, 1328–1337. [Google Scholar] [CrossRef]
- Wu, J.; Li, M.; Zhu, Q.; Zhou, Z. Energy and environmental efficiency measurement of China’s industrial sectors: A DEA model with non-homogeneous inputs and outputs. Energy Econ. 2019, 78, 468–480. [Google Scholar] [CrossRef]
- Bi, G.; Song, W.; Zhou, P.; Liang, L. Dose environmental regulation effect energy efficiency in China’s thermal power generation? Empirical evidence from a slacks-based DEA model. Energy Policy 2014, 66, 537–546. [Google Scholar] [CrossRef]
- Zhou, P.; Ang, B.; Wang, H. Energy and CO2 emission performance in electricity generation: A non-radial directional distance function approach. Eur. J. Oper. Res. 2012, 221, 625–635. [Google Scholar] [CrossRef]
- Sanja, F. Determinants of energy intensity in the European Union: A paneldata analysis. Energy J. 2015, 11, 10–16. [Google Scholar]
- Sergey, B.; Yuriy, B.; Wadim, S.; Dalia, S. Energy efficiency and natural gas consumption in the context of economic development in the European Union. Renew. Sustain. Energy Rev. 2016, 10, 51–55. [Google Scholar]
- Camioto, F.; Moralles, H.; Mariano, E. Energy efficiency analysis of G7 and BRICS considering total-factor structure. J. Clean. Prod. 2016, 2, 61–66. [Google Scholar] [CrossRef]
- Miroslav, V.; Sanja, F.; Mirjana, R. Electricity prices and energy intensity in Europe. Util. Policy 2017, 10, 1011–1016. [Google Scholar]
- Carmona, M.; Collado, R. LMDI decomposition analysis of energy consumption in Andalusia (Spain) during 2003–2012: The energy efficiency policy implications. Energy Effic. 2015, 9, 807–823. [Google Scholar] [CrossRef]
- Chong, C.; Ma, L.; Zheng, L. Logarithmic mean Divisia index (LMDI) decomposition of coal consumption in China based on the energy allocation diagram of coal flows. Energy 2015, 85, 366–378. [Google Scholar] [CrossRef]
- Shao, S.; Yang, L.; Gan, C.; Cao, J. Using an extended LMDI model to explore techno-economic drivers of energy-related industrial CO2 emission changes: A case study for Shanghai (China). Renew. Sustain. Energy Rev. 2016, 55, 516–536. [Google Scholar] [CrossRef]
- Liu, L.; Fan, Y.; Wu, G. Using LMDI method to analyze the change of China’s industrial CO2 emissions from final fuel use: An empirical analysis. Energy Policy 2007, 35, 5892–5900. [Google Scholar] [CrossRef]
- Zhao, M.; Tan, L.; Zhang, W.; Ji, M. Decomposing the influencing factors of industrial carbon emissions in Shanghai using the LMDI method. Energy 2010, 35, 2505–2510. [Google Scholar] [CrossRef]
- Wu, R.; Zhang, J.; Bao, Y.; Lai, Q. Decomposing the Influencing Factors of Industrial Sector Carbon Dioxide Emissions in Inner Mongolia Based on the LMDI Method. Sustainability 2016, 8, 661. [Google Scholar] [CrossRef]
- Ren, S.; Yin, H.; Chen, X. Using LMDI to analyze the decoupling of carbon dioxide emissions by China’s manufacturing industry. Environ. Dev. 2014, 9, 61–75. [Google Scholar] [CrossRef]
- Jaruwan, C.; Paitoon, W.; Atinat, B. An LMDI decomposition analysis of carbon emissions in the Thai manufacturing sector. Energy Rep. 2020, 6, 705–710. [Google Scholar]
- Nicolas, M.; Fabrice, D. Determinants of energy demand in the French service sector: A decomposition analysis. Energy Policy 2009, 37, 2734–2744. [Google Scholar]
- Manel, D. Using the LMDI Decomposition Approach to Analyze the Influencing Factors of Carbon Emissions in Tunisian Transportation Sector. Int. J. Energy Econ. Policy 2018, 7, 22–28. [Google Scholar]
- Malla, S. CO2 emissions from electricity generation in seven Asia-Pacific and North American countries: A decomposition analysis. Energy Policy 2009, 37, 1–9. [Google Scholar] [CrossRef]
- Ram, M.; Gabrial, A.; Migara, L. Factors affecting CO2 emission from the power sector of selected countries in Asia and the Pacific. Energy Policy 2009, 37, 2375–2384. [Google Scholar]
- Tan, Z.; Li, L.; Wang, J. Examining the driving forces for improving China’s CO2 emission intensity using the decomposing method. Appl. Energy 2011, 88, 4496–4504. [Google Scholar] [CrossRef]
- Zhou, G.; Chung, W.; Zhang, Y. Carbon dioxide emissions and energy efficiency analysis of China’s regional thermal electricity generation. J. Clean. Prod. 2014, 83, 173–184. [Google Scholar] [CrossRef]
- Yan, Q.; Qian, Z.; Xin, Z. Decomposition analysis of carbon dioxide emissions in China’s regional thermal electricity generation, 2000–2020. Energy 2016, 112, 788–794. [Google Scholar] [CrossRef]
- Liu, N.; Ma, Z.; Kang, J. A regional analysis of carbon intensities of electricity generation in China. Energy Econ. 2017, 67, 268–277. [Google Scholar] [CrossRef]
- Li, D.; Wang, H.; Li, Y. Incentive Mechanisms for Thermal Power Generation Enterprises with Conflicting Tasks: Electricity Production versus Carbon Emission Reduction. Sustainability 2023, 15, 10420. [Google Scholar] [CrossRef]
- Xu, Y.; Wang, Z.; Chiu, Y.; Ren, F. Research on energy-saving and emissions reduction efficiency in Chinese thermal power companies. Energy Environ. 2020, 31, 903–919. [Google Scholar] [CrossRef]
- Dai, L.; Wang, M. Study on the influence of carbon emission constraints on the performance of thermal power enterprises. Environ. Sci. Pollut. Res. 2020, 27, 30875–30884. [Google Scholar] [CrossRef]
- Bai, Y.; Hua, C.; Jiao, J.; Yang, M.; Li, F. Green efficiency and environmental subsidy: Evidence from thermal power firms in China. J. Clean. Prod. 2018, 188, 49–61. [Google Scholar] [CrossRef]
- Meng, X.; Gou, D.; Chen, L. The relationship between carbon performance and financial performance: Evidence from China. Environ. Sci. Pollut. Res. 2023, 30, 38269–38281. [Google Scholar] [CrossRef] [PubMed]
- Huang, S.; Lin, H.; Zhou, Y.; Ji, H.; Zhu, N. The Influence of the Policy of Replacing Environmental Protection Fees with Taxes on Enterprise Green Innovation—Evidence from China’s Heavily Polluting Industries. Sustainability 2022, 14, 6850. [Google Scholar] [CrossRef]
- Li, Y.; Mao, J.; Chen, S.; Yang, D. Tax-reducing incentive and corporate green performance: What we learn from China. Renew. Energy 2022, 199, 791–802. [Google Scholar] [CrossRef]


Disclaimer/Publisher’s Note: The statements, opinions and data contained in all publications are solely those of the individual author(s) and contributor(s) and not of MDPI and/or the editor(s). MDPI and/or the editor(s) disclaim responsibility for any injury to people or property resulting from any ideas, methods, instructions or products referred to in the content. |
© 2024 by the authors. Licensee MDPI, Basel, Switzerland. This article is an open access article distributed under the terms and conditions of the Creative Commons Attribution (CC BY) license (https://creativecommons.org/licenses/by/4.0/).