
Energy and Carbon Savings in European Households Resulting from Behavioral Changes


Faculty of Architecture, Wrocław University of Science and Technology, 50-370 Wrocław, Poland
Energies 2024, 17(16), 3888; https://doi.org/10.3390/en17163888
Submission received: 5 July 2024
/
Revised: 25 July 2024
/
Accepted: 1 August 2024
/
Published: 7 August 2024
(This article belongs to the Special Issue Research of Energy Storage and Energy Efficiency in Buildings and Cities)
Abstract
:The study evaluates the impact of behavioral changes resulting from climate awareness on energy consumption and carbon emissions in European households based on the results of a two-stage survey addressed to individuals manifesting pro-ecological attitudes. In the first stage, the author analyzed 67 pro-environmental behaviors declared by the participants, identified a set of new sustainable choices, and compared them to the conservation habits used in Rasch and Campbell’s models. The 10 most popular initiatives undertaken by over 50% of participants were selected for further analysis. The influence of these initiatives on energy consumption and CO2 emissions was assessed. A total of 24 impact indicators were identified at the building scale. Energy and carbon savings were calculated for 500 participants from 28 European countries and compared to the results computed for the 100 households used as a reference. The main conclusions from the research concern the significance of individual decisions at the building scale in the context of their actual environmental impact calculated for a larger scale. The comparative analysis showed that the highest annual energy (2292.1 MWh) and emission (267.02 tons of CO2) savings resulted from the car-to-bicycle (or walking) transition on short-distance trips (declared by 79%) and from the transition from non-renewable to renewable energy sources (PV panels installed by 65% of respondents). Annual energy and emission savings reached, respectively, 1300 MWh and 262.6 tons of CO2. The research findings help explain the critical importance of transforming the built environment towards renewable energy sources and supporting pedestrian and sustainable transportation.
1. Introduction
At the beginning of the third decade of the 21st century, the urgent need to counteract the negative effects of climate change has become one of the top priorities of international organizations [1]. On 11 March 2024, the European Environment Agency published the European Climate Risk Assessment (EUCRA), which provides the latest analysis of how changing temperatures will affect Europe [2]. It shows that Europe is the fastest-warming continent in the world. Extreme heat, fires, and droughts are becoming more frequent while precipitation patterns are changing. Recent years have seen catastrophic floods in various regions. At the same time, southern Europe can expect a considerable decline in overall rainfall and more severe droughts. Reacting to the findings highlighted by the EUCRA and to the latest Copernicus reports, on 12 March 2024, the European Commission published a Communication on Managing Climate Risks [3], which set out how the EU can effectively anticipate the growing climate-related risks and build resilience to the impacts of climate change. The Communication underlined the necessity to radically cut greenhouse gas emissions in this decade and to achieve climate neutrality by 2050. The document also highlighted the importance of the EU Mission on Adaptation to Climate Change, which suggests best practices through peer learning, promoting innovation, citizen engagement, and building resilience to climate change. Increased consciousness of climate threats influences shifts in pro-environmental attitudes. Therefore, it is very important to understand the real impact resulting from individual citizens’ decisions, as well as to determine which actions are of crucial significance for building resilience to climate change. The above analysis triggered the research described in this article.
Growing environmental awareness is followed by concerns about the depletion of non-renewable resources [4] and excessive GHG emissions [5,6,7]. As the building sector is currently responsible for 40% of GHG emissions and a similar level of energy consumption [1], the energy efficiency and CO2 emissions from buildings [8] are perceived as important issues, which in turn leads to enhanced research on renewable and sustainable energy [9,10] and adequate design methods [11,12], including advanced concepts such as artificial-intelligence-assisted techniques [13]. Interest in forecasting energy availability and prices is also growing [14]. Aspects of improved thermal performance [15] have been studied with the aim of providing optimal comfort and reduced energy consumption [16]. Renewable energy applications are recognized as solutions to energy poverty [17]. The topic of energy efficiency has been analyzed together with vernacular and bioclimatic strategies [18,19,20] and, in the pursuit of energy-efficient building design solutions [21], various definitions of occupant behavior have been created, especially in residential buildings [22].
There has been well-documented research in the fields of environmental activism, consumerism, occupant behavior, and energy conservation [23,24,25]. Various behavior models, such as the Rasch measurement [25], allow for the analysis of pro-ecological behaviors based on the attitude of the average citizen in a given country [26]. The existing models are related to the impact of occupant behaviors on building-energy analysis [27], the influence of occupant behavior on household electricity consumption [28], occupant-centric building-control strategies to reduce building-energy use [29], the modeling of building-occupant impact on energy and indoor environmental performance [30], occupant-behavior modeling methods for resilient building design [31], real data-driven occupant-behavior optimization for reduced energy consumption and improved comfort [32], and the modeling of occupant behavior in buildings [33]. However, the existing models may not fully reflect currently occurring changes in the patterns of pro-environmental behavior. In the housing environment, and especially at the scale of neighborhood units, so-called “green ambassadors” play an increasingly important role [34].
Internationally, the perception of environmental activism is changing [35]. The importance of “green role models” is especially growing among people aged under 30, instead of the greatest interest in environmental issues being among the older generation, which has been noted so far [36]. Young people demonstrating pro-environmental attitudes have attracted numerous followers [37,38]. Although their behavior is in line with the EU’s policy regarding the need to combat climate change, they show several non-conformist and anti-systemic attitudes [26]. This clearly observable shift in attitudes prompted the author of this article to replace the method of a survey conducted on statistical groups, commonly used in relation to pro-environmental attitudes, with a study strictly focused on social groups determining the direction of change.
The research presented in this paper was conducted in 2021 and 2022 with the aim of evaluating and discussing the influence of newly identified individual sustainable choices and initiatives on energy consumption and CO2 emissions in households. The author applied innovative, unconventional methods and compared the results to well-established models such as Rasch and Campbell’s. A tailor-made two-stage survey was directed to individuals who manifested distinct and meaningful pro-ecological attitudes. Based on the responses of 500 people from 28 European countries, the calculations of energy and emission impacts were carried out. The study revealed several behavioral changes related to rising responsibility towards planet Earth and its actual and future inhabitants. Some of the crucial changes were observed in attitudes towards sustainability and resilience in the built environment, as well as towards the environmental impact of human activities. The author argues that a bottom-up approach, used instead of purely statistical methods, better reflects actual behavior patterns in the fields of building and the environment, renewable energy, responsible consumption, and tackling climate change. The research allowed for the identification of 24 impact indicators related to energy and carbon footprint measured on a building scale. The study conclusions involved the evaluation of savings potential and the applicability of particular sustainable choices and identified changes in existing environmental behavior models. The research findings are aimed at supporting stakeholders and policymakers in enhancing observed behavioral changes. Drawing practical conclusions from the study can, for instance, encourage the addressing of issues hindering walkability in EU cities. One of the main values of the presented analysis is the comparison of the real impact of described behavioral changes arising from climate awareness on energy consumption and carbon emissions. Additionally, the paper should help interested readers to calculate on a household scale their own environmental impacts, inspiring the wider public to use the results of the research to make smart choices aimed towards sustainable living and planet safety.
2. Literature Review
An extensive literature review was carried out to identify the existing state of knowledge of the issues subject to research, including the latest developments and advances in knowledge regarding pro-environmental behavior and its impact on energy consumption and emissions in buildings in the context of climate change. Due to the complex nature of this study, the literature review was performed in several categories. The first part of the literature review concerned work in the area of GHG emissions and energy consumption in the context of climate change, including, for instance, the IPCC Report [1] and papers by Syed et al. [4] and Dunlap & Jones [23]. The second part of the analysis was performed with a specific focus on energy efficiency and GHG emissions in buildings. Pylsy, Lylykangas, and Kurnitski [8] analyzed the impact of building-energy efficiency on CO2 emissions. Slabe-Erker et al. [9] described energy efficiency in households as a small step towards decarbonization, while Wang et al. [10] examined buildings’ energy efficiency and performance predictions. Seyrek et al. [11] developed a set of parameters related to building façade design, energy efficiency, and GHG emissions. Mrówczyńska et al. [39] observed the dependencies between energy consumption, household standards, and socio-economic aspects. The next group of reviewed papers addressed the relationship between thermal comfort and energy efficiency in buildings. These issues were described by Merabet et al. [13], Jouhara & Sayegh [15], Widera [16], and Cubillos-González & Tiberio Cardoso [12].
Research on carbon-neutral building using life-cycle assessment was performed by Amoruso, Sonn, and Schuetze [5], Berrill et al. [40], and Raslan & Ambrose [41] as well as by Lausselet, Lund, and Brattebø [6]. A separate group of reviewed literature focused on environmental emissions from materials and processes. These papers include research on environmental emissions from plastic by Kawecki & Nowack [42], the energy required to produce several materials by Gutowski et al. [43], LCA of cultured meat production by Tuomisto & Teixeira de Mattos [44], GHG emissions from food production by Clune, Crossin, and Verghese [45], LCA of bottled- vs. tap-water systems by Dettore [46], and energy efficiency and environmental emissions of household appliances by Brunzell & Renström [47]. Aspects pertaining to carbon emissions from choosing sustainable materials for civil engineering applications were covered by Kumar et al. [48].
Several authors carried out research on photovoltaic panels in households. Lee & McCuskey Shepley [17] analyzed the benefits of solar systems and RES applications to fight energy poverty. Tsang, Sonnemann, and Bassani [49], and Contreras-Lisperguer et al. [50] performed a life-cycle assessment of various types of PV solar panels using a cradle-to-cradle and cradle-to-grave approach. The works of Bucher et al. [7], Dagaut & Cathonnet [51], the US Department of Energy [52], and the European Environment Agency [53] addressed low-carbon mobility.
An important part of the literature review concerned the interdependencies between occupant behavior and building performance. Works by the following authors were analyzed: Chen et al. [22], Laskari et al. [24], Delzendeh et al. [27], Shen et al. [28], Berger & Mahdavi [30], Dong et al. [31], Amasyali & El-Gohary [32], Naylor et al. [29], and Lago et al. [14]. The last group of reviewed papers focused on the issue of user behavior and conservation habits. The reviewed works were authored by Wright & Masters [25], Byrka et al. [26], Carlucci et al. [33], Nilsson, Fielding & Dean [54], Rootes [35], Otto & Kaiser [36], Lorenzini, Monsch & Rosset [37], Kaiser & Wilson [55], Oladokun & Odesola [56] and Lapinski et al. [57]. A summary of the literature review is presented in Table 1.
Based on the literature review, the research methodology was conceived with a focus on the identified research gaps, i.e., the missing links between the actual pro-environmental attitudes and their measurable, comparable impact on energy consumption and GHG emissions resulting from new behavioral patterns analyzed on the household scale.
3. Materials and Methods
The research methodology comprised the following steps:
- literature review
- survey design using a theory-driven model based on the literature review
- questionnaire validation, including an external review of the survey items and a co-creative workshop aimed at questionnaire verification and improvement
- two-stage online survey with 500 people
- qualitative and quantitative analysis of survey results
- identification of the 10 most popular sustainable environmental initiatives out of 67 reported in the first stage of the survey
- development of 24 impact indicators with a focus on environmental impacts related to material, energy, and CO2 emissions for the 10 identified sustainable initiatives
- computation of 24 impact indicators using literature-driven calculation methods for material, energy, and CO2 emissions savings
- calculations of reduced annual carbon footprint, material, and energy consumption per household using a reference unit
The aims of the survey were defined as:
- Survey Stage I:
- Determining what kind of initiatives are undertaken on the scale of a single household by representatives of the examined group defined as “building users oriented toward minimizing the negative impact on the environment”.
- Survey Stage II:
- 2.
- Calculating the real significance of activities undertaken by this group in the context of the natural environment and tackling climate change;
- 3.
- Determining the degree of popularity of individual initiatives in the studied group in correlation with the calculated value of undertaken activities.
To test the reliability and validity of the questionnaire, the author ensured that the survey was designed to minimize respondent error, avoiding situations where the respondent responds to an item in a way that is different from the researcher’s intention [58]. A theory-driven model was followed, starting from the observation that the urgency of climate change has a strong influence on behavioral change in terms of pro-environmental attitudes. A validated theoretical model provided the basis for an instrument (information the researcher wanted to obtain by having people respond to survey items) and the items composing that instrument. The survey was derived deductively from the model constructed by the author drawing from the literature [59], which provided the first line of validity evidence for the survey [60]. Consequently, a survey design based on the model considered item fit, instrument length, item format, item discrimination, item clarity, order of items, and item effectiveness. Item fit and instrument length were pre-defined by the author based on the Rasch model [61]. Item format was designed to provide adequate responses (i.e., value and time intervals). Another way to improve validity was item discrimination using bipolar items that required the respondent to compare objectives [62]. Item clarity, order of items, and item effectiveness were verified with a representative group of respondents during a dedicated workshop. An external review of the items was performed using a set of checking questions, and the survey was modified based on feedback. In the second stage of the survey, the foundational model was derived bottom-up using a combination of grounded theory and statistical methods.
The selection of the first group of participants followed the Eurobarometer methodology, and the basic sampling design in all member states was a multi-stage, random (probability) one. The sampling was based on a random selection of sampling points after stratification by the distribution of the national resident population in terms of metropolitan, urban, and rural areas, i.e., proportional to the population size (for a total coverage of the country) and the population density. These primary sampling units were selected from each of the administrative regions in every country, using region nomenclature adopted by EUROSTAT (NUTS—nomenclature of territorial units for statistics). In the second stage, a cluster of addresses was selected from each sampled primary sampling unit. In this method, addresses are chosen systematically using standard random route procedures, beginning with an initial address selected at random. In each household, a respondent was selected by a random procedure, such as the first-birthday method. Up to two recalls were made to invite the selected respondent to the online workshop. No more than one participant was invited from each household. As a result, 50 people representing 28 countries (27 EU countries and the United Kingdom) joined the online workshop aimed at the development of the questionnaire. The first version of the questionnaire, proposed by the author of the paper and reviewed by two external experts, was discussed during the workshop, and the questions were modified to be easily understandable by the respondents.
The tailor-made two-stage survey was directed to the individuals who positively responded to invitations sent by e-mail. The participants were recruited through personal contacts, social media, university networks, and other sustainability-related environments (such as the PLEA conference, Youth Climate Conference, or the New European Bauhaus initiative established by the European Commission). The initial invitation included information on the purpose and scope of the survey, procedures for collecting, processing, storing, and using the data, as well as the way in which data are secured, including procedures for safeguarding privacy. The respondents clearly showed pro-ecological attitudes and the resulting actions. These people’s attitudes were noticed to influence several behavioral changes in their social environment. A total of 500 people living in 28 countries (27 EU countries and the United Kingdom) took part in the two-stage online survey.
The extremely high percentage of people who agreed to participate in the study was noted. This ratio was around 74% of people invited to contribute. A distinguishing feature of the examined group is the fact that the activities they undertake are not of an agitating character but have the typical nature of bottom-up activities. A total of 86% of survey participants did not consider themselves environmental activists, and most of their activities were related to a single household.
The bottom-up approach was used to identify new dominant pro-environmental attitudes and to compare them to existing, well-established patterns, such as 50 conservation behaviors grouped into six performance domains [55]. In the first stage of the survey, the participants had the opportunity to define their own pro-environmental activities. Of the 67 pro-environmental decisions and initiatives reported during the study, 16 were in line with the scale used in the Rasch model [25,26] and in Campbell’s approach [55]. These behaviors are presented and discussed in the Results and Discussion.
The second part of the research was aimed at better understanding the effects of individual sustainable choices and initiatives on buildings and the environment, with a particular focus on issues related to climate change, namely carbon emissions and energy consumption. In the second stage of the survey, the participants answered 10 questions with multiple choice answers. The responses allowed us to analyze the technological, societal, and economic potential of specific actions. The first round of calculations addressed the embodied energy and environmental emissions using the life-cycle assessment (LCA) method [46,47,49]. The second step involved the comparative analysis of energy savings [MWh/year] and reduced GHG emissions [kg CO2/year].
3.1. Survey Stage I
The first stage of the survey consisted of six open questions:
- What are your environmental/sustainable choices/initiatives? Please list up to 5.
- Do you believe your choices/initiatives have rather temporary or constant character? If possible, please indicate the timeline.
- What was the main rationale behind undertaking the aforementioned decisions?
- Do you think your individual choices have an influence on your household (the consumption of energy, water, and other resources, recycling, reduced amount of waste, and other elements of circular economy, etc.)?
- Do you observe the influence of your personal choices/sustainable initiatives on your friends/family/people you know? Could you provide any examples/numbers?
- Do you believe you contribute to the planet’s overall health and resilience? Have you ever tried to evaluate/calculate your environmental impact? Could you provide some examples?
Participants were instructed to complete only one questionnaire per household, relating the data contained therein to the entire household.
3.2. Survey Stage II
The first stage of the survey was followed by the second part of the survey with the same participants. Based on the initial results, the most popular environmental actions were identified, and their significance in terms of energy savings and reduced GHG emissions was assessed. From the 67 various forms of pro-environmental behavior declared during the first stage of research, the most popular 10 were selected for further analysis, while the threshold of 50% of participants indicated that particular behavior was applied. The second stage of the survey was aimed at collecting more detailed data necessary for the evaluation of the specific impacts resulting from individual sustainable choices and initiatives. For each activity, the calculation of environmental impacts, both positive and negative, was carried out. The outcomes were computed for individual households represented by the survey participants. Similar to the first stage, all participants were asked to provide data for the whole household, and only one questionnaire per household was submitted. It was observed that gender did not have a significant impact on research results, while the survey demonstrated that factors such as age and income of the survey participants influenced the analyzed environmental attitudes. Among the studied group of 500 people manifesting behavioral change oriented towards lowering energy consumption and carbon footprint, the most represented group was people under 30 years of age with a middle income. The survey statistics, including information on participant profile (country, gender, age, and income), are presented in Table 2, while more detailed information on the survey participants and the questionnaire from Stage II are included in Section S1.
A ranking of the top 30 sustainable behaviors that were demonstrated during the survey is presented in Table 3, with an indication of the behaviors that were previously considered pro-environmental [40,54,63,64,65]. Habits indicated by less than 10% of participants were not included in the list.
Energy consumption (both renewable and non-renewable) and greenhouse gas emissions were found to be the two key elements of environmental impact. To identify the behavioral changes resulting from climate-crisis awareness and to calculate their impact on energy consumption and carbon emissions in European households, a threshold of 50% confirmative responses was applied. The following 10 environmental initiatives, identified as the most popular on the building scale, were taken for further research and detailed impact calculation:
- Replacement of all the major appliances in the households with ones with the highest energy-efficiency index (59 ≤ EEI < 68 replaced with EEI ≤ 46), declared by 99% of respondents;
- Elimination of all disposable plastics from households, 96%;
- Replacing AC with natural ventilation, 86%;
- Drinking tap water (instead of bottled), 81%;
- Meat elimination from the diet, 80%;
- Transition from car to bicycle for short journeys, 79%;
- Laundry limited to 1 cycle/week, 77%;
- Decision not to fly (mid-distance journeys), 72%;
- Using renewable energy from PV roof panels instead of non-renewable energy, 65%;
- Replacing the lawn with a meadow, 51%.
3.3. Calculation Methods
Calculations were performed for each of the 10 most popular behavioral changes identified through the two-stage survey. The energy savings and avoided carbon emissions resulting from the application of the selected conservation habits in European households were computed. While the assumptions were based on the average of the numbers declared by the 500 people who participated in the survey, the established methods identified through the literature review were used. Whenever it was possible, the author gave the preference to life-cycle assessment. Calculations showed the correlation between the popularity, easiness, and accessibility of the particular initiative and its value in terms of reducing energy consumption and carbon footprint. For comparative purposes, all indicators were calculated for the actual number of participants that declared the specific behavioral change in the survey as well as for the 100 households taken as a reference. The detailed calculations are presented in Section S2.
3.3.1. Sustainable Environmental Initiative No. 1
“Completely eliminating disposable plastic packaging from the premises”.
This initiative was declared by 96% of respondents (480 people) and turned out to be the second most popular decision dictated by environmental concerns. The participants explained in the section dedicated to comments available in Stage II of the survey that this environmental initiative was possible through the fundamental change in the way the survey participants would shop. Respondents explained that they have been using exclusively reusable packaging when shopping, giving preference to retail facilities that allow this. Despite initial difficulties due to the need to change behavioral patterns, the decision was evaluated by the participants as easy to implement. The calculation does not include the impact of plastic bottles on drinking water since this impact was calculated separately, which is presented further in the article.
- Impact indicator no. 1:
- RP—Annual reduction of disposable plastic usage [tons of plastic per year]
- Calculation method:
Reduced total amount of plastic consumption in the households per year (52 weeks):
where 52 is the number of weeks per year, RPHw is an average reduction of plastic consumption per week per household estimated based on the survey results as 0.6 kg per household, and Cn is the number of consumers resulting from the survey responses. In this case, Cn is 480 people. It was agreed with the participants on the initial stage that the provided data are relevant for the whole household and each household (HH) is represented by only one person who responded to the survey and filled the questionnaires in Stage I and Stage II. The same approach is applied to each category subject for calculation. The calculated total amount of reduced disposable plastic consumption resulting from the survey is 14.98 tons of plastic per year. The calculated total amount of reduced disposable plastic consumption per 100 households is 3.12 tons of plastic per year.
- Method limitations:
The emissions were calculated solely for residential waste since the survey respondents never left litter in the environment, which would be typically included in the total environmental impact of plastic waste [42].
- Impact indicator no. 2
- REP—Annual reduction of embodied energy of plastic [MWh per year]
- Calculation method:
- REP—The reduced embodied energy from plastic:where Rp is the reduced total amount of plastic consumption in the households per year calculated by Equation (1), and EP is an embodied primary energy of plastic, i.e., the total amount of energy required to produce 1 kg of plastic (from crude oil), calculated by [43]. EP remains in the range of 62–108 MJ with an average value of 85 MJ. The reduced embodied energy from plastic calculated for the survey results with Equation (2) is 353.6 MWh per year. The reduced embodied energy from plastic calculated for 100 HH is 73.667 MWh per year.
- Method limitations:
The reduction of embodied energy from disposable plastic was calculated for the average value of 85 MJ. In real-life conditions, this value can be slightly different, depending on the specific production methods of disposable plastic. However, this would not produce a significant difference regarding this particular research scope.
- Impact indicator no. 3
- RCP—Annual reduction of carbon dioxide emissions of plastic [ton CO2 per year]
- Calculation method
The reduction of carbon dioxide emissions from plastic can be calculated by Equation (3):
where Rp is the reduced total amount of plastic consumption in the households per year calculated by Equation (1), and CEP is carbon emissions from plastic expressed in kilograms of CO2 per kilogram of material produced. CEP calculated by [43] may vary from 3 to 5 kg CO2 per 1 kg of plastic produced, and the average CEP value is 4 kg CO2.
The reduction of carbon dioxide emissions from plastic calculated for the survey results is 59.9 tons of CO2 per year. The reduction of carbon dioxide emissions from plastic calculated for 100 HH is 12.48 tons of CO2 per year.
3.3.2. Sustainable Environmental Initiative No. 2
“Decision not to use air conditioning systems at home and learning proper patterns of natural ventilation”.
According to the information provided in the survey, 160 respondents (32%) had air conditioning devices installed on their premises and decided not to use them anymore. Moreover, 270 respondents (54%) decided not to have any AC systems installed in their households and learned correct natural ventilation patterns instead. Altogether, a significant group of 430 people (86%) reduced their environmental impact from air conditioning used for cooling purposes.
The energy-efficiency class under average climate conditions for medium temperature: A.
The average cooling capacity of an air conditioner for the average dwelling size reported in the survey was 6.8 kW. The maximum input energy consumption of the air conditioner was determined as 2.3 kW and the average energy consumption per hour was assumed to be 2 kW. Typically, the air conditioning systems were used for 6 hours per day, 90 days per year.
- Impact Indicator No. 4
- REAC—Annual reduction of energy consumption for cooling purposes
- Calculation method
- EAC—energy consumption for cooling purposes in a single household:where TACd is the daily operational time of an air conditioner based on the survey results as 6 h per day, NACd is the number of AC system working days per year, estimated as 90, and Each is the average energy consumption per hour, estimated as 2 kW.
The average energy consumption for cooling purposes per household calculated by Equation (4) is 1.08 MWh/year.
REAC—reduction of energy consumption for cooling purposes:
where EAC is the energy consumption for cooling purposes in a single household, and Cn is the number of consumers resulting from the survey responses. In this case, it is 430 people who decided not to use AC devices in their households, assuming that each person represents one household.
The reduction of energy consumption for cooling purposes, calculated based on data declared by the test group and calculated by Equation (5), is 464.4 MWh/year.
The reduction of energy consumption for cooling purposes calculated for 100 HH is 108 MWh/year.
- Impact Indicator No. 5
- RCAC—Annual reduction of carbon dioxide emissions resulting from using AC devices in households [tons of CO2 per year]
The total annual savings of CO2 emissions computed per kWh from electricity and heat for 464.4 MWh/year for the European region, using the SunEarthTools calculator [66], is 134.82 tons of CO2/year.
The total annual savings of CO2 emissions computed for 100 HH per kWh from electricity and heat for the European region is 31.35 tons of CO2/year.
- Method limitations:
The calculation was carried out solely for the European region, and the results for other regions may be slightly different. Moreover, the method allows for the estimation of the reduction of carbon dioxide emissions resulting from using AC devices in households. The emissions resulting from the production and installation of AC devices were not calculated in this study.
3.3.3. Sustainable Environmental Initiative No. 3
“Transition to a vegetarian or vegan diet: resource savings through the elimination of meat from the diet”.
The elimination of meat from the diet was declared by 400 people (80% of respondents).
- Impact Indicator No. 6
- RM—reduction of annual meat consumption
- Calculation method
Average meat consumption per person before the change in diet: 4 kg per month (calories).
The calculation of average meat consumption based on information provided by survey participants is possible with Equation (6):
where Mcyr is the average annual meat consumption per person, Mcw is the average weekly meat consumption per person, and 52 is the number of weeks per year. The calculated Mcyr is 47.7 kg of meat per person per year.
RM—reduction of annual meat consumption can be calculated by Equation (7):
where Cn is the number of consumers that have declared the change in their diet, i.e., 400 people. The reduction of annual meat consumption calculated for the survey results is 18.72 tons of meat per year.
The reduction of annual meat consumption calculated for 100 HH is 4.68 tons of meat per year.
- Impact Indicator No. 7
- REM—Annual reduction of energy consumption of cultured meat production
- Calculation method
The energy consumption and greenhouse gas emissions of cultured meat production were assessed with the application of the life-cycle assessment (LCA) methodology based on ISO14044:2006 guidelines [67] by [51], as shown in Figure 1. The annual reduction of energy consumption of cultured meat production can be calculated by Equation (8):
where RM is a reduction of annual meat consumption, and EM is the amount of energy required to produce 1 ton of cultured meat [44]. The calculated annual reduction of energy consumption of cultured meat production is 494,21 GJ per year, which is equal to 137.28 MWh per year.
Annual energy savings resulting from the elimination of meat from the diet computed for 100 HH is 34.32 MWh per year.
- Impact Indicator No. 8
- RCM—Annual reduction of carbon dioxide emissions resulting from the elimination of meat from the diet
- Calculation method
Annual reduction of carbon dioxide emissions resulting from the elimination of meat from the diet can be calculated by Equation (9):
where CFMP is a carbon footprint from meat production, estimated as 1508 kg CO2 per 1 ton of cultured meat, based on the calculation carried out by [44], and RM is the reduction of annual meat consumption calculated by Equation (7). The annual reduction of carbon dioxide emissions resulting from the elimination of meat from the diet calculated for the survey results with Equation (9) is 28.23 tons of CO2 per year.
The annual reduction of carbon dioxide emissions resulting from the elimination of meat from the diet calculated for 100 HH is 7.06 tons of CO2 per year.
A systematic review of greenhouse gas emissions for different fresh-food categories has proven that grains, fruit, and vegetables have the lowest environmental impact, regarding both energy consumption and GHG emissions, while meat production has the highest impact [45].
- Method limitations:
Variations in data may be attributable to different LCA approaches, including functional units, methods, geographic locations, and processes. The collation of data with percentile bands enables the inclusion of uncertainty when assessing the greenhouse profiles for food-related activities [45].
3.3.4. Sustainable Environmental Initiative No. 4
“Transition from car to bicycle or walking on short-distance trips”.
This initiative was declared by 395 people (79% of participants).
- Impact Indicator No. 9
- RFC—Annual reduction of fossil-fuel consumption resulting from reduced car journeys
- Calculation method
The number of avoided journeys was estimated based on the assumption (based on the results of the second stage of the survey) that the average sum of car journeys per week is 100 km, excluding longer holiday trips. This value was calculated for 3 groups of journeys: everyday journeys to work and school, frequent journeys such as shopping and entertainment, and occasional weekend trips. The survey participants declared that the aforementioned journeys were avoided by giving preference to cycling and walking.
Energy reduction for 100 km per week per person was computed for the average fuel consumption estimated as 6 L/100 km.
RFC—Annual reduction of fossil-fuel consumption resulting from reduced car journeys can be calculated by Equation (10):
where RFCw is the reduced fossil-fuel consumption per person per week, 52 is the number of weeks per year, and Cn is the number of consumers who declared this change in behavior, i.e., 395 people. Annual fuel savings per person can be calculated by multiplying average weekly fuel consumption by 52 weeks, which results in 318 L of reduced fossil-fuel consumption per person per year. The calculated annual reduction of fossil-fuel consumption resulting from reduced car journeys RFC is 257,540 L of fossil fuel per year.
- Impact Indicator No. 10
- REFC—Annual energy savings from fossil-fuel consumption by car travel
- Calculation method
The reduced amount of energy from fossil-fuel consumption by car travel can be calculated by Equation (11):
where RFC is an annual reduction of fossil-fuel consumption resulting from reduced car journeys, and 8.9 kWh is the energy equivalent of 1 liter of gasoline. The calculated REFC for the survey results is 2292.106 MWh per year.
For 100 HH, an annual reduction of fossil-fuel consumption resulting from reduced car journeys is 277.68 MWh.
- Impact Indicator No. 11
- RCFC—Annual reduction of carbon dioxide emissions from fossil fuels from car journeys
- Calculation method
Taking the calculation rate of CO2 emissions from passenger cars provided by the European Environment Agency (EEA) as 130 g of CO2 per kilometer [53], the reduction of CO2 emissions for a survey participant representing a single household can be calculated by Equation (12):
where RDw is reduced travel distance per week, 52 is the number of weeks, and Cn is the number of consumers who declared this behavior change, i.e., 395 survey participants. The calculated annual reduction of carbon dioxide emissions from fossil fuels from car journeys is 267.02 tons of CO2 per year.
The annual reduction of carbon dioxide emissions from fossil fuels from car journeys computed for 100 HH is 67.6 tons of CO2.
- Method limitations
The CO2 emissions were calculated solely for the European region, based on EEA data for the performance of new passenger cars in Europe. For other regions and older cars with different performance, the carbon dioxide emissions will vary.
3.3.5. Sustainable Environmental Initiative No. 5
“Drinking tap water instead of bottled water”.
This sustainable initiative was declared by 405 people (81% of survey participants).
- Impact Indicator No. 12
- REWPET—Annual reduction of energy from bottled water
- Calculation method
The average consumption of bottled water declared by the survey participants was 7 bottles per week. The reduced amount of energy and GHG emissions was calculated for rPET bottles (recycled polyethylene tetraphyte). The calculation was carried out for one of the most environmentally friendly variants, i.e., “Regional distribution; rPET bottle (25%); spring water; recycled”, as described by [46].
- REWPET—Annual reduction of energy consumption from single-use bottled water can be calculated by Equation (13):where EgW is the amount of energy used for 1000 gallons of single-use bottled water calculated by [46] for the selected variant of bottled water production and distribution, 3785.4 L is the conversion rate of liters to 1000 gallons (1000 gallons = 3785.4 L), CBWd is the daily bottled water consumption estimated based on the survey results, 365 is the number of days in year, and Cn is several consumers who declared a behavior change, i.e., 405 people (81% of survey participants). It is assumed that each survey participant represents a single household. The calculated annual reduction of energy consumption from single-use bottled water is 650.635 GJ per year, which is equal to 180.73 MWh per year.
The annual reduction of energy consumption from single-use bottled water computed for 100 HH is 44.62 MWh/yr.
- Impact Indicator No. 13
- RCWPET—Annual reduction of CO2 emissions from bottled water
- Calculation method
- CWPET—CO2 emissions from bottled water were calculated for the same variant, i.e., “Regional distribution; rPET bottle (25%); spring water; recycled”, and the LCA results reported by [46] are 836.7 kg CO2 per 1000 gallons (3785.4 L). GHG emissions per liter of bottled water can be calculated by Equation (14) by dividing 836.7 kg CO2 by 3785.4 L which is 0.22 kg CO2.where CWPET stands for CO2 emissions from bottled water, 365 is the number of days per year, and Cn is the number of consumers who declared a behavior change, i.e., 405 people (81% of survey participants). Therefore, the annual reduction of CO2 emissions from bottled water calculated by Equation (14) is 32.521 tons of CO2 per year.
The annual reduction of CO2 emissions from bottled water computed for 100 HH is 8.03 tons of CO2 per year.
- Method limitation
The calculations were carried out for the rPET variant, spring water, and regional distribution. For other water sources, production, and distribution methods, the results will vary.
3.3.6. Sustainable Environmental Initiative No. 6
“All major appliances in households replaced with energy-efficient appliances with EEI B (formerly A+++)”.
This initiative was declared by 495 people (99% of respondents).
- Impact Indicator No. 14
- REA—Annual reduction of energy consumption from household appliances
- Calculation method
Average energy savings were computed based on the following household appliances: refrigerator, cooker, dishwasher, and washing machine. For the aforementioned appliances, the survey participants declared the increased energy class D compared to B (formerly A compared to A+++) [68]. Since this environmental initiative was undertaken by 495 people, assuming that each person represents one household, the annual reductions of energy were calculated for 495 households, using Equation (15):
where RERA is an annual reduction of energy consumption from refrigerating appliances, RECA is the annual reduction of energy consumption from cooking appliances, REDA is an annual reduction of energy consumption from dishwashing appliances, and REWA is an annual reduction of energy consumption from washing appliances.
- Impact Indicator No. 14a
- RECR—annual reduction of energy consumption from refrigerating appliances
- Calculation method
Refrigerating appliances are used for 24 h × 365 days/year, which is 8760 h/year. For class A, the value of EEI (energy efficiency index) remains within the following limits: 44 ≤ EEI < 55 (the average EEI = 50 was assumed for further calculations), and for class B (formerly A+++), EEI < 22 [69]. The wattage of 80 W was assumed for class D (formerly A) and 50 W for class B (formerly A+++) [39]. The annual reduction of energy consumption from refrigerating appliances can be calculated by Equation (16):
where RERA is the annual reduction of energy consumption from refrigerating appliances, ERAD is the average energy consumption for refrigerating appliances belonging to energy efficiency class A, ERAB is the average energy consumption for refrigerating appliances belonging to energy efficiency class B (formerly A+++), and Cn is the number of consumers that changed this behavior, i.e., 495 people. The difference between EEI for class D and class B is 38, and the difference in wattage is 30 W. The average yearly energy consumption for class D is 348 kWh/year, and for class B, it is three times less, i.e., 116 kWh/year [39]. This gives energy savings of 232 kWh/year for each household (in the case of this research, the same value is calculated per person as no more than 1 person per household participated in the survey). The annual reduction of energy consumption from refrigerating appliances calculated for the survey results with Equation (16) is 114.84 MWh per year.
The annual reduction of energy consumption from refrigerating appliances calculated for 100 HH is 23.2 MWh per year.
- Impact Indicator No. 14b
- RECA—annual reduction of energy consumption from cooking appliances.
- Calculation method
For class A cooking appliances, the energy consumption of an electric hob is about 1.5 kW for an hour of operation. Assuming that the cooking devices work about 2 h/day, for 351 days per year (365 days–14 days of holidays when the family is not cooking at home), it is possible to compute annual energy consumption using Equation (17):
where PC is a cooking hob power, TCd is the average number of device working hours per day, 365 is the number of days per year, and 14 is the number of days when cooking appliances are not in use, e.g., due to holidays. For a class D (formerly A) electric hob, the annual energy consumption ECeh calculated by Equation (17) is 1.053 MWh per year.
The energy consumption of a class B (formerly A+++) electric induction hob is about 0.5 kW for an hour of working. Assuming that the cooking devices work about 2 h/day for 351 days per year, the ECih—the annual energy consumption for a class B electric induction hob calculated by Equation (17)—is 351 kWh per year.
Thus, the achieved annual energy savings can be calculated by Equation (18):
where ECeh is the annual energy consumption of a class D (formerly A) electric hob, ECih is the annual energy consumption for an electric induction hob class B (formerly A+++), and Cn is the number of households in which the appliances were exchanged to provide the highest EEI. The RECA—annual reduction of energy consumption from cooking appliances calculated for the survey results with Equation (19) is 347.49 MWh per year.
The annual reduction of energy consumption from cooking appliances calculated for 100 HH is 70.2 MWh per year.
- Impact indicator No. 14c
- REDA—Annual reduction of energy consumption from dishwashers
- Calculation method
Based on the survey results, the energy consumption per washing cycle per load for class D (formerly A) was determined as 0.9 kWh, and for class B (formerly A+++), it is 0.3 kWh. The number of washing cycles per year was estimated as 1 cycle per day for 351 days (365 days − 14 days of holidays when the family is not washing at home). Equation (19) is used to calculate the energy consumption of dishwasher appliances EDA:
where PD is dishwasher power, TDd is the average number of dishwasher loads per day, 365 is the number of days per year, and 14 is the number of days when dishwashing appliances are not in use, e.g., due to holidays. The annual energy consumption for dishwasher class D (EDAD) calculated by Equation (19) is 315.9 kWh per year, while the energy consumption for dishwasher class B, the annual energy consumption (EDAB) is 105.3 kWh per year. The difference between the energy consumption of older appliances (class D) replaced with energy-efficient ones (class B) is calculated by Equation (20):
where EDAD is the annual energy consumption of a class D dishwasher, EDAB is the annual energy consumption of a class B dishwasher, and Cn is the number of consumers that declared this change. In this case, 495 people (as previously explained, it is assumed that each person represents one household). The annual reduction of energy consumption from dishwashers (REDA) calculated for the survey results with Equation (20) is 103.6 MWh per year.
The annual reduction of energy consumption from dishwashers (REDA) calculated for 100 HH is 20.93 MWh per year.
- Method limitations
The values of energy consumption of dishwashing appliances used in the calculations result directly from the analysis of the energy consumption of appliances used by the survey participants. The values calculated by [47] were slightly different for class B (formerly), resulting in 231 kWh/year. The difference is due to washing habits since the biggest amount of energy is used for water heating, and the survey participants reported generally lower temperatures during the washing cycle [47].
- Impact indicator No. 14d
- REWA—Annual reduction of energy consumption from washing machines
- Calculation method
The energy consumption per washing cycle per 5 kg load, 60 °C, for class D (formerly A) is 1.3 kWh, and for class B (formerly A+++), it is 0.9 kWh. For the average of 5 washing cycles per week (265 cycles per year) declared by the survey participants, the annual energy consumption (EWA) can be calculated by Equation (21):
where PW is the power of the washing machine, NLWw is the number of loads per week, and 52 is the number of weeks per year. Therefore, for washing machines with energy efficiency class D, the energy consumption (EWAD) calculated by Equation (21) is 338 kWh per year, and the energy consumption for washing machines with energy efficiency class B (EWAB) is equal 234 kWh per year.
The energy savings from washing machines are calculated by Equation (22):
where EWAD is the annual energy consumption of a class B (formerly A) washing machine, EWB is the annual energy consumption of a class B (formerly A+++) washing machine, and Cn is the number of consumers that declared this change—in this case, 495 people (it is assumed that each person represents one household). The annual energy savings from washing machines calculated for the survey results with Equation (22) is 51.48 MWh per year.
The annual energy savings from washing machines calculated for 100 HH is 10.4 MWh per year.
- Impact Indicator No. 15
- RCA—Annual reduction of carbon dioxide emissions from household appliances
- Calculation method
The average reduction of carbon dioxide emissions was calculated by Equation (23), based on the annual reduction of energy consumption (REA) for the four major household appliances: refrigerator, cooker, dishwasher, and washing machine. For the aforementioned appliances, 495 survey participants (99% of respondents) declared the increased energy class D compared to B (formerly A compared to A+++) [68].
where RCRA is an annual reduction of CO2 emissions from refrigerators, RCCA is the annual reduction of CO2 emissions from cookers, RCDA is an annual reduction of CO2 emissions from dishwashers, and RCWA is an annual reduction of CO2 emissions from washing machines.
A detailed calculation of the specific component indices for energy reduction and CO2 emissions is presented below.
- Impact Indicator No. 15a
- RCRA—Annual reduction of CO2 emissions from refrigerating appliances
- Calculation method
The reduction of GHG emissions was calculated for 114.840 MWh/yr, for the European region, using SunEarthTools [66], and it was determined as follows:
RCRA = 33.34 ton CO2
The reduction of GHG emissions for 100 HH is 6.73 tons of CO2.
- Impact Indicator 15b
- RCCA—Annual reduction of CO2 emissions from cooking appliances
- Calculation method
The annual reduction of CO2 emissions was calculated for the survey results for the European region, using SunEarthTools [66], and it is:
RCCA = 100.883 ton CO2 per year
The reduction of GHG emissions calculated for 100 HH is 20.38 tons of CO2 per year.
- Impact Indicator No. 15c
- RCDA—Annual reduction of CO2 emissions from dishwashing appliances
- Calculation method
The annual reduction of CO2 emissions was calculated for the survey results for the European region, using SunEarthTools [66] is 30.077 tons of CO2 per year.
The annual reduction of CO2 emissions calculated for 100 HH is 6.076 tons of CO2 per year.
- Impact indicator No. 15d
- RCWA—Annual reduction of CO2 emissions from washing machines.
- Calculation method
The reduction of GHG emissions was calculated for the survey results for the European region, using SunEarthTools [66], and it is 14.945 tons of CO2 per year.
The annual reduction of CO2 emissions calculated for 100 HH is 3.019 tons of CO2 per year.
The annual reduction of energy consumption from household major appliances REA for the examined group of survey participants was calculated by Equation (15) and is 617.41 MWh per year.
The annual reduction of energy consumption from household major appliances for 100 HH is 124.73 MWh per year.
The annual reduction of CO2 emissions from household major appliances was calculated for the examined group of survey participants using Equation (23) and is 179.242 tons of CO2 per year.
The annual reduction of CO2 emissions from household major appliances RCA calculated for 100 HH using Equation (23) is 36.21 tons of CO2 per year.
3.3.7. Sustainable Environmental Initiative No. 7
“Washing laundry limited to 1 cycle per week” (instead of the average of 5 cycles/week reported by 90% of respondents).
This sustainable initiative was declared by 385 people (77% of survey participants).
- Impact Indicator No. 16
- REW—Annual reduction of energy consumption from washing habits
- Calculation method
A total of 385 people declared a significant change in habits in terms of laundry. They limited the number of washing cycles to only one per week, using solely “eco” mode and the class B (formerly A+++) appliances, as calculated above. Therefore, the additional energy reduction for washing appliances EWA was calculated by Equation (24) for the avoided 4 cycles per week, giving a reduction of 208 cycles (4 × 52 weeks). This brought the result of 187.2 kWh per year.
As this behavior pattern was declared by Cn = 385 people, the energy savings were calculated by Equation (25):
where EWA is a calculated annual energy reduction for washing appliances, i.e., 187.2 kWh per year, and Cn is the number of people who declared this change. The annual reduction of energy consumption from washing habits (REW) calculated for EWA = 187.2 kWh per year and for 385 people is 72.072 MWh per year.
An annual reduction of energy consumption from washing habits calculated for 100 HH is 18.72 MWh per year.
- Impact indicator No. 17
- RCW—Annual reduction of CO2 emissions from washing habits.
- Calculation method
The reduction of CO2 emissions from washing habits calculated for survey results for the European region, using SunEarthTools [66], is 20.924 tons of CO2 per year.
The reduction of CO2 emissions from washing habits calculated for 100 HH for the European region is 5.435 tons of CO2 per year.
3.3.8. Sustainable Environmental Initiative No. 8
“Resignation from plane journeys”.
This sustainable initiative was declared by 360 survey participants (72% of respondents).
- Impact indicator No. 18
- RFF—Annual reduction of fossil-fuel consumption resulting from flying.
- Calculation method
A total of 360 survey participants declared avoiding plane journeys or giving preference to train travel. Based on the information provided by the respondents, the average length of the avoided journey per year was assumed at the level of 1000 km. Consequently, the exemplary average trip used for calculations was a roundtrip London–Berlin–London (LHR–BER–LHR) on a distance of 1918 km (2 × 959 km). The computations were carried out using the International Civil Aviation Organization Carbon Emissions Calculator [70].
- CFFA—consumption of fossil fuel per aircraft:CFFA = 9837.9 kg (fuel burned by aircraft per journey)
The same source [70] provides information on the amount of fuel burned per passenger as 71 kg. Therefore, for the examined group, an annual reduction of fossil-fuel consumption per person resulting from changing flying habits is estimated as follows:
RFFp = 71 kg
Annual reduction of fossil-fuel consumption resulting from flying can be calculated by Equation (26):
where RFFp is an annual reduction of fossil-fuel consumption per person resulting from changing flying habits, and Cn is the number of people who declared this behavioral change.
For Cn = 360 people, the RFF, i.e., the reduction of fossil-fuel consumption from avoided airplane journeys calculated by Equation (26), is 25.56 tons of CO2 per year.
- Impact indicator No. 19
- REF—Annual reduction of energy consumption from flying.
- Calculation method
For the journey analyzed above, the amount of fuel burned per passenger is 71 kg [70]. A simplified calculation method was used to estimate the achieved energy savings. The average energy density of aviation fuel was estimated for kerosene as 43.1 MJ/kg, based on its lower heating value [51,52], using Equation (27):
where RFF is an annual reduction of fossil-fuel consumption resulting from flying, and u is an energy density (energy per volume) of aviation fuel (kerosene) estimated as 43.1 MJ/kg.
Taking the energy released on burning RFF = 25,560 kg (previously calculated for 360 survey participants) of kerosene, the annual reduction of energy consumption from flying is 1,099,080 MJ, which, when converted to MWh, is 305.302 MWh. Thus, the annual reduction of energy consumption from flying calculated for the examined group of survey participants is 305.302 MWh per year.
The annual reduction of energy consumption from flying calculated for 100 HH is 84.806 MWh per year.
- Impact indicator No. 20
- RCF—Annual reduction of CO2 emissions from flying
- Calculation method
The total amount of CO2 emitted during the analyzed journey can be calculated by Equation (28):
where Npax is the number of passengers on board.
According to ICAO [70], for the analyzed journey, the amount of CO2 calculated per passenger (Cpax):
The annual reduction of CO2 emissions from flying (RCF) can be calculated by Equation (29):
The impact for Cn = 360, being the number of customers who declared the sustainable environmental initiative related to avoided flights, RCF is 82.44 tons of CO2 per year.
The annual reduction of CO2 emissions from flying computed for 100 HH is 22.9 tons of CO2 per year.
3.3.9. Sustainable Environmental Initiative No. 9
“Transition from non-renewable to renewable energy in households”.
This sustainable environmental initiative was declared by 325 people (65% of survey participants).
- Impact Indicator No. 21
- RENR—Annual reduction of non-renewable energy consumption.
- Calculation method:
The results are based on the summarized non-renewable energy savings calculated for the last 12 months. The levelized cost of energy calculator (LcoE), developed by the Danish Energy Agency (DEA), was used to assess the average lifetime costs of providing 1 MWh for a range of power production technologies and power savings [71]. Based on the information regarding the installed solar systems provided by the survey participants, the average PV panel system size was estimated as 4.5 kW, and therefore, an annual production of photovoltaic energy per household (EPVh) would be around 4000 kWh/year. The simplified calculation allows us to state that this figure, at the same represents annual non-renewable energy savings since the households would otherwise use the grid electricity produced by commercial power stations and based on non-renewable energy sources.
The annual energy savings resulting from the replacement of non-renewable with renewable energy in households can be calculated by Equation (30):
where EPVh is the annual production of photovoltaic energy per household, and Cn is the number of customers who declared this change.
The annual reduction of non-renewable energy consumption (RENR) calculated for the group examined within the survey is 1300 MWh per year.
The annual reduction of non-renewable energy consumption calculated for 100 HH is 400 MWh per year.
- Impact Indicator No. 22
- RCNR—Annual reduction of CO2 emissions from non-renewable grid energy consumption
- Calculation method
The average grid carbon intensity was used for calculating the amount of CO2 emission savings. Since the average amount of CO2 emitted for each kWh of electricity produced for the grid in 2019 is estimated at 255 g CO2 [72], and in 2022 the average CO2 emissions per MWh from electricity and heat in the European region are 290.32 kg CO2 [66], the savings of CO2 emissions (RCPV) estimated for the examined group of the survey participants using the SunEarthTools calculator [66] are 377,000 kg CO2. The annual reduction of CO2 emissions from non-renewable grid energy consumption for 100 HH is 116,000 kg CO2. The annual reduction of CO2 emissions from non-renewable grid energy consumption per household RCPV = 1160 kg CO2.
CPV—the footprint of solar panels (a functional unit of an average kWh of electricity generation over 25 years using a solar rooftop array) estimated using the cradle-to-grave method is 88 g CO2/kWh [73]. Therefore, the CO2 savings from cumulative PV panels systems installed by the survey participants can be calculated by Equation (31):
where RCPV is the annual reduction of CO2 emissions per household resulting from replacing non-renewable grid electricity with photovoltaic electricity, CPV is the carbon footprint of PV panels installed in households, EPV is an annual production of photovoltaic energy per household, and Cn is the number of consumers who declared this change, here estimated as a single household. The annual CO2 emission savings RCNR calculated for the examined group of survey participants, i.e., 325 households with PV systems installed, is 262.6 tons of CO2 per year. The annual CO2 emission savings RCNR calculated for 100 households is 80.8 tons of CO2 per year.
Moreover, the exact carbon payback time (CPBT) can be calculated from the comparison of cumulative CO2-equivalent emissions (CCE) across the life-cycle of each PV panel to CO2-equivalent emissions generated from a European average electricity production mix (CCERER) for the same kWh produced by the PV panel, using Equation (32) [73].
A detailed cradle-to-cradle approach in the life-cycle of silicon solar photovoltaic panels was presented by [50].
3.3.10. Sustainable Environmental Initiative No. 10
“Replacing traditional backyard lawn with a natural meadow that does not require watering (can easily survive between rains) and increases the level of biodiversity (including nectar-producing plants)”.
This initiative, reported by 255 people (51% of survey participants), contributes to water savings, increased biodiversity, and energy savings from lawnmowers.
- Impact indicator No. 23
- RELM—Annual reduction of energy from lawnmowers
- Calculation method
Calculations were conducted for an electric lawnmower, 1000 W, working 1 h a day, 14 days per year, using Equation (33):
where PM is mower power, TMd is the average time of a mower working cycle, Nd is the number of days per year when a mower was used in a household, and Cn is the number of consumers that declared this behavior change. It is assumed that each survey participant represents 1 household. For the examined group of the survey participants, the calculated energy savings equal 3570 kWh per year. The annual reduction of energy from lawnmowers is 1400 kWh per year.
- Impact indicator No. 24
- RCLM—Annual reduction of CO2 emissions from lawnmowers
- Calculation method
The CO2 emissions from lawnmowers calculated as 3570 kWh/year were estimated with SunEarthTools [66]. The annual reduction of CO2 emissions from lawnmowers:
RCLM = 1.035 tons CO2/year
The annual reduction of CO2 emissions from lawnmowers computed for 100 HH is 0.406 tons CO2/year.
- Method limitations
Based on the survey results, it was possible to estimate only an average value of energy and carbon footprint from lawnmowers. The annual reductions did not bring significant results in terms of energy and carbon dioxide emissions savings. The water savings and the environmental benefits resulting from increased biodiversity levels were not evaluated in this research.
4. Results and Discussion
The research conducted in 2021 and 2022 allowed the identification of behavioral changes resulting from climate-crisis awareness and evaluate their impact on energy consumption and CO2 emissions in European households. The two-stage survey was addressed to individuals who manifested pro-ecological attitudes and brought up 500 responses from inhabitants of 28 European countries. In the first stage, the author determined initiatives undertaken at the scale of a single household by representatives of the examined group, defined as “building users oriented at minimizing the negative impact on the environment”. The next stage was aimed at a better understanding of the effects of individual sustainable choices and initiatives on society and the environment. The second part of the survey allowed us to collect specific data related to the 10 most popular environmental initiatives undertaken at the building scale and identified in the first stage. The achieved data were used for calculations of energy and emission impacts. The degree of popularity of individual initiatives in the studied group in correlation to the calculated value of undertaken activities was also determined. The potential of models applied in the households was computed to establish the basis for the evaluation of future effects of individual decisions at the building scale.
One of the most interesting findings of the study was the identification of a set of new sustainable behaviors not present in the Rasch and Campbell models and not listed among the 50 conservation behaviors so far [40,54,63,64,65]. It is even more striking that as many as seven of them were ranked among the most popular ten sustainable initiatives. The aforementioned newly identified behaviors include:
- Elimination of all disposable plastics from households (96%);
- Refraining from using air conditioning for cooling purposes and adopting the habit of using natural ventilation instead (86%);
- Drinking solely tap water instead of bottled water (81%);
- Elimination of meat products from the diet (80%);
- Limiting laundry to 1 cycle per week (77%);
- Refraining from flying and giving preference to train journeys (72%);
- Replacement of a traditional backyard lawn with a biodiverse meadow (51%).
The research revealed that the most popular decisions (undertaken by 99%) were related to replacing older house appliances (typically indicated EEI D) with the ones characterized by EEI B (according to the rescaled EU energy efficiency label) [69]. The annual reduction of energy consumption from household appliances calculated for the examined group of survey participants reached 617.41 MWh, while the reduction calculated for the reference 100 HH is 124.1 MWh per year.
As many as 96% of survey participants decided to change their habits regarding disposable plastic and eliminate it from their households. This has been achieved through a fundamental change in the way the survey participants would shop. Respondents explained that they used solely reusable packaging when shopping, giving preference to shops and distribution points that allow this. Despite initial difficulties due to the need for a change in behavioral patterns, the decision was ultimately found to be easy to implement. The calculation for the examined group shows significant benefits resulting from this conservation decision, in particular, the annual energy savings of 353.6 MWh and reduced CO2 emissions of 59.9 tons CO2 per year. The annual reduction of embodied energy of plastic computed for 100 HH is 73.67 MWh per year, while the reduced CO2 emissions for 100 HH are 12.48 tons CO2 per year.
The third most popular environmental decision declared by 86% of respondents was not to use air conditioning for cooling purposes and instead use natural ventilation in households. This brought energy savings of 464.4 MWh and avoided CO2 emissions of 134.82 tons CO2 for the examined group per year. The energy savings calculated for 100 HH equal 108 MWh, and the reduced CO2 emissions reached 31.35 tons CO2.
The most significant behavioral change that resulted in the highest annual energy savings of 2292.106 MWh per year for the examined group and 277.68 MWh per year for 100 HH was related to reduced everyday car journeys replaced by biking or walking. This concerned everyday journeys to work and school, frequent journeys such as shopping and entertainment, and occasional weekend trips. Based on the survey results, the number of avoided journeys was estimated for the average sum of car journeys per week is 100 km, excluding longer holiday trips. The same behavioral change reduced carbon emissions for the examined group by 267.02 tons of CO2, while the annual reduction of carbon dioxide emissions from fossil fuels from car journeys for 100 HH is 67.6 tons of CO2 per year. Energy reduction for 100 km per week per person was computed for the average fuel consumption estimated as 6 L/100 km. This method has limitations since carbon dioxide emissions were calculated using EEA data for the performance of new passenger cars in Europe. It is important to note that for other regions and less efficient engines, the emissions might vary.
One of the most popular decisions in terms of reduced energy consumption and carbon dioxide emissions was related to the elimination of meat from the diet. This sustainable initiative has been undertaken by 80% of the members of the examined group. This is even more astonishing because so far, vegetarianism and veganism have not even been included in the list of pro-environmental behaviors [55] nor were they reflected in studies conducted with standard methods on statistical groups [26].
The popularity of the most common decisions may be related to economic aspects, e.g., growing prices of electricity [14]. A significant variation of people declaring specific environmental initiatives can be attributed to the ease of implementation and the observed knowledge gaps. Specifically, in some cases, the initiative entitled “I apply passive and/or bioclimatic strategies in my house” required radical renovations in the buildings, and consequently, it was applied by 28% of respondents. At the same time, the similar initiative, “I do not use air conditioning for cooling purposes, and instead I use natural ventilation at home”, was much easier to apply and brought economic benefits for 86% of respondents who declared this change. Similarly, the decision declared by 81% of respondents, “I drink solely tap water/I do not drink bottled water anymore”, was much more popular than “I re-use gray water, e.g., for irrigation, having washed vegetables I use the water in the garden as a natural fertilizer”, indicated by only 11%, due to the ease of application. The aspect of required knowledge relevant both for bioclimatic strategies and gray water re-use cannot be ignored. It highlights the importance of educating society in terms of simple and effective methods of reducing environmental impacts.
The study revealed several behavioral changes related to rising responsibility and awareness of the climate crisis and allowed for the identification of 24 impact indicators (Table 4) related to energy and carbon footprint measured on a building scale. The results of the research can be interpreted as a part of habitual change that has been initiated by the group of “green role models” and is very likely to find numerous followers in the statistical groups. The computed impact indicators demonstrate the significance of individual sustainable choices and environmental decisions.
One of the crucial observations from Stage I of the survey is that in response to Question 3, “What was the main rationale behind your undertaking the above-mentioned decisions/actions?”, the participants claimed that their decisions were undertaken due to the responsibility towards planet Earth and its actual and future inhabitants. While other extensions were provided, and various facts that contributed to the decision were indicated, environmental responsibility has been highlighted in first place by 100% of respondents. Moreover, 100% of participants responded to Question 2, “Do you believe your choices/initiatives have rather temporary or constant character? If possible, please indicate the timeline”, that at least half of their choices are intended to have the character of a constant change, while other choices are likely to be constant. It is remarkable that 0% stated that the undertaken environmental initiative was meant to be temporary.
In reply to Question 4, Stage I of the survey, “Do you think your individual choices have an influence on your household? e.g., the reduced consumption of energy, water, and other resources, using solely renewable energy sources, reduced/modified travel habits, recycling, reduced amount of waste, other elements of circular economy, etc.”, 73% of respondents confirmed that they observe an influence on their households, and in particular on energy, water, and other resource consumption. They have also expressed their understanding of the fact that the CO2 emissions generated on the building scale are significant and must be reduced through adequate actions undertaken by stakeholders as well as the properly modified habits of end users. Similar answers were provided to Question 6: “Do you believe your individual choices contribute to the overall planet health and resilience? Have you ever tried to evaluate/calculate your environmental impact? Could you provide any examples/numbers?”. A total of 67% of respondents confirmed that they have made an effort to assess their environmental impact, but only 36% have tried to calculate it. However, the computations were almost exclusively related to energy savings, in several cases combined with renewable and sustainable energy.
Some of the most important conclusions are linked to the responses to Question 5 in Stage I: “Do you observe the influence of your personal choices/sustainable initiatives on your friends/family/people you know? Could you provide any examples/numbers?” This is particularly noticeable in relation to new role models, sometimes representing the youngest generation. The examined group demonstrates distinct and meaningful pro-ecological attitudes that find a significant number of followers. While research participants do not perceive themselves as environmental activists, in fact, their sustainable initiatives and personal choices influence their social environment in a profound way. A total of 95% of respondents confirmed that at least 1 person decided to act similarly, and 81% of participants were aware of 2–3 followers. A total of 73% of participants believe their initiative influenced 4–6 people. A total of 55% claim 7–10 followers, and 12% of respondents influenced 10 or more other people who changed their conservation behavior accordingly.
The calculations performed for the examined group of 500 participants showed that the highest results in terms of energy and GHG emissions savings were achieved from the transition from car to bicycle or walking for short-distance everyday trips declared by 79% of the respondents. This brought the annual energy savings of 2292.1 MWh per year and the GHG emission savings of 267.02 tons of CO2 eq. The annual reduction of non-renewable energy consumption resulting from the installation of PV panels calculated for the examined group of 65% of survey participants was ranked in second place with a total value of 1300 MWh per year. Similarly, the annual reduction of CO2 emissions from non-renewable grid energy consumption calculated for the survey participants who confirmed the transition to PV energy in their households was ranked in second place with 262.6 tons of CO2 eq.
As shown in Table 5, the results calculated for the reference group of 100 HH were slightly different, and both the energy savings and reduced CO2 emissions resulting from the transition to PV energy were the highest. Renewable energy from PV roof panels brought 400 MWh of energy savings and 80.8 tons of CO2 eq. per year per 100 HH. The car-to-bicycle transition was ranked in second place with 277.68 MWh of energy savings and 67.7 tons of CO2 eq. per year per 100 HH. The transition from non-RES to RES was the most significant in terms of energy savings and carbon emissions but requires initial costs and is not always possible for technical reasons. The research has proven that the transition from using a car to walking or traveling by bicycle on short-distant everyday trips brings comparable results and does not require any additional costs.
The summary of energy savings resulting from replacing older and less energy-efficient appliances (EEI D) in households with the most energy-efficient appliances (EEI B) in the examined group has reached the level of 617.41 MWh/year, and a total GHG emission savings of 179,242 tons of CO2 eq. This sustainable choice was ranked in third place both for the survey results and for 100 HH as a reference value. The comparison of energy and carbon-footprint savings is illustrated in Figure 2.
In 2023, during the meetings organized under the TRAMI project (Transnational Cooperation on the Missions Approach), the results of the research were presented to stakeholders, policymakers, and representatives of the European regions participating in the EU Mission Adaptation to Climate Change. The representatives of 28 European countries noted that one of the main conclusions from the research presented in this paper addresses the significance of behavioral change resulting from the citizen awareness of the climate crisis, directly related to the transition from driving to cycling or walking short-distance everyday trips. Since this sustainable habit is increasing in popularity and its influence on energy consumption and carbon emissions is meaningful, participants of the EU Mission Adaptation to Climate Change discussed how regions could enhance this behavioral change through improved walkability in European cities. It was concluded that the main issues that may hider walkability are related to the exposure to outdoor environmental conditions, and in particular to outdoor high temperatures.
Several methods aimed at the reduction of outdoor heat stress were discussed in the context of adaptation to climate change. The participants expressed their interest in applying adaptive strategies by the cities, and they were particularly keen on passive shading of streets, public spaces, and transportation stops. Some of the most promising strategies included temporary passive shading, trees, green canopies, pergolas (Figure 3), or kinetic passive shading linked to ventilation corridors (Figure 4). The participants also agreed that further research on the subject was necessary to select the most appropriate strategy for specific bioclimatic and cultural conditions, as well as consistency in approaches.
5. Conclusions
This study evaluates the potential of sustainable environmental initiatives undertaken at the level of European households for energy and carbon savings. Described behavioral change is crucial for holistic green transformation and counteracting climate change. The study allowed for:
- evaluation of savings potential and applicability of particular sustainable choices;
- recognition of changes in existing environmental behavior models;
- identification of new sustainable attitudes, especially towards the reduction of GHG emissions and energy consumption.
New pro-environmental attitudes identified by the research were related to the elimination of all disposable plastics from households, using natural ventilation instead of air conditioning, drinking solely tap water instead of bottled water, elimination of meat products from the diet, and limiting laundry to 1 cycle per week.
The study showed that the most popular choices were not always the most significant in the context of climate change mitigation. The comparative analysis of energy savings [MWh/year] and reduced GHG emissions [kg CO2/year] demonstrated that the most significant behavioral change that resulted in the highest annual energy and GHG emission savings was related to the transition from car to bicycle or walking for short-distance everyday trips (declared by 79% of the respondents). This brought the annual savings of 2292.1 MWh and 267.02 tons of CO2 eq per year. The annual reduction of non-renewable energy consumption resulting from the installation of PV panels calculated for the examined group of 65% of survey participants was ranked in second place with a total value of 1300 MWh per year. Similarly, the annual reduction of CO2 emissions from non-renewable grid energy consumption calculated for the survey participants who confirmed the transition to PV energy in their households ranked in second place, with 262.6 tons of CO2 eq saved. The energy savings from PV roof panels calculated for the reference group of 100 HH brought the highest savings, i.e., 400 MWh of energy and 80.8 tons of CO2 eq. per 100 HH per year. In this case, the car-to-bicycle (or walking) transition ranked in second place with 277.68 MWh of energy savings and 67.7 tons of CO2 eq. per 100 HH per year. Therefore, the transition from non-RES to RES has been the most significant in terms of energy savings and carbon emissions, while the transition from driving to walking or cycling on short-distant everyday trips brings comparable results and does not require any additional costs.
The research allowed us to identify the key factors slowing down, hindering, or even blocking positive changes in the field of pro-environmental behavior. These include a national energy policy that hinders the prosumer economy, the high costs of transition to renewable energy sources, and an overly conservative approach.
The conclusions from this study can be used to help policymakers support and enhance most actual conservation behavior patterns through the creation of an inclusive policy contributing to decarbonization as well as to more efficient and responsible energy consumption. The research results were already presented to the stakeholders and policymakers during the series of workshops dedicated to the implementation of the EU Mission Adaptation to Climate Change (Mission Adapt). Based on the received feedback on key areas of behavioral change resulting from citizen awareness of the climate crisis, the workshop participants (signatories of the Mission Adaptation Charter) concluded that it is necessary to support activities that lead to the most significant savings in terms of energy and environmental emissions. Consequently, region representatives discussed the ways to improve the walkability of pedestrian routes in European cities with a focus on outdoor thermal comfort and effective methods to protect users of public spaces during summer heatwaves.
Newly identified pro-environmental attitudes can be used to create baselines for new models of sustainable living in a transition to renewable and sustainable energy. This is regarding individual households but can be extended to neighborhood units and urban settlements [41]. Several decarbonization challenges relevant to these scales have already been identified [41,74,75]. The impact of user behavior on energy consumption and carbon emissions in buildings, although very well presented by [24,48,76], is still underestimated. Further research should address policy development supporting the green transition with a focus on the radical reduction of GHG emissions and strong support for a prosumer economy, integrated sustainable mobility, increased walkability, and ways to improve outdoor thermal comfort. There is an urgent need to address these issues to bend the warming curve down through deep cuts in emissions of CO2 [3].
Supplementary Materials
The following supporting information can be downloaded at: https://www.mdpi.com/article/10.3390/en17163888/s1, Section S1: Survey and statistics, Section S2: Calculations.
Funding
This research was funded by Wroclaw University of Science and Technology [grant number W01/K03/2021]. The APC was funded by Wroclaw University of Science and Technology [grant number W01/K03/2024].
Data Availability Statement
The original contributions presented in the study are included in the article, further inquiries can be directed to the corresponding author.
Acknowledgments
The author wishes to acknowledge the contribution of the survey participants who dedicated their valuable time and kindly agreed to participate in this research. The research has been a part of an action undertaken within activities of EU Mission Adaptation to Climate Change.
Conflicts of Interest
The author declares no conflicts of interest. The funders had no role in the design of the study, in the collection, analyses, or interpretation of data, in the writing of the manuscript, or in the decision to publish the results.
Abbreviations
The list of abbreviations and symbols used in the text
| AC | Air Conditioning |
| CCE | Cumulative CO2-equivalent Emissions |
| CPBT | Carbon Payback Time |
| DEA | Danish Energy Agency |
| EEA | European Environment Agency |
| EEI | Energy-Efficiency Index |
| EC | The European Commission |
| EU | The European Union |
| GHG | Greenhouse Gas |
| HH | Household |
| ICAO | International Civil Aviation Organization |
| IPCC | Intergovernmental Panel on Climate Change |
| LCA | Life-Cycle Assessment |
| LcoE | Levelized Cost of Energy Calculator |
| MJ | Megajoule |
| non-RES | Non-renewable Energy Sources |
| PV | Photovoltaic |
| rPET | Recycled polyethylene Tetraphyte (PET) |
| RES | Renewable Energy Sources |
| wk | Week |
| yr | Year |
| Symbols | |
| Cn | Number of survey participants declaring particular behavioral change |
| Cpax | Amount of CO2 emitted during the flight calculated per passenger |
| CPV | Carbon footprint of PV panels installed in households |
| CFMP | Carbon footprint from meat production |
| EAC | Energy consumption for cooling purposes in a single household |
| Each | Average energy consumption of AC system per hour |
| EM | Amount of energy required to produce 1 ton of cultured meat |
| EPV | Annual production of photovoltaic energy per household |
| EWA | Annual energy reduction for washing appliances |
| Mcyr | Average annual meat consumption per person |
| Mcw | Average weekly meat consumption per person |
| NACd | Number of AC system working days per year |
| Npax | Number of passengers on board during the flight |
| PC | Cooking hob power |
| RCP | Annual reduction of carbon dioxide emissions from plastic |
| RCPV | Annual reduction of CO2 emissions per household resulting from replacing non-renewable grid electricity with photovoltaic electricity |
| RM | Reduction in annual meat consumption |
| RP | Annual reduction of disposable plastic usage |
| REP | Annual reduction of embodied energy of plastic |
| RPHw | An average reduction of plastic consumption per week per household |
| REAC | Annual reduction of energy consumption for cooling purposes |
| RCAC | Annual reduction of carbon dioxide emissions from AC |
| RM | Annual reduction of meat consumption |
| REM | Annual reduction of energy consumption of cultured meat production |
| RCM | Annual reduction of carbon dioxide emissions resulting from the elimination of meat from the diet |
| RFC | Annual reduction of fossil-fuel consumption resulting from reduced car journeys |
| REFC | Annual energy savings from fossil-fuel consumption of car travel |
| RCFC | Annual reduction of carbon dioxide emissions from fossil fuels from car journeys |
| REWPET | Annual reduction of energy consumption from single-use bottled water |
| RCWPET | Annual reduction of CO2 emissions from bottled water |
| REA | Annual reduction of energy consumption from household appliances: |
| RERA | Annual reduction of energy consumption from refrigerating appliances |
| RECA | Annual reduction of energy consumption from cooking appliances |
| REDA | Annual reduction of energy consumption from dishwashers |
| REWA | Annual reduction of CO2 emissions from washing appliances |
| RCA | Annual reduction of carbon dioxide emissions from household appliances: |
| RCRA | Annual reduction of CO2 emissions from refrigerating appliances |
| RCCA | Annual reduction of CO2 emissions from cooking appliances |
| RCDA | Annual reduction of CO2 emissions from dishwashing appliances |
| RCWA | Annual reduction of CO2 emissions from washing appliances |
| REW | Annual reduction of energy consumption from washing habits |
| RCW | Annual reduction of CO2 emissions from washing habits |
| RFF | Annual reduction of fossil-fuel consumption resulting from flying |
| REF | Annual reduction of energy consumption from flying |
| RCF | Annual reduction of CO2 emissions from flying |
| RENR | Annual reduction of non-renewable energy consumption |
| RCNR | Annual reduction of CO2 emissions from non-renewable grid energy consumption |
| RELM | Annual reduction of energy from lawnmowers |
| RCLM | Annual reduction of CO2 emissions from lawnmowers |
| TACd | Daily operational time of air conditioner |
| TCd | Average number of device working hours per day |
| TDd | Average number of dishwasher loads per day |
References
- IPCC. Sixth Assessment Report, Climate Change 2022: Impacts, Adaptation and Vulnerability, the Working Group II Contribution. Available online: https://www.ipcc.ch/report/sixth-assessment-report-working-group-ii/ (accessed on 10 June 2022).
- European Environment Agency. European Climate Risk Assessment, EEA Report No 1/2024. Available online: https://www.eea.europa.eu/publications/european-climate-risk-assessment (accessed on 23 July 2024).
- European Commission. Communication from the Commission to the European Parliament, the Council, the European Economic and Social Committee and the Committee of the Regions: Managing Climate Risks—Protecting People and Prosperity, Strasbourg. 12 March 2024. Available online: https://eur-lex.europa.eu/legal-content/EN/TXT/?uri=CELEX%3A52024DC0091 (accessed on 23 July 2024).
- Khan, S.A.R.; Zaman, K.; Zhang, Y. The relationship between energy-resource depletion, climate change, health resources and the environmental Kuznets curve: Evidence from the panel of selected developed countries. Renew. Sustain. Energy Rev. 2016, 62, 468–477. [Google Scholar] [CrossRef]
- Amoruso, F.M.; Sonn, M.-H.; Schuetze, T. Carbon-neutral building renovation potential with passive house-certified components: Applications for an exemplary apartment building in the Republic of Korea. Build. Environ. 2022, 215, 108986. [Google Scholar] [CrossRef]
- Lausselet, C.; Lund, K.M.; Brattebø, H. LCA and scenario analysis of a Norwegian net-zero GHG emission neighbourhood: The importance of mobility and surplus energy from PV technologies. Build. Environ. 2021, 189, 107528. [Google Scholar] [CrossRef]
- Bucher, D.; Buffat, R.; Froemelt, A.; Raubal, M. Energy and greenhouse gas emission reduction potentials resulting from different commuter electric bicycle adoption scenarios in Switzerland. Renew. Sustain. Energy Rev. 2019, 114, 109298. [Google Scholar] [CrossRef]
- Pylsy, P.; Lylykangas, K.; Kurnitski, J. Buildings’ energy efficiency measures effect on CO2 emissions in combined heating, cooling and electricity production. Renew. Sustain. Energy Rev. 2020, 134, 110299. [Google Scholar] [CrossRef]
- Slabe-Erker, R.; Dominko, M.; Bayar, A.; Majcen, B.; Primc, K. Energy efficiency in residential and non-residential buildings: Short-term macroeconomic implications. Build. Environ. 2022, 222, 109364. [Google Scholar] [CrossRef]
- Wang, C.; Lu, S.; Chen, H.; Li, Z.; Lin, B. Effectiveness of one-click feedback of building energy efficiency in supporting early-stage architecture design: An experimental study. Build. Environ. 2021, 196, 107780. [Google Scholar] [CrossRef]
- Seyrek, C.I.; Widera, B.; Woźniczka, A. Sustainability-Related Parameters and Decision Support Tools for Kinetic Green Façades. Sustainability 2021, 13, 10313. [Google Scholar] [CrossRef]
- Cubillos-González, R.-A.; Cardoso, G.T. Clean technology transfer and innovation in social housing production in Brazil and Colombia. A framework from a systematic review. Sustainability 2020, 12, 1335. [Google Scholar] [CrossRef]
- Merabet, G.H.; Essaaidi, M.; Ben Haddou, M.; Qolomany, B.; Qadir, J.; Anan, M.; Al-Fuqaha, A.; Abid, M.R.; Benhaddou, D. Intelligent building control systems for thermal comfort and energy-efficiency: A systematic review of artificial intelligence-assisted techniques. Renew. Sustain. Energy Rev. 2021, 144, 110969. [Google Scholar] [CrossRef]
- Lago, J.; Marcjasz, G.; De Schutter, B.; Weron, R. Forecasting day-ahead electricity prices: A review of state-of-the-art algorithms, best practices and an open-access benchmark. Appl. Energy 2021, 293, 116983. [Google Scholar] [CrossRef]
- Jouhara, H.; Sayegh, M.A. Energy efficient thermal systems and processes. Therm. Sci. Eng. Prog. 2018, 7, 1–2. [Google Scholar] [CrossRef]
- Widera, B. Comparative analysis of user comfort and thermal performance of six types of vernacular dwellings as the first step towards climate resilient, sustainable and bioclimatic architecture in western sub-Saharan Africa. Renew. Sustain. Energy Rev. 2021, 140, 110736. [Google Scholar] [CrossRef]
- Lee, J.; McCuskey Shepley, M.M. Benefits of solar photovoltaic systems for low-income families in social housing of Korea: Renewable energy applications as solutions to energy poverty. J. Build. Eng. 2020, 28, 101016. [Google Scholar] [CrossRef]
- Widera, B. Bioclimatic architecture. J. Civ. Eng. Archit. Res. 2015, 2, 567–578. [Google Scholar]
- Givoni, B. Comfort, climate analysis and building design guidelines. Energy Build. 1992, 18, 11–23. [Google Scholar] [CrossRef]
- Widera, B. Bioclimatic architecture as an opportunity for developing countries. In Proceedings of the 30th International PLEA Conference: Sustainable Habitat for Developing Societies—Choosing The Way Forward, CEPT University, Ahmedabad, India, 16–18 December 2014; Available online: https://www.researchgate.net/publication/276936256_Bioclimatic_architecture_as_an_opportunity_for_developing_countries/link/555c576808aec5ac2232b614/download?_tp=eyJjb250ZXh0Ijp7ImZpcnN0UGFnZSI6InB1YmxpY2F0aW9uIiwicGFnZSI6InB1YmxpY2F0aW9uIn19 (accessed on 12 April 2021).
- Pacheco, R.; Ordóñez, J.; Martínez, G. Energy efficient design of building: A review. Renew. Sustain. Energy Rev. 2012, 16, 3559–3573. [Google Scholar] [CrossRef]
- Chen, S.; Yang, W.; Yoshino, H.; Levine, M.D.; Newhouse, K.; Hinge, A. Definition of occupant behavior in residential buildings and its application to behavior analysis in case studies. Energy Build. 2015, 104, 1–13. [Google Scholar] [CrossRef]
- Dunlap, R.E.; Jones, R.E. Environmental Concern: Conceptual and Measurement Issues. In Handbook of Environmental Sociology; Dunlap, R.E., Michelson, W., Eds.; Greenwood: Westport, CT, USA, 2002; pp. 482–524. [Google Scholar]
- Laskari, M.; de Masi, R.-F.; Karatasou, S.; Santamouris, M.; Assimakopoulos, M.-N. On the impact of user behaviour on heating energy consumption and indoor temperature in residential buildings. Energy Build. 2022, 255, 111657. [Google Scholar] [CrossRef]
- Wright, B.D.; Masters, G.N. Rating Scale Analysis: Rasch Measurement; MESA: Chicago, IL, USA, 1982. [Google Scholar]
- Byrka, K.; Jȩdrzejewski, A.; Sznajd-Weron, K.; Weron, R. Difficulty is critical: The importance of social factors in modeling diffusion of green products and practices. Renew. Sustain. Energy Rev. 2016, 62, 723–735. [Google Scholar] [CrossRef]
- Delzendeh, E.; Wu, S.; Lee, A.; Zhou, Y. The impact of occupants’ behaviours on building energy analysis: A research review. Renew. Sustain. Energy Rev. 2017, 80, 1061–1071. [Google Scholar] [CrossRef]
- Shen, M.; Lu, Y.; Wei, K.H.; Cui, Q. Prediction of household electricity consumption and effectiveness of concerted intervention strategies based on occupant behaviour and personality traits. Renew. Sustain. Energy Rev. 2020, 127, 109839. [Google Scholar] [CrossRef]
- Naylor, S.; Gillott, M.; Lau, T. A review of occupant-centric building control strategies to reduce building energy use. Renew. Sustain. Energy Rev. 2018, 96, 1–10. [Google Scholar] [CrossRef]
- Berger, C.; Mahdavi, A. Review of current trends in agent-based modeling of building occupants for energy and indoor-environmental performance analysis. Build. Environ. 2020, 173, 106726. [Google Scholar] [CrossRef]
- Dong, B.; Liu, Y.; Fontenot, H.; Ouf, M.; Osman, M.; Chong, A.; Qin, S.; Salim, F.; Xue, H.; Yan, D.; et al. Occupant behavior modeling methods for resilient building design, operation and policy at urban scale: A review. Appl. Energy 2021, 293, 116856. [Google Scholar] [CrossRef]
- Amasyali, K.; El-Gohary, N.M. Real data-driven occupant-behavior optimization for reduced energy consumption and improved comfort. Appl. Energy 2021, 302, 117276. [Google Scholar] [CrossRef]
- Carlucci, S.; De Simone, M.; Firth, S.K.; Kjærgaard, M.B.; Markovic, R.; Rahaman, M.S.; Annaqeeb, M.K.; Biandrate, S.; Das, A.; Dziedzic, J.W.; et al. Modeling occupant behavior in buildings. Build. Environ. 2020, 174, 106768. [Google Scholar] [CrossRef]
- Duranton, G.; Henderson, V.; Strange, W. Handbook of Regional and Urban Economics; Elsevier: Amsterdam, The Netherlands, 2015; Volume 5B, ISBN 9780444595317. [Google Scholar]
- Rootes, C.A. The transformation of environmental activism: Activists, organizations and policy-making. Innov. Eur. J. Soc. Sci. Res. 1999, 12, 155–173. [Google Scholar] [CrossRef]
- Otto, S.; Kaiser, F.G. Ecological behavior across the lifespan: Why environmentalism increases as people grow older. J. Environ. Psychol. 2014, 40, 331–338. [Google Scholar] [CrossRef]
- Lorenzini, J.; Monsch, G.-A.; Rosset, J. Challenging Climate Strikers’ Youthfulness: The Evolution of the Generational Gap in Environmental Attitudes Since 1999. Front. Political Sci. 2021, 3, 633563. [Google Scholar] [CrossRef]
- Terren, L.; Soler-I-Martí, R. “Glocal” and Transversal Engagement in Youth Social Movements: A Twitter-Based Case Study of Fridays For Future-Barcelona. Front. Political Sci. 2021, 3, 635822. [Google Scholar] [CrossRef]
- Mrówczyńska, M.; Skiba, M.; Bazan-Krzywoszańska, A.; Sztubecka, M. Household standards and socio-economic aspects as a factor determining energy consumption in the city. Appl. Energy 2020, 264, 114680. [Google Scholar] [CrossRef]
- Berrill, P.; Wilson, E.J.; Reyna, J.L.; Fontanini, A.D.; Hertwich, E.G. Decarbonization pathways for the residential sector in the United States. Nat. Clim. Change 2022, 12, 712–718. [Google Scholar] [CrossRef]
- Raslan, R.; Ambrose, A. Solving the difficult problem of hard to decarbonize homes. Nat. Energy 2022, 7, 675–677. [Google Scholar] [CrossRef]
- Kawecki, D.; Nowack, B. Polymer-Specific Modeling of the Environmental Emissions of Seven Commodity Plastics as Macro- and Microplastics. Environ. Sci. Technol. 2019, 53, 9664–9676. [Google Scholar] [CrossRef] [PubMed]
- Gutowski, T.G.; Sahni, S.; Allwood, J.M.; Ashby, M.F.; Worrell, E. The energy required to produce materials: Constraints on energy-intensity improvements, parameters of demand. Philos. Trans. R. Soc. A 2013, 371, 20120003. [Google Scholar] [CrossRef] [PubMed]
- Tuomisto, H.L.; de Mattos, M.J.T. Life cycle assessment of cultured meat production. In Proceedings of the 7th International Conference on Life Cycle Assessment in the Agri-Food Sector, Bari, Italy, 22–24 September 2010. [Google Scholar]
- Clune, S.; Crossin, E.; Verghese, K. Systematic review of greenhouse gas emissions for different fresh food categories. J. Clean. Prod. 2017, 140 Pt 2, 766–783. [Google Scholar] [CrossRef]
- Dettore, C.G. Comparative Life-Cycle Assessment of Bottled vs. Tap Water Systems. Center for Sustainable Systems, Report No. CSS09-11. Ph.D. Thesis, University of Michigan, Ann Arbor, MI, USA, 14 December 2009. [Google Scholar]
- Brunzell, L.; Renström, R. Recommendations for revising the energy label system for dishwashers: Supporting sustainable development and usage through the interaction of energy labels, technical improvements and consumer behaviour. Energy Effic. 2020, 13, 145–155. [Google Scholar] [CrossRef]
- Kumar, M.A.; Moghal, A.A.B.; Vydehi, K.V.; Almajed, A. Embodied Energy in the Production of Guar and Xanthan Biopolymers and Their Cross-Linking Effect in Enhancing the Geotechnical Properties of Cohesive Soil. Buildings 2023, 13, 2304. [Google Scholar] [CrossRef]
- Tsang, M.P.; Sonnemann, G.W.; Bassani, D.M. Life-cycle assessment of cradle-to-grave opportunities and environmental impacts of organic photovoltaic solar panels compared to conventional technologies. Sol. Energy Mater. Sol. Cells 2016, 156, 37–48. [Google Scholar] [CrossRef]
- Contreras-Lisperguer, R.; Muñoz-Cerón, E.; Aguilera, J.; de la Casa, J. Cradle-to-cradle approach in the life cycle of silicon solar photovoltaic panels. J. Clean. Prod. 2017, 168, 51–59. [Google Scholar] [CrossRef]
- Dagaut, P.; Cathonnet, M. The ignition, oxidation, and combustion of kerosene: A review of experimental and kinetic modeling. Prog. Energy Combust. Sci. 2005, 32, 48–92. [Google Scholar] [CrossRef]
- US Department of Energy, Office of Energy Efficiency & Renewable Energy, Sustainable Aviation: Fuel Review of Technical Pathways. September 2020. Available online: https://www.energy.gov/sites/prod/files/2020/09/f78/beto-sust-aviation-fuel-sep-2020.pdf (accessed on 20 June 2021).
- Monitoring of CO2 Emissions from Passenger Cars—Regulation (EU) 2019/631 Provided by European Environment Agency (EEA). Available online: https://www.eea.europa.eu/en/analysis/indicators/co2-performance-of-new-passenger (accessed on 14 August 2021).
- Nilsson, D.; Fielding, K.; Dean, A.J. Achieving conservation impact by shifting focus from human attitudes to behaviors. Conserv. Biol. 2020, 34, 93–102. [Google Scholar] [CrossRef] [PubMed]
- Kaiser, F.G.; Wilson, M. Goal-directed conservation behavior: The specific composition of a general performance. Pers. Individ. Differ. 2004, 36, 1531–1544. [Google Scholar] [CrossRef]
- Oladokun, M.G.; Odesola, I.A. Household energy consumption and carbon emissions for sustainable cities—A critical review of modelling approaches. Int. J. Sustain. Built Environ. 2015, 4, 231–247. [Google Scholar] [CrossRef]
- Lapinski, M.K.; Rimal, R.N.; DeVries, R.; Lee, E.L. The Role of Group Orientation and Descriptive Norms on Water Conservation Attitudes and Behaviors. Health Commun. 2007, 22, 133–142. [Google Scholar] [CrossRef]
- Krosnick, J.A. Improving question design to maximize reliability and validity. In The Palgrave Handbook of Survey Research; Vannette, D.L., Krosnick, J.A., Eds.; Palgrave Macmillan: New York, NY, USA, 2018; pp. 95–101. [Google Scholar]
- Cobern, W.W. Everyday Thoughts about Nature: An Interpretive Study of 16 Ninth Graders’ Conceptualizations of Nature; Kluwer Academic Publishers: Dordrecht, The Netherlands, 2000. [Google Scholar]
- Cobern, W.W.; Adams, B. Establishing survey validity: A practical guide. Int. J. Assess. Tools Educ. 2020, 7, 404–419. [Google Scholar] [CrossRef]
- Lamb, R.L.; Annetta, L.; Meldrum, J.; Vallett, D. Measuring science interest: RASCH validation of the science interest survey. Int. J. Sci. Math. Educ. 2012, 10, 643–668. [Google Scholar] [CrossRef]
- Haryani, E.; Cobern, W.W.; Pleasants, B. Indonesia Vocational High School Science Teachers’ Priority Regarding 21st Century Learning Skills in Their Science Classrooms. J. Res. Sci. Math. Technol. Educ. 2019, 2, 105–133. [Google Scholar] [CrossRef]
- Toomey, A.H.; Domroese, M.C. Can citizen science lead to positive conservation attitudes and behaviors? Hum. Ecol. Rev. 2013, 20, 50–62. [Google Scholar]
- St. John, F.; Edwards-Jones, G.; Jones, J.P.G. Conservation and human behaviour: Lessons from social psychology. Wildl. Res. 2011, 37, 658–667. [Google Scholar] [CrossRef]
- Widera, B. Research model for bioclimatic small-scale urban settlement in mild and temperate climate. In PLEA 2020 A Coruña: Planning Post Carbon Cities: 35th PLEA Conference on Passive and Low Energy Architecture, 1–3 September 2020; Álvarez, J.R., Gonçalves, J.C.S., Eds.; University of A Coruña: Coruña, Spain, 2020; Volume 3, pp. 1650–1655. ISBN 978-84-9749-794-7. [Google Scholar] [CrossRef]
- SunEarthTools Calculator. Available online: https://www.sunearthtools.com/tools/CO2-emissions-calculator.php (accessed on 10 August 2021).
- ISO 14044:2006; Environmental Management—Life Cycle Assessment—Requirements and Guidelines. ISO: Geneva, Switzerland, 2006. Available online: https://www.iso.org/standard/38498.html (accessed on 22 August 2021).
- European Commission. Understanding the Energy Label. Available online: https://energy-efficient-products.ec.europa.eu/ecodesign-and-energy-label/understanding-energy-label_en (accessed on 14 August 2021).
- European Commission. New EU Energy Labels Applicable from 1 March 2021. Available online: https://ec.europa.eu/commission/presscorner/detail/en/ip_21_818 (accessed on 25 July 2022).
- ICAO Carbon Emissions Calculator. Available online: https://www.icao.int/environmental-protection/CarbonOffset/Pages/default.aspx (accessed on 20 June 2021).
- Danish Energy Agency, Finding Your Cheapest Way to a Low Carbon Future. The Danish Levelized Cost of Energy Calculator, LCoE Calculator (ens.dk). Available online: https://ens.dk/sites/ens.dk/files/Globalcooperation/vejledning_lcoe_calculator.pdf (accessed on 20 June 2021).
- European Commission. Data and Maps. CO2 Emission Intensity. 2021. Available online: https://www.eea.europa.eu/data-and-maps/daviz/co2-emission-intensity-8#tab-googlechartid_googlechartid_googlechartid_googlechartid_chart_11111 (accessed on 23 June 2021).
- Houses of Parliament, Parliamentary Office of Science and Technology, Carbon Footprint of Electricity Generation, Number 383 June 2011. Available online: https://www.parliament.uk/globalassets/documents/post/postpn_383-carbon-footprint-electricity-generation.pdf (accessed on 27 July 2021).
- Santamouris, M. Innovating to zero the building sector in Europe: Minimising the energy consumption, eradication of the energy poverty and mitigating the local climate change. Sol. Energy 2016, 128, 61–94. [Google Scholar] [CrossRef]
- Widera, B. Proces Kształtowania Relacji z Naturą w Architekturze Współczesnej; Oficyna Wydawnicza Politechniki Wrocławskiej: Wrocław, Poland, 2018; ISBN 978-83-7493-999-7. [Google Scholar]
- von Braun, J.; Ramanathan, V.; Turkson, P.K.A.; Afwork, A.G.; Mukherji, K.A.; Munasinghe, M.; Fears, R.; Sánchez Sorondo, M.; Galaz, V.; Hassan, M.H.A.; et al. Resilience of People and Ecosystems under Climate Stress; Pontifical Academy of Sciences: Rome, Italy, 2022; Available online: https://www.pas.va/content/dam/casinapioiv/pas/pdf-vari/statements/statement_resilience_23aug.pdf (accessed on 7 September 2022).
Figure 1.
Primary energy consumption and CO2 emissions of cultured meat production based on LCA. Source: [44].
Figure 1.
Primary energy consumption and CO2 emissions of cultured meat production based on LCA. Source: [44].
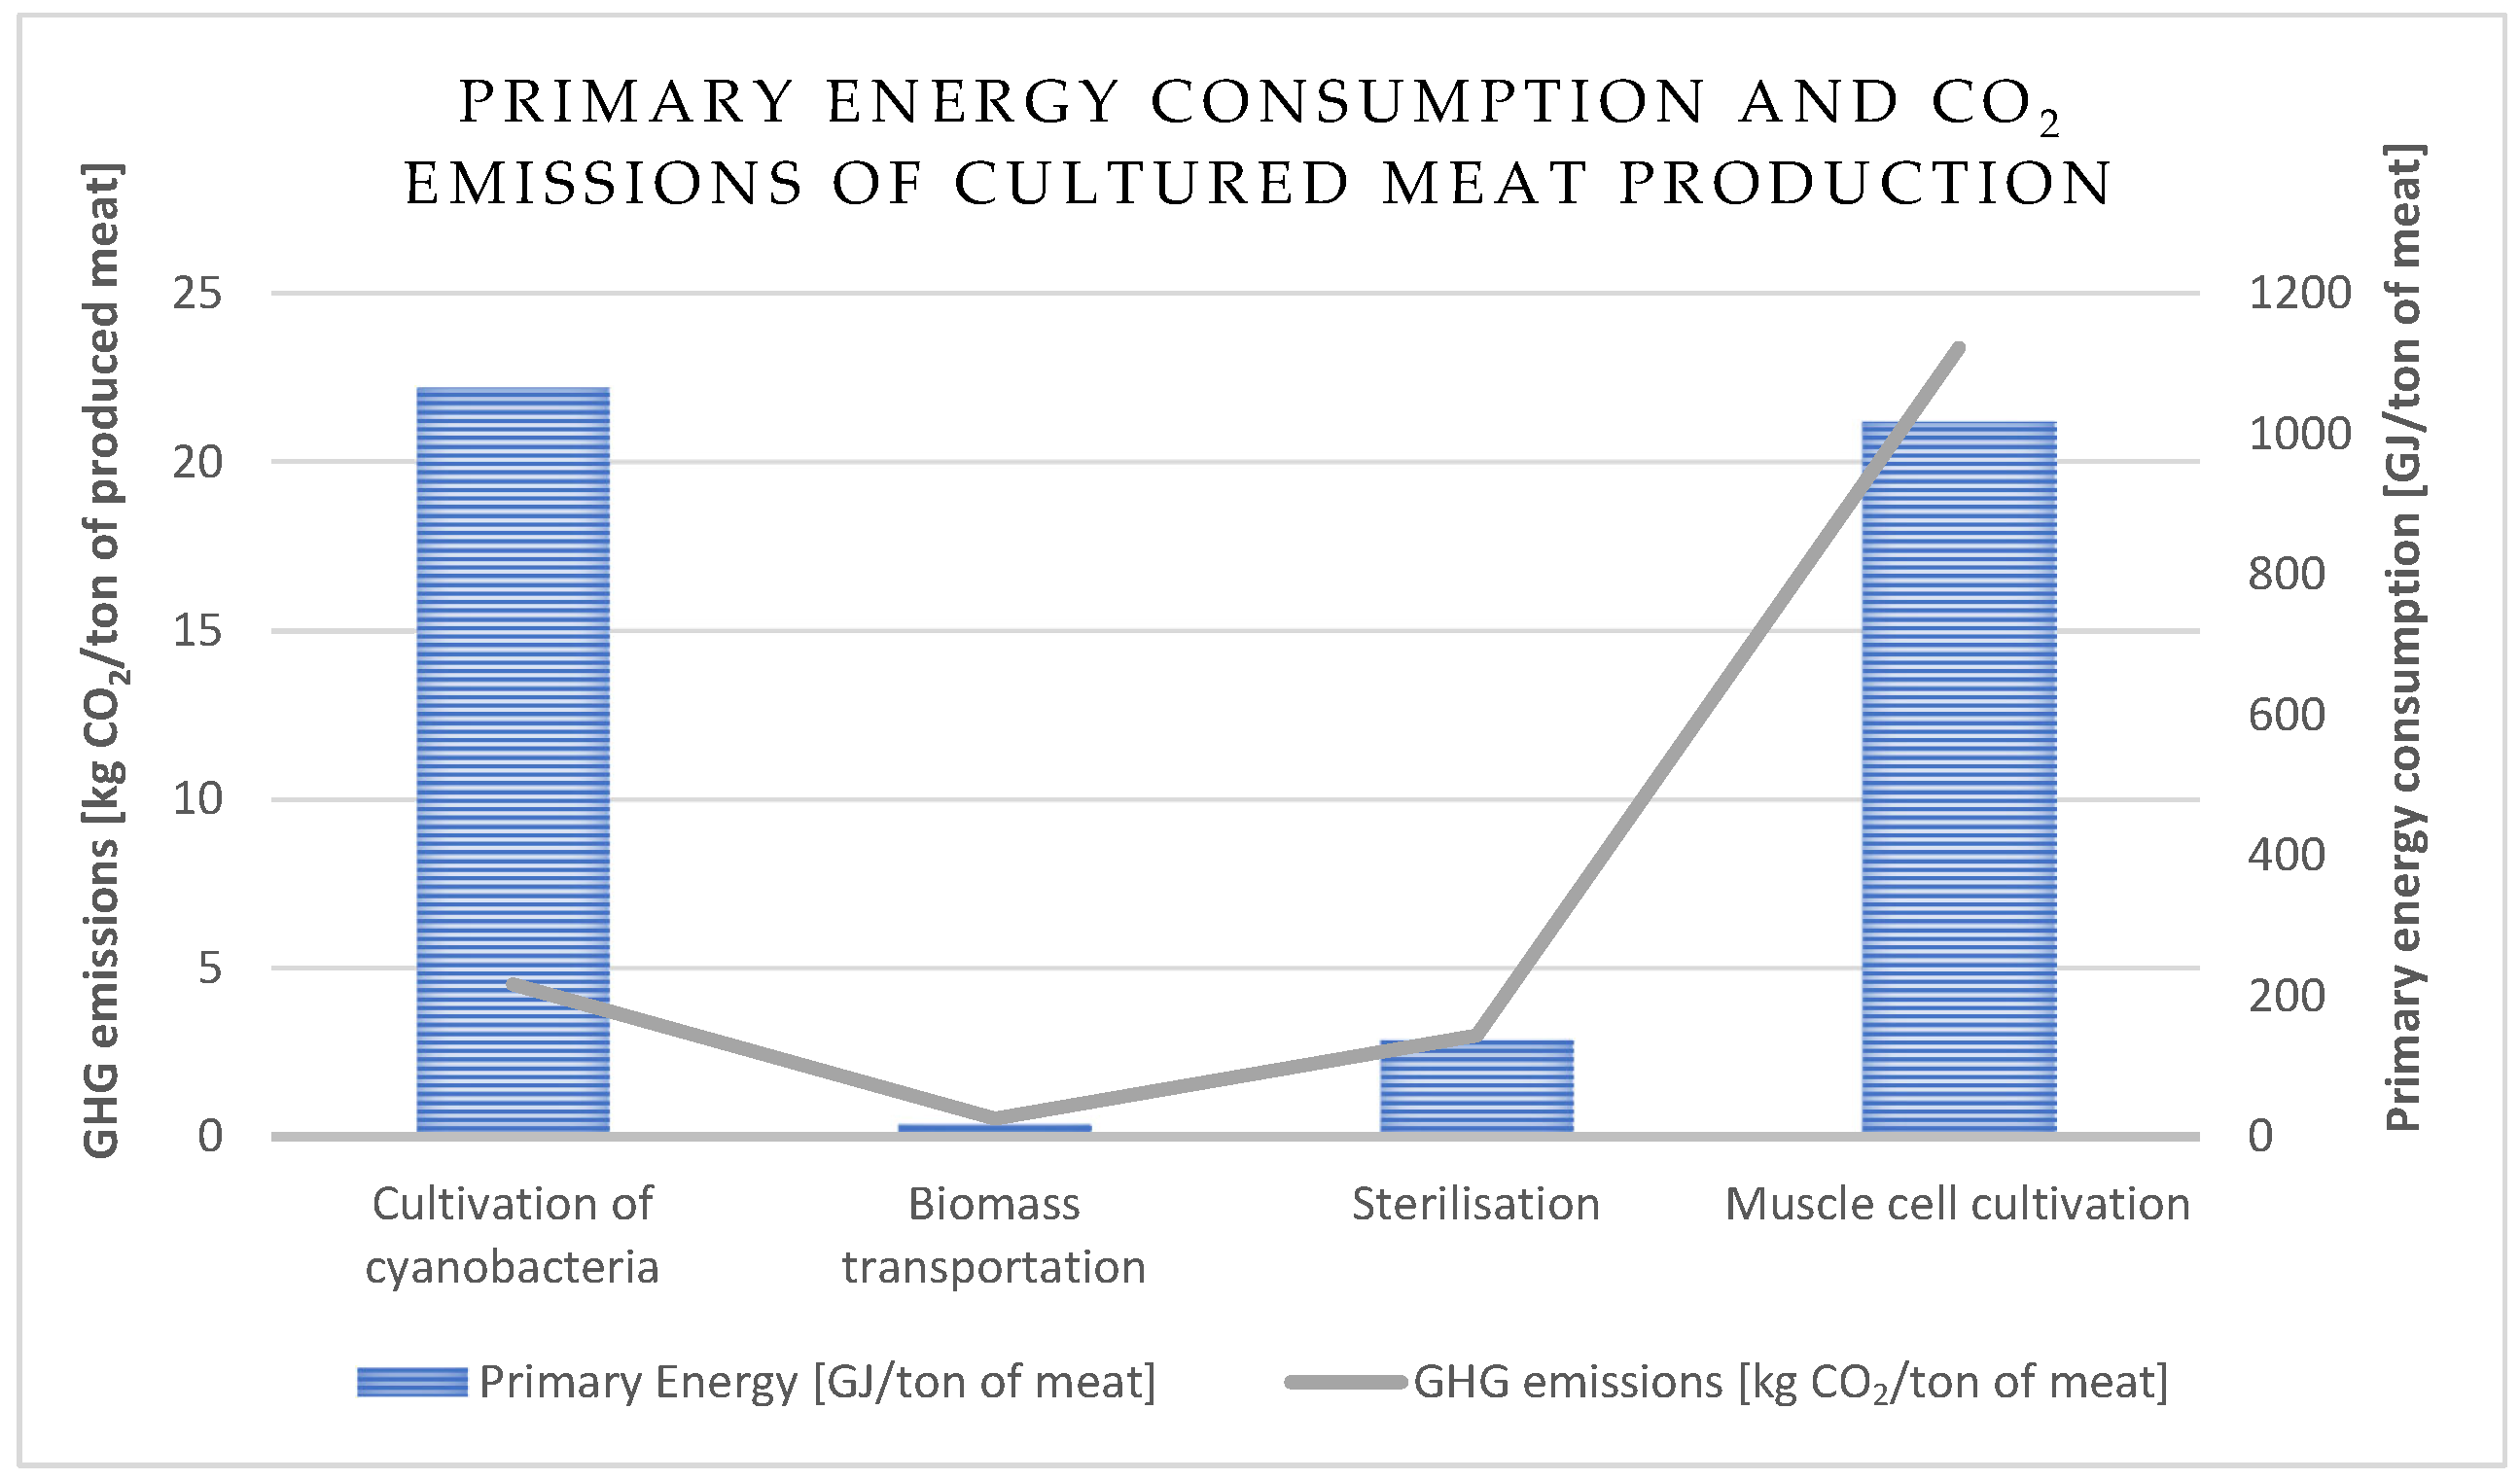
Figure 2.
Energy and carbon-footprint savings—comparison of results for the examined group and per 100 HH. Source: author’s estimations.
Figure 2.
Energy and carbon-footprint savings—comparison of results for the examined group and per 100 HH. Source: author’s estimations.

Figure 3.
Example of green pergolas improving the walkability of pedestrian routes in cities. Source: author (2023).
Figure 3.
Example of green pergolas improving the walkability of pedestrian routes in cities. Source: author (2023).
Figure 4.
Kinetic passive shading protects public spaces during summer heat waves. Source: author (2022).
Figure 4.
Kinetic passive shading protects public spaces during summer heat waves. Source: author (2022).


Table 1.
Summary of the literature review. Source: author.
| Authors | Research Area | Type of Paper | Contribution |
|---|---|---|---|
| IPCC (2022) [1] | GHG emissions and energy consumption in the context of climate change | Report |
|
| Dunlap; Jones (2002) [23] | Research paper |
| |
| Syed et al. (2016) [4] | Research paper |
| |
| Pylsy; Lylykangas; Kurnitski (2020) [8] | Energy efficiency and GHG emissions in building | Research paper |
|
| Slabe-Erker et al. (2022) [9] | Research paper |
| |
| Wang et al. (2021) [10] | Research paper |
| |
| Seyrek, Widera, Woźniczka (2021) [11] | Review paper |
| |
| Mrówczyńska et al. (2020) [39] | Research paper |
| |
| Merabet et al. (2021) [13] | Thermal comfort and energy efficiency in building | Review paper |
|
| Jouhara; Sayegh (2018) [15] | Review paper |
| |
| Widera (2021) [16] | Research paper |
| |
| Cubillos-González; Tiberio Cardoso (2020) [12] | Review paper |
| |
| Amoruso; Sonn; Schuetze (2022) [5] | Carbon-neutral building, LCA | Review paper |
|
| Raslan; Ambrose (2022) [41] | Review paper |
| |
| Berrill et al. (2022) [40] | Review paper |
| |
| Lausselet.; Lund; Brattebø (2020) [6] | Research paper |
| |
| Kawecki; Nowack (2019) [42] | Environmental emissions from materials and processes, LCA | Research paper |
|
| Gutowski et al. (2013) [43] | Research paper |
| |
| Tuomisto; Teixeira de Mattos (2010) [44] | Research paper |
| |
| Clune; Crossin; Verghese (2017) [45] | Research paper |
| |
| Brunzell; Renström (2020) [47] | Research paper |
| |
| Dettore (2009) [46] | Research paper |
| |
| Lee; McCuskey Shepley (2019) [17] | Photovoltaic solar panels in households | Review paper |
|
| Tsang; Sonnemann; Bassani (2016) [49] | Research paper |
| |
| Contreras-Lisperguer et al. (2017) [50] | Research paper |
| |
| Bucher et al. (2019) [7] | Low-carbon mobility | Research paper |
|
| European Environment Agency (2021) [2] | Regulation |
| |
| US Department of Energy (2020) [52] | Report |
| |
| Dagaut; Cathonnet (2005) [51] | Review paper |
| |
| Chen et al. (2015) [22] | Occupant behavior and building performance | Research paper |
|
| Laskari; de Masi; Karatasou; Santamouris; Assimakopoulos (2022) [24] | Research paper |
| |
| Delzendeh et al. (2017) [27] | Review paper |
| |
| Shen et al. (2020) [28] | Research paper |
| |
| Berger; Mahdavi (2020) [30] | Research paper |
| |
| Dong et al. (2021) [31] | Review paper |
| |
| Amasyali; El-Gohary (2021) [32] | Research paper |
| |
| Gillott; Lau (2018) [29] | Review paper |
| |
| Lago et al. (2021) [14] | Review paper |
| |
| Wright; Masters (1982) [25] | User behavior and conservation habits | Research paper |
|
| Byrka et al. (2016) [26] | Review paper |
| |
| Carlucci et al. (2020) [33] | Review paper |
| |
| Nilsson; Fielding; Dean (2020) [54] | Research paper |
| |
| Rootes (1999) [35] | Narrative review |
| |
| Otto; Kaiser (2014) [36] | Narrative review |
| |
| Lorenzinu; Monsch; Rosset (2021) [37] | Narrative review |
| |
| Kaiser; Wilson (2004) [55] | Narrative review |
| |
| Oladokun; Odesola (2015) [56] | Review paper |
| |
| Lapinski et al. (2007) [57] | Review paper |
|
Table 2.
Statistical information on survey participants. Source: author.
| Participant Profile (Self-Descriptive) Country of Residence | Gender | Age | Income | |||||||||||
|---|---|---|---|---|---|---|---|---|---|---|---|---|---|---|
| Female | Male | Other/Prefer Not to Say/Non-Binary Person | <20 | 20–30 | 30–40 | 40–50 | 50–60 | >60 | low | mid | high | <low | Financially Dependent | |
| Total number of participants (500 respondents) | ||||||||||||||
| Austria | 7 | 6 | 0 | 2 | 3 | 3 | 4 | 1 | 0 | 2 | 6 | 5 | 0 | 0 |
| Belgium | 12 | 10 | 0 | 4 | 7 | 2 | 3 | 5 | 1 | 2 | 9 | 7 | 0 | 4 |
| Bulgaria | 3 | 2 | 0 | 0 | 4 | 0 | 1 | 0 | 0 | 1 | 2 | 1 | 1 | 0 |
| Croatia | 4 | 3 | 0 | 0 | 5 | 1 | 1 | 0 | 0 | 2 | 2 | 2 | 1 | 0 |
| Cyprus | 5 | 2 | 1 | 1 | 2 | 4 | 0 | 1 | 0 | 0 | 6 | 2 | 0 | 0 |
| Czech Republic | 8 | 5 | 0 | 2 | 3 | 3 | 1 | 2 | 2 | 2 | 5 | 5 | 0 | 1 |
| Denmark | 22 | 17 | 0 | 15 | 10 | 6 | 4 | 3 | 1 | 3 | 16 | 8 | 0 | 12 |
| Estonia | 4 | 3 | 0 | 0 | 6 | 1 | 0 | 0 | 0 | 2 | 5 | 0 | 0 | 0 |
| Finland | 4 | 2 | 0 | 1 | 3 | 2 | 0 | 0 | 0 | 2 | 2 | 1 | 0 | 1 |
| France | 10 | 14 | 0 | 8 | 7 | 6 | 2 | 0 | 1 | 3 | 9 | 5 | 0 | 7 |
| Germany | 15 | 17 | 0 | 9 | 8 | 7 | 2 | 4 | 2 | 5 | 11 | 8 | 1 | 7 |
| Greece | 14 | 5 | 0 | 8 | 9 | 1 | 1 | 0 | 0 | 4 | 4 | 3 | 0 | 8 |
| Hungary | 6 | 2 | 0 | 2 | 2 | 2 | 0 | 2 | 0 | 2 | 2 | 0 | 2 | 2 |
| Ireland | 10 | 3 | 0 | 3 | 4 | 2 | 1 | 3 | 0 | 3 | 7 | 1 | 1 | 1 |
| Italy | 16 | 14 | 0 | 7 | 9 | 8 | 2 | 3 | 1 | 4 | 15 | 6 | 0 | 5 |
| Latvia | 5 | 4 | 0 | 1 | 5 | 3 | 0 | 0 | 0 | 1 | 8 | 0 | 0 | 0 |
| Lithuania | 5 | 1 | 0 | 0 | 4 | 2 | 0 | 0 | 0 | 1 | 4 | 1 | 0 | 0 |
| Luxembourg | 6 | 4 | 0 | 0 | 3 | 2 | 1 | 4 | 0 | 0 | 5 | 5 | 0 | 0 |
| Malta | 10 | 14 | 1 | 3 | 6 | 3 | 3 | 9 | 1 | 1 | 19 | 4 | 0 | 1 |
| Netherlands | 9 | 10 | 0 | 4 | 1 | 1 | 4 | 8 | 1 | 2 | 11 | 4 | 0 | 2 |
| Poland | 21 | 20 | 0 | 4 | 10 | 5 | 9 | 9 | 4 | 5 | 25 | 3 | 2 | 6 |
| Portugal | 11 | 10 | 0 | 4 | 3 | 3 | 5 | 6 | 0 | 5 | 9 | 4 | 0 | 3 |
| Romania | 7 | 3 | 0 | 1 | 1 | 2 | 2 | 4 | 0 | 2 | 6 | 2 | 0 | 0 |
| Slovakia | 7 | 8 | 0 | 3 | 2 | 4 | 3 | 2 | 1 | 3 | 5 | 3 | 1 | 3 |
| Slovenia | 5 | 6 | 0 | 2 | 4 | 1 | 4 | 0 | 0 | 2 | 7 | 1 | 0 | 1 |
| Spain | 16 | 8 | 0 | 9 | 5 | 5 | 3 | 2 | 0 | 5 | 5 | 4 | 1 | 9 |
| Sweden | 6 | 10 | 1 | 9 | 0 | 4 | 2 | 1 | 1 | 4 | 2 | 4 | 0 | 7 |
| United Kingdom | 21 | 24 | 1 | 19 | 7 | 9 | 6 | 2 | 3 | 7 | 18 | 6 | 1 | 14 |
| ∑ | 269 | 227 | 4 | 121 | 133 | 92 | 64 | 71 | 19 | 75 | 225 | 95 | 11 | 94 |
| Standard Deviation | 11.26 | 10.13 | 0.38 | 6.43 | 5.57 | 4.17 | 3.15 | 3.77 | 1.23 | 2.5 | 10.04 | 4.14 | 0.74 | 4.75 |
| Sample Mean | 9.6 | 8.1 | 0.14 | 4.32 | 4.75 | 3.29 | 2.29 | 2.54 | 0.68 | 2.68 | 8.04 | 3.39 | 0.39 | 3.36 |
| Mode | 5 | 3 | 0 | 4 | 4 | 2 | 2 | 2 | 1 | 2 | 5 | 4 | 0 | 0 |
Table 3.
List of sustainable behaviors declared by the examined group. Source: author.
| No | Sustainable Behaviors | % of Participants |
|---|---|---|
| 1 | I own energy-efficient household devices | 99% |
| 2 | I have eliminated all disposable plastics from households | 96% |
| 3 | I do not use air conditioning for cooling purposes; instead, I use natural ventilation at home | 86% |
| 4 | I drink solely tap water/I do not drink bottled water anymore | 81% |
| 5 | I do not eat any meat products | 80% |
| 6 | I refrain from driving my car in or into the city/In nearby areas, I use public transportation or ride a bike/I ride a bicycle or take public transportation to work or school | 79% |
| 7 | I have limited my laundry to one cycle per week | 77% |
| 8 | I refrain from flying, and I give preference to train journeys | 72% |
| 9 | I use renewable energy sources/I bought solar panels to produce energy | 65% |
| 10 | I have replaced a traditional backyard lawn with a biodiverse meadow | 51% |
| 11 | If I am offered a plastic bag in a store, I never take it. I re-use my shopping bags, and I always have my own non-plastic shopping bag | 49% |
| 12 | I talk with friends about problems related to the environment | 45% |
| 13 | I remember to unplug any electronic devices when fully charged or not used | 45% |
| 14 | I wait until I have a full load before doing my laundry | 44% |
| 15 | In winter, I do not leave the windows open for long periods of time | 43% |
| 16 | In winter, I keep the heat low so that I have to wear a sweater | 39% |
| 17 | I buy products in refillable packages | 35% |
| 18 | I apply passive and/or bioclimatic strategies in my house | 28% |
| 19 | I teach environmental and sustainability issues | 22% |
| 20 | I boycott companies with an unecological background | 21% |
| 21 | I use only biodegradable and environmentally safe cosmetics and household cleaning products | 20% |
| 22 | I refrain from owning a car | 19% |
| 23 | I buy clothes in a responsible way/I select my clothes in such a way that I can wear them in various combinations/ I avoid clothes that require ironing/washing in high temperature | 19% |
| 24 | I refrain from consuming animal-based products | 17% |
| 25 | I take a shower rather than a bath, including taking a shower with a partner/family member | 16% |
| 26 | I do not eat fish and seafood | 15% |
| 27 | I bring empty bottles to a recycling bin | 14% |
| 28 | I take public transportation to where I want to start my hikes | 13% |
| 29 | In winter, I turn down the heat when I leave my apartment for more than 4 h | 12% |
| 30 | I re-use gray water, e.g., for irrigation, having washed vegetables, I use the water in the garden as a natural fertilizer | 11% |
| 31 | I am a member of a carpool | 10% |
Table 4.
Summary of impact indicators. Source: author’s estimations.
| No | Symbol | Impact Value per Annum | ||
|---|---|---|---|---|
| For the Survey Results | For 100 Households | Unit | ||
| 1 | RP | 14.98 | 3.12 | ton of plastic |
| 2 | REP | 353.6 | 73.67 | MWh |
| 3 | RCP | 59.9 | 12.48 | ton CO2 |
| 4 | REAC | 464.4 | 108 | MWh |
| 5 | RCAC | 134.82 | 31.35 | ton CO2 |
| 6 | RM | 18.72 | 4.68 | ton of meat |
| 7 | REM | 137.28 | 34.32 | MWh |
| 8 | RCM | 28.23 | 7.06 | ton CO2 |
| 9 | RFC | 257,540 | 19,398 | L of fossil fuel |
| 10 | REFC | 2292.106 | 277.68 | MWh |
| 11 | RCFC | 267.02 | 67.6 | ton CO2 |
| 12 | REWPET | 180.73 | 44.62 | MWh |
| 13 | RCWPET | 32.521 | 8.03 | ton CO2 |
| 14 | REA | ∑617.41 | ∑124.1 | MWh |
| 14a | RERA | 114.840 | 23.2 | MWh |
| 14b | RECA | 347.49 | 70.2 | MWh |
| 14c | REDA | 103.6 | 20.93 | MWh |
| 14d | REWA | 51.48 | 10.4 | ton CO2 |
| 15 | RCA | ∑179,242 | ∑36.21 | ton CO2 |
| 15a | RCRA | 33.34 | 6.73 | ton CO2 |
| 15b | RCCA | 100.88 | 20.38 | ton CO2 |
| 15c | RCDA | 30.077 | 6.08 | ton CO2 |
| 15d | RCWA | 14.945 | 3.02 | ton CO2 |
| 16 | REW | 72.072 | 18.72 | MWh |
| 17 | RCW | 20.924 | 5.43 | ton CO2 |
| 18 | RFF | 25.56 | 7.1 | ton fossil fuel |
| 19 | REF | 305.302 | 84.81 | MWh |
| 20 | RCF | 82.44 | 22.9 | ton CO2 |
| 21 | RENR | 1300 | 400 | MWh |
| 22 | RCNR | 262.6 | 80.8 | ton CO2 |
| 23 | RELM | 3.57 | 1.4 | MWh |
| 24 | RCLM | 1.035 | 0.41 | ton CO2 |
Table 5.
The summary of the popularity of environmental decisions and the significance of achieved impacts regarding energy savings and GHG emissions for 100 households. Source: author’s estimations.
Table 5.
The summary of the popularity of environmental decisions and the significance of achieved impacts regarding energy savings and GHG emissions for 100 households. Source: author’s estimations.
| Environmental Decision | Decision Category | Number of Stakeholders | Percent of Stakeholders | Energy Savings per 100 HH MWh/Year | GHG Savings per 100 HH Tons CO2 eq |
|---|---|---|---|---|---|
| Renewable energy from PV roof panels | Energy efficiency in building | 325 | 65% | 400 | 80.8 |
| Car-to-bicycle transition | Sustainable transport | 395 | 79% | 277.68 | 67.6 |
| Energy-efficient appliances in households (D to B) | Energy efficiency in building | 495 | 99% | ∑124.73 | ∑36.21 |
| Refrigerating appliances | 23.2 | 6.73 | |||
| Cooking appliances | 70.2 | 20.38 | |||
| Dishwashers | 20.93 | 6.08 | |||
| Washers | 10.4 | 3.02 | |||
| Replacing AC with natural ventilation | Energy efficiency in building | 430 | 86% | 108 | 31.35 |
| Not flying | Sustainable transport | 360 | 72% | 84.81 | 22.9 |
| Disposable plastic elimination from households | Circular economy in building | 480 | 96% | 73.67 | 12.8 |
| Drinking tap water | Circular economy in building | 405 | 81% | 44.62 | 8.03 |
| Meat elimination from the diet | Resource savings | 400 | 80% | 34.32 | 7.06 |
| Laundry limited to 1 cycle/week | Energy efficiency in building | 385 | 77% | 18.72 | 5.43 |
| Replacing the lawn with a meadow | Biodiversity | 255 | 51% | 1.4 | 0.41 |
| TOTAL | ∑1167.95 | ∑272.59 |
Disclaimer/Publisher’s Note: The statements, opinions and data contained in all publications are solely those of the individual author(s) and contributor(s) and not of MDPI and/or the editor(s). MDPI and/or the editor(s) disclaim responsibility for any injury to people or property resulting from any ideas, methods, instructions or products referred to in the content. |
© 2024 by the author. Licensee MDPI, Basel, Switzerland. This article is an open access article distributed under the terms and conditions of the Creative Commons Attribution (CC BY) license (https://creativecommons.org/licenses/by/4.0/).
Share and Cite
MDPI and ACS Style
Widera, B. Energy and Carbon Savings in European Households Resulting from Behavioral Changes. Energies 2024, 17, 3888. https://doi.org/10.3390/en17163888
AMA Style
Widera B. Energy and Carbon Savings in European Households Resulting from Behavioral Changes. Energies. 2024; 17(16):3888. https://doi.org/10.3390/en17163888
Chicago/Turabian StyleWidera, Barbara. 2024. "Energy and Carbon Savings in European Households Resulting from Behavioral Changes" Energies 17, no. 16: 3888. https://doi.org/10.3390/en17163888
Note that from the first issue of 2016, this journal uses article numbers instead of page numbers. See further details here.
Article Metrics
Article metric data becomes available approximately 24 hours after publication online.