
Study on the Influencing Factors of Oil Bearing and Mobility of Shale Reservoirs in the Fourth Member of the Shahejie Formation in the Liaohe Western Depression


 ,
,
Abstract
:1. Introduction
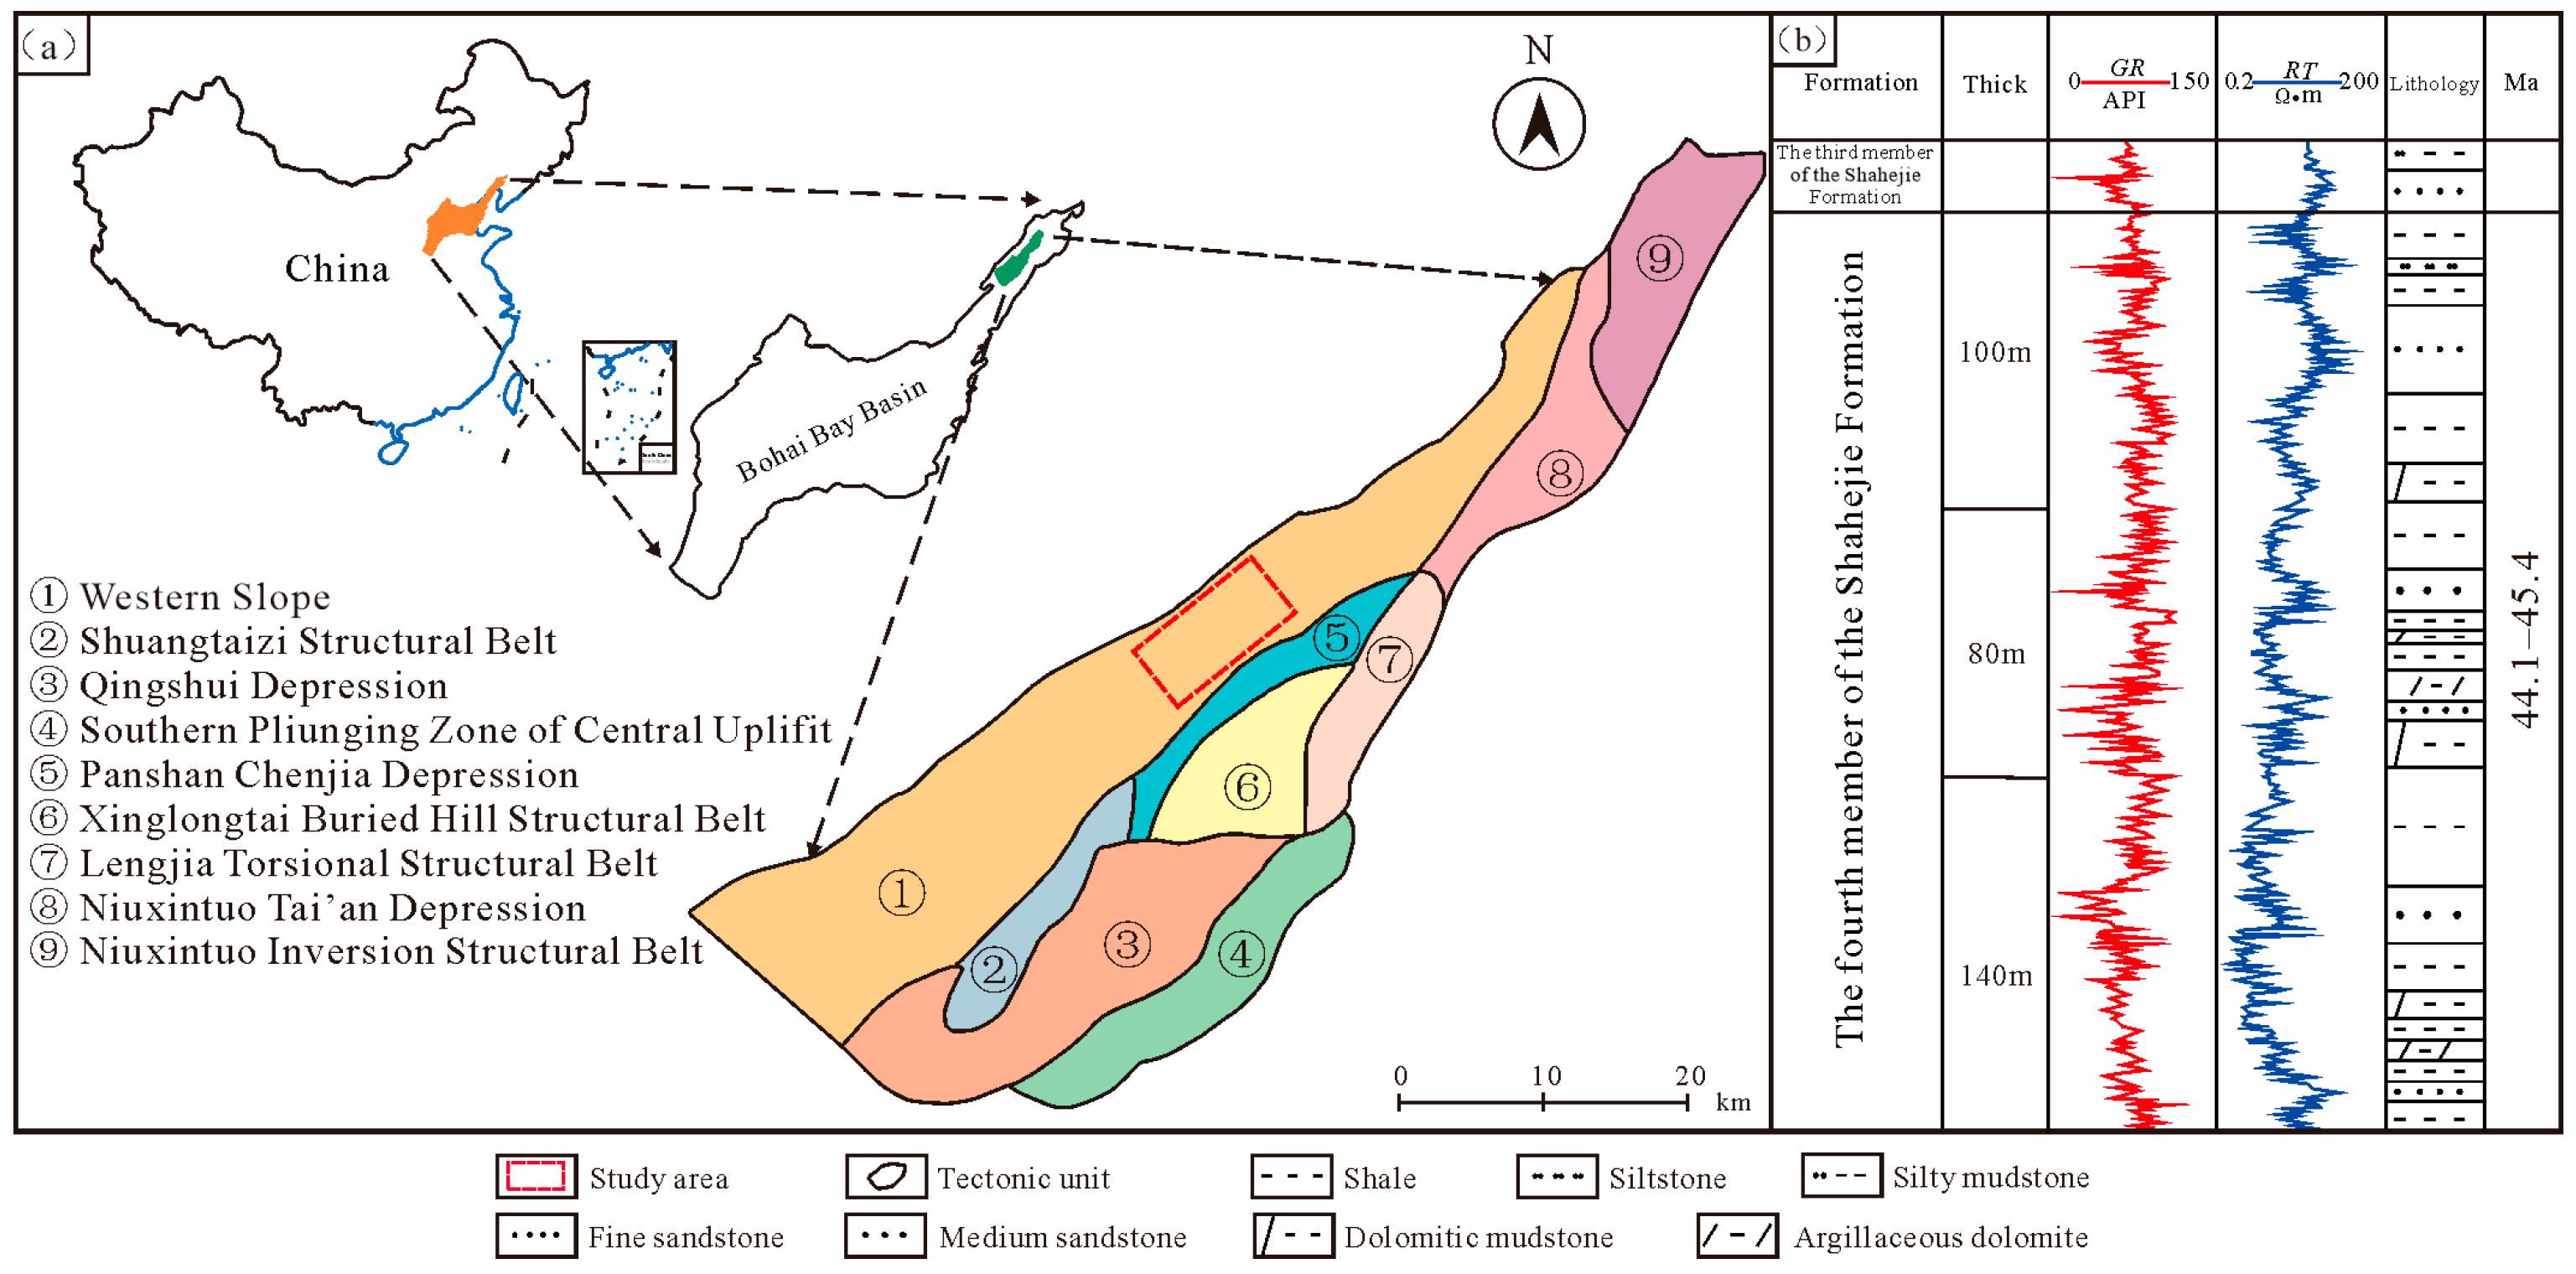
2. Geological Setting
3. Samples and Experimental Methods
3.1. Samples
3.2. Low-Temperature (77.35 K) Nitrogen Adsorption (N2GA)
3.3. High-Pressure Mercury Intrusion (HPMI)
3.4. Nuclear Magnetic Resonance (NMR)
4. Results
4.1. Organic Geochemical Characterization
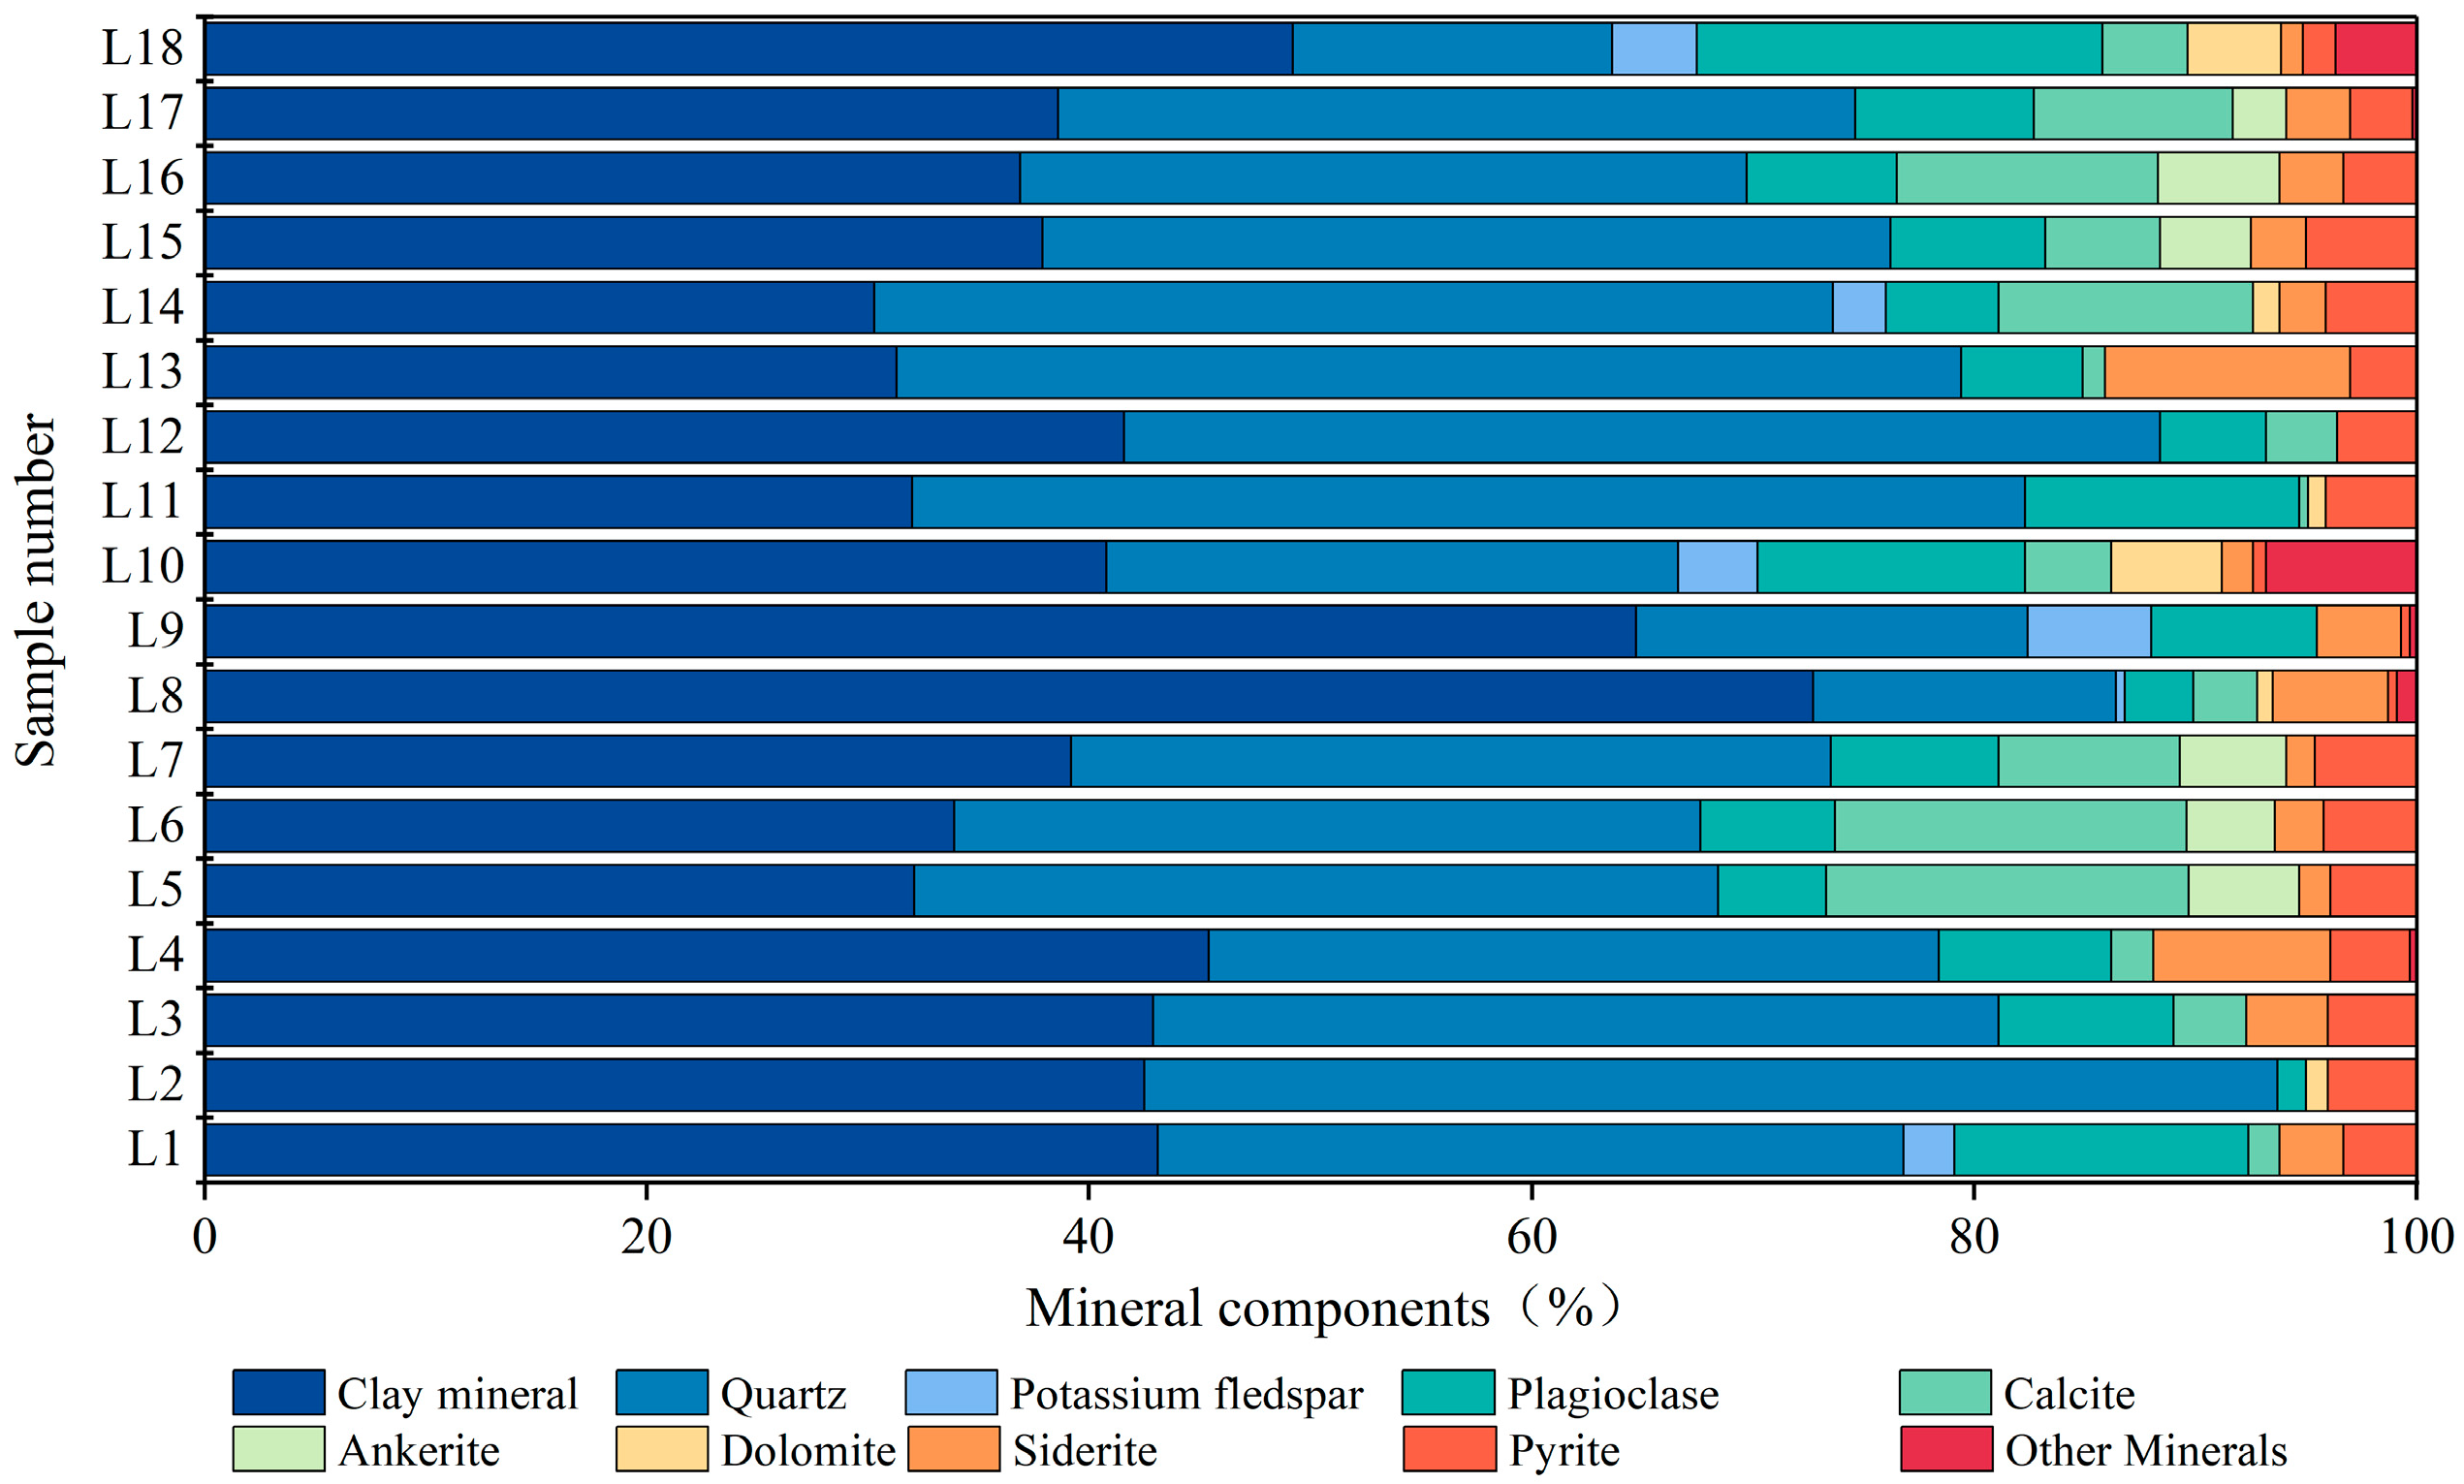
4.2. Characteristics of Mineral Components
4.3. Characteristics of Reservoir Space
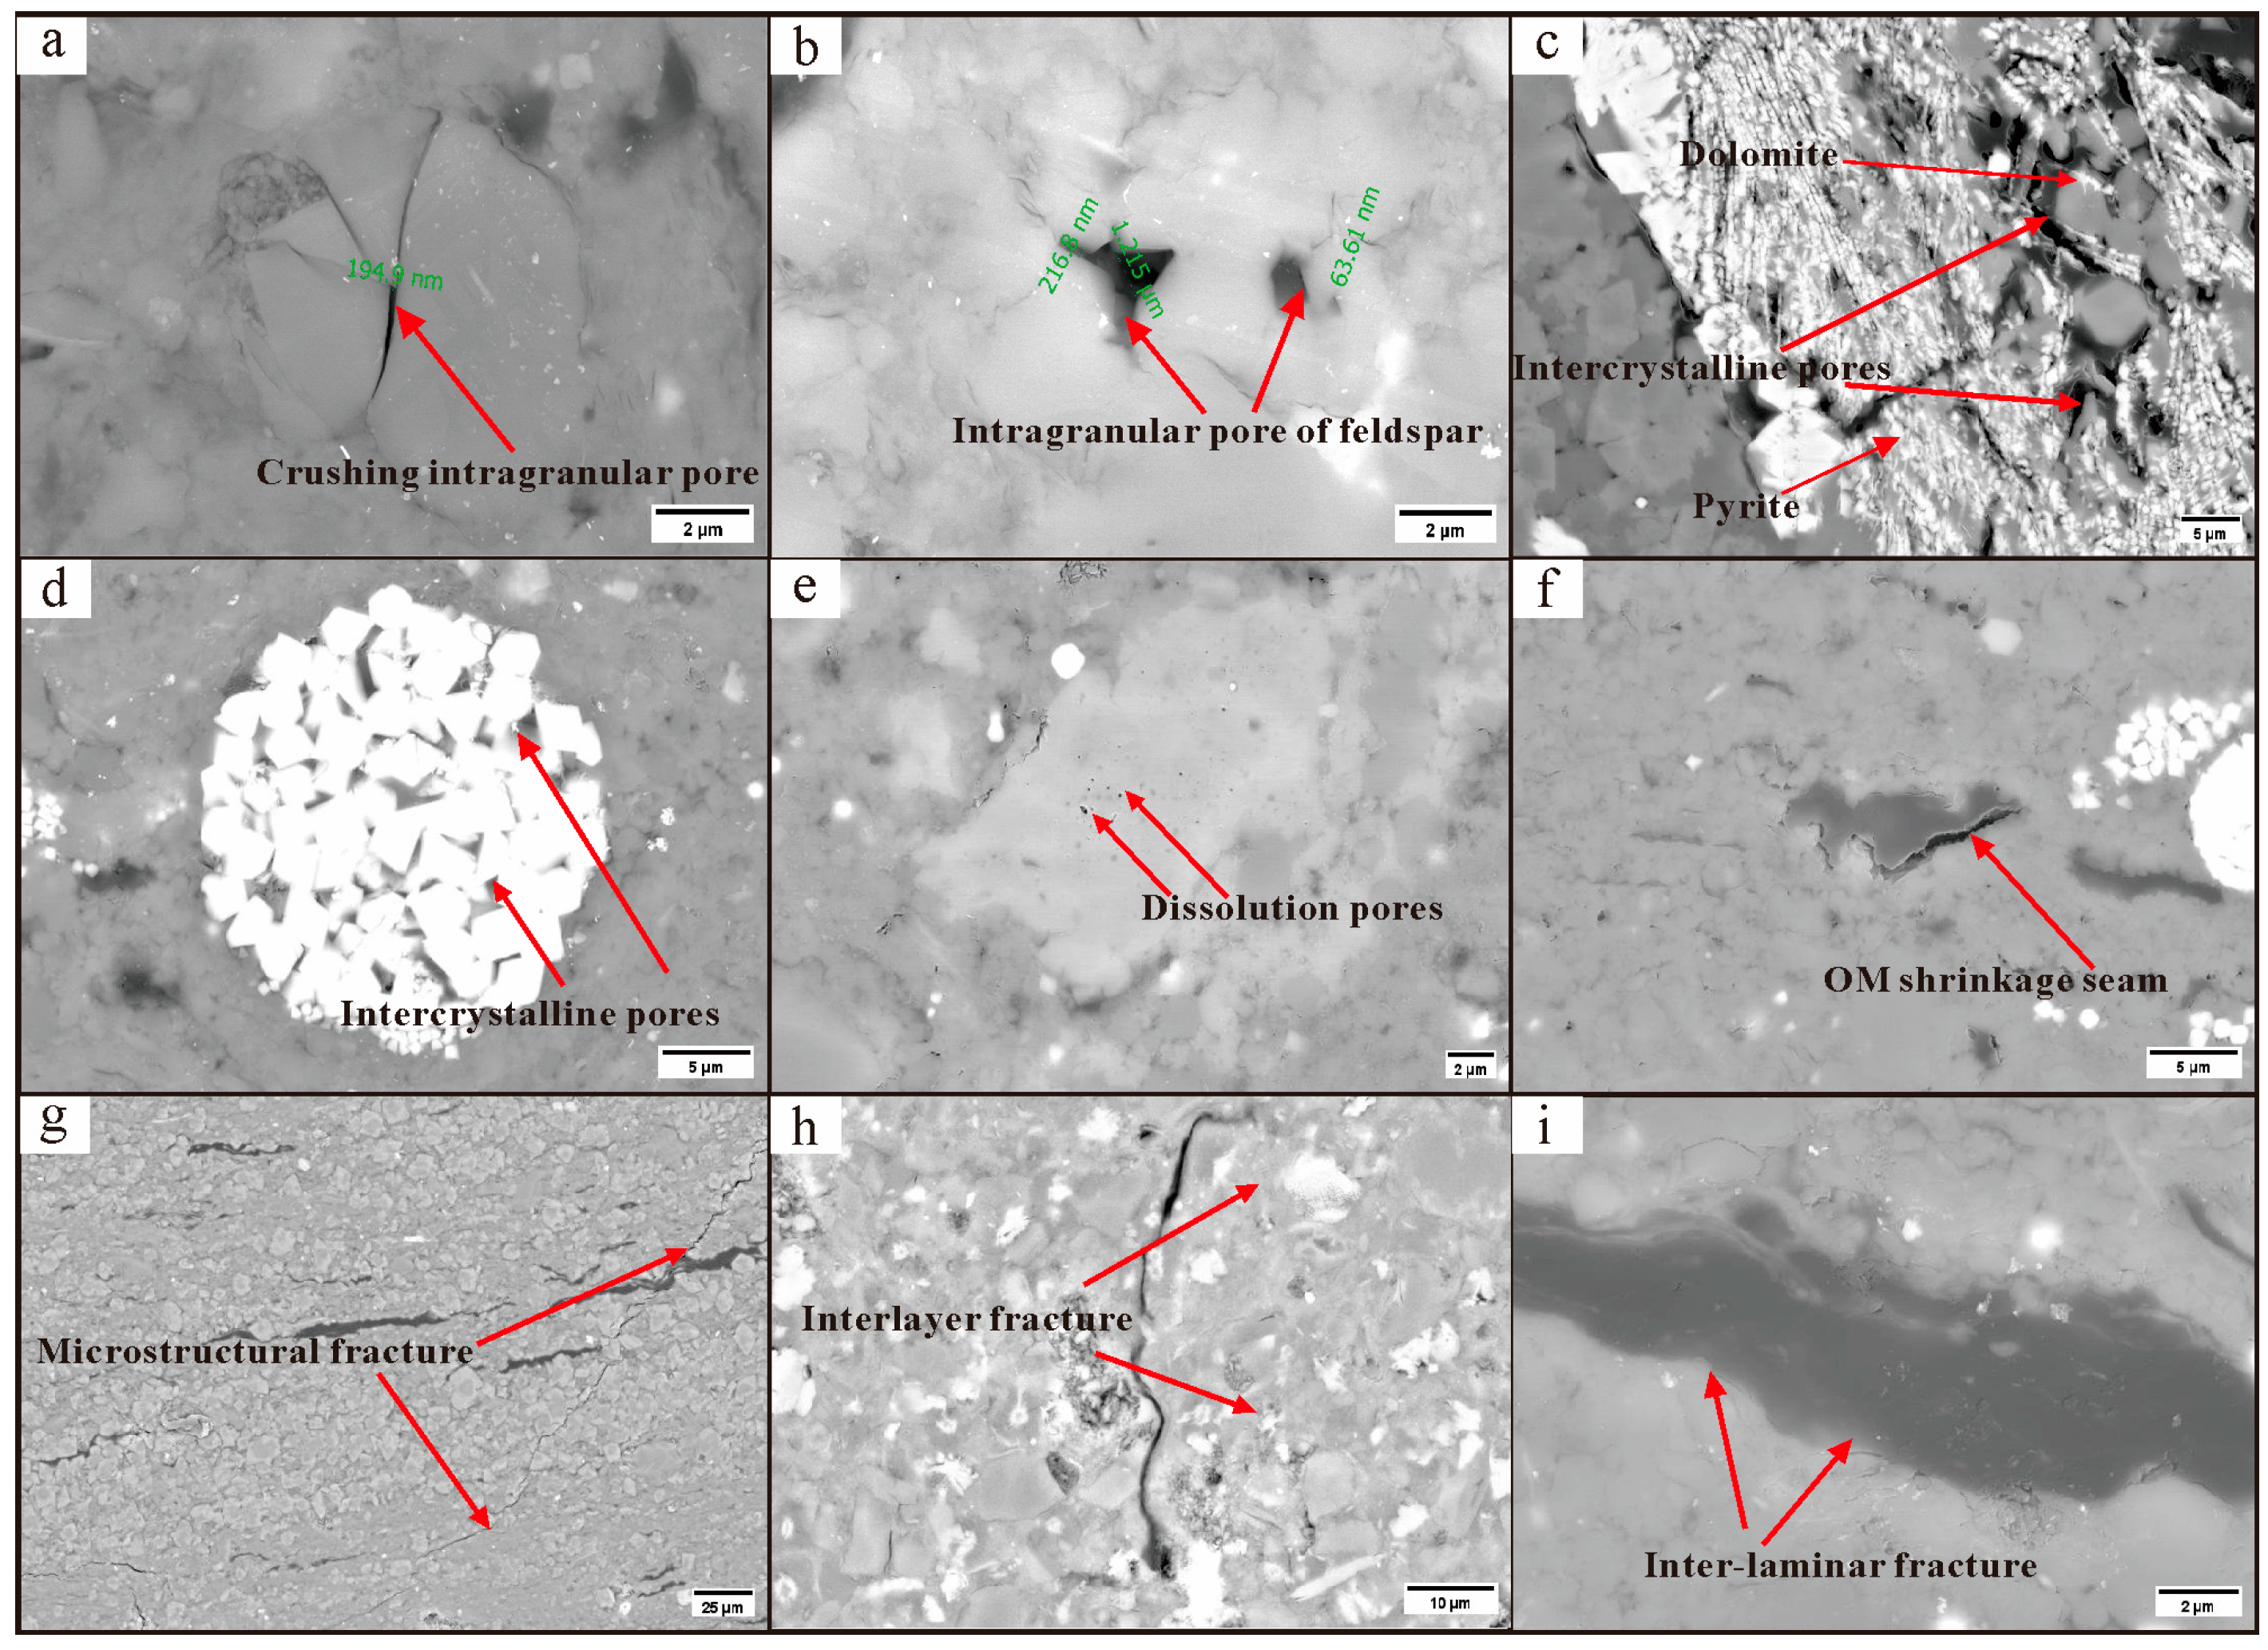
4.3.1. Type of Reservoir Space
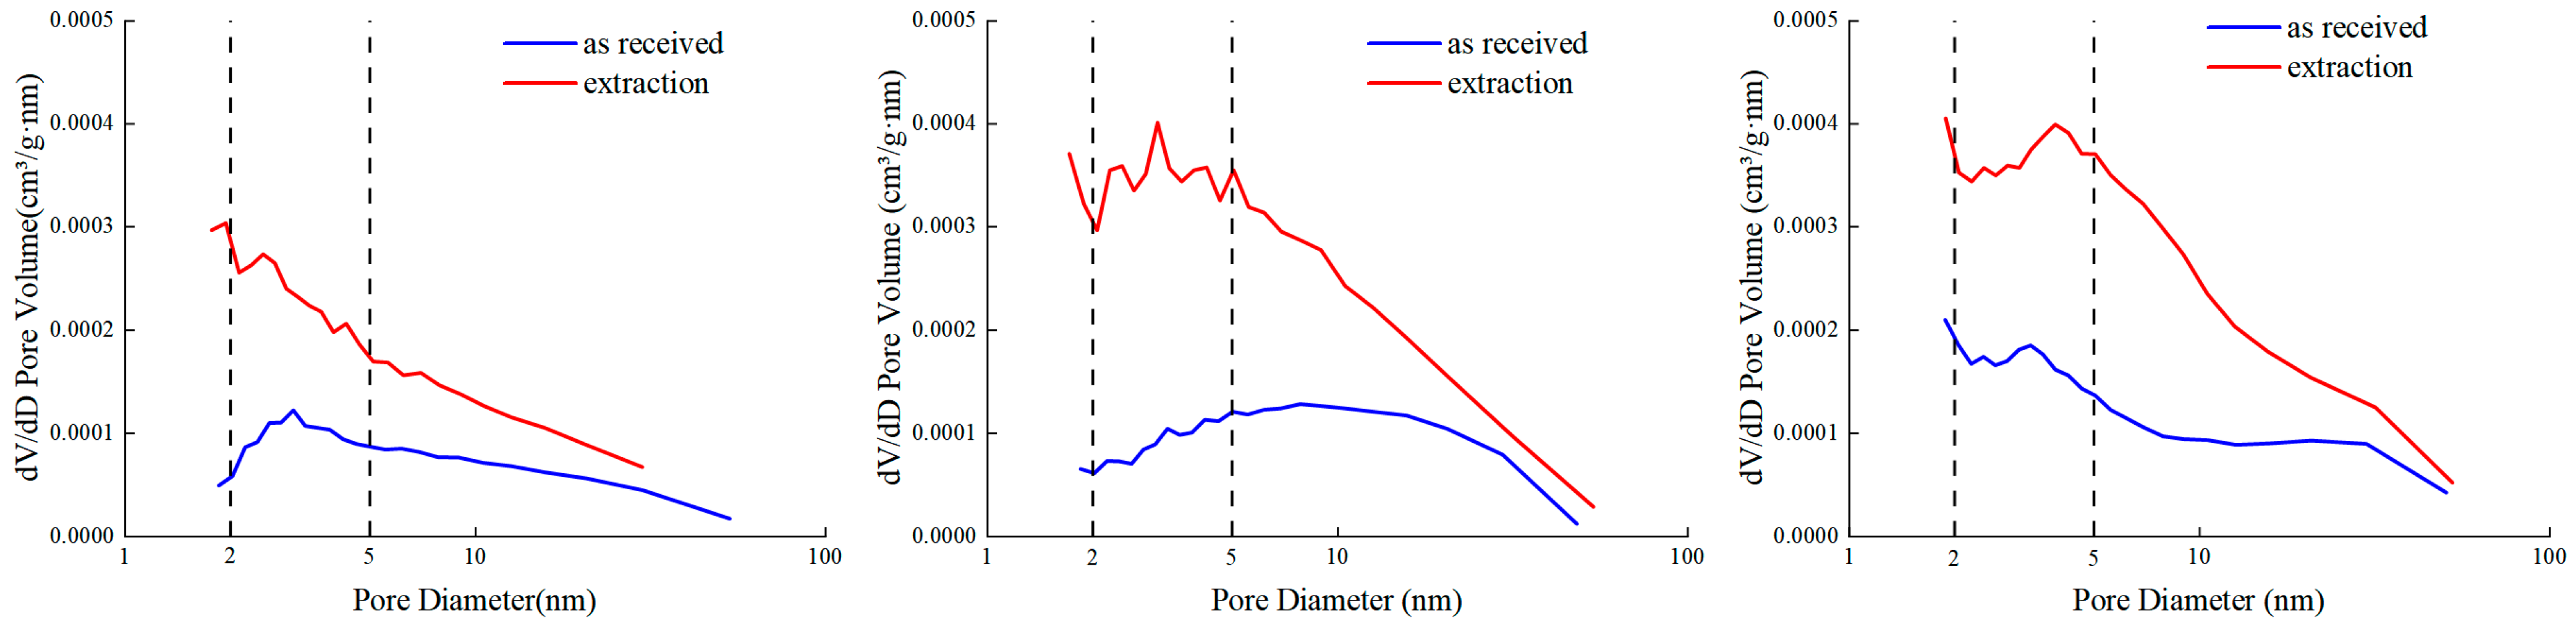
4.3.2. Pore Structure Characterization
- (1)
- Nitrogen adsorption experiment and high-pressure mercury injection experiment parameters.
- (2)
- Nuclear magnetic resonance experiment.
5. Discussion
5.1. Lithofacies Classification of Shale
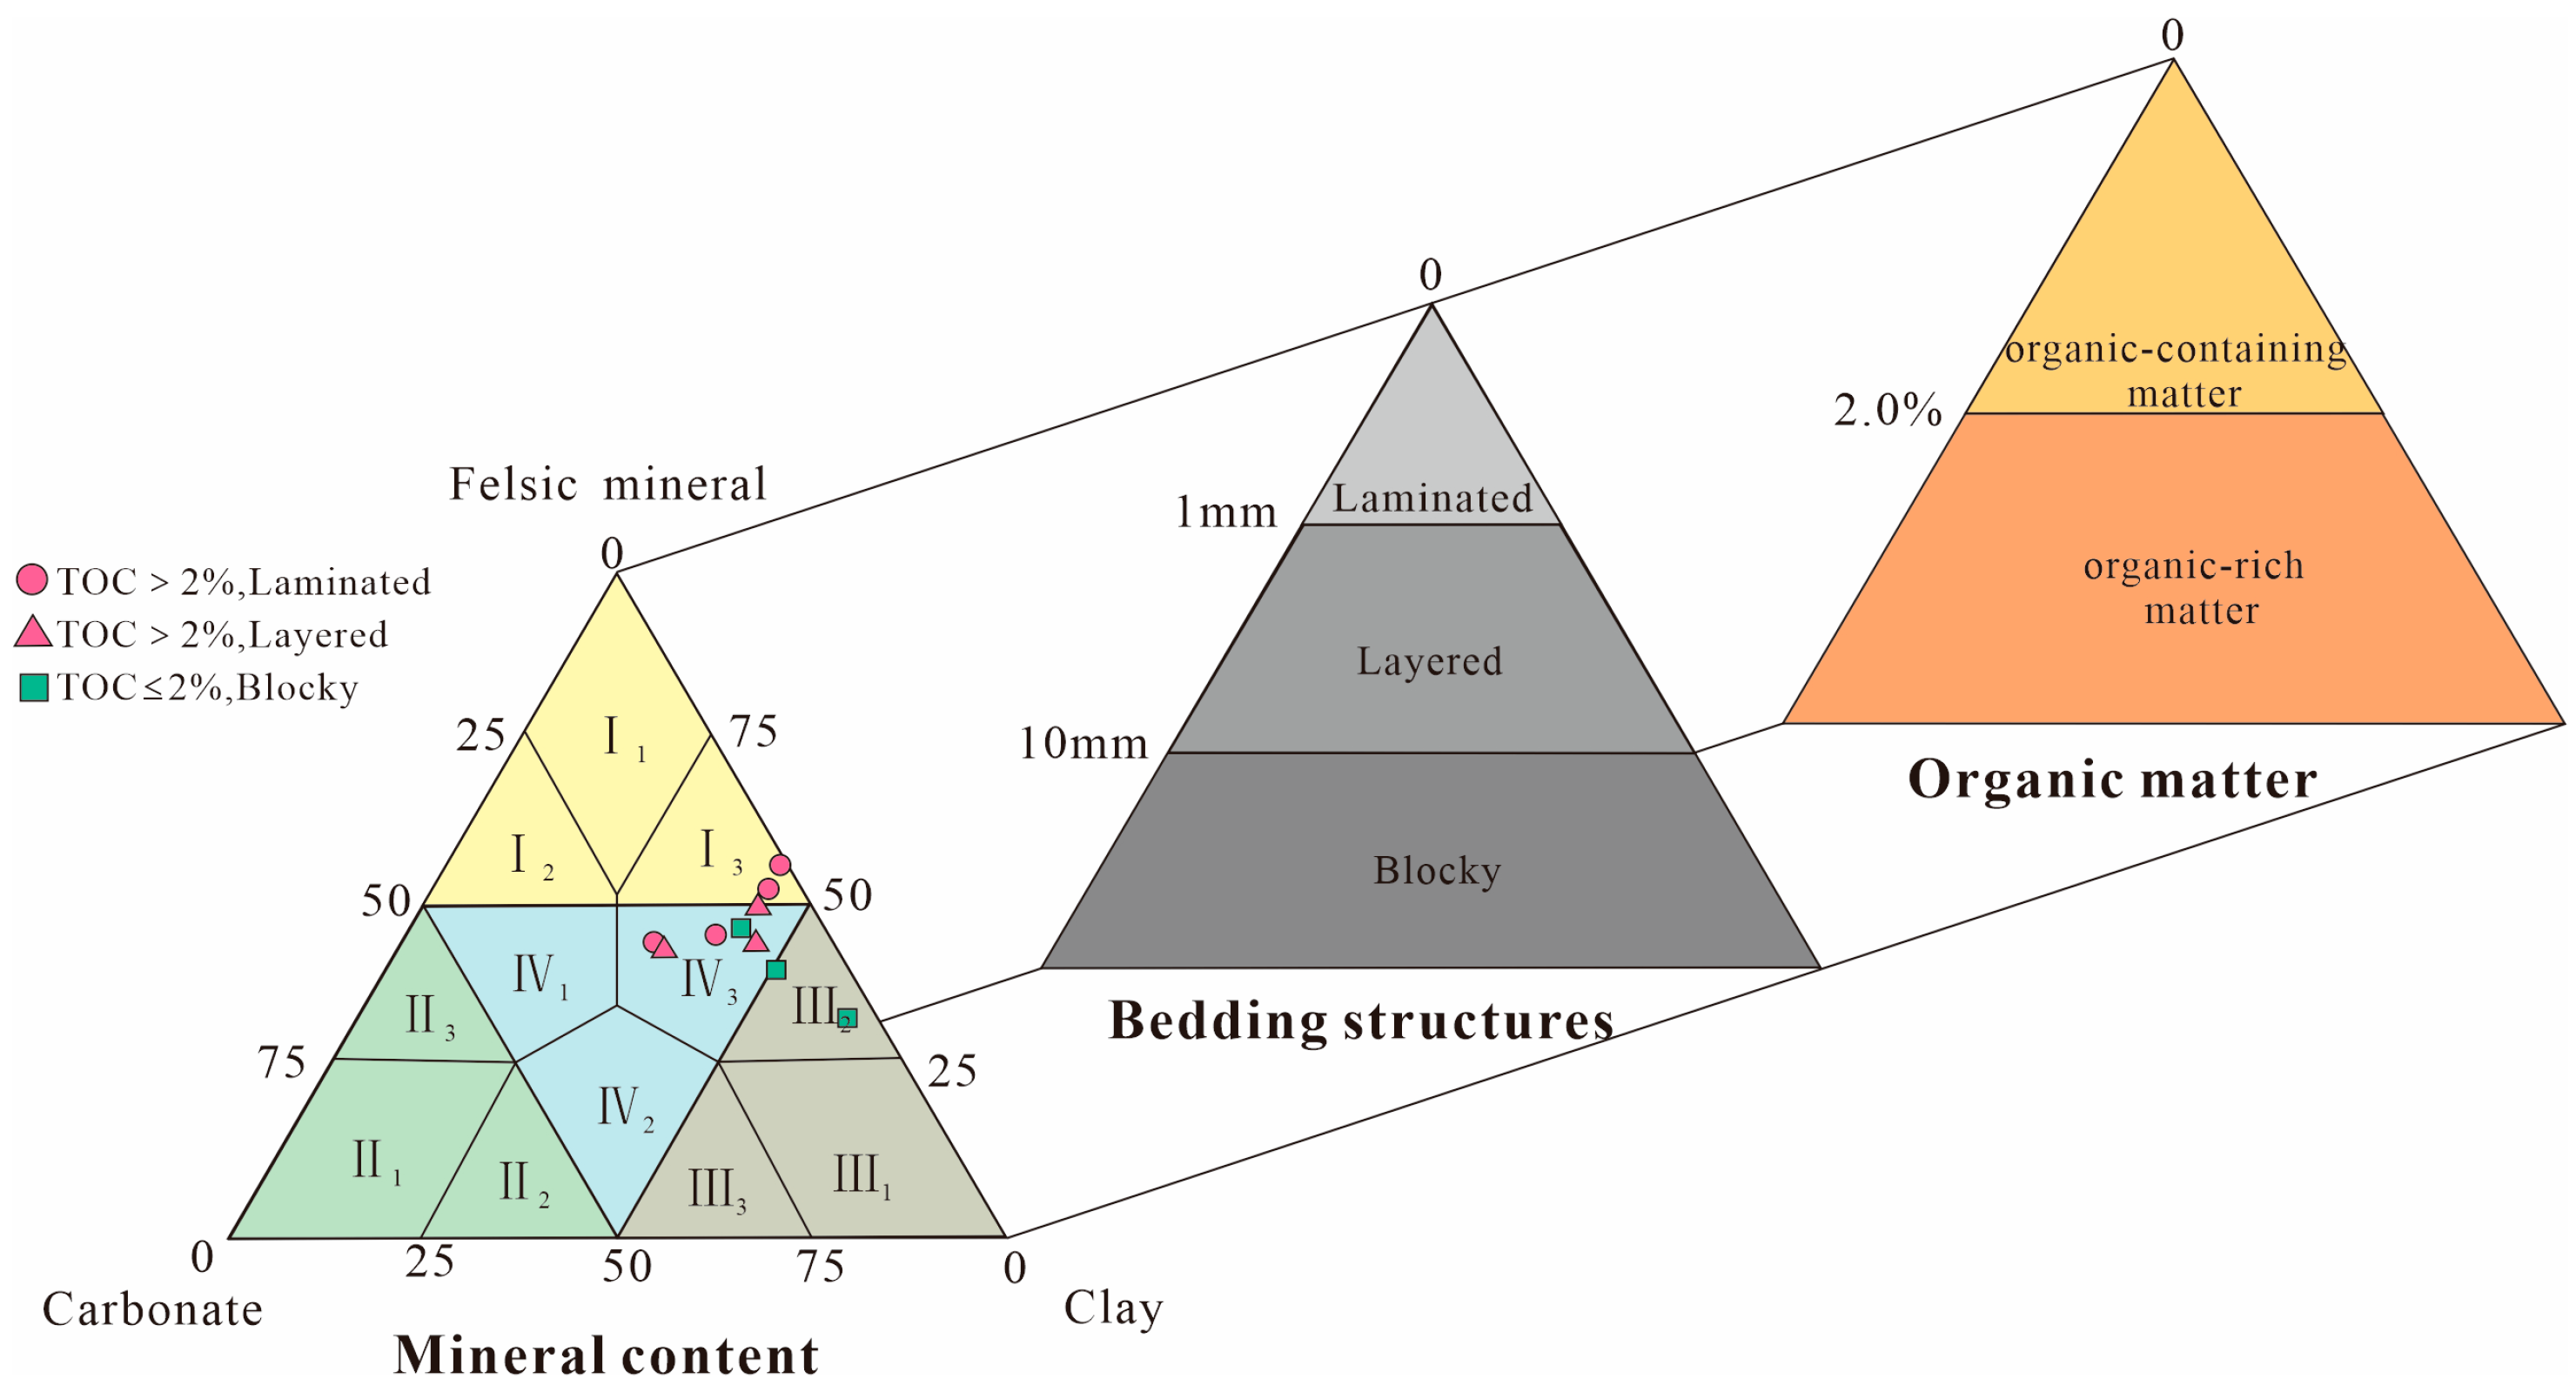
5.1.1. Principles and Bases for Classification of Lithofacies Types
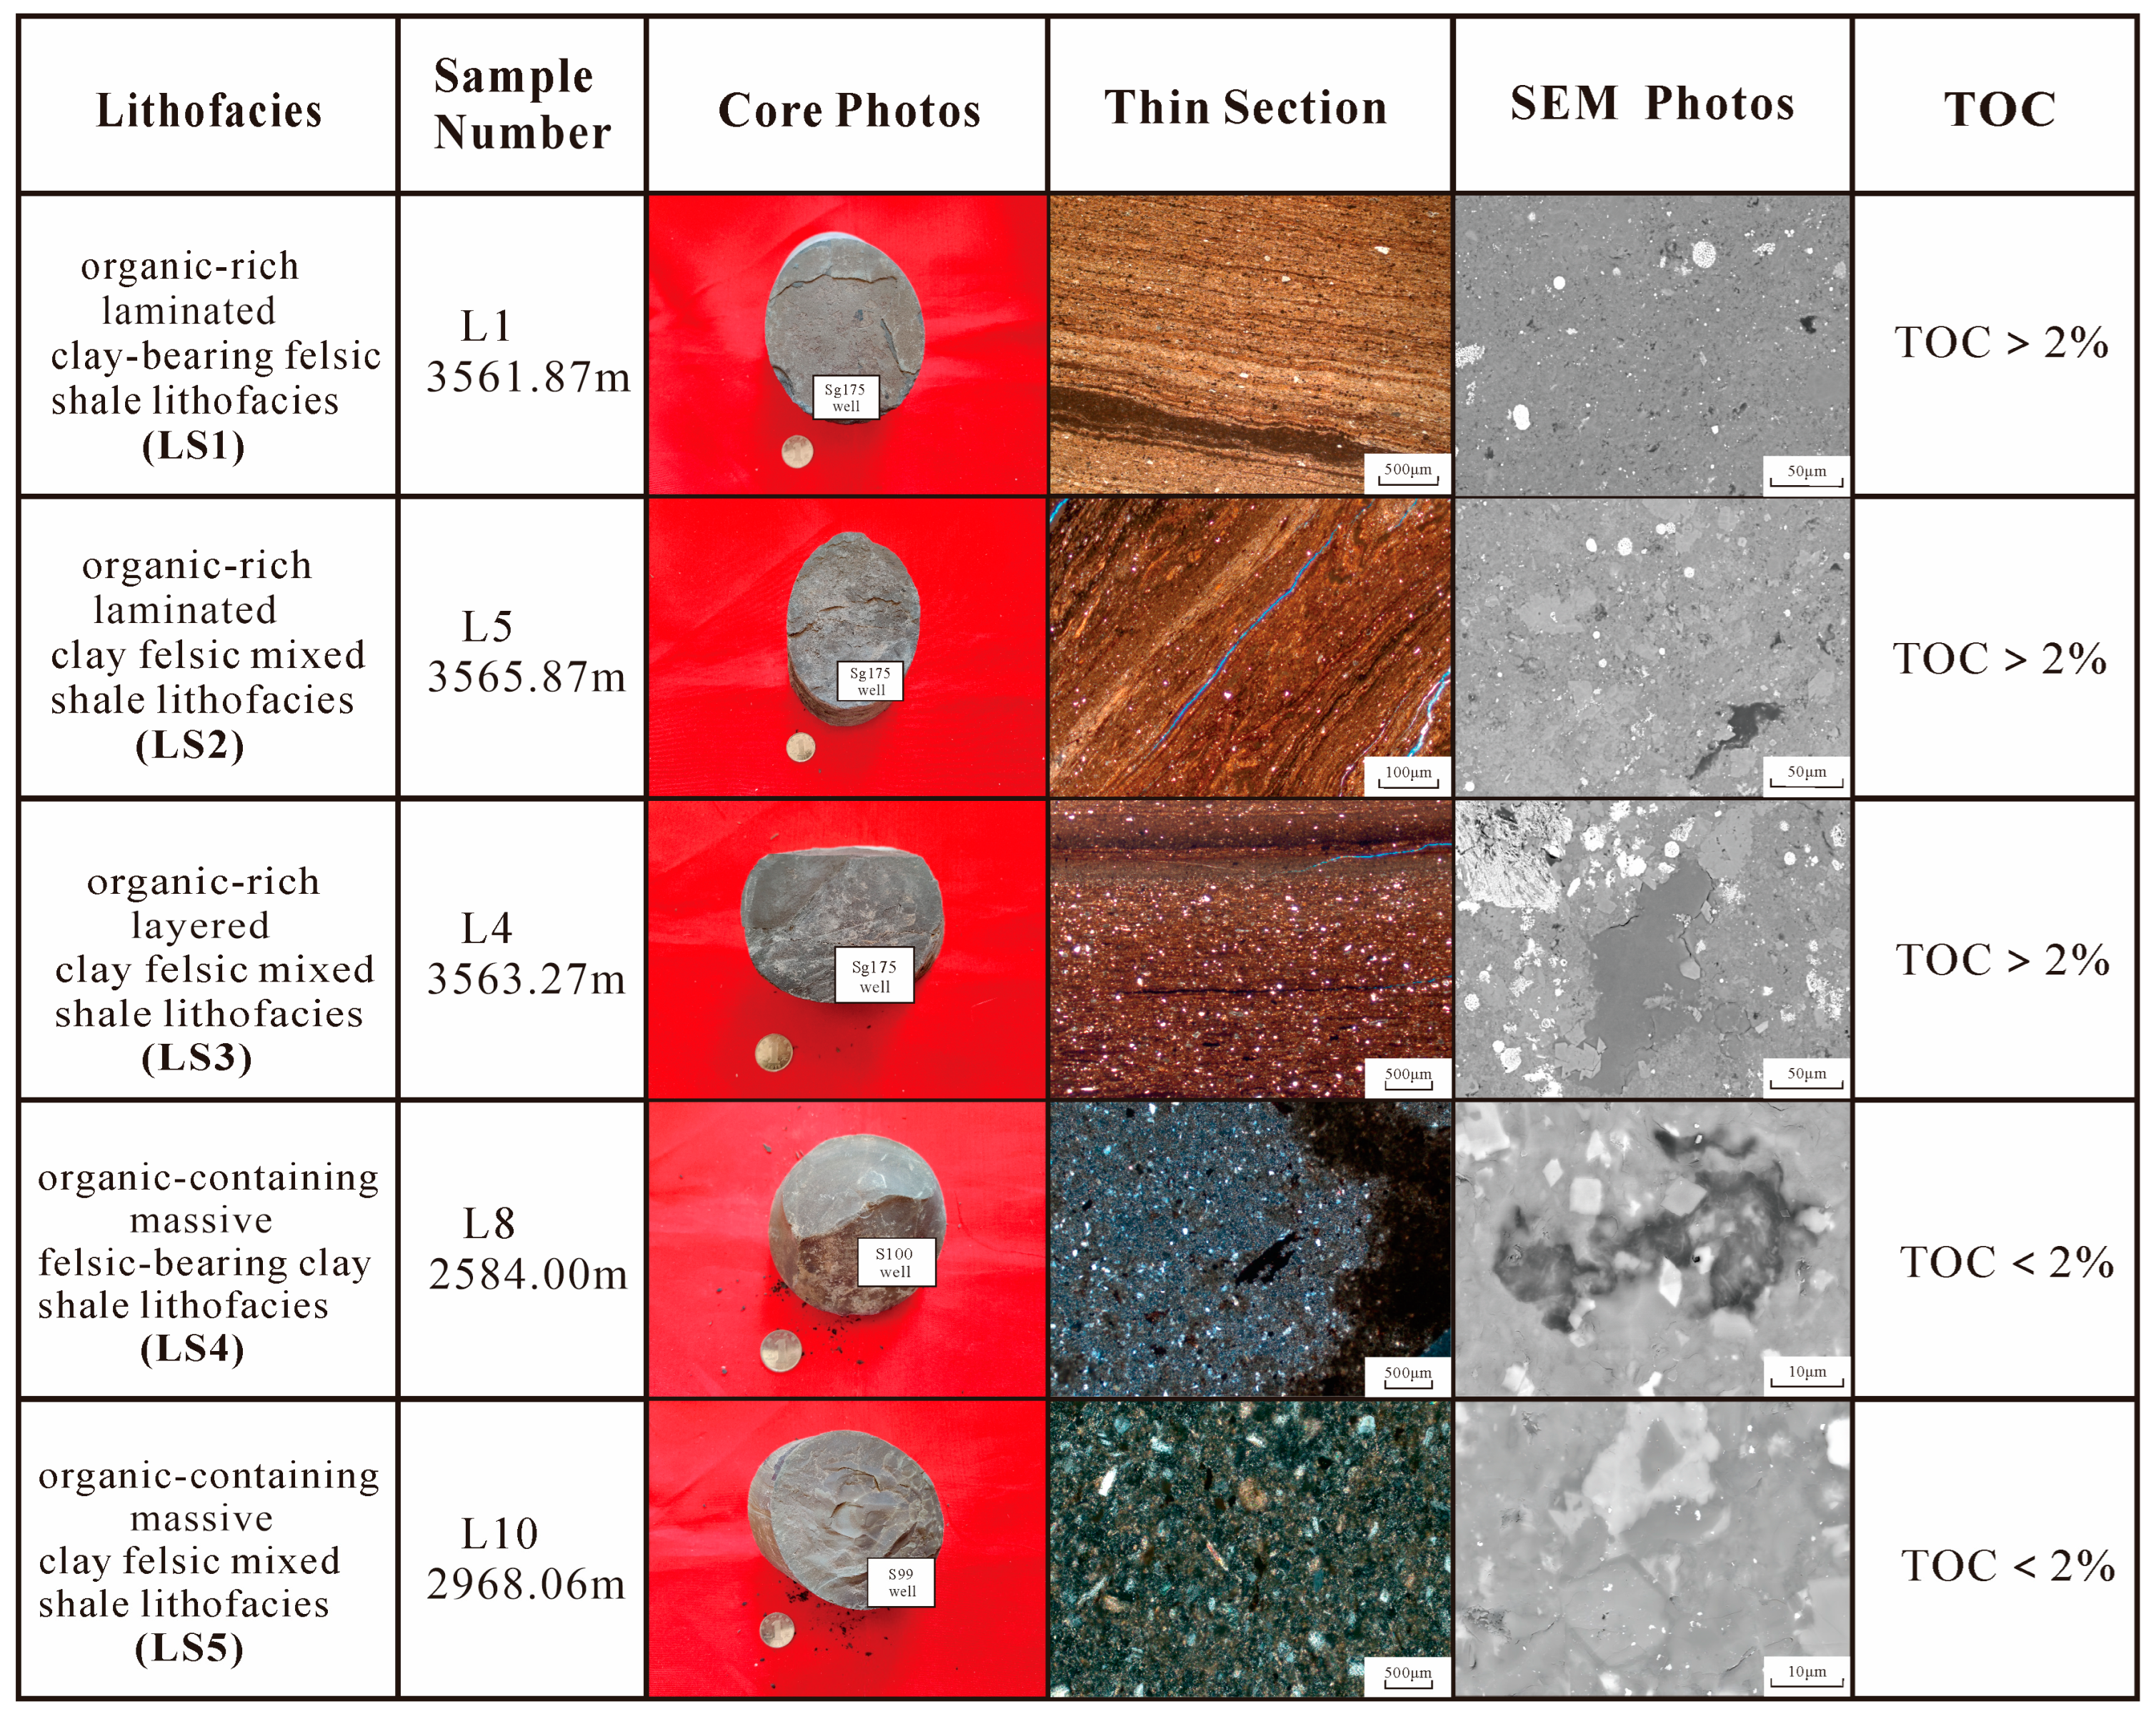
5.1.2. Basic Characteristics of the Main Lithofacies Shale
5.2. Oil Content of Shale
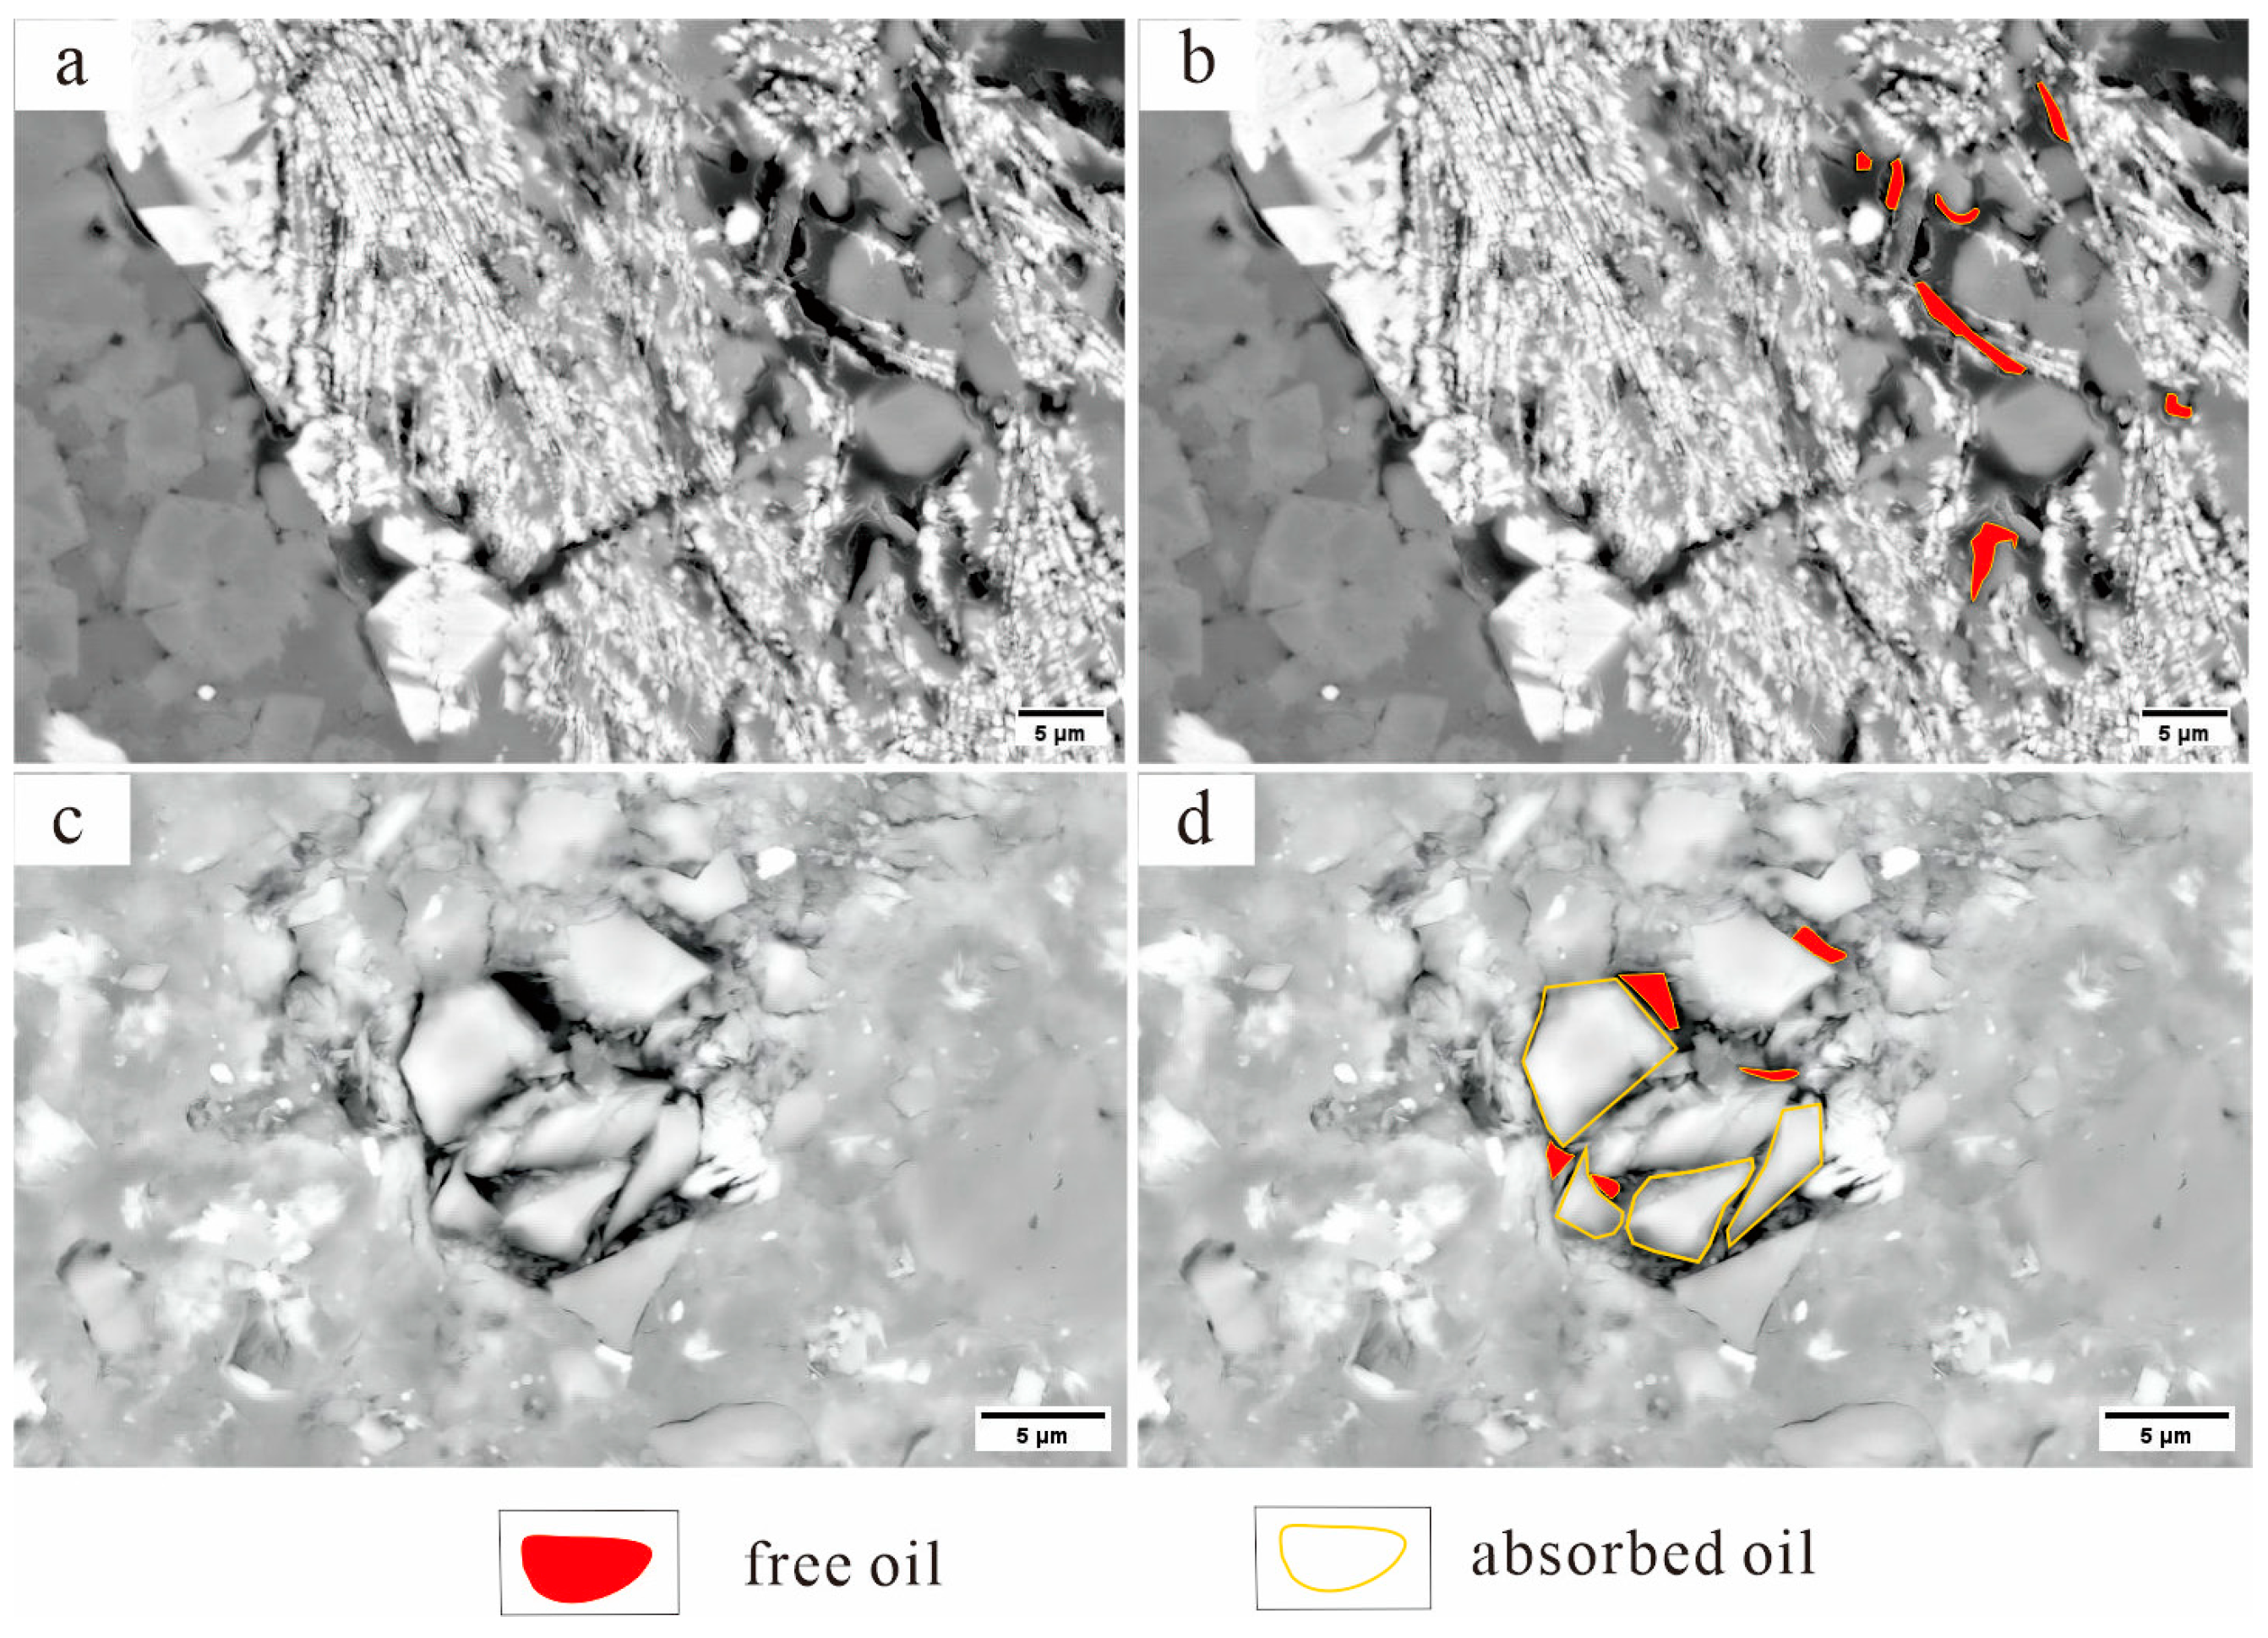
5.2.1. Hydrocarbon Occurrence
5.2.2. Characterization of Shale Oil Content
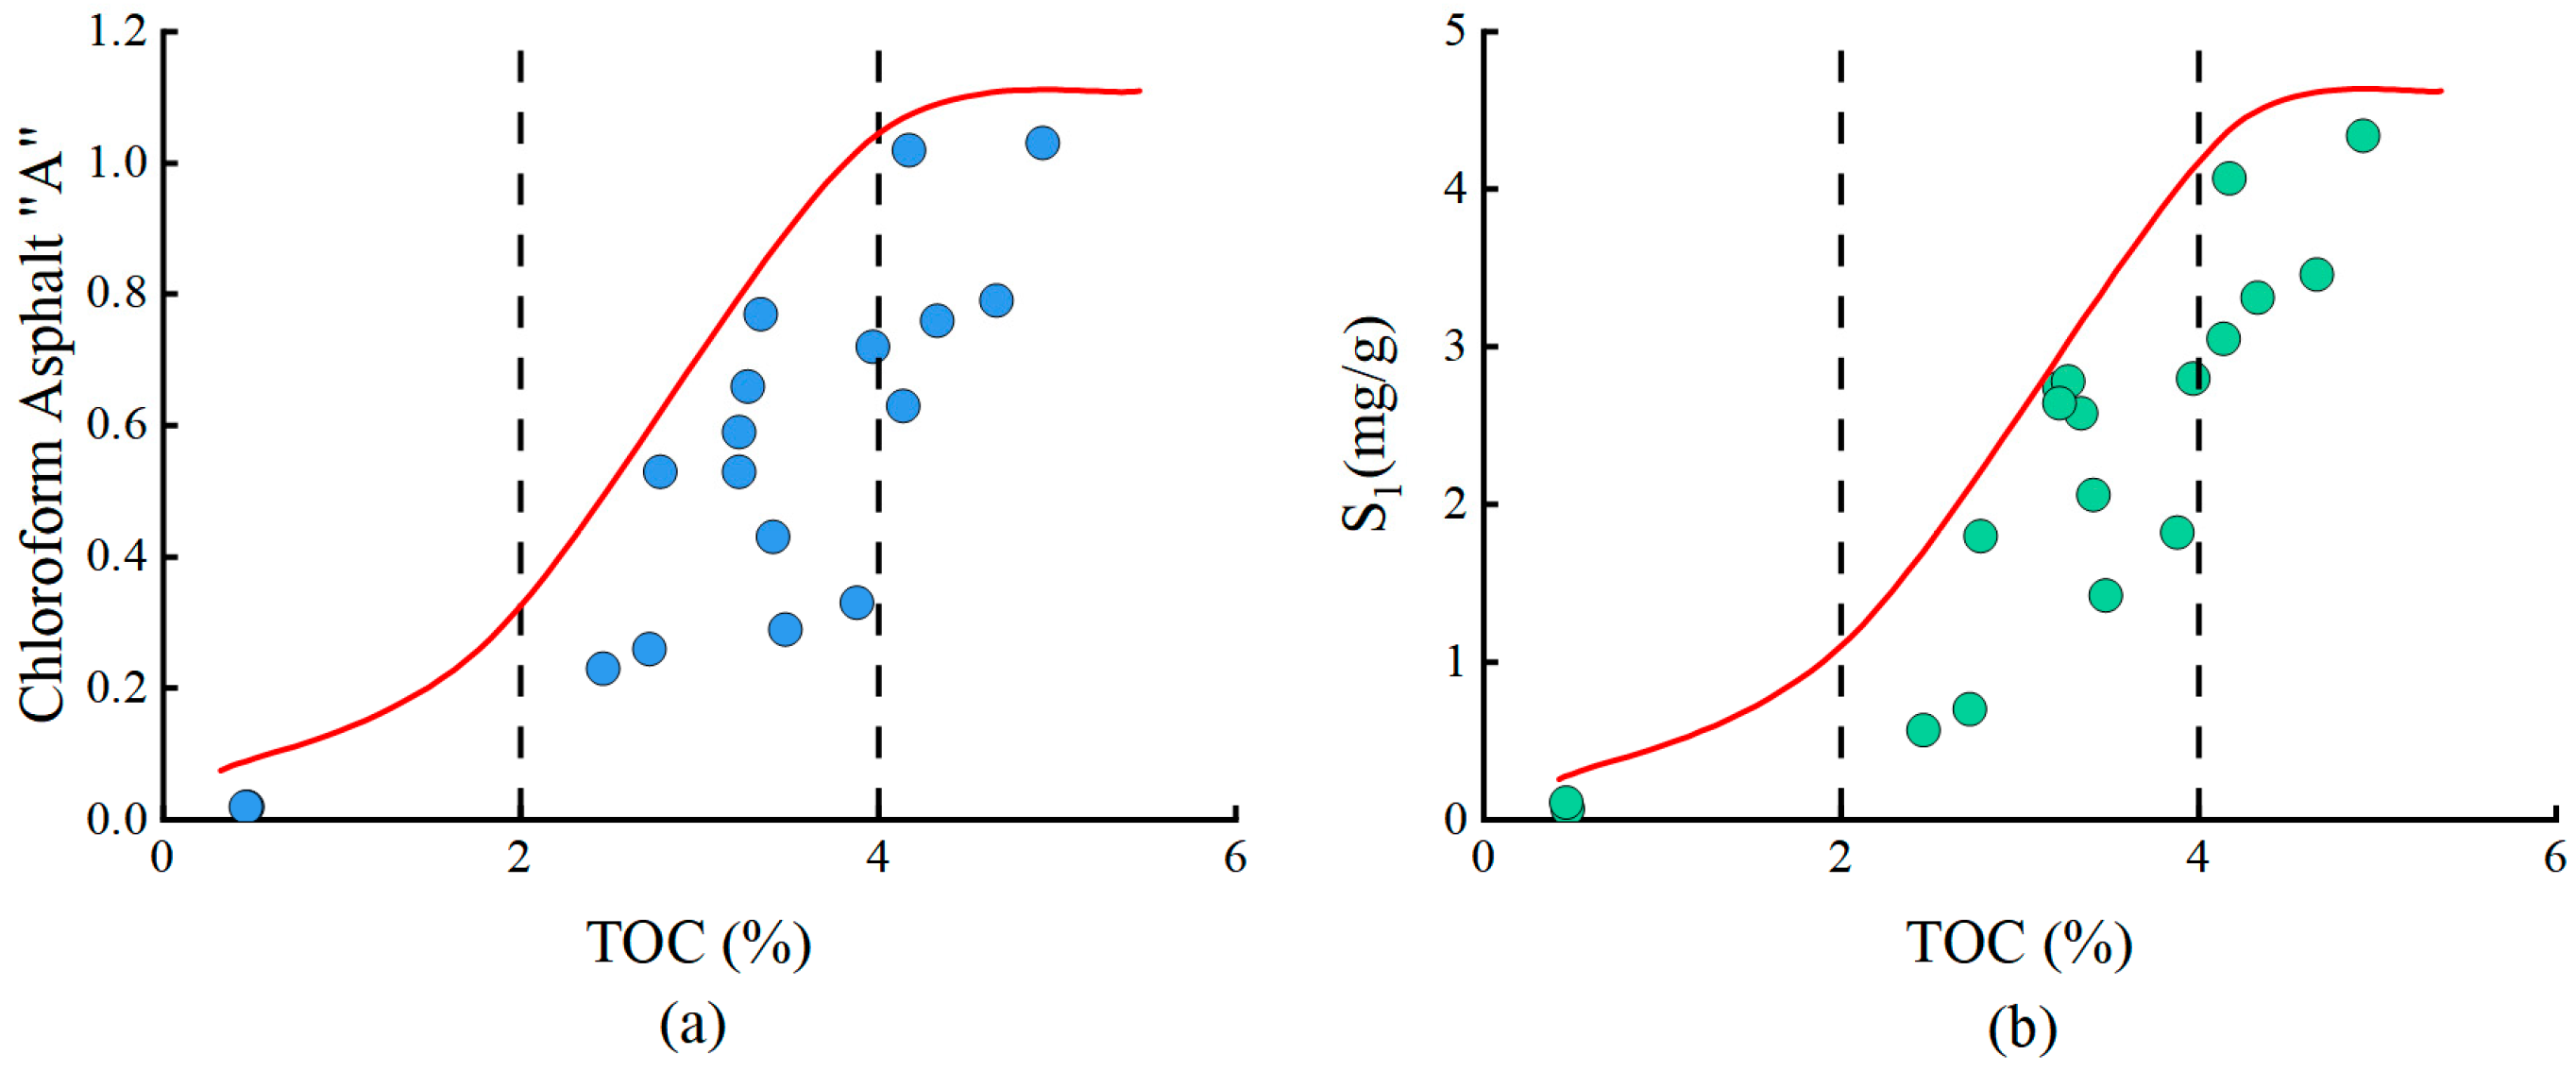
5.2.3. Factors Influencing the Oil Content of Shale
5.3. Shale Oil Movability
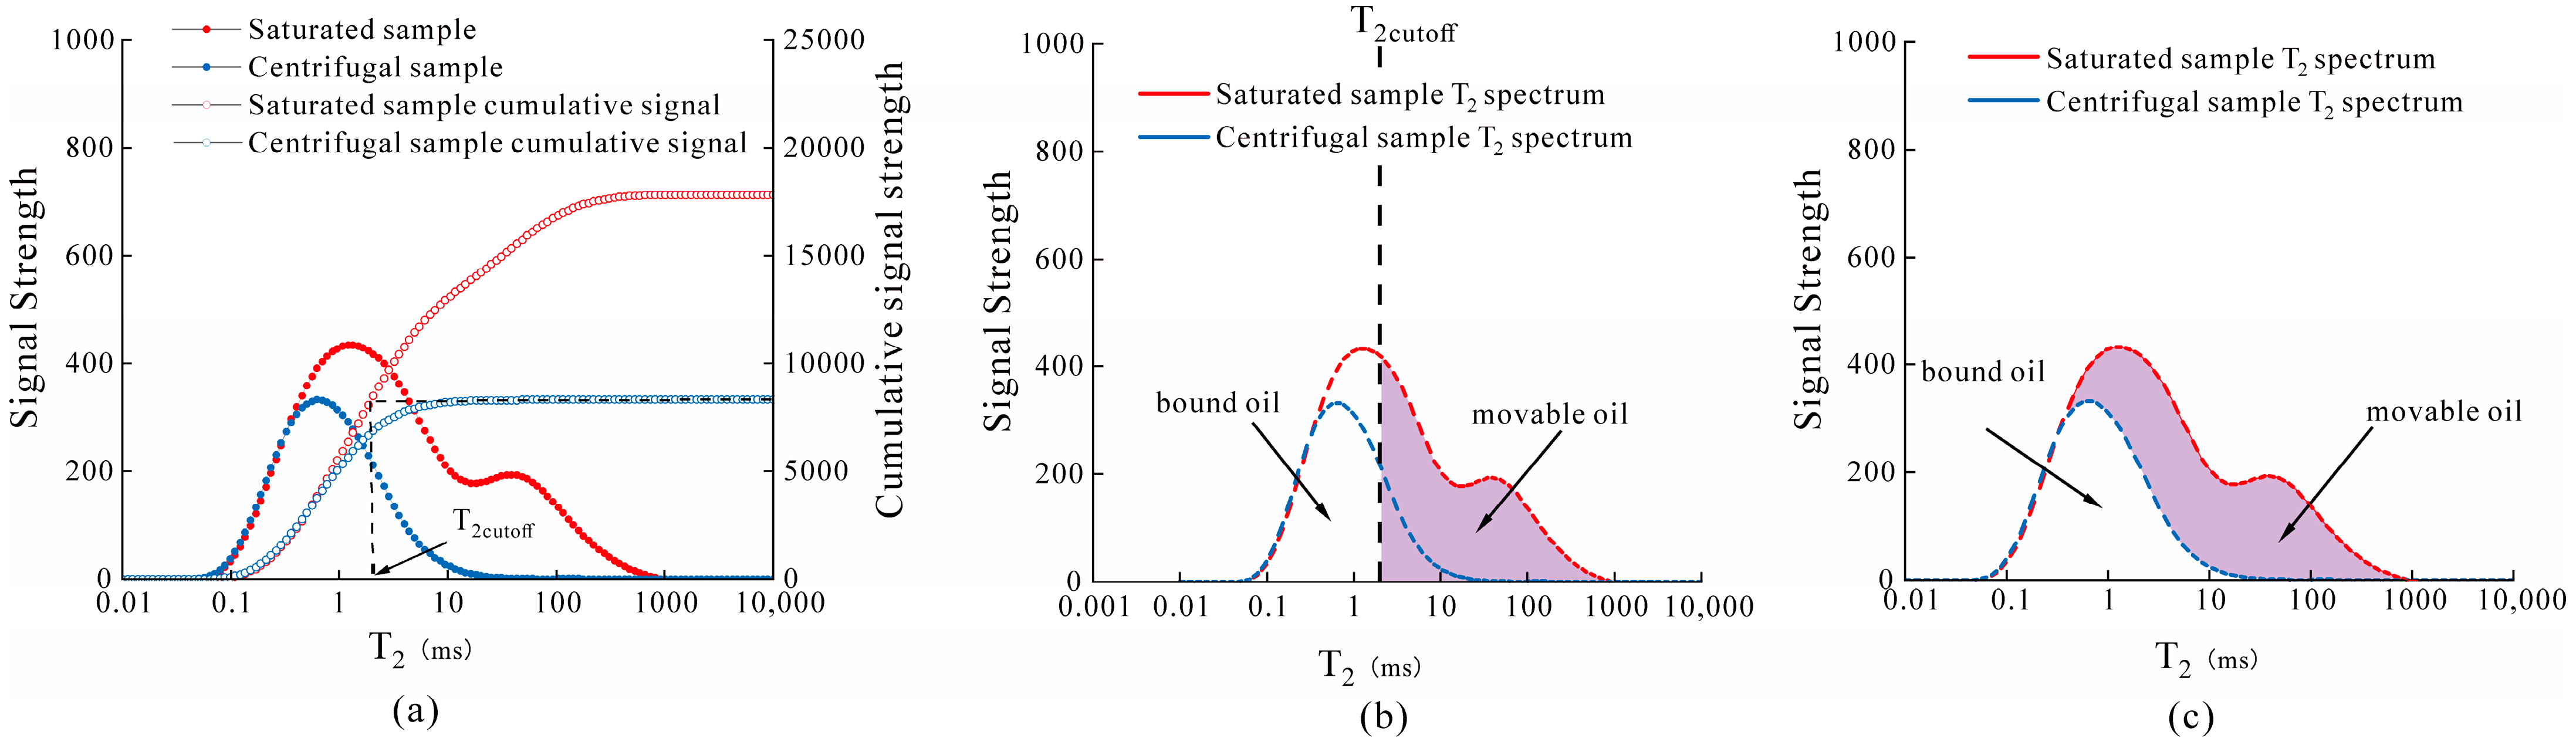
5.3.1. Shale Oil Movability Characterization
5.3.2. Factors Affecting Shale Movability
- (1)
- Sedimentary structure
- (2)
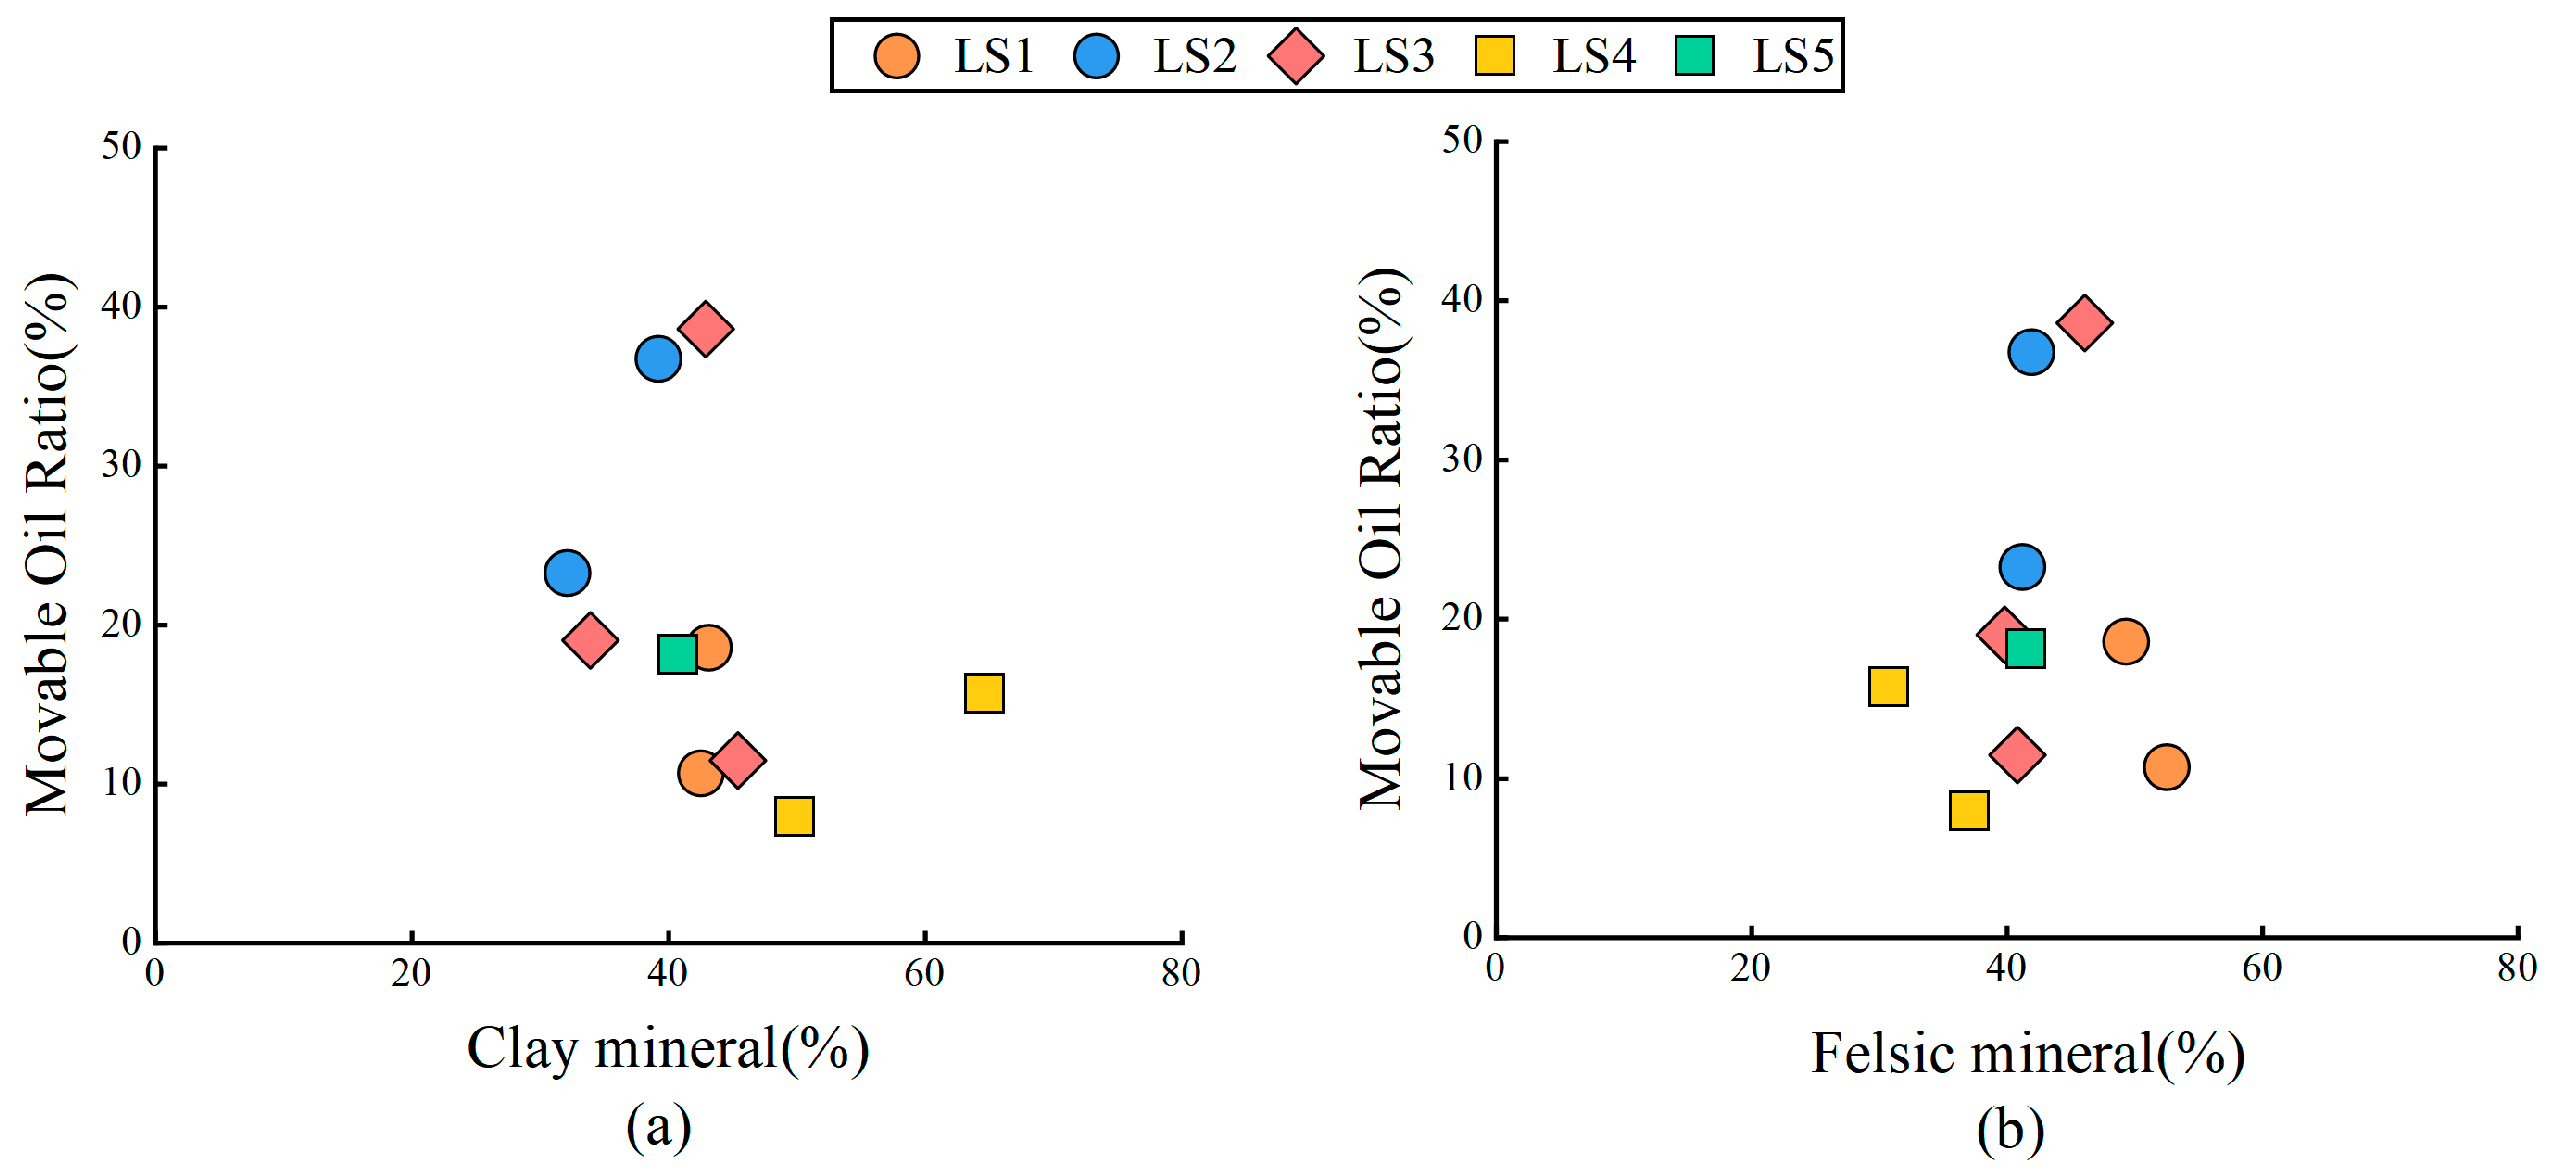
- Mineral components
- (3)
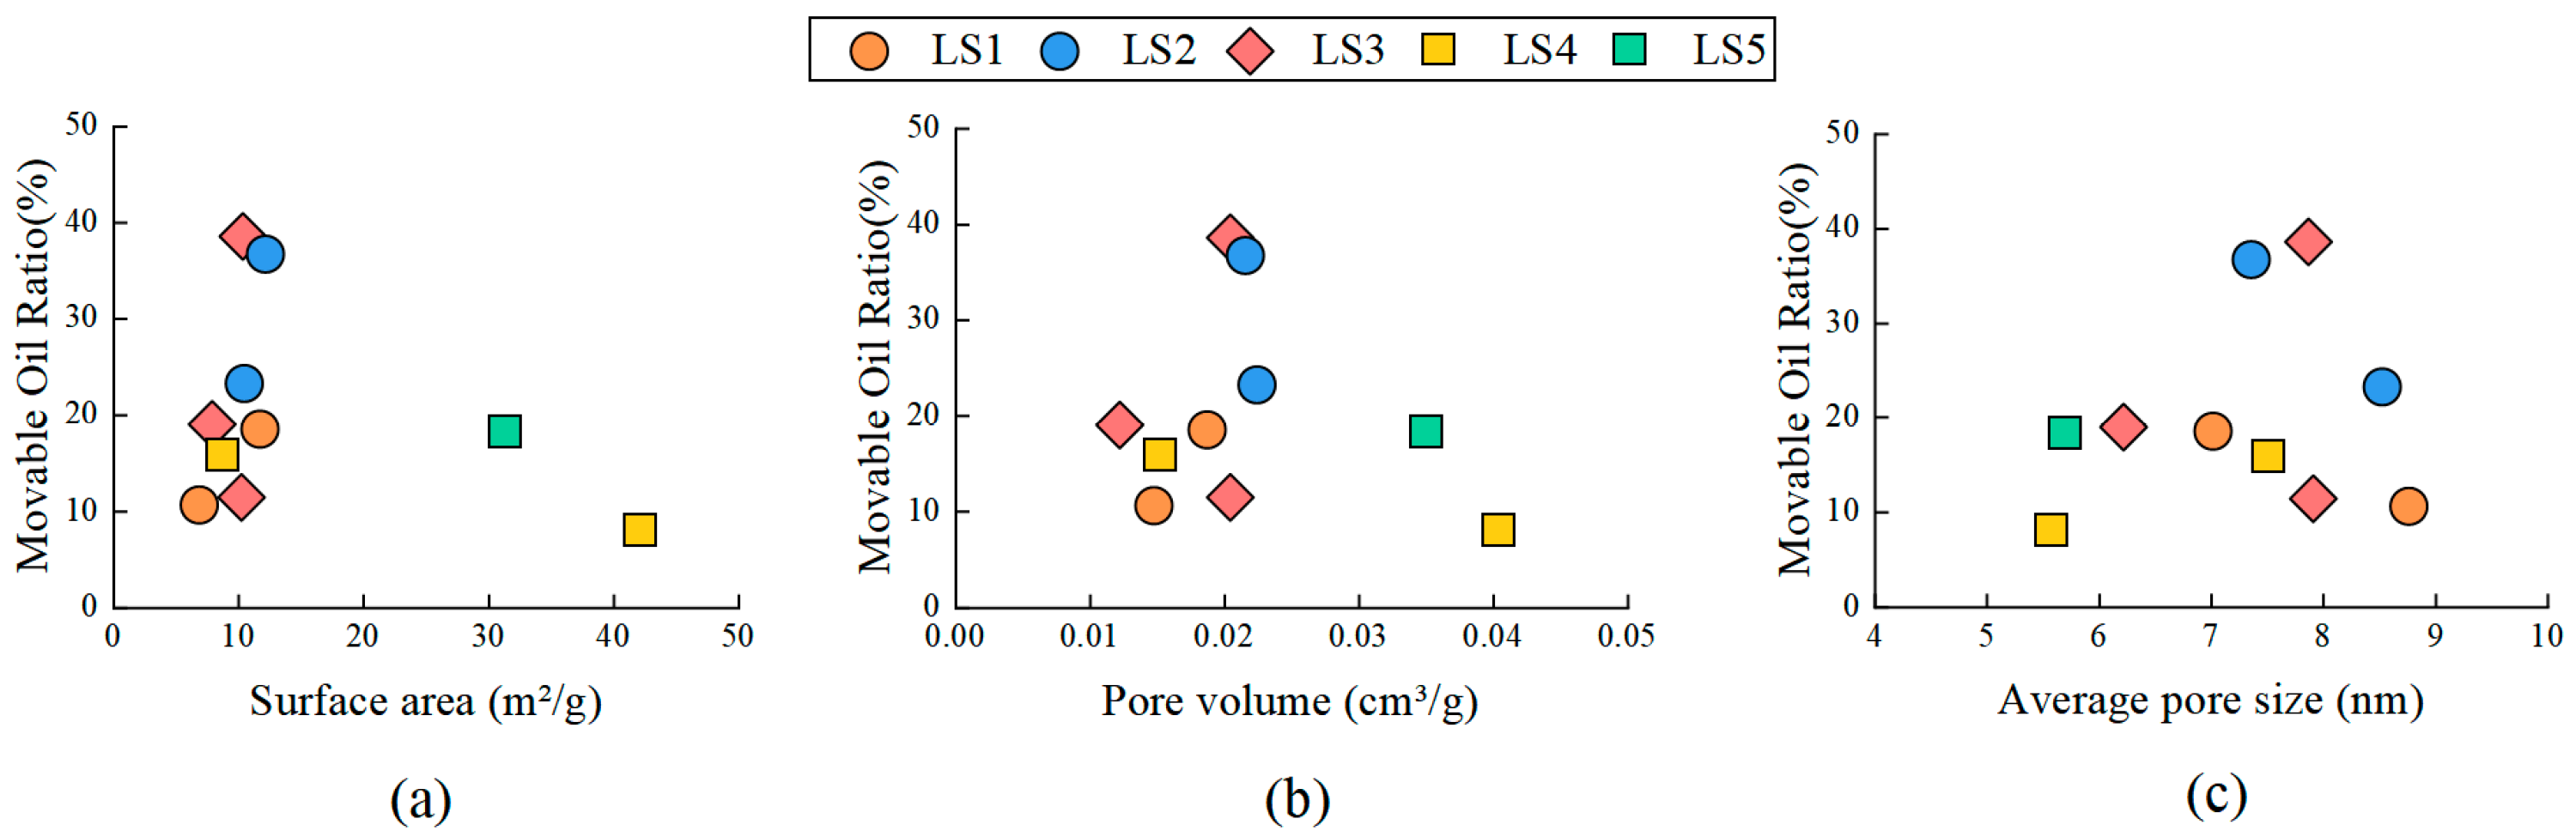
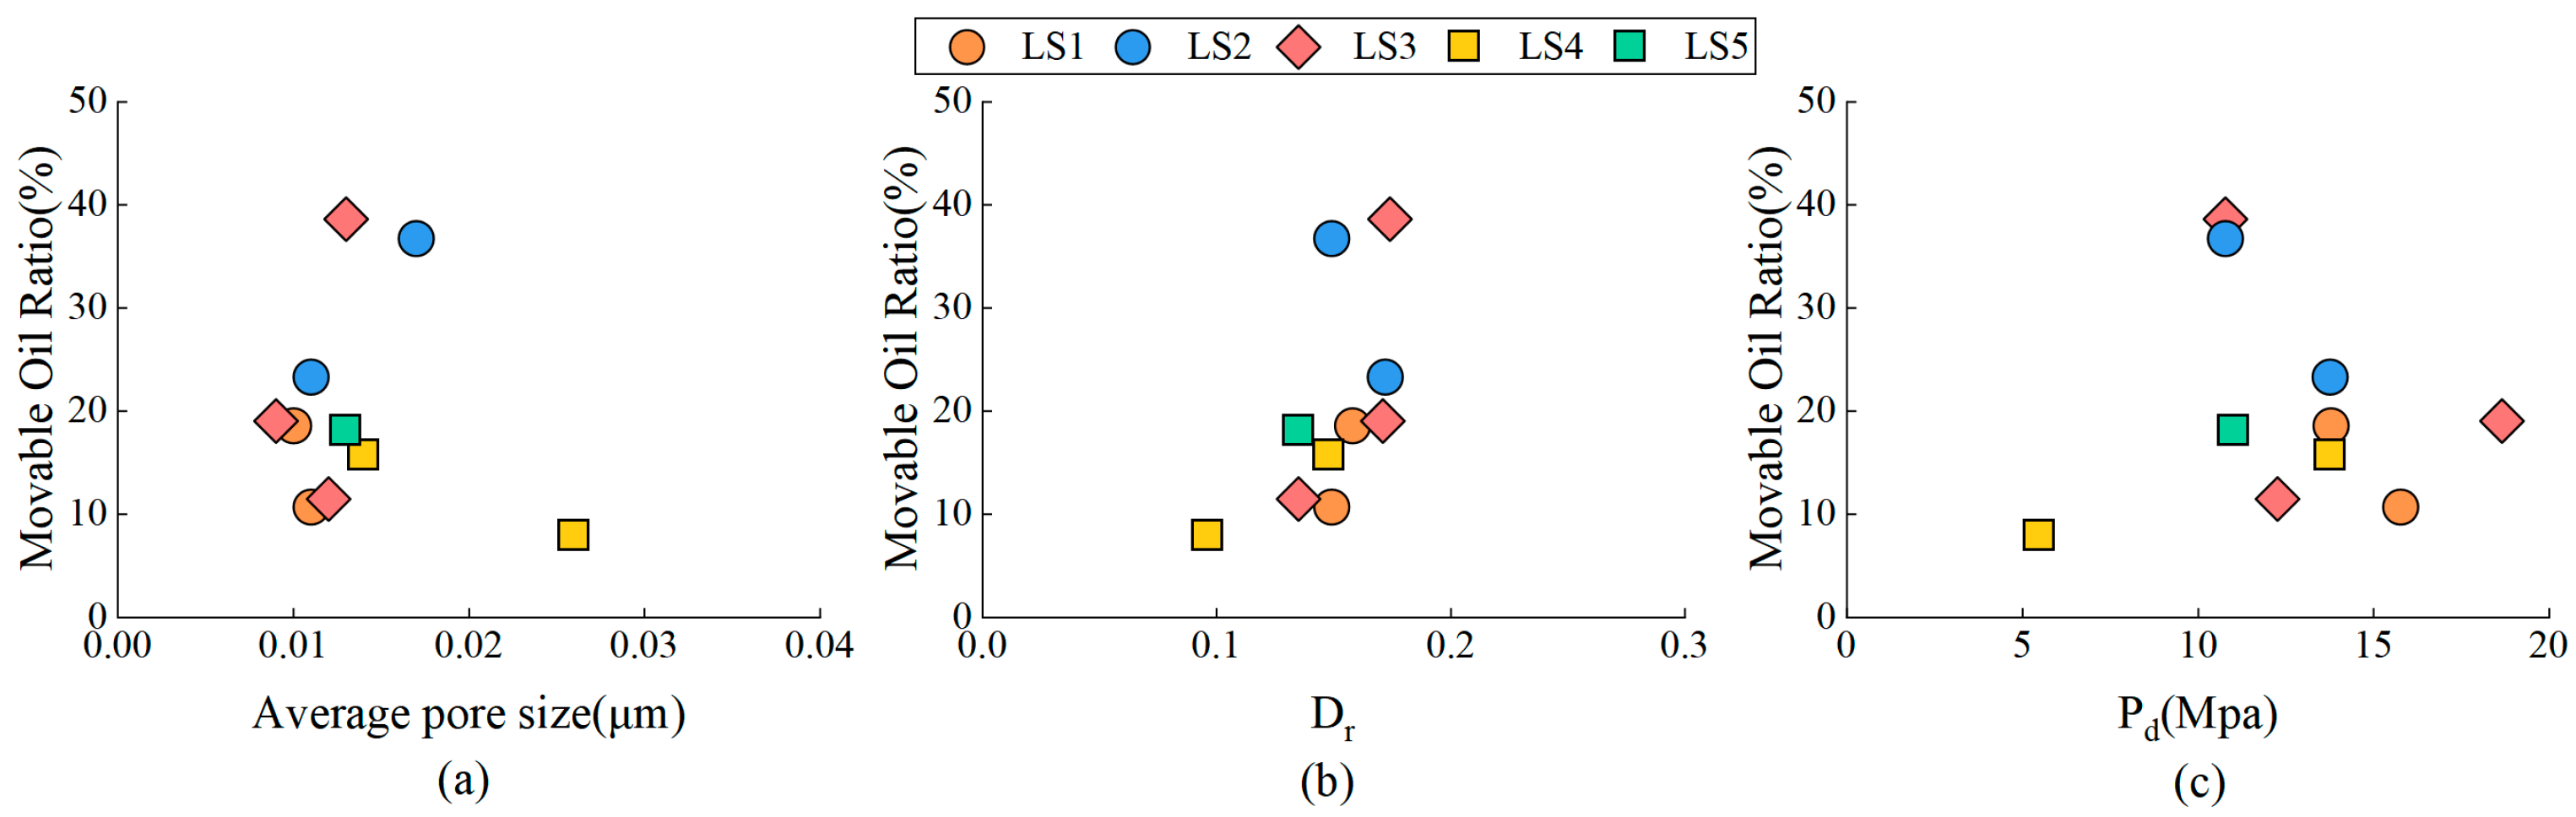
- Microscopic pore structure
6. Conclusions
- (1)
- The fourth member of the Shahejie Formation in the Liaohe Western Depression mainly develops a set of lake sedimentary phases and fan delta sedimentary phases, and the shale phases are mainly divided into five categories based on organic carbon content, mineral components, and lithofacies types, including organic-rich laminated clay-bearing felsic shale lithofacies (LS1), organic-rich laminated clay felsic mixed shale lithofacies (LS2), organic-rich layered clay felsic mixed shale lithofacies (LS3), organic-containing massive felsic-bearing clay shale lithofacies (LS4), and organic-containing massive clay felsic mixed shale lithofacies (LS5).
- (2)
- Organic-rich layered clay felsic mixed shale lithofacies (LS3) has the best oil content, and the average value of S1′ is 6.34 mg/g. The organic-rich laminated clay felsic mixed shale lithofacies (LS2) has the strongest movability, and the percentage of movable oil is 30.65%. TOC is the main influencing factor on the oil content of shale, and with the increase in TOC content, the oil content of the shale increases. The movability of shale oil is controlled by the sedimentary structure, mineral components, and microscopic pore structure; the more developed the shale laminae, the less clay content, and the more developed the large pores, the better the movability of shale oil.
- (3)
- It is clear that the organic-rich laminated clay felsic mixed shale lithofacies (LS2) and organic-rich layered clay felsic mixed shale lithofacies (LS3) are the dominant lithofacies in the fourth member of Shahejie Formation of the Liaohe Western Depression. In the process of the subsequent exploration and development, the dominant shale should be selected with the characteristics of a higher number of grains, a TOC of >2%, a mixed texture of clay minerals and felsic minerals ranging from 25% to 50%, and a higher degree of development of micro-fractures.
Author Contributions
Funding
Data Availability Statement
Conflicts of Interest
References
- Zou, C.N.; Yang, Z.; Cui, J.W.; Zhu, R.K.; Hou, L.H.; Tao, S.Z.; Yuan, X.J.; Wu, S.T.; Lin, S.H.; Wang, L.; et al. Formation mechanism, geological characteristics and development countermeasures of shale oil. Pet. Explor. Dev. 2013, 40, 14–26. [Google Scholar] [CrossRef]
- Zhao, W.Z.; Jia, A.L.; Wei, Y.S.; Wang, J.L.; Zhu, H.Q. Progress and prospect of shale gas exploration and development in China. China Pet. Explor. 2020, 25, 31–44. [Google Scholar]
- Guo, X.S.; Ma, X.X.; Li, M.W.; Qian, M.H.; Hu, Z.Q. Discussion on enrichment mechanism of continental shale oil. Oil Gas Geol. 2023, 44, 1333–1349. [Google Scholar]
- Liu, H.M.; Bao, Y.S.; Zhang, S.C.; Li, Z.; Li, J.L.; Wang, X.J.; Wu, L.B.; Wang, Y.; Wang, W.Q.; Zhu, R.F.; et al. Structural characteristics and shale oil mobility of continental carbonate-rich shale: A case study of Paleogene Shahejie Formation shale in Jiyang Depression. Pet. Explor. Dev. 2023, 50, 1150–1161. [Google Scholar] [CrossRef]
- Zhao, W.Z.; Hu, S.Y.; Hou, L.H.; Yang, T.; Li, X.; Guo, C.B.; Yang, Z. Types, resource potential and boundary with tight oil of continental shale oil in China. Pet. Explor. Dev. 2020, 47, 1–10. [Google Scholar] [CrossRef]
- Jin, Z.J.; Wang, G.P.; Liu, G.X.; Gao, B.; Liu, Q.Y.; Wang, H.L.; Liang, X.P.; Wang, R.Y. Research progress and key scientific issues of continental shale oil in China. Acta Pet. Sin. 2021, 42, 821–835. [Google Scholar]
- Lu, S.F.; Xue, H.T.; Wang, M.; Xiao, D.S.; Huang, W.B.; Li, J.Q.; Xie, L.J.; Tian, S.S.; Wang, S.; Li, J.J.; et al. Some key issues and research trends in shale oil evaluation. Acta Pet. Sin. 2016, 37, 1309–1322. [Google Scholar]
- Romero-Sarmiento, M.F. A quick analytical approach to estimate both free versus sorbed hydrocarbon contents in liquid-rich source rocks. AAPG Bull. 2019, 103, 2031–2043. [Google Scholar] [CrossRef]
- Lu, S.F.; Huang, W.B.; Chen, F.W.; Li, J.J.; Wang, M.; Xue, H.T.; Wang, W.M.; Cai, X.Y. Some key issues in shale oil evaluation and research trends Discussion on classification evaluation criteria of shale oil and gas resources. Pet. Explor. Dev. 2012, 39, 249–256. [Google Scholar] [CrossRef]
- Li, M.; Wang, M.; Zhao, C.; Zhang, J.Y.; Liu, Z.; Zhao, X.B.; Li, J.B.; Chen, J.Y. Compositional differences of near-critical petroleum from closed pores to wellhead in Gulong shale oil play, Songliao Basin, NE China. Mar. Pet. Geol. 2024, 167, 106968. [Google Scholar] [CrossRef]
- Liu, W.; Zhang, D.F.; Liu, H.H.; Zhang, W.J. Application of digital core technology in oil saturation evaluation of tight sandstone reservoir. Fault-Block Oil Gas Field 2013, 20, 593–596. [Google Scholar]
- Zhu, X.M.; Zhu, W.B.; Cao, J.; Song, Y.; Zhang, D.M.; Hu, S.Z.; Li, S.F. Research progress on characterization methods of shale oil mobility. Xinjiang Pet. Geol. 2019, 40, 745–753. [Google Scholar]
- Song, G.Q.; Zhang, L.H.; Lu, S.F.; Xu, X.Y.; Zhu, R.F.; Wang, M.; Li, Z. Shale oil resource evaluation technology and its application. Earth Sci. Front. 2013, 20, 221–228. [Google Scholar]
- Cang, J.Q.; Jiang, Z.X.; Gao, Z.Y.; Zheng, G.W.; Zhang, Y.H.; Huang, L.L.; He, W.J.; Duan, L.F.; Chen, Z.X.; Song, J.N. Oil-bearing and mobility characteristics of different lithofacies shales in Fengcheng Formation of Mahu Sag. J. Cent. South Univ. (Sci. Technol.) 2022, 53, 3354–3367. [Google Scholar]
- Behar, F.; Beaumont, V.; Penteado, H.L. Rock-Eval 6 Technology. Performances and Development. Oil Gas Sci. Technol. 2001, 56, 111–134. [Google Scholar] [CrossRef]
- Jiang, Z.X.; Li, T.W.; Gong, H.J.; Jiang, T.; Chang, J.Q.; Ning, C.X.; Su, S.Y.; Chen, W.T. Characteristics of low-mature shale reservoirs in Zhanhua Sag and their influence on shale oil mobility. Acta Pet. Sin. 2020, 41, 1587–1600. [Google Scholar]
- Jiang, Q.G.; Li, M.W.; Qian, M.H.; Li, Z.M.; Li, Z.; Huang, Z.K.; Zhang, C.M.; Ma, Y.Y. Quantitative characterization of shale oil in different occurrence states and its application. Pet. Geol. Exp. 2016, 38, 842–849. [Google Scholar]
- Xu, C.Y.; Xie, R.H.; Guo, J.F.; Jin, G.W.; Fan, W.S.; Xiao, L.Z. Comprehensive characterization of petrophysical properties in shale by solvent extraction experiments and 2D NMR. Fuel 2023, 335, 127070. [Google Scholar] [CrossRef]
- Song, Y.Q.; Kausik, R. NMR application in unconventional shale reservoirs-A new porous media research frontier. Prog. Nucl. Magn. Reson. Spectrosc. 2019, 112/113, 17–33. [Google Scholar] [CrossRef]
- Ma, Y.S.; Cai, X.Y.; Zhao, P.R.; Hu, Z.Q.; Liu, H.M.; Gao, B.; Wang, W.Q.; Li, Z.M.; Zhang, Z.L. Geological characteristics and exploration practice of continental shale oil in China. Acta Geol. Sin. 2022, 96, 155–171. [Google Scholar]
- Jiang, F.J.; Hu, M.L.; Hu, T.; LYU, J.H.; Huang, L.L.; Liu, C.L.; Jiang, Z.X.; Huang, R.D.; Zhang, C.X.; Wu, G.Y.; et al. Controlling factors and models of shale oil enrichment in Lower Permian Fengcheng Formation, Mahu Sag, Junggar Basin, NW China. Pet. Explor. Dev. 2023, 50, 812–825. [Google Scholar] [CrossRef]
- Liu, G.H.; Huang, Z.L.; Jiang, Z.X.; Chen, J.F.; Chen, C.C.; Gao, X.Y. Development characteristics and reservoir significance of laminae in lacustrine shale of Yanchang Formation in Ordos Basin. Nat. Gas Geosci. 2015, 26, 408–417. [Google Scholar]
- Chai, B.Q.; Zhao, F.; Ji, Y.B.; Chen, L.; Cheng, Q.S. Lithofacies Types and Reservoir Characteristics of Mountain Shale in Wufeng Formation-Member 1 of Longmaxi Formation in the Complex Structural Area of Northern Yunnan–Guizhou. ACS Omega 2023, 8, 2085–2097. [Google Scholar] [CrossRef] [PubMed]
- Wang, S.; Feng, Q.H.; Farzam, J.; Xia, T.; Li, Z. Oil adsorption in shale nanopores and its effect on recoverable oil-in-place. Int. J. Coal Geol. 2015, 147, 9–24. [Google Scholar] [CrossRef]
- Lu, S.F.; Chen, G.H.; Wang, M.; Li, J.B.; Wang, X.; Shan, J.F.; Hu, Y.J.; Mao, J.L. Evaluation of resource potential of shale oil enrichment in the fourth member of Shahejie Formation in Damintun Sag, Liaohe Depression. Oil Gas Geol. 2016, 37, 8–14. [Google Scholar]
- Li, X.G. Heavy oil accumulation conditions and key technologies of exploration and development in Huanxiling Oilfield of Liaohe Depression. Acta Pet. Sin. 2021, 42, 541–560. [Google Scholar] [CrossRef]
- Li, Y.; Li, X.G.; Zhang, T.S.; Zhou, B.F.; Chen, C.; Li, J.P.; Zhou, X.L.; Wang, G.F.; Liu, Y.; Qi, X.C.; et al. Astronomical cycle identification of fine-grained rock and its application in fine stratigraphic division: A case study of the fourth member of Shahejie Formation in Leijia area, western sag of Liaohe Basin. Acta Sedimentol. Sin. 2024, 1–19. [Google Scholar] [CrossRef]
- Wang, X.B.; Jiang, Z.X.; Hu, G.Y.; Fan, T.N.; Wang, J.H.; Lu, H. Sedimentary facies and evolution of upper Es4 of Paleogene in western sag of Liaohe Basin. J. Jilin Univ. (Earth Sci. Ed.) 2019, 49, 1222–1234. [Google Scholar]
- Liu, Y.L.; Zhang, L.; Zhang, X.J.; He, X.; Li, J.P.; Xing, Y.B.; Jin, F.X.; Wang, Y.R. Pore Structure and Fractal Characteristics of Continental Low Maturity Organic-Rich Shale in the Sha-4 Member of the Liaohe Western Depression. Energies 2022, 16, 327. [Google Scholar] [CrossRef]
- Wang, X.; Wang, M.; Zhao, C.; Yang, X.Y.; Jia, Y.D.; Wu, R.; Li, T.Y.; Zhao, X.B.; Tang, Y.L. Reservoir characteristics and controlling factors of the middle–high maturity multiple lithofacies reservoirs of the Lianggaoshan Formation shale strata in the northeastern Sichuan basin, China. Mar. Pet. Geol. 2024, 161, 106692. [Google Scholar] [CrossRef]
- GB/T 19587−2017; Determination of the Specific Surface Area of Solids by Gas Adsorption Using the BET Method. Standards Press of China: Beijing, China, 2017.
- GB/T 29172-2012; Practices for Core Analysis. Standards Press of China: Beijing, China, 2017.
- GB/T 29171-2012; Rock Capollary Pressure Measurement. Standards Press of China: Beijing, China, 2012.
- SY/T 6490-2014; Specification for Measurement of Rock NMR Parameter in Laboratory. Petroleum Industry Press: Beijing, China, 2015.
- Wenger, L.M.; Baker, D.R. Variations in vitrinite reflectance with organic facies—Examples from Pennsylvanian cyclothems of the midcontinent, USA. Org. Geochem. 1987, 11, 411–416. [Google Scholar] [CrossRef]
- Wilkins, R.W.T.; Wilmshurst, J.R.; Russell, N.J.; Hladky, G.; Ellacott, M.V.; Buckingham, C. Fluorescence alteration and the suppression of vitrinite reflectance. Org. Geochem. 1992, 18, 629–640. [Google Scholar] [CrossRef]
- Li, X.G.; Liu, X.Z.; Li, J.P.; Tian, Z. Comprehensive evaluation and exploration practice of lacustrine shale oil in the fourth member of Shahejie Formation in Damintun Sag, Liaohe Depression. China Pet. Explor. 2019, 24, 636–648. [Google Scholar]
- Zhu, R.K.; Bai, B.; Cui, J.W.; Wu, S.T.; Cui, J.G.; Wang, T.; Niu, L.; Li, T.T. Research progress on microstructure of unconventional oil and gas tight reservoirs. J. Palaeogeogr. 2013, 15, 615–623. [Google Scholar]
- Li, M.W.; Ma, X.X.; Jin, Z.J.; Li, Z.M.; Jiang, Q.G.; Wu, S.Q.; Li, Z.; Xu, Z.X. The diversity of lithofacies assemblages of marine and continental shale strata in China and its significance for unconventional oil and gas exploration. Oil Gas Geol. 2022, 43, 1–25. [Google Scholar]
- Ma, C.F.; Liu, S.P.; Zhao, Q.; Fan, Y.J.; Qian, Y.Y.; Liu, X.T.; Ge, X.M. Sedimentary Genesis and Model Analysis of Shale Lithofacies in Jiyang Depression. Processes 2023, 11, 2302. [Google Scholar] [CrossRef]
- Bian, C.S.; Guo, B.C.; Pu, X.; Zeng, X.; Liu, W.; Li, Y.X.; Zhou, K.J.; Tian, Q.H.; Ma, C. Lithofacies Characteristics and Their Effects on Shale Oil Enrichment: A Case Study from Shahejie Formation of the Qibei Sag, Bohai Bay Basin, China. Energies 2023, 16, 2107. [Google Scholar] [CrossRef]
- Jarvie, D.M. Shale resource systems for oil and gas: Part 2. Shale-oil resource systems. In Shale Reservoirs: Giant Resources for 21st Century; Breyet, J., Ed.; AAPG Memoir; AAPG: Houston, TX, USA, 2012; pp. 89–119. [Google Scholar]
- Wang, Y.; Wang, X.J.; Song, G.Q.; Liu, H.M.; Zhu, D.S.; Zhu, D.Y.; Ding, J.H.; Yang, W.Q.; Yin, Y.; Zhang, S.; et al. Relationship between shale lithofacies and shale oil enrichment in Jiyang Depression, Bohai Bay Basin. Pet. Explor. Dev. 2016, 43, 696–704. [Google Scholar] [CrossRef]
- Wang, M.; Ma, R.; Li, J.B.; Lu, S.F.; Li, C.M.; Guo, Z.Q.; Li, Z. Occurrence mechanism of lacustrine shale oil in Shahejie Formation of Paleogene in Jiyang depression. Pet. Explor. Dev. 2019, 46, 789–802. [Google Scholar] [CrossRef]
- Wang, M.; Li, M.; Li, J.B.; Xu, L.; Shao, H.M.; Yu, C.Q.; Li, T.T. Comparison of various test methods for shale oil content. Acta Pet. Sin. 2022, 43, 1758–1769. [Google Scholar]
- Zhu, R.F.; Zhang, L.H.; Li, J.Y.; Liu, Q.; Li, Z.; Wang, R.; Zhang, L. Quantitative evaluation of retained liquid hydrocarbon in shale. Acta Pet. Sin. 2015, 36, 13–18. [Google Scholar]
- Cao, X.X.; Meng, X.Z.; Pu, R.H. Understanding of movable fluid occurrence characteristics based on fractal theory of pore throat system in tight sandstone reservoir. Nat. Gas Ind. 2023, 43, 78–90. [Google Scholar]
- Yuan, X.T.; Peng, S.M.; Lin, C.Y.; Jia, R.G. An interpretation method for permeability based on flow units and its applicability. Acta Pet. Sin. 2005, 26, 78–81. [Google Scholar]
- Zeng, W.Z.; Song, Z.G.; Cao, X.X. Oil-bearing analysis of source rocks in Qingshankou Formation in northern Songliao Basin. Geochimica 2018, 47, 345–353. [Google Scholar]
- Mao, J.L.; Zhang, J.C.; Liu, T.; Ding, J.H. Shale lamina structure and its reservoir space significance in western sag of Liaohe. Pet. Geol. Exp. 2019, 41, 113–120. [Google Scholar]
- Xie, J.Y.; Yuan, Z.Z.; Dai, B.; Wu, C.M.; Jia, C.; Xu, F.; Luo, Q.; Cui, Q. Shale oil reservoir bedding fracture imbibition mechanism and imbibition mode. Spec. Oil Gas Reserv. 2021, 28, 161–167. [Google Scholar]
- Huang, X.; Li, T.T.; Wang, X.Z.; Gao, H.; Ni, J.; Zhao, J.X.; Wang, C. Distribution characteristics and influencing factors of movable fluid in tight sandstone reservoir-Taking Chang 8 reservoir group of Yanchang Formation in Jiyuan Oilfield of Ordos Basin as an example. Acta Pet. Sin. 2019, 40, 557–567. [Google Scholar]
- Gao, Z.Y.; Fan, Y.P.; Hu, Q.H.; Jiang, Z.X.; Cheng, Y.; Xuan, Q.X. A review of shale wettability characterization using spontaneous imbibition experiments A review of shale wettability characterization using spontaneous imbibition experiments. Mar. Pet. Geol. 2019, 109, 330–338. [Google Scholar] [CrossRef]
- Yang, C.; Zhang, J.C.; Li, W.J.; Jing, T.Y.; Sui, R.; Wang, Z.P.; He, W.; Lu, Y.Y. Microscopic pore characteristics and reservoir-forming significance of shale in Es3 and Es4 of Liaohe Depression. Oil Gas Geol. 2014, 35, 286–294. [Google Scholar]


| Sample Number | Depth (m) | TOC (%) | S1 (mg/g) | S2 (mg/g) | “A” (%) | Ro (%) |
|---|---|---|---|---|---|---|
| L1 | 3561.87 | 3.41 | 2.06 | 13.61 | 0.43 | 0.48 |
| L2 | 3562.67 | 3.48 | 1.42 | 16.48 | 0.29 | 0.57 |
| L3 | 3563.77 | 4.66 | 3.46 | 24.47 | 0.79 | 0.53 |
| L4 | 3563.27 | 4.14 | 3.05 | 19.17 | 0.63 | 0.46 |
| L5 | 3565.87 | 3.34 | 2.58 | 17.51 | 0.77 | 0.48 |
| L6 | 3566.87 | 3.22 | 2.74 | 17.12 | 0.59 | 0.51 |
| L7 | 3567.87 | 3.27 | 2.78 | 16.06 | 0.66 | 0.61 |
| L8 | 2584 | 0.47 | 0.07 | 0.85 | 0.02 | 0.37 |
| L9 | 2717.16 | 2.46 | 0.57 | 9.91 | 0.23 | 0.45 |
| L10 | 2968.06 | 0.46 | 0.11 | 0.75 | 0.02 | 0.49 |
| L11 | 3564.37 | 4.33 | 3.31 | 21.5 | 0.76 | 0.46 |
| L12 | 3562.17 | 3.88 | 1.82 | 18.35 | 0.33 | 0.60 |
| L13 | 3564.17 | 4.17 | 4.07 | 19.14 | 1.04 | 0.58 |
| L14 | 3565.47 | 4.92 | 4.34 | 26.25 | 1.03 | 0.47 |
| L15 | 3566.27 | 3.97 | 2.8 | 22.16 | 0.72 | 0.54 |
| L16 | 3567.37 | 3.22 | 2.64 | 16 | 0.53 | 0.63 |
| L17 | 3568.17 | 2.78 | 1.8 | 13.33 | 0.53 | 0.68 |
| L18 | 3101.63 | 2.72 | 0.7 | 15.56 | 0.26 | 0.51 |
| Sample Number | Surface Area (m2/g) | Pore Volume (cm3/g) | Average Pore Size (nm) |
|---|---|---|---|
| L1 | 11.71 | 0.019 | 7.01 |
| L2 | 6.80 | 0.015 | 8.76 |
| L3 | 10.29 | 0.020 | 7.86 |
| L4 | 10.21 | 0.020 | 7.91 |
| L5 | 10.45 | 0.022 | 8.52 |
| L6 | 7.87 | 0.012 | 6.22 |
| L7 | 12.13 | 0.022 | 7.35 |
| L8 | 42.21 | 0.040 | 5.59 |
| L9 | 8.83 | 0.015 | 7.52 |
| L10 | 31.38 | 0.035 | 5.71 |
| Sample Number | Pore-Throat Size | Degree of Pore Throat Sorting | Pore-Throat Connectivity |
|---|---|---|---|
| Average Pore Throat Radius (μm) | Dr | Pd (Mpa) | |
| L1 | 0.010 | 0.158 | 13.78 |
| L2 | 0.011 | 0.149 | 15.77 |
| L3 | 0.013 | 0.174 | 10.77 |
| L4 | 0.012 | 0.135 | 12.26 |
| L5 | 0.011 | 0.172 | 13.76 |
| L6 | 0.009 | 0.171 | 18.66 |
| L7 | 0.017 | 0.149 | 10.77 |
| L8 | 0.026 | 0.096 | 5.48 |
| L9 | 0.014 | 0.148 | 13.77 |
| L10 | 0.013 | 0.135 | 11.02 |
| Lithofacies | Sample Number | Movable Oil Ratio (%) | ||
|---|---|---|---|---|
| T2cutoff Method | Area Subtraction Method | Average | ||
| LS1 | L1 | 11.71 | 0.019 | 7.01 |
| L2 | 6.80 | 0.015 | 8.76 | |
| LS2 | L5 | 10.29 | 0.020 | 7.86 |
| L7 | 10.21 | 0.020 | 7.91 | |
| LS3 | L3 | 10.45 | 0.022 | 8.52 |
| L4 | 7.87 | 0.012 | 6.22 | |
| L6 | 12.13 | 0.022 | 7.35 | |
| LS4 | L8 | 42.21 | 0.040 | 5.59 |
| L9 | 8.83 | 0.015 | 7.52 | |
| LS5 | L10 | 31.38 | 0.035 | 5.71 |
Disclaimer/Publisher’s Note: The statements, opinions and data contained in all publications are solely those of the individual author(s) and contributor(s) and not of MDPI and/or the editor(s). MDPI and/or the editor(s) disclaim responsibility for any injury to people or property resulting from any ideas, methods, instructions or products referred to in the content. |
© 2024 by the authors. Licensee MDPI, Basel, Switzerland. This article is an open access article distributed under the terms and conditions of the Creative Commons Attribution (CC BY) license (https://creativecommons.org/licenses/by/4.0/).
Share and Cite
Zhang, L.; Xu, S.; Jin, K.; Zhang, X.; Liu, Y.; Chen, C.; Liu, R.; Li, M.; Li, J. Study on the Influencing Factors of Oil Bearing and Mobility of Shale Reservoirs in the Fourth Member of the Shahejie Formation in the Liaohe Western Depression. Energies 2024, 17, 3931. https://doi.org/10.3390/en17163931
Zhang L, Xu S, Jin K, Zhang X, Liu Y, Chen C, Liu R, Li M, Li J. Study on the Influencing Factors of Oil Bearing and Mobility of Shale Reservoirs in the Fourth Member of the Shahejie Formation in the Liaohe Western Depression. Energies. 2024; 17(16):3931. https://doi.org/10.3390/en17163931
Chicago/Turabian StyleZhang, Lei, Shizhen Xu, Ke Jin, Xuejuan Zhang, Yinglin Liu, Chang Chen, Ruhao Liu, Ming Li, and Jinpeng Li. 2024. "Study on the Influencing Factors of Oil Bearing and Mobility of Shale Reservoirs in the Fourth Member of the Shahejie Formation in the Liaohe Western Depression" Energies 17, no. 16: 3931. https://doi.org/10.3390/en17163931