Article

Regional Breakthrough Innovation Change Strategies, Ecological Location Suitability of High-Tech Industry Innovation Ecosystems, and Green Energy

1
Business School, Ningbo University, Ningbo 315211, China
2
Business School, East China University of Science and Technology, Shanghai 200237, China
3
Ningbo Urban Civilization Research Institute, Ningbo 315211, China
*
Author to whom correspondence should be addressed.
Energies 2024, 17(16), 3938; https://doi.org/10.3390/en17163938
Submission received: 1 July 2024 / Revised: 29 July 2024 / Accepted: 6 August 2024 / Published: 8 August 2024
(This article belongs to the Special Issue Studies of Energy Economics and Environmental Policies in China)

Abstract

:
Against the backdrop of an ongoing energy revolution, this study measured the regional green energy efficiency and ecological niche suitability of high-tech industry innovation ecosystems using the Super-SBM and entropy methods. We employed panel data from 30 mainland provinces (excluding Tibet) from 2009 to 2021 to conduct a quasi-natural experiment using spatial difference-in-differences models and double machine learning models. This was performed in order to investigate the impact mechanisms of the transformation of ecological niche suitability within the innovation ecosystems of high-tech industries driven by regional breakthrough innovation change strategies on green energy efficiency. The findings of this study revealed the following: (1) Driven by regional breakthrough innovation strategies, the transformation of the ecological niche suitability of high-tech industry innovation ecosystems has significant and positive local effects and spillover effects on green energy efficiency. (2) Regional breakthrough innovation strategies have a significant and positive mediating transmission effect on green energy efficiency through the development and optimization of internal factors within the ecological niche suitability of high-tech industry innovation ecosystems, including innovation entities, support, vitality, resources, and environment. (3) The transformation of the ecological niche suitability of high-tech industry innovation ecosystems driven by regional breakthrough innovation strategies promotes the advancement and rationalization of the industrial structure, thus indirectly enhancing regional green energy efficiency. These findings are of paramount importance for propelling the next wave of regional disruptive innovation reform strategies, ensuring that the outcomes of these reforms drive the ecological niche suitability of high-tech industry innovation ecosystems toward the advancement and realization of clean and efficient energy utilization.

1. Introduction

Against the backdrop of globalization and accelerated progress toward carbon neutrality, countries are actively and deeply pushing forward the energy revolution, promoting the clean and efficient use of energy and ensuring the security of energy resources. This indicates that improving the cleanliness and utilization efficiency of energy has become an important way for countries to pursue high-quality development and realize the transformation of old and new kinetic energies. Therefore, how to guide improvements in green energy efficiency through policies and how to coordinate the synergistic development of various links to jointly improve green energy efficiency have become major keys to alleviating energy security and resolving the contradiction between energy supply and demand.
Improvements in green energy efficiency need to be achieved through multiple policy tools and institutional arrangements [1], including innovation policies, and the development of regional breakthrough innovation and change strategies provides a quasi-natural experiment for exploring this issue (from now on, these are referred to as the “Programme” and the “Notice”, respectively). The Programme and the Notice are two rounds of regional breakthrough innovation change strategies designed to improve the efficiency and quality of regional technological innovation through a series of policy tool combinations, such as strengthening market mechanisms, optimizing institutional arrangements, implementing policy safeguards, creating an innovative environment, and empowering industrial chain transformation and optimization, with the results of the innovations. Therefore, this policy implementation may have a certain impact on the levels of regional and industrial energy use. In this regard, Dutt AK found that regional breakthrough innovation change strategies can coordinate the clustering of innovation resources, incentivize enterprises to increase their R&D activities, and enable other mechanisms to promote regional total factor productivity [2]. Still, such studies have not incorporated energy and ecological factors, such as energy factor inputs and non-desired output factors such as pollution and carbon emissions, into the “total factor productivity.” Meanwhile, existing studies have also proved that regional breakthrough innovation and change strategies can drive the transformation and upgrading of regional industrial structures and improvements in the level of green innovation [3,4], and the existing evidence indicates that regional breakthrough innovation and change strategies do have green development effects on green innovation, industrial structure, and other local factors. However, a current and direct inquiry into the overall green development effect of the region caused by a regional breakthrough innovation and change strategy has not been conducted. Fewer studies have directly explored the overall green development transformation and energy use pattern changes in the region caused by a regional breakthrough innovation and change strategy, so this research investigated it as a main line of research.
Meanwhile, from the perspective of regional industrial innovation, research on the innovation ecosystems of high-tech industries based on the ecological niche theory has become a focus of academic attention. The innovation subjects in each industrial chain of a high-tech industry form a complex social relationship network through information interactions, energy exchange, and material exchange, which constantly adjust the ecological niche through dynamic matching with the innovation environment, thus forming the high-tech industry innovation ecosystem [5]. If the evolution direction of the regional high-tech industry innovation ecosystem tends to cause the subjects in the system to make more efficient use of innovation resources and give greater play to their ecological niche effect, thus releasing the regional innovation potential and promoting the expansion of the overall scale and technological progress of the region’s high-tech industry, it is considered that the ecological niche suitability of the high-tech industry innovation ecosystem is being optimized [6]. In addition, many studies have shown that the expansion of the innovation body represented by high-tech enterprises can drive the upgrading of industrial structure, the integration of market resources, and the promotion of knowledge spillover and resource sharing, which in turn reduces the operating costs and enhances the R&D efficiency of green technologies and new products [7]. Meanwhile, some studies have found that with the goals of innovation, greenness, openness, coordination, and sharing, national independent innovation demonstration zones, science and technology business incubators, industry–education fusion platforms, crowdsourcing spaces, and other innovation platforms, along with the innovation services they supply to the region, can accelerate the transformation of green application technologies, assist the enterprise innovation body in carrying out energy control and environmental regulation, and encourage other ways to help promote regional green transformation and energy efficiency [8].
Previous studies have analyzed the enabling mechanism of regional innovation and technological progress on regional green development and the decarbonization transition from a single perspective of the main body of regional innovation, the environment, and resources, but few studies have examined the effect of interactions, symbiosis, and dynamic evolution between the regional innovation main body and the innovation environment on regional green development and energy use pattern changes from the perspective of the whole regional innovation ecosystem. Granstrand O et al. explored the green innovation effect of the group of pathways constituted by the interactions of innovation ecosystems [9], but most of these studies have investigated the mechanism of regional innovation ecosystem evolution based on the single green development variable of green innovation. The mechanism of regional innovation ecosystem suitability transition based on regional green energy efficiency needs to be further explored, so this research cites it as an alternative pathway. Therefore, this study refers to it as another main line of research.
In addition, few studies have discussed the policy effects of regional breakthrough innovation change strategies on the regional innovation ecosystems as a whole. How regional breakthrough innovation strategies can drive the transformation of the regional innovation ecosystems’ development mode, enhance ecological suitability, and coordinate the establishment of a synergistic development mechanism between the innovation subject and the innovation environment are still important questions that need to be urgently researched [10].
In summary, given that existing studies rarely discuss the mechanism of the effect of regional high-tech industry innovation ecosystem suitability on regional green energy efficiency driven by the policy effect of regional breakthrough innovation change strategies, this study suggests that it is necessary to incorporate regional breakthrough innovation change strategies, high-tech industry innovation ecosystem suitability, and regional green energy efficiency into a unified framework for research. Under the research framework of “regional breakthrough innovation change strategy–ecological niche suitability of the high-tech industry innovation ecosystem–regional green energy efficiency”, the internal mechanism of the three factors are deeply analyzed.
Consequently, this research investigates the influence mechanisms of ecological niche adaptability within regional high-tech industry innovation ecosystems under policy-driven regional breakthrough innovation reform strategies on green energy efficiency. By utilizing panel data from 30 provinces in China, this analysis employed spatial difference-in-differences and double machine learning models to conduct a quasi-natural experiment analysis. The empirical conclusions drawn from this study aim to deepen the understanding of the intricate interactions and evolutionary mechanisms among policy drivers, green innovation, and industrial structure, thereby providing theoretical guidance for energy development in emerging innovative nations such as China and facilitating the achievement of sustainable development goals.
The remainder of this study is organized as follows. The second section embarks on a comprehensive exploration and critique of the extant body of literature and research pertinent to our study. The third section delineates a detailed research design and articulates the hypotheses, constructing the spatial difference-in-differences and double machine learning models while explaining the variables involved. The fourth section conducts an empirical analysis based on panel data from 30 mainland provinces in China. The fifth section summarizes the main research conclusions and offers policy recommendations. The sixth section revisits the potential contributions, limitations, and future prospects of the research.
The anticipated contributions of this research are as follows: In light of the current global market’s need for energy structure transformation and China’s commitment to achieving dual carbon goals, the findings of this study aspire to provide a new theoretical framework and research perspective for the exploration of green energy efficiency. Furthermore, this study seeks to assist China and other emerging market nations in reallocating innovative resources and designing innovation policies from the perspective of innovation ecosystems, thereby making marginal contributions to addressing issues such as energy depletion and climate change.

2. Literature Review

2.1. Dynamics of Green Energy Efficiency Research

For an extended period, the study of green energy efficiency was a prominent topic within the energy sector; it was regarded as a vital driver for achieving sustainable resource management and the profound transformation of energy systems [11]. Enhancing green energy efficiency is a crucial policy strategy for addressing energy security issues, fostering economic growth, and reducing greenhouse gas emissions. From a regional innovation perspective, scholars have increasingly focused on areas such as the evaluation of green energy efficiency, the analysis of influencing factors, and the relationship between energy consumption and economic growth [12,13,14].
In terms of evaluating energy efficiency, Meng Ming et al. established a green energy efficiency assessment model using the Super-SBM model and GML index methodology [15]. Kolosok Svitlana Ivanivna et al. conducted a comprehensive evaluation of green innovation policies in Europe based on a least-squares model, confirming the positive impact of green innovation on energy efficiency by addressing four sustainable development goals: affordable clean energy, decent work and economic growth, responsible consumption and production, and the response to climate change. In analyzing the influencing factors of energy efficiency [16], Wu Haitao et al. demonstrated a U-shaped relationship between environmental regulation and green total factor energy efficiency using a dynamic threshold panel model. Regarding the relationship between energy consumption and economic growth [17], Jiang Zhujun et al. employed fixed-effects models and generalized method of moments (GMM) vector autoregression (VAR) methods from both micro and macro perspectives, revealing that energy consumption significantly stimulates green energy innovation, thereby enhancing green energy efficiency and facilitating the energy transition [18]. These research perspectives provide robust theoretical support and concrete quantitative standards for exploring pathways toward the overall enhancement of green energy efficiency.

2.2. A Review of Energy Efficiency Research from a Regional Innovation Perspective

Within the existing literature on green energy efficiency, numerous scholars have recognized the significant impact of regional industrial innovation. Studies have indicated that regional inequalities in industrial technological innovation related to renewable energy may lead to insufficient innovation growth, thereby impeding the deployment of renewable energy and slowing the low-carbon transition, ultimately diminishing energy efficiency [19]. Regional technological industrial innovation represents the process from regional development and innovation to the formation of technical industries, serving as a core component for implementing green development principles and driving sustainable economic growth [20]. This study, which references the work of Hong Yue et al., offers a refined evaluation of regional industrial innovation capabilities based on R&D funding and input intensity, patent applications, and labor productivity [21].

2.2.1. Regional Industrial R&D Funding and Input Intensity in Relation to Green Energy Efficiency

R&D funding and input intensity are regarded as critical indicators of the technological innovation capabilities of a country or region. Investments in regional industrial R&D not only directly propel technological advancements but also promote technological upgrades in other industries through knowledge spillover effects. Caglar Abdullah Emre et al. used an enhanced mean group and common correlated effects mean group approach to demonstrate the driving force of increased green energy R&D budgets on energy efficiency improvements, providing policy recommendations for innovative countries amid the green energy transition [22]. Jin Xin et al. analyzed the long-term impact and causal relationship between R&D investments targeting green energy and the energy efficiency load capacity coefficients (LCF) within regional industries using an improved time series testing method, revealing that increased R&D investment in green energy and energy efficiency effectively enhances the ecological quality and promotes growth in load capacity coefficients [23]. Wang Qiang et al. examined the heterogeneous effects of green energy consumption, conducted an empirical analysis utilizing comprehensive panel data from the G20, and found that among middle- to high-income groups, the R&D effect significantly surpasses other factors, effectively promoting improvements in green energy efficiency [24]. These studies substantiate the positive correlation between R&D funding and input intensity targeting energy within regional industries and green energy efficiency, providing a reference for budget allocation and resource optimization in green energy enterprises.

2.2.2. The Relationship between Patent Applications in Regional Industries and Green Energy Efficiency

The number of patent applications serves as a vital indicator of a country or region’s technological innovation capacity, reflecting the outcomes and level of technological innovation in regional industries. In the domain of green energy, the relationship between technology patents related to energy efficiency, renewable energy, and green energy efficiency has garnered significant academic attention. Sun Huaping et al. explored the cross-sector spillover effects of technological innovation, analyzing the positive correlation between the innovation spillover effects and the regional energy efficiency in developed and developing innovative nations using patent data [25]. Li Jin et al. utilized a two-way fixed effects difference-in-differences (DID) model to analyze the interaction between green technology innovation patents and energy efficiency, revealing the importance of accelerating the patent conversion rate for optimizing green energy efficiency and enhancing corporate green production efficiency [26].
Furthermore, the number of green technology patents filed by regional industries reflects, to some degree, their green innovation capability, thereby facilitating the transition from green innovation to green energy efficiency. Esmaeilpour Moghadam et al. measured the level of industrial green innovation through environmentally relevant patents and employed various statistical testing methods to assess the regional innovation deployment situation, ultimately corroborating the positive correlation between industrial green innovation and the advancement of green energy and green energy efficiency [27]. Li Jiaman et al. investigated the impact of green energy and green technology innovation on green growth using a systems GMM approach, finding that green technology innovation enhances the positive influence of green energy growth, thereby improving energy efficiency [28]. These studies underscore that the number of green technology patent applications within regional industries can reflect regional green innovation levels and is positively correlated with green energy efficiency, providing guidance for the publication of relevant patents and technological innovations associated with energy efficiency.

2.2.3. Labor Productivity in Regional Industries and Green Energy Efficiency

Labor productivity is a crucial indicator of economic growth and technological advancement within a country or region. The labor productivity of regional industries not only reflects the efficiency of factor utilization but also indicates the technological progress and innovative capabilities of the region [29]. Yu Xie et al. examined the labor productivity of technological industries in Asia, Europe, and South America and employed data envelopment analysis to study and validate the promoting effect of industrial labor productivity on green energy efficiency [30]. Zhang Hong Yan et al. measured the impact of the discrete index of technological industry labor productivity on regional energy intensity, utilizing a spatial panel model to verify that the decentralization of industrial labor productivity hampers the efficient allocation of energy factors and that the transition of labor from primary to secondary and tertiary industries is a pressing issue to be overcome to achieve structural upgrading and enhanced energy efficiency in China’s regional industries [31]. Additionally, considering the inverse relationship between labor productivity and labor costs, some scholars have validated the significant contributions of rising labor costs to green technology efficiency (GTF) through a systems GMM model, a moderation effect model, and a panel threshold model from an industrial intelligence perspective, indicating that leveraging the innovative developmental effects of rising labor costs should be grounded in advancements in industrial intelligence [32]. These studies affirm that regional industrial labor productivity can enhance regional green energy efficiency by fostering improved levels of green innovation, thereby providing theoretical references for structural transformations in industries.

2.2.4. Other Innovation-Related Factors and Green Energy Efficiency Research

Beyond the aforementioned three factors that measure regional industrial innovation capabilities, industrial innovation policies play a significant role in enhancing regional industrial innovation capabilities, thus driving improvements in green energy efficiency. Taking China as an example, a series of innovation policies, including the National Innovation City Policy (NIPCP) and the Regional Breakthrough Innovation Reform Strategy, have been implemented to guide regional industrial innovation, with some studies addressing the impact of such policies on green energy efficiency. For instance, Yang Jingyi et al. investigated the implementation of the National Innovation City Policy in China and employed the propensity score-matching difference-in-differences (PSM-DID) methodology to demonstrate the policy’s facilitative influence on urban energy efficiency [33]. Research on these industrial innovation policies aids in comprehensively understanding and catalyzing the positive effects of innovation policies on the aggregation of innovative factors, leading to amicable interactions among innovation entities.

2.3. Literature Critique

The aforementioned literature, which is grounded in theories of green energy efficiency and regional industrial innovation perspectives, forms a comprehensive research framework on green energy efficiency. However, a review of the existing studies revealed several areas necessitating further exploration:
(1)
While previous research has established the positive effects of regional industrial innovation on green energy efficiency, much of it has focused on the impacts of individual innovation factors on energy without comprehensively assessing the complexity and dynamics of regional industrial innovation ecosystems. Therefore, it is imperative to analyze the influence of the interrelationships and synergistic evolution of various innovation factors within the region through a systems theory perspective, thereby rendering the conclusions more universally applicable.
(2)
Existing research has investigated the mechanisms through which the evolution of regional industrial innovation ecosystems affects green development variables, yet few studies have examined these mechanisms from the perspective of ecological niche adaptability transformations within regional innovation ecosystems and their effects on regional green energy efficiency. Although some research has analyzed the causes, spatiotemporal evolution, and optimization paths of ecological niche adaptability within regional innovation ecosystems, an in-depth analysis of the interaction between adaptability and energy efficiency remains largely unexplored. Consequently, studying the influencing factors on regional green energy efficiency from the viewpoint of ecological niche adaptability transformations within innovation ecosystems will reveal the potential impacts of regional industrial innovation disparities on energy efficiency.
(3)
While prior research has highlighted the driving role of regional innovation policies in enhancing green energy efficiency, few investigations have considered the comprehensive policy effects of regional breakthrough innovation reform strategies on the overall regional innovation ecosystem. The existing evidence indicates that such strategies indeed exert green developmental effects on specific factors, such as green innovation and the industrial structure. Thus, exploring the mechanisms through which regional innovation ecosystems influence green energy efficiency under these policy effects holds significant importance.
Based on the above critique of the existing research, this study adopted a systems theory perspective as well as a view of regional industrial innovation ecosystem adaptability to analyze the influence mechanisms of ecological niche adaptability on green energy efficiency under the policy effects of regional breakthrough innovation reform strategies. Through the design of quasi-natural experiments for empirical research, this study aimed to delve deeply into the intricate interplay among ecological niche adaptability within industrial innovation ecosystems, green energy efficiency, and regional breakthrough innovation reform strategies, providing theoretical insight for promoting transformations in the adaptability of industrial innovation ecosystems and achieving the clean and efficient utilization of energy.

3. Research Design

3.1. Research Hypothesis

3.1.1. The Direct Effect of Innovation Reform-Driven Transformation of Innovation Ecological Niche Suitability of High-Tech Industries on Green Energy Efficiency

Both the Programme and the Notice emphasize that innovation fostering regional innovation necessitates a focus on the main actors, foundational elements, resources, and environment of innovation. The enhancement of these components can facilitate the agglomeration of innovative elements and the optimization of resource allocation, thereby providing impetus for regional innovation development [34]. Concurrently, regional breakthrough innovation change strategies aimed at transformative innovation can aid in achieving regional digital transformation, ultimately enhancing the suitability of the regional innovation ecosystem’s niche through the attraction of high-skilled talent and the integration of innovative components [35]. Therefore, this study suggests that driving the transformation of the ecological niche suitability of high-tech industry innovation ecosystems is crucial for the realization of regional breakthrough innovation change strategies.
Regional breakthrough innovation change strategies, as significant innovation policies, can drive the evolution of niche suitability within high-tech industry innovation ecosystems. The suitability of the innovation ecosystem’s niche can be measured through three dimensions: innovative actors, the innovation environment, and innovation resources [36]. Consequently, the transformation of niche suitability driven by regional breakthrough innovation change strategies may have potential impacts on green energy efficiency in the following ways: Firstly, the niche suitability of the regional innovation ecosystem effectively reflects the current status and environmental adaptability of innovation actors within the region [37]. Under the influence of environmental adaptability, green energy systems are likely to prioritize the rational allocation of resources, thereby minimizing waste and enhancing resource utilization efficiency [38]. Secondly, the niche suitability of the regional innovation ecosystem indicates the degree of rational allocation of innovation resources within the region [39], and the agglomeration of these resources is conducive to reducing urban energy consumption, thereby improving energy efficiency.
Based on the above analysis, this study puts forward the following hypothesis:
Hypothesis 1. 
The policy effect of the transformation of niche suitability within high-tech industry innovation ecosystems, driven by regional breakthrough innovation change strategies, can significantly enhance green energy efficiency.

3.1.2. Mechanism Effects Based on the Sub-Dimensions of the Niche Suitability of High-Tech Industry Innovation Ecosystems

The niche suitability of high-tech industry innovation ecosystems serves as a multidimensional, dynamic, and comprehensive systemic indicator that profoundly reflects the interactions and synergies among the key elements of innovation actors, external environments, as well as material, energy, and information. Given its complexity and dynamism, capturing the transformation and evolution of these elements under the guidance of regional breakthrough innovation change strategies is instrumental in assessing their potential contributions to enhancing regional green energy efficiency [40]. In this regard, this study draws upon and expands the research of Yi Huiyong et al. (2022), systematically measuring the niche suitability of high-tech industry innovation ecosystems through five core dimensions: innovation actors, innovation support, innovation vitality, innovation resources, and the innovation environment [41]. This study employs these five sub-dimensions as mechanism variables to explore in depth how regional disruptive innovation strategies can influence and optimize the niche suitability of high-tech industry innovation ecosystems through their effects on these variables, ultimately leading to improvements in regional green energy efficiency.
(1)
Regional Breakthrough Innovation Strategy → Innovation Entities → Regional Green Energy Efficiency
Higher education institutions, research organizations, and high-tech enterprises, as the core biotic communities of high-tech innovation ecosystems, contribute their diversity, vibrancy, and the complexity of the networks they build, serving as key indicators for assessing the ecosystem’s niche suitability [42]. With the increasing diversity of innovation actors, the flourishing of venture capital and R&D activities, and the growing complexity of innovation network structures, the adaptability and innovative capacity of high-tech industry innovation ecosystems are significantly enhanced, thereby providing a more accurate reflection of their niche suitability [43].
In the transmission pathway of “regional breakthrough innovation strategy → innovation entities → regional green energy efficiency”, regional breakthrough innovation strategies can optimize market mechanisms and business environments, effectively alleviating financing constraints for high-tech enterprises [44]. Simultaneously, these reforms can provide policy and financial support for universities, research institutions, and researchers. By establishing experimental zones and introducing innovation entities, the scale of innovation entities from both the production and consumption sides of high-tech industry innovation ecosystems can be expanded, thereby increasing the knowledge supply needed to enhance green energy efficiency [10]. Furthermore, driven by innovation reform policies, innovation actors actively respond by comprehensively optimizing and upgrading various aspects, from technological R&D and product design to production processes and market promotion. This encourages high-tech industries to increase investment in green energy technologies and focus on overcoming key challenges related to enhancing energy conversion efficiency, reducing production costs, and improving system stability and compatibility [45]. In this favorable context for innovation actors, the green energy market can develop and mature, thereby improving energy efficiency.
Based on the above analysis, this study puts forward the following hypothesis:
Hypothesis 2 (H2a). 
Regional breakthrough innovation strategies significantly enhance regional green energy efficiency by promoting the expansion and upgrading of subjects of innovation.
(2)
Regional Breakthrough Innovation Strategy → Innovation Support → Regional Green Energy Efficiency
Innovation support refers to the innovation platforms within high-tech industry innovation ecosystems that provide services to innovation entities or policy subjects that support the sustainable evolution of the ecosystems [46]. The degree of innovation support development represents the enabling characteristics of the niche suitability of high-tech industry innovation ecosystems, serving as an important indicator of the systems’ internal innovation and growth potential.
In the pathway of “regional breakthrough innovation strategy → innovation support → regional green energy efficiency”, regional breakthrough innovation strategies can reform government innovation strategies, drive the construction of regional innovation platforms, strengthen the development of innovation platforms in experimental zones, and optimize the supply mechanism of innovation services in these zones [47]. This pathway provides policy and technical service support for the high-tech industry to seek green competitive advantages, characterized by low environmental pollution and resource consumption. Additionally, regional innovation platforms expedite the incubation and maturation of new green energy technologies by integrating resources from universities, research institutions, and enterprises, thereby promoting interdisciplinary and cross-sectoral collaboration and providing technical support for enhancing green energy efficiency [48]. Simultaneously, the strengthening of regional innovation support can optimize resource allocation and enhance industrial synergy, enabling high-tech industries located upstream and downstream of the green energy supply chain to strengthen communication and collaboration, achieving resource sharing and complementary advantages, thus forming an effective collaborative force for improving regional energy efficiency [49].
Based on the above analysis, this study puts forward the following hypothesis:
Hypothesis 3 (H2b). 
Regional breakthrough innovation strategies significantly enhance regional green energy efficiency by strengthening innovation support.
(3)
Regional Breakthrough Innovation Strategy → Innovation Vitality → Regional Green Energy Efficiency
According to niche status theory [50], the entities, support, resources, and environment of regional innovation represent the “status” of the niche suitability of high-tech innovation ecosystems—a cross-sectional representation of its comprehensive strength. Innovation vitality encompasses the movement, upgrading, transformation, and interactions among innovation entities, resources, and the environment, embodying the dynamic potential and development momentum of the niche suitability of high-tech innovation ecosystems [51]. It facilitates the optimized combination and efficient collaboration of internal system elements, enhancing the systems’ self-repair and evolution capabilities, thereby bolstering their overall suitability.
In the pathway of “regional breakthrough innovation strategy → innovation vitality → regional green energy efficiency”, plans and notifications highlight the need to address the pain points and bottlenecks in the innovation development process. This focus can stimulate the innovation and entrepreneurial vitality of entities [52]. Evidence shows that once regional innovation and entrepreneurial vitality are unleashed [53], more enterprises within the region will leverage technological innovation to forge their green competitive advantage due to evasive competition effects [54], thereby promoting an overall enhancement in regional green energy efficiency. Furthermore, the stimulation of innovation vitality can drive the optimization and upgrading of industrial structures and the extension of industrial chains, propelling high-tech industries to continuously explore and break through in areas such as renewable energy technologies, energy-saving and emission-reduction technologies, and energy management systems, thereby providing robust technical support for improving green energy efficiency [55].
Based on the above analysis, this study puts forward the following hypothesis:
Hypothesis 4 (H2c). 
Regional breakthrough innovation strategies significantly enhance regional green energy efficiency by stimulating innovation vitality.
(4)
Regional Breakthrough Innovation Strategy → Innovation Resources → Regional Green Energy Efficiency
Innovation resources form the material foundation dimension of the niche suitability of high-tech industry innovation ecosystems. The abundance and aggregation level of innovation resources directly determine the evolutionary potential of innovation entities and reflect the enabling level of innovation support [56]. In the pathway of “regional breakthrough innovation strategy → innovation resources → regional green energy efficiency”, regional breakthrough innovation strategies emphasize increasing innovation resource supply and optimizing resource allocation through measures such as the open sharing of research equipment, reform of research funding management, and improvement of the technical elements market system. These actions provide a material foundation for regional green technology innovation and industrial technological development while promoting resource efficiency [57]. Under constrained resources, high-tech industries can enhance the economic efficiency of green energy by applying energy-saving, resource-conserving, environmentally safe, and cost-effective innovative technologies [58].
Based on the above analysis, this study puts forward the following hypothesis:
Hypothesis 5 (H2d). 
Regional breakthrough innovation strategies significantly enhance regional green energy efficiency by optimizing the supply of innovation resources.
(5)
Regional Breakthrough Innovation Strategy → Innovation Environment → Regional Green Energy Efficiency
The innovation environment encompasses the institutional arrangements, cultural development, financial circulation, and market development essential for the innovative growth of high-tech industries. It is a direct reflection of the niche suitability of high-tech industry innovation ecosystems [59]. In the pathway of “regional breakthrough innovation strategy → innovation environment → regional green energy efficiency”, plans and notifications call for accelerating reforms in intellectual property, market access, and financial innovation, thus shaping a favorable legal, financial, and market environment. A good social order and institutional framework can expand the green competitive advantages of industries, further motivating green industrial transformation and providing an environmental foundation for the enhancement of regional green energy efficiency [60]. Moreover, a favorable innovation environment enhances innovation efficiency, shortens the R&D cycles of green technologies, and enables high-tech industries to more effectively apply new materials, processes, and equipment in the research and production of green energy technologies, thereby forming technological integration advantages that further enhance the overall efficiency of green energy systems [61].
Based on the above analysis, this study proposes the following hypothesis:
Hypothesis 6 (H2e). 
Regional breakthrough innovation strategies significantly enhance regional green energy efficiency by transforming the innovation environment.

3.1.3. Mechanism Effect of Industrial Structure

The ecological niche suitability of high-tech industry innovation ecosystems has been verified by Yi Huiyong et al. to be able to have an effect on the advanced and rationalized industrial structure. This suitability not only deepens the agglomeration effects of innovation elements but also markedly enhances the symbiotic coordination and operational efficiency among key innovation entities such as universities, research institutions, and enterprises. It delivers a systems combination punch to the ecological suitability of high-tech industry innovation ecosystems and can further drive the concentration of innovation factors, improve the symbiosis and coordination between innovation subjects such as universities, research institutions, and enterprises, and drive the innovation and development of high-tech industries with the combination of systems, thus improving the optimization and upgrading of industrial structure [62]. The advanced industrial structure can give rise to high-tech industries with higher production efficiency and higher value-added production [63], and there is sufficient evidence to prove that industries occupying a high position in the industrial structure have the attribute of green environmental protection and can promote the reduction of pollution and emission reduction [64]. Furthermore, regional breakthrough innovation change strategies can drive the transformation of niche suitability within high-tech enterprise innovation ecosystems, guiding the orderly flow of innovative elements from path-dependent traditional sectors to more efficient high-tech sectors, promoting the rationalization of industrial structure and thus reducing resource waste while efficiently allocating factors and resources [65], which has a positive impact on the enhancement of regional green energy efficiency.
Based on the above analysis, this study puts forward the following hypotheses:
Hypothesis 7 (H3a). 
Regional breakthrough innovation-driven transformation of the ecological niche suitability of high-tech industry innovation ecosystems can significantly promote regional green energy efficiency by improving the advanced evolution of industrial structure.
Hypothesis 8 (H3b). 
Regional breakthrough innovation-driven transformation of the ecological niche suitability of high-tech industry innovation ecosystems can significantly promote regional green energy efficiency by improving the rationalization of industrial structure.

3.1.4. Spatial Effect Mechanism of Regional Breakthrough Innovation Strategies Driving the Transformation of Innovation Ecological Location Suitability of High-Tech Industries

With the progress of the construction process of the national unified large market in China, the spatial spillover of the policy effect of regional breakthrough innovation strategy has intensified. The potential contributions of these spatial effects to green energy efficiency enhancement are as follows: Firstly, a region’s new development model, formed through regional breakthrough innovation strategies encompassing resource allocation optimization, innovation element agglomeration, innovation vitality enhancement, and industrial structure upgrading, can transcend geographical boundaries and transfer to economically interconnected regions [66], thereby significantly improving their green energy utilization efficiency. Additionally, the policy exemplification effect of regional breakthrough innovation strategies fosters a positive spatial transmission to green energy efficiency, creating a virtuous cycle of regional interactions [67]. Furthermore, the transformation of niche suitability driven by regional breakthrough innovation accelerates the spatial diffusion and penetration of high-tech industries, advanced technologies, and knowledge, establishing a positive transmission bridge for the emergence of new industries, cultivation of new enterprises, and leaps in production efficiency in other regions [68]. This spatial “trickle-down” effect consequently promotes the enhancement of green energy efficiency across the entire domain.
Based on the above analysis, this study puts forward the following hypothesis:
Hypothesis 9 (H4). 
The spatial effect of the transformation of the ecological suitability of high-tech industry innovation ecosystems driven by regional breakthrough innovation can significantly promote regional green energy efficiency.

3.2. Experimental Design and Modeling

3.2.1. Spatial Double-Difference Model Construction

This study primarily investigates the transformation of ecological niche suitability within high-tech innovation ecosystems driven by regional breakthrough innovation strategies. Therefore, we refer to the research of Xing Hui et al. to verify the influence mechanism outlined in H1 and the spatial effect detailed in H4 [69]. We utilize continuous policy processing variables to construct a continuous spatial double-difference model. The core advantage of this model lies in its ability to significantly eliminate or reduce systematic and random errors, thereby highlighting authentic signals or patterns. In the context of continuous space, the model enhances the precision and reliability of data analysis through meticulous processing of spatial data [70]. Consequently, this paper employs the model to accurately quantify the spatial effects arising from the transformation of ecological niche suitability within high-tech industrial innovation ecosystems, validating its impact on green energy efficiency. Models 1–3 are based on spatial autoregressive model, spatial error model, and spatial Durbin model of spatial double-difference model, respectively.
Model 1:
G T F P i t = ρ W G T F P i t + α F i t i t × D I D i t + β X i t + γ t + u i + ε i t
Model 2:
G T F P i t = α F i t i t × D I D i t + β X i t + γ t + λ W v i t + u i + ε i t
Model 3:
G T F P i t = ρ W G T F P i t + α F i t i t × D I D i t + β X i t + θ W F i t i t × D I D i t + β X i t + γ t + u i + ε i t
In Equations (1)–(3), G T F P i t is the explanatory variable regional green energy efficiency; F i t i t and D I D i t represent the ecological niche suitability of high-tech industry innovation ecosystems and the regional breakthrough innovation and change strategy policy treatment variables, respectively; α is the coefficient of the continuous policy variable; β X i t is the set of control variables and the product of their coefficients; W is the economic spatial weight matrix on which the model is based; ρ and θ are the spatial autoregressive coefficient and the spatial effect coefficients of the independent variables, respectively; v i t is the shock variable; and γ t , u i , and ε i t are the time fixed effects, spatial fixed effects, and random error terms, respectively.

3.2.2. Construction of the Dual Machine Learning Model

In order to verify H2 and H3, and considering problems such as the curse of dimensionality and the difficulty of exhaustively enumerating the key covariates in the dual difference model, this study refers to Chernozhukov et al. [71] to correct the canonical bias of the machine learning algorithms by using dual machine learning (DML), and also refers to He J et al. [72] to verify the mechanism hypothesis of this study by using the dual machine learning model of the mediating effect mechanism, constructing models 4 and 5, as follows:
Model 4:
( 1 ) : G T F P i t = α 1 D I D i t + g X i t + U i t   ,   E U i t D I D i t , X i t = 0 2 : F i t i t S u b i t , S u r i t = β 1 D I D i t + g X i t + U i t   , E U i t D I D i t , X i t = 0 3 : G T F P i t = α 1 D I D i t + α 2 F i t i t S u b i t , S u r i t + g X i t + U i t   , E U i t D I D i t , X i t = 0
Model 5:
1 : G T F P i t = α 1 F i t i t × D I D i t + g X i t + U i t   ,   E U i t F i t i t × D I D i t i t , X i t = 0 2 : A I S i t R I S i t = β 1 F i t i t × D I D i t + g X i t + U i t   , E U i t D I D i t , X i t = 0 3 : G T F P i t = α 1 F i t i t × D I D i t + α 2 A I S i t R I S i t + g X i t + U i t   ,   E U i t D I D i t , X i t = 0
In the above equation, Equation (1) of model 4 is used to test the overall effect of the regional breakthrough innovation change strategy policy ( D I D i t ) on regional green innovation efficiency ( G T F P i t ), Equation (2) is used to estimate the effect of D I D i t on the mediator variable ( F i t i t ) and its sub-dimensions ( S u b i t , S u r i t ), and Equation (3) estimates the effect of D I D i t on the explanatory variables under the influence of the mediator variable. Model 5 takes the advanced industrial structure ( A I S i t ) and rationalization ( R I S i t ) as mechanism variables in the same way to estimate the indirect effect of F i t i t × D I D i t on the explanatory variables under the influence of the mediator effect.
In the parameter estimation of the dual machine learning model, D I D i t is used as the explanatory variable, auxiliary equations are constructed for the second machine learning to correct the regularity bias of g ^ ( X i t ) , and the residuals obtained from the estimation are used as the instrumental variables of D I D i t for the parameter estimation.

3.3. Interpretation of Variables and Sources

3.3.1. Interpreted Variable

The explanatory variable of this study is the regional green energy efficiency (GTFP), which is measured using the global Super-SBM method. The detailed process of model establishment is as follows:
Model 6:
M i n δ = 1 + 1 m i = 1 m S i k X i k 1 1 S i = 1 s S r y r k S . t . j = 1 , j k n λ j x i j s i x i k j = 1 , j k n λ j x j + s i + y i k j = 1 , j k n λ j = 1 λ j , s i s i + 0
(1)
Model Establishment
In order to better align with the practical demands for evaluating resource allocation efficiency, this study draws upon the research of Li Chunpeng et al. to design a non-orientated global Super-SBM model [73]. The core concept of this model is structured around the following framework: a system comprising n decision-making units (DMUs), each constituted by p types of input factors and q types of output factors. Within this framework, X = X i k and Y = Y i k respectively denote the input and output vectors for each sample, while θ serves as the objective function value, directly reflecting the level of resource allocation efficiency. Furthermore, X i r ( i = 1 , , p ) and Y i r ( r = 1 , , q ) correspond to specific elements within the input vector X and output vector Y, respectively. In the model, λ represents the column vector of decision variables, while S i and S i + symbolize the slack variables on the input and output sides, respectively.
Based on the aforementioned concepts, the specific mathematical expression of the non-orientated Super-SBM model is as follows:
Assuming there are n projects, each is characterized by m input variables and s output variables, represented by x and y, respectively, where s denotes the slack variable and λ signifies the weight. The aforementioned model allows for the computation of the efficiency value δ of the Super-SBM.
(2)
Classification Indicators of the Super-SBM Model
The classification indicators for the input–output of the Super-SBM decision-making units are detailed in Table 1. Here, x i j indicates the input indicator of the i-th type corresponding to the j-th decision-making unit, while y r j denotes the output indicator of the r-th type for the j-th decision-making unit. The vector v i represents the weight coefficients for the i-th type of input, reflecting the degree of influence that input indicators exert on efficiency, and u r represents the weight coefficients for the r-th type of output, indicating the impact of output indicators on efficiency. Additionally, the following conditions must hold: x r j > 0 , y r j > 0 , v i 0 , u r 0 , I = 1, 2,…, m; r = 1, 2,…, s; j = 1, 2,…, n.
(3)
Analysis of Input Redundancy and Output Insufficiency
When a decision-making unit is in a non-DEA efficient state, it may encounter issues of input redundancy or output insufficiency.
From the perspective of inputs, when a decision-making unit faces input redundancy, it should aim to reduce resource input Δ X i while maintaining output levels as much as possible. Assuming the solutions to the model are represented by S i , S i + , and θ i with inputs and outputs constituted by ( X ~ l , Y ~ l ) being efficient.
X ~ l = θ i X i S i
In Equation (7), ( X ~ l , Y ~ l ) signifies the projection of the j-th decision-making unit relative to ( X i , Y i ) on the efficient frontier of the DEA model. The calculation formula for Δ X i and the input redundancy rate is as follows:
Δ X i = X i X ~ l = ( 1 θ i ) X i S i
From the perspective of output, when a decision-making unit experiences output insufficiency, it should strive to increase resource output Δ Y while maintaining input levels as much as possible. Assuming the solutions to the model are represented by S 0 , S 0 + , and θ 0 with inputs and outputs constituted by X 0 ^ , Y 0 ^ being efficient.
Y ~ 0 = Y 0 S 0 +
In Equation (9), X 0 ^ , Y 0 ^ signifies the projection of the j-th decision-making unit relative to ( X 0 , Y 0 ) on the efficient frontier of the DEA model. The calculation formula for Δ Y and the output insufficiency rate is as follows:
Δ Y 0 = Y 0 Y 0 ~
It is clear that when a decision-making unit is in a non-DEA efficient state, a comparative analysis with DEA-efficient decision-making units can be conducted. This enables a reduction in resource inputs while ensuring that output does not decline, or alternatively, it facilitates the calculation of adjustment amounts for various output indicators, while keeping resource inputs fixed.
Based on the above analysis, we selected the input and output factors for green energy efficiency, as shown in Table 2 (of which the stock of fixed assets is obtained using the perpetual inventory method of calculation), to measure GTFP.

3.3.2. Interpreted Variable

The interpreted variable of the study is the regional breakthrough innovation strategy-driven ecosystem suitability transformation of high-tech industry innovation ecosystems (Fit × DID), which is expressed as the product of the ecosystem suitability of the high-tech industry innovation ecosystem (Fit) and the policy variable of the regional breakthrough innovation change strategy (DID).
In China, the first and second rounds of regional breakthrough innovation change strategies started in 2015 and 2021, respectively, so the test provinces during the policy implementation period are regarded as the disposal group (DID = 1), and the rest as the control group (DID = 0). Among them, the 13 test areas in the second round of regional breakthrough innovation and change strategies are all provincial-level regions, but three of the 10 test areas in the first round are prefecture-level cities (Xi’an, Shenyang, and Wuhan). Since spatial double-difference modeling needs to take into account the spatial dependence of geographic units, Xi’an, Shenyang, and Wuhan, which are located in Shaanxi, Liaoning, and Hubei, were excluded from the full sample directly, as in the case of Wang, Xin, and Du [72]. Excluding Shaanxi, Liaoning, and Hubei, where Xi’an, Shenyang, and Wuhan are located, from the full sample would lead to estimation bias because the spatial dependence of other regions on these three provinces is not taken into account, but grouping the three provinces into a control group would ignore the radiation-driven role of Xi’an, Shenyang, and Wuhan in the province’s territory due to the effect of the “strong provincial capitals.” In addition, because the Programme intends to “strive to make efforts through three years”, most of the literature has set the period of the first round of experimentation as 2015–2018, and the examination period of the corresponding studies also stops at 2018, which results in a lack of timeliness, and, after 2018, the pilot regions have various regional breakthrough innovation strategy measures, systems, and models, which have been shaped and continue to play effective roles, and there are policy advantages compared with other regions, so 2018–2020 can be included in the processing time of the first round of regional breakthrough innovation and change strategies. In addition, this study also adopts a compromise strategy, i.e., the samples of Shaanxi, Liaoning, and Hubei are excluded from the robustness test, the sample data of 2019 and beyond are excluded, and the empirical results are considered reliable if the parameter estimates are consistent with the full sample condition.
Fit and its sub-indicators are measured by constructing an indicator system, as shown in Table 3, using the entropy method, and this study sets five secondary indicators based on the theoretical mechanism, such as innovation main body, innovation resources, the innovation environment, innovation support, and innovation vitality [74,75]. The tertiary indicators under each category are delineated as follows:
(1)
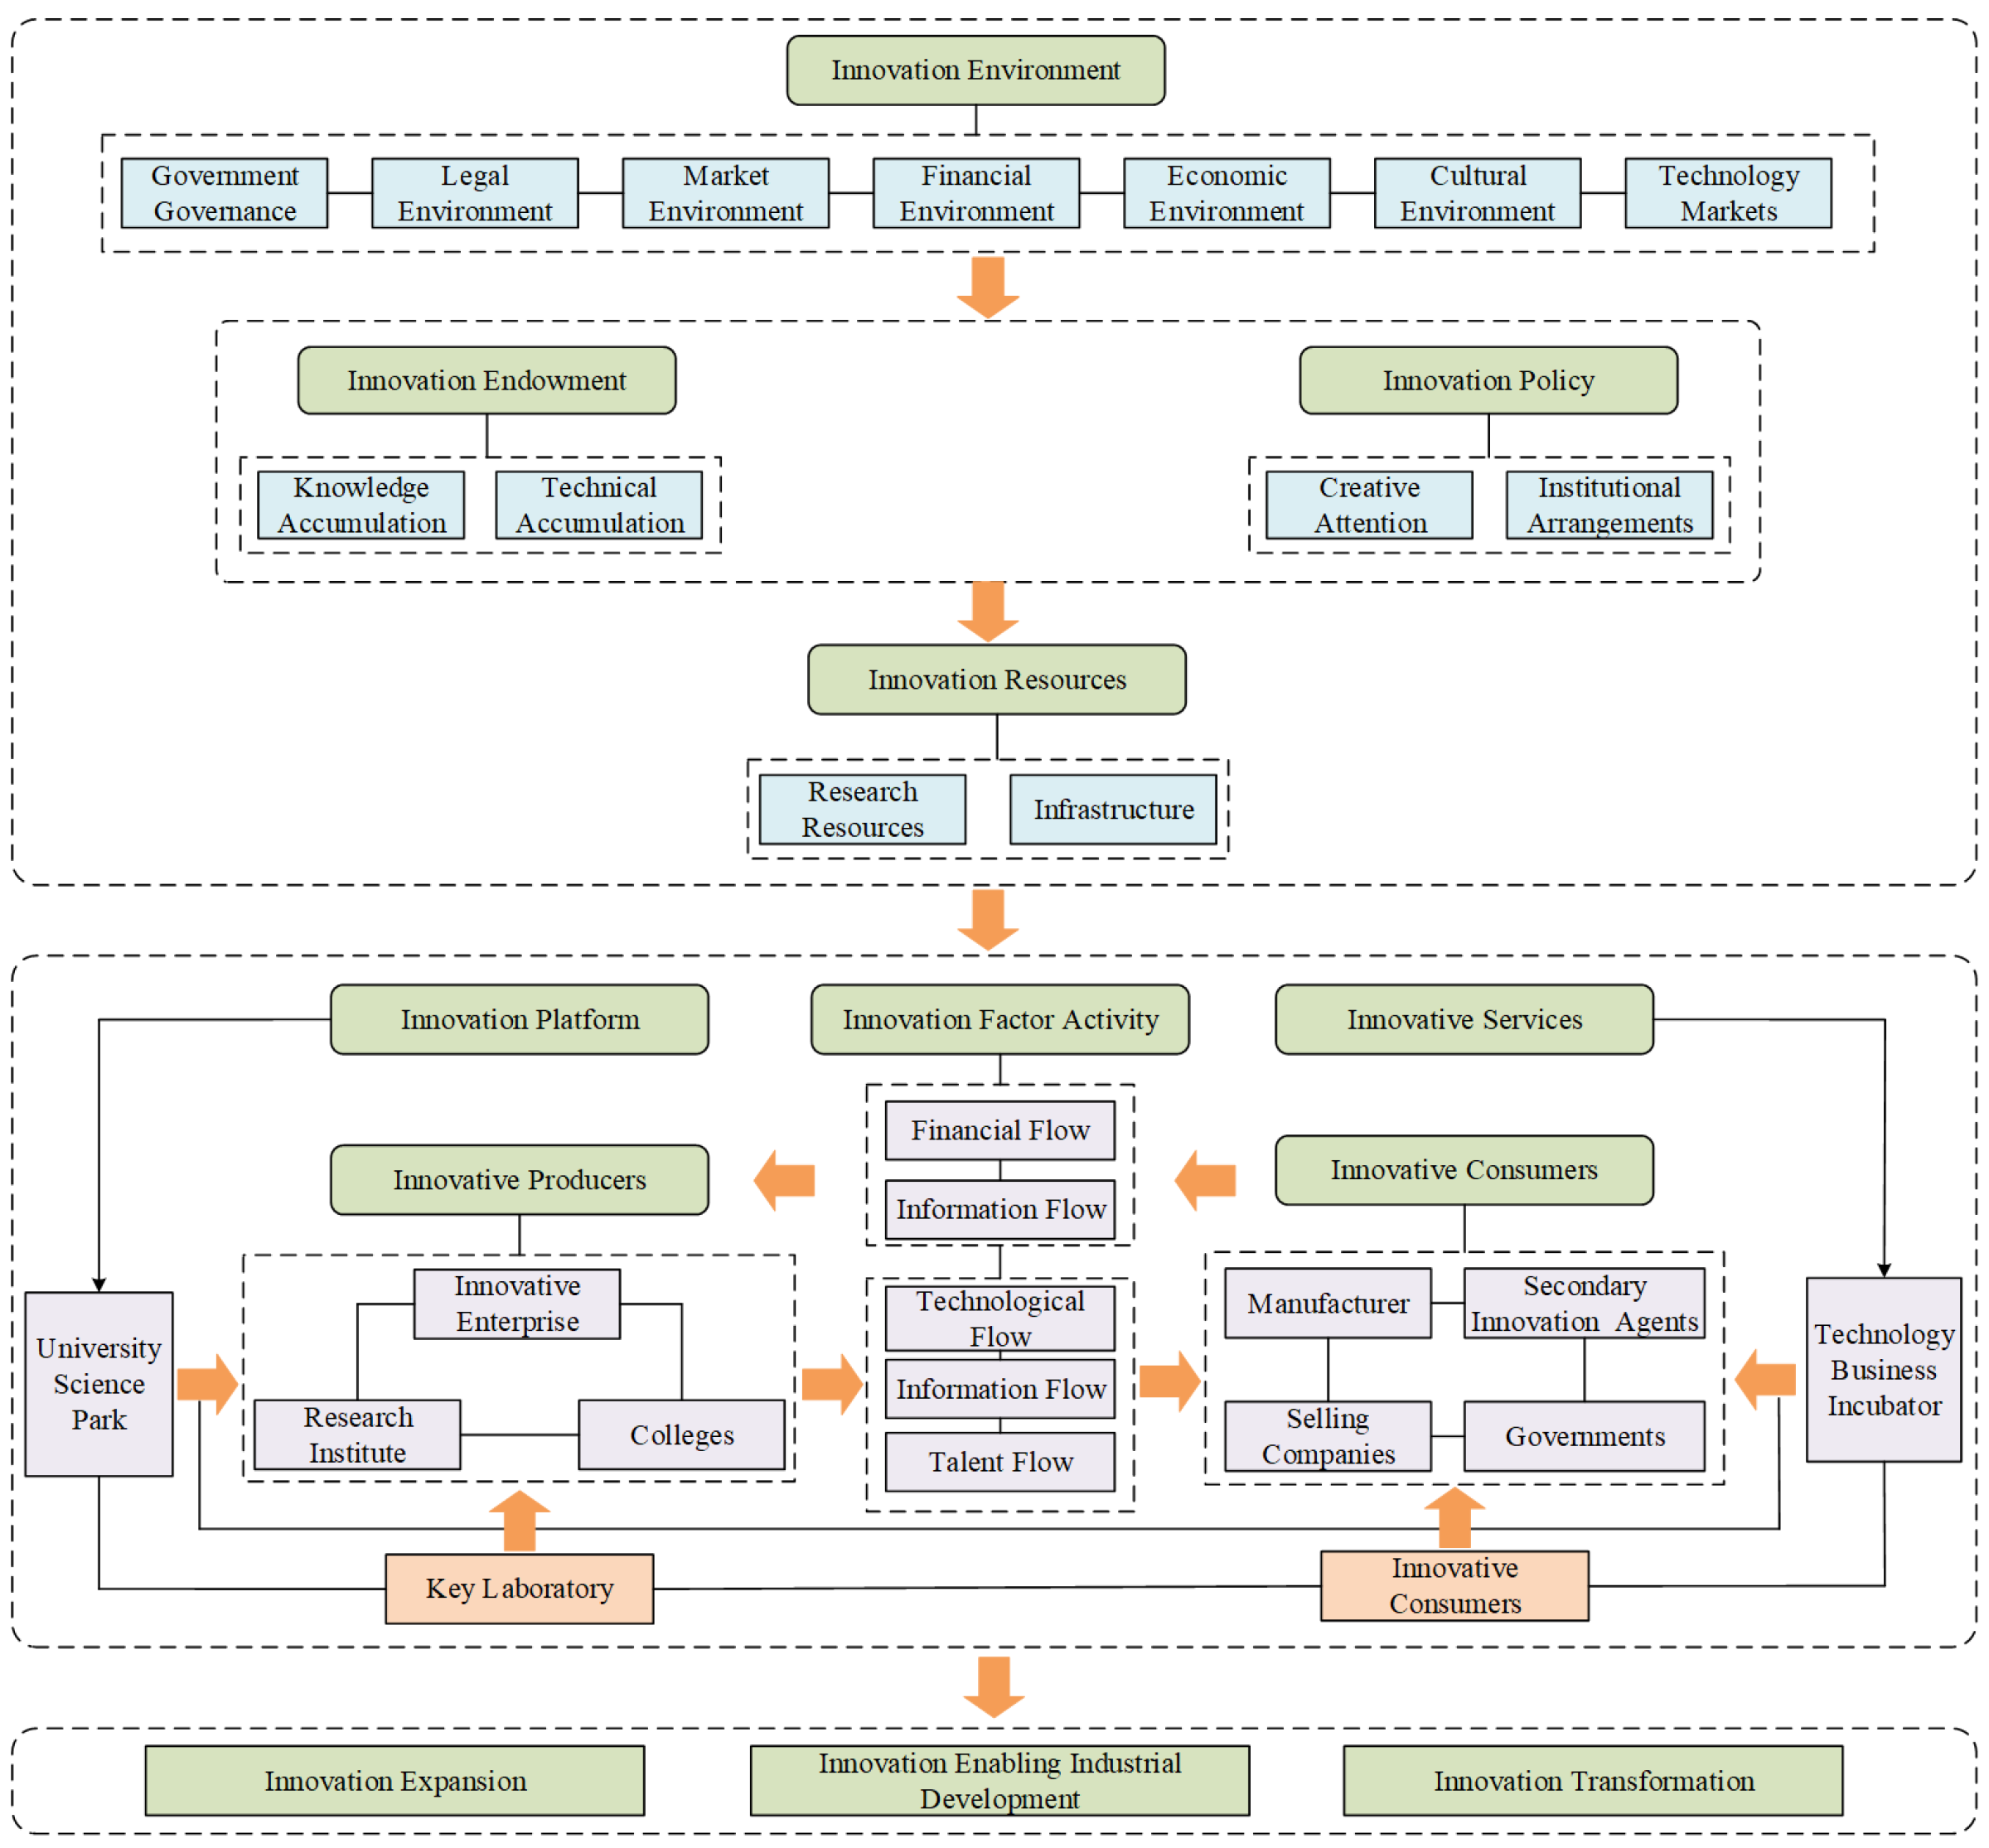
Subject of Innovation (Sub): Innovation producers, such as enterprises, universities, and research institutions, are the creators and disseminators of new knowledge, technologies, and products, driving the expansion of technological frontiers and industrial upgrades through research and development activities. Conversely, innovation consumers, including end users and downstream enterprises, are the recipients and applicators of innovative outcomes, with their demands significantly influencing the direction of innovation activities [76]. Therefore, this study defines two tertiary indicators—innovation producers and innovation consumers—to concretely represent subject of innovation.
(2)
Innovation Support (Sur): Innovation platforms serve as critical vehicles for resource integration and sharing; they encompass research platforms, technology transfer platforms, and innovation incubators. The construction quality and service efficacy of these platforms directly impact the efficiency and quality of innovation activities. Innovation services cover various aspects, including policy consultation, financing support, and talent training, providing comprehensive assistance to innovation entities. Innovation endowments refer to the inherent advantages, such as natural conditions, economic foundations, and cultural legacies within a region that facilitate innovation activities. Innovation policies are crucial instruments for guiding and supporting innovation activities, with their formulation and implementation directly affecting the enthusiasm of innovation entities and the sustainability of innovation endeavors [77]. Hence, this study incorporates three tertiary indicators—innovation platforms, innovation services, innovation endowments, and innovation policies—to specifically characterize innovation support.
(3)
Innovation Vitality (Vit): Innovation expansion represents the scale and domain growth of innovation activities, serving as a vital expression of innovation vitality. Innovation transformation refers to the process by which innovative outcomes transition from laboratories to markets, with its efficiency directly influencing the economic benefits and social value of innovations. The role of innovation in enabling industrial development pertains to its capacity to drive industry upgrades and transformations. Through the application and promotion of new technologies and products, innovation can empower traditional industries, steering them towards higher-end and intelligent development. The activity of innovation factors reflects the flow and collaboration of innovation resources and entities within innovation activities [78]. Consequently, this study defines five tertiary indicators—innovation expansion, innovation transformation, innovation enabling industrial development, and the activity of innovation factors—to thoroughly represent innovation vitality.
(4)
Innovation Resources (Res): Research and development resources are the core driving forces behind innovation activities, with the quality and quantity of human knowledge and technological resources directly impacting the efficiency and outcome quality of innovation endeavors. Physical infrastructure also constitutes a significant material foundation for the smooth conduct of innovation activities, providing essential conditions and technical support for innovation entities [79]. Thus, this study introduces two tertiary indicators—R&D resources and facility resources—to specifically represent innovation resources.
(5)
Innovation Environment (Env): The governance environment reflects the government’s capacity and efficiency in formulating, implementing, and supervising innovation policies, playing a dominant role in the successful execution of innovation activities. The legal environment encompasses the construction of laws and regulations pertaining to intellectual property protection, antitrust measures, and fair competition, thereby providing legal support and assurance for innovation activities. The market environment facilitates the optimization and efficient utilization of innovation resources through market mechanisms. The financial environment signifies the extent and efficiency of support from capital markets and venture investments for innovation activities. The economic environment embodies factors such as the regional economic development level, industrial structure, and economic growth potential, which underpin innovation activities. The cultural environment profoundly influences innovation endeavors by shaping an innovative atmosphere and inspiring innovative spirit, including aspects like innovation culture and conceptual frameworks. Lastly, the technological market environment focuses on the maturity of the technological market, the activity level of technology transactions, and the efficiency of technology transfers, thereby offering technical support for the conversion and application of innovative outcomes [80]. Accordingly, this study establishes seven tertiary indicators—governance environment, legal environment, market environment, financial environment, economic environment, cultural environment, and technological market environment—to comprehensively represent the innovation environment.
Among the specific proxy variables, this study performed a search for 121 innovation-related words, such as “artificial intelligence”, “innovation”, “big data”, and so on, in local government work reports from 2009 to 2021 year by year and measured the word frequency of these words. The word frequencies of 121 innovation-related words, such as “artificial intelligence”, “innovation”, “big data”, etc., were measured, and the ratio of the word frequency of these words to the total word frequency of the government work report was measured to characterize the government’s attention to innovation. Meanwhile, the word frequencies of “deep learning”, “machine learning”, “blockchain”, “machine learning”, etc., were searched on the Baidu advanced search webpage and for each province from 2009 to 2021. Meanwhile, in the Baidu advanced search and search on the webpage of each province from 2009 to 2021, the word frequencies of 57 keywords, such as “deep learning”, “machine learning”, “blockchain”, etc., were used as the proxy indicators of the development of the local service industry and emerging industry. Among them, Figure 1 shows the schematic diagram of the ecological niche suitability transition of high-tech industry innovation ecosystems.

3.3.3. Mechanism Variables

Based on the theoretical mechanism, this study takes the index of the advanced industrial structure (AIS) and the rationalization index (RIS) as mechanism variables. Among them, this study refers to the method of Xu Min and Jiang Yong [81] to measure the index of the advanced industrial structure with the following formula:
A I S i t = j = 1 3 Y i t , j Y i t     j
where Y i t represents the total output value of province i in year t, and Y i t , j represents the output value of industry j in province i in year t.
Meanwhile, this study refers to Hu Longwei et al. [82] to take the inverse of the Tel index of industrial structure rationalization as the index of industrial structure rationalization.

3.3.4. Control Variables

In this study, government size (GS), government environmental attention (ER) [83], agglomeration of employed persons in high-tech industries (AIP) [84], and agglomeration of enterprises in high-tech industries (AIE) [85] are chosen as control variables.
Government size is characterized by the ratio of local government general public budget expenditure to regional real GDP.
The environmental attention of local governments is based on the evaluation index system shown in Table 4, and the entropy value method is used for comprehensive evaluation. Among them, the attention to green development is given by the ratio of word frequency to the total word frequency of the theme words related to green development (including 94 theme words such as “environmental protection”, “ecology”, “afforestation”, “river chief system”, etc.) in the work reports of the local governments from 2009 to 2021 [86]. The intensity of the “five-in-one” ecological civilization layout is given by the ratio of the word frequency of the word “ecology” to the total word frequency of the five words “economy”, “society”, “politics”, “culture”, and “ecology” in government work reports [87]. The intensity of environmental governance and the intensity of environmental infrastructure construction are given by the proportion of fiscal expenditure on environmental pollution control and the proportion of environmental infrastructure investment in GDP, respectively [88]. The regional legislation on ecological civilization construction is given by the ratio of the number of ecological environment-related local legislations to the total number of local legislations obtained from the search of Beida Faber.
The clustering of employed personnel in high-tech industries and the clustering of enterprises in high-tech industries are measured using the improved location entropy measurement method of Wang Yan et al. [89], and the measurement formulas are as follows:
A I P i t = p i t / l i t P t / L t
A I E i t = e i t / l i t E t / L t
where l i t is the total employment in region i in year t, and L t is the national employment in year t; p i t and e i t are the employment and number of firms in the high-tech industry in region i in year t, respectively; and P t and E t are the employment and number of firms in the high-tech industry in the country in year t, respectively.

3.3.5. Spatial Weighting Matrix

The spatial weight matrix can be used to characterize the dependencies between the geographic units on which the parameter estimates of the spatial double difference model are based [90], and in this quasi-natural experiment, this study uses economic spatial weights (e.g., Equation (14)).
W = 1 W 12 W 21 1 W 1 N W 2 N W N 1 W N 2 1 ,
W i θ = 1 | y i y θ |             i θ           1               i = θ  
In Equation (14), W is the economic spatial weight matrix, W i θ is an element in W, and y i and y θ are the average annual real GDP of cities i and θ, respectively, over the period 2000–2021.

3.3.6. Data Sources

The above data were obtained from statistical information such as the China Statistical Yearbook, China Science and Technology Statistical Yearbook, China High-Tech Industry Statistical Yearbook, China Torch Statistical Yearbook, etc., and the provincial data of the 30 provinces in the mainland (except Tibet) in the EPS database and Beida Fabulous, in addition to the data obtained from government work reports and the word frequency statistics from webpage text searches by Python and analyzed through semantic analysis of natural text recognition, and the data were examined from 2009 to 2021.
Figure 2 illustrates the spatiotemporal distribution of green total factor productivity (GTFP) for the years 2009 (a) and 2021 (b), and the suitability of high-tech innovation ecosystems (Fit) for the years 2009 (c) and 2021 (d). As depicted in the figures, in 2009 and 2021, GTFP exhibited high levels in Heilongjiang and coastal regions, while low levels were observed in Qinghai and Tibet. Regarding Fit, China’s southeastern and coastal regions consistently maintained high levels in both years, whereas low levels persisted in Qinghai and Inner Mongolia. Notably, from 2009 to 2021, a rapid growth trend in Fit was evident in the Xinjiang region.

4. Empirical Analysis

4.1. Analysis of Spatial Double-Difference Models

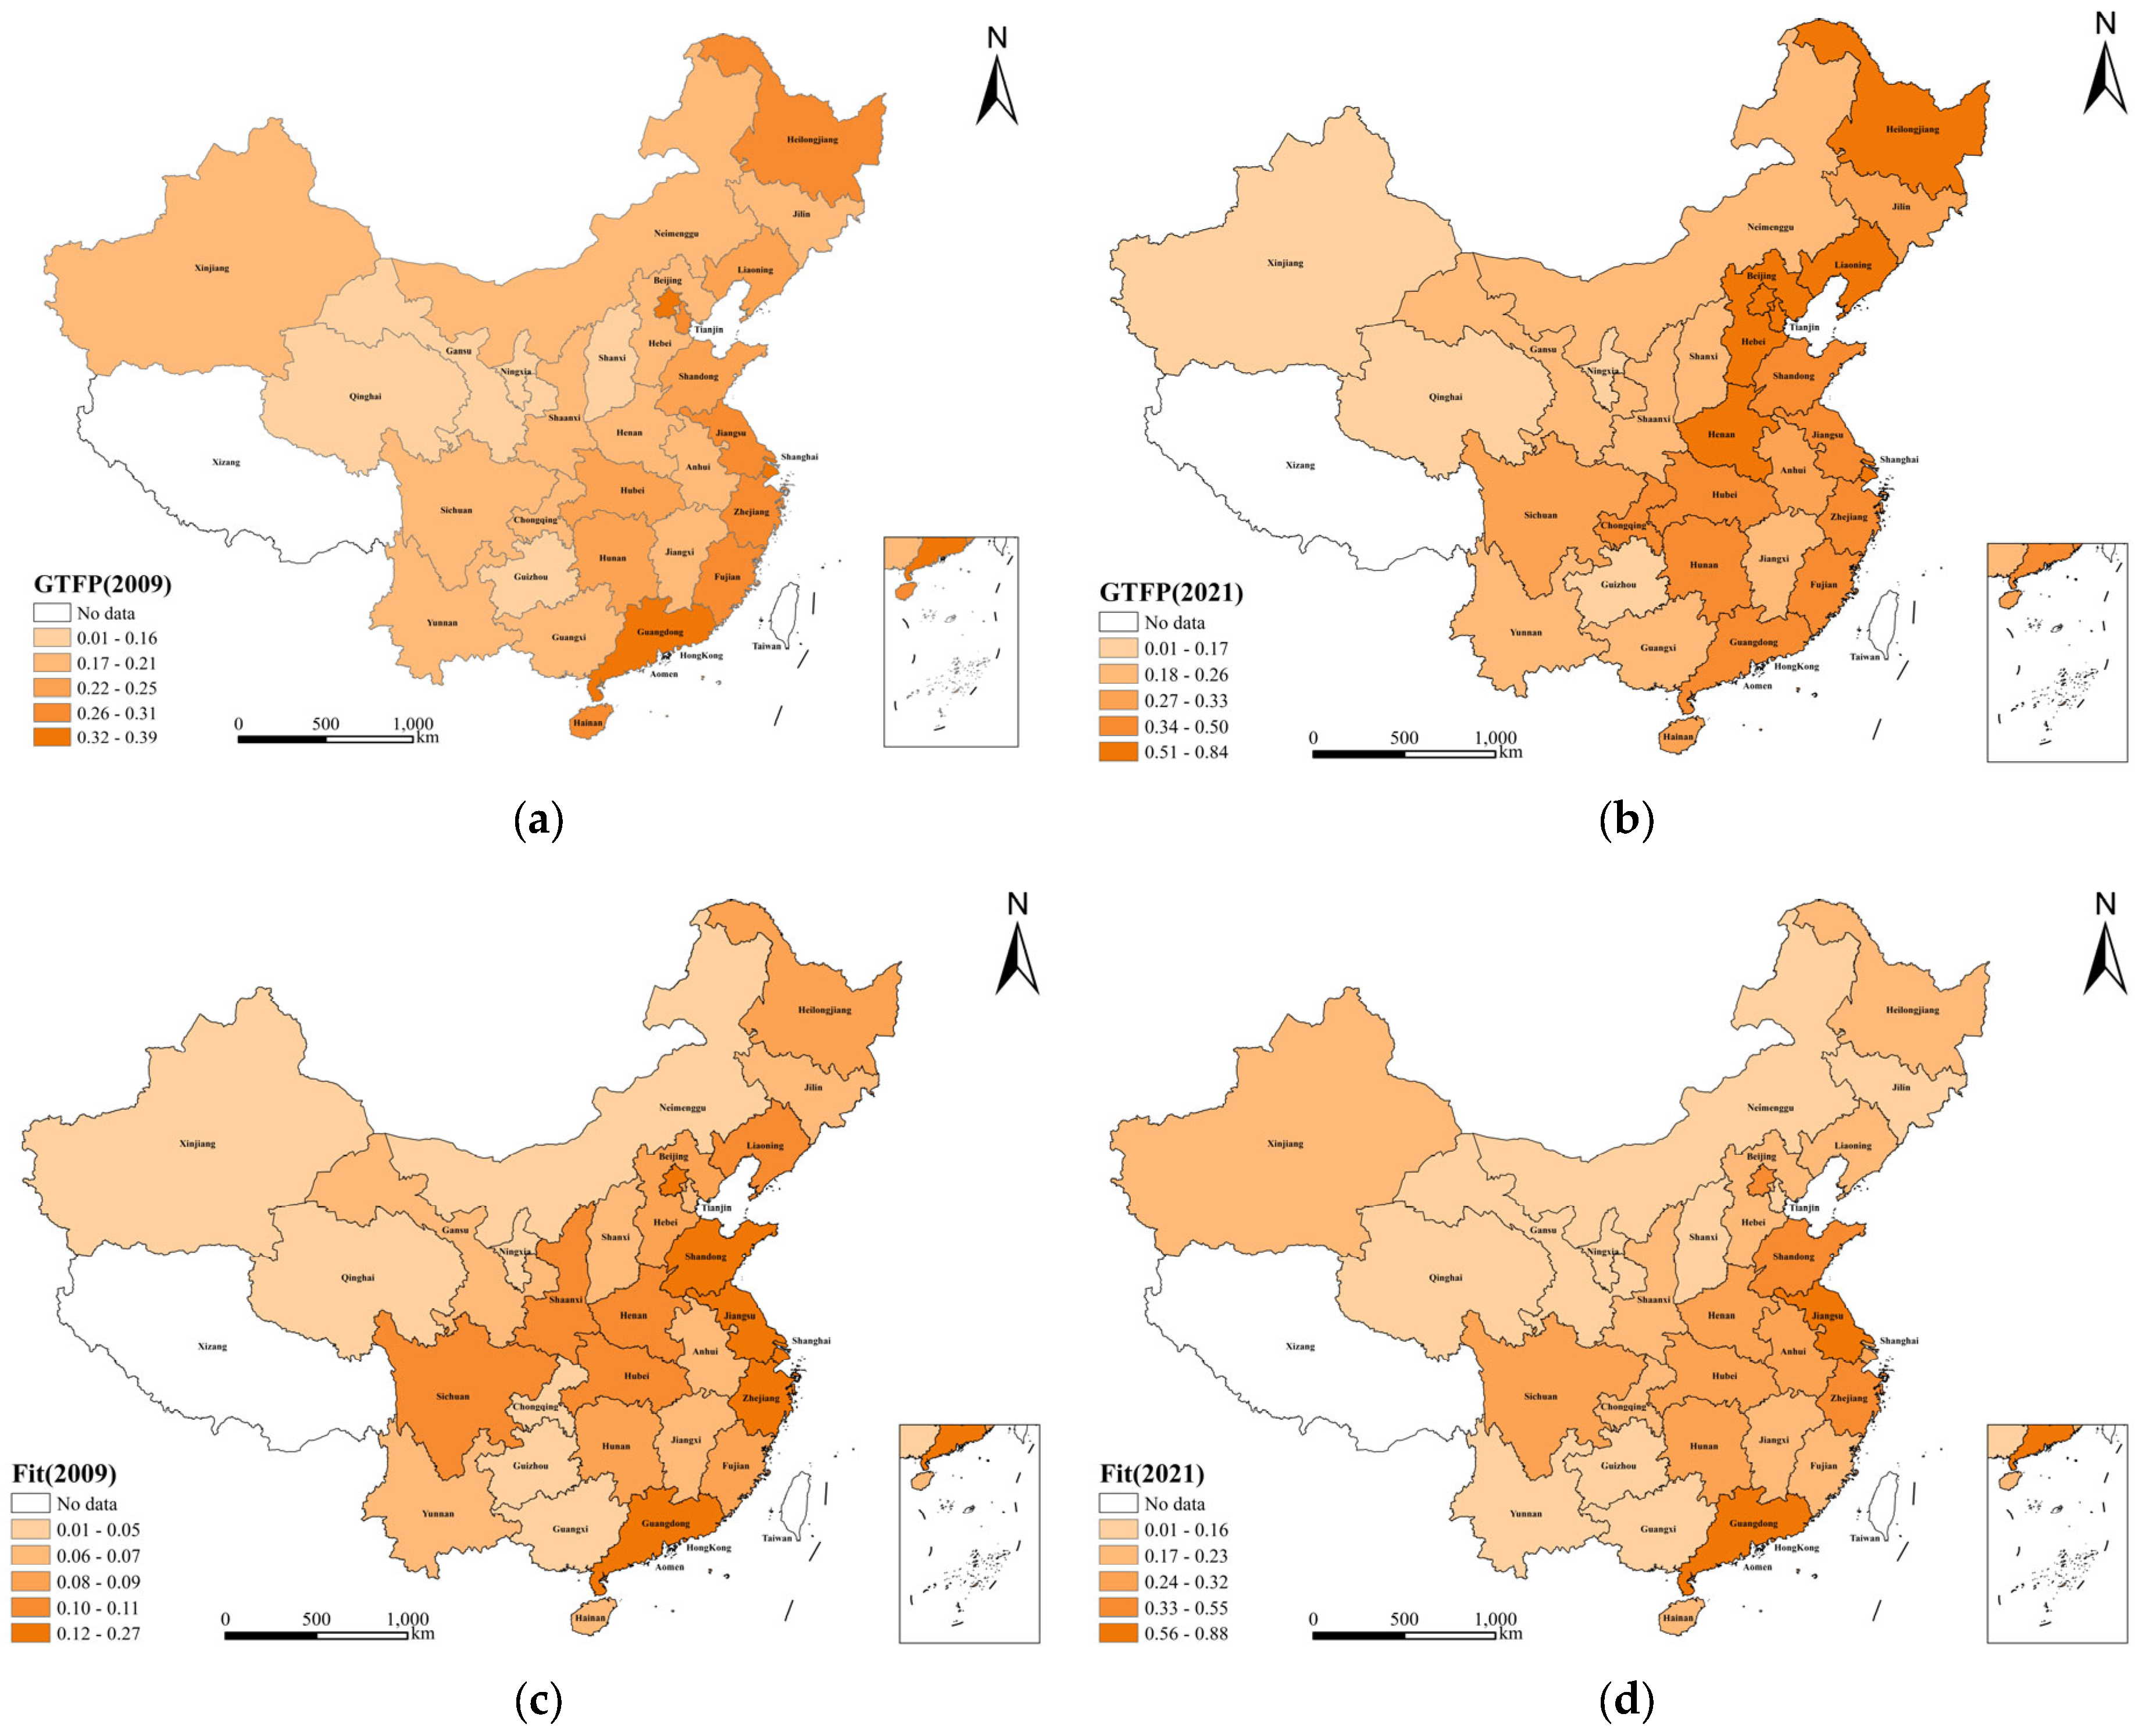
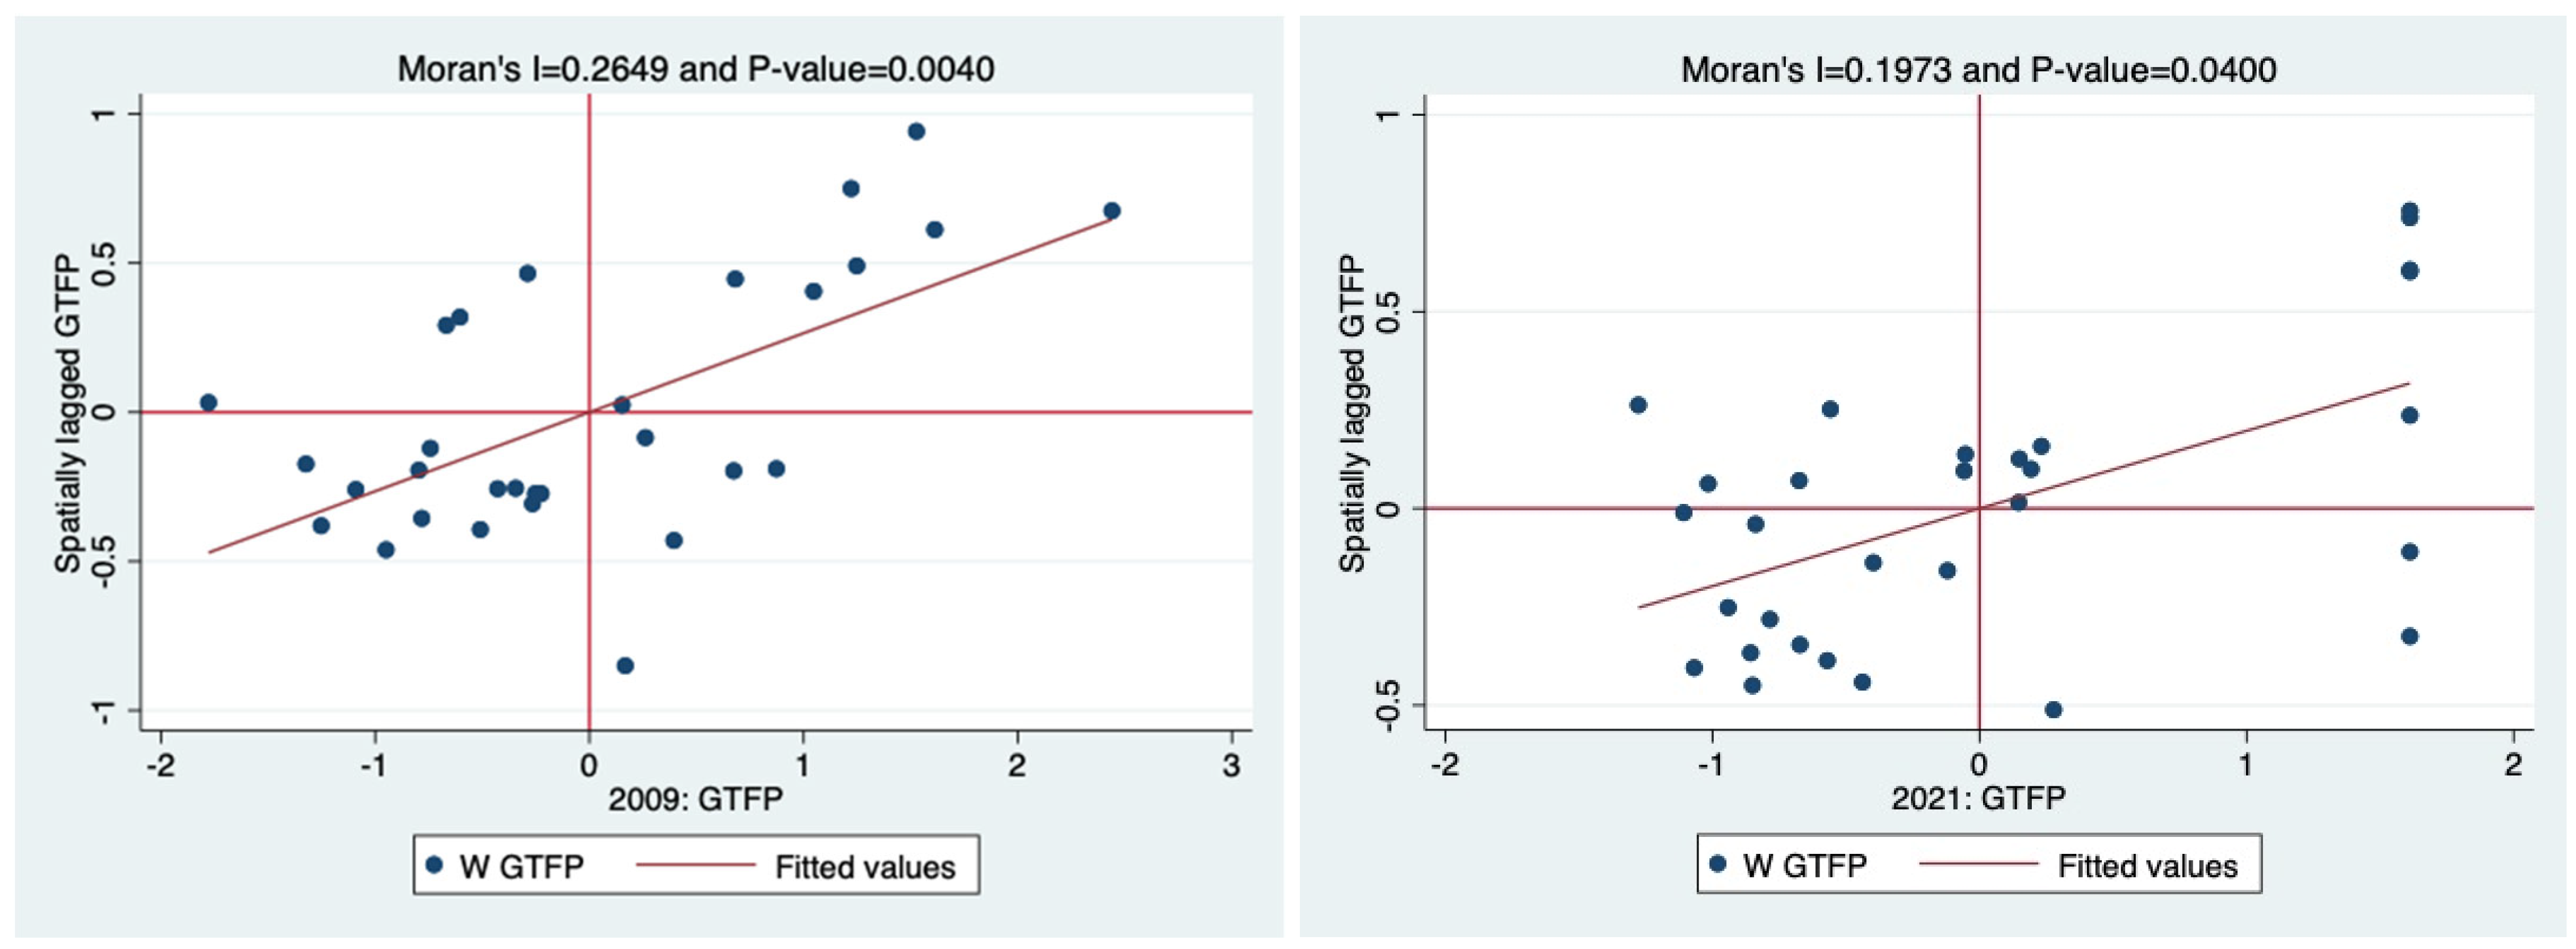
4.1.1. Spatial Autocorrelation and Model Applicability Tests

In this study, according to Moran’s I test (see Table 5 for the results), it is found that the global Moran’s I based on the economic spatial weight matrix is significantly positive for each year for the regional green energy efficiency (GTFP). Combined with Moran’s scatterplot (Figure 3 reports the localized GTFP scatterplot for 2009 and 2021), the spatial autocorrelation of “high—high agglomeration” and “low—low agglomeration” of the provincial GTFP is tested.
In addition, after LM and Robust LM tests, the parameter estimates based on the spatial error model (LM = 42.920, Robust LM = 3.246) and the spatial autoregressive model (LM = 84.586, Robust LM = 44.912) were superior to the least-squares estimation, which suggested that a general form of the two, the spatial Durbin model, should be chosen for empirical analysis. The Hausman test result (Hausman of re = 48.43) rejected the original hypothesis of not using random effects, so random effects were used. And in the post-hoc test based on the Wald test and the LR test, the spatial Durbin model did not degenerate into the spatial autoregressive model (Wald = 26.57; LR = 26.83) and the spatial error model (Wald = 44.22; LR = 47.62).

4.1.2. Spatial Double-Difference Model Parameter Estimation

As shown in Table 6, this study decomposes the parameter estimation results of the spatial double difference model into local effect and neighborhood effect, the former being the effect of the independent variable on the dependent variable in the region, and the latter being the effect of the independent variable on other provinces through the spatial weight matrix.
After parameter estimation, the coefficient of the local effect of DID × Fit is 0.239 and the coefficient of the neighborhood effect is 0.696, both of which pass the significance test of 1%, indicating that regional breakthrough innovation strategies driving the transformation of ecological suitability of the innovation ecosystems of high-tech industries can not only significantly promote the green energy efficiency of the region, but can also, through the spillover of the policy effect, have a significant and positive influence. This result verifies the mechanism hypotheses H1 and H4.
Therefore, we accept the null hypotheses H1 and H4, indicating that the policy effect and the spatial effect of the transformation of niche suitability within high-tech industry innovation ecosystems driven by regional breakthrough innovation change strategies can significantly enhance green energy efficiency.

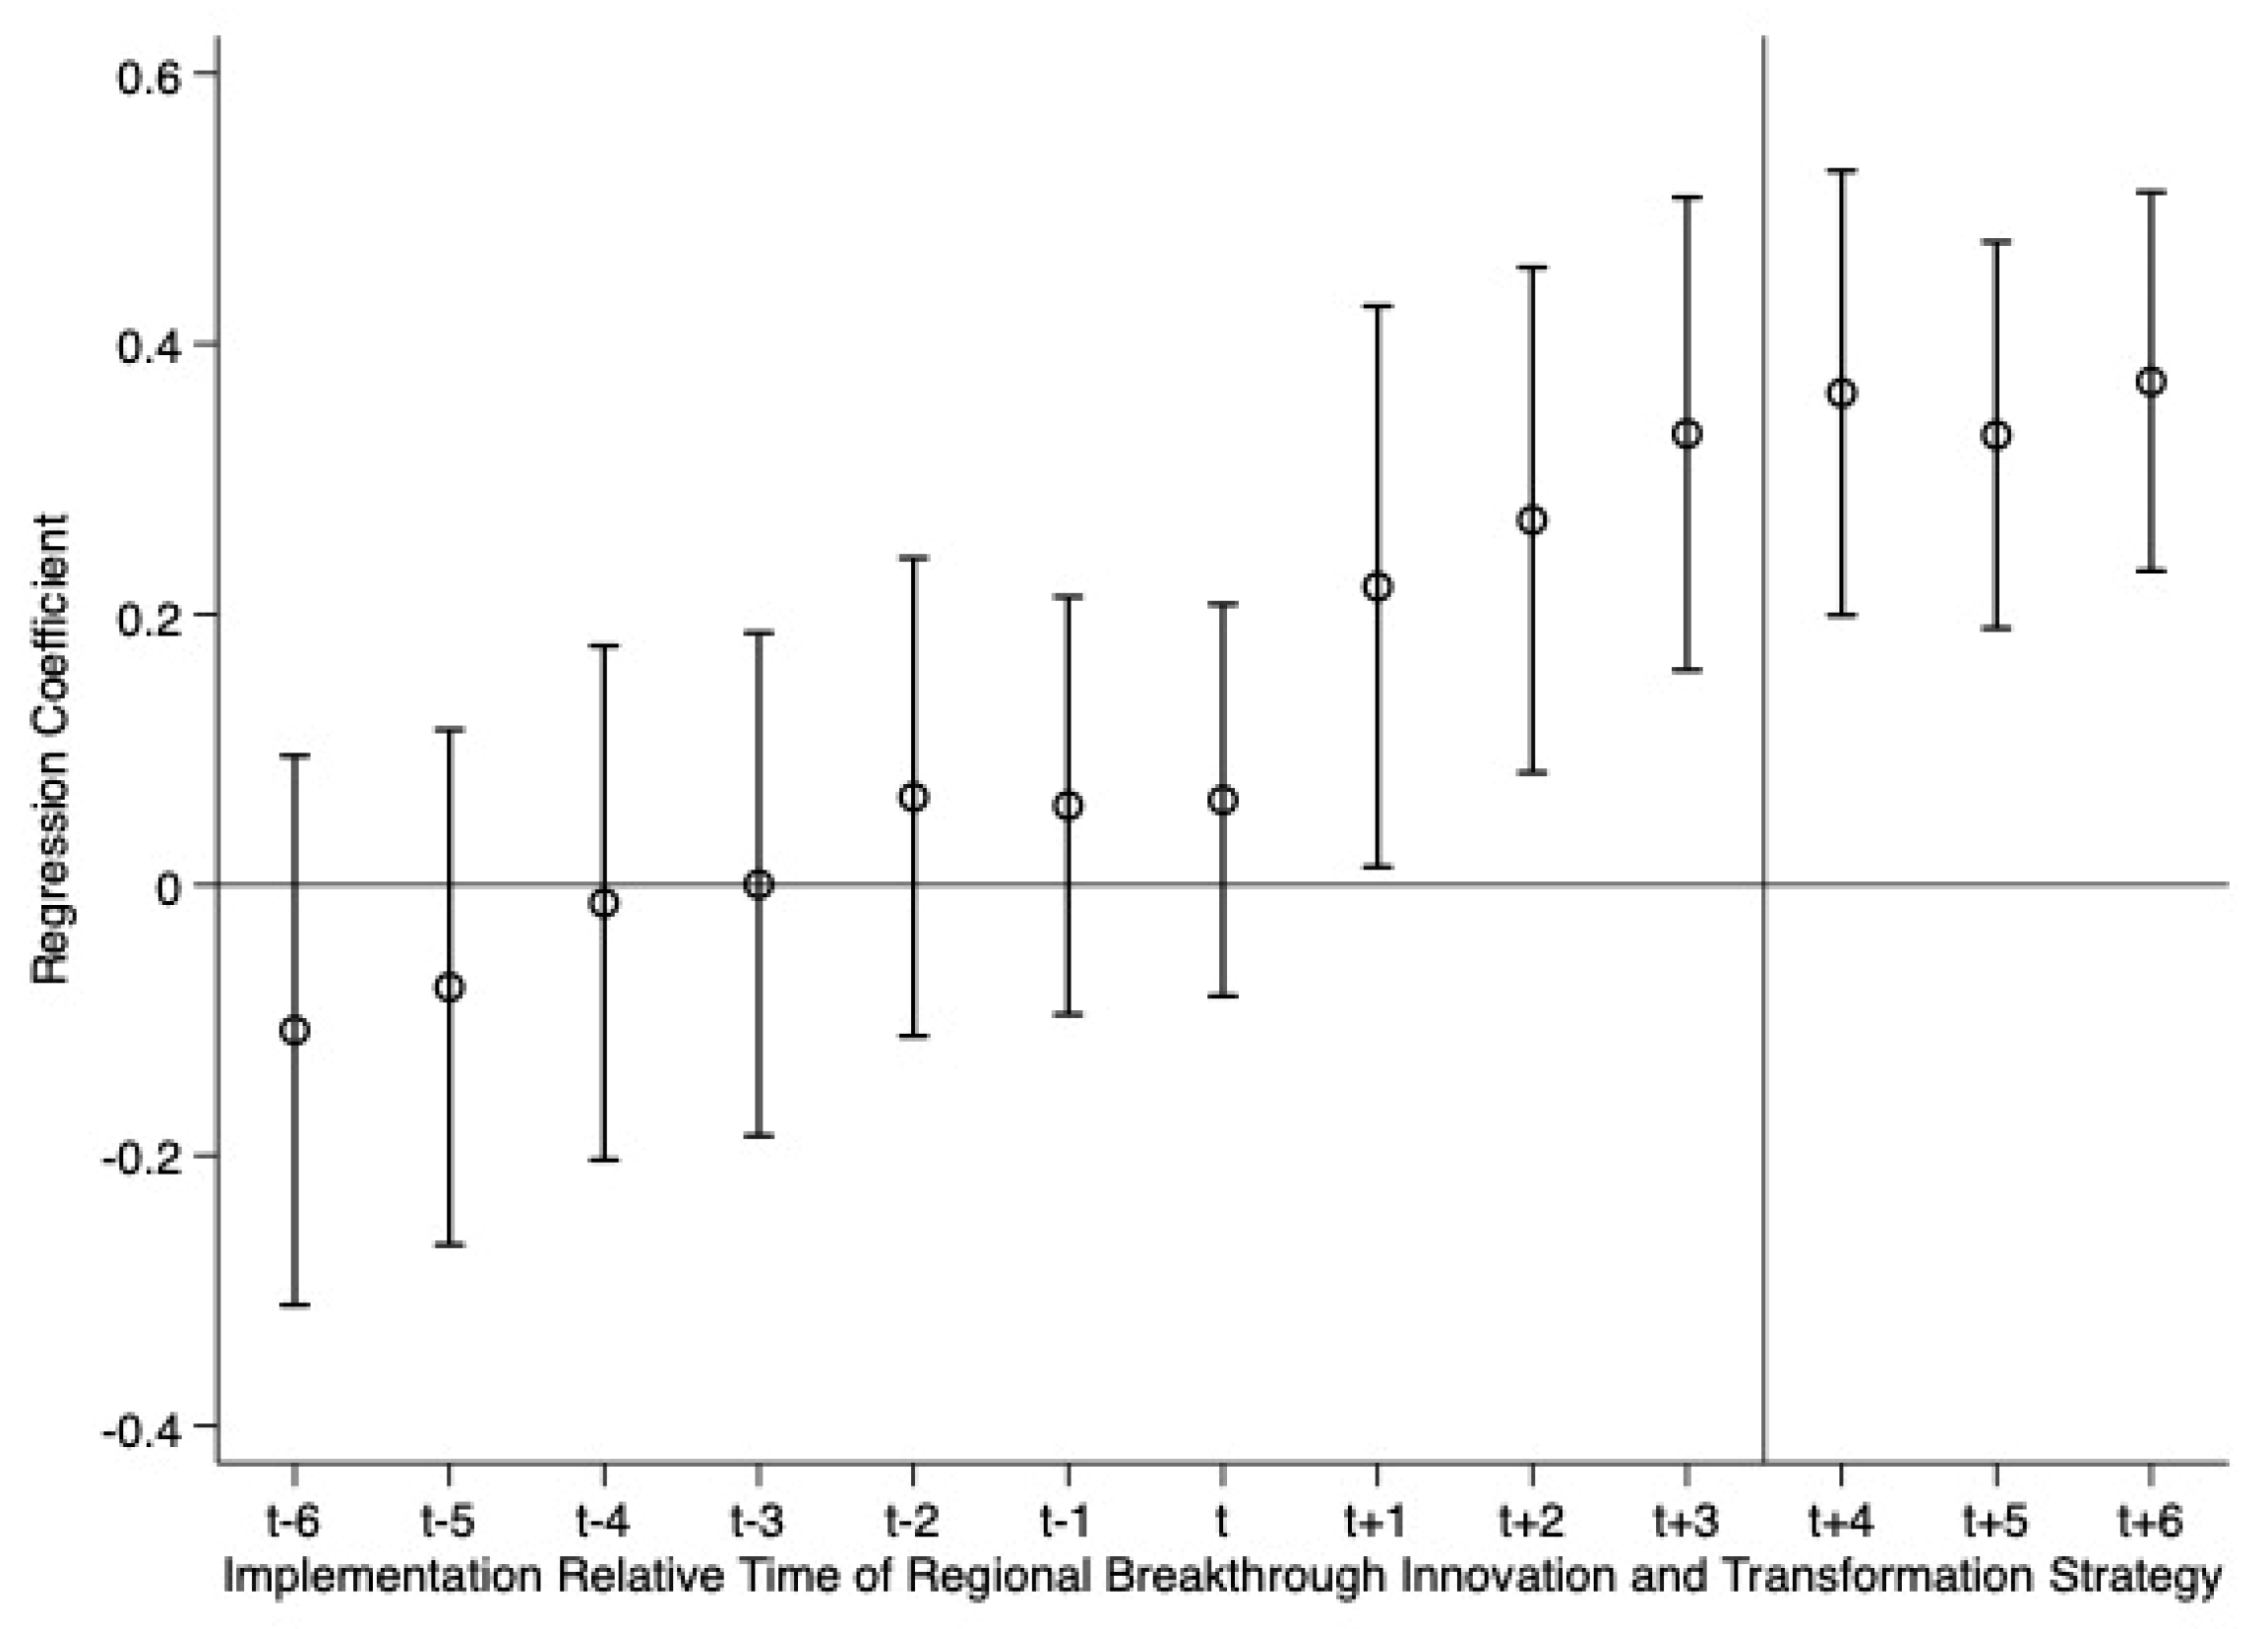
4.1.3. Parallel Trend Test

To test whether the above quasi-natural experiment was consistent with the parallel trend hypothesis of the quasi-natural experiment, this study refers to Zhu Chen et al. [91] to construct the following parallel trend test model:
G T F P i t = λ i t + θ 1 p o l i c y i ( t 11 ) × F i t i t + θ 2 p o l i c y i ( t 10 ) × F i t i t + + θ 6 p o l i c y i t × F i t i t + + θ 11 p o l i c y i ( t + 5 ) × F i t i t + θ 12 p o l i c y i ( t + 6 ) × F i t i t + β X i t + γ t + u i + ε i t
In Equation (15), p o l i c y i ( t ± n ) is a dummy variable for n years before and after the implementation of the regional breakthrough innovation strategy in region i, respectively. If the regression coefficient of p o l i c y i ( t n ) is not significant and the coefficient of p o l i c y i ( t n ) is significant, it means that there are parallel trends in the disposal group and the control group before the implementation of the policy, and the policy has a good policy effect after the implementation of the policy. We used stata17 software to conduct parallel trend test, and the results are shown in Figure 4. Figure 4 shows the parallel trend test p o l i c y i ( t n ) regression coefficient changes, and it can be seen that the quasi-natural experimental design of this study passed the parallel trend test.

4.2. Mechanism Analysis Based on Dual Machine Learning

4.2.1. Analysis of Mechanisms of Regional Breakthrough Innovation Strategies Driving Suitability Transformation

To validate H2, this study refers to He Jinan et al. [72], who tested the mediation effect paths of “DIDFitGTFP” with Fit composite indicator as the mediating variable and “DIDSubGTFP” based on dual machine learning models and the four mediated effect paths “DIDSubGTFP”, “GTFPSurGTFP”, “DIDVitGTFP”, “DIDResGTFP”, and “DIDEnvGTFP” with the Fit sub-indicator as the mediating variable (Model 4).
In the process of parameter estimation, this study uses a dual machine learning model based on the random forest algorithm and a sample split ratio of 1:4 as the parameter estimation model, and the results are reported in Table 7.
After parameter estimation and Sobel, Aroian, and Goodman tests, the above six paths of mediation effect are all valid, indicating that the regional breakthrough innovation change strategy can positively influence regional green energy efficiency by driving the ecological suitability of the innovation ecosystems of high-tech industries (mediator accounted for 45.0%) and its sub-indicators of the innovation body (mediator accounted for 11.7%), innovation support (mediator accounted for 36.8%), innovation vitality (mediator ratio 28.4%), innovation resources (mediator ratio 15.2%), and the innovation environment (mediator ratio 53.8%) have a positive effect on regional green energy efficiency. The results of this parameter estimation indicate that the mechanism hypotheses H2(a–e) are correct. Therefore, we accept the null Hypothesis H2, indicating that regional breakthrough innovation strategies significantly enhance regional green energy efficiency by promoting the expansion and upgrading of subjects of innovation, strengthening innovation support, stimulating innovation vitality, optimizing the supply of innovation resources, and transforming the innovation environment.

4.2.2. Robustness Check

(1)
Eliminate interfering samples
Based on the experimental design of the previous study, this study needed to eliminate the sample data from 2019 and later and the samples of Shaanxi, Liaoning, and Hubei provinces and re-perform the parameter estimation, as in Table 7 (the results are shown in Table 8), the results were the same as the conclusions obtained in the previous study, which indicated that the this study has robustness.
(2)
Change the sample split ratio
In this study, the sample split ratio was changed from the original 1:4 to 1:7 and 1:3, and the adjusted parameter estimation results were consistent with the conclusions obtained in the previous study, which verified the robustness of the study.
(3)
Replacement of machine learning algorithms
In this study, the random forest algorithm was replaced with a neural network and gradient boosting tree, and the empirical results after adjustment were consistent with the conclusions of the previous study, which proved the robustness of the research in this study again.
The results indicate that whether by excluding outlier samples, altering the sample partition ratios, or substituting different machine learning algorithms, the adjusted empirical findings remain largely consistent with the model estimation results presented earlier, thereby further validating the robustness of the research.

4.2.3. Extended Analyses: Tests of Group Mediation Effect Mechanisms

To verify what kind of policy effects regional breakthrough innovation change strategies can have on the disposal and control groups, respectively, this study refers to Farbmacher et al. [92], and conducts a lasso regression-based double machine learning group mediated effect mechanism test via the medMDL function in the causalweight package of R language, and the results are reported in Table 9.
According to Table 9, the direct and indirect effects of the five mediating mechanism pathways “DID → Fit → GTFP”, “GTFP → Sur → GTFP”, “DID → Vit → GTFP”, “DID → Res → GTFP”, and “DID → Env → GTFP” for the disposal group and the control group are both significantly positive, indicating that the current regional breakthrough innovation strategies can empower both the disposal group and the control group with innovation support, innovation vigor, and vitality. It shows that the current regional breakthrough innovation strategies can simultaneously empower the disposal group and the control group with innovation support, innovation vitality, innovation resources, and innovation environment to play a positive role in enhancing green energy efficiency, promote innovation-driven connotative growth, and enhance the level of industrial energy use.
The indirect effect of the mediating mechanism path “DID → Sub → GTFP” on the disposal and control groups is negative and insignificant, which may be due to the fact that the regional breakthrough innovation and change strategies are pilot test policies that need to be accepted in the short term. In order to obtain more innovation outputs and better performance data in the short term, local government will ignore environmentally friendly and resource-saving high-tech industries with immature technology conditions, long cycle times, high risk, and insignificant short-term results, and focus on innovation in basic research and on traditional industries with mature technology and marginal innovation in applied technology, which strengthens the path dependence and is not conducive to the diversity of innovation subjects, resulting in the inability of regional breakthrough innovation and change strategies to drive innovation subjects to generate a significant and indirect transmission mechanism for regional green energy efficiency.

4.2.4. Test of the Mechanism Effect of Industrial Structure Optimization

To verify H3, this study takes DID × Fit as the explanatory variable, and the advanced industrial structure (AIS) and rationalization (RIS) as the mediating variables, and tests the two mediating mechanism paths of “DID × FitAISGTFP” and “DID × FitRISGTFP”, and the results of the test and parameter estimations are shown in Table 10.
After Sobel, Aroian, and Goodman tests, both mediating mechanism paths are valid, indicating that both regional breakthrough innovation strategies driving high-tech industrial innovation ecosystem suitability can promote regional green energy efficiency by enhancing the advanced industrial structure (mediating share 56.0%) and rationalization (mediating share 43.3%), and H3(a,b) is proved. Therefore, we accept the null Hypothesis H3, indicating that the regional breakthrough innovation-driven transformation of ecological niche suitability of high-tech industrial innovation ecosystems can significantly promote regional green energy efficiency by improving the advanced evolution and the rationalization of industrial structure.
In summary, this study accepts all null hypotheses, confirming that hypotheses H1–H4 are validated as correct, with specific conclusions detailed in the next section.

5. Conclusions and Policy Recommendations

Based on the quasi-natural experimental analysis of spatial double-difference models and double machine learning models, this study explores the green energy efficiency effect of the ecosystem suitability transformation of regional high-tech industrial innovation ecosystems driven by regional breakthrough innovation strategies and obtains the following conclusions: (1) The ecosystem suitability transformation of high-tech industrial innovation ecosystems driven by regional breakthrough innovation strategies has a significant effect on the green energy efficiency of the region and also can drive knowledge and industrial spillover and form policy demonstrations; thus, its spatial effect on regional green energy efficiency is significantly positive. (2) From the perspective of specific mechanisms, regional breakthrough innovation change strategies can strengthen and optimize specific factors for the transformation of the ecological suitability of the innovation ecosystems of high-tech industries, such as the main body of innovation, innovation support, innovation vitality, innovation resources, innovation environment, etc., and generate a policy transmission mechanism for regional green energy efficiency. (3) In the group regression, innovation support, innovation vitality, innovation resources, and the innovation environment of the disposal group and the control group can play a significant and positive mediating role between regional breakthrough innovation change strategies and regional green energy efficiency, but the innovation body may not play a significant mediating role due to the short-term economic behaviors of governments under short-term pilot policies. (4) The ecological niche suitability transformation of high-tech industrial innovation ecosystems driven by regional breakthrough innovation strategies can empower the optimization and upgrading of industrial structure, which in turn promotes regional green energy efficiency.
Considering the current circumstances, the conclusions of this study are applicable to the context of China from 2009 to 2021, a period spanning the post-global subprime crisis era to the global pandemic of COVID-19. During this time, the Chinese government implemented large-scale industrial innovation policies to foster the development of regional high-tech industries and innovation ecosystems, thereby effectively facilitating the energy transition.
Based on these conclusions, the study makes the following policy recommendations:
(1) Summarize and promote the reform experience of the first round and promote the spillover of policy effects.
Summarize, replicate, and promote the successful models and experiences of the first round of regional breakthrough innovation and change strategies and promptly follow up the new progress of the new round of regional breakthrough innovation and change strategies. In the new round of regional breakthrough innovation and change strategies, it is necessary to assess and monitor the ecological suitability of the innovation ecosystems of high-tech industries and set it as an important assessment and acceptance target for pilot regions, in addition to promoting the exchange of administrative officials from pilot regions to serve in different places, establishing a platform for sharing the results of regional breakthrough innovation and change strategies and promoting the cross-regional scientific research of high-level colleges and universities. In addition, we should promote the exchange of administrative officials in pilot regions, establish a platform for sharing the results of regional breakthrough innovation change strategies, and promote the cross-regional scientific research and education of high-level universities and other innovation subjects.
(2) Stimulate the main body’s green innovation vitality and guide the ecosystem’s ecological niche suitability to exert green development effects.
Guide innovation policies to synergize with the energy security goal of clean and efficient use of energy; guide enterprises to seek green competitive advantages based on the new technological revolution by unleashing innovation vitality and strengthening the green competitive advantages of market players through policies and institutional arrangements such as subsidies and incentives for environmentally friendly high-tech industrial enterprises; the closure, merger, and transformation of resource-wasting traditional enterprises; and enhance the protection of intellectual property rights, etc. At the same time, it is possible to bring in the public and media, who can be introduced to supervise public opinion and guide the capital market to invest more in technology enterprises with good ESG performance, forcing enterprises to adopt ESG behaviors. At the same time, measures such as setting up a special green innovation fund, providing green innovation incentives, strengthening green science and technology innovation education, building green innovation platforms, and providing corresponding facilities and talent support should be taken to encourage universities and research institutes to expand and strengthen the green innovation chain and to provide more efficient and cleaner production technologies, production methods, and management modes for the green transformation of industries to empower the reform of the industrial chain with the innovation chain.
(3) Setting up long-term innovation and reform goals and forming a long-term innovation and development mechanism.
Scientifically promote regional breakthrough innovation change strategies and avoid short-sighted short-term economic behaviors local governments driven by short-term policies, which requires the adoption of a new identification and evaluation mechanism focusing on the structure and potential of regional innovation development instead of short-term performance, and guide local governments to establish a reasonable sustainable innovation development system and a long-term timetable during the process of the regional breakthrough innovation change strategies. Strengthen the empowering effect of regional breakthrough innovation strategies on basic research, emerging technologies and key core technologies, specifically through big data and other ways to monitor, assess, and predict the performance and process of building the ecological suitability of local high-tech industry innovation ecosystems, and support regional high-tech industry innovation development by “unveiling the list of commanding officers”, “horse-racing”, and other ways to support regional high-tech industry innovation. Using the “list of champions”, the “horse-racing system”, and other methods, it can support regional high-tech industries in replenishing, fixing, and strengthening their chains, and then provide policy tools for the green and efficient transformation of industries and the enhancement of energy-use efficiency.

6. Research Contributions, Limitations, and Future Directions

6.1. Potential Marginal Contributions of the Study

(1) For an extended duration, the sustainable development of China and other developing countries has been constrained by the energy dilemma. This study introduces a paradigm of regional breakthrough innovation transformation, which serves as a quasi-natural experiment, offering a viable practical pathway and solution for enhancing regional energy efficiency. Specifically, the findings validate that the regional breakthrough innovation transformation policies implemented in China have yielded an integrated and systematic framework of replicable experiences, effectively stimulating innovation, facilitating the transformation and upgrading of energy systems, and assisting regions in improving energy efficiency.
(2) This study has established a composite index and evaluation system for the ecological niche suitability of regional innovation ecosystems encompassing various dimensions. On the one hand, this evaluative framework allows for a systematic and ecological perspective on the quantitative assessment of niche suitability within regional innovation ecosystems; on the other hand, it provides an empirical approach for emerging market nations, such as China, to measure the ecological niche suitability of their regional innovation ecosystems.
(3) Grounded in niche theory and systems theory, this study explores the specific mechanisms through which the ecological niche suitability of regional innovation ecosystems influences regional energy efficiency. This investigative process and its conclusions transcend the prevailing paradigm of research, which primarily focuses on the impact of singular innovation factors on regional energy systems. Instead, it delves into the synergistic effects of the multidimensional suitability of innovation ecosystem niches on energy efficiency. The perspective presented herein offers a novel marginal contribution to understanding the role of regional innovation ecosystems in energy transitions.
(4) By integrating regional breakthrough innovation transformation policies, the ecological niche suitability of regional innovation ecosystems, and green energy efficiency into a cohesive research framework, this study not only examines the direct effects of China’s regional breakthrough innovation transformation policies on green energy efficiency but also investigates the policies’ role as a driving force behind the optimization of regional innovation ecosystem niche suitability, thereby empowering it to enhance green energy efficiency.

6.2. Limitations and Future Prospects

(1) This study focuses solely on the role of the ecological niche suitability of innovation ecosystems, as enabled by regional breakthrough innovation transformation policies on green energy efficiency. However, for emerging market nations, the economic viability, green cleanliness, and security of energy systems constitute the “impossible triangle” of the energy sector. The green energy efficiency explored in this study does not fully capture the contradictions highlighted by this “impossible triangle.” Future research could build upon the green energy efficiency variable presented here to develop a more comprehensive index system for regional energy systems, facilitating further investigation into the impacts of breakthrough innovation transformations and the ecological niche suitability of regional innovation ecosystems on entire energy systems.
(2) Due to the focus, scope, and data availability of this study, it investigates the role of regional breakthrough innovation transformations at the provincial administrative level in China, while lower-tier administrative divisions and entities remain unexplored. Future research could leverage data scraping, field surveys, and textual analysis to acquire more micro-level data sources, thereby allowing for a reassessment of the primary issues discussed in this study from a new and more focused perspective.
(3) This study, rooted in innovation niche theory, examines the impact of the ecological niche suitability of regional innovation ecosystems on energy efficiency. However, from the standpoint of innovation niche theory, the regional innovation ecosystem represents the highest level of innovation ecosystem units. Future studies could further concentrate on other levels of innovation ecosystems, such as industrial and corporate innovation ecosystems, enabling the findings of this research to be extended to heterogeneous innovation ecosystem units.

Author Contributions

Conceptualization, Z.B. and K.L.; methodology, software, validation, formal analysis, and writing—original draft preparation, Z.B.; investigation, resources, and data curation, Z.L.; visualization, T.J.; writing—review and editing, supervision, and project administration, K.L. All authors have read and agreed to the published version of the manuscript.

Funding

This research was supported by the National Social Science Foundation of China: Research on the Construction and Collaborative Evolution of an Innovative Ecosystem for the Integration of “Technology Economy Region” Information under the “Dual Carbon” Goal (22CTQ028), and the research project of Ningbo Urban Civilization Research Institute: Sample Study of Civilization and Good Governance in Grassroots Communities Based on Digital Application Scenarios—a case study of Ningbo Hefeng, Mingzhu, Haichuang, and other communities (CSWM202307).

Data Availability Statement

The original contributions presented in the study are included in the article, further inquiries can be directed to the corresponding author.

Acknowledgments

The authors would like to thank the editors and anonymous reviewers for their thoughtful and constructive comments.

Conflicts of Interest

The authors declare no conflicts of interest.

References

  1. Zhang, D.; Zheng, M.; Feng, G.-F.; Chang, C.-P. Does an environmental policy bring to green innovation in renewable energy? Renew. Energy 2022, 195, 1113–1124. [Google Scholar] [CrossRef]
  2. Dutt, A.K. Aggregate demand, aggregate supply and economic growth. Int. Rev. Appl. Econ. 2006, 20, 319–336. [Google Scholar] [CrossRef]
  3. Chen, C.; Zhang, T.; Chen, H.; Qi, X. Regional financial reform and corporate green innovation–Evidence based on the establishment of China National Financial Comprehensive Reform Pilot Zones. Financ. Res. Lett. 2024, 60, 104849. [Google Scholar] [CrossRef]
  4. Vargas-Hernández, J.G. Urban Green Innovation: Public Interest, Territory Democratization, and Institutional Design. In Handbook of Research on Cultural Heritage and Its Impact on Territory Innovation and Development; IGI Global: Hershey, PA, USA, 2021; pp. 138–153. [Google Scholar]
  5. Zhang, H.; Geng, C.; Cao, D.; Wei, J. Can high-tech industrial convergence promote green innovation efficiency? Evidence from 30 Chinese provinces. Environ. Dev. Sustain. 2023, 1–33. [Google Scholar] [CrossRef]
  6. Xiao, J.; Liao, Y.; Hou, R.; Peng, W.; Dan, H. Evaluation and Prediction of Regional Innovation Ecosystem from the Perspective of Ecological Niche: Nine Cities in Hubei Province, China as the Cases. Sustainability 2024, 16, 4489. [Google Scholar] [CrossRef]
  7. Noseleit, F. Entrepreneurship, structural change, and economic growth. J. Evol. Econ. 2013, 23, 735–766. [Google Scholar] [CrossRef]
  8. Li, Y.; Zhang, M. Green manufacturing and environmental productivity growth. Ind. Manag. Data Syst. 2018, 118, 1303–1319. [Google Scholar] [CrossRef]
  9. Granstrand, O.; Holgersson, M. Innovation ecosystems: A conceptual review and a new definition. Technovation 2020, 90, 102098. [Google Scholar] [CrossRef]
  10. Wang, J.; Jin, F.; Lyu, W.; Liu, Y.; Zhou, X.; Sun, Y.; Yang, Y.; Shi, J.; Ma, L. Innovation and Reform, Cultivation of New Growth Drivers in Northeast China: Academic Review of the 256th Shuangqing Forum. Sci. Found. China 2022, 36, 329–338. [Google Scholar]
  11. Bhowmik, C.; Bhowmik, S.; Ray, A.; Pandey, K.M. Optimal green energy planning for sustainable development: A review. Renew. Sustain. Energy Rev. 2017, 71, 796–813. [Google Scholar] [CrossRef]
  12. Du, L.; Tian, M.; Cheng, J.; Chen, W.; Zhao, Z. Environmental regulation and green energy efficiency: An analysis of spatial Durbin model from 30 provinces in China. Environ. Sci. Pollut. Res. 2022, 29, 67046–67062. [Google Scholar] [CrossRef]
  13. Wu, H.; Wang, L.; Peng, D.; Liu, B. Input–output efficiency model of urban green-energy development from the perspective of a low-carbon economy. Clean Energy 2022, 6, 141–152. [Google Scholar] [CrossRef]
  14. Bertoldi, P.; Mosconi, R. Do energy efficiency policies save energy? A new approach based on energy policy indicators (in the EU Member States). Energy Policy 2020, 139, 111320. [Google Scholar] [CrossRef]
  15. Meng, M.; Qu, D. Understanding the green energy efficiencies of provinces in China: A Super-SBM and GML analysis. Energy 2022, 239, 121912. [Google Scholar] [CrossRef]
  16. Kolosok, S.I.; Pimonenko, T.V.; Yevdokymova, A.V.; Hajiyev, N.O.; Palienko, M.; Prasol, L. Energy efficiency policy: Impact of green innovations. Mark. Manag. Innov. 2020, 4, 50–60. [Google Scholar] [CrossRef]
  17. Wu, H.; Hao, Y.; Ren, S. How do environmental regulation and environmental decentralization affect green total factor energy efficiency: Evidence from China. Energy Econ. 2020, 91, 104880. [Google Scholar] [CrossRef]
  18. Jiang, Z.; Lyu, P.; Ye, L.; Zhou, Y.W. Green innovation transformation, economic sustainability and energy consumption during China’s new normal stage. J. Clean. Prod. 2020, 273, 123044. [Google Scholar] [CrossRef]
  19. Zhao, G.; Zhou, P.; Wen, W. What cause regional inequality of technology innovation in renewable energy? Evidence from China. Appl. Energy 2022, 310, 118464. [Google Scholar] [CrossRef]
  20. Lin, S.; Lin, R.; Sun, J.; Wang, F.; Wu, W. Dynamically evaluating technological innovation efficiency of high-tech industry in China: Provincial, regional and industrial perspective. Socio-Econ. Plan. Sci. 2021, 74, 100939. [Google Scholar] [CrossRef]
  21. Hong, Y.; Niu, D.; Xiao, B.; Wu, L. Comprehensive evaluation of the technology innovation capability of China’s high-tech industries based on fuzzy borda combination method. Int. J. Innov. Sci. 2015, 7, 215–230. [Google Scholar] [CrossRef]
  22. Caglar, A.E.; Ulug, M. The role of government spending on energy efficiency R&D budgets in the green transformation process: Insight from the top-five countries. Environ. Sci. Pollut. Res. 2022, 29, 76472–76484. [Google Scholar]
  23. Jin, X.; Ahmed, Z.; Pata, U.K.; Kartal, M.T.; Erdogan, S. Do investments in green energy, energy efficiency, and nuclear energy R&D improve the load capacity factor? An augmented ARDL approach. Geosci. Front. 2024, 15, 101646. [Google Scholar]
  24. Wang, Q.; Li, S.; Pisarenko, Z. Heterogeneous effects of energy efficiency, oil price, environmental pressure, R&D investment, and policy on renewable energy-evidence from the G20 countries. Energy 2020, 209, 118322. [Google Scholar]
  25. Sun, H.; Edziah, B.K.; Kporsu, A.K.; Sarkodie, S.A.; Taghizadeh-Hesary, F. Energy efficiency: The role of technological innovation and knowledge spillover. Technol. Forecast. Soc. Change 2021, 167, 120659. [Google Scholar] [CrossRef]
  26. Li, J.; Zhang, H. Can pollution regulations enable key industries to reduce CO2 emissions?—Empirical evidence from China, based on green innovative technology patents and energy efficiency perspectives. Atmosphere 2022, 14, 33. [Google Scholar] [CrossRef]
  27. Esmaeilpour Moghadam, H.; Karami, A. Green innovation: Exploring the impact of environmental patents on the adoption and advancement of renewable energy. Manag. Environ. Qual. Int. J. 2024. [Google Scholar] [CrossRef]
  28. Li, J.; Dong, K.; Dong, X. Green energy as a new determinant of green growth in China: The role of green technological innovation. Energy Econ. 2022, 114, 106260. [Google Scholar] [CrossRef]
  29. Crespi, G.; Zuniga, P. Innovation and productivity: Evidence from six Latin American countries. World Dev. 2012, 40, 273–290. [Google Scholar] [CrossRef]
  30. Yu, X.; Dilanchiev, A.; Bibi, S. Enhancing labor productivity as a key strategy for fostering green economic growth and resource efficiency. Heliyon 2024, 10, e24640. [Google Scholar] [CrossRef]
  31. Zhang, H.; Chen, S.; Wang, S. Impact of economic growth and labor productivity dispersion on energy intensity in China. Energy 2022, 242, 123004. [Google Scholar] [CrossRef]
  32. Qian, W.; Wang, Y. How do rising labor costs affect green total factor productivity? based on the industrial intelligence perspective. Sustainability 2022, 14, 13653. [Google Scholar] [CrossRef]
  33. Yang, J.; Xiong, G.; Shi, D. Innovation and sustainable: Can innovative city improve energy efficiency? Sustain. Cities Soc. 2022, 80, 103761. [Google Scholar] [CrossRef]
  34. Zhang, Y. The sustainability of regional innovation in China: Insights from regional innovation values and their spatial distribution. Sustainability 2023, 15, 10398. [Google Scholar] [CrossRef]
  35. He, Z.; Wang, H.; Ma, X.; Hu, Y.; Zhao, H. Research on the suitability and spatial and temporal evolution of innovation environment niche suitability of regional innovation ecosystem under digitalization. Front. Phys. 2024, 12, 1425130. [Google Scholar] [CrossRef]
  36. He, W.; Dong, Y.; Lv, J. The Impact of Digital Transformation on the Niche Fitness of Regional Innovation Ecosystem. Sci. Technol. Prog. Policy 2024, 1–10. [Google Scholar]
  37. Sun, Y.; Xu, J. Evaluation model and empirical research on the green innovation capability of manufacturing enterprises from the perspective of ecological niche. Sustainability 2021, 13, 11710. [Google Scholar] [CrossRef]
  38. Pahle, M.; Schaeffer, R.; Pachauri, S.; Eom, J.; Awasthy, A.; Chen, W. The crucial role of complementarity, transparency and adaptability for designing energy policies for sustainable development. TIDEE TERI Inf. Dig. Energy Environ. 2022, 21, 55–56. [Google Scholar] [CrossRef]
  39. Bandera, C.; Thomas, E. The role of innovation ecosystems and social capital in startup survival. IEEE Trans. Eng. Manag. 2018, 66, 542–551. [Google Scholar] [CrossRef]
  40. De Vasconcelos Gomes, L.A.; Facin, A.L.F.; Salerno, M.S.; Ikenami, R.K. Unpacking the innovation ecosystem construct: Evolution, gaps and trends. Technol. Forecast. Soc. Change 2018, 136, 30–48. [Google Scholar] [CrossRef]
  41. Yi, H.; Zeng, Z.; Yang, B. Research on the Spatial Relationship Between Niche Suitability and Innovation Performance of High-Tech Industry Innovation Ecosystem. Forum Sci. Technol. China 2022, 82–92. [Google Scholar] [CrossRef]
  42. Xu, W. Research on the driving mechanisms and control factors of ecological innovation in high-tech enterprises. Fresenius Environ. Bull. 2020, 29, 8237–8243. [Google Scholar]
  43. Benitez, G.B.; Ayala, N.F.; Frank, A.G. Industry 4.0 innovation ecosystems: An evolutionary perspective on value cocreation. Int. J. Prod. Econ. 2020, 228, 107735. [Google Scholar] [CrossRef]
  44. Liu, S.; Xu, P.; Chen, X. Green fiscal policy and enterprise green innovation: Evidence from quasi-natural experiment of China. Environ. Sci. Pollut. Res. 2023, 30, 94576–94593. [Google Scholar] [CrossRef] [PubMed]
  45. García-Quevedo, J.; Jové-Llopis, E. Environmental policies and energy efficiency investments. An industry-level analysis. Energy Policy 2021, 156, 112461. [Google Scholar] [CrossRef]
  46. Woo, J.; Kim, Y. A Study on the Influence of the Government’s Innovation Promotion Policy on the Innovation Performance of the Service Industry. J. Korea Acad. -Ind. Coop. Soc. 2019, 20, 469–482. [Google Scholar]
  47. Murakami, N. Changes in Japanese industrial structure and urbanization: Evidence from prefectural data. J. Asia Pac. Econ. 2015, 20, 385–403. [Google Scholar] [CrossRef]
  48. Shen, C.; Li, S.; Wang, X.; Liao, Z. The effect of environmental policy tools on regional green innovation: Evidence from China. J. Clean. Prod. 2020, 254, 120122. [Google Scholar] [CrossRef]
  49. Zhu, L.; Luo, J.; Dong, Q.; Zhao, Y.; Wang, Y.; Wang, Y. Green technology innovation efficiency of energy-intensive industries in China from the perspective of shared resources: Dynamic change and improvement path. Technol. Forecast. Soc. Change 2021, 170, 120890. [Google Scholar] [CrossRef]
  50. Xie, X.; Liu, X.; Blanco, C. Evaluating and forecasting the niche fitness of regional innovation ecosystems: A comparative evaluation of different optimized grey models. Technol. Forecast. Soc. Change 2023, 191, 122473. [Google Scholar] [CrossRef]
  51. Xu, D.; Yu, B. How can regional innovation ecosystem affect innovation level? an Fs QCA analysis. Technol. Anal. Strateg. Manag. 2023, 1–17. [Google Scholar] [CrossRef]
  52. Dutta, S.; Lanvin, B.; Wunsch-Vincent, S. The Global Innovation Index 2018: Energizing the World with Innovation; WIPO: Geneva, Switzerland, 2018; pp. 3–55. [Google Scholar]
  53. Zameer, H.; Wang, Y.; Yasmeen, H. Reinforcing green competitive advantage through green production, creativity and green brand image: Implications for cleaner production in China. J. Clean. Prod. 2020, 247, 119119. [Google Scholar] [CrossRef]
  54. Lin, Y.-H.; Chen, Y.-S. Determinants of green competitive advantage: The roles of green knowledge sharing, green dynamic capabilities, and green service innovation. Qual. Quant. 2017, 51, 1663–1685. [Google Scholar] [CrossRef]
  55. Zhou, W.; Li, H.; Zhang, L.; Tian, H.; Fu, M. Evaluation analysis and promotion paths of regional green innovation vitality in China. Grey Syst. Theory Appl. 2023, 13, 747–766. [Google Scholar] [CrossRef]
  56. Zhao, W.; Yi, L. Product innovation logic under the open innovation ecosystem: A case study of Xiaomi (China). Technol. Anal. Strateg. Manag. 2023, 35, 659–675. [Google Scholar] [CrossRef]
  57. Klemetsen, M.E.; Bye, B.; Raknerud, A. Can direct regulations spur innovations in environmental technologies? A study on firm-level patenting. Scand. J. Econ. 2018, 120, 338–371. [Google Scholar] [CrossRef]
  58. Ostapenko, O.; Savina, N.; Mamatova, L.; Zienina-Bilichenko, A.; Selezneva, O. Perspectives of Application of Innovative Resource-Saving Technologies in the Concepts of Green Logistics and Sustainable Development. 2020. Available online: http://natal.uern.br/periodicos/index.php/RTEP/article/view/1261/1202 (accessed on 3 October 2020).
  59. Cao, Y.; Liu, J.; Yang, Y.; Liu, X.; Liu, Z.; Lv, N.; Ma, H.; Wang, Z.; Li, H. Construct a Regional Innovation Ecosystem: A Case Study of the Beijing-Tianjin-Hebei Region in China. Sustainability 2023, 15, 7099. [Google Scholar] [CrossRef]
  60. Zeng, W.; Li, L.; Huang, Y. Industrial collaborative agglomeration, marketization, and green innovation: Evidence from China’s provincial panel data. J. Clean. Prod. 2021, 279, 123598. [Google Scholar] [CrossRef]
  61. Wang, S.; Fan, J.; Zhao, D.; Wang, S. Regional innovation environment and innovation efficiency: The Chinese case. Technol. Anal. Strateg. Manag. 2016, 28, 396–410. [Google Scholar] [CrossRef]
  62. Hu, J.; Zhang, H. Has green finance optimized the industrial structure in China? Environ. Sci. Pollut. Res. 2023, 30, 32926–32941. [Google Scholar] [CrossRef]
  63. Dai, S.; Zhang, W.; Wang, Y.; Wang, G. Examining the impact of regional development policy on industrial structure upgrading: Quasi-experimental evidence from China. Int. J. Environ. Res. Public Health 2022, 19, 5042. [Google Scholar] [CrossRef]
  64. Tao, J.; Ho, C.-Y.; Luo, S.; Sheng, Y. Agglomeration economies in creative industries. Reg. Sci. Urban Econ. 2019, 77, 141–154. [Google Scholar] [CrossRef]
  65. Wang, D.; Xu, D.; Zhou, N.; Cheng, Y. The asymmetric relationship between sustainable innovation and industrial transformation and upgrading: Evidence from China’s provincial panel data. J. Clean. Prod. 2022, 378, 134453. [Google Scholar] [CrossRef]
  66. Fang, Z.; Razzaq, A.; Mohsin, M.; Irfan, M. Spatial spillovers and threshold effects of internet development and entrepreneurship on green innovation efficiency in China. Technol. Soc. 2022, 68, 101844. [Google Scholar] [CrossRef]
  67. Wang, H.; Cui, H.; Zhao, Q. Effect of green technology innovation on green total factor productivity in China: Evidence from spatial durbin model analysis. J. Clean. Prod. 2021, 288, 125624. [Google Scholar] [CrossRef]
  68. Li, J.; Du, Y. Spatial effect of environmental regulation on green innovation efficiency: Evidence from prefectural-level cities in China. J. Clean. Prod. 2021, 286, 125032. [Google Scholar] [CrossRef]
  69. Xing, H.; Jiang, Y.; Chen, Y. Carbon trading and green total factor productivity in manufacturing industry under the “double carbon” goal: A mechanism test based on heterogeneous technology innovation model. Sci. Technol. Prog. Policy 2022, 39, 76–86. [Google Scholar]
  70. Zhang, S.; Wang, X. Does innovative city construction improve the industry–university–research knowledge flow in urban China? Technol. Forecast. Soc. Change 2022, 174, 121200. [Google Scholar] [CrossRef]
  71. Chernozhukov, V.; Chetverikov, D.; Demirer, M.; Duflo, E.; Hansen, C.; Newey, W.; Robins, J. Double/debiased machine learning for treatment and structural parameters. Econom. J. 2018, 21, 1–68. [Google Scholar] [CrossRef]
  72. He, J.; Peng, F.; Xie, X. Mixed-ownership reform, political connection and enterprise innovation: Based on the double/unbiased machine learning method. Sci. Technol. Manag. Res. 2022, 42, 116–126. [Google Scholar]
  73. Li, C.; Meng, B. Research on the Evaluation of the Input-Output Efficiency of Vocational Education Project Construction Based on the Super-SBM Model. Soc. Sci. Guangxi 2023, 154–160. [Google Scholar] [CrossRef]
  74. Yin, J.; Liu, P.; Li, F. Suitability Evaluation and Improvement Strategy of Innovation Ecosystem of High-tech Shipbuilding Industry in China. Strategy Innov. Dev. Sci. Technol. 2023, 7, 1–12. [Google Scholar]
  75. Todtling, F.; Trippl, M. Knowledge links in high-technology industries: Markets, Networks or Milieu? The case of the Vienna biotechnology cluster. Int. J. Entrep. Innov. Manag. 2007, 7, 345–365. [Google Scholar] [CrossRef]
  76. Zhai, Z.; Wu, N.; Zhu, Y.; Gao, B.; Pan, Z. A new construction algorithm of the digital economy innovation system. J. Phys. Conf. Ser. 2020, 1656, 012006. [Google Scholar] [CrossRef]
  77. Albis, N.; Marín, R.; Sánchez, E.; Bayona-Rodríguez, H.; García, J.M. The impacts of public support for innovation on firm productivity and on private investment in R&D in manufacturing and services in Colombia. Innov. Dev. 2024, 14, 47–66. [Google Scholar]
  78. Wang, W.; Wang, J.; Wulaer, S.; Chen, B.; Yang, X. The effect of innovative entrepreneurial vitality on economic resilience based on a spatial perspective: Economic policy uncertainty as a moderating variable. Sustainability 2021, 13, 10677. [Google Scholar] [CrossRef]
  79. Yao, J.; Li, H.; Shang, D.; Ding, L. Evolution of the industrial innovation ecosystem of resource-based cities (RBCs): A case study of Shanxi Province, China. Sustainability 2021, 13, 11350. [Google Scholar] [CrossRef]
  80. Ma, J.; Seong, Y.-H.; Lee, M.-K. Evaluation of resource-based provincial innovation environment index system based on open innovation theory. Innov. Stud. 2021, 16, 77–96. [Google Scholar] [CrossRef]
  81. Xu, M.; Jiang, Y. Can the China’s industrial structure upgrading narrow the gap between urban and rural consumption. J. Quant. Tech. Econ 2015, 32, 3–21. [Google Scholar]
  82. Hu, L.; Yuan, W.; Jiang, J.; Ma, T.; Zhu, S. Asymmetric effects of industrial structure rationalization on carbon emissions: Evidence from thirty Chinese provinces. J. Clean. Prod. 2023, 428, 139347. [Google Scholar] [CrossRef]
  83. Tu, C.; Liang, Y.; Fu, Y. How does the environmental attention of local governments affect regional green development? Empirical evidence from local governments in China. Humanit. Soc. Sci. Commun. 2024, 11, 1–14. [Google Scholar] [CrossRef]
  84. Li, Q.; Kovacs, J.F.; Choi, G.H. High-technology employment growth in China: Geographic disparities in economic structure and sectoral performance. Econ. Change Restruct. 2021, 54, 1025–1064. [Google Scholar] [CrossRef]
  85. Tao, C.; Xu, Y.; Peng, Y.; Li, H. Driving mechanism and spatial effect of technological potential energy agglomeration promoting the development of high-tech industry. Econ. Res. -Ekon. Istraživanja 2022, 35, 5924–5946. [Google Scholar] [CrossRef]
  86. Xu, J.; Hong, J.; Zhou, Z. Local attention to environment and green innovation: Evidence from listed manufacturing companies in 120 cities in China. Emerg. Mark. Financ. Trade 2023, 59, 1062–1073. [Google Scholar] [CrossRef]
  87. Bi, M.; Wang, C.; Fu, D.; Tan, X.; Yu, S.; Pan, J.; Lv, K. Chinese-style fiscal decentralization, ecological attention of Government, and regional energy intensity. Energies 2022, 15, 8408. [Google Scholar] [CrossRef]
  88. Jin, H.; Liu, C.; Chen, S. Why is COD pollution from Chinese manufacturing declining?—The role of environmental regulation. J. Clean. Prod. 2022, 373, 133808. [Google Scholar] [CrossRef]
  89. Yan, W.; Jing, G.; Bangfan, L. Hi-tech Industrial Agglomeration, Scientific and Technological Innovation, and Economic Growth. East China Econ. Manag. 2023, 37, 56–64. [Google Scholar]
  90. Floch, J.-M.; Le Saout, R. Spatial econometrics-common models. Handb. Spat. Anal. Theory Pract. Appl. R 2018, 149–177. [Google Scholar]
  91. Zhu, C.; Lee, C.-C. The effects of low-carbon pilot policy on technological innovation: Evidence from prefecture-level data in China. Technol. Forecast. Soc. Change 2022, 183, 121955. [Google Scholar] [CrossRef]
  92. Farbmacher, H.; Huber, M.; Lafférs, L.; Langen, H.; Spindler, M. Causal mediation analysis with double machine learning. Econom. J. 2022, 25, 277–300. [Google Scholar] [CrossRef]
Figure 1. Schematic diagram of ecological niche suitability transition of the innovation ecosystems of high-tech industries.
Energies 17 03938 g001
Figure 2. Spatio-temporal distribution of GTFP and Fit. (a) Spatio-temporal distribution of GTFP in 2009. (b) Spatio-temporal distribution of GTFP in 2021. (c) Spatio-temporal distribution of Fit in 2009. (d) Spatio-temporal distribution of Fit in 2021.
Energies 17 03938 g002
Figure 3. The Moran scatterplot of regional green energy efficiency (GTFP) in 2009 and 2021.
Energies 17 03938 g003
Figure 4. Parallel trend test.
Energies 17 03938 g004
Table 3. Fit evaluation index system of ecological niche suitability of the innovation ecosystems of high-tech industries.
Level II
Evaluation Projects
Level III
Evaluation Projects
Proxy DataIndicator Attributes
Subject of Innovation (Sub)Innovative ProducersNumber of Scientific Institutionspositive
Number of Full-Time Teachers in General Higher Educationpositive
Innovative ConsumersNumber of High-Tech Enterprisespositive
Number of Industrial Enterprises above Designated Sizepositive
Innovation Support (Sur)Innovation PlatformNumber of University Science and Technology Parkspositive
Number of Technology Business Incubatorspositive
Innovative ServicesApplication of R&D Results in Terms of Full-Time Equivalents of S&T Service personnelpositive
Funding for Local Tertiary Institutions’ Results Application and Technology Service Projectspositive
Total Technology Business Incubator Incubation Fundpositive
Innovation EndowmentCumulative Number of Scientific and Technical Papers from Research Institutionspositive
Cumulative Number of Scientific and Technical Papers in Higher Educationpositive
Cumulative Number of Active Inventionspositive
Innovation PolicyAttention to Innovation in Governmentpositive
Innovation Vitality (Vit)Innovation ExpansionNumber of Enterprises Graduated from Technology Business Incubatorspositive
Number of Enterprises Graduated from University Science and Technology Parkspositive
Innovation TransformationSales Revenue of New Products of Industrial Enterprises above the Designated Sizepositive
Revenue from Sales of New Products in High-Tech Industriespositive
Innovation Enabling Industrial DevelopmentTotal Power of Agricultural Mechanisationpositive
Development of Services and New Technology Industriespositive
Density of Industrial Robotspositive
Innovation Factor ActivityNumber of University Students Enrolled (Brain Drain)positive
Broadband Access Port (Information Flow)positive
Geographical Amount of Technology Inflows to Technology Markets (Technology Flows)positive
Geographical Amount of Technology Exports from Technology Markets (Technology Flows)positive
Innovation Resources (Res)R & D ResourcesFull-Time Equivalent of R&D Personnelpositive
R&D Funding Internally Notedpositive
Government Expenditure On Science and Technologypositive
Facility ResourcesInstrument and Equipment Expenditure/Full-Time Equivalent of R&D personnelpositive
Investment in Fixed Assets in Research and Technology Services/Full-Time Equivalent of R&D personnelpositive
Fixed Asset Investment in IT Services/Full-Time Equivalent of R&D Personnelpositive
Environment for Innovation (Env)Government Governance EnvironmentFiscal Expenditure/Total Population of Provincespositive
Completed Investment/Total Output in Industrial Pollution Controlpositive
Traffic Accident Casualties/Total Population of Each Provincepositive
Legal EnvironmentNumber of Local IP-Related Legislation/Total Legislationpositive
Number of Patent Disputes Settled/Number of Patent Disputes Filed in Each Regionpositive
Number of Patents Granted per Region/National Number of Patents Grantedpositive
Market EnvironmentReal Foreign Direct Investmentpositive
Taxes and Surcharges On Main Business Operations of Enterprises/Total Profitspositive
Financial EnvironmentBalance of Loans from Financial Institutions at the End of the Yearpositive
Economic EnvironmentGDP per Capitapositive
Consumption Expenditure per Capita for the Population As a Wholepositive
Per Capita Disposable income of the Population as a Wholepositive
Cultural EnvironmentPer Capita Expenditure on Educationpositive
Library Holdings per Capitapositive
Technology Market EnvironmentTechnology Market Turnoverpositive
Number of Patent Applicationspositive
Table 4. System of indicators for evaluating government environmental attention.
Sub-IndicatorsEvaluation Projects
Policy Planning AttentionGreen Development Concerns
Strength of the “Five-in-One” Ecological Civilization Layout
Resource Allocation AttentionIntensity of Environmental Governance
Intensity of Environmental Infrastructure Development
Legislative AttentionRegional Legislation on Ecological Civilization
Table 1. Classification indicators of input and output for Super-SBM decision-making units.
Decision-Making UnitsDecision-Making UnitsDecision-Making Units
ν 1 x 1 x 12 x 1
ν 2 x 21 x 22 x 1
ν m x m 1 x m 2 x m n
y 11 y 12 y 1 n u 1
y 21 y 22 y 2 n u 2
y s 1 y s 1 y s n u s
Table 2. Input/output elements of regional green energy efficiency.
Factor ItemsIndicatorsCharacterisation Variables
Input FactorsLabor InputEmployed Population
(10,000 persons)
Capital InputFixed Assets (billion yuan)
Energy InputTotal Energy Consumption (tonnes)
Output FactorLevel of Regional Economic
Development
Real GDP (billion yuan)
Undesirable OutputCarbon EmissionsCarbon Dioxide Emissions
(million tonnes)
Pollution EmissionsIndustrial Sulphur Dioxide Emissions (million tonnes)
Wastewater Emissions
(million tonnes)
General Industrial Waste
(million tonnes)
Table 5. Global Moran’s I of the Regional Green Energy Efficiency (GTFP) based on the Economic Spatial Weighting Matrix, 2009–2021.
YearMoran’s Ip-ValueYearMoran’s Ip-Value
20090.265 ***0.00120160.341 ***0.000
20100.293 ***0.00020170.327 ***0.000
20110.315 ***0.00020180.318 ***0.000
20120.329 ***0.00020190.305 ***0.000
20130.333 ***0.00020200.268 ***0.000
20140.338 ***0.00020210.197 **0.014
20150.345 ***0.000
** p < 0.05, *** p < 0.01.
Table 6. Parameter estimates for model 3.
GTFP
Local EffectNeighborhood EffectAggregate Effect
DID × Fit0.239 ***0.696 ***0.936 ***
(6.02)(3.19)(4.03)
AIS0.1850.1880.373
(1.37)(1.22)(1.32)
RIS0.0004320.0004300.000861
(0.95)(0.84)(0.91)
GS0.421 ***0.421 **0.842 ***
(3.15)(2.39)(2.94)
ER0.156 ***0.157 **0.313 **
(2.91)(2.03)(2.55)
AIP0.0944 ***0.0950 **0.189 ***
(3.06)(2.20)(2.75)
AIE−0.125 ***−0.125 **−0.250 ***
(−3.99)(−2.57)(−3.46)
ρ0.532 ***
(7.12)
Variance
sigma2_e0.00333 ***
(13.64)
N390
R 2 0.118
t statistics in parentheses, ** p < 0.05, *** p < 0.01.
Table 7. Parameter estimates for model 4.
Intermediary PathImplicit VariableDIDIntermediary VariableCovariateFixed AreaFixed TimeIntermediary RatioSobel
(Z-Statistics)
Aroian
(Z-Statistics)
Goodman
(Z-Statistics)
DID → Fit → GTFPGTFP0.143 *** yesyesyes45.0%3.928 ***3.897 ***3.960 ***
(4.57)
Fit0.0862 *** yesyesyes
(5.36)
GTFP0.0793 ***0.746 ***yesyesyes
(2.83)(5.78)
DID → Sub → GTFPGTFP0.143 *** yesyesyes11.7%1.861 *1.800 *1.928 *
(4.57)
Sub0.0253 *** yesyesyes
(2.98)
GTFP0.126 ***0.659 **yesyesyes
(4.15)(2.38)
GTFP → Sur → GTFPGTFP0.143 *** yesyesyes36.8%3.762 ***3.730 ***3.796 ***
(4.57)
Sur0.0846 *** yesyesyes
(5.00)
GTFP0.0914 ***0.621 ***yesyesyes
(3.42)(5.72)
DID → Vit → GTFPGTFP0.143 *** yesyesyes28.4%2.999 ***2.958 ***3.041 ***
(4.57)
Vit0.0607 *** yesyesyes
(4.54)
GTFP0.101 ***0.668 ***yesyesyes
(3.55)(4.00)
DID → Res → GTFPGTFP0.143 *** yesyesyes15.2%2.664 ***2.619 ***2.713 ***
(4.57)
Res0.0460 *** yesyesyes
(3.72)
GTFP0.122 ***0.472 ***yesyesyes
(4.18)(3.82)
DID → Env → GTFPGTFP0.143 *** yesyesyes53.8%4.438 ***4.410 ***4.466 ***
(4.57)
Env0.100 *** yesyesyes
(6.60)
GTFP0.0652 **0.769 ***yesyesyes
(2.40)(6.00)
t statistics in parentheses, * p < 0.10, ** p < 0.05, *** p < 0.01.
Table 8. Robustness tests.
Intermediary PathImplicit VariableDIDIntermediary VariableCovariateFixed AreaFixed TimeIntermediary
Ratio
Sobel
(Z-Statistics)
Aroian
(Z-Statistics)
Goodman
(Z-Statistics)
Removal of interfering samplesGTFP0.126 *** yesyesyes44.0%3.380 ***3.360 ***3.400 ***
(4.83)
Fit0.0884 *** yesyesyes
(3.70)
GTFP0.0665 ***0.626 ***yesyesyes
(3.24)(8.28)
Changing the sample split ratio I
(1:7)
GTFP0.161 *** yesyesyes40.5%3.640 ***3.607 ***3.673 ***
(4.59)
Fit0.0902 *** yesyesyes
(4.75)
GTFP0.0975 ***0.723 ***yesyesyes
(3.22)(5.66)
Changing the sample split ratio II
(1:3)
GTFP0.167 *** yesyesyes45.0%4.186 ***4.157 ***4.215 ***
(4.79)
Fit0.0980 *** yesyesyes
(5.52)
GTFP0.0923 ***0.764 ***yesyesyes
(3.12)(6.43)
Replacement of Machine Learning Algorithm I
(Neural Networks)
GTFP0.191 *** yesyesyes26.9%2.480 **2.443 **2.520 **
(3.78)
Fit0.100 *** yesyesyes
(2.88)
GTFP0.152 ***0.513 ***yesyesyes
(3.70)(4.9)
Replacement of Machine Learning Algorithm II (Gradient Boosting Tree)GTFP0.148 *** yesyesyes44.2%3.713 ***3.682 ***3.746 ***
(4.48)
Fit0.0863 *** yesyesyes
(4.75)
GTFP0.0831 ***0.761 ***yesyesyes
(3.17)(5.96)
t statistics in parentheses, ** p < 0.05, *** p < 0.01.
Table 9. Estimates of the parameters of the cluster-mediated effects mechanism.
Intermediary VariableAggregate EffectDisposal Group Direct EffectControl Group
Direct Effect
Disposal Group
Indirect Effects
Control Group
Indirect Effects
Fit0.181 ***0.142 ***0.139 ***0.043 ***0.040 ***
Sub0.181 ***0.181 ***0.186 ***−0.005−0.001
Sur0.154 ***0.095 ***0.051 *0.103 ***0.059 ***
Vit0.183 ***0.150 ***0.152 ***0.031 *0.033 ***
Res0.179 ***0.164 ***0.152 ***0.026 **0.015 ***
Env0.173 ***0.141 ***0.105 ***0.068 ***0.032 ***
* p < 0.10, ** p < 0.05, *** p < 0.01.
Table 10. Parameter estimation results of mechanism effects of industrial structure optimization.
Intermediary Paths
DID × Fit → AIS → GTFPDID × Fit → RIS → GTFP
GTFPAISGTFPGTFPRISGTFP
DID × Fit0.488 ***0.463 ***0.218 ***0.488 ***47.35 ***0.276 ***
(4.37)(5.18)(2.70)(4.37)(4.83)(2.76)
AIS 0.591 ***
(8.33)
RIS 0.00447 ***
(2.89)
covariateyesyesyesyesyesyes
Fixed areayesyesyesyesyesyes
fixed timeyesyesyesyesyesyes
Percentage of intermediaries56.0%43.3%
Sobel
(Z-statistics)
4.396 ***2.482 **
Aroian
(Z-statistics)
4.374 ***2.444 **
Goodman
(Z-statistics)
4.420 ***2.522 **
N390390
R 2 --
t statistics in parentheses, ** p < 0.05, *** p < 0.01.
Disclaimer/Publisher’s Note: The statements, opinions and data contained in all publications are solely those of the individual author(s) and contributor(s) and not of MDPI and/or the editor(s). MDPI and/or the editor(s) disclaim responsibility for any injury to people or property resulting from any ideas, methods, instructions or products referred to in the content.

