Abstract
In the field of CO2 capture and sequestration, ensuring the safety of pipeline infrastructure is paramount to successful climate change mitigation efforts. This study investigates the dynamics of CO2 dispersion from pipeline systems, assessing not only the transport process but also the physical properties and associated hazards. Advanced simulation techniques are used to model how different states of CO2 (gas, liquid, and supercritical) and varying pipeline characteristics—such as perforation sizes, flow rates, and orientations—affect the dispersion patterns in the event of a leak. Simulations cover a range of atmospheric conditions, emphasizing the role of atmospheric stability and wind speed in shaping dispersion and defining potential impact zones. An analysis of historical pipeline accidents is included to inform risk management strategies. The results show that the orientation of the pipeline has a significant effect on dispersion, with downward leaks causing the largest impact zones, particularly under supercritical conditions. The results highlight the need for adaptive safety strategies that take into account real-time CO2 transport conditions and localized environmental data. By integrating these factors, the study recommends refining safety protocols and emergency response strategies to improve pipeline resilience and public safety against potential leaks. Key findings include the quantification of the relationship between leak parameters and dispersion areas, providing a valuable framework for future safety improvements.
1. Introduction
During the carbon capture and storage (CCS) process, various impurities can accumulate in carbon dioxide (CO2), which can subsequently pose risks to safety and the integrity of the overall CCS operation. Water, a prevalent by-product of the combustion process, is considered an impurity within the CO2 stream. Moreover, elements such as sulfur, chlorine, and mercury, which may naturally be present in fossil fuels, are emitted during combustion [1]. These elements can combine to form gaseous compounds that persist as impurities in the captured and compressed CO2. The oxidizing agent, such as oxygen (O2), can introduce impurities like nitrogen, oxygen, and argon, especially when air is used in the process. Additional impurities arising from the CO2 capture process further contribute to the overall level of impurities.
In addition, the processes for transporting and storing CO2 pose their own challenges in terms of the purity of the medium. Transporting CO2 through pipelines and storing it underground or under the seabed requires the gas to be pure, but also stable and non-corrosive. Impurities such as hydrogen sulphide or nitrogen oxides can cause corrosion of the infrastructure, leading to potential leaks and increased operating costs. Therefore, monitoring the quality and purity of CO2 and developing methods for its purification and treatment are critical to the safety and efficiency of these processes. Teng et al. (2021) and Volpi et al. (2015) emphasize that ensuring the purity of CO2 is essential to preventing these issues [2,3]. Kuczynski and Hendel utilized Monte Carlo simulations to assess the economic efficiency of carbon-dioxide-enhanced oil recovery projects, underscoring the importance of maintaining CO2 quality throughout the process [4]. Yu et al. and Cao et al. studied the decompression behavior and leakage characteristics of CO2 pipelines, highlighting the impact of impurities on pipeline integrity and risk [5,6]. Additionally, Vitali et al. reviewed the thermodynamic challenges for CO2 pipeline design, emphasizing the effects of impurities, water content, and low temperature [7].
In many European projects related to the implementation of transport and storage (T&S) hubs, specific purity criteria for CO2 have been published [8]. Notable examples include the PORTHOS and ARAMIS projects in the Netherlands, operated by Fluxys in Belgium, and the Longship project in Norway [9]. The established criteria outline the requirements for CO2 purity and set limits for various chemical substances, including water. Meeting these requirements necessitates the implementation of specialized processes to ensure the appropriate level of purity.
The study focused on detailed modeling of CO2 dispersion that could result from pipeline malfunctions. These analyses highlight the complexity of defining safety zones around pipeline infrastructure. A rigorous analysis of different failure scenarios was carried out, including different CO2 phases and flow rates. These studies provide key insights into the potential behavior of CO2 plumes and their impact on human safety. Different leak sizes were considered, allowing the prediction of different emergency scenarios over a wide range, which is essential for the development of effective emergency protocols and evacuation procedures.
2. Properties of CO2
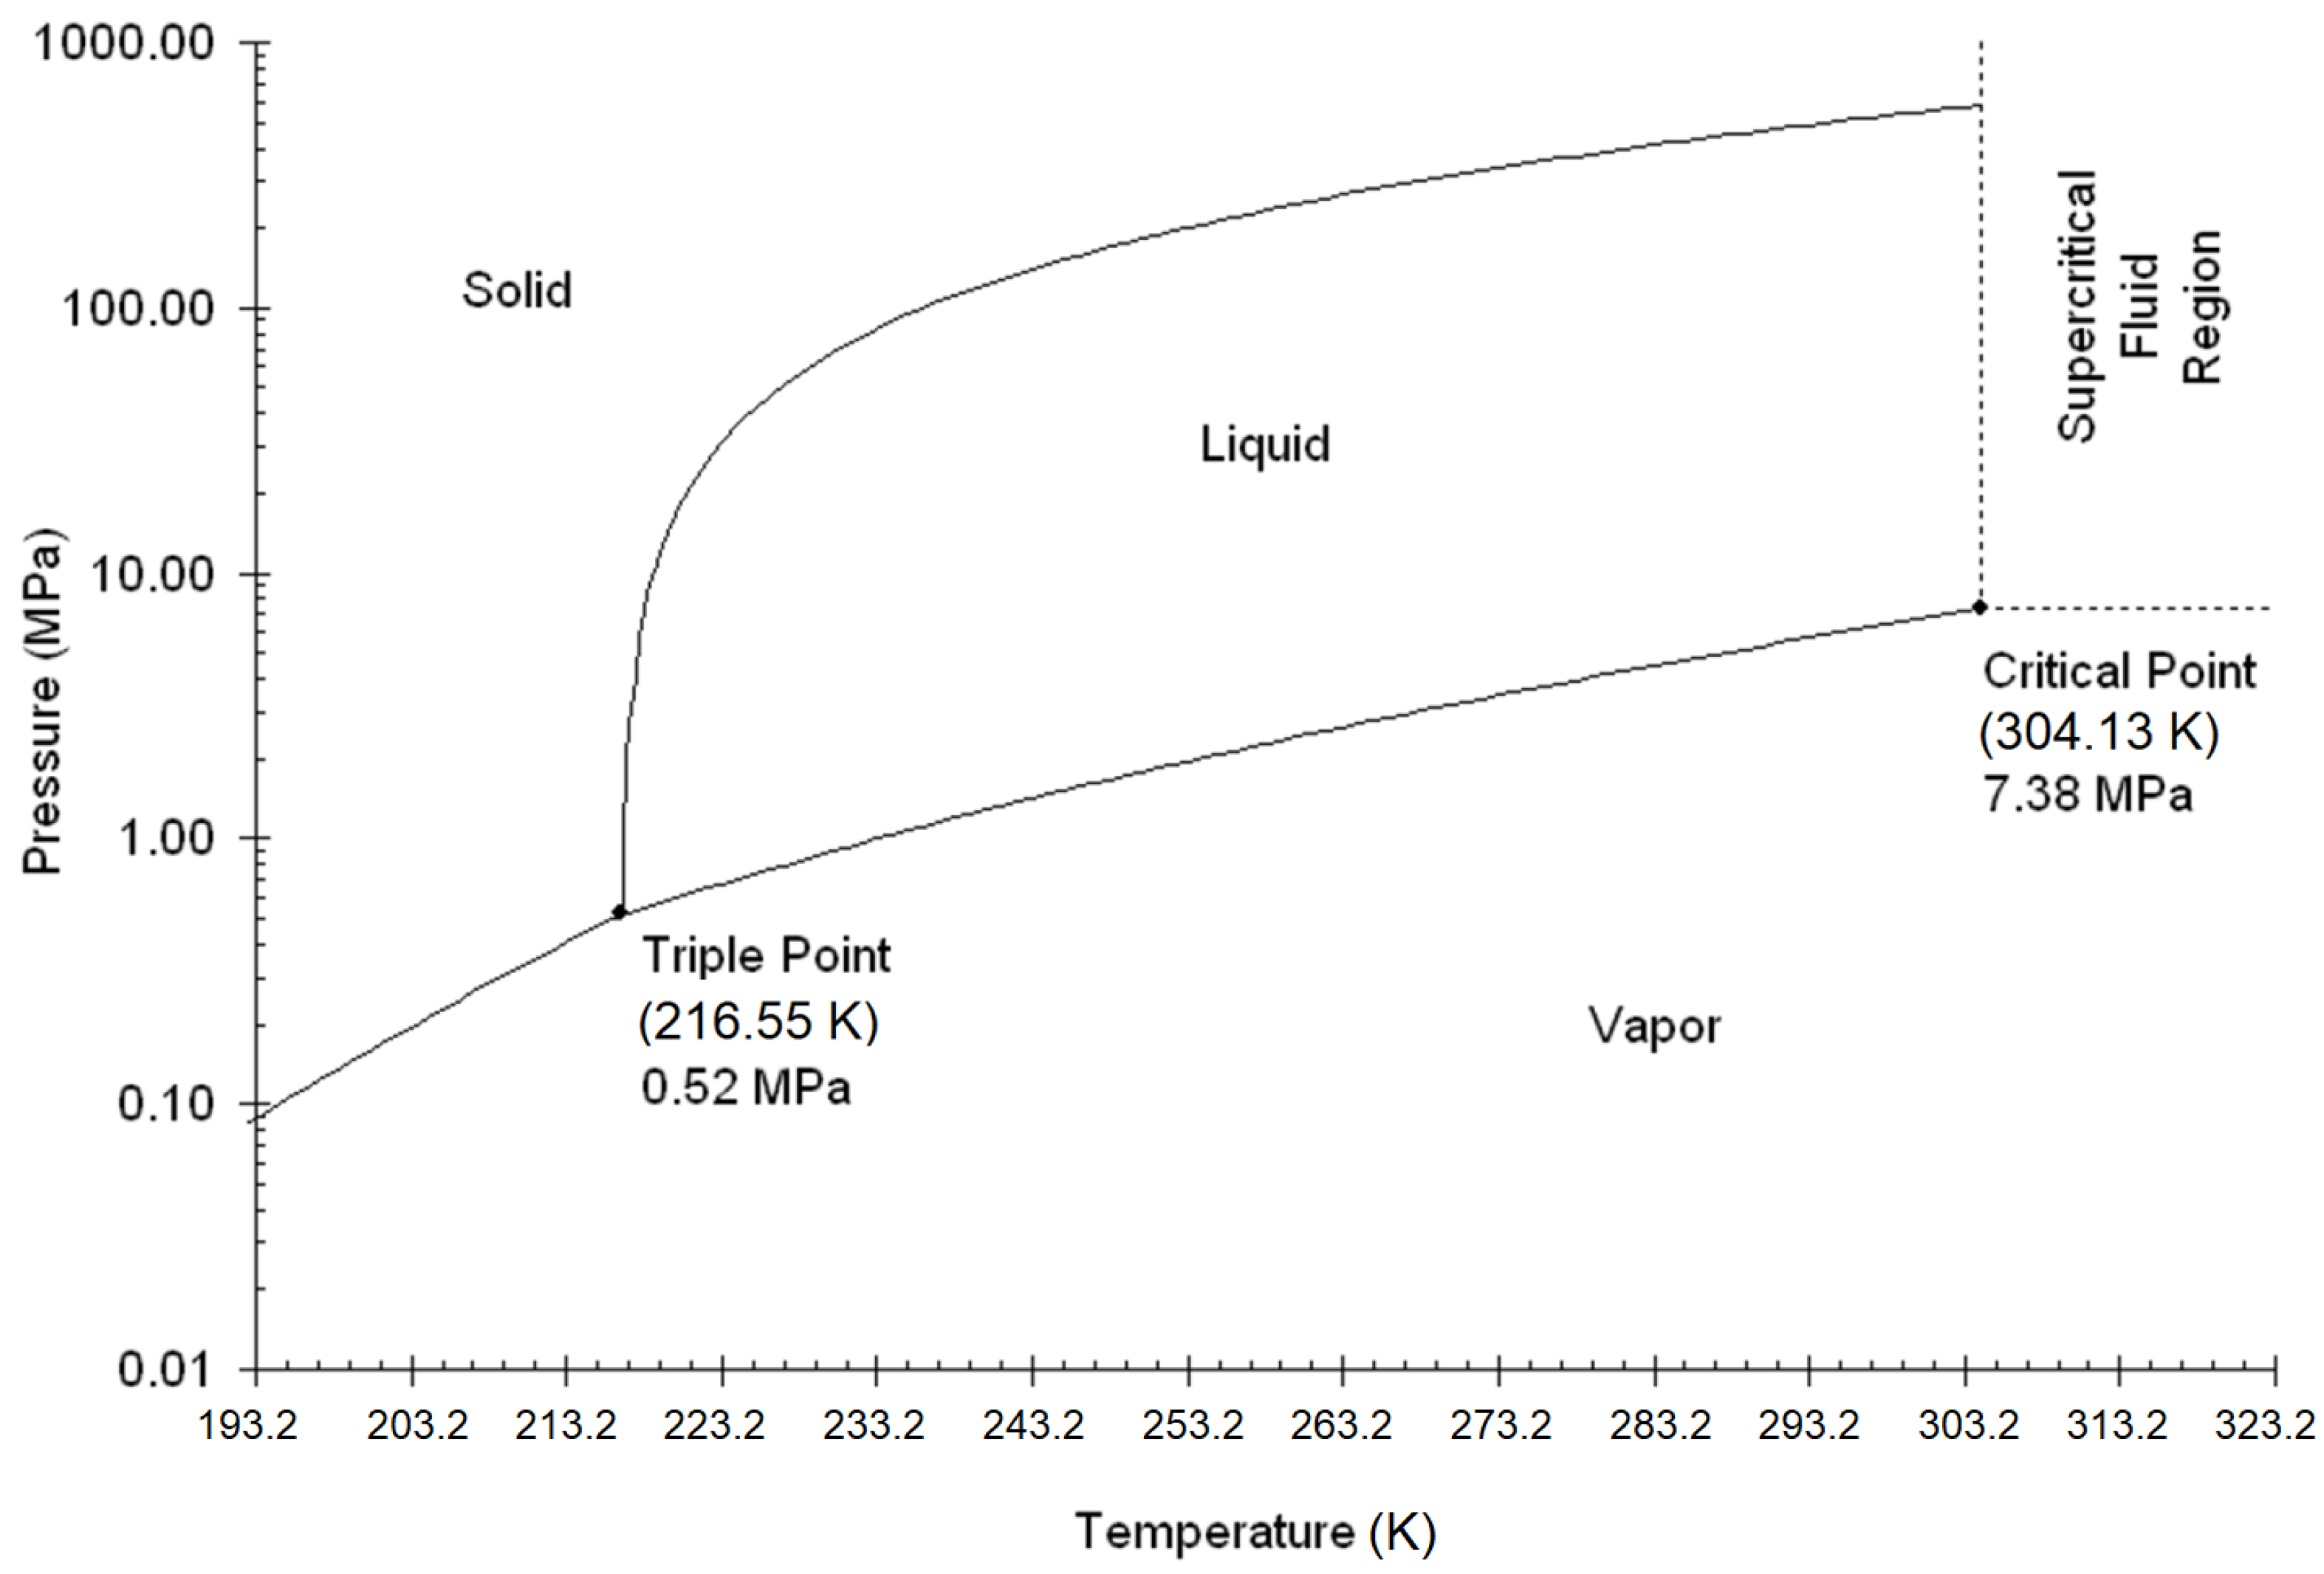
Carbon dioxide is an odorless, colorless, non-toxic, and heavier than air (relative density: 1.52) gas under ambient conditions. Depending on the PVT conditions, it can exist in a gaseous, liquid, or solid state. The literature also includes the so-called supercritical state, which is physically a gas phase at conditions above critical pressure and temperature. For the pipeline transport of carbon dioxide, there are two main areas of concern: the liquid phase at supercritical pressure and the supercritical phase (Figure 1). The location of the critical point (for pure CO2: Tc = 304.2 K; pc = 7.38 MPa, critical density 468 kg/m3) and the phase curve for the composition of the carbon dioxide stream are key to determining the phase in which carbon dioxide should be transported through the pipeline [2,10,11,12]. The dense phase appears in the diagram for pressure conditions above the critical pressure but below the critical temperature (liquid at conditions above the critical pressure).
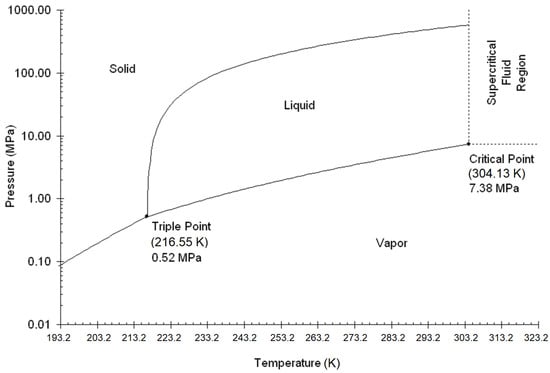
Figure 1.
Phase diagram of carbon dioxide.
At temperatures below the critical point, CO2 typically exists in a liquid state. When the temperature rises above the critical point, CO2 enters a supercritical phase, characterized by gas-like properties beyond the critical temperature and pressure [13]. The transition from a liquid to a gaseous state occurs when the pressure is reduced, crossing the vapor–liquid boundary, which results in changes in both enthalpy and density at sub-critical temperatures. To induce this phase change from liquid to gas in CO2, heat must be provided. Beyond the critical temperature, no distinct phase change is observed; instead, as the pressure decreases from supercritical conditions, the transition to a gaseous state involves a gradual change in enthalpy. Pure CO2 has a triple point at 216.55 K and a pressure of 0.52 MPa, where CO2 can coexist in gas, liquid, and solid states. By adjusting the pressure and temperature appropriately, CO2 can transition into a solid form. The ranges (pressure and temperature) of the different phases of carbon dioxide are shown in Figure 1 [13].
The physical properties of the CO2 stream determined by its individual chemical components may differ from the physical properties of pure CO2. The permissible content of other chemical components is related to the technical and economic optimization resulting from the pipeline transport of carbon dioxide and the technological conditions of its sources. In the context of CCS technology, the composition of CO2 varies depending on the source:
- -
- Captured from the combustion/processing of fossil fuels.
- -
- Produced in industrial processes (e.g., cement production, metallurgical processes, etc.).
- -
- Extracted from hydrocarbons with high CO2 content.
- -
- Table 1 presents the maximum allowable content of each component of the transported carbon dioxide stream [14,15,16,17,18,19,20,21].
 Table 1. Maximum allowable contents of individual components in the transported carbon dioxide stream.
3. Pipeline Carbon Dioxide Transportation
Carbon dioxide can be transported conventionally in the gaseous, liquid, and supercritical phases.
According to Liu et al., the thermodynamic range of the gaseous phase is very limited for CO2 pipeline transport [22]. The first problem that arises when adopting the CO2 transport model in the gaseous phase is the maximum inlet pressure in the pipeline. It can reach a maximum of 4 MPa, and in moderate climatic conditions during the cold half of the year, it can even be below 3.5 MPa, depending on the location of the saturation line. Exceeding the pressure at which liquid CO2 condenses at a given temperature results in a two-phase system and then a single liquid phase in the pipeline. This poses a significant risk to equipment and fittings operating under gas-phase transport conditions; in addition, untreated and inadequately dried carbon dioxide can lead to hydrate formation. Another problem with gas-phase transport of CO2 is the density of carbon dioxide. This gas is over one and a half times heavier than air and over two and a half times heavier than typical natural gas. The density of the medium plays a significant role in determining the critical length of the pipeline. In the case of gas-phase CO2 transport, the first problem is the low compression pressure, and the next problem is the significant pressure drop along the pipeline due to the relatively low density of the gas phase. For these reasons, gas-phase CO2 transport should only be considered for short distances and small quantities of carbon dioxide to be transported [23].
Carbon dioxide transport in the supercritical state (above critical parameters, pc = 7.38 MPa, Tc = 304.2 K), also known as the dense gas phase 1, is more efficient. The characteristic properties of carbon dioxide in the supercritical state include a density comparable to the liquid state and a viscosity and compressibility comparable to the density of the gas phase [23,24]. These properties of CO2 in the supercritical state determine that, from a thermodynamic point of view, this method of CO2 pipeline transport is the most efficient. However, from a technical point of view, it has certain drawbacks. Due to the high critical temperature, maintaining the supercritical state along the entire length of the pipeline is a challenge. If the temperature drops below the critical value, the carbon dioxide immediately transitions to the liquid phase, and if the pressure drops suddenly, it transitions to the gas phase. The appearance of a two-phase system, gas-supercritical state, causes a rapid decrease in the density of the transported CO2, leading to a sudden drop in pressure. Maintaining the transported carbon dioxide at a high temperature is energy-intensive and requires either heating the carbon dioxide to very high temperatures at the inlet of the pipeline while providing good thermal insulation so that the temperature does not fall below the critical temperature value along the entire length of the pipeline or installing several additional CO2 heating stations along the pipeline.
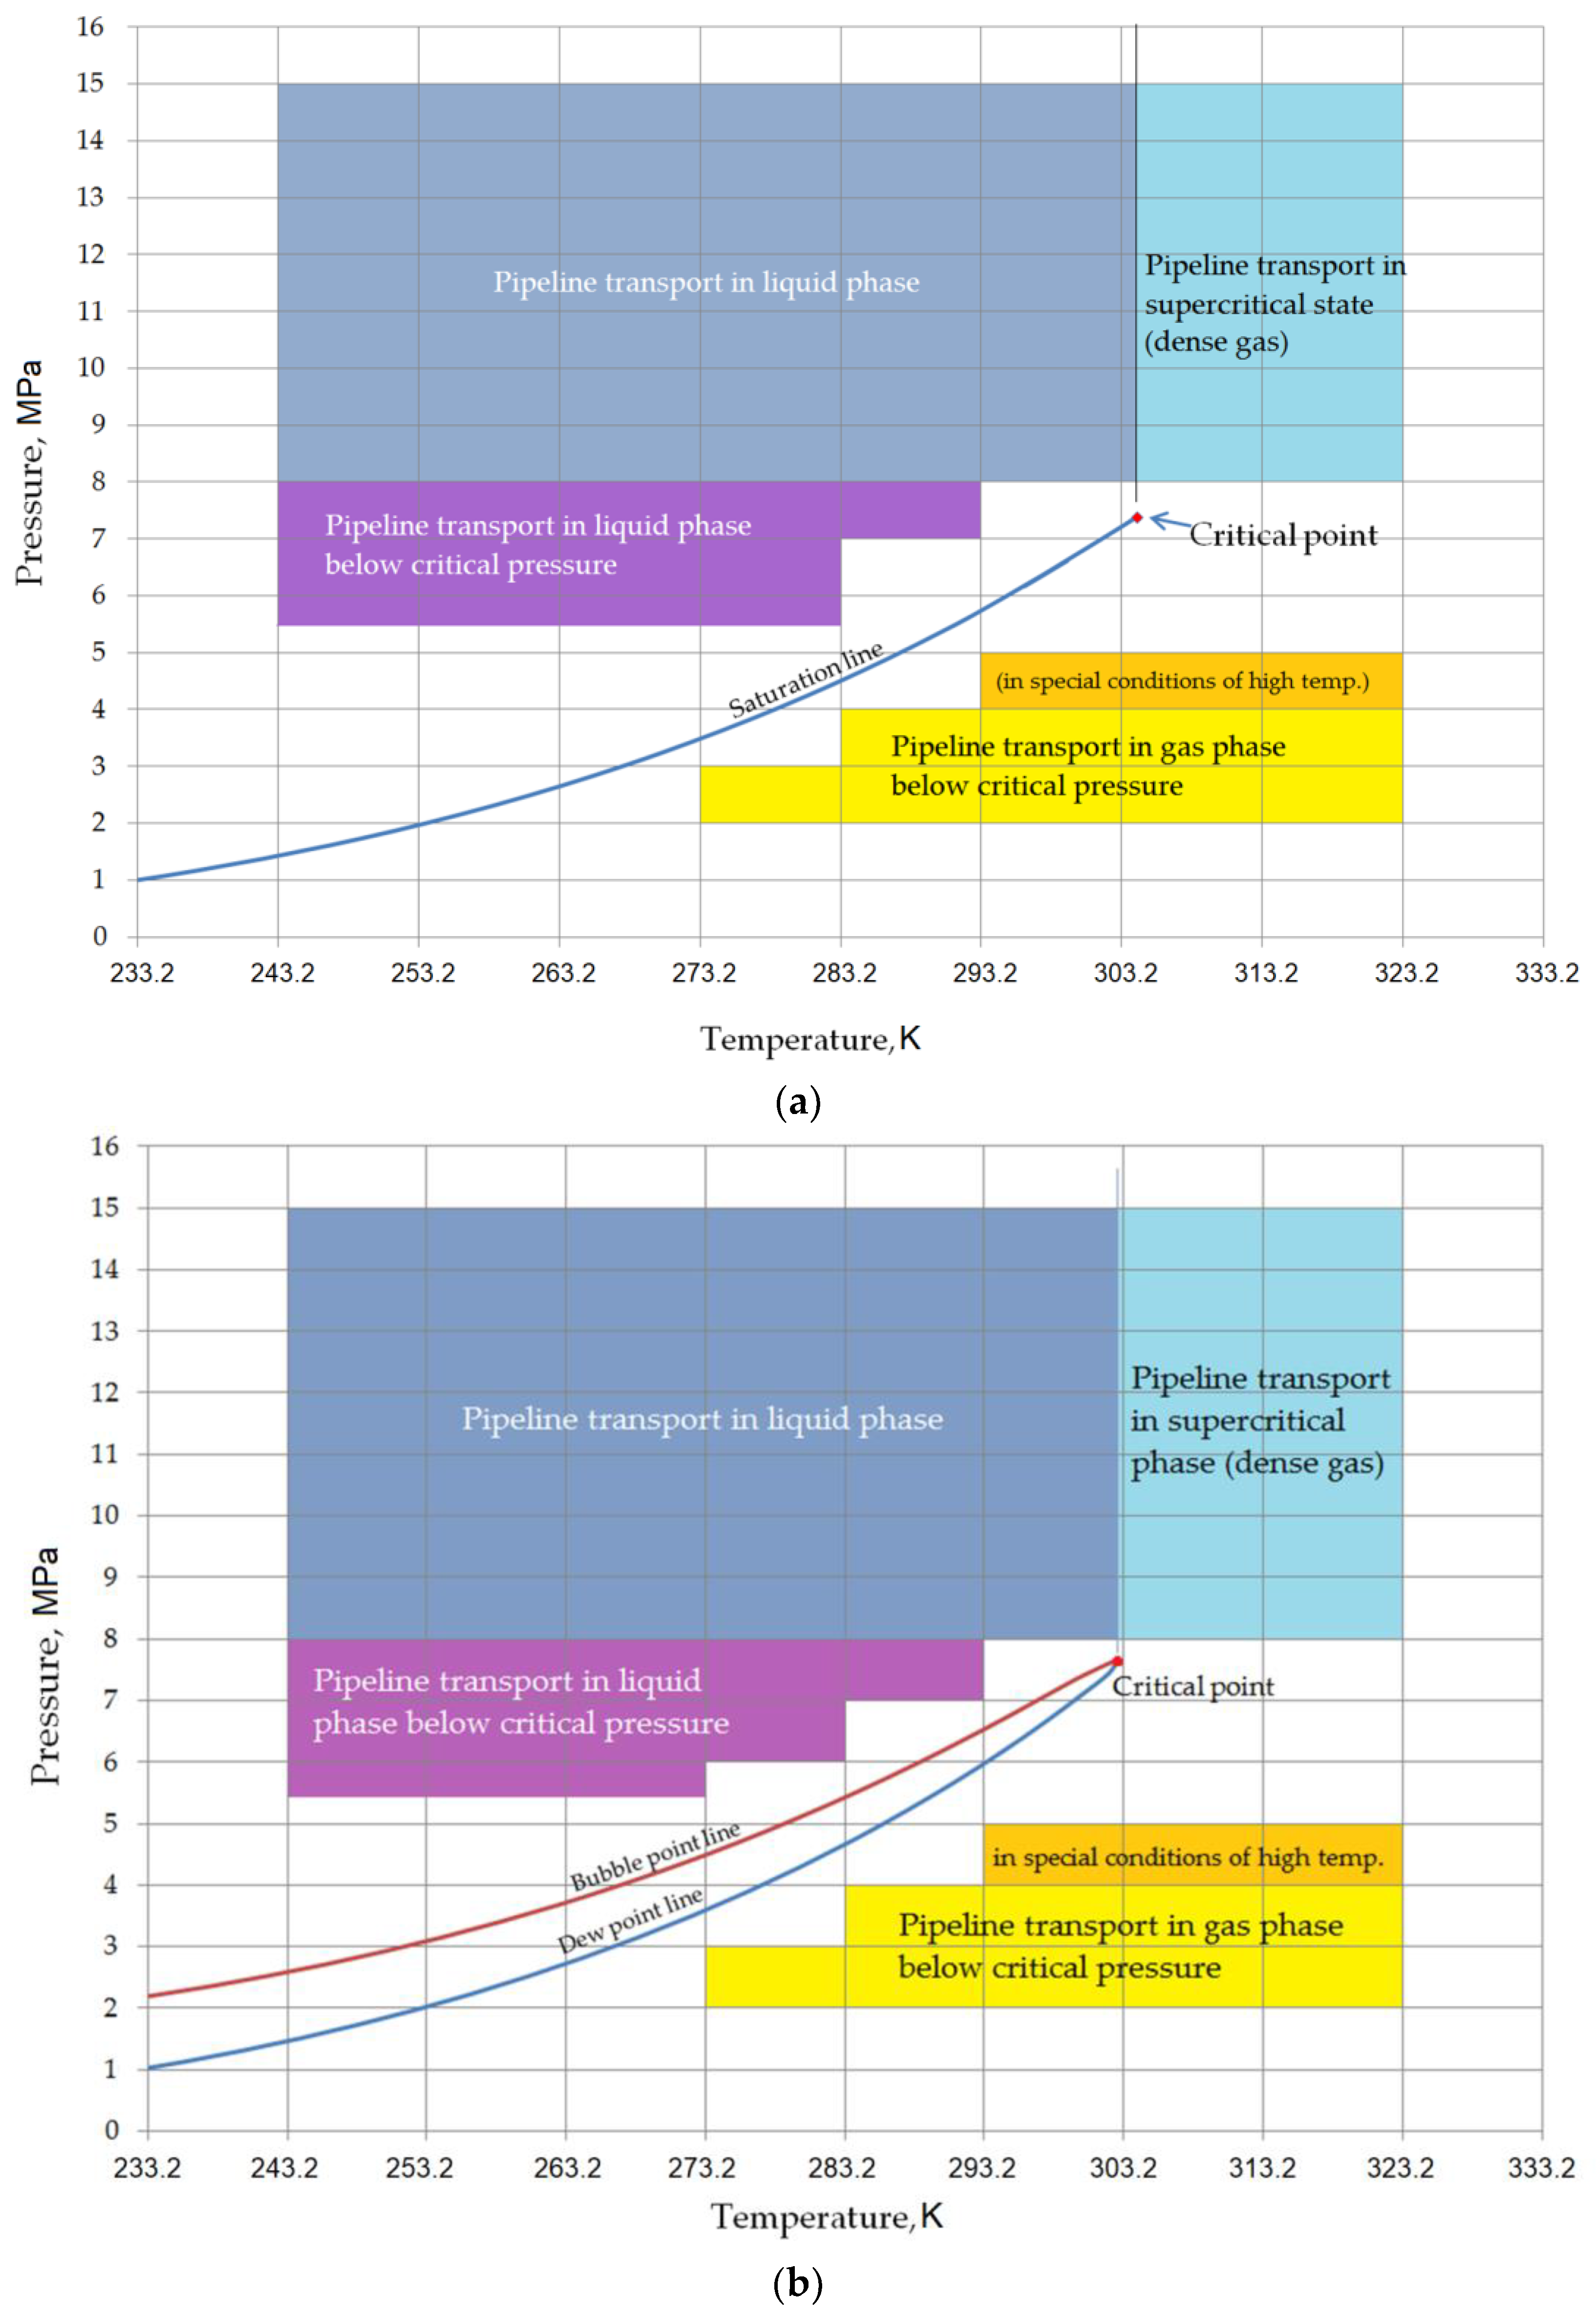
The need to maintain a high temperature when transporting CO2 in the supercritical phase, especially in temperate climates with large variations in soil temperature throughout the year or in soils with high thermal conductivity, makes pipeline transport of CO2 in the supercritical state technically impractical under these conditions. Molag and Dam have shown that analysis of the carbon dioxide phase diagram indicates a wide range of pressures and temperatures for the liquid phase of this compound [25]. Liquid carbon dioxide has a slightly higher density than in the supercritical phase, and this, together with the low compressibility of liquid CO2, is an additional advantage due to lower pressure drops along the pipeline. Therefore, liquid CO2 can be transported over relatively long distances using smaller pipeline diameters than in the gaseous or supercritical phase. The main problem with transporting liquid CO2 is its higher viscosity compared to the gas phase and supercritical state. The main risk of transporting liquid CO2, which is more significant than in the case of the supercritical phase (due to the greater difference in CO2 density between the liquid and gas phases), is the uncontrolled pressure drop in the pipeline and the appearance of a two-phase liquid–gas system, followed by the transition of CO2 to the gas state. To obtain carbon dioxide in the liquid phase, it must be compressed and cooled. Pipeline cooling for liquid CO2 may also be required in climates with large daily temperature variations. Typical ranges of operating parameters for CO2 transport pipelines are shown in Figure 2a,b and Table 2.

Figure 2.
(a)Typical operating parameter ranges for pure CO2 pipeline transport. Own study based on literature review [26,27,28,29,30,31,32,33,34,35,36]. (b) Typical operating parameter ranges for pipeline transport of CO2 with 2% of nitrogen. Own study based on literature review [26,27,28,29,30,31,32,33,34,35,36].
Table 2.
Typical operating parameter ranges for CO2 pipeline transport in different phases.
With a low allowable level of contaminants in the CO2 stream (Figure 2b), there is no restriction on the range of operating conditions for CO2 transport above the critical pressure. The presence of components such as nitrogen or hydrogen leads to the formation of a two-phase system in certain pressure and temperature ranges. This can have a negative effect on flow conditions only in the case of subsea pipeline transport, where the liquid CO2 stream can reach operating pressures below the critical pressure. The typical range of temperature conditions for pipeline transport of carbon dioxide is 303.2 K to 323.2 K. The temperature range is determined by the properties of the steel from which the pipeline is made; the lower limit is the commonly accepted minimum impact temperature of the steel, and above the upper limit, the steel must meet the operating requirements at higher temperatures. For transport in the gas phase, the pressure range is 2 to 4 MPa, and in the special conditions of CO2 transport, above 293.2 K, up to 5 MPa. For pipeline transport in the liquid phase, the typical pressure range is 8–15 MPa, although transport at lower pressures is possible, down to a minimum of 5.5–6 MPa in the case of constant, low ambient temperature (e.g., offshore pipelines) and appropriate CO2 input parameters. For the liquid phase, the maximum CO2 temperature should not exceed 303.2 K. For the supercritical phase, the typical operating pressure range of the pipeline is 8–15 MPa at temperatures of 308.2–323.2 K. Direct transition from the supercritical phase to the liquid phase is possible, but it is recommended to do so at an operating pressure above 10 MPa [13,26,27,28,29,30,31,32,33,34,35,36].
4. Hazards Related to CO2 Pipeline Transport
The transportation of carbon dioxide via pipeline from capture facilities to storage sites is associated with considerable health and environmental risks. The transportation of large volumes of carbon dioxide is primarily conducted through pipelines, which is considered one of the most efficient methods. Nevertheless, a notable risk is associated with pipeline failures, as they have the potential to rapidly release a concentrated CO2 cloud, which could pose significant health hazards. The dimensions of the released cloud are contingent upon a number of factors, including the geometry of the pipeline, the physical properties of the CO2 being transported, and the topography of the surrounding area. Carbon dioxide pipelines typically have diameters ranging from 200 to 700 mm and operate at pressures between 8 and 15 MPa, with some instances reaching 20 MPa.
Zhang et al. and Chen et al. indicate that a number of factors may result in pipeline damage, including leaking valves, sub-standard weld seams, corrosion, and human errors during excavation in the vicinity of the pipeline [37,38,39]. Furthermore, the formation of ‘hydrate plugs’ represents a significant concern, given the propensity of CO2 to produce hydrates and the presence of water in the flow stream. The primary risks associated with the transportation of carbon dioxide via pipeline are as follows:
- -
- Leakage of the pipeline and release of a significant amount of carbon dioxide.
- -
- Emergency release of carbon dioxide into the atmosphere.
- -
- Threat to human health and life from prolonged exposure to concentrated carbon dioxide.
- -
- Physicochemical properties of carbon dioxide—carbon dioxide, being heavier than air, spreads near the earth’s surface; leakage and release of large amounts of CO2 cause a sharp drop in temperature in the area of damage along with the formation of a solid phase of carbon dioxide.
- -
- CO2 emissions as a threat to the climate.
- -
- Possibility of rapid propagation of cracks and rapid leakage of the pipeline.
- -
- Impact on surface waters.
- -
- Corrosion of the pipeline material.
The above threats can be minimized by:
- -
- Inspection of the technical condition of the pipeline under the regulations.
- -
- Appropriate pipeline design taking into account reducing the length of the pipeline section between subsequent valve and relief units to 10 km.
- -
- Taking into account the material properties of the steel from which the pipeline is made, the correction of the pipeline wall thickness—allowance of wall thickness for rapid crack propagation (ductile fracture).
- -
- Routing the pipeline, if possible, outside highly urbanized areas.
- -
- Use of protective pipes on crossings with other infrastructure (roads, highways, railway lines, etc.) and in highly urbanized areas.
- -
- Additional pipeline protection in areas with unstable soil (wetlands, landslides, mining damage, etc.).
In order to mitigate the risk of pipeline failure, it is recommended that a number of preventative measures be implemented. These include the deep drying of CO2 in order to prevent corrosion and the formation of hydrates, the avoidance of elastomeric seals that are susceptible to dissolution by CO2, and the consideration of the possibility of brittle cracking at the design stage. The strategic placement of block valves and the implementation of automatic gas leak detection systems are also essential for ensuring pipeline safety. These systems facilitate the rapid closure of valves surrounding a leak, effectively containing the gas release to the affected pipeline section. In densely populated areas, the placement and number of block valves are of paramount importance in determining the hazard zone area and delineating the controlled zone along the pipeline [36,40].
5. CO2 Pipeline Accidents
The majority of documented failures of pipeline systems for carbon dioxide transport have occurred in the United States, largely due to the country’s extensive network length (approximately 8500 km in 2023) and the longest operational history of any such system. A review of the PHMSA database revealed that 113 incidents involving CO2 pipelines onshore were documented between 1994 and 2021. The mean number of incidents per year reported between 2004 and 2021 was 5.11 [41]. Fortunately, none of these incidents resulted in fatalities, and only one incident resulted in an injury, according to data provided by the PHMSA. The absence of fatalities and injuries can be attributed to the remote locations of the majority of pipelines and the time-dependent nature of CO2 exposure, in contrast to scenarios involving hydrocarbons such as fire and explosions, which can result in immediate harm. Furthermore, with regard to the most significant CO2 incident (the Satartia accident in 2020), the incident report does not provide clear documentation of injuries, despite referencing 46 hospitalizations following the release. On 22 February 2020, a 24-inch CO2 pipeline ruptured in the vicinity of Satartia in Fuzzy County, Mississippi, USA. The rupture resulted in the release of liquid CO2, which rapidly vaporized upon contact with atmospheric conditions. This incident led to the release of approximately 31,405 barrels of carbon dioxide, as documented in the Failure Investigation Report by PHMSA [42].
Upon release into the atmosphere, liquid CO2 vaporizes and, due to its density being 1.53 times greater than that of air, it can displace oxygen, thereby posing a risk of asphyxiation to humans and animals. At the site of the accident, the prevailing weather conditions and the specific topography impeded the rapid dispersion of the CO2 vapor, thereby preventing the formation of a plume that could have migrated towards Satartia (Figure 3). In response to the incident, the Yazoo County Office of Emergency Management initiated an evacuation of the surrounding area. Approximately 200 individuals, comprising the entirety of Satartia’s population (approximately 50 residents) and three households situated across the Yazoo River, were evacuated. As detailed in the PHMSA accident report, 45 individuals sought medical attention at local hospitals, including those who were exposed to the vapor cloud while driving. One individual was admitted to hospital for reasons unrelated to the pipeline failure, and it was fortunate that there were no fatalities.
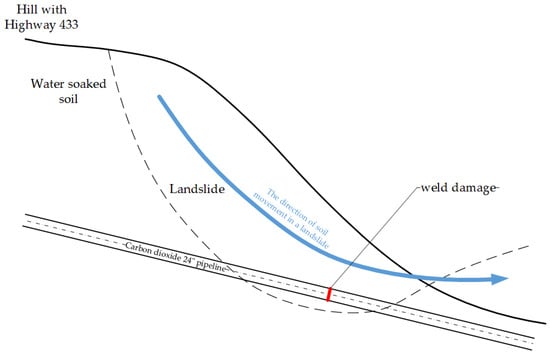
Figure 3.
Cross-sectional view of Satartia pipeline failure. Own study.
In order to gain insights into the environmental and operational consequences of pipeline incidents, it is possible to examine the amount of CO2 released into the atmosphere and the duration of pipeline shutdowns required to restore operations. These data are available in the PHMSA database. Of the total 113 registered events, 45 resulted in the necessity of pipeline shutdowns, while 52 incidents did not require such action, and information is unavailable for the remaining 16 cases. It is notable that the average duration of a pipeline shutdown is approximately 53 h, with an exception occurring in 2020 in Satartia, where a pipeline shutdown was required for 246 days [41].
6. Modelling of CO2 Plume Related to Pipeline Malfunctions
In the context of carbon dioxide pipeline transport, it is imperative to conduct a comprehensive analysis of potential risk scenarios in order to adequately assess and plan safety measures around pipeline infrastructure. A comprehensive risk assessment can be conducted by considering a variety of potential events and their implications, which allows for the design of effective strategies to minimize potential adverse effects. In the context of CO2 pipeline transportation, scenarios typically associated with conventional flammable and explosive materials, such as the extent of thermal radiation, blast overpressure waves, and the range of flammable clouds, have limited applicability. Such scenarios may be considered when examining the domino effect (impact on neighboring industrial installations). It is crucial to acknowledge that the primary risks associated with carbon dioxide pipeline transport are the potential health hazards related to asphyxiation and the thermal and mechanical effects resulting from the physical properties of CO2 itself.
In order to accurately estimate the consequences of chemical releases, it is essential to utilize mathematical modeling to analyze their behavior after release. In this context, the utilization of advanced algorithms for modeling carbon dioxide dispersion is of paramount importance. The calculations were conducted utilizing Phast™ 8.71 software, developed by Det Norske Veritas (DNV). As part of the research conducted, simulations of cloud dispersion during a CO2 pipeline leak were carried out. A series of simulation scenarios were identified and subjected to rigorous analysis. Constant conditions were adopted for the simulations, as summarized in Table 3.
Table 3.
Parameters used for analytical simulation studies.
6.1. Assessing the Impact of Rupture Orientation on CO2 Dispersion Zones
In order to gain a more precise understanding of the different leakage scenarios, an initial assessment was conducted to determine the impact of the rupture orientation in the pipeline on the size of the resulting impact zones. The scenarios examined in this study have been grouped into three main categories based on the size and location of the perforation:
The parameters set for these simulations were as follows: the pressure inside the pipeline was maintained at 15 MPag, the temperature of the CO2 was kept at 288.2 K, the rate of CO2 being pumped through the system was 100 kg/h, the elevation of the pipeline above ground level was set at 1 m (elevation for buried pipeline: −1 m), and the nominal diameter of the pipeline was DN200.
The outcomes presented in these figures highlight the maximum distances and heights at which a CO2 concentration of 30,000 ppm—the benchmark for comparison—was observed.
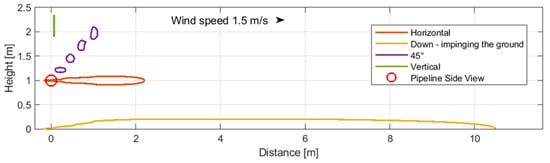
Figure 4.
Case 1: Above-ground pipeline with small perforation (1 mm).
Figure 4.
Case 1: Above-ground pipeline with small perforation (1 mm).
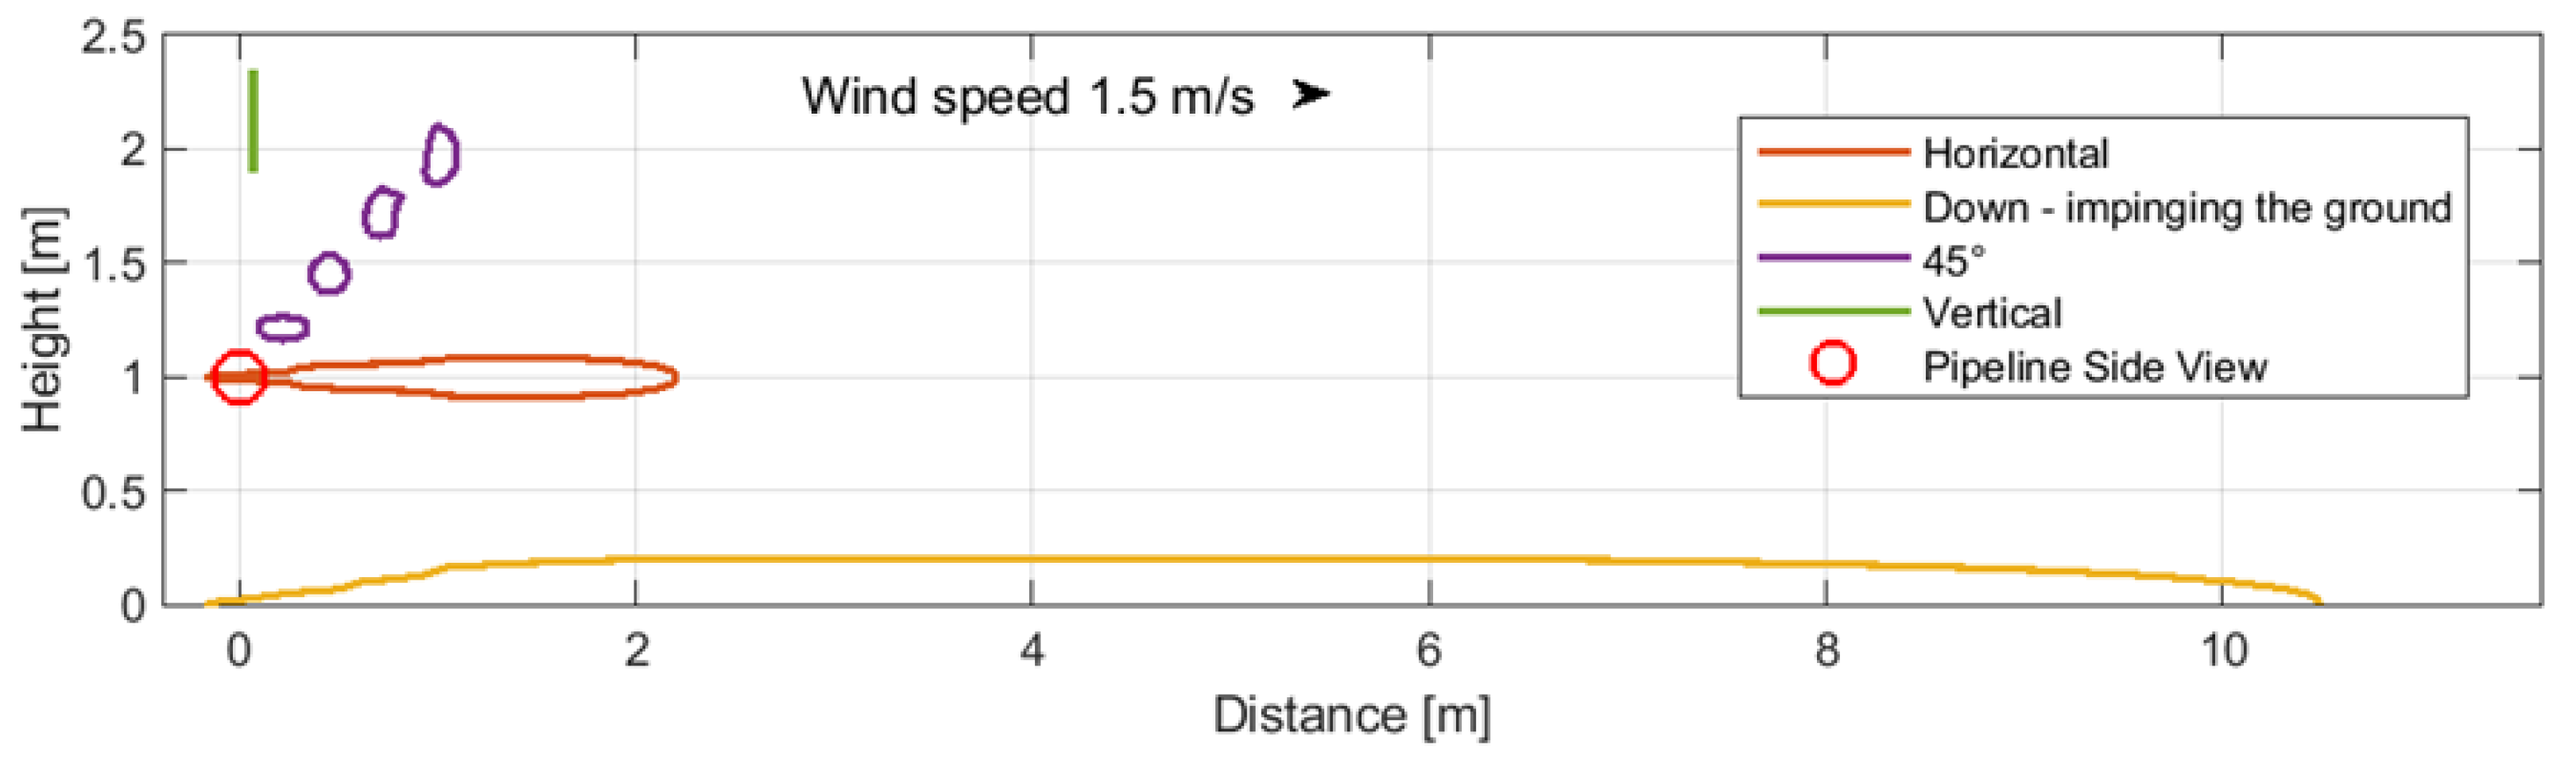
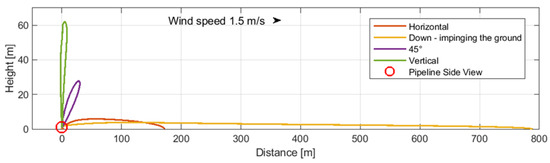
Figure 5.
Case 2: Above-ground pipeline rupture (50 mm).
Figure 5.
Case 2: Above-ground pipeline rupture (50 mm).
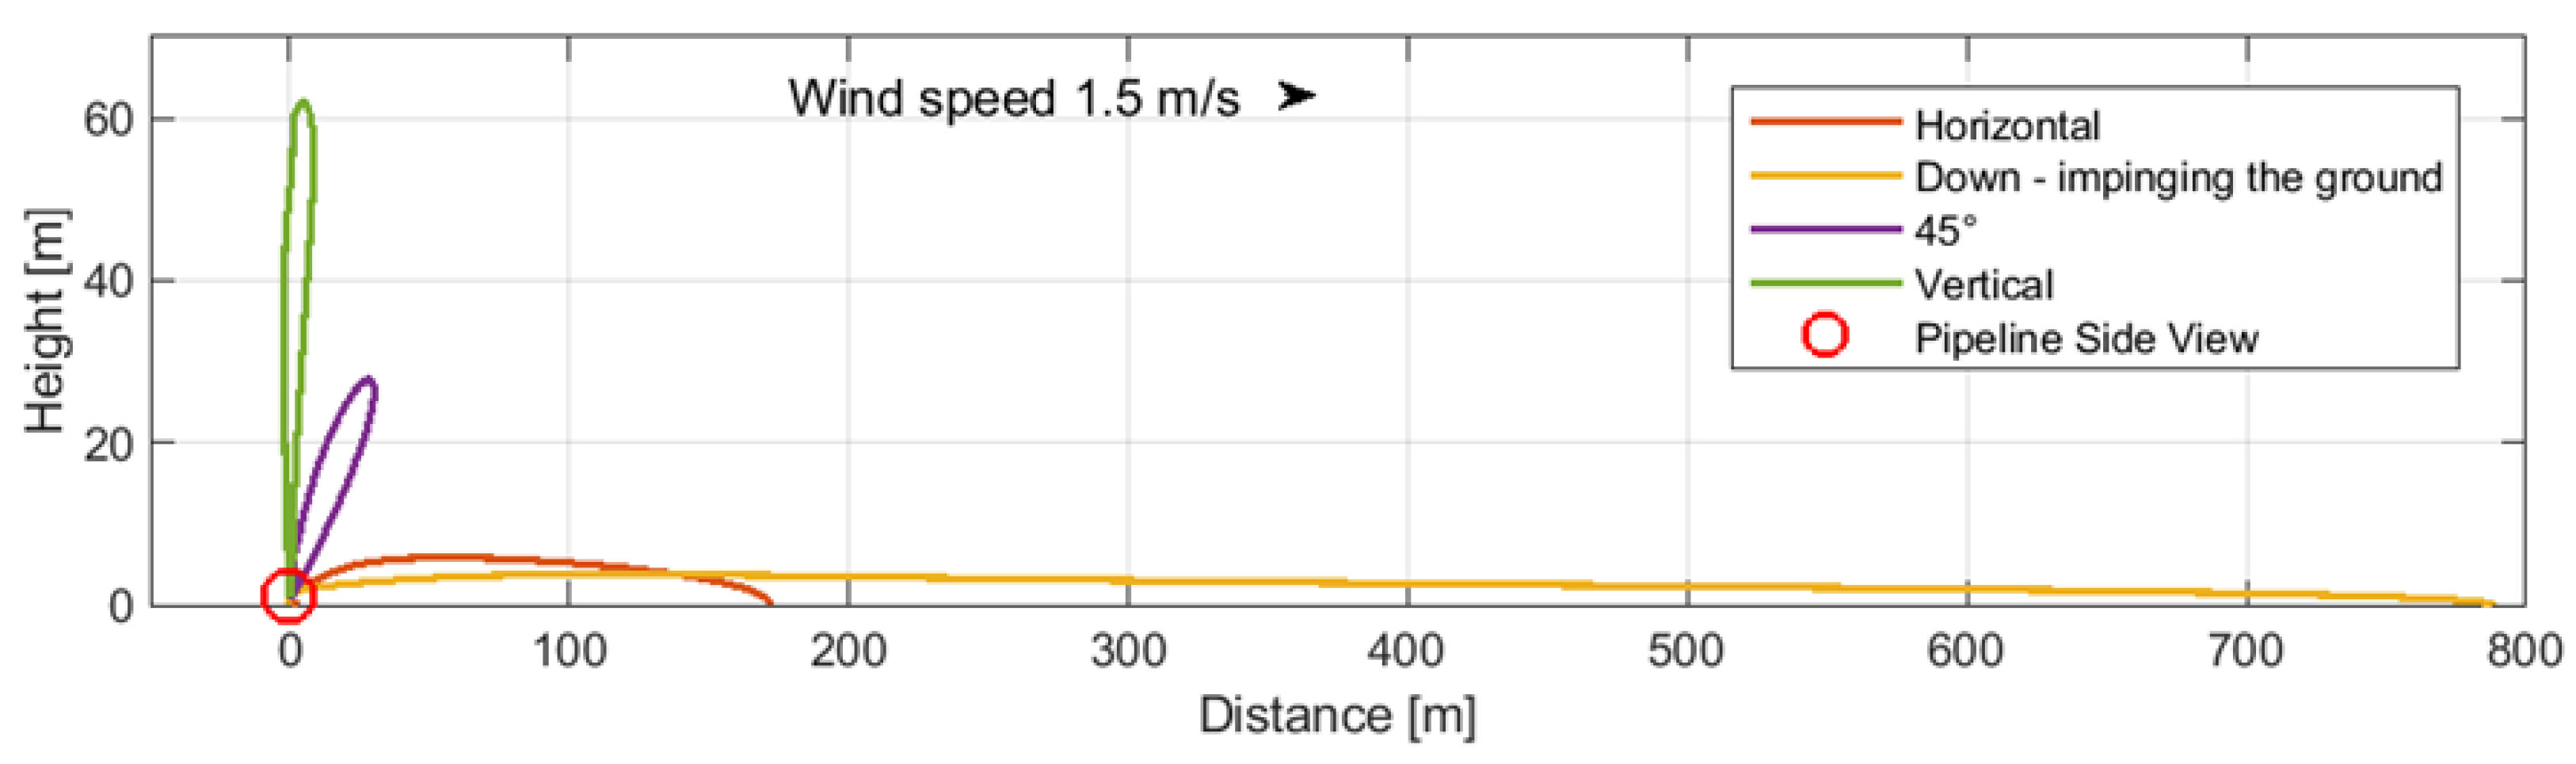

Figure 6.
Buried pipeline with varied perforation sizes (1 mm, 25 mm, 50 mm).
Figure 6.
Buried pipeline with varied perforation sizes (1 mm, 25 mm, 50 mm).
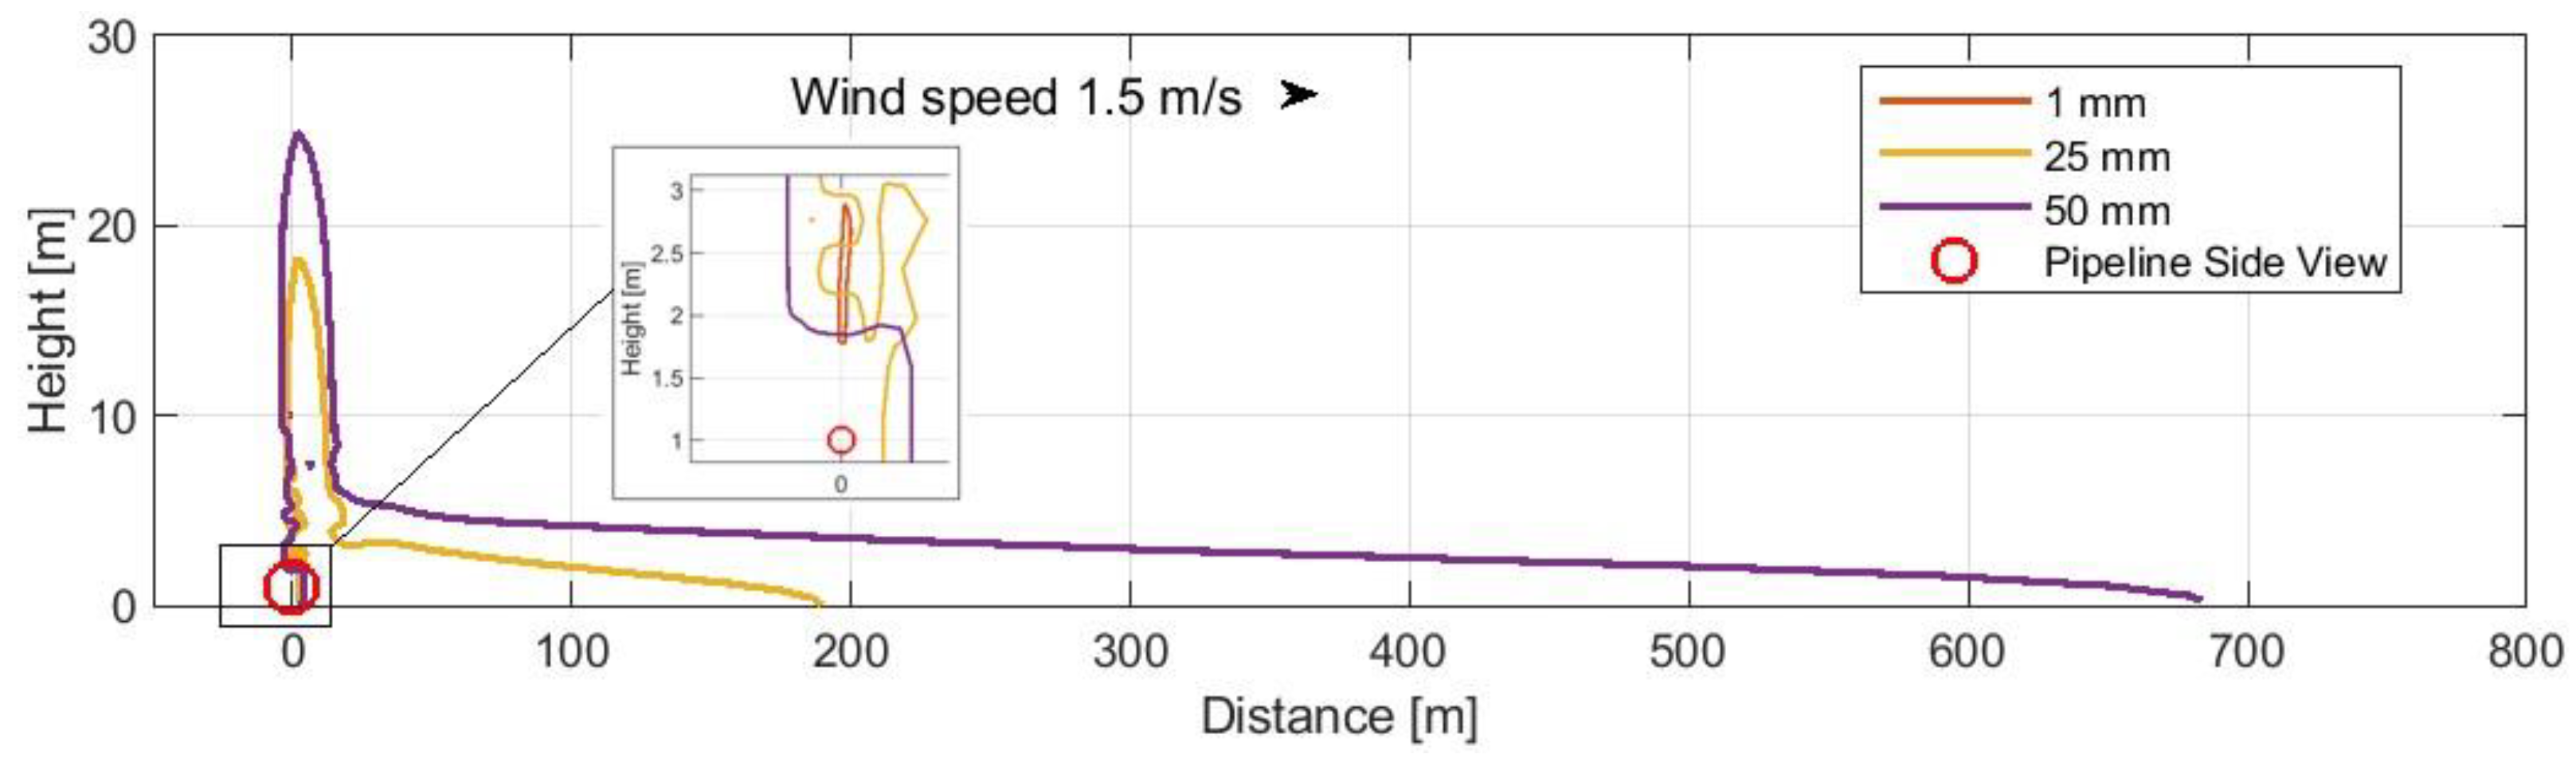
The data presented in Figure 4, Figure 5 and Figure 6 illustrate that a pipeline breach directed downwards, impinging on the ground, resulted in the greatest dispersion distances in all instances (Figure 4 and Figure 5, yellow lines). In comparison to CO2 dispersion zones in the case of buried pipelines, the examined zone exhibited a reduction in range (Figure 6). A leak directed downwards necessitates particular attention with regard to the potential hazard to individuals in the vicinity, which may affect a larger area. Further calculations were conducted on this case and the case of above-ground pipelines.
6.2. The Impact of the CO2 Transport Phase on Dispersion Ranges
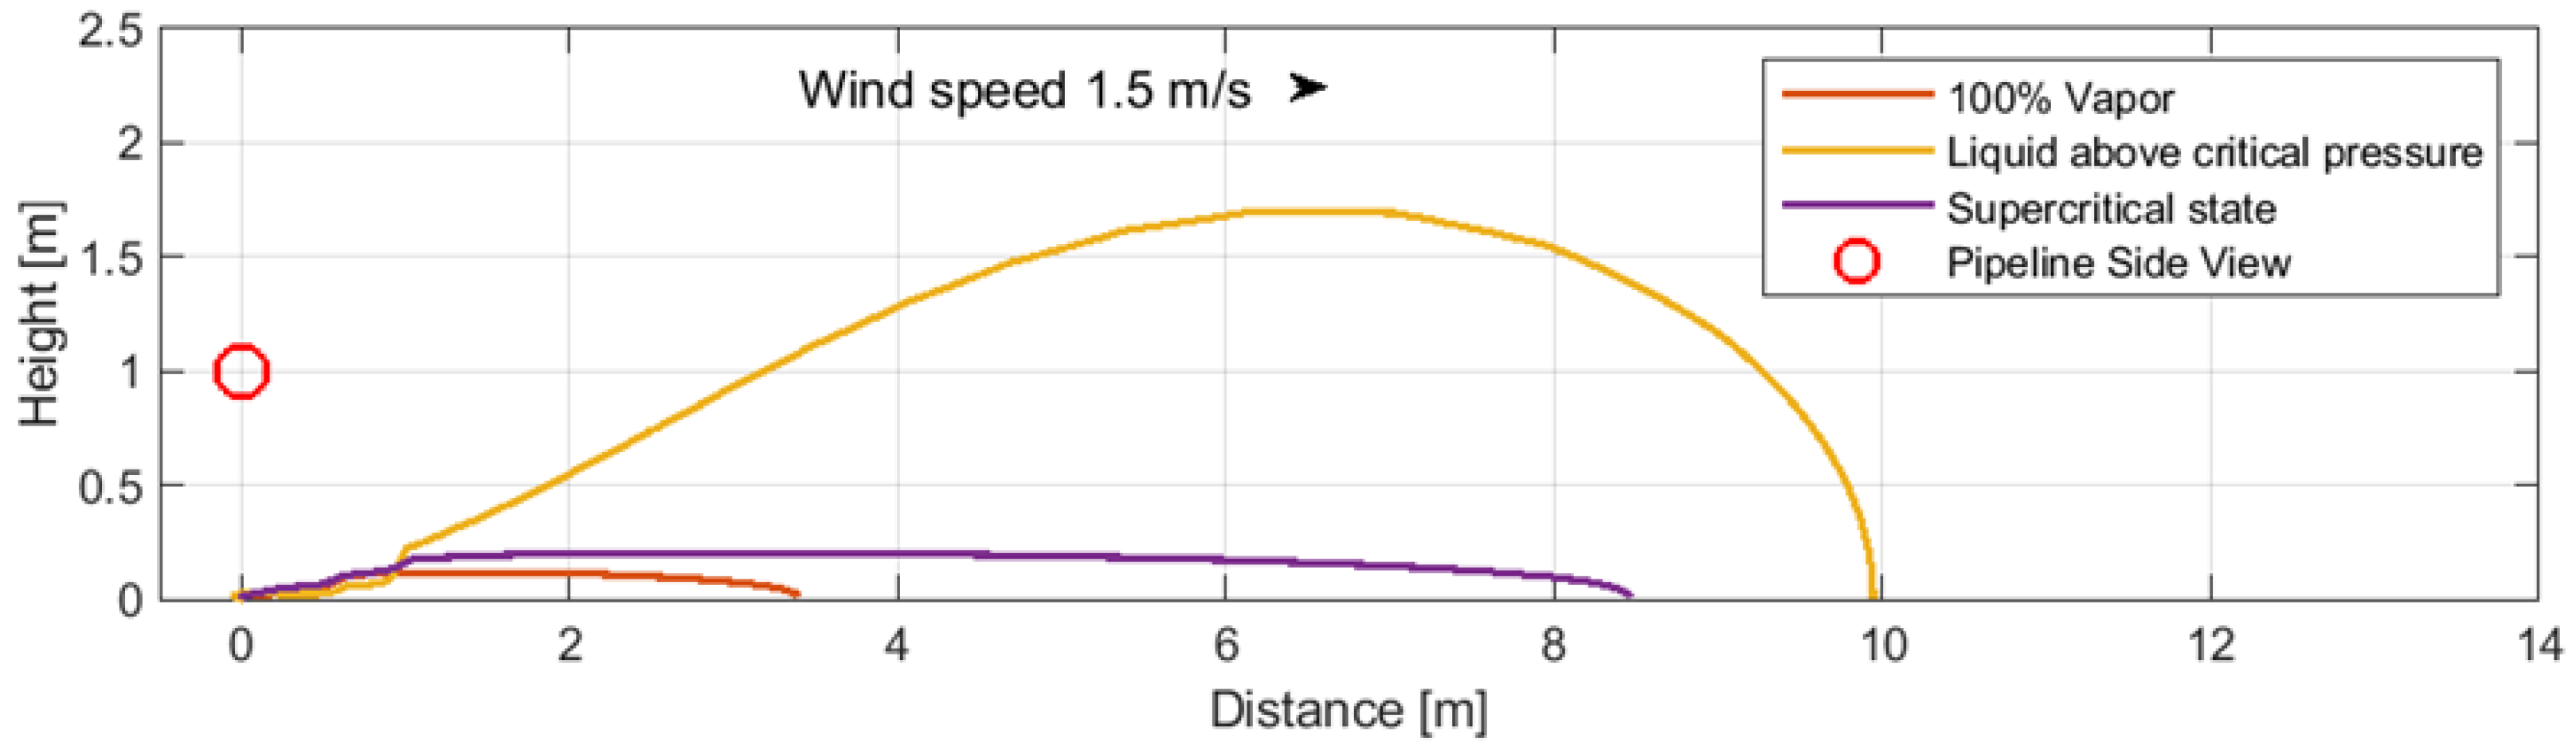
The impact of the phase in which carbon dioxide is transported on the size of CO2 dispersion zones during a leak through a 1 mm perforation impinging on the ground was analyzed (cases 4–6). The calculations were based on consistent parameters outlined in Table 3: a pumped inflow of 100 kg/h, an elevation of 1 m, and a pipeline diameter of DN200. The analysis compared distances at which the CO2 dispersion zone reached a concentration of 30,000 ppm across three different CO2 transport phases (Figure 7):
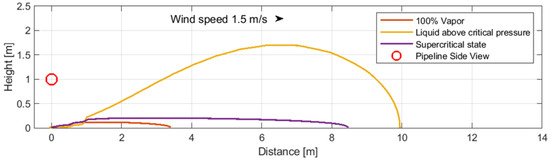
Figure 7.
Cases 4–6: Dispersion zone ranges for a CO2 concentration of 30,000 ppm, distinguished by CO2 phase.
- -
- Case 4: 100% vapor CO2, pressure: 4 MPag, temperature: 288.2 K.
- -
- Case 5: Liquid above critical pressure, pressure: 12 MPag, temperature: 288.2 K.
- -
- Case 6: Supercritical state, pressure: 12 MPag, temperature: 308.2 K.
The dispersion zone of CO2 in the gas phase (4 MPag, 288.2 K) is the smallest, followed by CO2 in the liquid state above the critical pressure (12 MPag, 288.2 K). In contrast, the CO2 dispersion zone in the supercritical state (10 MPag, 308.2 K) has the greatest range, indicating that higher temperature and pressure contribute to a larger gas expansion.
6.3. Pumped Inflow and Pipeline Diameter
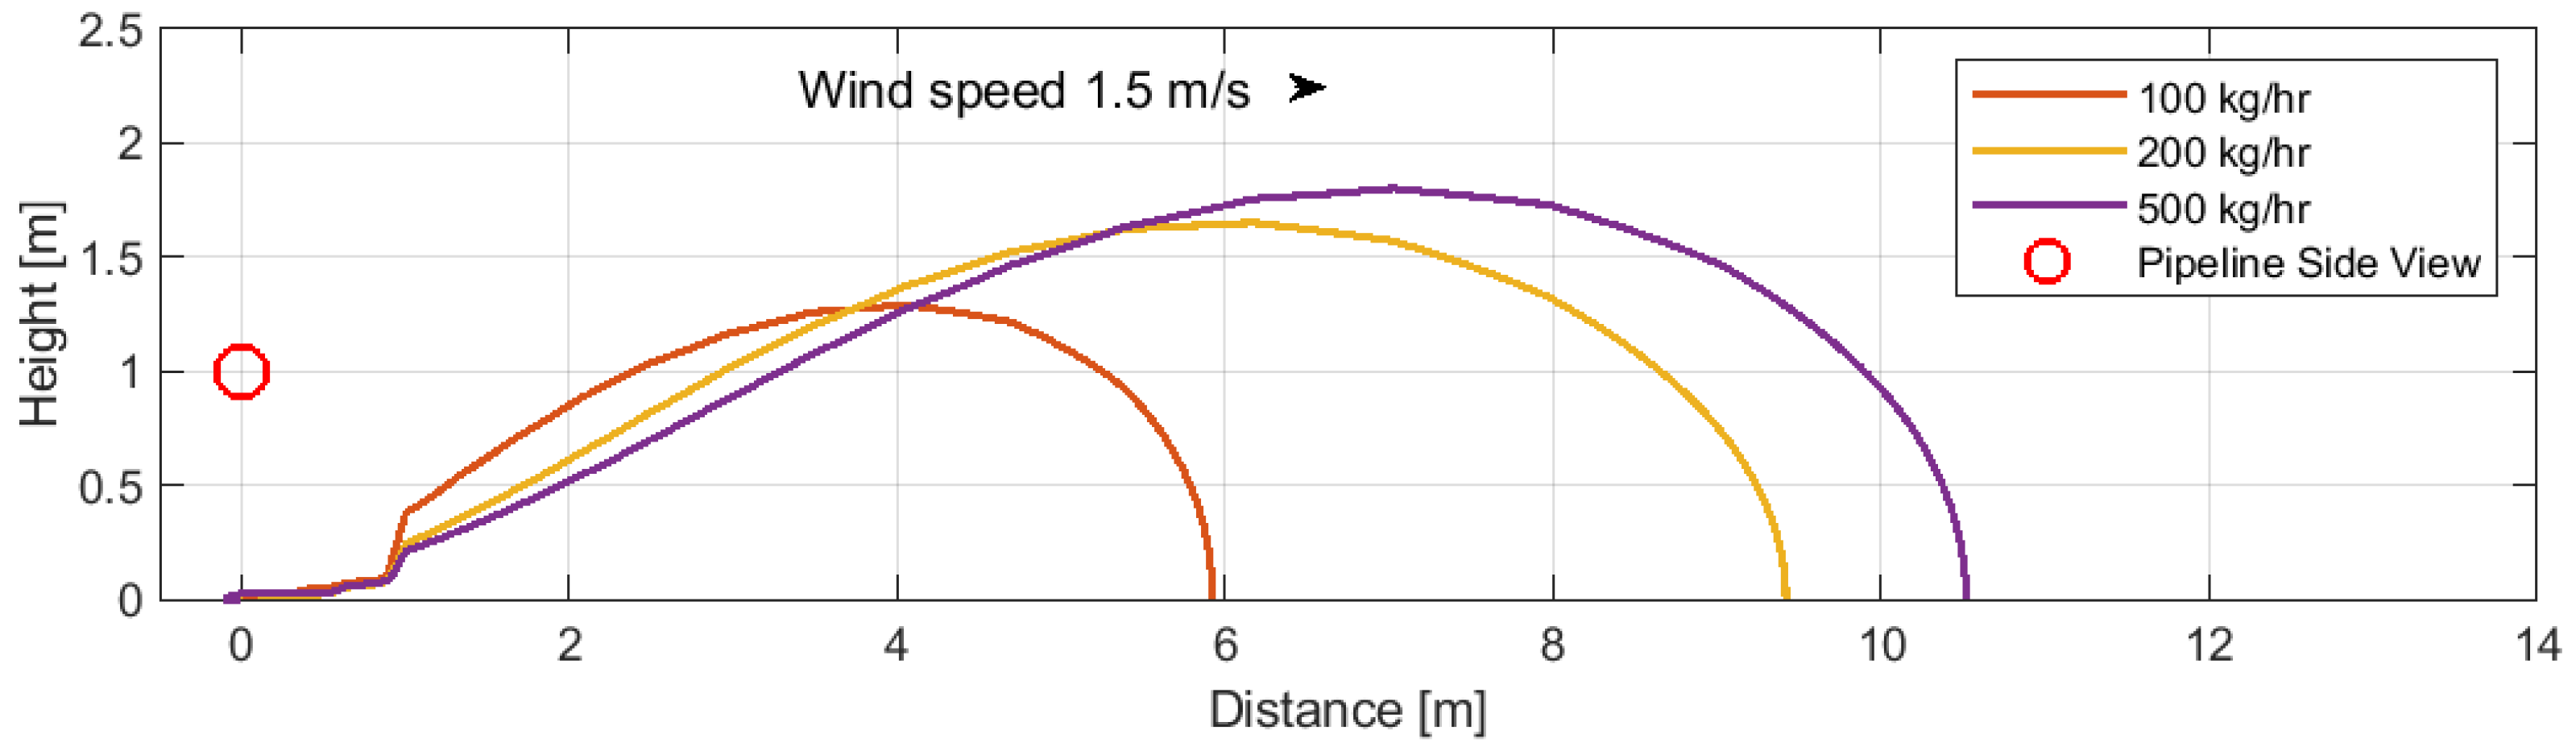
It is assumed that the inclusion of a 1 mm diameter perforation in the calculations functions as an orifice [43,44]. Accordingly, when the aforementioned variables remain constant, alterations to the pipeline diameter have no effect on the predicted ranges of the dispersion zones. In light of the aforementioned premise, the primary determinants of the dispersion zone ranges are the characteristics of the orifice (its diameter) and the atmospheric conditions. This assertion is contingent upon the pressure within the pipeline being sufficient to sustain a consistent flow through the leakage orifice. Subsequent analyses were conducted to evaluate the impact of varying flow rates on the distances at which a CO2 concentration of 30,000 ppm is attained (case 7). These simulations were conducted under steady conditions, as detailed in Table 3, with flow rates of 100, 200, and 500 kg/h. Figure 8 illustrates the correlation between flow rate and the distance at which this CO2 concentration occurs.
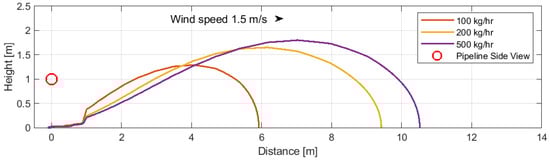
Figure 8.
Case 7: Dispersion zone ranges for a CO2 concentration of 30,000 ppm, distinguished by flow rates.
It was observed that the size of the CO2 dispersion zone increased in proportion to the flow rate. A flow rate of 100 kg/h resulted in the least distance of CO2 dispersion, with a minimal peak height before descending towards the ground. This resulted in the smallest dispersion zone of the three tested rates. An increase in the flow rate to 200 kg/h results in a higher peak height of the plume and a broader dispersion zone extending further downwind. At the maximum tested flow rate of 500 kg/h, the dispersion plume reaches the highest peak and spans the widest area downwind, indicating a direct relationship between the amount of CO2 released per time unit and the dispersion range.
6.4. Weather Conditions Analysis
This case study aimed to assess the impact of ambient temperature and wind dynamics, including wind type and speed, on the extent of the carbon dioxide dispersion zone, set at a threshold concentration of 30,000 ppm (case 8). The analysis employed data comparable to a scenario involving a leak of 1 mm in diameter, as illustrated in Figure 8, associated with a pump operating at 100 kg/h. Simulations were conducted for three distinct wind speeds (1.5, 10, and 20 m/s) across a range of Pasquill stability classes from A (very unstable) to G (very stable), as presented in Table 4.
Table 4.
Case 8: Dispersion zone ranges for a CO2 concentration of 30,000 ppm, distinguished by Pasquill stability class and wind speed.
A review of the presented results indicates that the maximum range of the carbon dioxide dispersion zone at a concentration of 30,000 ppm is contingent upon both the atmospheric stability class according to Pasquill and the speed of the wind. In general, an increase in wind speed results in a reduction in the range of the dispersion zone. The longest distances observed for CO2 dispersion were in conditions of very stable atmospheric stability (class G) and low wind speeds (1.5 m/s), with a range of 7.15 m. However, at wind speeds of 20 m/s, even in very stable conditions, the maximum dispersion range decreased to 3.32 m. It is evident that there is a discernible decline in the dispersion range with the increase in wind speed, irrespective of the atmospheric stability class. In conditions of high atmospheric instability (class A), the greatest reduction in dispersion range is observed when the wind speed changes from 1.5 m/s to 10 m/s, with the range decreasing from 4.9 to 1.98 m. An increase in speed to 20 m/s results in a further reduction in range to 1.38 m. Furthermore, the impact of atmospheric stability on the dispersion zone range is worthy of note. In low wind speeds, the range is greater in more stable conditions, whereas in higher wind speeds, this impact is less pronounced. This can be explained by the fact that at higher wind speeds, the influence of atmospheric turbulence becomes less significant for the dispersion process. The results were presented in Table 5.
Table 5.
Case 9: Dispersion zone ranges for CO2 at 30,000 ppm, affected by ambient temperature.
A review of the data in Table 5 reveals a discernible trend: the range within which carbon dioxide disperses at a concentration of 30,000 ppm widens with an increase in ambient temperature. Of particular note is the observation that this effect is amplified at elevated temperatures, suggesting that higher ambient temperatures may facilitate more extensive dispersion of carbon dioxide in the atmosphere. This phenomenon can be attributed to the fact that in warmer air, gas molecules move with greater velocity, leading to a wider spread.
6.5. Determining Death Risks in the Zone near the Pipeline
The risk of death near the pipeline can be expressed as the product of the probability of the occurrence of a hazardous carbon dioxide leak event and its consequences [45]: Risk = probability of failure (POF) × Consequence of failure (COF). In risk assessment, probit models are employed to consider the volumes of hazardous carbon dioxide released from damaged pipeline sections and the subsequent implications for human health and the natural environment. Using the assumptions presented in Table 6, calculations were conducted to determine the toxic probability of death for the cases outlined in Table 7.
Table 6.
Parameters used for calculations: toxic probability of death.
A series of calculations were conducted using the data from Table 6 to ascertain the toxic probability of death for the aforementioned cases 1–7, with the assumption of a pipeline rupture probability of 2.0 × 10⁻⁵ per year [36,45]. The impact zones for the toxic probability of death at levels of 0.990, 0.5, and 0.001 were identified. The calculations assumed a wind velocity of 1.5 m/s (stable and moderate) and an ambient temperature of 283.2 K. The cases analyzed are as follows:
- -
- Case 1: Above-ground pipeline with small perforation (1 mm)—directed down (Figure 4).
- -
- Case 2: Above-ground pipeline rupture (50 mm)—directed down (Figure 5).
- -
- Case 3(a): Buried pipeline with varied perforation sizes (1 mm) (Figure 6).
- -
- Case 3(b): Buried pipeline with varied perforation sizes (25 mm) (Figure 6).
- -
- Case 3(c): Buried pipeline with varied perforation sizes (50 mm) (Figure 6).
- -
- Case 4: 100% vapor CO2, pressure: 4 MPag, temperature: 288.2 K (Figure 7, orange line).
- -
- Case 5: Liquid above critical pressure, pressure: 12 MPag, temperature: 288.2 K (Figure 7, yellow line).
- -
- Case 6: Supercritical state, pressure: 12 MPag, temperature: 308.2 K (Figure 7, purple line).
- -
- Case 7(a): Pump flow rate: 100 kg/h (Figure 8, orange line).
- -
- Case 7(b): Pump flow rate: 200 kg/h (Figure 8, yellow line).
- -
- Case 7(c): Pump flow rate: 500 kg/h (Figure 8, purple line).
A lower boundary for the toxic probability of death was established at the 0.001 fraction, delineating a safety zone based on the accumulated simulation data. The majority of cases considered the probability of pipeline rupture at 2.0 × 10⁻⁵ per year for a perforation size of 1 mm. With regard to the rupture scenario, the largest safety zone in terms of toxicity was observed in case 7(c), which exhibited the highest examined flow rate. This finding highlights the considerable influence of flow rate on the dispersion of toxic substances and the resulting safety zones. As the flow rate increased, the safety zones expanded, indicating the necessity for more rigorous measures to ensure safety in scenarios with higher flow rates. Furthermore, the simulation underscores the importance of considering both the size of the leak and the flow rate when assessing risk and establishing safety protocols for potential toxic gas leaks. The classification into distinct cases and the corresponding impact ranges for different levels of toxic probability of death are detailed in Table 7.
Table 7.
Toxic probability of death: impact ranges.
Table 7.
Toxic probability of death: impact ranges.
| Toxic Probability of Death, frac | 0.990 | 0.500 | 0.001 | Remarks |
|---|---|---|---|---|
| Distance Downwind, m | ||||
| Case 1 | 3.3 | 4.6 | 6.7 | |
| Case 2 | 142.1 | 239.2 | 454.0 | 50 mm rupture |
| Case 3(a) (buried) | <0.1 | <0.1 | <0.1 | |
| Case 3(b) (buried) | max. 0.42 frac./10.6 m | - | 48.0 | 25 mm rupture |
| Case 3(c) (buried) | 64.1 | 118.4 | 267.2 | 50 mm rupture |
| Case 4 | 1.14 | 1.4 | 2.0 | |
| Case 5 | 3.3 | 4.4 | 6.4 | |
| Case 6 | 3.3 | 3.9 | 5.7 | |
| Case 7(a) | 2.8 | 3.5 | 4.6 | |
| Case 7(b) | 3.3 | 4.4 | 6.2 | |
| Case 7(c) | 3.3 | 4.6 | 6.8 | |
A threshold for the toxic probability of death was established at 0.001, delineating a safety perimeter based on the accumulated simulation data. A multitude of scenarios considered a leak size of 1 mm with an estimated pipeline rupture probability of 2.0 × 10⁻⁵ per year. In such instances, the most expansive safety zone in terms of toxicity was observed in case 7(C), which investigated the largest flow rate for above-ground pipeline incidents.
In the case of above-ground pipelines, a 1 mm leak size resulted in an impact zone of no more than 6.8 m at the 0.001 toxic probability of death level. This is applicable to instances of pipeline rupture with a leak size of 1 mm. For breaches of a greater magnitude, the zones of influence were found to be considerably more extensive, indicating a notable variation in the potential hazard area contingent on the severity of the rupture. For larger ruptures, as illustrated by the more extensive dispersion zones in case 2 for a 50 mm rupture, there is a marked increase in the affected area, underlining that the size of the pipeline rupture is a significant determinant of the risk profile. The implications for safety planning are clear: larger perforations present a higher risk and require larger safety zones to mitigate the potential for damage.
7. Conclusions
The study’s comprehensive modeling of CO2 dispersion due to pipeline failures highlights the complexity of establishing safety zones around such infrastructure. A rigorous analysis of different pipeline rupture scenarios, CO2 phases, and flow rates provides crucial insights into the behavior of CO2 plumes and their potential impact on human safety. The use of toxic probability of death as a baseline for safety zones allows the formulation of protective measures tailored to the severity of pipeline ruptures and operating conditions. For above-ground scenarios, particularly for a 1 mm leak size (gasket leakage), the simulation data show that the dispersion zones for this minimum probability level remain within a 6.8 m radius, providing a relatively contained area for immediate safety response for the considered scenarios.
However, when larger perforations are considered, the extent of the affected areas increases significantly. For example, case 2 with a 50 mm perforation showed dispersion zones extending up to 454 m downstream at the 0.001 probability level. This stark contrast between the effects of small and large perforations cannot be overemphasized and must be taken into account when establishing emergency protocols and evacuation procedures. For buried pipelines with similar perforation sizes, the dispersion zones show even greater ranges, such as in case 3(c), where the range at the 0.001 probability level extends to 267.2 m. This highlights the need for even more extensive safety measures for underground infrastructure.
These findings align with existing research that emphasizes the importance of detailed risk assessment and modeling in CO2 pipeline transport. For instance, Macchietto and Maschio (2021) highlighted the critical role of considering various rupture scenarios to understand the full extent of potential CO2 dispersion and its impacts on safety [46]. Wareing et al. (2016) also underscored the necessity of considering various rupture scenarios to understand the full extent of potential CO2 dispersion and its impacts on safety [23]. Additionally, studies on CO2 plume behavior under different environmental conditions support the observed variations in dispersion zones, further validating the need for adaptive safety protocols [24]. Moreover, Vitali et al. (2022) emphasized the importance of statistical analysis of pipeline incidents, particularly focusing on the role of impurities and environmental factors in affecting pipeline integrity and the subsequent dispersion of CO2 [41].
The results also provide valuable benchmarks for planning evacuation times. The distances calculated for the toxic probability of death levels, taking into account the most unfavorable case (the highest flow rate of 500 kg/h, resulting in the largest zone), suggest the need for a rapid response to ensure safety. Emergency procedures must take into account the furthest reaches of these zones to allow timely evacuation and reduce the risk of asphyxiation-related injuries or deaths. Given these findings, it is clear that developing a “safe zone” must be dynamic and adaptable to the various factors influencing CO2 dispersion, including the CO2 phase, environmental conditions, and operational parameters such as flow and pressure. These factors form a complex matrix of potential outcomes that must be navigated through careful planning and the integration of real-time monitoring systems to effectively manage the risk of CO2 pipeline transport.
In summary, the establishment of safe zones and associated thresholds for CO2 concentrations over time are not static values but vary significantly depending on the specific conditions of each case. This requires a layered approach to safety, with contingency plans tailored to the nuances of each potential risk scenario. Such an approach will ensure that safety measures remain robust and responsive to the unpredictable nature of pipeline incidents, protecting public health and the environment. For future endeavors, it is vital that simulation models are enhanced to take into account a wider range of variables. Incorporating data on local weather patterns, topography, and climate trends could significantly improve the accuracy of safety zone predictions. This is particularly important given the varying effects of wind speed and atmospheric stability on dispersion zones, as demonstrated by the simulation results. Operationally, the results underline the importance of emergency preparedness. Given the significant variation in dispersion affected by flow rates and leak sizes, emergency protocols need to be tailored to the specific characteristics of the CO2 transport system and the environments it traverses. This includes calculating evacuation times and distances with a nuanced understanding of potential danger zones.
Author Contributions
Conceptualization, S.N., S.K. and P.B.; methodology, S.K., P.B. and T.W.; validation, S.K. and T.W.; formal analysis, S.K., P.B. and T.W.; investigation, S.K., P.B. and T.W.; resources, S.K., P.B. and T.W.; data curation, S.K., P.B. and T.W.; writing—original draft preparation, P.B., T.W. and S.K.; writing—review and editing, P.B., T.W., S.K. and S.N.; visualization, P.B., T.W. and S.K.; supervision, S.K.; funding acquisition, S.N. All authors have read and agreed to the published version of the manuscript.
Funding
This research was funded by EEA and Norway Grants, operated by The National Center for Research and Development, grant number NOR/POLNORCCS/AGaStor/0008/2019-00 and Ministry subsidy 16.16.190.779 (B 409).
Data Availability Statement
Data are contained within the article.
Conflicts of Interest
The authors declare that they have no known competing financial interests or personal relationships that could have appeared to influence the work reported in this paper.
References
- Porter, R.T.; Fairweather, M.; Pourkashaniam, M.; Woolley, R.M. The range and level of impurities in CO2 streams from different carbon capture sources. Int. J. Greenh. Gas Control 2015, 36, 161–174. [Google Scholar] [CrossRef]
- Teng, L.; Liu, X.; Li, X.; Li, Y.; Lu, C. An approach of quantitative risk assessment for release of supercritical CO2 pipelines. J. Nat. Gas Sci. Eng. 2021, 94, 104131. [Google Scholar] [CrossRef]
- Volpi, V.; Forlin, E.; Baroni, A.; Estublier, A.; Donda, F.; Civile, D.; Delprat-Jannaud, F. Evaluation and characterization of a potential CO2 storage site in the south Adriatic offshore. Oil Gas Sci. Technol.-Rev. D’ifp Energ. Nouv. 2015, 70, 695–712. [Google Scholar] [CrossRef]
- Kuczynski, S.; Hendel, J. Application of Monte Carlo simulations for economic efficiency evaluation of carbon dioxide enhanced oil recovery projects. Int. Multidiscip. Sci. GeoConference SGEM 2014, 1, 663. [Google Scholar]
- Yu, S.; Yan, X.; He, Y.; Chen, L.; Hu, Y.; Yang, K.; Chen, S. Study on the decompression behavior during large-scale pipeline puncture releases of CO2 with various N2 compositions: Experiments and mechanism analysis. Energy 2024, 296, 131180. [Google Scholar] [CrossRef]
- Cao, Z.; Hu, Y.; Chen, L.; Yan, X.; Yu, S.; Yu, J. Experimental study of leakage characteristics and risk prediction of N2-containing dense-phase CO2 pipelines in real transportation conditions. Process Saf. Environ. Prot. 2024, 187, 1112–1125. [Google Scholar] [CrossRef]
- Vitali, M.; Corvaro, F.; Marchetti, B.; Terenzi, A. Thermodynamic challenges for CO2 pipelines design: A critical review on the effects of impurities, water content, and low temperature. Int. J. Greenh. Gas Control 2022, 114, 103605. [Google Scholar] [CrossRef]
- Neele, F.; Rycroft, L.; Gage, R.; Barnett, J.; Joos, M.; Baltac, S.; Stigter, H. CO2 transportation and network development. In Deployment of Carbon Capture and Storage; Woodhead Publishing: Sawston, UK, 2024; pp. 61–132. [Google Scholar]
- Brown, A.; Eickhoff, C.; Reinders, J.E.A.; Raben, I.; Spruijt, M.; Neele, F. IMPACTS: Framework for risk assessment of CO2 transport and storage infrastructure. Energy Procedia 2017, 114, 6501–6513. [Google Scholar] [CrossRef]
- Bielka, P.; Kuczyński, S.; Nagy, S. CO2 Compression and Dehydration for Transport and Geological Storage. Energies 2023, 16, 1804. [Google Scholar] [CrossRef]
- Li, Y.; Wang, W.; Chen, Z.F.; Li, Y.X. Integrity assessment of supercritical CO2 transport pipelines. Geoenergy Sci. Eng. 2023, 221, 211355. [Google Scholar] [CrossRef]
- Johnsen, K.; Helle, K.; Røneid, S.; Holt, H. DNV recommended practice: Design and operation of CO2 pipelines. Energy Procedia 2011, 4, 3032–3039. [Google Scholar] [CrossRef]
- McCoy, S.; Rubin, E. An engineering-economic model of pipeline transport of CO2 with application to carbon capture and storage. Int. J. Greenh. Gas Control 2008, 2, 219–229. [Google Scholar] [CrossRef]
- Alstom, U.K. European Best Practice Guidelines for Assessment of CO2 Capture Technologies; SINTEF: Trondheim, Norway, 2011. [Google Scholar]
- Climate Action-European Commission. Implementation of Directive 2009/31/EC on the Geological Storage of Carbon Dioxide. Guidance Document 1: CO2 Storage Life Cycle Risk Management Framework; Climate Action-European Commission: Luxembourg, 2011. [Google Scholar]
- De Visser, E.; Hendriks, C.; Barrio, M.; Mølnvik, M.J.; de Koeijer, G.; Liljemark, S.; Le Gallo, Y. Dynamis CO2 quality recommendations. Int. J. Greenh. Gas Control 2008, 2, 478–484. [Google Scholar] [CrossRef]
- Basava-Reddi, L.; Wildgust, N.; Ryan, D. Effects of Impurities on Geological Storage of Carbon Dioxide. In Proceedings of the 1st EAGE Sustainable Earth Sciences (SES) Conference and Exhibition, Valencia, Spain, 8–11 November 2011; European Association of Geoscientists & Engineers: Bunnik, The Netherlands, 2011; p. cp-268. [Google Scholar]
- Lako, P.; Van Der Welle, A.J.; Harmelink, M.; Van Der Kuip, M.D.C.; Haan-Kamminga, A.; Blank, F.; Nepveu, M. Issues concerning the implementation of the CCS Directive in the Netherlands. Energy Procedia 2011, 4, 5479–5486. [Google Scholar] [CrossRef]
- ISO 27913:2016; Carbon Dioxide Capture, Transportation and Geological Storage—Pipeline Transportation Systems. ISO: Geneva, Switzerland, 2016.
- ISO/TR 27921:2020; Carbon Dioxide Capture, Transportation, and Geological Storage—Cross Cutting Issues—CO2 Stream Composition. ISO: Geneva, Switzerland, 2020.
- DNV-RP-F104 Design and operation of carbon dioxide pipelines. Edition 2021-02–Amended 2021-09. Available online: https://www.dnv.com/oilgas/download/dnv-rp-f104-design-and-operation-of-carbon-dioxide-pipelines/ (accessed on 5 July 2024).
- Liu, X.; Godbole, A.; Lu, C.; Michal, G.; Linton, V. Consequence modelling of CO2 pipeline failure. Energy Procedia 2019, 158, 5109–5115. [Google Scholar] [CrossRef]
- Wareing, C.J.; Fairweather, M.; Falle, S.A.; Woolley, R.M.; Ward, A.M. High pressure CO2 CCS pipelines: Comparing dispersion models with multiple experimental datasets. Int. J. Greenh. Gas Control 2016, 54, 716–726. [Google Scholar] [CrossRef]
- Wareing, C.J.; Fairweather, M.; Falle, S.A.; Woolley, R.M. Modelling ruptures of buried high pressure dense phase CO2 pipelines in carbon capture and storage applications—Part I. Validation. Int. J. Greenh. Gas Control 2015, 42, 701–711. [Google Scholar] [CrossRef]
- Molag, M.; Dam, C. Modelling of accidental releases from a high pressure CO2 pipelines. Energy Procedia 2011, 4, 2301–2307. [Google Scholar] [CrossRef]
- Vandeginste, V.; Piessens, K. Pipeline design for a least-cost router application for CO2 transport in the CO2 sequestration cycle. Int. J. Greenh. Gas Control 2008, 2, 571–581. [Google Scholar] [CrossRef]
- Witkowski, A.; Majkut, M.; Rulik, S. Analysis of pipeline transportation systems for carbon dioxide sequestration. Arch. Therm. 2014, 35, 117–140. [Google Scholar] [CrossRef]
- Witkowski, A.; Rusin, A.; Majkut, M.; Rulik, S.; Stolecka, K. Comprehensive analysis of pipeline transportation systems for CO2 sequestration. Thermodynamics and safety problems. Energy Convers. Manag. 2013, 76, 665–673. [Google Scholar] [CrossRef]
- Lu, H.; Ma, X.; Huang, K.; Fu, L.; Azimi, M. Carbon dioxide transport via pipelines: A systematic review. J. Clean. Prod. 2020, 266, 121994. [Google Scholar] [CrossRef]
- Zheng, J.; Shi, J.; Liu, Z.; Jiang, S.; Liu, C. Recent advances in pipeline transportation technology of carbon dioxide. Sino-Glob. Energy 2018, 23, 87–94. [Google Scholar]
- Parfomak, P.W.; Folger, P. Carbon Dioxide Pipelines for Carbon Sequestration: Emerging Policy Issues; CRS Report for Congress; Library of Congress, Congressional Research Service: Washington, DC, USA, 2008.
- Zhang, Z.; Wang, G.X.; Massarotto, P.; Rudolph, V. Optimization of pipeline transport for CO2 sequestration. Energy Convers. Manag. 2006, 47, 702–715. [Google Scholar] [CrossRef]
- Han, C.; Zahid, U.; An, J.; Kim, K.; Kim, C. CO2 transport: Design considerations and project outlook. Curr. Opin. Chem. Eng. 2015, 10, 42–48. [Google Scholar] [CrossRef]
- Nagy, S.; Olajossy, A. Transport rurociągowy dwutlenku węgla oraz układu azot—Dwutlenek węgla. Rynek Energii 2010, 4, 63–67. [Google Scholar]
- Kuczyński, S.; Hendel, J.; Sikora, A. Economic evaluation of CO2 enhanced oil recovery and sequestration on small offshore field. In Proceedings of the SGEM 2018 Vienna, Section Oil and Gas Exploration, Vienna, Austria, 3–6 December 2018. [Google Scholar]
- Rusin, A.; Stolecka, K. Assessment of risk related to transport of carbon dioxide. J. Power Technol. 2014, 94, 4. [Google Scholar]
- Bilio, M.; Brown, S.; Fairweather, M.; Mahgerefteh, H. CO2 pipelines material and safety considerations. In Hazards XXI: Process Safety and Environmental Protection in a Changing World. Inst. Chem. Eng. 2009, 155, 423–429. [Google Scholar]
- Zhang, D.; Liu, X.; Fu, Y.; Yang, Y.; Yan, F.; Wu, X.; Zhang, H. Investigation on crack propagation and reasonable wall thickness of supercritical CO2 pipeline. Eng. Fract. Mech. 2024, 298, 109951. [Google Scholar] [CrossRef]
- Chen, L.; Hu, Y.; Yang, K.; Yan, X.; Yu, S.; Yu, J.; Chen, S. Fracture process characteristic study during fracture propagation of a CO2 transport network distribution pipeline. Energy 2023, 283, 129060. [Google Scholar] [CrossRef]
- Duncan, I.J.; Wang, H. Estimating the likelihood of pipeline failure in CO2 transmission pipelines: New insights on risks of carbon capture and storage. Int. J. Greenh. Gas Control 2014, 21, 49–60. [Google Scholar] [CrossRef]
- Vitali, M.; Zuliani, C.; Corvaro, F.; Marchetti, B.; Tallone, F. Statistical analysis of incidents on onshore CO2 pipelines based on PHMSA database. J. Loss Prev. Process. Ind. 2022, 77, 104799. [Google Scholar] [CrossRef]
- Failure Investigation Report—Denbury Gulf Coast Pipelines LLC, May 2022, PHMSA. Available online: https://www.phmsa.dot.gov/news/phmsa-failure-investigation-report-denbury-gulf-coast-pipelines-llc (accessed on 5 July 2024).
- Li, C.Y.; Marquez, J.A.D.; Hu, P.; Wang, Q. CO2 pipelines release and dispersion: A review. J. Loss Prev. Process Ind. 2023, 85, 105177. [Google Scholar] [CrossRef]
- Hu, Y.; Yan, X.; Chen, L.; Yu, S.; Liu, C.; Yu, J. Leakage hazard distance of supercritical CO2 pipelines through experimental and numerical studies. Int. J. Greenh. Gas Control 2022, 119, 103730. [Google Scholar] [CrossRef]
- Gerboni, R.; Salvador, E. Hydrogen transportation systems: Elements of risk analysis. Energy 2009, 34, 2223–2229. [Google Scholar] [CrossRef]
- Vianellob, C.; Macchiettoa, S.; Maschiob, G. Risk assessment of CO2 pipeline network for CCS-a UK case study. Chem. Eng. 2013, 31, 13–18. [Google Scholar]

Disclaimer/Publisher’s Note: The statements, opinions and data contained in all publications are solely those of the individual author(s) and contributor(s) and not of MDPI and/or the editor(s). MDPI and/or the editor(s) disclaim responsibility for any injury to people or property resulting from any ideas, methods, instructions or products referred to in the content. |
© 2024 by the authors. Licensee MDPI, Basel, Switzerland. This article is an open access article distributed under the terms and conditions of the Creative Commons Attribution (CC BY) license (https://creativecommons.org/licenses/by/4.0/).