Article

Logging Identification Methods for Oil-Bearing Formations in the Chang 6 Tight Sandstone Reservoir in the Qingcheng Area, Ordos Basin

1
State Key Laboratory of Continental Dynamics, Northwest University, Xi’an 710069, China
2
Department of Geology, Northwest University, Xi’an 710069, China
3
Gas Field Company, Shaanxi Yanchang Petroleum (Group) Co., Ltd., Xi’an 710065, China
*
Author to whom correspondence should be addressed.
Energies 2024, 17(16), 3966; https://doi.org/10.3390/en17163966 (registering DOI)
Submission received: 6 July 2024 / Revised: 7 August 2024 / Accepted: 8 August 2024 / Published: 10 August 2024

Abstract

:
The Chang 6 sandstone reservoir of the Upper Triassic Yanchang Formation in the Ordos Basin is one of the tight-oil-rich intervals in the basin. Owing to the strong heterogeneity and complex lithology of the Chang 6 reservoir, lithology and fluid identification have become more challenging, hindering exploration and development. This study focused on the Chang 6 member in the Qingcheng area of the Ordos Basin to systematically analyze the lithology, physical properties, and oil-bearing properties of the Chang 6 reservoir. We adopted the method of normalized superposition of neutron and acoustic time-difference curves, the method of induced conductivity–porosity–density intersection analysis, the method of superposition of difference curves (Δφ), and the induced conductivity curve. Our results indicated that the method of normalized superposition of neutron and acoustic wave time-difference curves could quickly and effectively identify the lithologies of tight fine sandstone, silty mudstone, mudstone, and carbonaceous mudstone. The induced conductivity–porosity–density cross-plot could be used to effectively identify oil and water layers, wherein the conductivity of tight oil layers ranged from 18 to 28.1 mS/m, the density ranged from 2.42 to 2.56 g/cm3, the porosity was more than 9.5%, and the oil saturation was more than 65%. Based on the identification of tight fine sandstone using the dual-curve normalized superposition method, the oil layer thickness within the tight fine sandstone could be effectively identified using the superposition of difference curves (Δφ) and induced conductivity curves. Verified by oil-bearing reservoir data from the field test, the overall recognition accuracy of the plots exceeded 90%, effectively enabling the identification of reservoir lithology and fluid types and the determination of the actual thickness of oil layers. Our results provide a reference for predicting favorable areas in the study area and other tight reservoirs.

1. Introduction

Exploration of nonrenewable oil and gas resources in China is becoming increasingly difficult, and the gas and oil resources are steadily declining [1,2,3,4]. In this context, tight sandstone reservoirs will be an important resource base for China’s oil industry to increase reserves and production in the future. Therefore, efficient identification of tight sandstone reservoirs will contribute to the exploration and development of oil fields [5,6,7,8]. Tight oil has become an important part of China’s energy structure [9,10,11]. After continuous advancements in theoretical, exploration, and development technologies, significant breakthroughs have been made in the exploration of tight sandstone oil in major basins, such as the Ordos, Songliao, Bohai Bay, Junggar, and Sichuan, indicating promising exploration prospects [12,13,14,15]. Therefore, efficient identification of tight sandstone reservoirs will contribute to the exploration and development of oil fields.
The Ordos Basin, one of the largest oil- and gas-bearing basins in China [16,17], has total oil and gas resources amounting to 250 × 108 t. The tight sandstone oil and gas reservoirs were extensively developed in the Triassic Yanchang Formation of the Mesozoic era, and the permeability of the reservoirs generally ranges from 0.01 to 1 mD, which is typical of tight oil reservoirs, characterized by multiple oil-bearing formations, extensive distribution, poor reservoir physical properties, and complex microporous structures [18,19,20]. Large oil fields with reserves of more than 1 billion tons have been discovered in the basin, such as Xifeng, Jiyuan, Huaqing, and Qingcheng. Among them, the Chang 6, 7, and 8 reservoirs are the primary layers for tight oil exploration and development [21,22,23]. Owing to the influence of provenance and the depositional environment, the lithology of the Chang 6 reservoir is more complex, with strong heterogeneity, complex pore structures, significant lithological and electrical variations, complex reservoir fluids, and indistinct conventional logging response characteristics. These factors have severely impacted the progress of oil and gas exploration [24,25,26,27,28]. In recent years, the introduction of big data, machine learning, and mathematical algorithms has provided new insights and methods for the interpretation of logging data. Various machine learning techniques, such as vector machines, neural networks, decision trees, and cluster analysis, have been widely used in the identification of complex lithologies. However, the establishment of a training model requires a large quantity of data to ensure accuracy [29,30,31,32,33,34,35,36,37,38]. Nuclear magnetic resonance (NMR) logging and array acoustic logging are considered effective tools for addressing issues in tight sandstone reservoirs [39,40,41,42,43]. However, NMR T2 spectra depend on the pore structure, fluid type, and distribution, making certain NMR logging-based interpretations inappropriate for tight reservoirs [44,45,46,47]. Array logging is effective in identifying gas reservoirs; however, owing to the smaller elastic parameters of oil and water in oil reservoirs than in gas reservoirs and the influence of rock skeletons, this technology is not extensively used in tight oil reservoirs [48,49,50]. Therefore, there is an urgent need to explore a fast, effective, and low-cost method to finely identify the lithology and fluid types of tight reservoirs. Based on this, large quantities of core description, well logging, core analysis and testing, mud logging, and oil testing data were comprehensively used in this study to effectively identify the lithology of the tight reservoir in the Chang 6 reservoir of the Qingcheng area in the Ordos Basin using the normalized multi-curve superposition method. Additionally, the fluid properties and thicknesses of the favorable reservoirs were thoroughly investigated.

2. Geologic Setting

The Ordos Basin is located in central China (Figure 1a) and is a multicycle craton basin with a Cenozoic inland lake basin superimposed on a Late Paleozoic marine basin [51,52,53]. During the Late Triassic Yanchang period, a large inland river delta–lake depositional system was developed in the Ordos Basin, with the main sediment supply oriented toward the Yinshan Paleocontinent in the northern part of the basin and the Qinqi orogenic belt in the southwestern part of the basin [54,55,56,57,58].
The Qingcheng area was selected as the study area, with an exploration area of approximately 2800 km2, located in the southwestern part of the Yishan Slope of the secondary structural unit of the Ordos Basin [59,60,61]. The target horizon is the Chang 6, where tight reservoirs predominantly developed in the lacustrine delta and semi-deep to deep lake depositional environments [62,63]. Influenced by various factors, such as basin tectonic subsidence and the evolution of the depositional environment, the thickness of the Chang 6 ranges from approximately 90 to 140 m. The base is characterized by thick, massive sandstone interbedded with thin mudstone layers, whereas the middle to upper part mainly comprises dark-gray mudstone interbedded with thin layers of siltstone and fine sandstone (Figure 1b). The lithology rapidly changes vertically, indicating strong heterogeneity [64,65].

3. Data and Methods

3.1. Data and Sample Description

In this study, 86 drilled wells were investigated, including 12 cored wells. The logging curves of the drilled wells included gamma ray (GR), acoustic (AC), compensated neutron (CNL), density (DEN), resistivity (RT), and induced conductivity logging (CILD). In this study, 263 core samples were collected according to the core analysis method of PetroChina (SY/T 5336-2006) [66]. Porosity and permeability equipment were used to test the relevant physical parameters. The porosity test equipment was a Smart-Por Porosity Test Instrument, the permeability test equipment was a Smart-PermII Ultra Low Permeameter(Porous Materials, Inc., Santa Clara, CA, USA), and the experimental equipment was from the State Key Laboratory of Continental Dynamics of Northwest University.

3.2. Hyperbolic Normalized Superposition Reconstruction Method

Based on the selection principles of PetroChina logging data (SY/T 6451-2000) [67], 86 wells were selected for this study. Considering the complex lithology of the Chang 6, in the process of logging curve processing in this study, the dimensions of the AC and CNL logging curves were different, and the magnitudes were quite different. Therefore, it was necessary to normalize the logging data and unify the response values of each logging curve into scalars in the range of (0, 1) [68,69]. The normalized logging curve was superimposed and reconstructed according to the marker layer. The procedure is as follows:
(1)
Normalize the AC and CNL curves of the selected wells using the normalization equation to obtain the normalized logging curves AC* and CNL*:
X = X X min X max X min
where X*, Xmin, and Xmax are the normalized, minimum, and maximum lithological logging characteristic values, respectively.
(2)
The thick silty mudstone in the Chang 6 reservoir of the study area was selected as the marker layer. Using this marker layer as a reference, the normalized AC* and CNL* curves were shifted by adding or subtracting to achieve overlap between the AC* and CNL* curves.
(3)
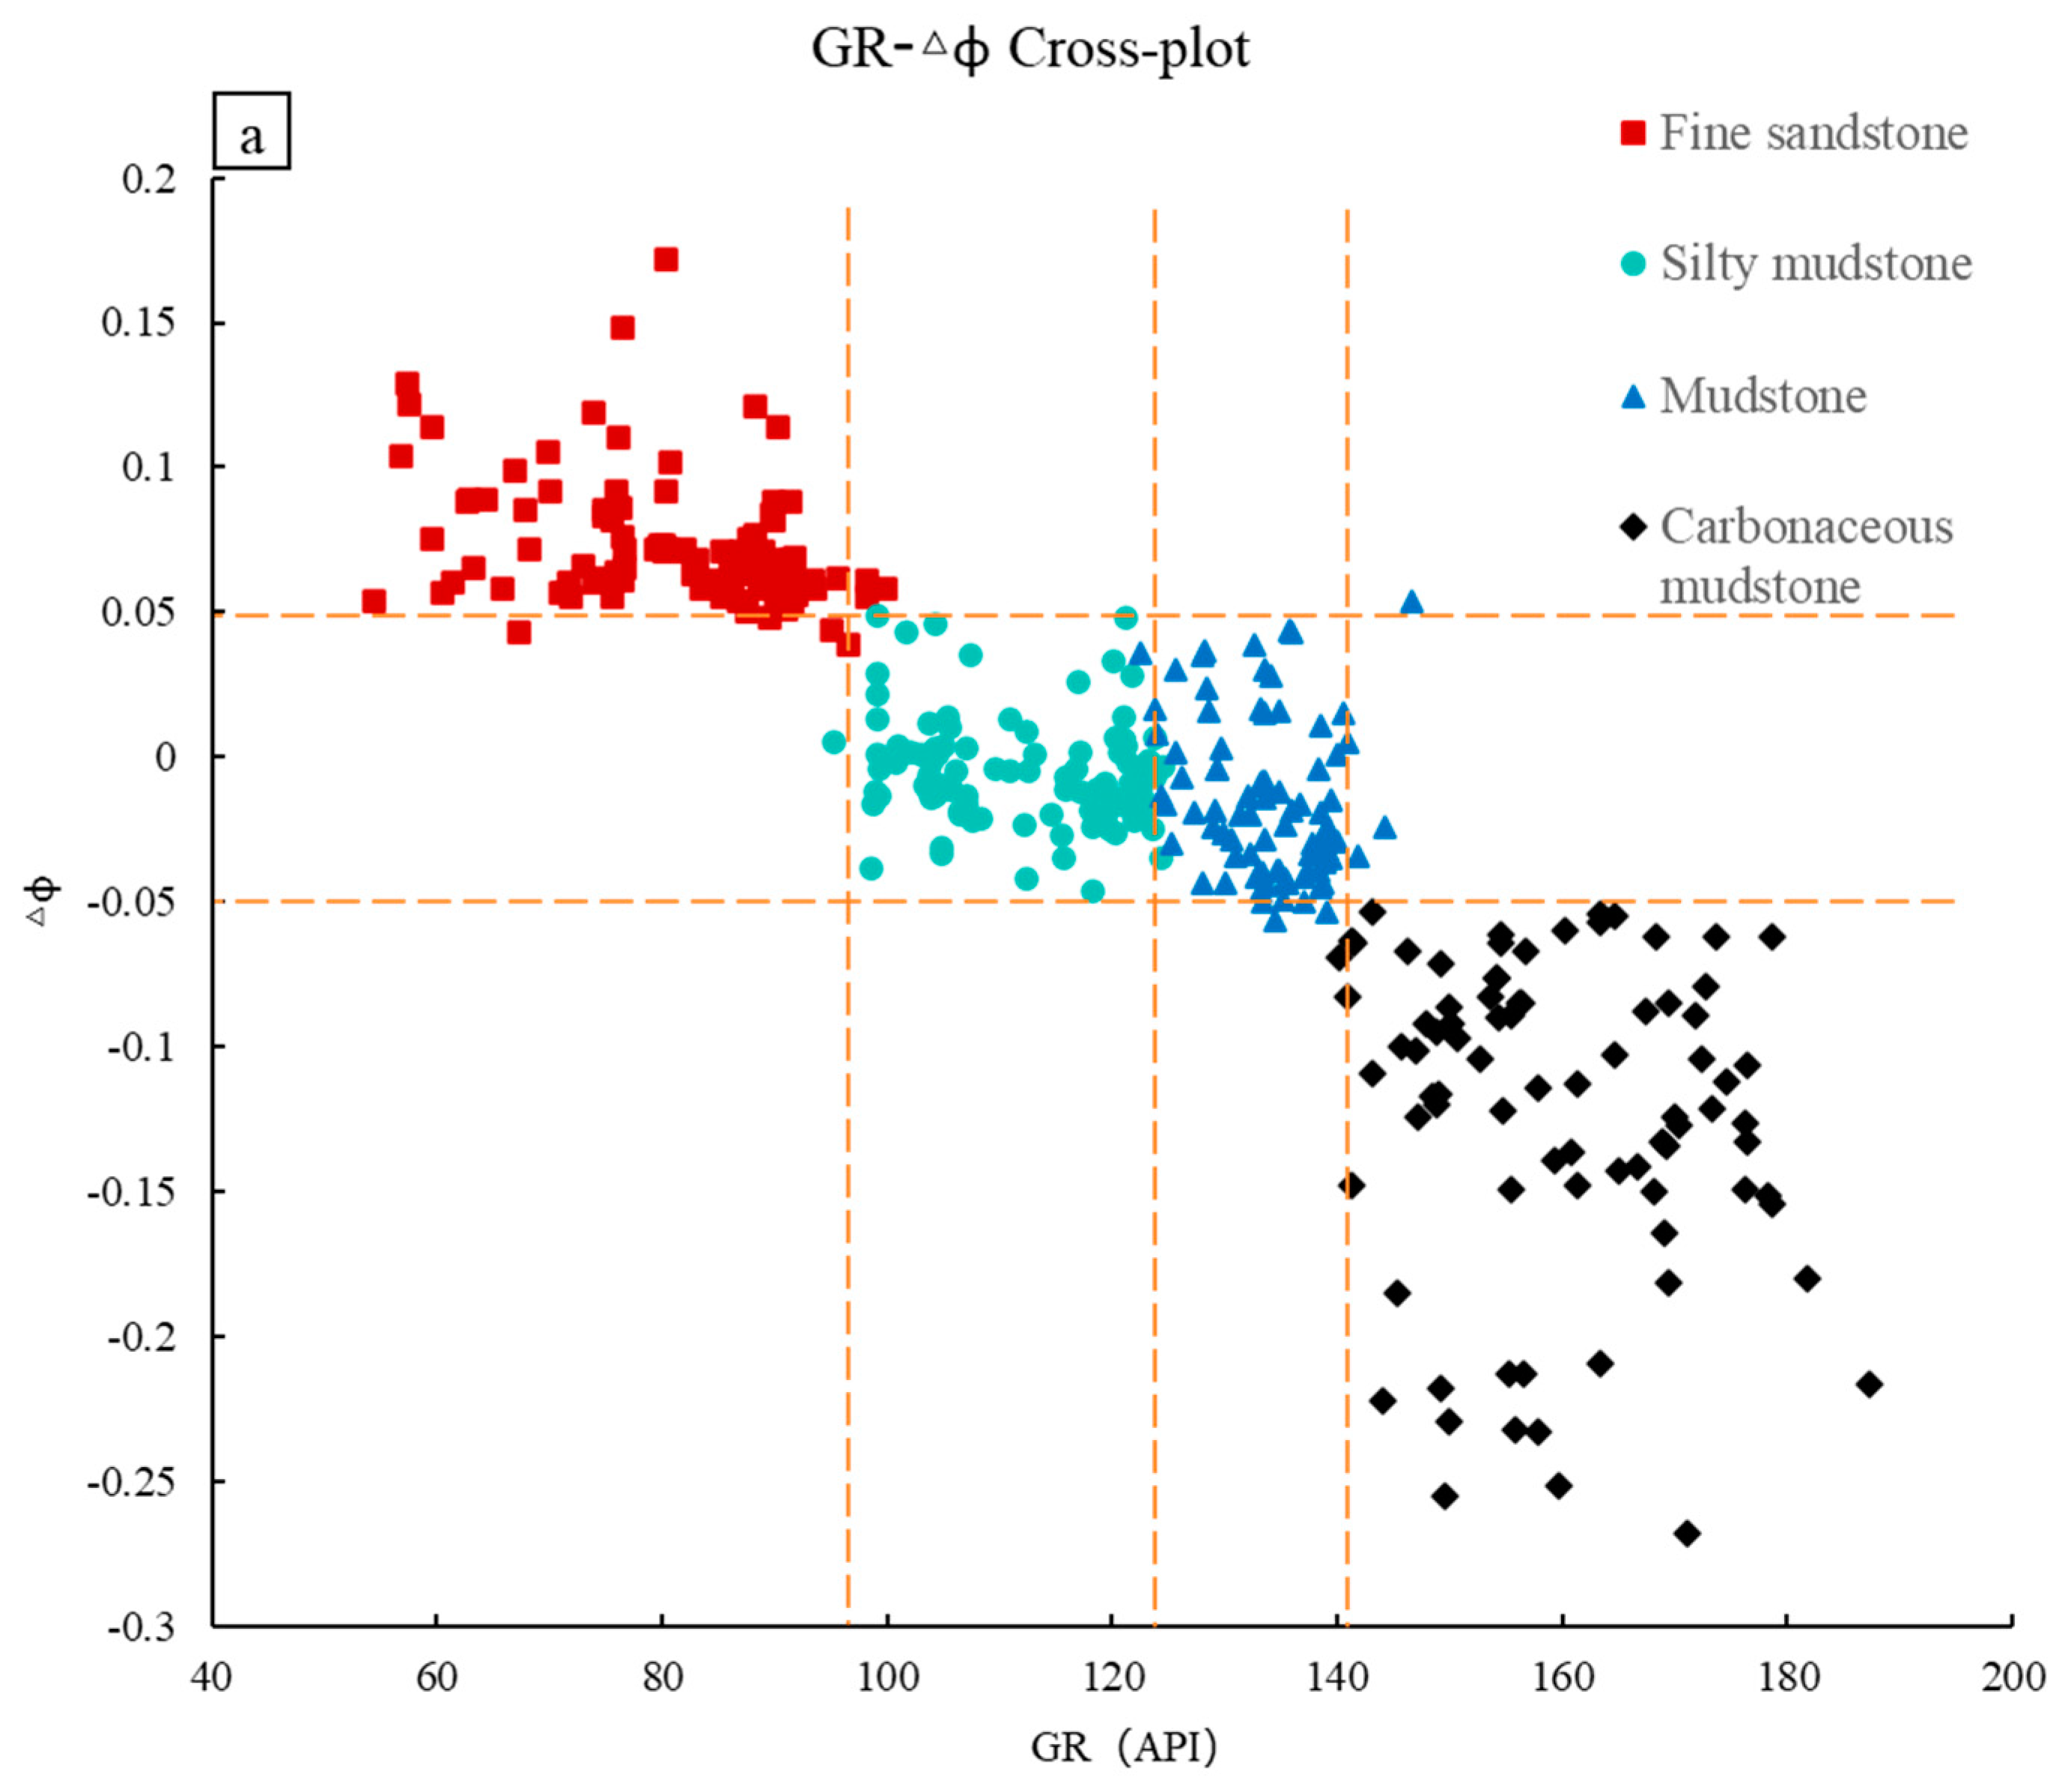
The average values of AC and CNL data corresponding to the same lithology at different depths were determined at intervals of 0.5 m. The difference between the gamma values in the different lithologies and normalized curves, namely, Δφ (obtained by subtracting CNL* values from AC* values), was used to construct a cross-plot used to identify the tight fine sandstone.

4. Results

4.1. Characteristics of the Tight Sandstone Reservoir

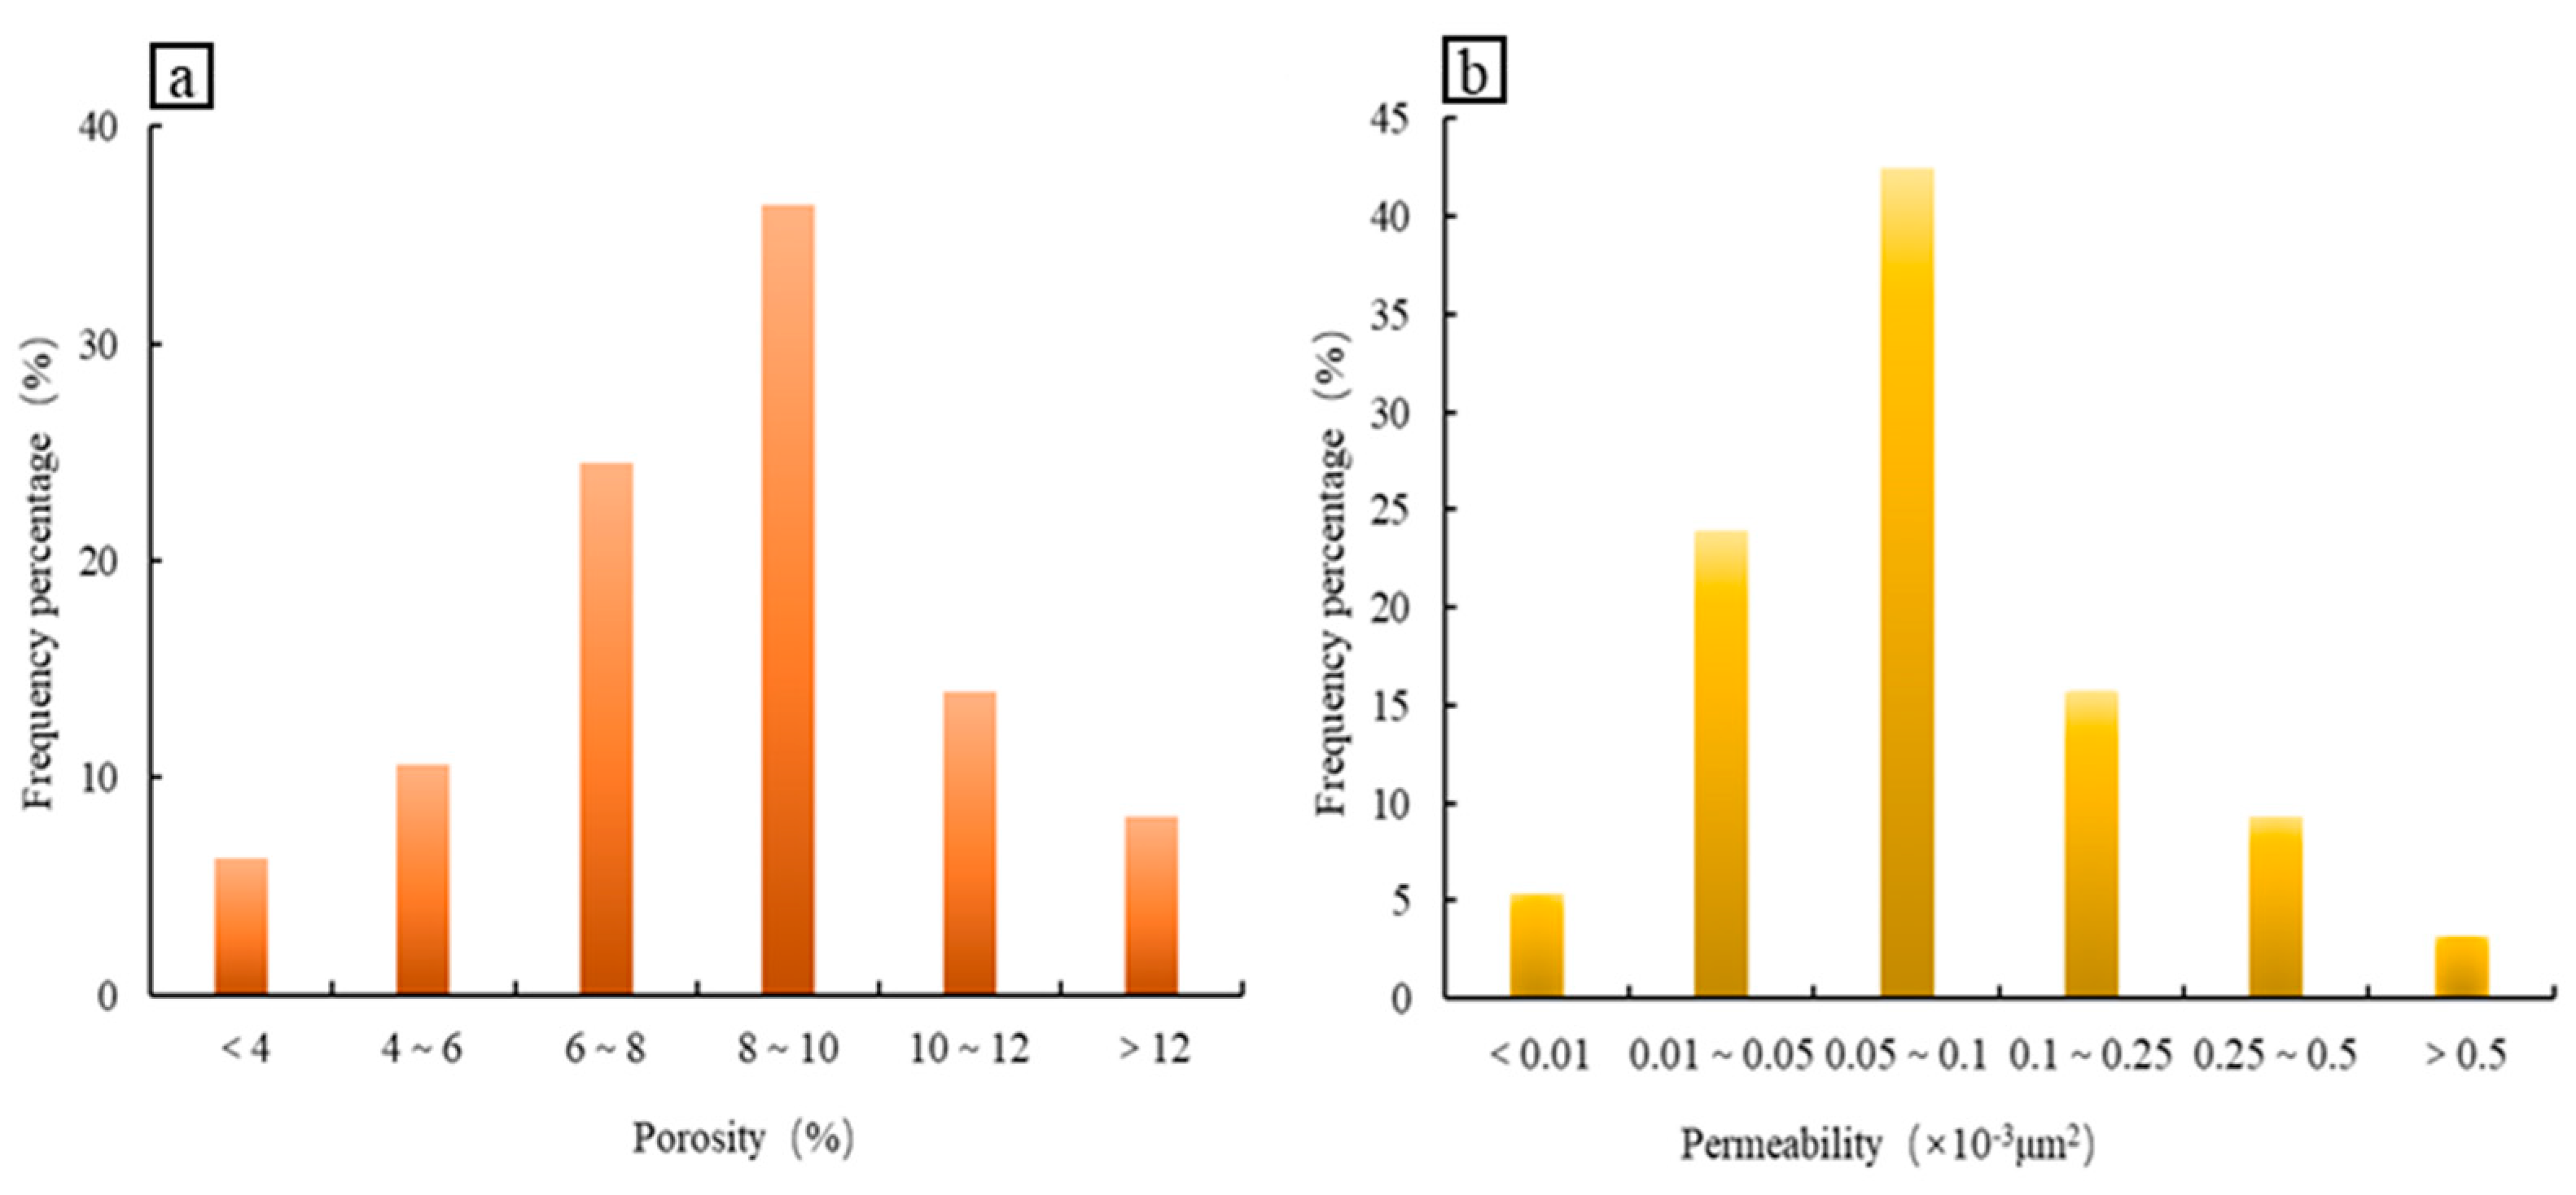
4.1.1. Physical Characteristics

Physical property tests were conducted on 263 core samples from the Chang 6 taken from 12 core wells in the Qingcheng area. The results indicated that the porosity of the reservoir ranged from 4 to 12%, with 60.9% of porosity test data being distributed between 6 and 10% (Figure 2a). The permeability of the reservoir ranged from 0.01 to 0.5 × 10⁻³ μm2, with 66.4% of permeability test data being distributed between 0.01 and 0.1 × 10⁻³ μm2 (Figure 2b), indicating a typical tight sandstone reservoir.

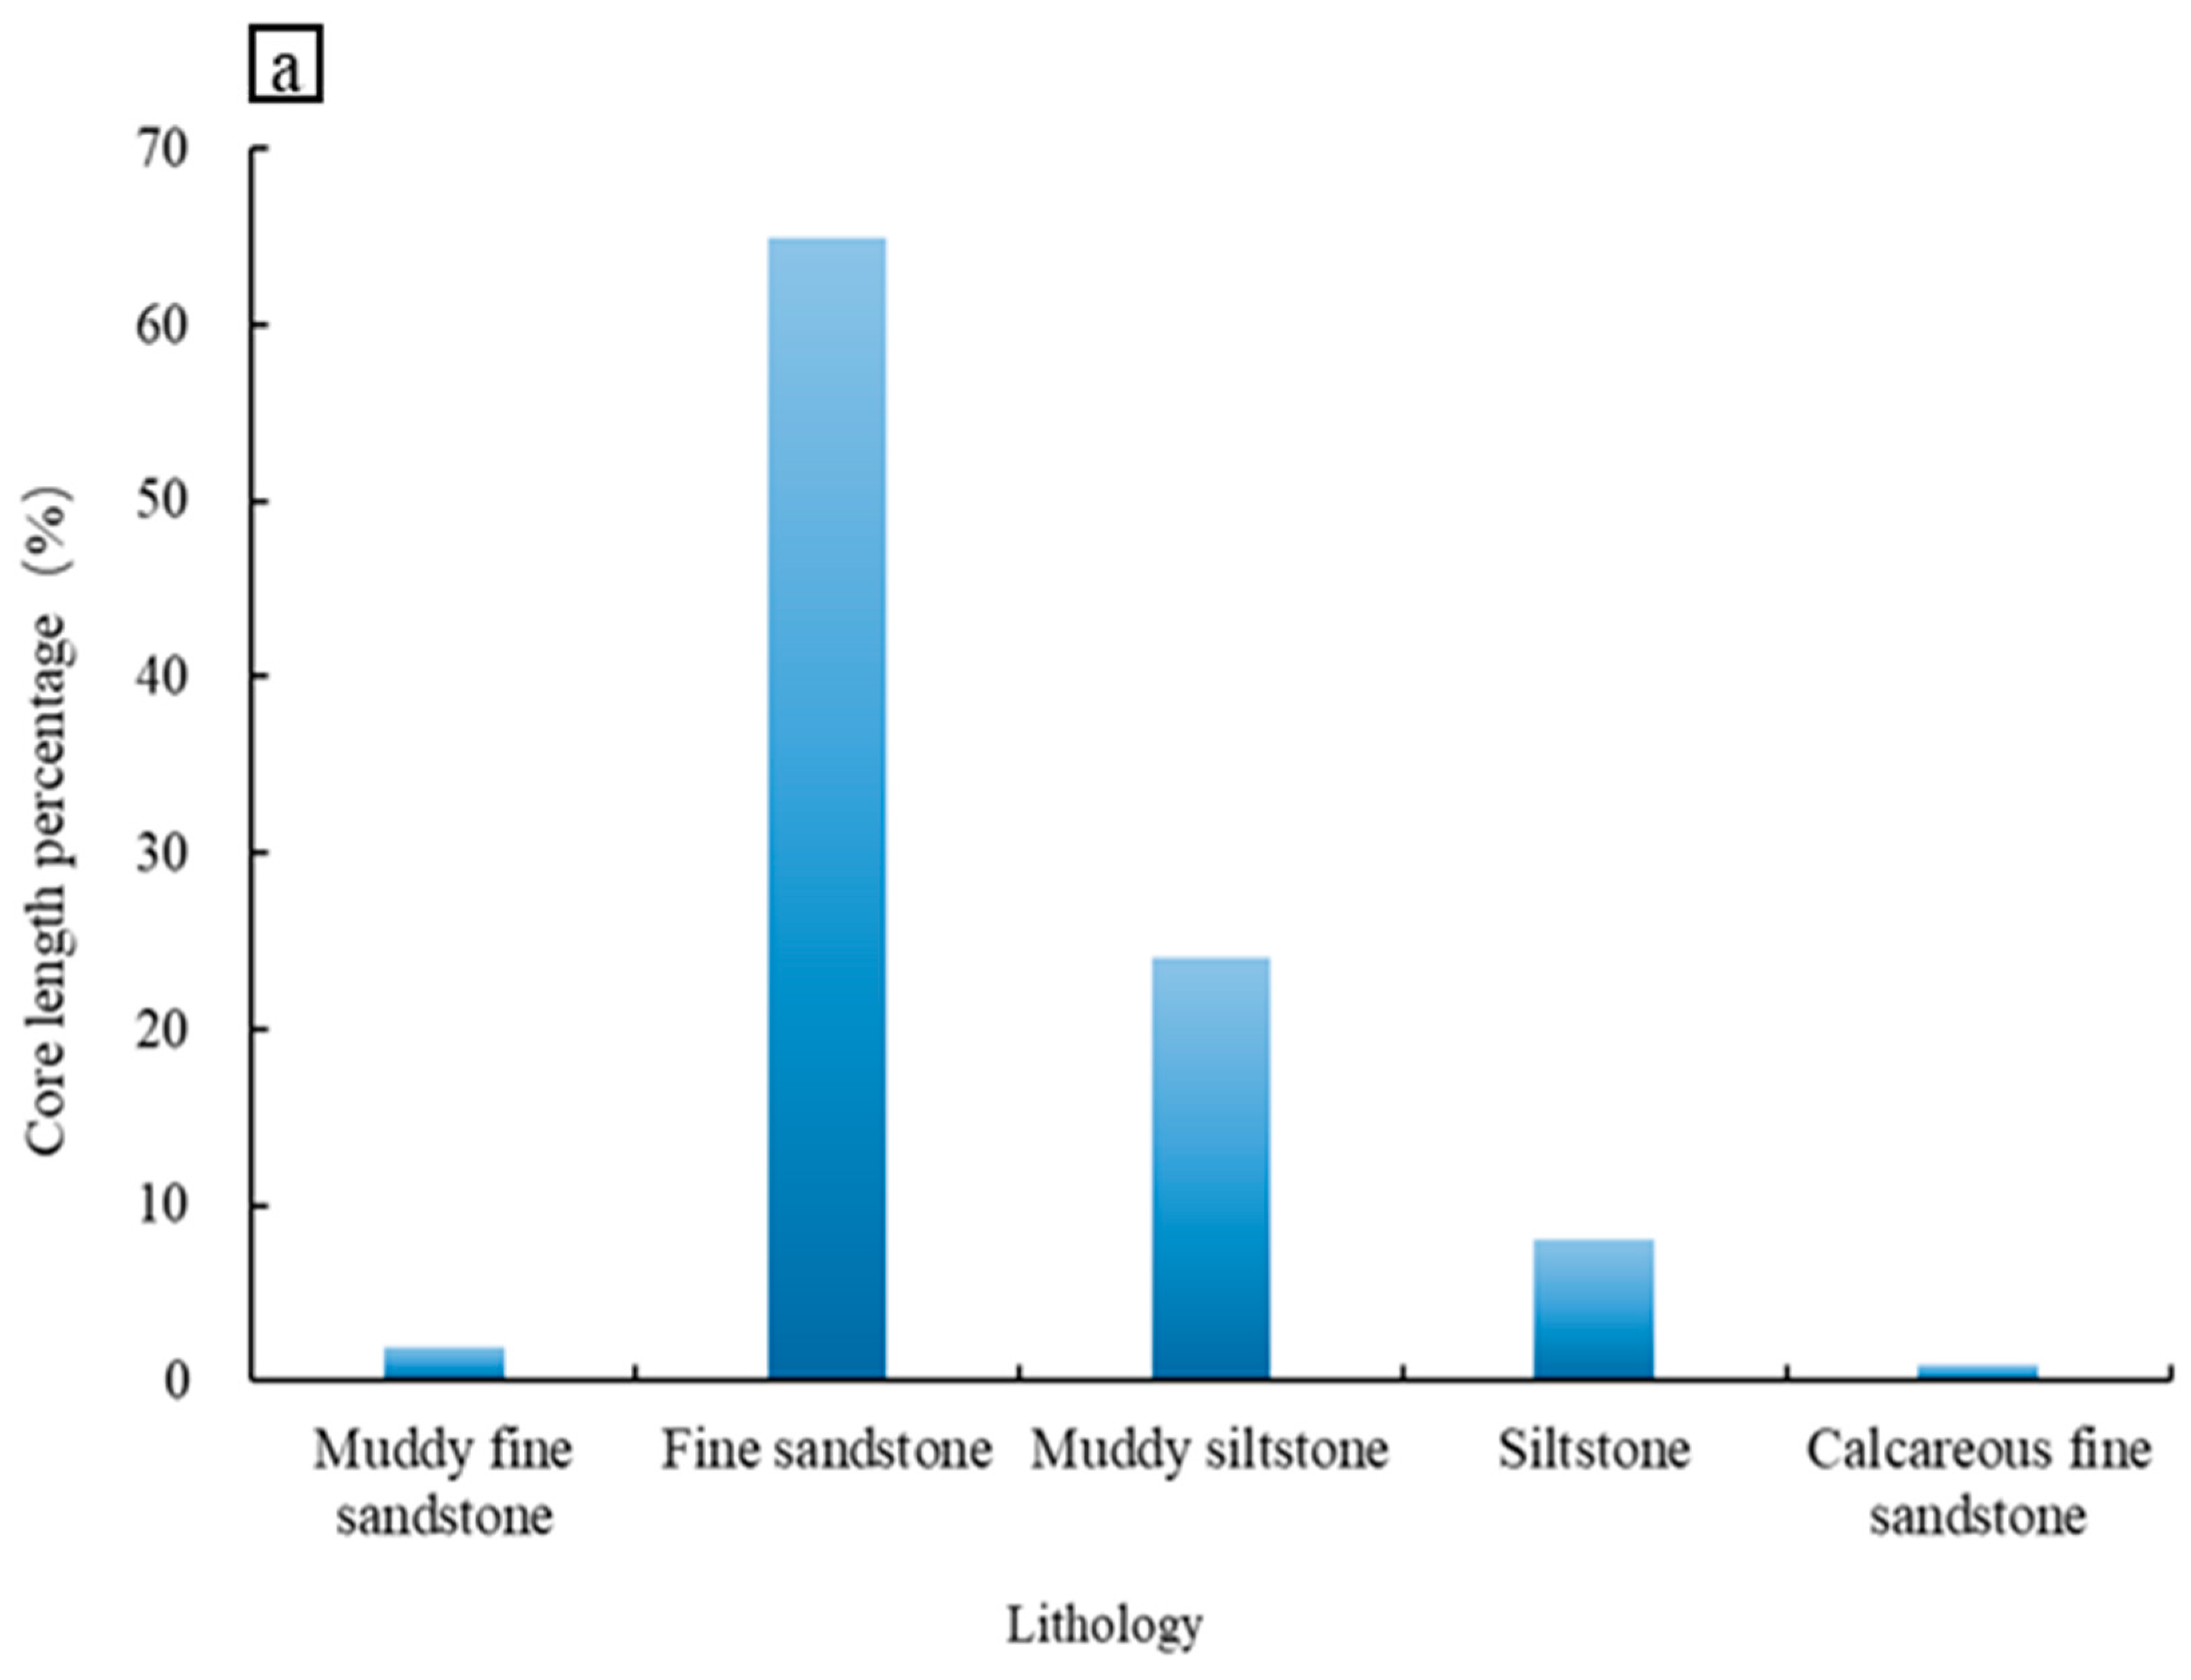
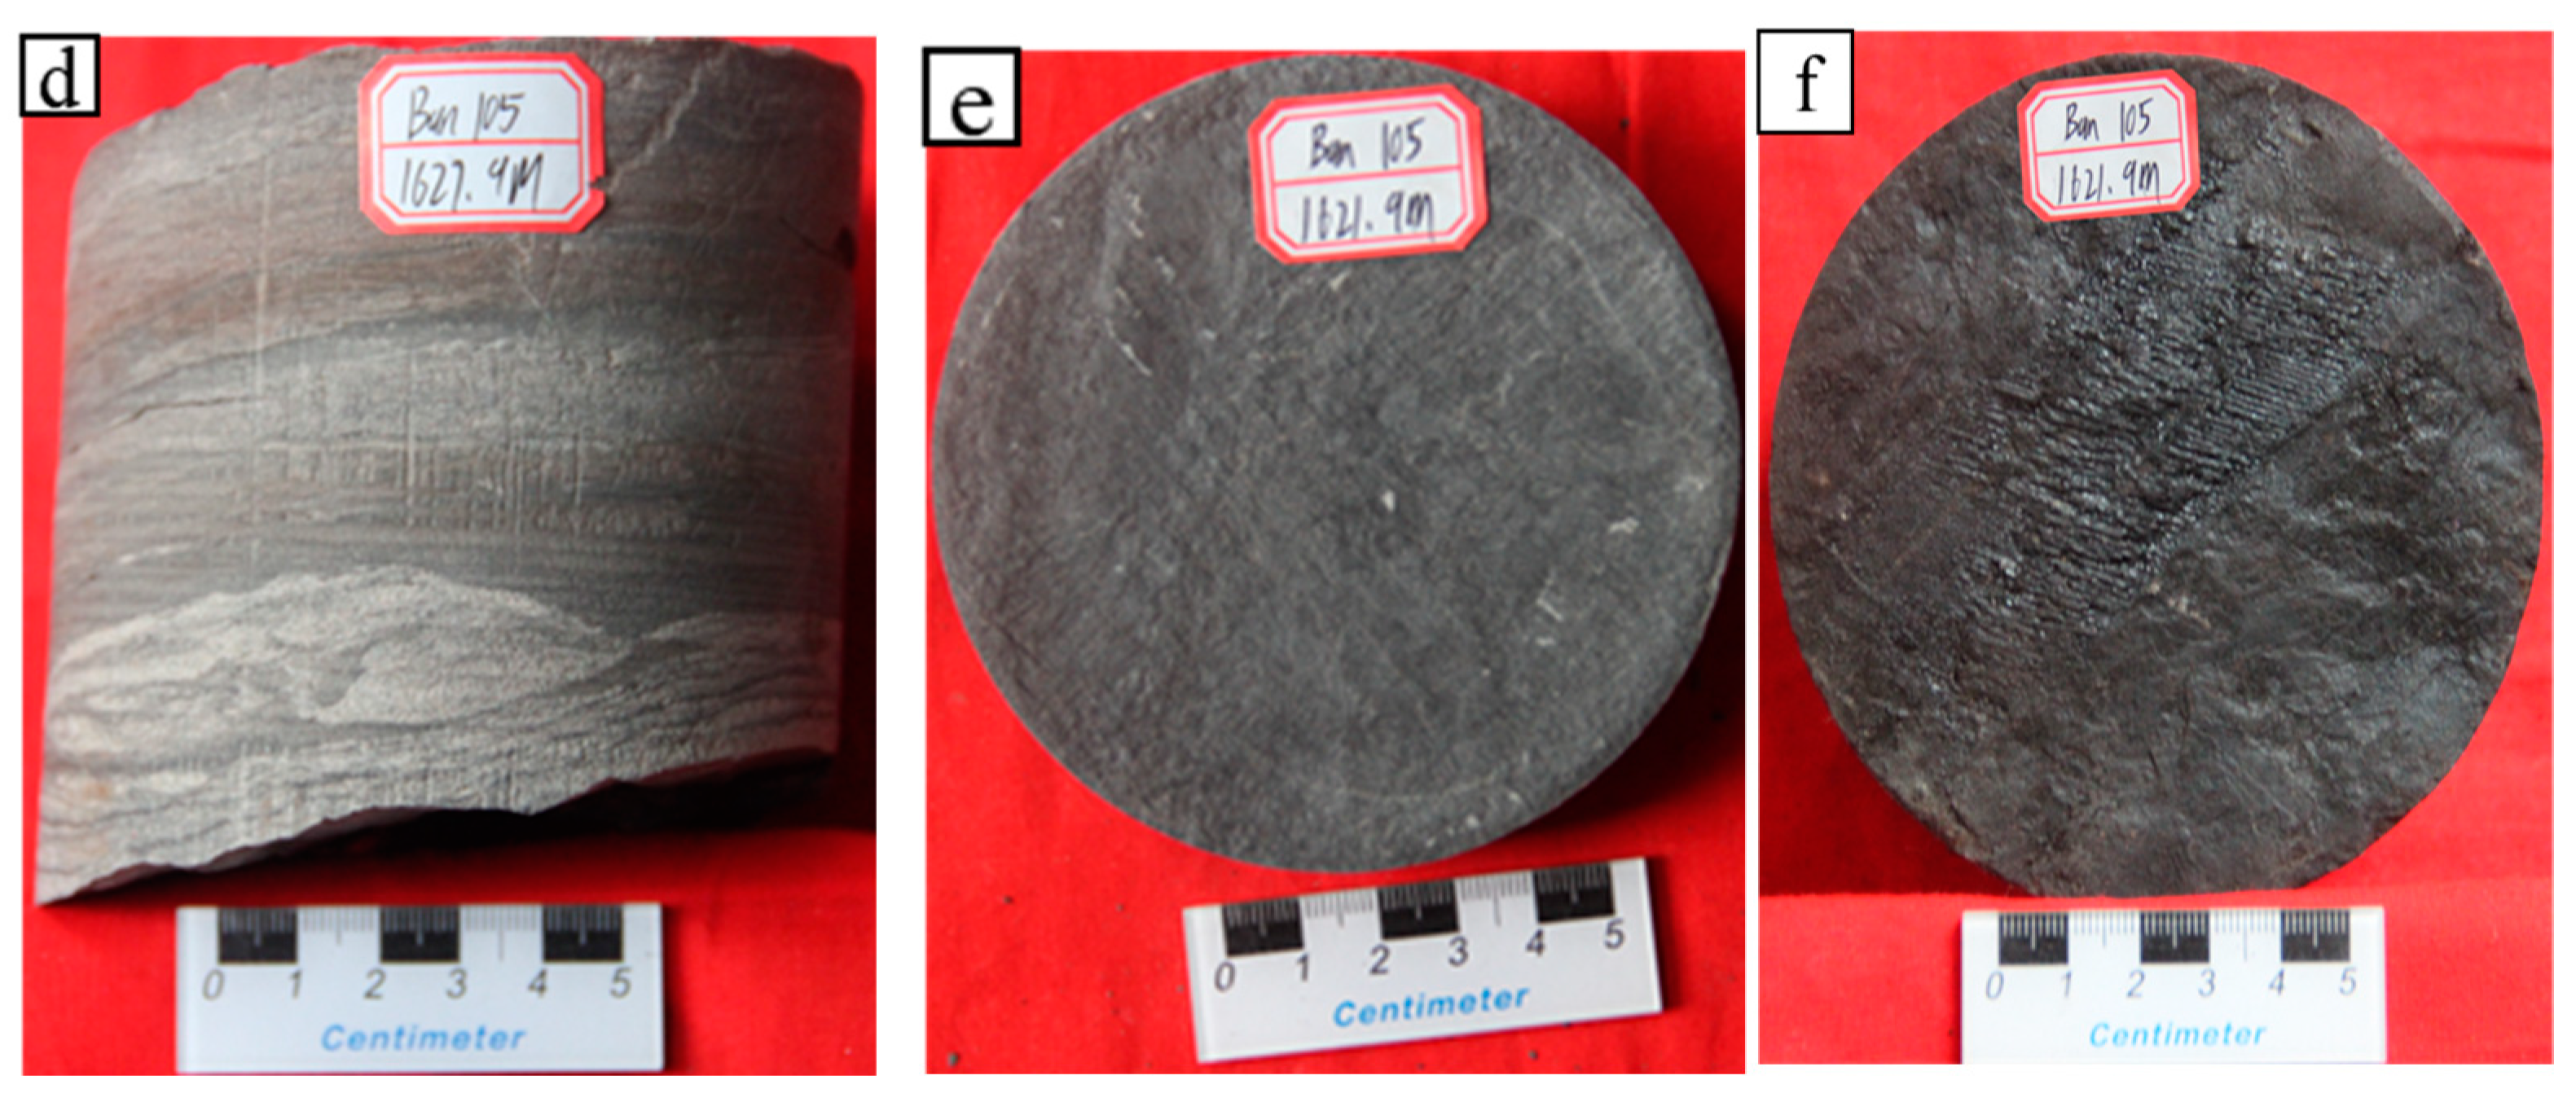
4.1.2. Lithological Characteristics

Based on the mud logging data from 52 wells in the Chang 6 in the Qingcheng area, five types of lithology of tight sandstone were identified, specifically categorized as fine sandstone, muddy fine sandstone, calcareous fine sandstone, siltstone, and muddy siltstone. Among them, the content of fine sandstone was the highest, accounting for 65.3% of the total mud logging data; muddy siltstone showed the second highest content, accounting for 24.3% of the total mud logging data; the siltstone content was lower, accounting for 7.9% of the mud logging data; and the calcareous fine sandstone and muddy fine sandstone content were the lowest, accounting for 1.2 and 1.4% of the total mud logging data, respectively (Figure 3a). The predominant rock types in the Chang 6 in the Qingcheng area were feldspathic lithic sandstone and lithic feldspathic sandstone, with relatively few occurrences of feldspathic sandstone. Considering the clastic composition, the mass fractions of feldspar, quartz, and rock debris ranged from 10.4% to 56.5%, 12.8% to 61.2%, and 6.9% to 42.3%, with average content of 30.89%, 41.84%, and 28.36%, respectively (Figure 3b). The predominant detritus type was metamorphic rock debris, followed by sedimentary rock debris, with the least occurrence of magmatic rock debris (Figure 3c).

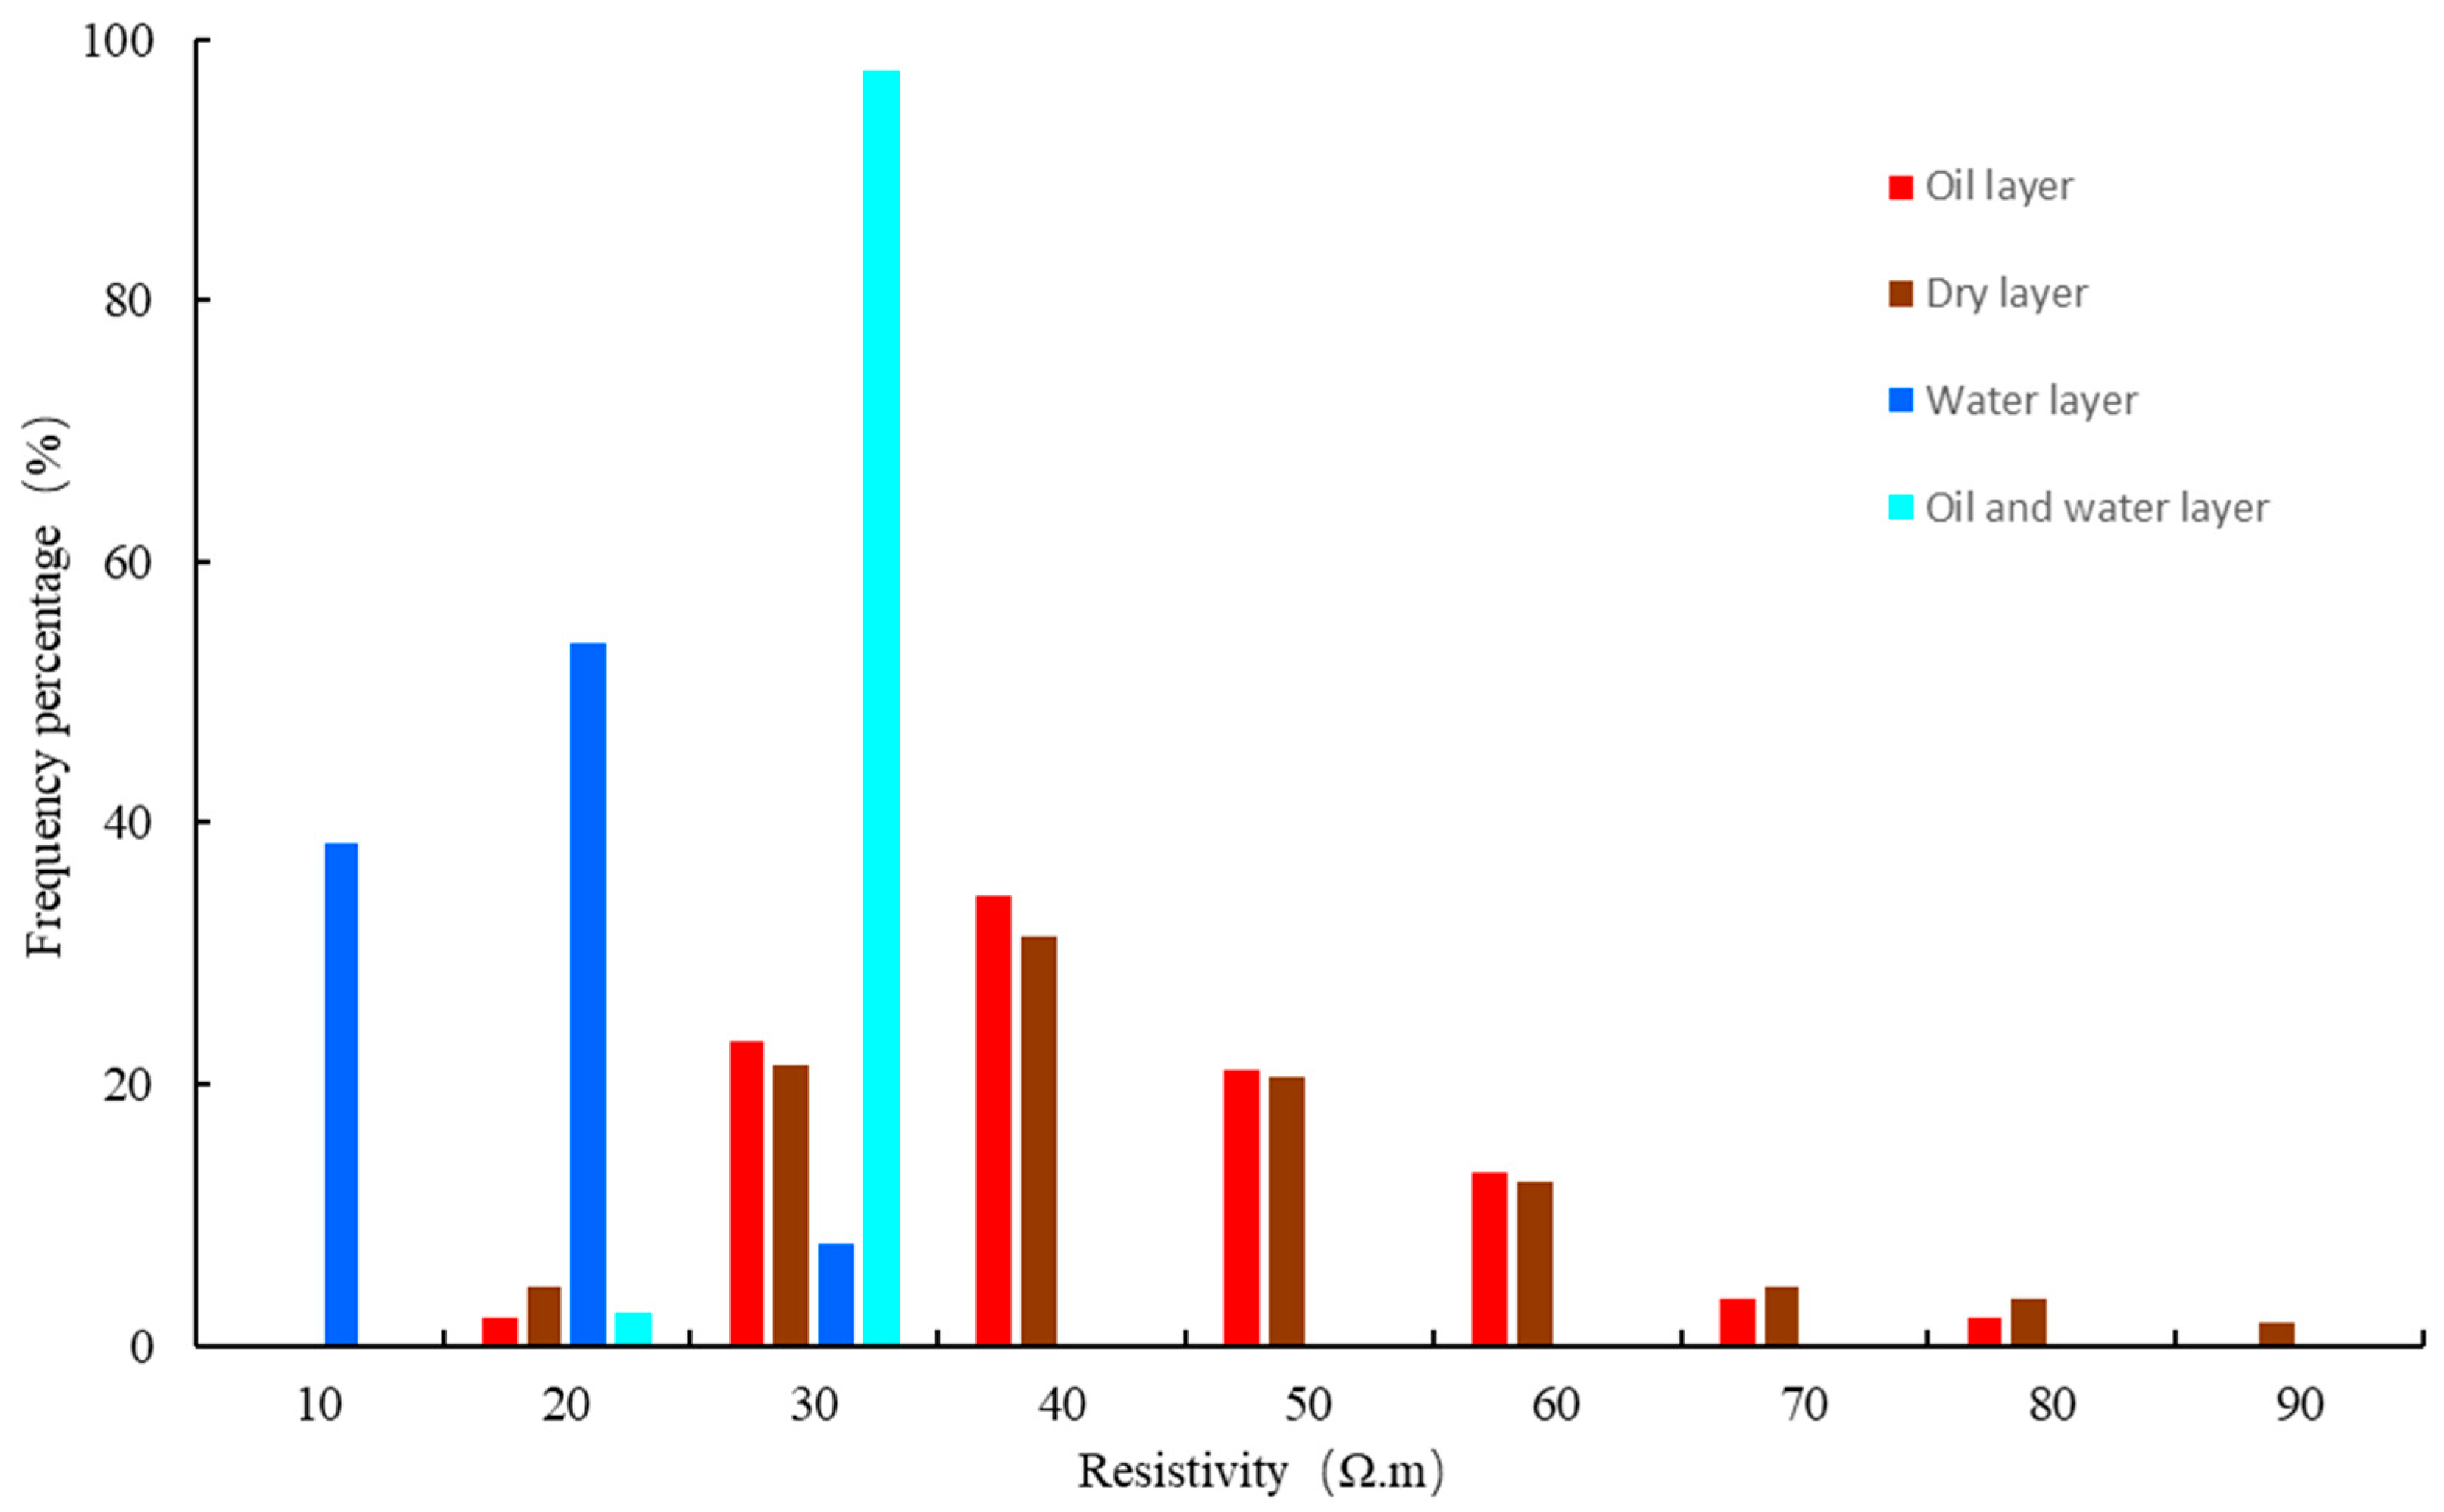
4.1.3. Electrical Characteristics

By analyzing the testing and production data of oil from 52 wells in the Chang 6 of the Qingcheng area, four types of fluids were identified in the tight sandstone reservoir, namely, oil, water, oil–water, and dry layers. The resistivities of water, oil–water, oil, and dry layers were concentrated in the ranges of 10 to 30, 20 to 30, 20 to 80, and 20 to 90 Ω·m, respectively (Figure 4). A significant overlap was observed among the four fluid types within the resistivity range of 20 to 30 Ω·m (Figure 4). Moreover, in the resistivity range of 30 to 80 Ω·m, the resistivity distribution characteristics of oil and dry layers were similar. Therefore, identifying the oil, water, oil–water, and dry layers in the tight sandstone using only resistivity curves is difficult.

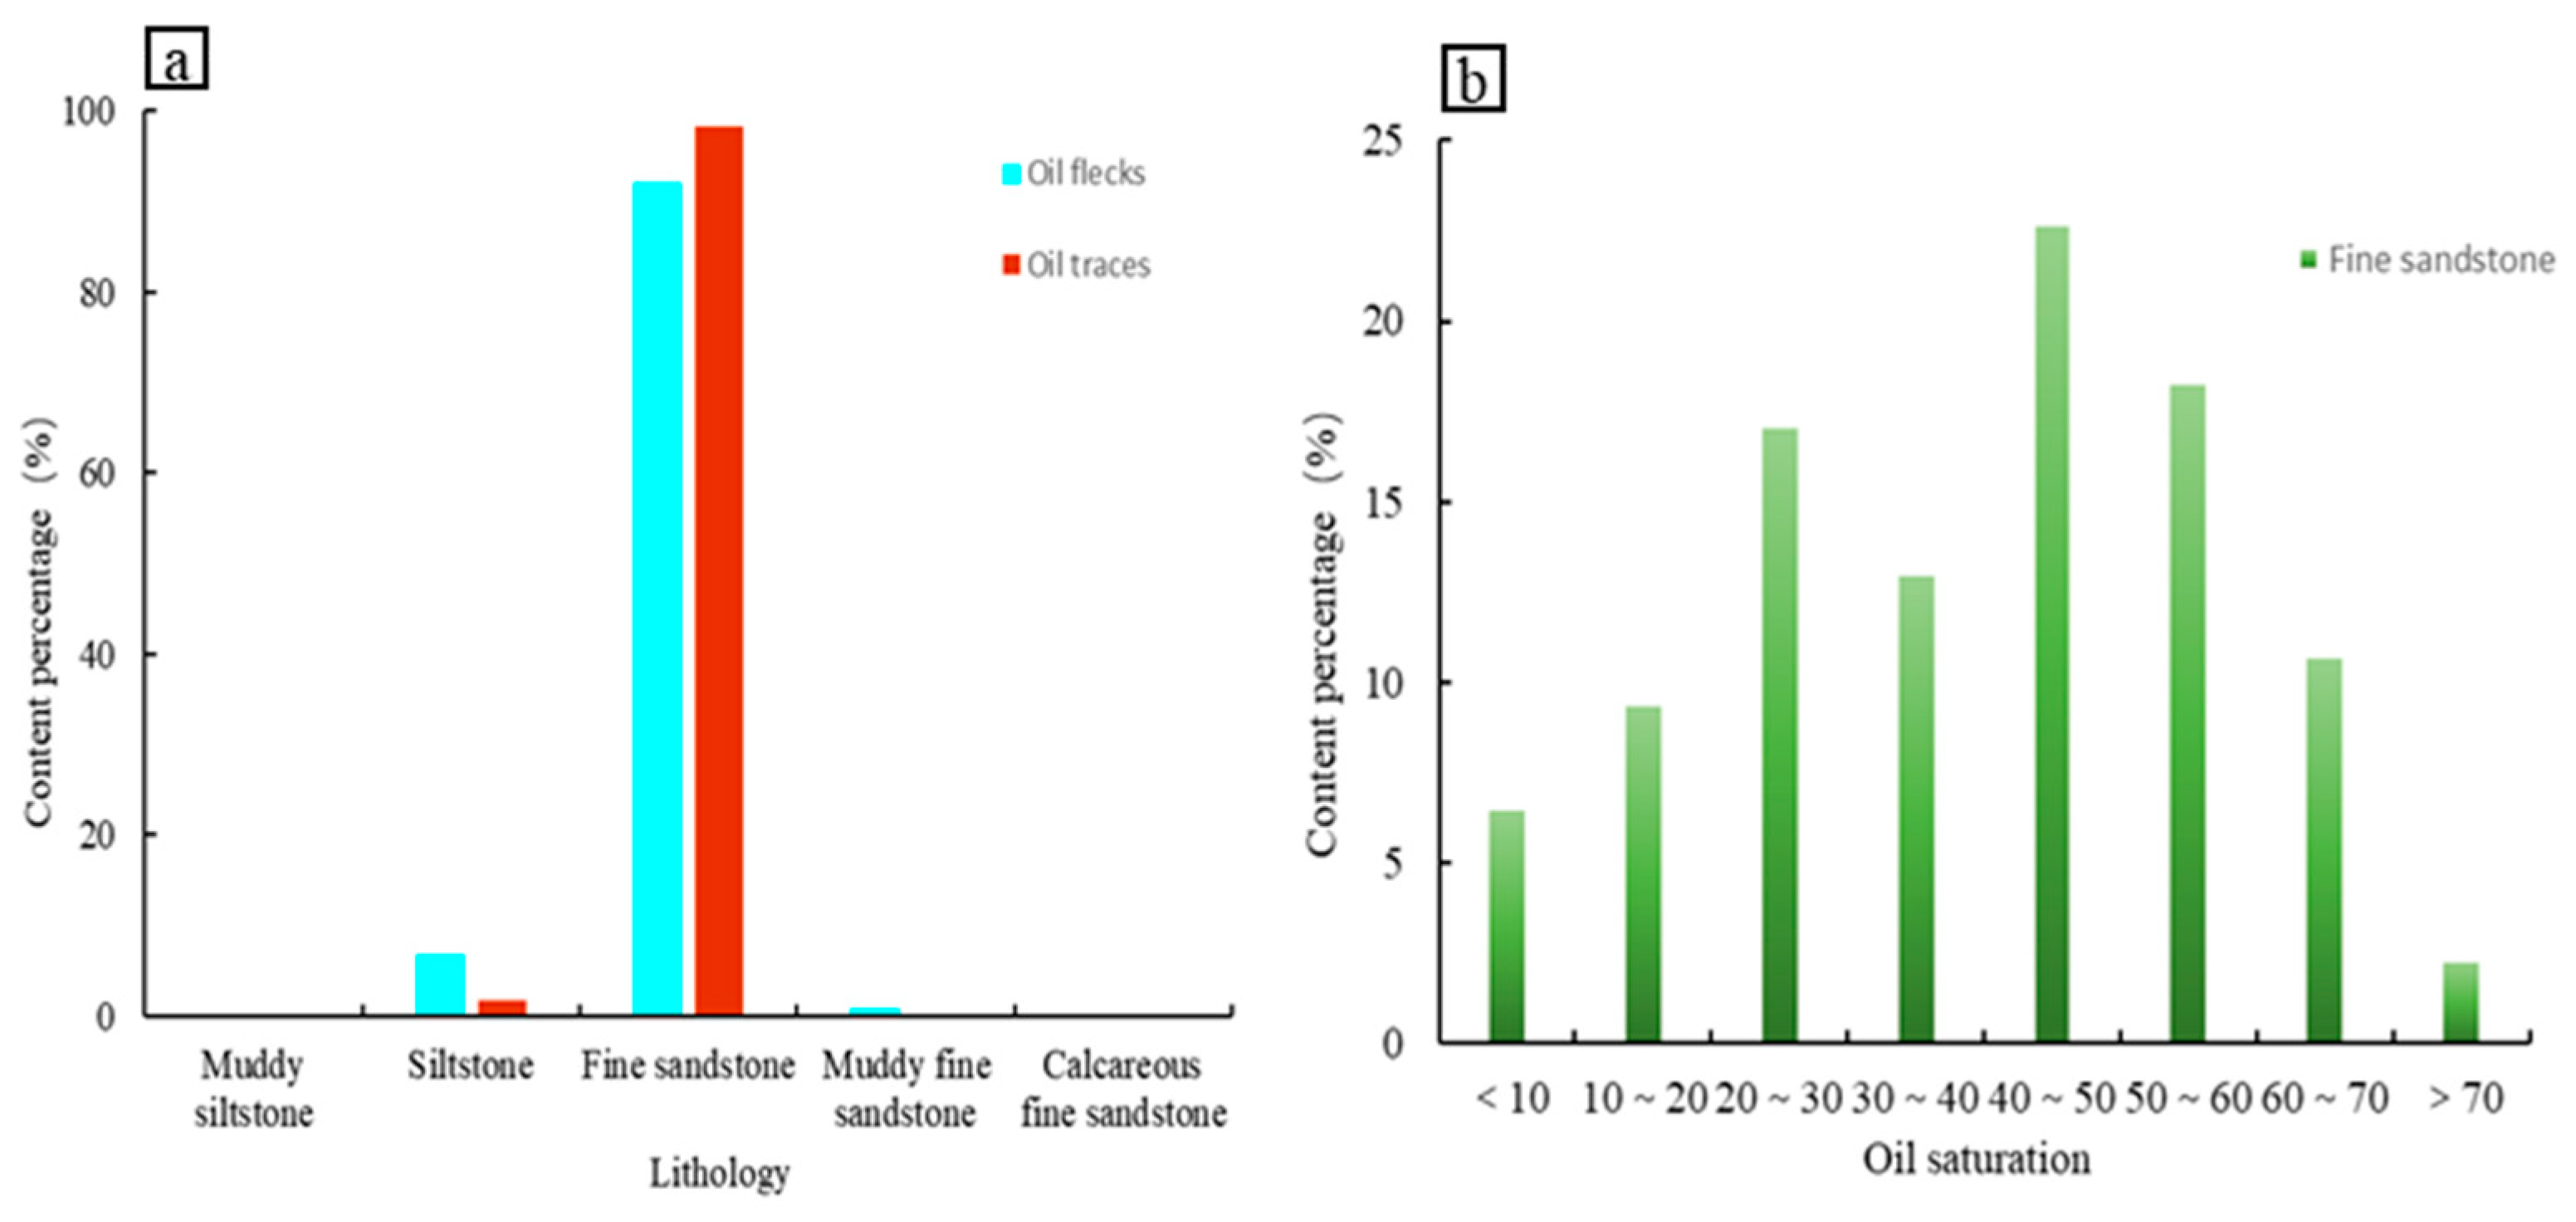
4.1.4. Oil-Bearing Characteristics

The tight sandstone reservoir in the Chang 6 has two types of oil-bearing saturation levels, namely, oil traces and oil flecks. The oil and gas shows in the siltstone were lower, with the oil fleck and oil trace core data accounting for 6.9 and 1.7% of the total oil fleck and oil trace core data, respectively. In contrast, the oil and gas shows of the fine sandstone were more pronounced, with the oil fleck and oil trace core data accounting for 92.2 and 98.3% of the total oil fleck and oil trace core data, respectively. The muddy fine sandstone had very low oil and gas shows, with oil fleck core data accounting for 0.9% of the total oil fleck core data (Figure 5a). The cores from 12 cored wells were tested, and no cores were tested for oil saturation in the siltstone owing to the low oil and gas shows. The oil saturation of the fine sandstone was higher, with 31% of the core samples showing oil saturation exceeding 50%, which was attributed to the pronounced oil and gas shows in the fine sandstone (Figure 5b).
Although the results of reservoir lithology analysis indicated that the lithology of the tight sandstone reservoir in the Chang 6 included siltstone and fine sandstone, the oil and gas show characteristics of the fine sandstone were more prominent in the oil flecks and traces and showed high oil saturation, whereas the oil-bearing characteristics of the siltstone were not obvious. Therefore, in this study, the effective reservoir in the Chang 6 was considered to be fine sandstone.
Consequently, the following studies on fluid types and effective reservoir thickness are focused on fine sandstone.

4.2. Reservoir Lithology Identification

4.2.1. Type of Lithology

The results of core observation and description indicated four types of lithologies, namely, fine sandstone, silty mudstone, mudstone, and carbonaceous mudstone, in the Chang 6 in the study area. Based on the observation and description of the cores from the cored wells, the fine sandstone was generally gray or gray–brown, with massive bedding (Figure 6a). It ranged in thickness from more than thirty centimeters to more than twenty meters, wherein the top was in contact with silty mudstone or mudstone with argillaceous agglomerates visible at the bottom (Figure 6b), which is a typical sandy debris flow depositional feature. The silty mudstone was generally dark gray, with fine sandstone at the top or bottom, or interbedded with the mudstone and ranged in thickness from a few centimeters to tens of centimeters, reflecting the depositional environment characteristics of turbidity currents (Figure 6c,d). The mudstone was generally black with well-developed bedding and high organic content, indicating a depositional environment of semi-deep to deep lakes (Figure 6e). Carbonaceous mudstone refers to lithologies in coal-bearing strata that lie between typical mudstone and coal rocks (Figure 6f). Based on the core description data, the core histograms of the 12 coring wells were completed. The tight fine sandstone corresponded to lower gamma values, whereas the gamma value of tight silty mudstone was higher than that of the tight fine sandstone but lower than the natural gamma value of the thicker mudstone (Figure 7). The thick-layered tight sandstone reservoir was formed by multiple phases of interaction between sandy debris flow and turbidity currents, exhibiting rapid lithological changes and lithological complexity in the vertical direction.
In the method used for lithological identification, the neutron and acoustic curves were normalized, and the normalized curves were superimposed to identify tight fine sandstone, silty mudstone, mudstone, and carbonaceous mudstone. In particular, the normalized neutron and density values of thick silty mudstone were the same, tending to be 0.5.
In the normalized and superimposed well log plots (Figure 8), the normalized neutron and acoustic wave curves of the tight fine sandstone section showed more obvious intervals, wherein the acoustic wave and neutron curves were positioned to the left and right, respectively, indicating a significant difference (highlighted in yellow). For the silty mudstone, the normalized neutron and acoustic wave curves overlapped with both curves, converging at approximately 0.5. In the case of mudstone, a noticeable gap was observed between the normalized neutron and acoustic wave curves, with the acoustic wave and neutron curves positioned to the right and left, respectively, in contrast to the characteristics of tight sandstone (highlighted in purple). For the carbonaceous mudstone, the normalized neutron and acoustic wave curves showed a clear separation, with a greater interval than the mudstone (highlighted in orange).
The tight fine sandstone contained four fluid categories, namely, the dry layer, oil layer, water layer, and oil–water co-layer. The normalized differences between neutron and sonic curves exhibited significant variations, indicating that the method of lithology identification had no correlation with fluid categories. Therefore, tight fine sandstone, silty mudstone, mudstone, and carbonaceous mudstone can be clearly identified by the method of normalized superposition of neutron and acoustic wave curves.

4.2.2. Lithology Identification Criteria

We established a normalized difference curve Δφ (subtracting CNL* values from AC* values). The lithology cross-plot was constructed by combining the natural gamma curve with the difference, acoustic wave, and density curves, respectively (Figure 9), and was used to identify the tight fine sandstone, silty mudstone, mudstone, and carbonaceous mudstone. The key aspect is to distinguish the tight fine sandstone from the other lithologies. Based on the method of normalized superposition of neutron and acoustic time-difference curves, the identification criteria for the four lithologies in the Chang 6 in the study area were established (Figure 9 and Table 1). In particular, the natural gamma value of the tight fine sandstone was less than 96 API, and the normalized difference value (Δφ) was more than 0.05. For the silty mudstone, the natural gamma value ranged between 96 and 123 API, and the normalized difference value (Δφ) was between −0.05 and 0.05. Mudstone showed a natural gamma value between 123 and 141 API, and the normalized difference value (Δφ) was between −0.05 and 0.05. The natural gamma value of carbonaceous mudstone ranged between 141 and 200 API, and the normalized difference value (Δφ) was less than −0.05.

4.3. Fluid Identification

Based on the analysis of the testing and production data of oil from the Chang 6 in the study area, overlapping regions were observed in the resistivities of the oil, dry, water, and oil–water layers within the tight sandstone reservoirs. In particular, the resistivity distributions of the oil and dry layers were similar, ranging from 30 to 80 Ω·m, whereas the resistivity of the water and oil–water layers ranged from 10 to 30 Ω·m. Within the resistivity range of 20 to 30 Ω·m, the oil, water, oil–water, and dry layers were represented. Therefore, the key challenge is the identification of oil layers in tight fine sandstone.

4.3.1. Fluid Types and Characteristics

In this study, 230 data points were selected from 52 wells to establish cross-plots using the acoustic time difference with density and induced conductivity, respectively (Figure 10). Notably, the densities of the oil, water, and oil–water layers in the tight sandstone ranged from 2.42 to 2.56 g/cm3, and those of the dry layer in the tight sandstone ranged from 2.54 to 2.68 g/cm3 (Figure 10a). The acoustic time difference of the oil, water, and oil–water layers in tight sandstone ranged from 212 to 246 μs/m, whereas that of the dry layers in the tight sandstone ranged from 203 to 230 μs/m. Additionally, the induced conductivity of the dry, oil, and oil–water layers in the tight sandstone showed a large number of overlaps (Figure 10b). Therefore, identifying oil-bearing layers in tight fine sandstone using the cross-plot of the acoustic time difference with density and induced conductivity is difficult.

4.3.2. Fluid Identification Criteria

In this study, 230 data points were selected from 52 wells to establish an induced conductivity–porosity–density intersection plate (Figure 11). Notably, the fluid types such as the oil, water, and oil–water layers, in the tight sandstone were distinguished. The identification markers of the tight oil layer were as follows: induced conductivity between 18 and 28.1 mS/m, density between 2.42 and 2.56 g/cm3, and porosity of more than 9.5%. The identification markers of the tight water layer were as follows: induced conductivity higher than 48.6 mS/m, density between 2.46 and 2.56 g/cm3, and porosity higher than 9.5%. Similarly, for the tight dry layers, the identification criteria were as follows: induced conductivity greater than 19.2–41.65 mS/m, density ranging between 2.54 and 2.68 g/cm3, and porosity less than 9.5%. For the oil–water layers, the identification criteria were as follows: conductivity ranging between 34.8 and 49.6 mS/m, density between 2.46 and 2.58 g/cm3, and porosity between 8.8 and 10.1%.

4.3.3. Multi-Curve Superposition Method for the Determination of Reservoir Thickness

The tight fine sandstone was identified using the tight reservoir lithology identification standards in combination with gamma curves. The tight fine sandstone section in well W1 comprised segments A, B, C, D, E, F, and G, as shown in Figure 12. Within this section, thick beds of silty mudstone, mudstone, and carbonaceous mudstone were interbedded. Based on the aforementioned lithology identification, the induced conductivity curve was superimposed on the normalized difference curve Δφ. We determined that the sections A, C, D, and G (highlighted with red fill) in Figure 12 were oil layers, which is consistent with the results of oil testing. For all four sections, the thickness of oil layers typically ranged from 5 to 8 m, with average porosity, induced conductivity, and oil-bearing saturation values of 10.8%, 26.3 mS/m, and 68%, respectively, which are characteristic of tight oil layers. Conversely, sections B, E, and F in Figure 12 (highlighted with brown–green fill) were identified as dry layers whose thickness ranged from 3 to 6 m, with porosity and induced conductivity values of 8.3% and 33.8 mS/m, respectively, characteristic of typical dry layers.

5. Discussion

5.1. Verification of Lithology Identification by Hyperbolic Normalized Superposition Reconstruction Method

To validate the accuracy of lithology identification using the hyperbolic normalized superposition reconstruction method, the established lithology identification plate was compared with the mud logging data from 34 wells in the study area (Figure 13). There were 40 recorded data points for the tight fine sandstone, with 38 conforming to test data, resulting in an accuracy rate of 95%. For silty mudstone, there were 40 test points, with 37 conforming to test data, resulting in an accuracy rate of 92.5%. For mudstone, there were 40 data points, with 37 conforming to test data, resulting in an accuracy rate of 92.5%. Additionally, there were 40 test points for carbonaceous mudstone, with 36 conforming to test data, resulting in an accuracy rate of 90%. Thus, we concluded that the results of lithology identification using the hyperbolic normalized superposition reconstruction method were basically consistent with the actual results.

5.2. Validation of the Identification of the Fluid Types

To verify the accuracy of the identification of the fluid types using the induced conductivity–porosity–density cross-plot, the results of the identification of oil, water, dry, and oil–water layers in the Chang 6 from 36 wells in the study area were compared with actual shot-hole test results (Figure 14). There were 63 test data points for oil layers, among which 58 conformed to test data, resulting in an accuracy rate of 92.1%. For the water layers, there were 23 test data points, with 21 conforming to test data, yielding an accuracy rate of 91.3%. The dry layers had 31 test data points, with 28 conforming to test data, resulting in an accuracy rate of 90.3%. For the oil–water layers, there were 25 test data points, with 23 conforming to test data, resulting in an accuracy rate of 92%. Table 2 presents the validation results of the partial identification and actual perforation test data, indicating that the results of the identification of the oil–water layer using the induced conductivity–porosity–density cross-plot method were consistent with the actual perforation test results.

6. Conclusions

(1)
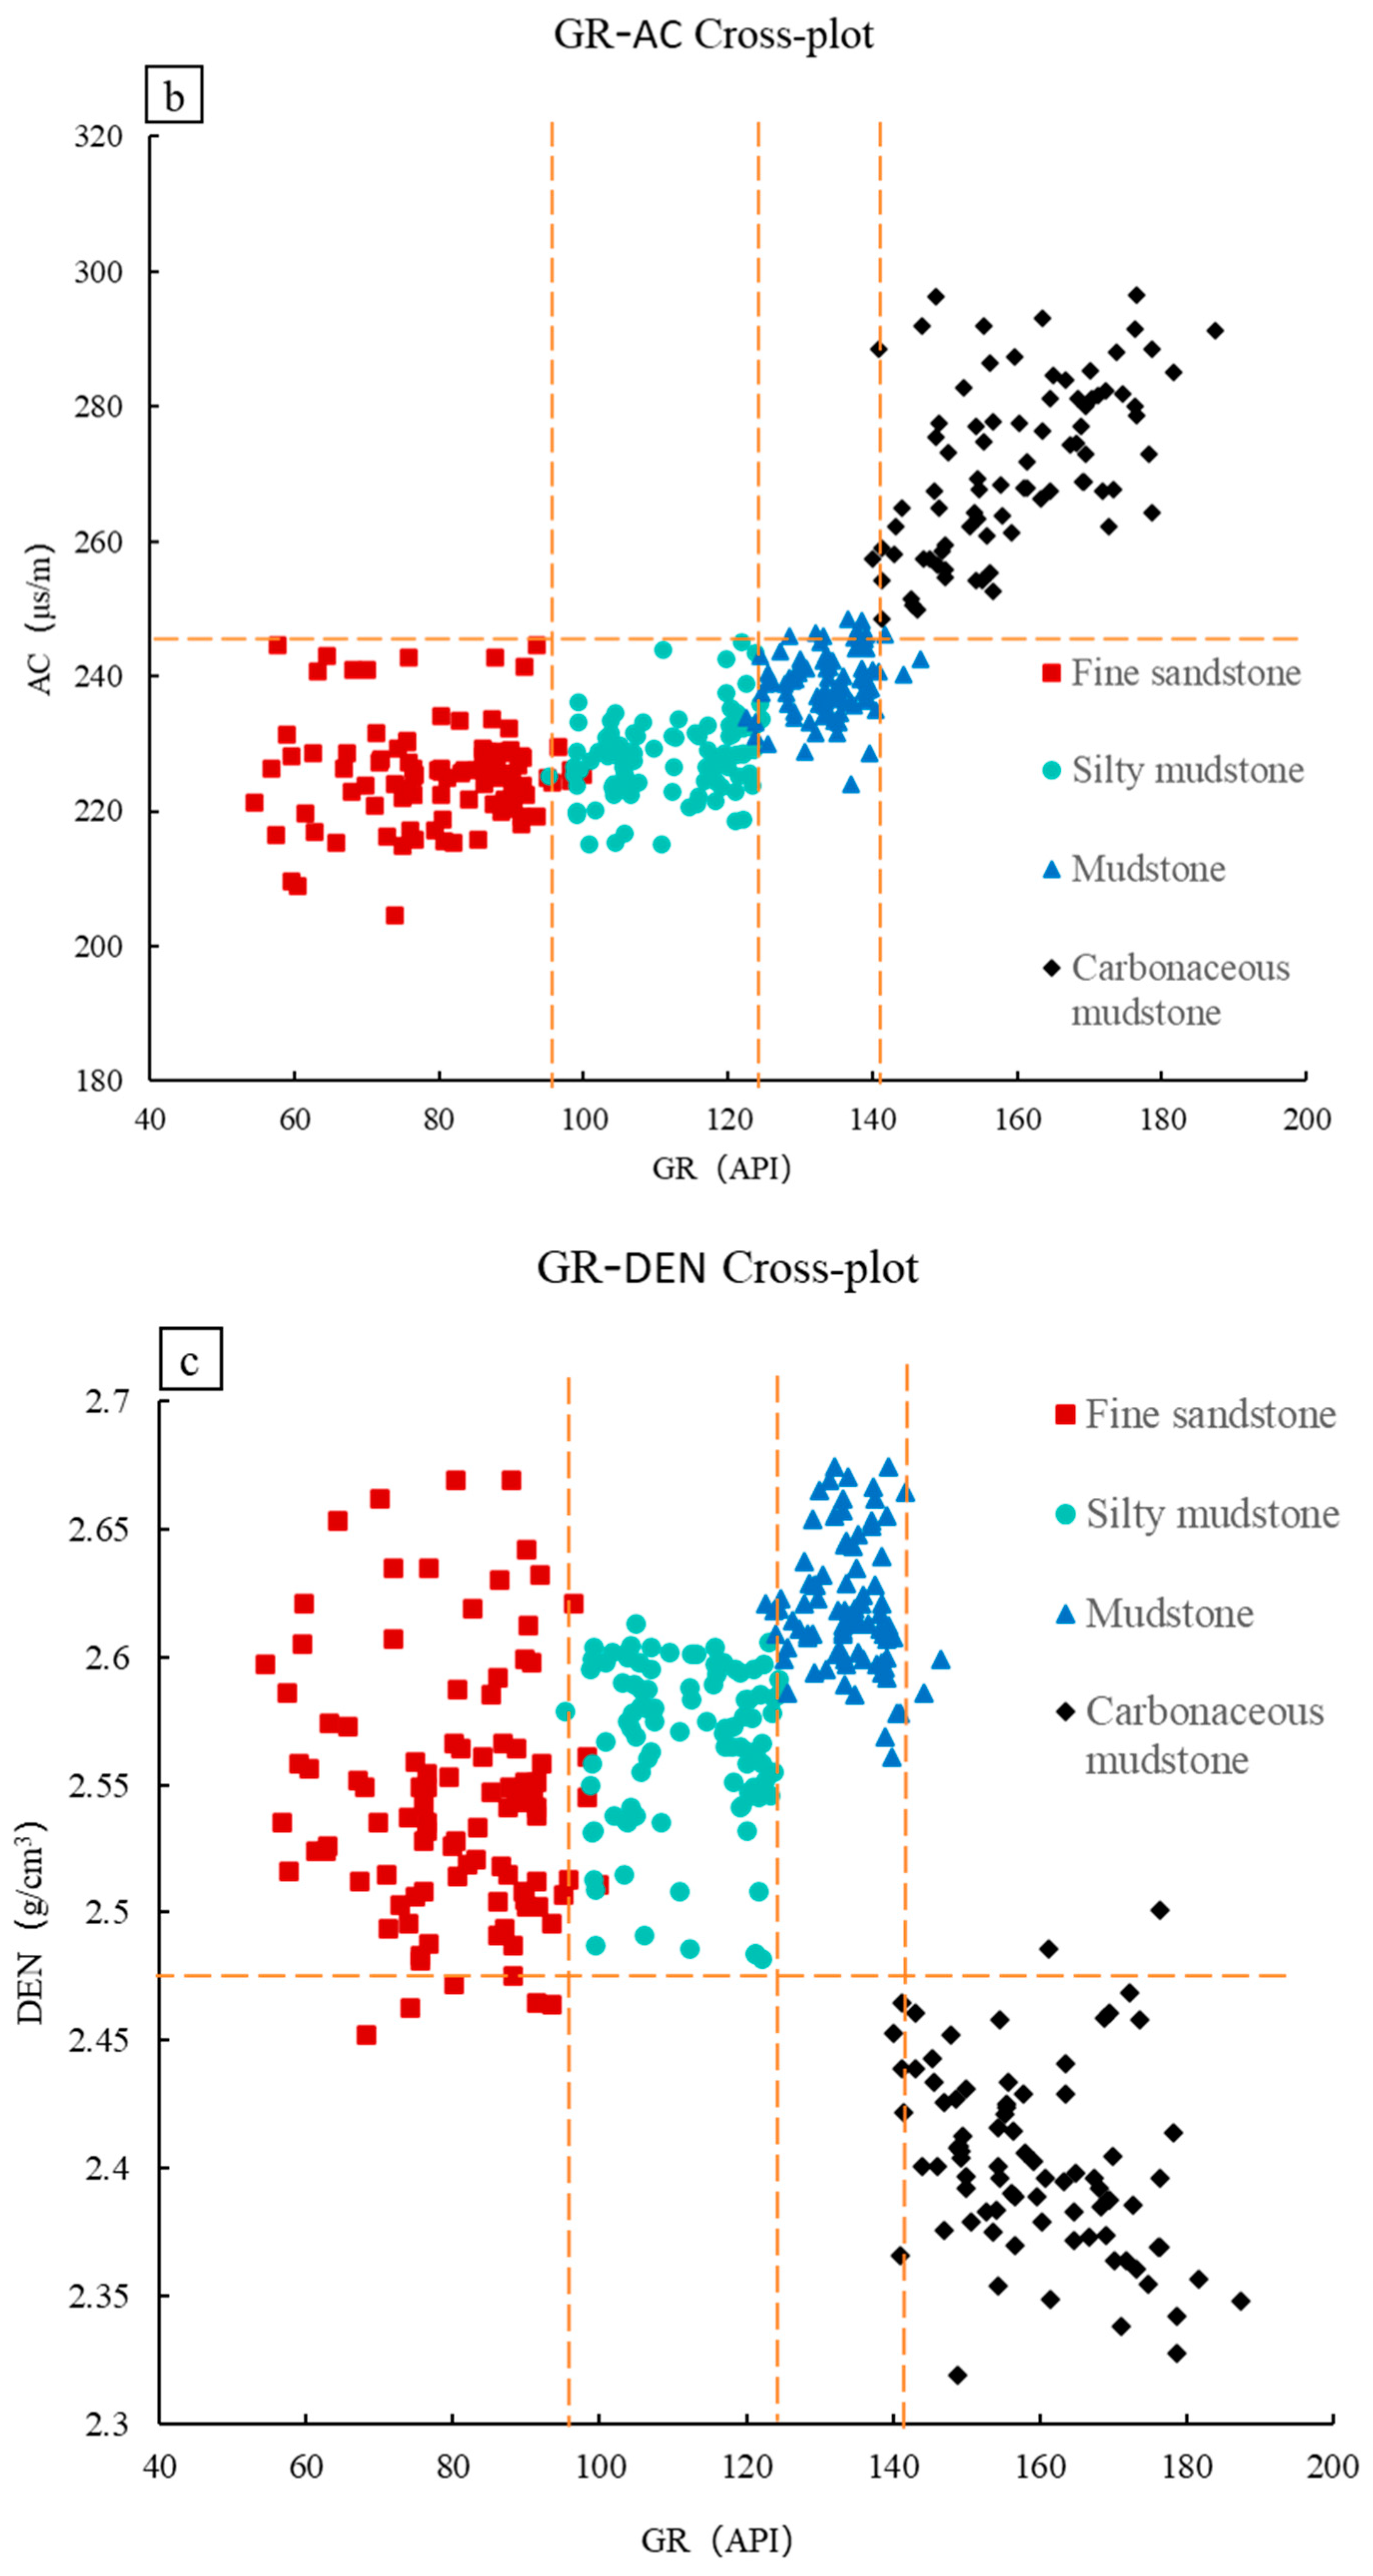
The hyperbolic normalized superposition reconstruction method can quickly and effectively identify the lithology of tight fine sandstone, silty mudstone, mudstone, and carbonaceous mudstone. The natural gamma value of tight fine sandstone was less than 96 API, and the normalized curve difference (Δφ) was greater than 0.05; that of silty mudstone was between 96 and 123 API, and the normalized difference (Δφ) was between −0.05 and 0.05; that of mudstone was between 123 and 141 API, and the normalized difference (Δφ) was between −0.05 and 0.05; that of carbonaceous mudstone was between 141 and 185 API, and the normalized difference (Δφ) was less than −0.05.
(2)
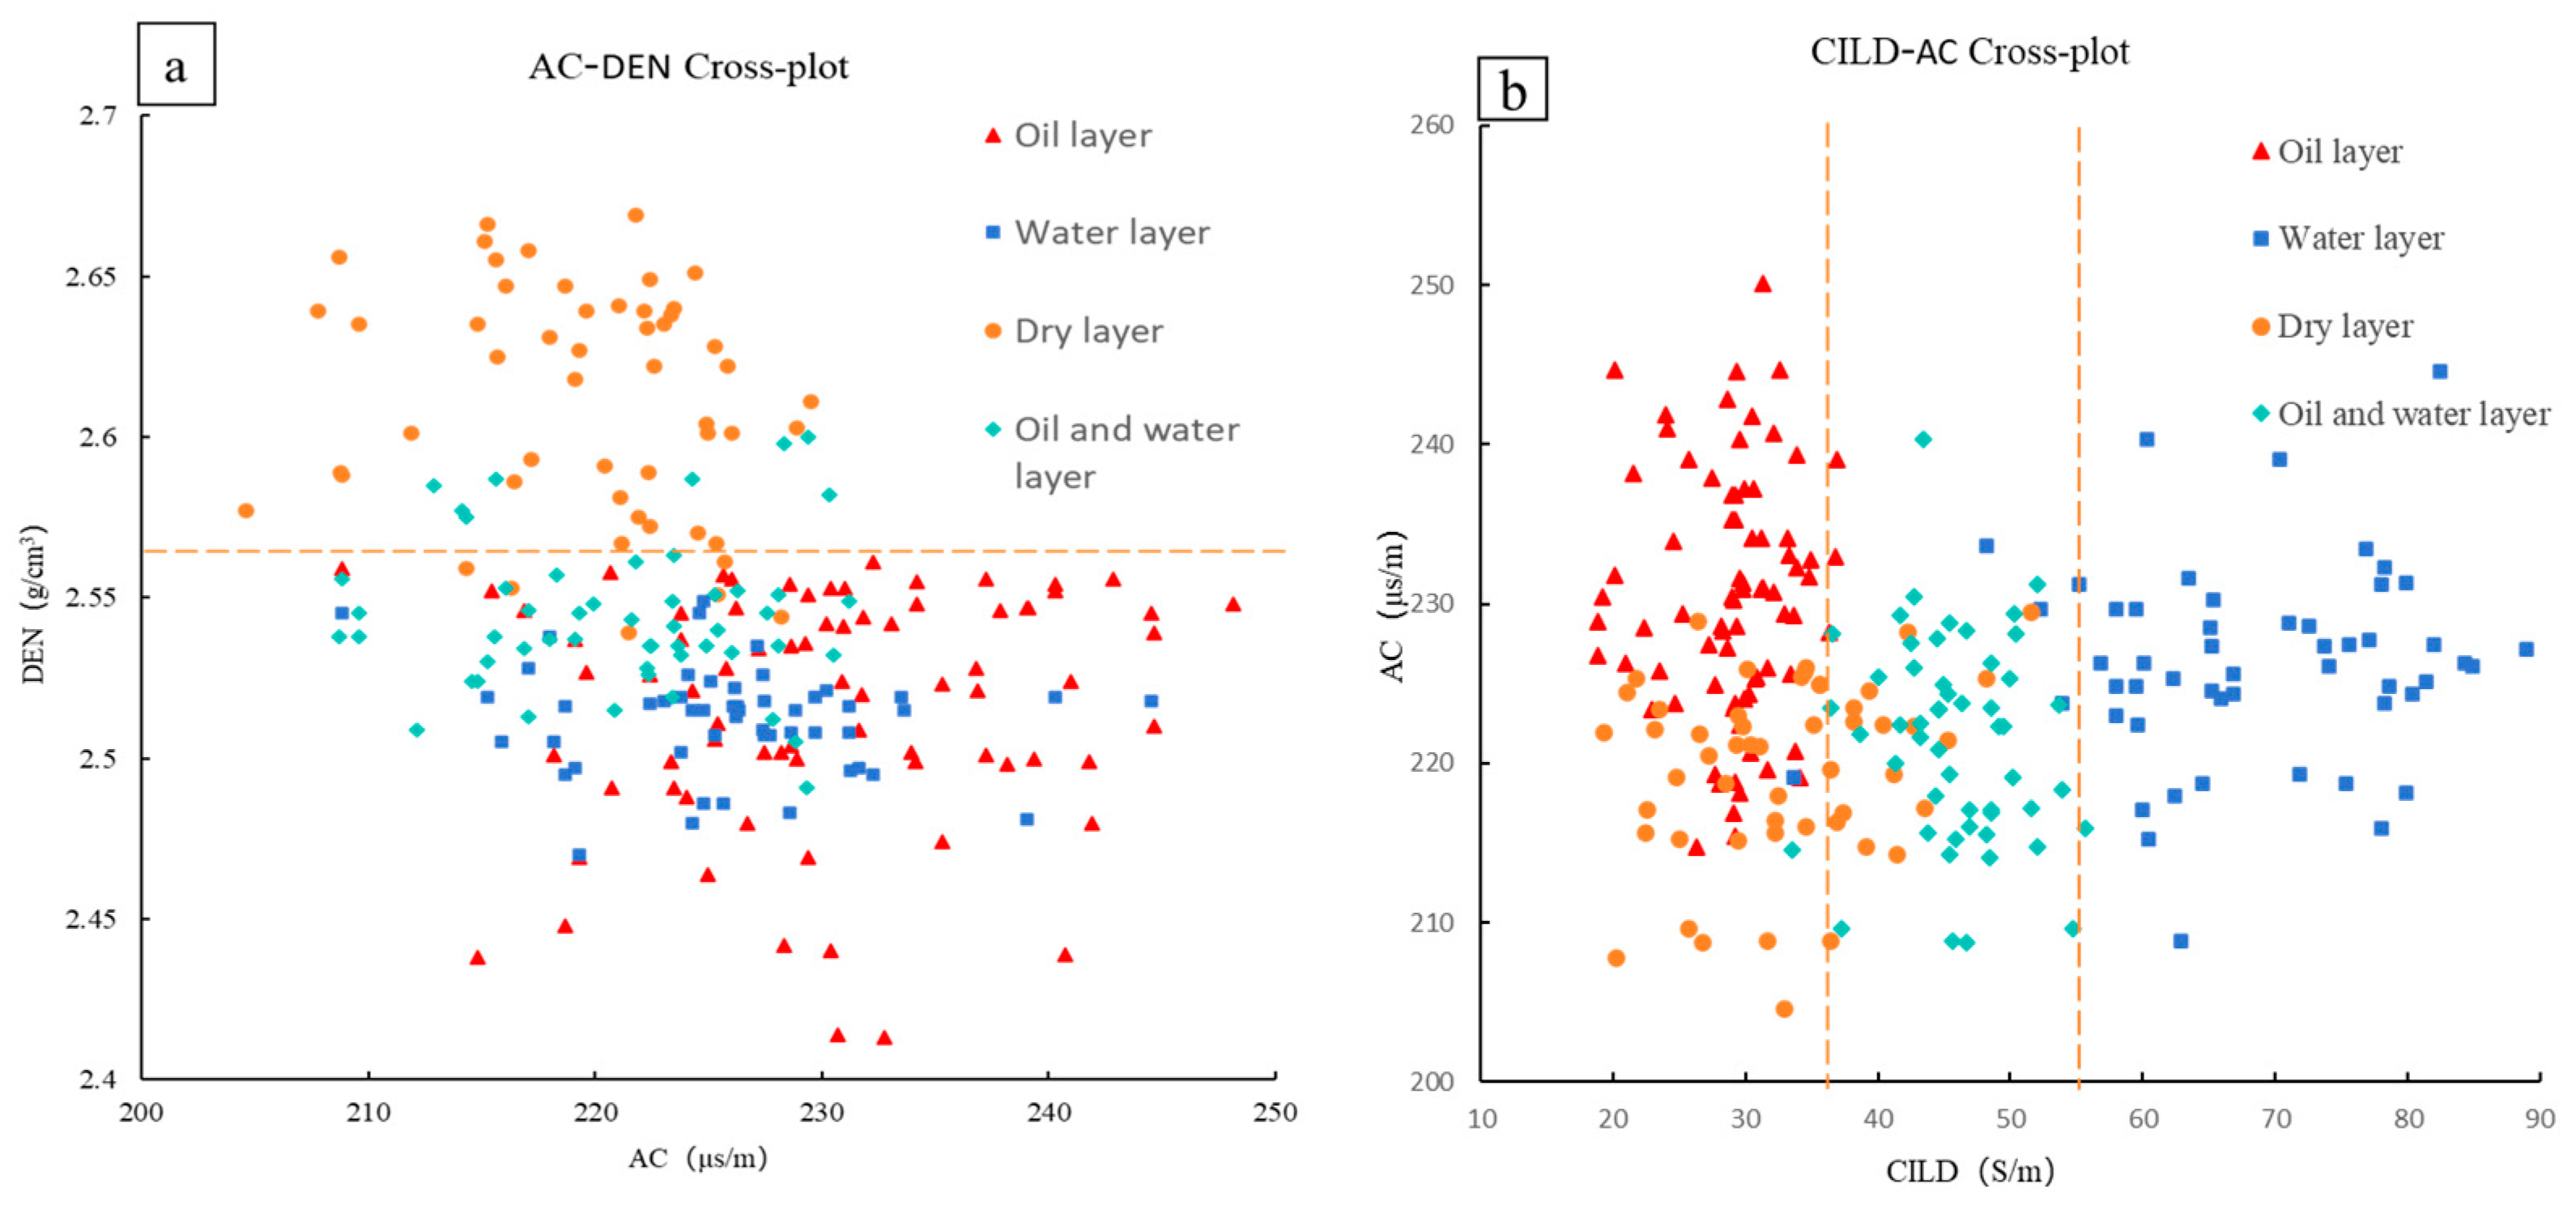
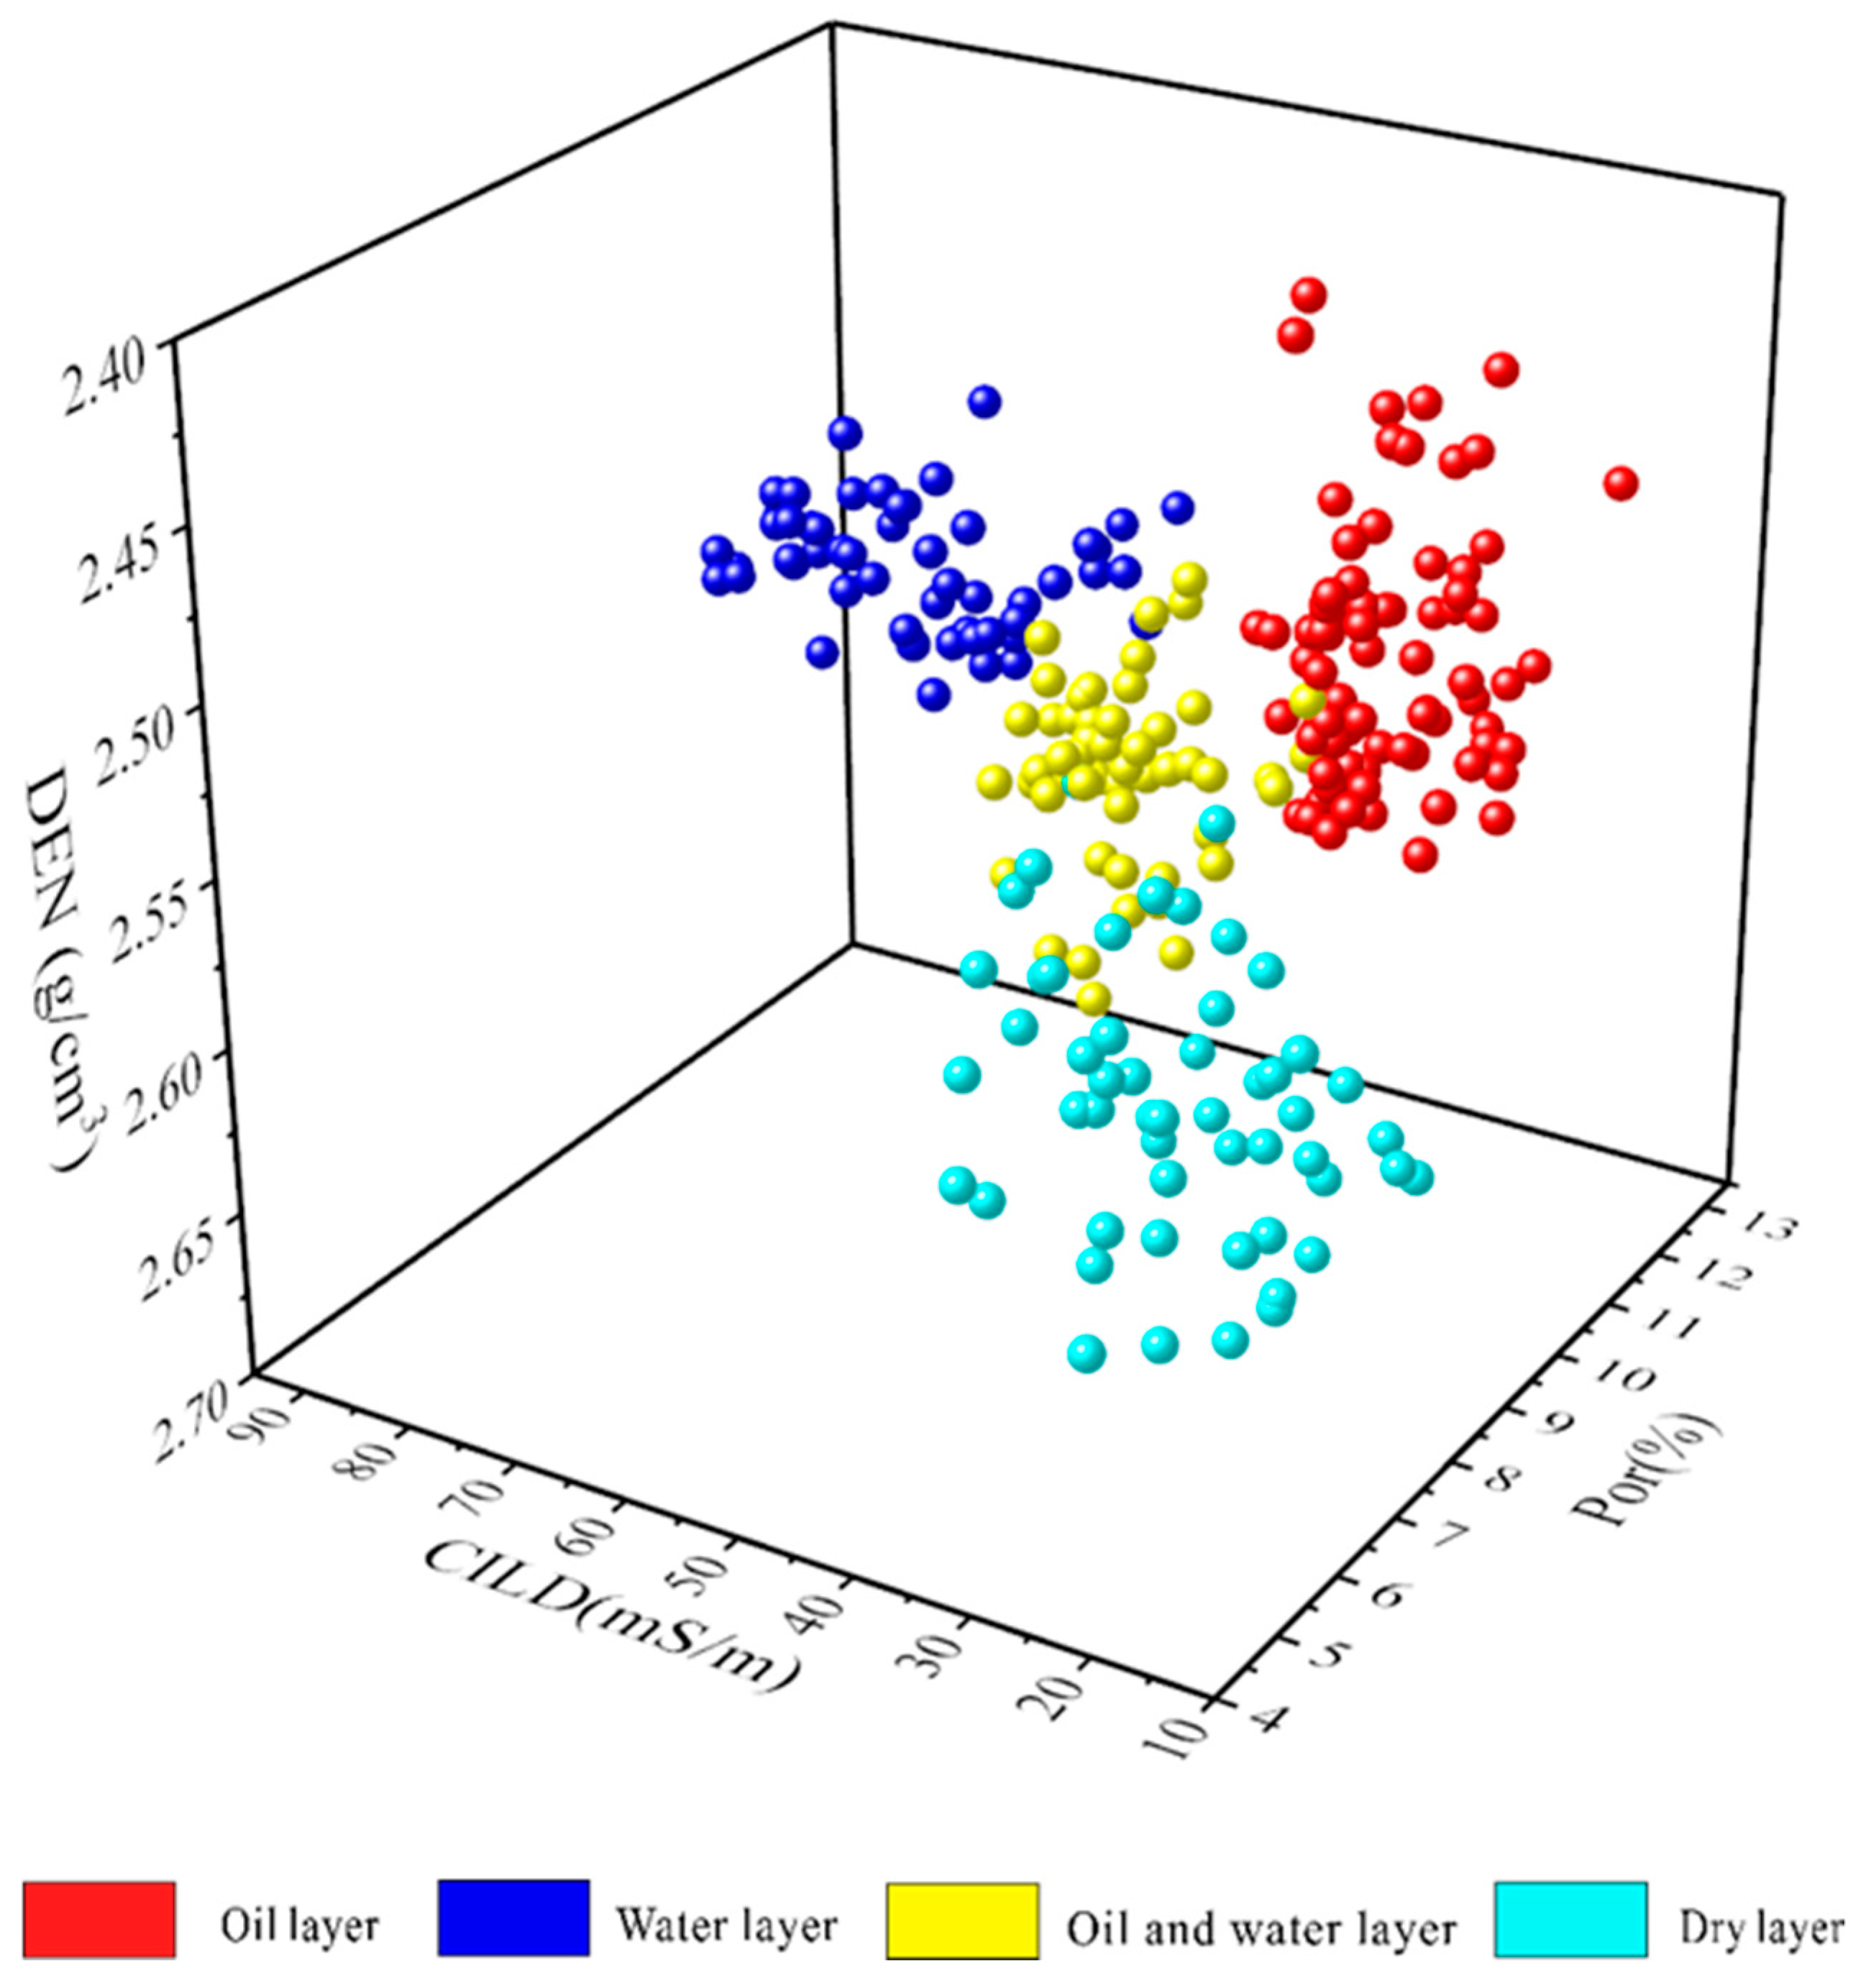
The induced conductivity–porosity–density intersection diagram can help identify the oil and water layers more effectively. For the tight oil layers, the induced conductivity was between 18 and 28.1 mS/m, the density was between 2.42 and 2.56 g/cm3, the porosity was more than 9.5%, and the oil saturation was more than 65%. For the tight water layers, the induced conductivity was greater than 48.6 mS/m, the density was between 2.46 and 2.56 g/cm3, and the porosity was greater than 9.5%. For the tight dry layers, the induced conductivity was more than 19.2–41.65 mS/m, the density was between 2.54 and 2.68 g/cm3, and the porosity was less than 9.5%. For the oil–water layers, the induced conductivity was between 34.8 and 49.6 mS/m, the density was between 2.46 and 2.58 g/cm3, and the porosity was between 8.8 and 10.1%.
(3)
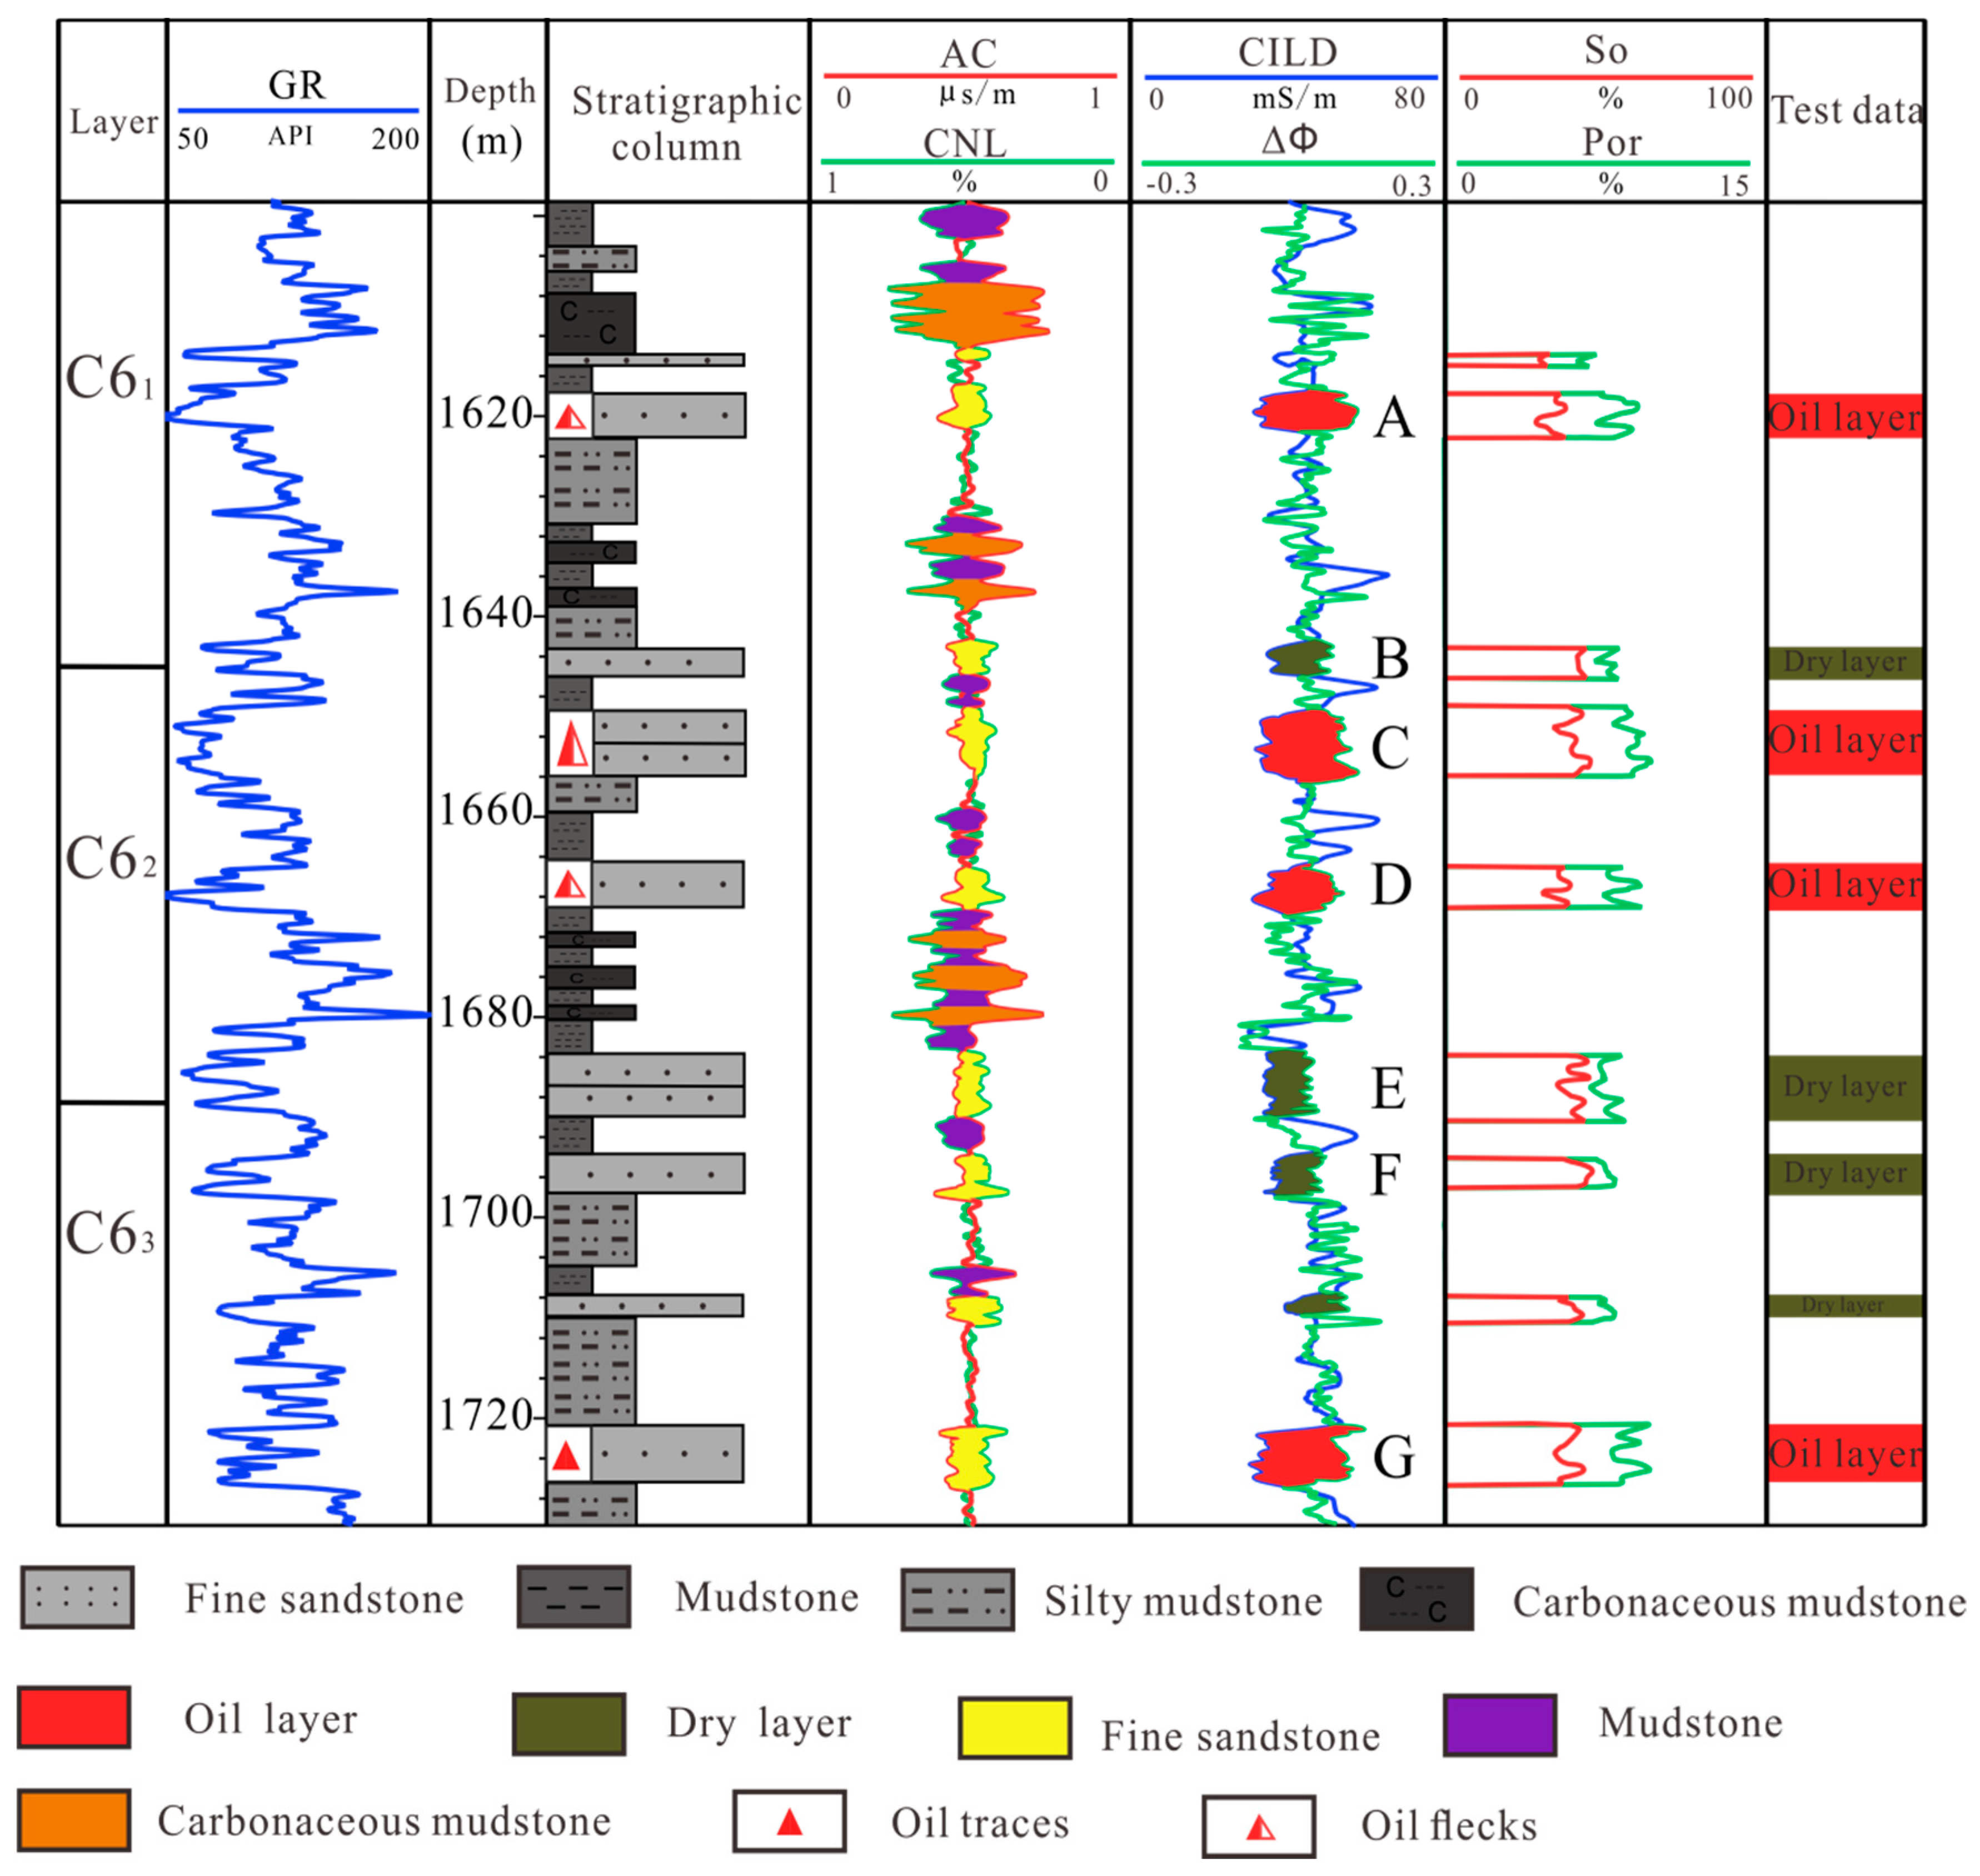
The thickness of the oil layer in tight fine sandstone can be effectively determined using the method of superposition of the difference and induced conductivity curves.

Supplementary Materials

The following supporting information can be downloaded at: https://www.mdpi.com/article/10.3390/en17163966/s1.

Author Contributions

Investigation, Formal Analysis, Conceptualization, Data Curation, Writing—Original Draft, Y.G.; Writing—Review and Editing, Supervision, Funding Acquisition, Methodology, Y.G.; Writing—Review and Editing, Supervision, Funding Acquisition, Methodology, K.Z. and H.N.; Investigation, Resources, Data Curation, X.S.; Supervision, Writing—Review and Editing, Project Administration, L.Q. and X.C.; Supervision, Writing—Review and Editing, Project Administration, C.F. All authors have read and agreed to the published version of the manuscript.

Funding

This research was sponsored by the Natural Science Basic Research Plan in Shaanxi Province, China (Grant No. 2017JM4013; Grant No. 2020JQ-798).

Data Availability Statement

The data used in this article are in the Supplementary Materials.

Conflicts of Interest

Authors Kai Zhao, Hao Niu, Lianlian Qiao and Xiaojuan Cheng were employed by the company Gas Field Company, Shaanxi Yanchang Petroleum (Group) Co., Ltd. The remaining authors declare that the research was conducted in the absence of any commercial or financial relationships that could be construed as a potential conflict of interest.

References

  1. Dou, L.; Wen, Z.; Wang, J.; Wang, Z.; He, Z.; Liu, X.; Zhang, N. Analysis of the world oil and gas exploration situation in 2021. J. Pet. Explor. Dev. Online 2022, 49, 1033–1044. [Google Scholar] [CrossRef]
  2. Zou, C.; Yang, Z.; Dong, D.; Zhao, Q.; Chen, Z.; Feng, Y.; Li, J.; Wang, X. Formation, Distribution and Prospect of Unconventional Hydrocarbons in Source Rock Strata in China. Earth Sci. 2022, 47, 1517–1533. [Google Scholar]
  3. Zhou, N.; Lu, S.; Wang, M.; Huang, W.; Xiao, D.; Jiao, C.; Wang, J.; Tiao, W.; Zhou, L.; Chen, F.; et al. Limits and grading evaluation criteria of tight oil reservoirs in typical continental basins of China. Pet. Explor. Dev. 2021, 48, 1089–1100. [Google Scholar] [CrossRef]
  4. Fu, S.; Jin, Z.; Fu, J.; Li, S.; Yang, W. Transformation of understanding from tight oil to shale oil in the Member 7 of Yanchang Formation in Ordos Basin and its significance of exploration and development. Acta Pet. Sin. 2021, 42, 561. [Google Scholar]
  5. Li, G.; Lei, Z.; Dong, W.; Wang, H.; Zheng, X.; Tan, J. Progress, challenges and prospects of unconventional oil and gas development of petrochina. China Pet. Explor. 2022, 27, 1–11. [Google Scholar]
  6. Zou, C.; Qiu, Z.; Zhang, J.; Li, Z.; Wei, H.; Liu, B.; Zhao, J.; Yang, T.; Zhu, S.; Tao, H.; et al. Unconventional petroleum sedimentology: A key to understanding unconventional hydrocarbon accumulation. Engineering 2022, 18, 62–78. [Google Scholar] [CrossRef]
  7. Yang, Z.; Zou, C. On the orderly “symbiotic enrichment” of conventional–unconventional oil and gas: On the theoretical techniques of conventional–unconventional oil and gas geology. J. Acta Geol. Sin. 2022, 96, 1635–1653. [Google Scholar]
  8. Yang, Z.; Zou, C.; Wu, S.; Pan, S.; Wang, L.; Pang, Z.; Lin, S.; Li, J. From source control theory to source–reservoir symbiosis system: On the theoretical understanding and practice of source rock strata oil and gas geology in China. Acta Geol. Sin. 2021, 95, 618–631. [Google Scholar]
  9. Jia, C.; Zheng, M.; Zhang, Y. Unconventional hydrocarbon resources in China and the prospect of exploration and development. J. Pet. Explor. Dev. Online 2012, 39, 139–146. [Google Scholar] [CrossRef]
  10. Qiu, Z.; Zou, C.; Mills, B.; Xiong, Y.; Tao, H.; Lu, B.; Liu, H.; Xiao, W.; Poulton, S. A nutrient control on expanded anoxia and global cooling during the Late Ordovician mass extinction. J. Commun. Earth Environ. 2022, 3, 82. [Google Scholar] [CrossRef]
  11. Zou, C.; Guo, Q.; Yang, Z.; Wu, S.; Chen, N.; Lin, S.; Pan, S. Resource potential and core area prediction of lacustrine tight oil: The Triassic Yanchang Formation in Ordos Basin, China. AAPG Bull. 2019, 103, 1493–1523. [Google Scholar] [CrossRef]
  12. Zou, C.; Tao, S.; Yuan, X.; Zhu, R.; Dong, D.; Li, W.; Wang, L.; Gao, X.; Gong, Y.; Jia, J.; et al. Global importance of“continuous”petroleum reservoirs: Accumulation, distribution and evaluation. J. Pet. Explor. Dev. 2009, 36, 669–682. [Google Scholar]
  13. Zhao, J. Conception, classification and resource potential of unconventional hydrocarbons. J. Nat. Gas Geosci. 2012, 23, 393–406. [Google Scholar]
  14. Hu, S.; Tao, S.; Yan, W.; Men, G.; Tang, Z.; Xue, J.; Jia, X.; Chen, X.; Jiang, T.; Huang, D.; et al. Advances on enrichment law and key technologies of exploration and development of continental tight oil in China. J. Nat. Gas Geosci. 2019, 30, 1083–1093. [Google Scholar]
  15. Sun, L.; Zou, C.; Jia, A.; Wei, Y.; Zhu, R.; Wu, S.; Guo, Z. Development characteristics and orientation of tight oil and gas in China. Pet. Explor. Dev. 2019, 46, 1073–1087. [Google Scholar] [CrossRef]
  16. Bai, Y.; Huang, L.; Zhao, J. Geochemical characteristics of Chang 91 source rocks of upper Triassic Yanchang formation in Zhidan–Ansai area, Ordos Basin and its significance for tight oil exploration. Pet. Sci. Technol. 2020, 38, 524–534. [Google Scholar] [CrossRef]
  17. Tong, Q.; He, D.; Xia, Z.; Huang, J.; Di, K.; Xu, F.; Guo, S. Influence of Reservoir Pore–Throat Structure Heterogeneity on Water–Flooding Seepage: A Case Study of Yanchang Formation in Ordos Basin. Minerals 2022, 12, 1243. [Google Scholar] [CrossRef]
  18. Fu, J.; Dong, G.; Zhou, X.; Hui, X.; Dan, W.; Fan, L.; Wang, Y.; Zhang, H.; Gu, Y.; Zhou, G. Research progress of petroleum geology and exploration technology in Ordos Basin. J. China Pet. Explor. 2021, 26, 19–40. [Google Scholar]
  19. Wang, J.; Wu, S.; Li, Q.; Guo, Q. An investigation into pore structure fractal characteristics in tight oil reservoirs: A case study of the Triassic tight sandstone with ultra–low permeability in the Ordos Basin, China. Arab. J. Geosci. 2020, 13, 961. [Google Scholar] [CrossRef]
  20. Zhu, R.; Zou, C.; Wu, S.; Yang, Z.; Mao, Z.; Yang, H.; Fan, C.; Hui, X.; Cui, J.; Su, L.; et al. Mechanism for generation and accumulation of continental tight oil in China. Oil Gas Geol. 2019, 40, 1168–1184. [Google Scholar]
  21. Yang, H.; Liu, Z.; Zhu, X.; Deng, X.; Zhang, Z.; Qi, Y. Provenance and depositional systems of the Upper Triassic Yanchang Formation in the southwestern Ordos Basin, China. J. Earth Sci. Front. 2013, 20, 10–18. [Google Scholar]
  22. Fu, S.; Yao, J.; Li, S.; Zhou, X.; Li, M. Enrichment characteristics and resource potential of continental shale oil in Mesozoic Yanchang Formation, Ordos Basin. J. Pet. Geol. Exp. 2020, 42, 698–710. [Google Scholar]
  23. Zhang, C.; Liu, X.; Yang, Y.; Yu, J.; Han, T.; Zhang, Y. Petroleum exploration history and enlightenment of Changqing Oilfield in Ordos Basin. J. Xinjiang Pet. Geol. 2021, 42, 253–263. [Google Scholar]
  24. Guo, F.; Peng, X.; Ma, X.; Wang, H. Main controlling factors and oil–bearing potential characteristics of a tight sandstone reservoir: A case study of southwest Ordos Basin. Energy Explor. Exploit. 2023, 41, 1288–1307. [Google Scholar] [CrossRef]
  25. Zhang, L.; Qiao, X.; Zhang, L.; Wu, K.; Zhou, W.; Bai, H.; Xin, C.; Wang, T. Reservoir characteristics and development performance of Yanchang Formation in Xunyi exploration area, Ordos Basin. Acta Pet. Sin. 2020, 41, 88. [Google Scholar]
  26. Sun, M.; Feng, C.; Li, Y. Characteristics and Paleoenvironment of High–Quality Shale in the Triassic Yanchang Formation, Southern Margin of the Ordos Basin. Minerals 2023, 13, 1075. [Google Scholar] [CrossRef]
  27. Feng, C.; Yang, H.; Pu, R.; Wang, Y.; Wang, D.; Liang, X.; Zhang, M.; Huang, Y.; Fei, S. Lithology and oil–bearing properties of tight sandstone reservoirs: Chang 7 member of Upper Triassic Yanchang Formation, southwestern Ordos Basin, China. Geosci. J. 2017, 21, 201–211. [Google Scholar] [CrossRef]
  28. Wang, M.; Zhang, S.; Zhang, F.; Liu, Y.; Guan, H.; Li, J.; Shao, L.; Yang, S.; She, Y. Quantitative research on tight oil microscopic state of Chang 7 Member of Triassic Yanchang Formation in Ordos Basin, NW China. J. Pet. Explor. Dev. 2015, 42, 827–832. [Google Scholar] [CrossRef]
  29. Cai, W.; Deng, R.; Gao, C.; Wang, Y.; Ning, W.; Shu, B.; Chen, Z. Evaluation Techniques for Shale Oil Lithology and Mineral Composition Based on Principal Component Analysis Optimized Clustering Algorithm. Processes 2023, 11, 958. [Google Scholar] [CrossRef]
  30. Xiang, M.; Qin, P.; Zhang, F. Research and application of logging lithology identification for igneous reservoirs based on deep learning. J. Appl. Geophys. 2020, 173, 103929. [Google Scholar]
  31. Busch, J.M.; Fortney, W.G.; Berry, L.N. Determination of lithology from well logs by statistical analysis. SPE Form. Eval. 1987, 2, 412–418. [Google Scholar]
  32. Yin, S.; Lin, X.; Huang, Y.; Zhang, Z.; Li, X. Application of improved support vector machine in geochemical lithology identification. Earth Sci. Inf. 2023, 16, 205–220. [Google Scholar] [CrossRef]
  33. Ren, Q.; Zhang, H.; Zhang, D.; Zhao, X.; Yan, L.; Rui, J.; Zeng, F.; Zhu, X. A framework of active learning and semi–supervised learning for lithology identification based on improved naive Bayes. Expert Syst. Appl. 2022, 202, 117278. [Google Scholar] [CrossRef]
  34. Sebtosheikh, M.A.; Salehi, A. Lithology prediction by support vector classififiers using inverted seismic attributes data and petrophysical logs as a new approach and investigation of training data set size effect on its performance in a heterogeneous carbonate reservoir. J. Pet. Sci. Eng. 2015, 134, 143–149. [Google Scholar] [CrossRef]
  35. Bhattacharya, S.; Carr, T.R.; Pal, M. Comparison of supervised and unsupervised approaches for mudstone lithofacies classifification:Case studies from the Bakken and Mahantango–Marcellus Shale, USA. J. Nat. Gas Sci. Eng. 2016, 33, 1119–1133. [Google Scholar] [CrossRef]
  36. Dev, V.A.; Eden, M.R. Evaluating the Boosting Approach to Machine Learning for Formation Lithology Classification. Comput. Chem. Eng. 2018, 44, 1465–1470. [Google Scholar]
  37. Saporetti, C.M.; da Fonseca, L.G.; Pereira, E.; de Oliveira, L.C. Machine learning approaches for petrographic classification of carbonate–siliciclastic rocks using well logs and textural information. J. Appl. Geophys. 2018, 155, 217–225. [Google Scholar] [CrossRef]
  38. Hu, Y.; Li, J.; Su, J. Identification of lithology and pore structure of subsalt carbonate rocks by geophysical logging method: Brazil deep sea J oilfield case. Prog. Geophys. 2020, 35, 735–742. [Google Scholar]
  39. Zhang, H.; Fang, Y.; Li, G.; Tan, M.; Wang, Q. Nuclear magnetic resonance relaxation mechanism and fluid identification in oil wet tight sandstone reservoirs. Geophys. Prospect. Pet. 2020, 59, 422–429. [Google Scholar]
  40. Raeesi, M.; Moradzadeh, A.; Doulati Ardejani, F.; Rahimi, M. Classifification and identifification of hydrocarbon reservoir lithofacies and their heterogeneity using seismic attributes, logs data and artifificial neural networks. J. Pet. Sci. Eng. 2012, 82–83, 151–165. [Google Scholar] [CrossRef]
  41. Maia Ramos Lopes, D.; Neves Andrade, A.J. Lithology identifification on well logs by fuzzy inference. J. Pet. Sci. Eng. 2019, 180, 357–368. [Google Scholar] [CrossRef]
  42. Aghli, G.; Soleimani, B.; Moussavi–Harami, R.; Mohammadian, R. Fractured zones detection using conventional petrophysical logs by differentiation method and its correlation with image logs. J. Pet. Sci. Eng. 2016, 142, 152–162. [Google Scholar] [CrossRef]
  43. Lai, F.; Liu, Y.; Kou, X.; Huang, Z.; Chen, Z.; Liu, Y.; Jiang, G.; Zang, Y.; Wang, M.; Wang, R.; et al. Fluid identification based on NMR apparent free water porosity inversion: A case study of Paleozoic tight sandstone gas reservoirs in Western Ordos. Geofluids 2022, 2022, 2–16. [Google Scholar] [CrossRef]
  44. Li, B.; Tan, M.; Zhang, H. Interpretation method of nuclear magnetic resonance dual–TW logging in oil–wet tight sandstone reservoirs. Appl. Geophys. 2020, 5, 796–808. [Google Scholar] [CrossRef]
  45. Shi, W.; Wang, X.; Shi, Y.; Feng, A.; Zou, Y.; Young, S. Application of dipole array acoustic logging in the evaluation of shale gas reservoirs. Energies 2019, 12, 3882. [Google Scholar] [CrossRef]
  46. Asante–Okyere, S.; Shen, C.; Yao, Y.Z.; Rulegeya, M.M.; Zhu, X. A novel hybrid technique of integrating gradient–boosted machine and clustering algorithms for lithology classifification. Nat. Resour. Res. 2020, 29, 2257–2273. [Google Scholar] [CrossRef]
  47. Silva, A.; Tavares, M.; Carrasquilla, A.; Missagia, R.; Ceia, M. Petrofacies Classifification Using Machine Learning Algorithms. Geophysics. 2020, 85, WA101–WA113. [Google Scholar] [CrossRef]
  48. Nouri–Taleghani, M.; Kadkhodaie, A.; Karimi–Khaledi, M. Determining Hydraulic Flow Units Using a Hybrid Neural Network and Multi–Resolution Graph–Based Clustering Method: Case Study from South Pars Gasfifield, Iran. J. Pet. Geol. 2015, 38, 177–191. [Google Scholar] [CrossRef]
  49. Xing, D.; Fan, Y.; Lu, H.; Lu, C.; Zhang, P.; Li, H.; Ding, Y. A combined method for gas–bearing layer identification in a complex sandstone reservoir. Front. Earth Sci. 2022, 10, 942895. [Google Scholar] [CrossRef]
  50. Li, J.; He, X.; Zhao, A.; Jiang, C. Joint inversion of formation radial shear–velocity profiles by dipole acoustic logging while drilling. Geophysics 2023, 88, 295–305. [Google Scholar] [CrossRef]
  51. Fu, J.; Deng, X.; Zhang, X.; Luo, A.; Nan, J. Relationship between deepwater sandstone and tight oil of the Triassic Yanchang Formation in Ordos Basin. J. Palaeogeogr. 2013, 15, 624–634. [Google Scholar]
  52. Er, C.; Luo, A.; Zhao, J.; Zhang, Z.; Bai, Y.; Cheng, D.; Wu, W.; Wei, Z.; Zhang, J. Lithofacies features of organic–rich shale of the Triassic Yanchang Formation in Huachi Aera, Ordos Basin. J. Earth Sci. Front. 2016, 23, 108–117. [Google Scholar]
  53. Li, F.; Du, L.; Zhao, J.; Li, Y.; Xiang, F.; Li, F. Dolomite genesis in Member Ma55 of Majiagou Formation, Sudong area, Ordos Basin. Acta Pet. Sin. 2016, 37, 328. [Google Scholar]
  54. Yang, H.; Liang, X.; Niu, X.; Feng, S.; You, Y. Geological conditions for continental tight oil formation and the main controlling factors for the enrichment: A case of Chang 7 Member Triassic Yanchang Formation, Ordos Basin, NW China. J. Pet. Explor. Dev. 2017, 44, 12–20. [Google Scholar] [CrossRef]
  55. Yan, L.; Yuan, D.; Chen, F.; Gao, Y.; Wang, S.; Cheng, F. A study on differentiated oil bearing controlling factors and distribution patterns of continental tight oil reservoir. J. Xinjiang Pet. Geol. 2019, 40, 262–268. [Google Scholar]
  56. Wang, B.; Sun, W.; Bai, Y.; Han, J.; Liu, D.; Zhang, X. Diagenesis and Pore Evolution of Tight Sandstone Reservoir of Chang 61 Member in Jiyuan Area, Ordos Basin. Xinjiang Pet. Geol. 2018, 39, 430–438. [Google Scholar]
  57. Wang, Z.; Mao, Z.; Yuan, X.; Deng, X.; Hui, X.; Zhang, Z.; Cui, J. Types, characteristics and geological significance of event deposits of Chang 9 Member of Triassic Yanchang Formation in southwestern Ordos Basin, NW China. Pet. Explor. Dev. 2023, 50, 588–602. [Google Scholar] [CrossRef]
  58. Niu, X.; Yang, T.; Cao, Y.; Li, S.; Zhou, X.; Xi, K.; Dodd, T. Characteristics and formation mechanisms of gravity–flow deposits in a lacustrine depression basin: Examples from the Late Triassic Chang 7 oil member of the Yanchang Formation, Ordos Basin, Central China. Mar. Pet. Geol. 2023, 148, 106048. [Google Scholar] [CrossRef]
  59. Tian, J.; Liang, Q.; Wang, F.; Yu, W. Genesis and development model of tight oil reservoir sand body in continental lacustrine basin: A case study on the Upper Triassic Chang 6 pay zone, Ordos Basin. J. Oil Gas Geol. 2022, 43, 877–888. [Google Scholar]
  60. Fu, S.; Fu, J.; Niu, X.; Li, S.; Wu, Z.; Zhou, X.; Liu, J. Accumulation conditions and key exploration and development technologies in Qingcheng Oilfield. J. Acta Pet. Sin. 2020, 41, 777–795. [Google Scholar]
  61. Zhang, X.; Feng, S.; Liang, X.; Feng, S.; Mao, Z.; Ren, J.; Chen, S. Sedimentary Microfacies identification and inferredevolution of Chang 7 Member of Yanchang Formation in the Longdong area, Ordos Basin. J. Acta Geol. Sin. 2020, 94, 957–967. [Google Scholar]
  62. Chen, Z.; Yang, Y.; Shao, J.; Zhu, Y.; Chen, X.; Shi, L.; Meng, D. Origin and distribution of formation water in tight sandstone reservoirs in the northeastern Ordos Basin. J. Oil Gas Geol. 2019, 40, 313–325. [Google Scholar]
  63. Li, Z.; Li, W.; Wu, Y.; Liu, X.; Zhang, Q.; Bai, J.; Yang, B. Characteristics and controlling factors of Chang 8 reservior of the Jiyuan Area in the Ordos Basin. J. Northwest Univ. 2020, 50, 193–203. [Google Scholar]
  64. Wang, R.; Zhou, J.; Du, Y.; Li, W. Deposition evolution model of the Carboniferous–Permian in Yan’an gas field, the southeastern Ordos Basin. Chin. J. Geol. 2021, 56, 1088–1105. [Google Scholar]
  65. Wang, F.; Chen, D.; Xie, G.; Li, S.; Zeng, J.; Yao, D.; Cheng, M. Differential enrichment mechanism of tight sandstone oil under the control of the source–reservoir structure in the Member 7 of Yanchang Formation in Qingcheng area, Ordos Basin. J. Acta Pet. Sin. 2022, 43, 941–956. [Google Scholar]
  66. Practices for Core Analysis; Standards Press of China: BeiJing, China, 3 November 2006.
  67. The Technical Specifications for Exploring Well Logging Data Processing and Interpreting; Standards Press of China: BeiJing, China, 27 August 2010.
  68. Jing, J.; Wei, W.; Mei, Z.; Li, Z. Method of Welllogging interpretation for fracture reservoirs of carbonate rock: A case study in Tahe oil–field. Prog. Geophys. 2005, 20, 78–82. [Google Scholar]
  69. Wang, Y.; Gao, J.; Dong, J.; Yang, H. Integrative processing in synthesis of multi–logging traces. J. Pet. Geophys. Explor. 2005, 40, 243–247. [Google Scholar]
Figure 1. Geological background map of the study area. (a) Map showing the geographic location of the study area. (b) Stratigraphic histogram of the study area.
Energies 17 03966 g001
Figure 2. Histogram of the distribution of physical properties of tight sandstone reservoirs in the Chang 6 in the study area. (a) Histograms of porosity and (b) permeability.
Energies 17 03966 g002
Figure 3. Lithological characteristics of the tight sandstone reservoir in the Chang 6 in the study area. (a) Histogram of lithology distribution, (b) ternary plot of sandstone types, and (c) histogram of the rock debris content.
Energies 17 03966 g003aEnergies 17 03966 g003b
Figure 4. Histogram of the electrical characteristics of the tight sandstone reservoir in the Chang 6 in the study area.
Energies 17 03966 g004
Figure 5. Histogram of the distribution of oil-bearing characteristics of the tight sandstone reservoir in the Chang 6 in the study area. (a) Oil-bearing grade histogram. (b) Oil-saturation histogram.
Energies 17 03966 g005
Figure 6. Photos of the cores in the study area. (a,b) Block-bedding fine sandstone, (c,d) silty mudstone, (e) mudstone, and (f) carbonaceous mudstone.
Energies 17 03966 g006aEnergies 17 03966 g006b
Figure 7. Photos of a core sketch in the study area.
Energies 17 03966 g007
Figure 8. The identification method for the tight sandstone reservoirs in the Chang 6 in the study area. Comparisons of lithology identification in wells (a) W1, (b) W2, (c) W3, and (d) W4.
Energies 17 03966 g008
Figure 9. Lithological identification plot for the tight sandstone reservoirs in the Chang 6 of the study area. Cross-plots of the (a) normalized difference and natural gamma curves, (b) natural gamma and acoustic time-difference curves, and (c) natural gamma and density curves. The orange lines are the dividing lines.
Energies 17 03966 g009aEnergies 17 03966 g009b
Figure 10. Identification plate of the oil and water layers in a tight sandstone reservoir in the Chang 6 in the study area. Cross-plots of (a) density versus acoustic time difference and (b) induced conductivity versus acoustic time difference. The orange lines are the dividing lines.
Energies 17 03966 g010
Figure 11. Identification plot of the induced conductivity, porosity, and density of tight sandstone reservoirs in the Chang 6 in the study area.
Energies 17 03966 g011
Figure 12. Superposition of tight sandstone reservoir curves in the Chang 6 in well W1 to identify the thickness of the fractured oil layer.
Energies 17 03966 g012
Figure 13. Lithology verification diagram of the Chang 6 in the study area. The orange lines are the dividing lines.
Energies 17 03966 g013
Figure 14. Verification diagram of the identification of oil and water layers in the Chang 6 in the study area.
Energies 17 03966 g014
Table 1. Lithology identification of tight reservoirs in the Chang 6 in the study area.
LithologyGR (API)DEN (g/cm3)AC (μs/m)Δφ
Fine sandstone50~962.46~2.67208~2450.05~0.2
Silty mudstone96~1232.48~2.62213~245−0.05~0.05
Mudstone123~1412.56~2.68223~246−0.05~0.05
Carbonaceous mudstone141~2002.31~2.46246~300−0.05~−0.3
Table 2. Validation data for the oil and water layers in the Chang 6 in the study area.
Well NumberInduction
Conductivity (mS/m)
Porosity (%)Identify
Test Results
Test Results
Y19920.2699.83Oil layerOil layer
Y42424.97210.36Oil layerOil layer
Y8728.1449.71Oil layerOil–water layer
Y7626.83811.28Oil layerOil layer
Y7427.87711.05Oil layerOil layer
Y7219.22310.58Oil layerOil layer
X32928.1229.60Oil layerOil–water layer
X32329.2619.73Oil layerOil layer
X32128.99412.38Oil layerOil layer
X32029.01111.16Oil layerOil layer
X30523.2669.78Oil layerOil layer
L9925.59710.29Oil layerOil layer
L41627.33412.58Oil layerOil layer
Y7049.129.7Oil–water layerWater layer
Y4842.7619.43Oil–water layerOil–water layer
X29433.58410.16Oil–water layerOil layer
X29238.5519.49Oil–water layerOil–water layer
X29154.7059.92Oil–water layerOil–water layer
L38943.2489.55Oil–water layerOil–water layer
L36141.2879.46Oil–water layerOil–water layer
L35645.3979.39Oil–water layerOil–water layer
L28235.4849.07Oil–water layerOil–water layer
L18050.1718.12Oil–water layerOil–water layer
Z3040.0319.44Oil–water layerOil–water layer
Z10544.3068.84Oil–water layerOil–water layer
Y4629.368.64Dry layerDry layer
Y3327.2576.47Dry layerDry layer
X28841.1477.17Dry layerDry layer
X28740.2598.97Dry layerOil–water layer
L1637.2187.74Dry layerDry layer
L15134.5946.84Dry layerDry layer
Z49642.2647.29Dry layerDry layer
Z13070.9799.89Water layerWater layer
Z14353.86410.80Water layerWater layer
Z3050.339.30Water layerOil–water layer
...............
Z28765.3810.44Water layerWater layer
Disclaimer/Publisher’s Note: The statements, opinions and data contained in all publications are solely those of the individual author(s) and contributor(s) and not of MDPI and/or the editor(s). MDPI and/or the editor(s) disclaim responsibility for any injury to people or property resulting from any ideas, methods, instructions or products referred to in the content.

