Abstract
The CO2 sequestration capacity evaluation of reservoirs is a critical procedure for carbon capture, utilization, and storage (CCUS) techniques. However, calculating the sequestration amount for CO2 flooding in low-permeability reservoirs is challenging. Herein, a method combining numerical simulation technology with artificial intelligence is proposed. Based on the typical geological and fluid characteristics of low-permeability oil reservoirs in the Liaohe oilfield, the CMG 2020 version software GEM module is used to establish a model for CO2 flooding and sequestration. Meanwhile, a calculation method for the effective sequestration coefficient of CO2 is established. We systematically study the sequestration rules in low-permeability reservoirs under varying conditions of permeability, reservoir temperature, and initial reservoir pressure. The results indicate that, as the permeability and sequestration pressure of the reservoir increase, oil recovery gradually increases. The proportion of structurally bound sequestration volume increases from 55% to 60%. Reservoir temperature has minimal impact on both the recovery rate and the improvement in sequestration efficiency. Sequestration pressure primarily improves sequestration efficiency by increasing the dissolution of CO2 in the remaining oil and water. The calculation chart for the effective sequestration coefficient, developed using artificial intelligence algorithms under multi-factor conditions, enables accurate and rapid evaluation of the sequestration potential and the identification of favorable sequestration areas in low-permeability reservoirs. This approach provides valuable technical support for CO2 flooding and sequestration in pilot applications.
1. Introduction
In recent years, with the rapid development of the global economy and the improvement of living standards, global oil consumption has been rising. Since 2019, China has relied on foreign crude oil for over 70% of its needs for six consecutive years [1,2,3]. The main section of aging oilfields developed through water injection has reached the “double high” stage, characterized by a high water cut and high recovery rates. Stabilizing and increasing crude oil production has become challenging, making it urgent to identify new growth points for resources [4,5,6]. Direct emissions of CO2, the by-product of burning fossil fuels, will pollute the atmosphere, causing the greenhouse effect [7,8]. As the world’s second largest economic entity and a responsible nation, China has taken the initiative to shoulder the responsibility of tackling global climate change. It has set the ambitious targets of reaching peak carbon emissions by 2030 and achieving carbon neutrality by 2060 [9,10,11]. In the background of “energy independence” and “carbon peak and carbon neutrality”, CCUS (carbon capture, utilization, and storage) have received increasing attention in the field of petroleum production [12,13].
Low-permeability reservoirs face challenges such as strong reservoir heterogeneity, a complex pore structure, rapid energy depletion in depleted production formations, difficulties in replenishing energy through water injection, and low recovery rates [14,15]. In 2014, the United States was responsible for about 93% of global CO2 flooding-enhanced oil recovery (EOR) production. About 80% of the CO2 flooding reservoirs had permeabilities of less than 50 × 10−3 μm, demonstrating considerable economic and social benefits [16,17,18,19]. Injecting CO2 into a reservoir can lead to the dissolution, expansion, and viscosity reduction of crude oil. Miscible flooding can significantly enhance both sweep efficiency and flooding efficiency [20,21]. However, the varying characteristics of reservoirs—including physical properties, oil quality, temperature, pressure, fluid distribution, and trap storage capacity—affect the impact of CO2 flooding on enhanced oil recovery and burial effects [22,23,24]. Currently, CO2 storage capacity assessment studies mostly focus on specific physical properties of oil reservoirs [25,26,27]. There is a lack of research on the changes and potential assessment of CO2 burial amounts under varying reservoir conditions.
The calculation of CO2 storage capacity is primarily determined by the method used to calculate effective storage capacity. Effective storage capacity considers factors such as buoyancy, overburden pressure, fluid dynamics, heterogeneity, water saturation, and others. Its value aligns more closely with actual storage capacity than theoretical estimates [28,29,30]. Existing method mainly use analogy or numerical simulation techniques to calculate effective CO2 storage capacity. However, pilot test projects for CO2 storage sites are limited, leading to restricted available parameters and reliability issues in analog-based CO2 storage calculations [31]. The process of calculating the effective storage coefficient by numerical simulation method is complex and lacks the capability for rapid and convenient calculations, which imposes application limitations [32,33]. To address these issues, a numerical simulation model of CO2 flooding was developed based on the geological and fluid characteristics of typical low-permeability oil reservoirs in the Liaohe oilfield. This model aims to systematically study the effects of enhanced oil recovery and CO2 burial behavior, establish a calculation framework for the effective storage coefficient using artificial intelligence methods, and provide technical support and theoretical guidance for assessing CO2 burial potential and identifying favorable burial areas in the study area.
2. The Establishment of a Numerical Model of CO2 Flooding and Burial
To investigate the CO2 flooding and burial behavior in low-permeability reservoirs, a numerical simulation component model of CO2 flooding and burial was developed using CMG reservoir numerical simulation software. This model was calibrated based on the phase behavior of original formation fluids and the geological characteristics and production data of the study area. A mature reservoir engineering calculation model was employed to compute the theoretical CO2 storage capacity. The solubility of CO2 measured in the laboratory was used to adjust the theoretical storage estimates. Subsequently, the CO2 effective storage coefficient was determined, forming the foundation for investigating CO2 storage mechanisms and developing a predictive model for effective storage coefficients.
2.1. The Fitting of the Phase of Fluids
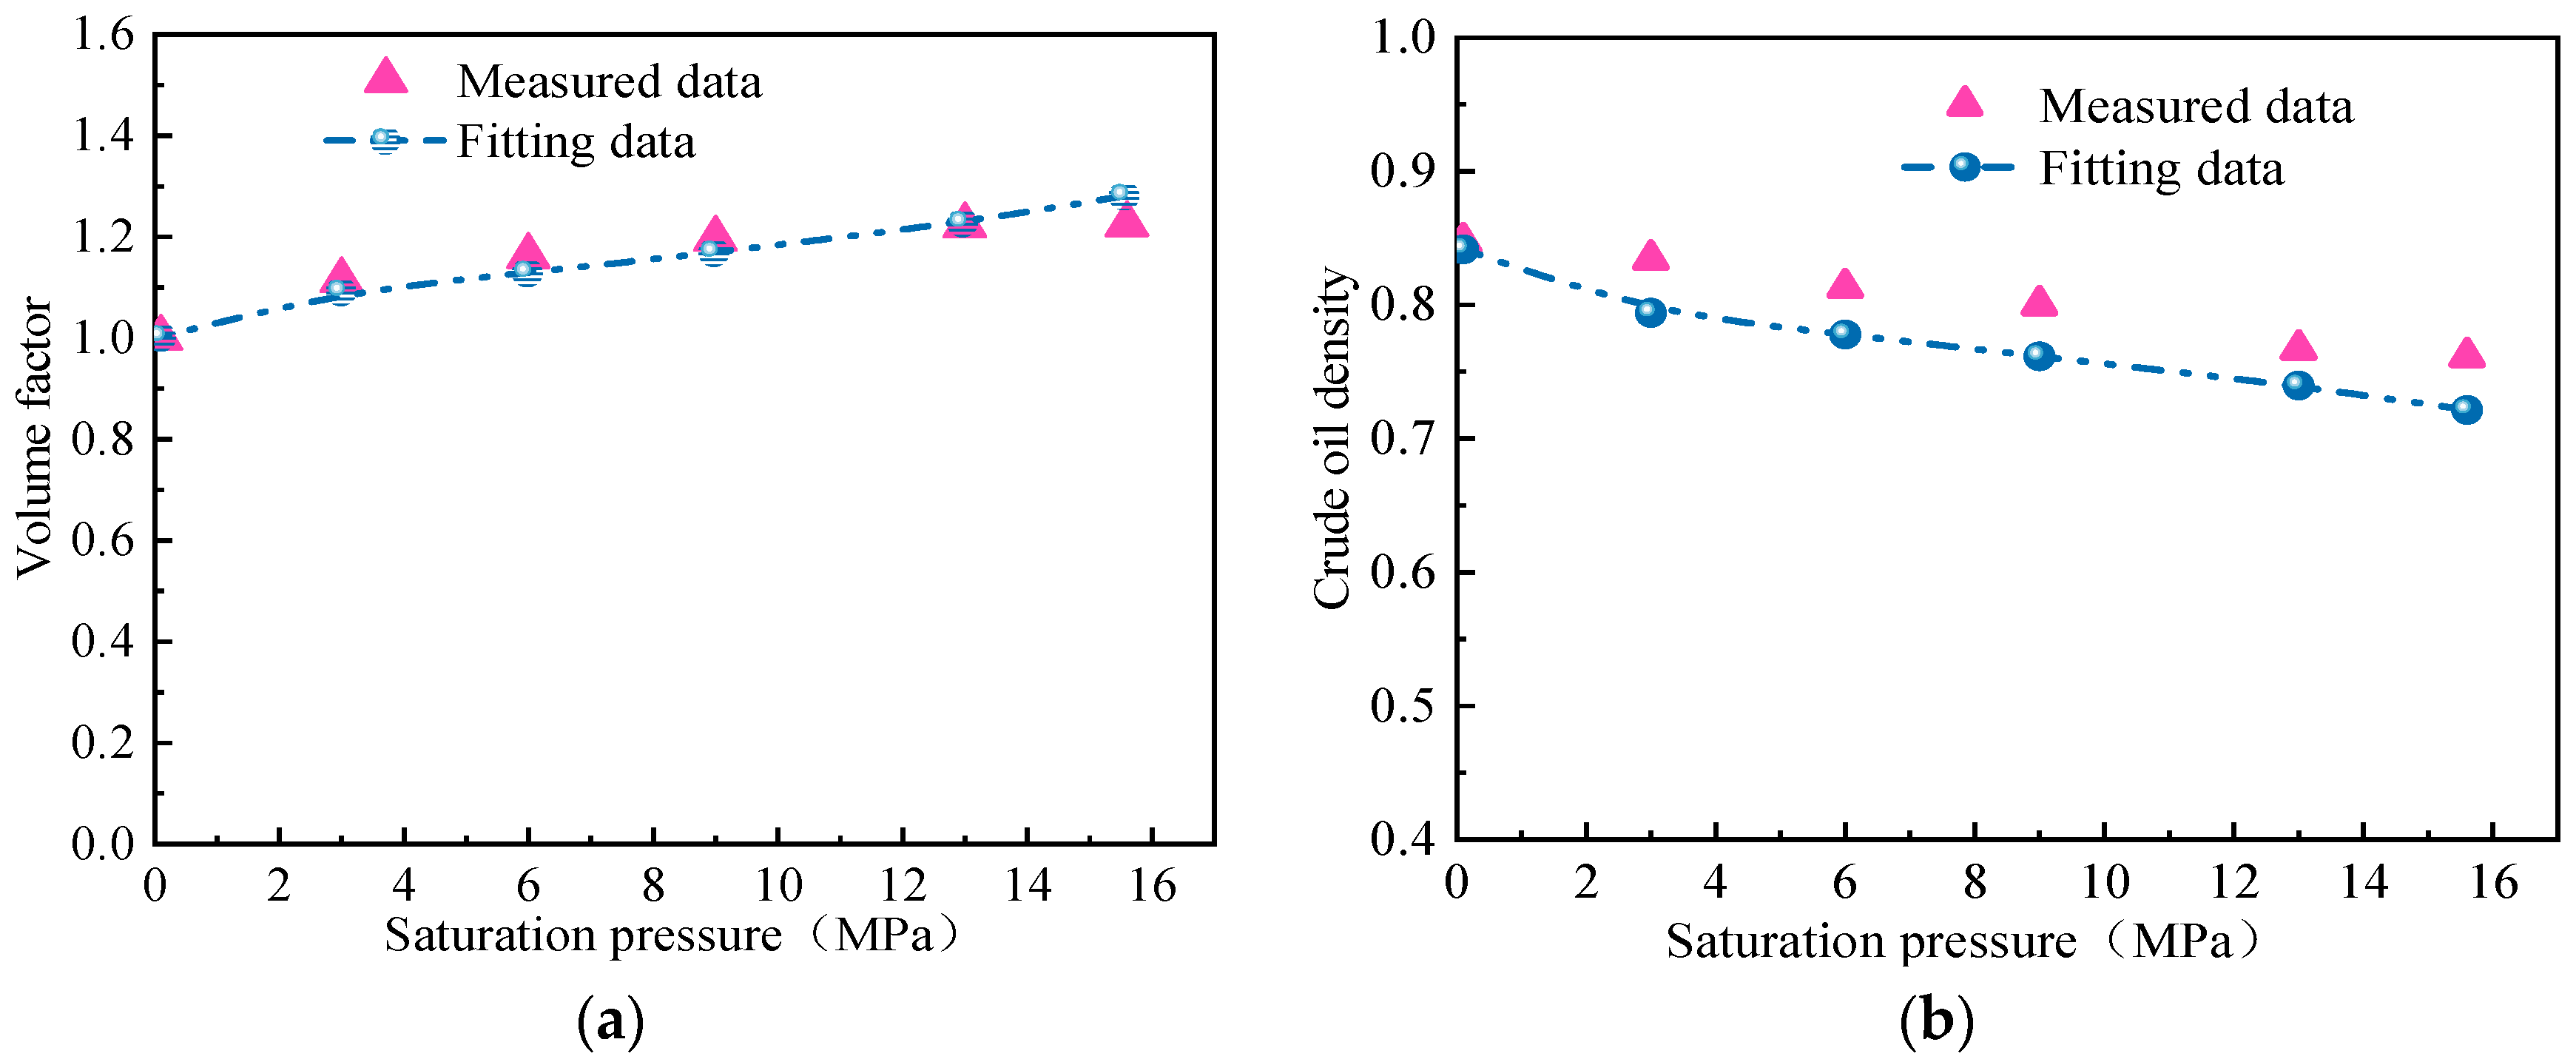
Based on chromatographic measurements of degassed oils and associated gasses in the study area, simulations were conducted using the Winprop module of the phase behavior simulation CMG 2020 version software under an original reservoir pressure of 30.24 MPa, a reservoir temperature of 88 °C, and a gas–oil ratio of 91.5 m3/m3 to configure the live oil in the study area and reconstruct the underground fluid composition. The phase equilibrium calculations primarily utilized the PR state equation, obtaining the pseudo-component composition of the model (Table 1). The experimental data of multistage degassing and reservoir fluid property parameters were obtained from oilfield reservoir fluid testing information. The saturation pressure, viscosity, gas–oil ratio, and multi-stage degassing experiments of underground crude oil were fitted, and the results are shown below (Table 2 and Figure 1), and the equation of state parameters that can reflect the reservoir fluid was obtained (Table 3).

Table 1.
Pseudo-component composition of live oil in model.
Table 2.
Fitting results of fluid phase features.
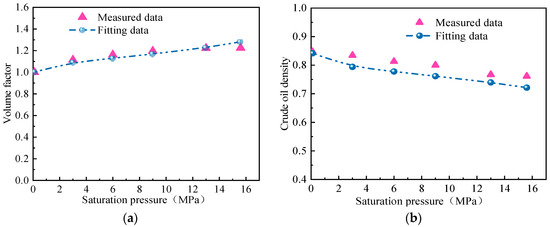
Figure 1.
Fitting results of the multi-stage degassing experiment of formation fluid. (a) Fitting results of volume factor. (b) Fitting results of crude oil density.
Table 3.
Characteristic parameters of the equation of state after fluid phase fitting in low-permeability thin oil reservoirs.
2.2. The Establishment of the Low-Permeability Reservoir Model
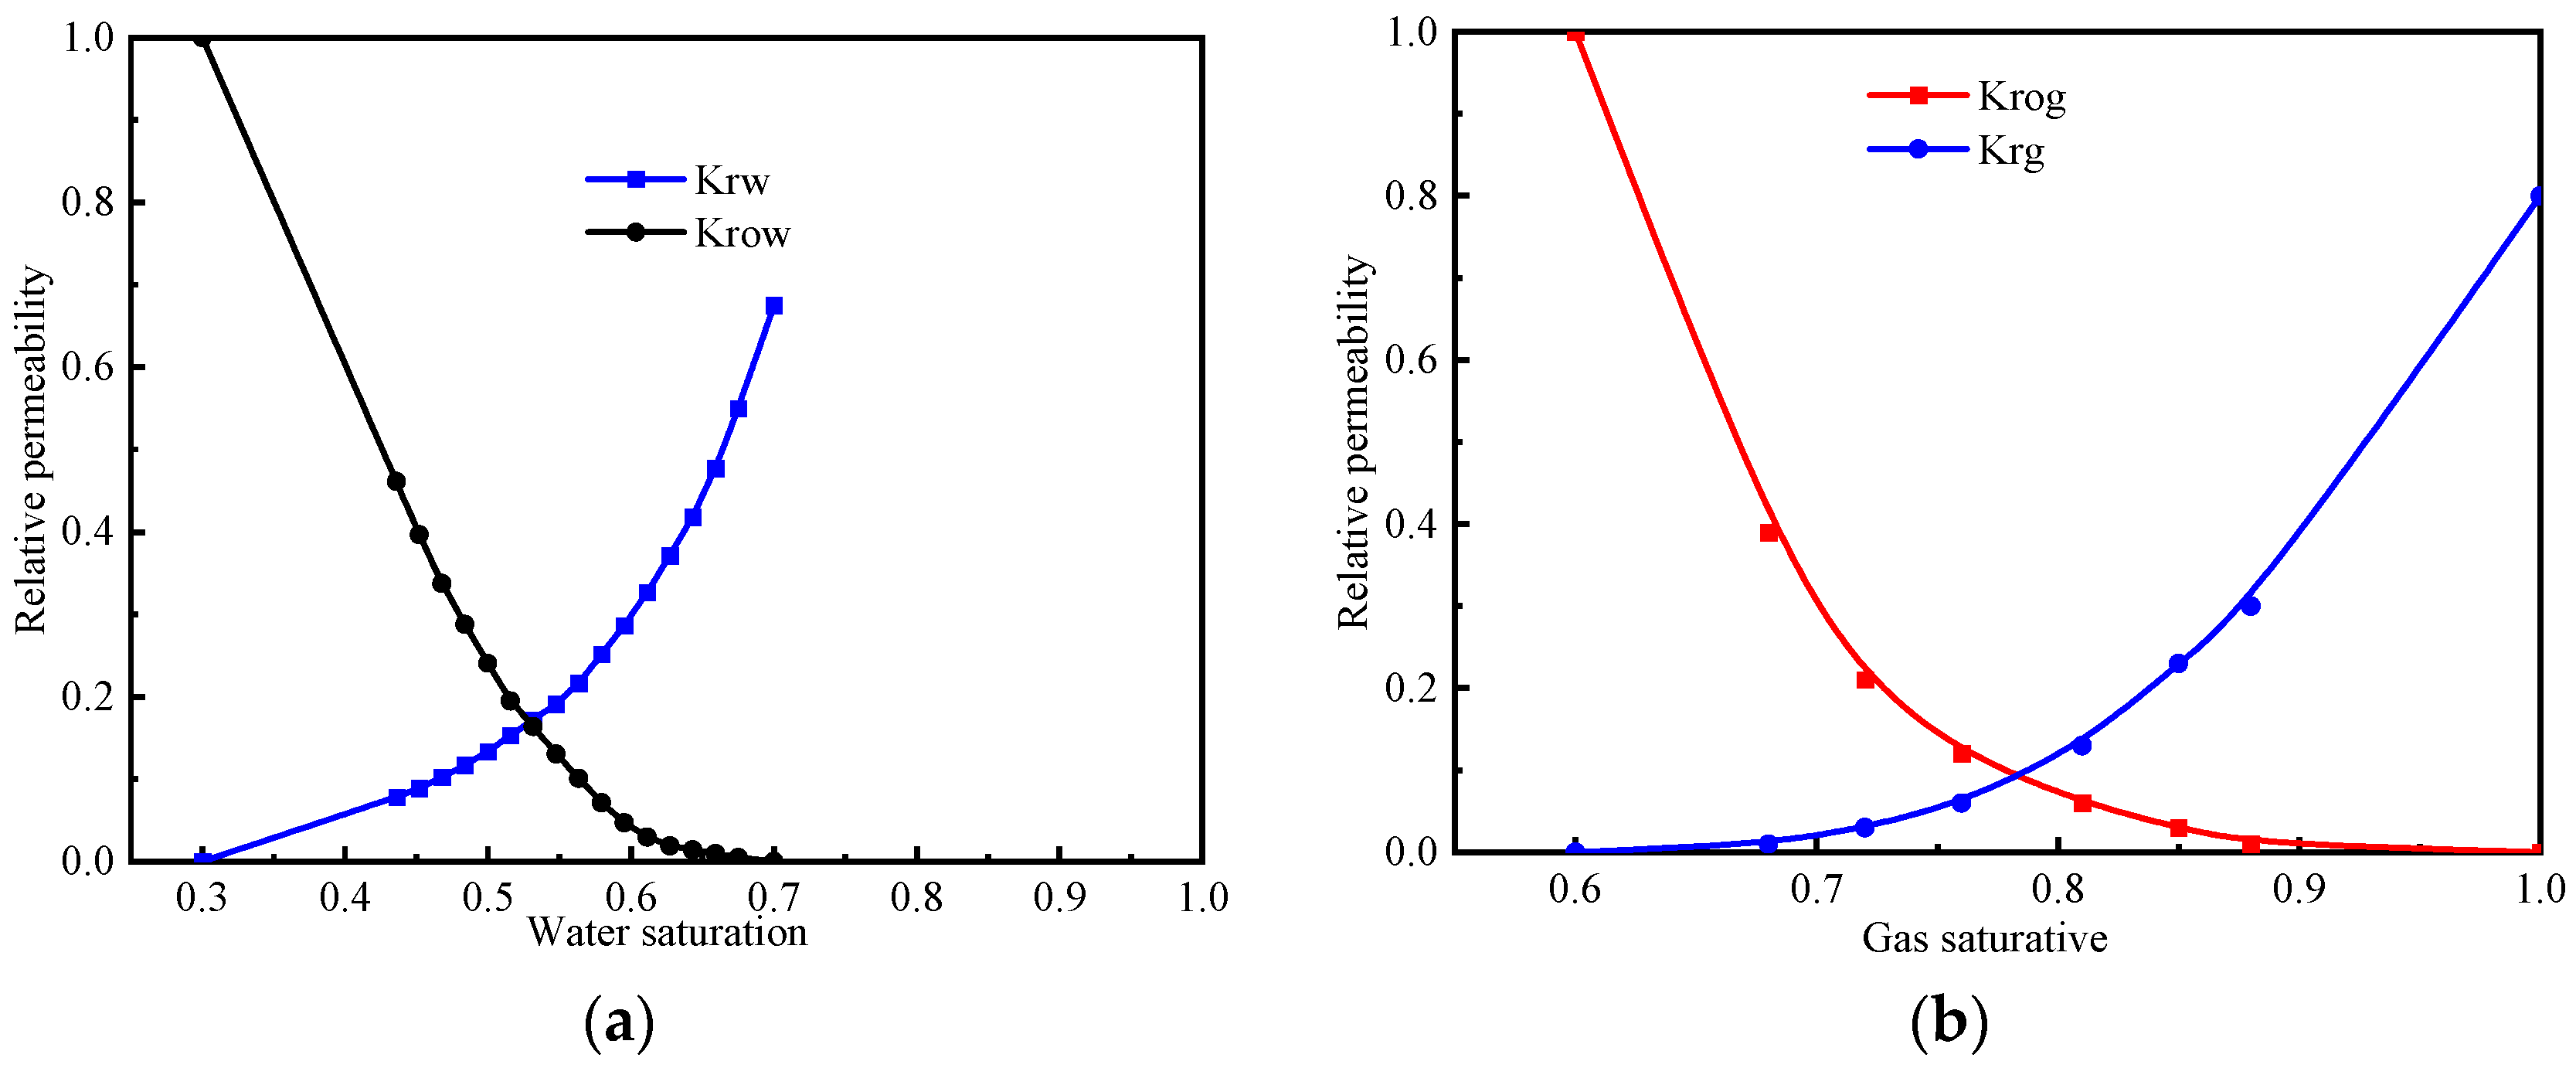
Based on the geological model of the study area, a representative well group (Figure 2) was selected, and production history matching was performed to enhance the reliability and accuracy of the model simulation results. Subsequently, numerical simulations were conducted to study CO2 flooding and burial. The total number of grids of the model is 31,050 grids. The initial average formation pressure is 30.24 MPa, with an average permeability of 21 mD; average porosity is 16.3%, initial oil saturation is 0.55, and the rock compressibility coefficient is 4.5 × 10⁻⁶ 1/kPa. A three-dimensional schematic diagram of the model is shown below (Figure 2a). Historical production data of the study area were fitted to obtain the current distribution of the remaining oil (Figure 2b) and the relative permeability curves of the oil–water and gas–liquid phases (Figure 3).
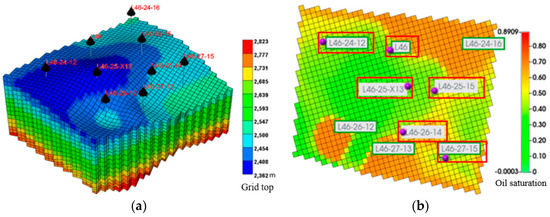
Figure 2.
The established well group model and the current remaining oil distribution after historical fitting. (a) A typical well group model for low-permeability reservoirs in the study area. (b) Distribution of remaining oil after historical fitting.
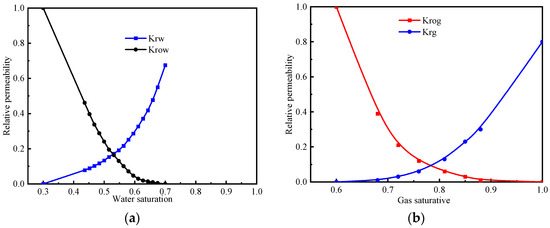
Figure 3.
Relative permeability curves after historical fitting. (a) Oil–water relative permeability curve. (b) Gas–liquid relative permeability curve.
2.3. The Solution of Effective Buried Storage Coefficient
Numerical simulation is the most effective method for calculating oil recovery and effective storage coefficient [34]. CO2 is influenced by factors such as differences in fluid viscosity and density, formation heterogeneity, water saturation, and strong water bodies. Therefore, it is more reliable to determine key parameters using “numerical simulation technology + experimental measurements” for calculating the correlation coefficient, compared to the empirical method. The solubility of CO2 in the crude oil and water from the study area was determined through solubility measurement experiments (Figure 4). This approach calculates the actual CO2 storage considering various factors, followed by computation of the effective storage coefficient (Equation (1)) [35].
where Ce is the effective storage coefficient of the comprehensive influence of various factors, Me is the effective burial amount of CO2 in the reservoir, 106 t; Mt is the theoretical buried amount of CO2 in the reservoir, 106 t.
where Mt is the theoretical buried amount of CO2 in the reservoir, 106 t; ρr is the density of CO2 in the reservoir, kg/m3; A is the reservoir area, m2; h is the reservoir thickness, m; Ø is the porosity of the reservoir; Swi is the reservoir bound water saturation; Viw is the amount of water injected into the reservoir, m3; Vpw is the water produced from the reservoir, m3; Cws is the CO2 solubility coefficient in water, m3/m3; Cos is the CO2 solubility coefficient in oil, m3/m3; ERb is the oil recovery factor before CO2 breakthrough; ERh is the oil recovery factor when a certain volume of CO2 is injected.
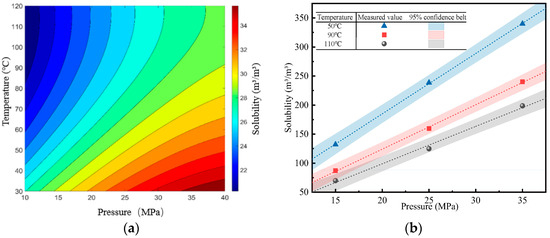
Figure 4.
The results of CO2 solubility determination in oil and water in the study area. (a) Solubility determination results in water. (b) Solubility determination results in oil.
The actual burial amount of CO2 is obtained by numerical simulations to calculate the difference between the actual CO2 injection and the CO2 output, and the actual model considers the diffusion coefficient of CO2 in oil and water, and the diffusion coefficient is measured by the pressure drop method experimentally [36]. The measurement method involves connecting a CO2-filled container of constant volume to a core holder saturated with crude oil. At the beginning of the experiment, the valve is opened to allow communication between the container and the core holder, which proceeds at constant temperature. As CO2 continues to diffuse into the core, the system pressure gradually decreases until it reaches equilibrium. Pressure changes during the experiment are recorded, and Fick’s second law is applied to calculate the gas diffusion coefficient.
where: Me is the effective burial amount of CO2 in the reservoir, 106 t; Minj is the amount of CO2 injected,106 t; Mprd is the amount of CO2 produced, 106 t.
3. Numerical Simulation Study of CO2 Flooding and Storage
Based on the historical fitting model, wells were arranged according to the current distribution of remaining oil. CO2 injection was prioritized for wells with low oil saturation in the vicinity, while high-pressure gas injection was employed to maximize gravity-driven oil displacement. In Figure 2b, the injection well is highlighted by a red box, with the remaining wells designated as production wells. The single-variable method was employed to simulate CO2 flooding and storage across varying permeability, temperature, and original reservoir pressure, based on the component model. Temperature and pressure tests are conducted via a gas injection well. The current gas injection capacity is calculated based on the principle that the bottomhole pressure should not exceed 90% of the rupture pressure, with a designed gas injection rate of 15,000 m3/d (at standard conditions). The production wells adopt constant-pressure production, with the pressure set to the reservoir pressure in each well’s grid cell after historical fitting. During the injection process, the well is shut down when the production gas–oil ratio reaches 2000 m3/m3. All wells are then switched to CO2 until the formation pressure equals the original formation pressure (i.e., the final storage pressure). The CO2 flooding and storage simulation is completed, yielding CO2 storage results under different conditions, and calculating the contribution rate of various storage mechanisms for CO2 storage. Several methods are employed to compute storage volumes for various sequestration mechanisms: the total storage volume is derived from the difference between the CO2 injected at the injection well and the CO2 produced at the production well; the dissolved storage volume in oil and water is determined using CMG 2020 version software, which calculates the CO2 mole fraction in the oil–water phase using an equation of state. This calculation is then combined with the post-sequestration volumes of oil and water in the reservoir to ascertain the dissolved storage volume. The residual storage volume is computed by subtracting the dissolved storage volume in oil and water from the total storage volume. Temperature and pressure tests are conducted via a gas injection well. The current gas injection capacity is determined based on ensuring that the bottom pressure of the injection rate does not exceed 90% of the rupture pressure. The designed injection rate is 15,000 m3/d under standard conditions. During the injection process, wells are closed when the gas-to-oil ratio reaches 2000 m3/m3. Subsequently, all wells are switched to CO2 injection until the formation pressure is restored to the original level (i.e., the final storage pressure). This process completes the simulation of CO2-enhanced oil recovery and storage, producing calculated results for CO2 storage under varying conditions. Consequently, the contribution rates of different storage mechanisms for CO2 storage are calculated.
3.1. Effect of Permeability on CO2 Flooding and Storage
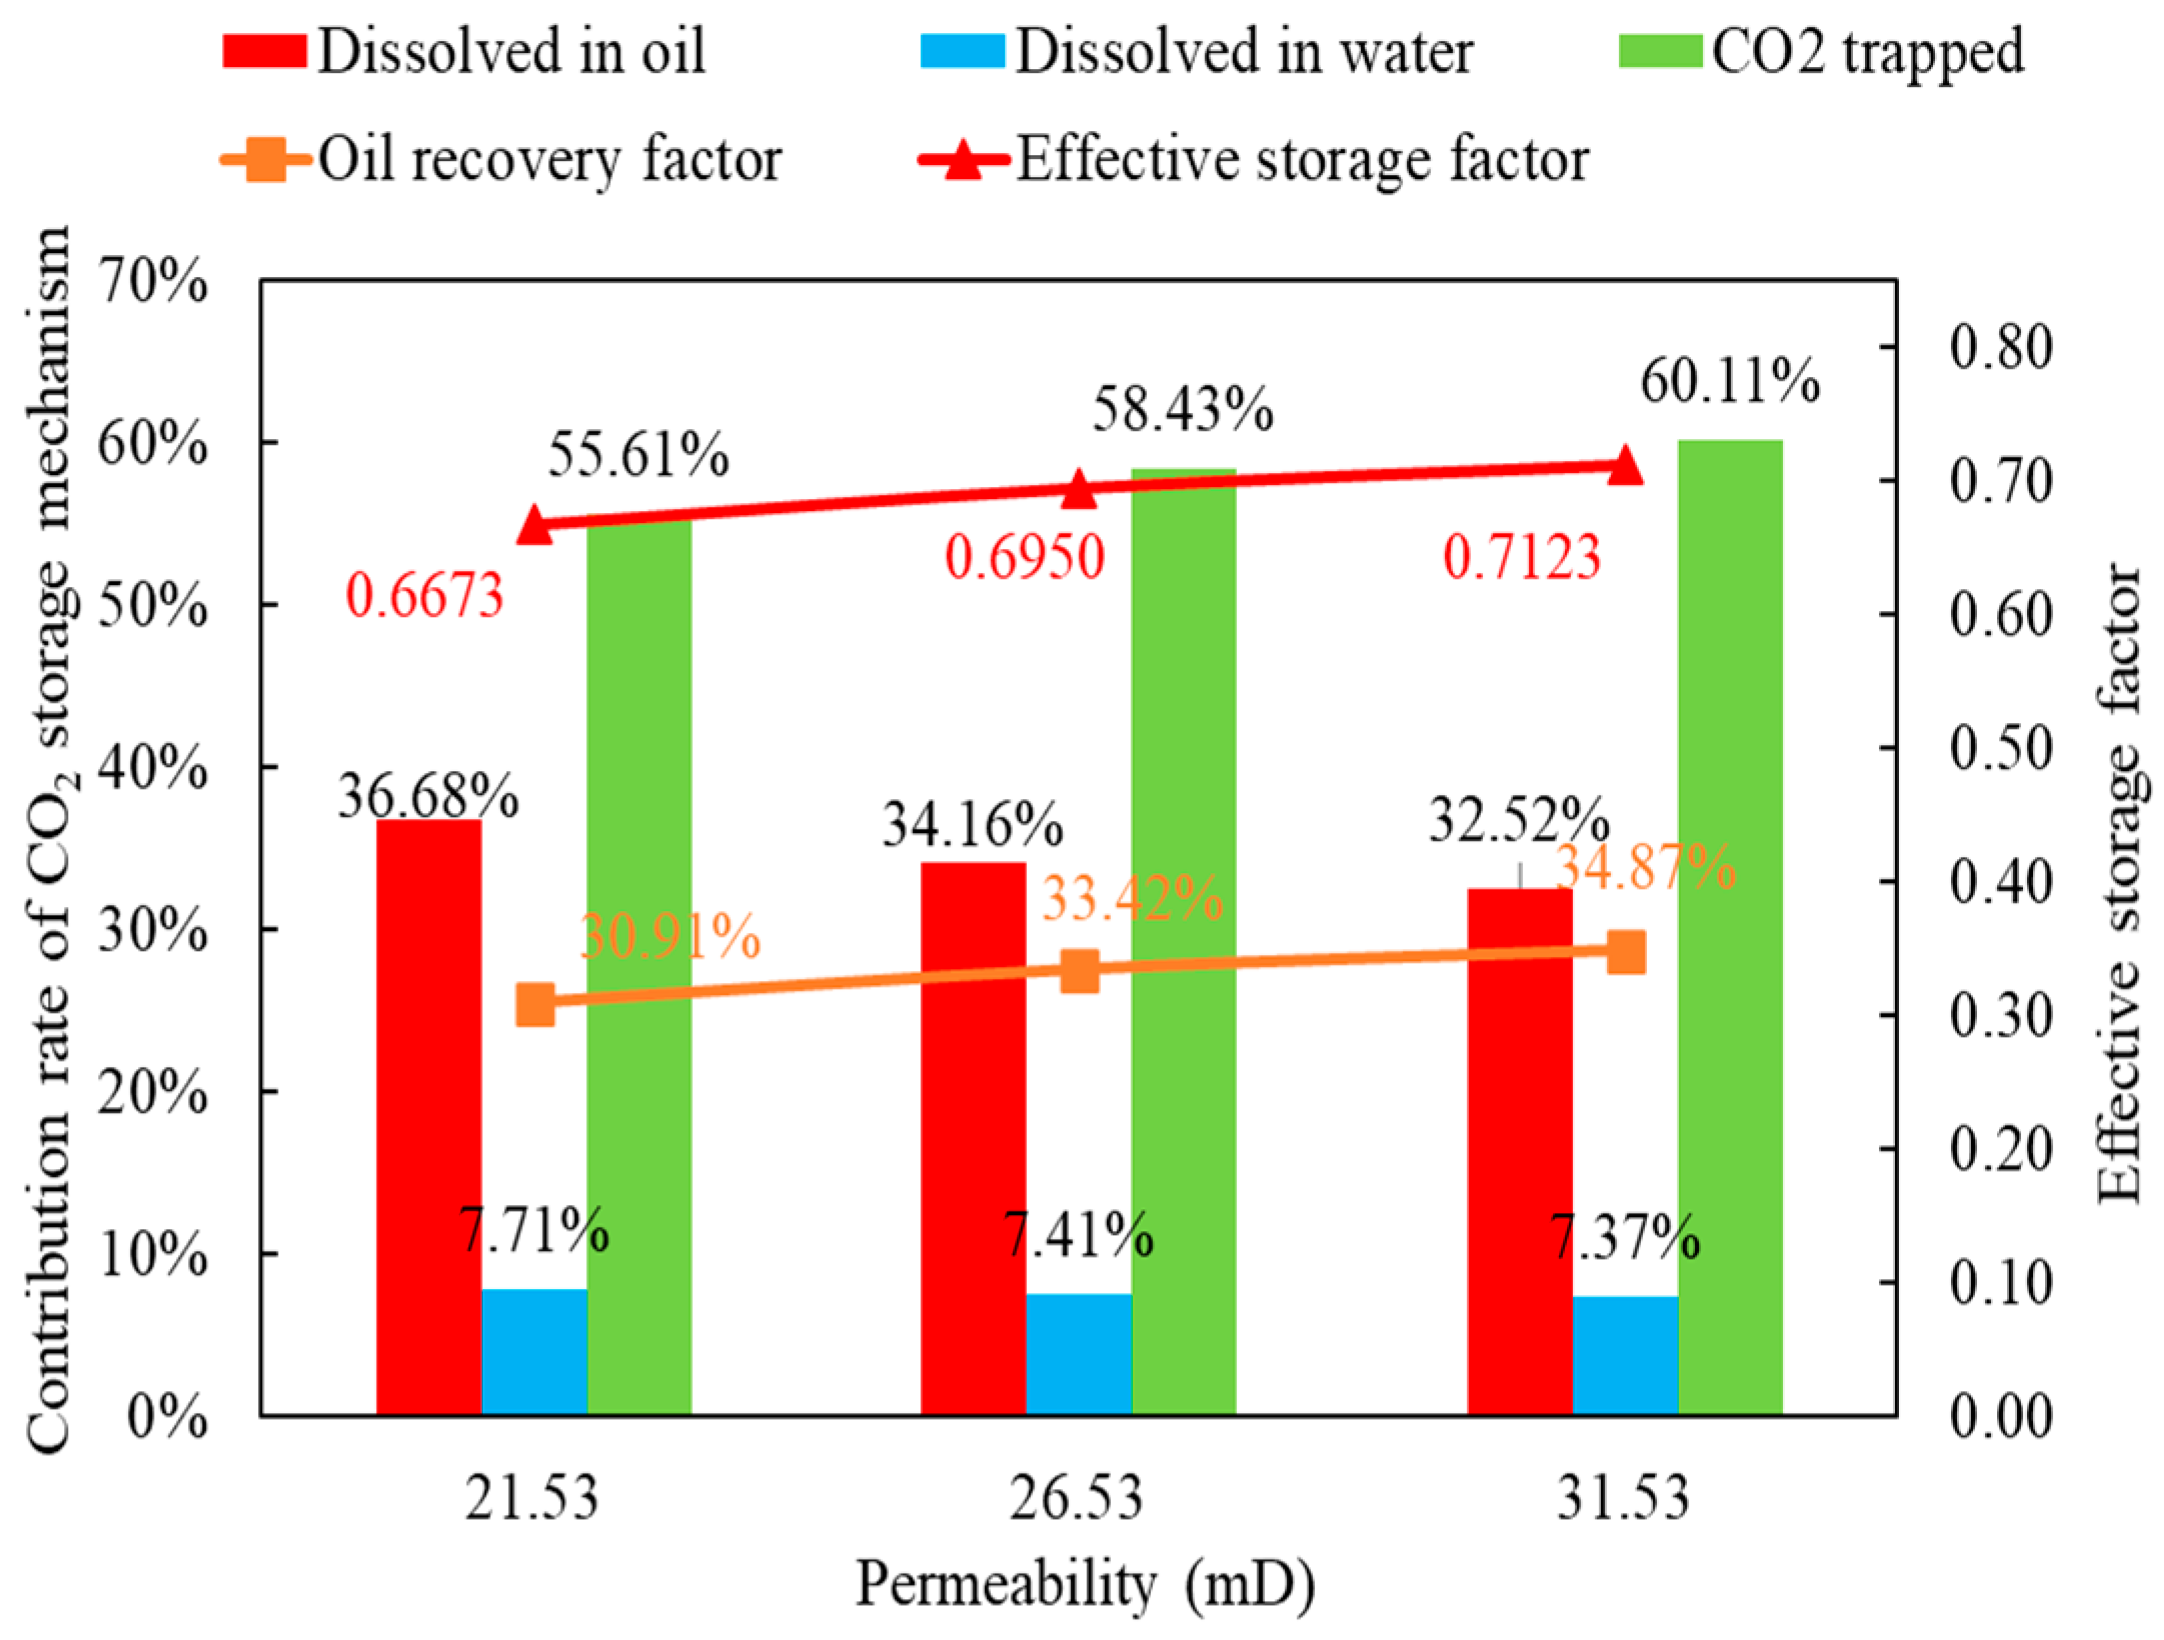
Keeping all other model parameters constant, the permeability was set to 21.53 mD, 26.53 mD, and 31.53 mD, respectively, to investigate the effects of varying permeability on CO2 flooding and storage. In low permeability oil reservoirs, with the increase in permeability, the degree of crude oil recovery improves. Figure 5 illustrates the molar fraction of CO2 in the oil phase under varying permeability conditions. As permeability increases, the sweep range of CO2 in the crude oil widens, facilitating contact with the crude oil and enhancing processes such as extraction, expansion, and dissolution. This effect is more beneficial for crude oil recovery in low-permeability reservoirs. Figure 6 illustrates that an increase in permeability enhances the contribution rate of structural and adsorptive storage, which represents approximately 55% to 60% of the total storage. As permeability increases, oil and water can be extracted more easily, thereby reducing the proportion of storage in the oil-water mixture. The effective storage coefficient also increases from 0.67 to 0.71, indicating that higher permeability is advantageous for CO2 storage. This is because higher permeability facilitates greater oil extraction and provides more space in low-permeability zones for CO2 storage. Increasing permeability significantly enhances the oil recovery and storage efficiency of CO2 in low-permeability reservoirs.

Figure 5.
Mole fraction of CO2 in the oil phase under different permeability conditions.
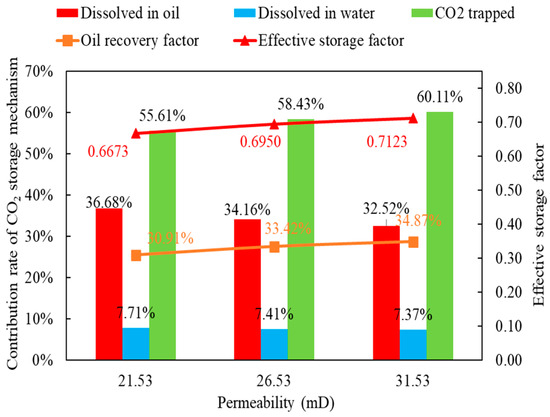
Figure 6.
Effect of permeability on CO2 storage in oil reservoirs with low permeability.
3.2. Effect of Reservoir Temperature on CO2 Flooding and Storage
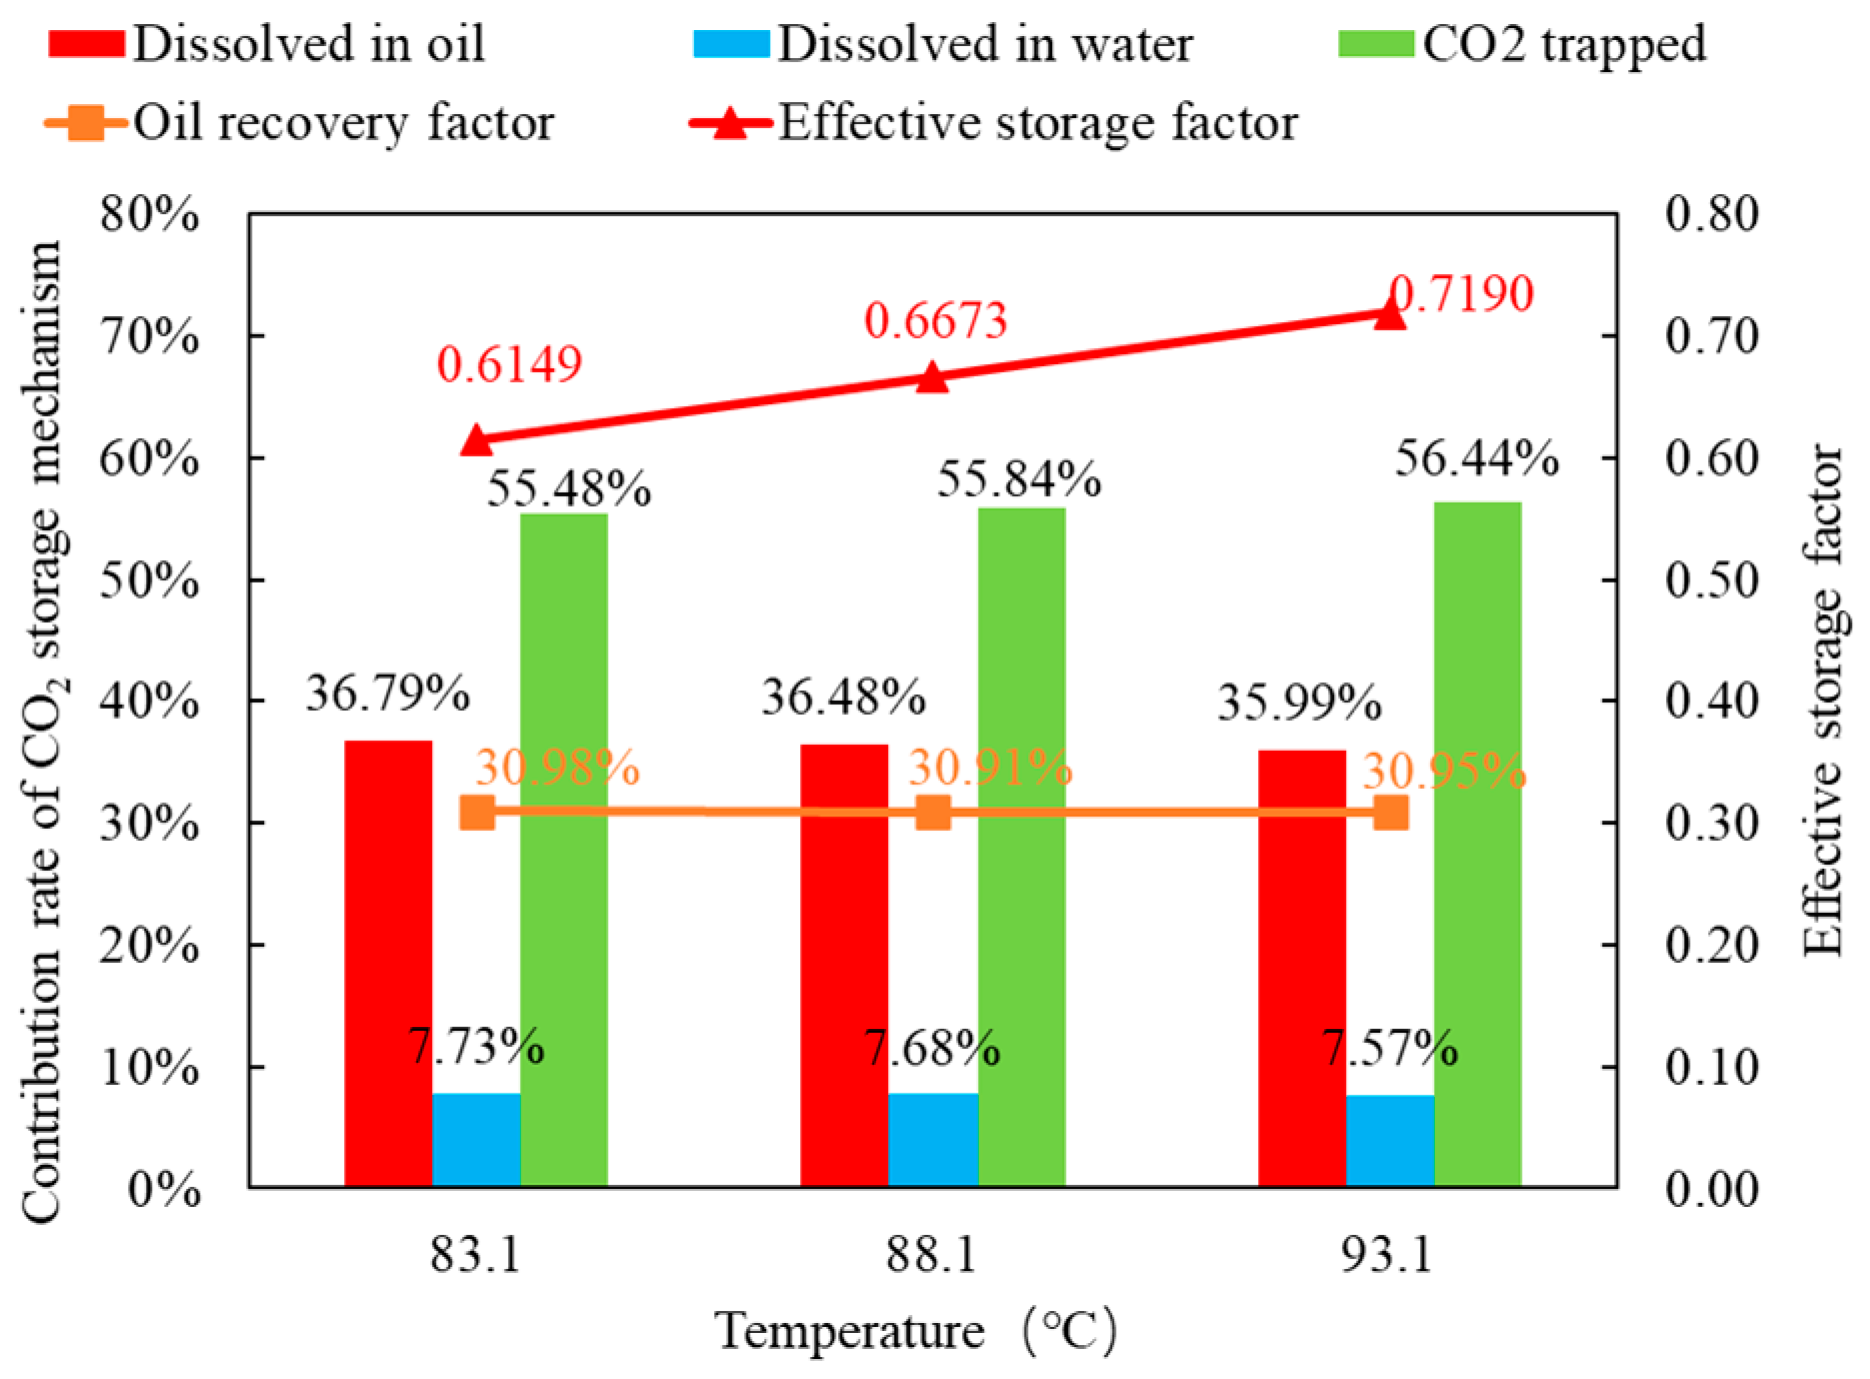
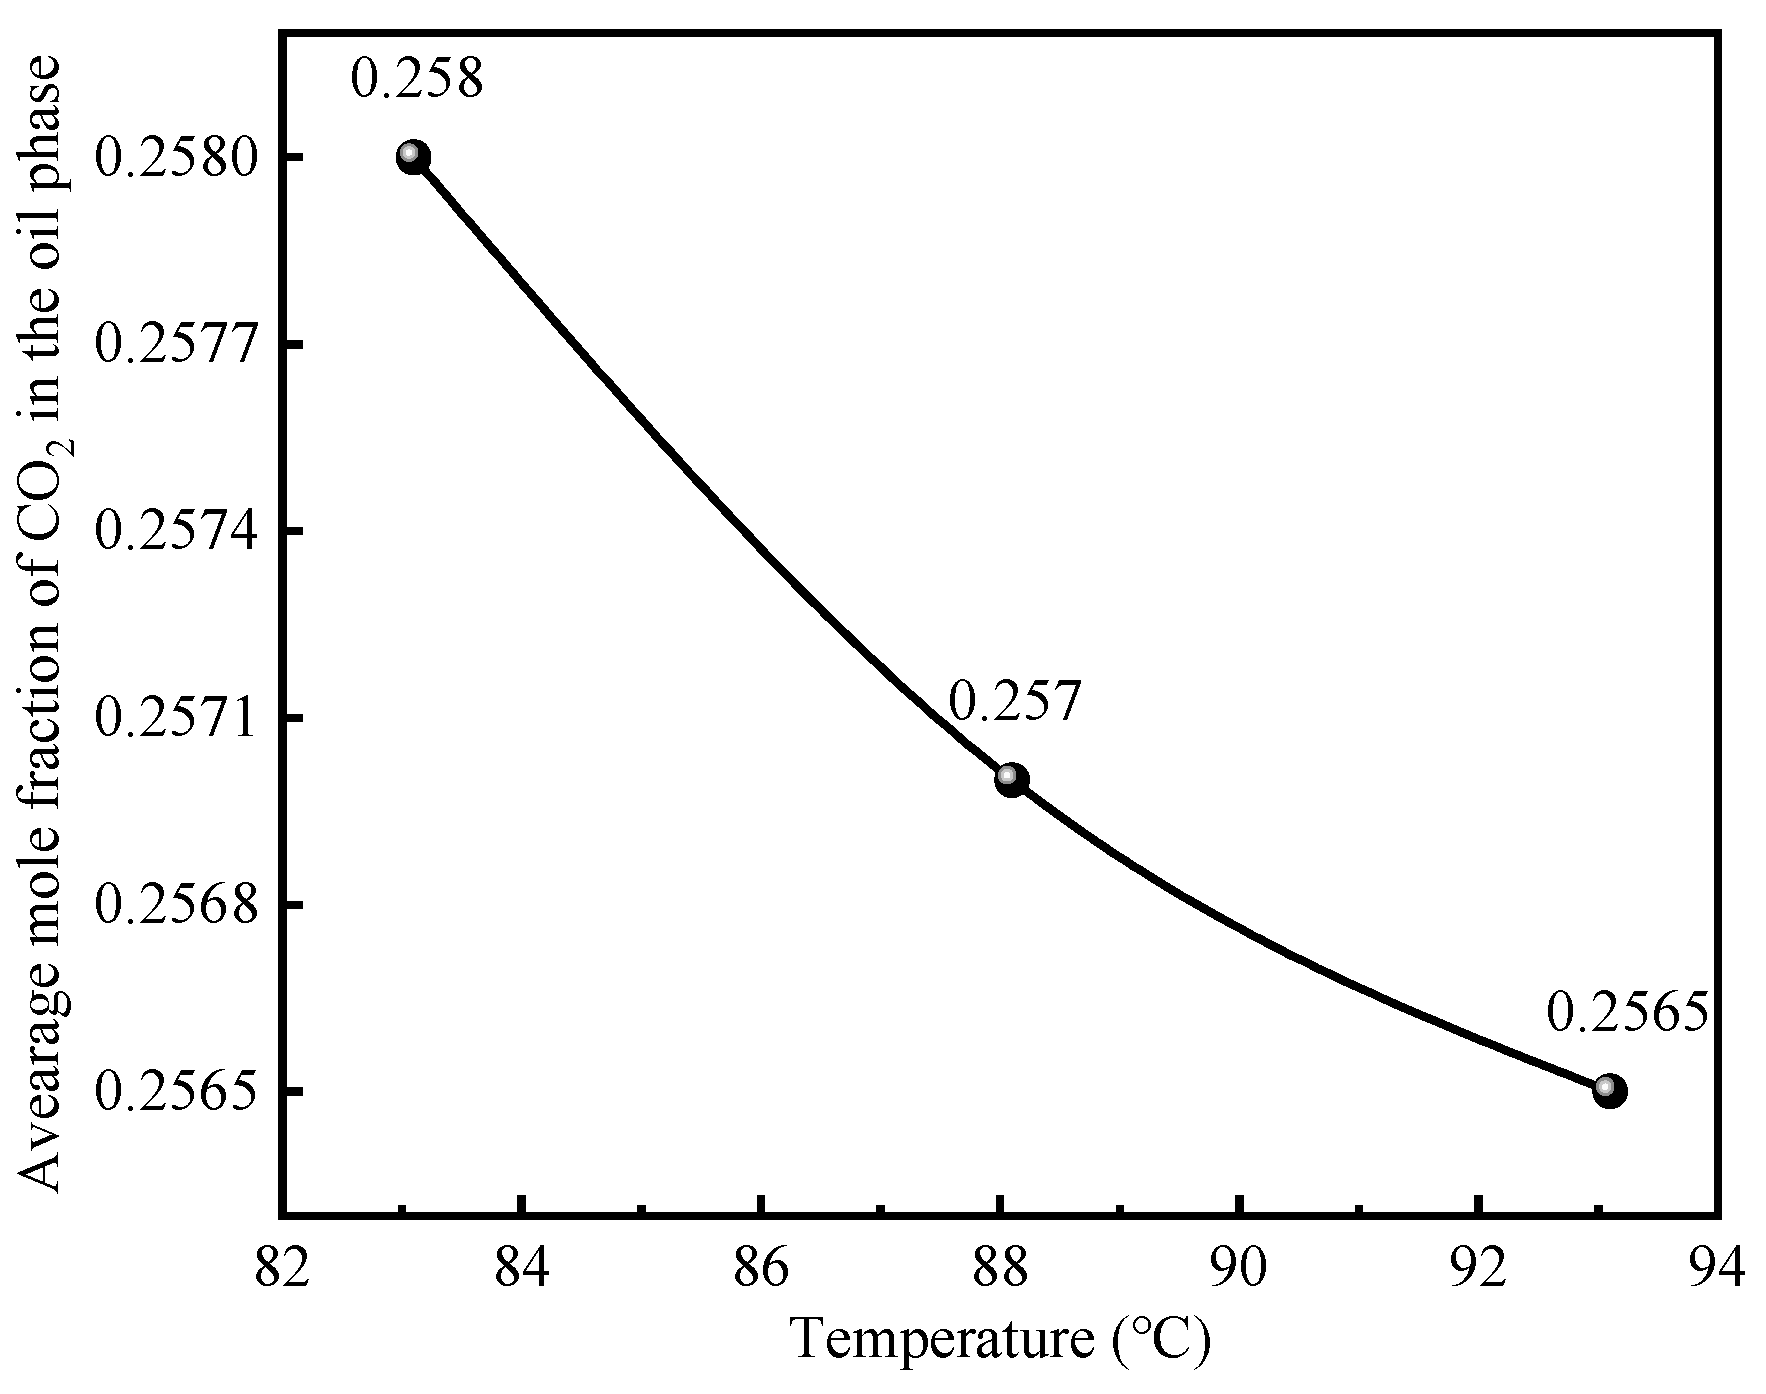
With all other model parameters held constant, reservoir temperatures were set to 83.1 °C, 88.1 °C, and 93.1 °C to investigate the effects of varying temperatures on CO2 flooding and storage. The simulation results indicate that under temperature conditions of 83.1 °C, 88.1 °C, and 93.1 °C, the recovery rates during the depletion stage were 10.9%, 10.88%, and 10.89%, respectively. The production period during the depletion stage was 19 years. Figure 7 shows that temperature has minimal impact on the recovery rate of low-permeability oil reservoirs and the proportion of each storage mechanism. The effective storage coefficient increases with temperature because the actual amount of CO2 stored remains relatively stable while the CO2 density decreases with rising temperature, leading to a decrease in theoretical storage capacity and thus increasing the effective storage coefficient. The proportion of dissolved storage in oil and water decreases slightly because CO2 becomes less soluble in oil and water at higher temperatures, reducing its dissolution. Figure 8 illustrates that as temperature increases, the average molar fraction of CO2 in the oil phase decreases, but this decrease occurs at a slower rate.
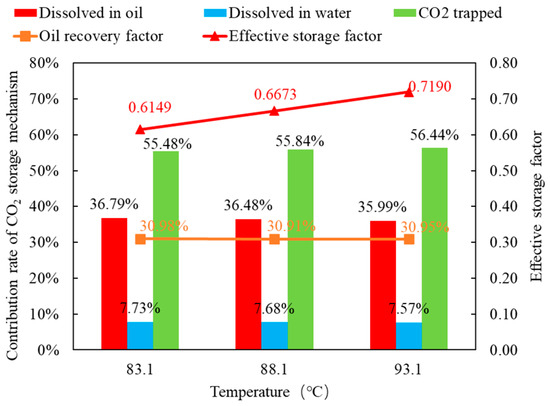
Figure 7.
Effect of temperature on CO2 storage in thin oil reservoirs with low permeability.
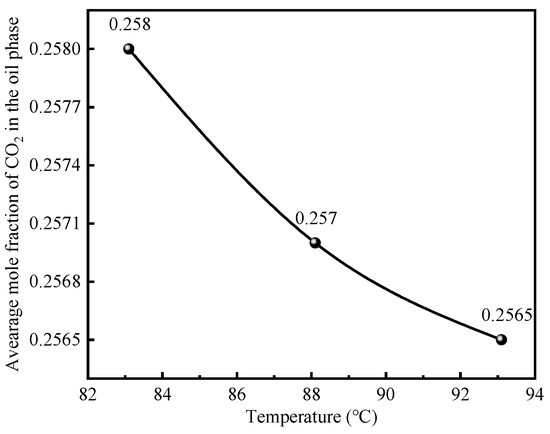
Figure 8.
Effect of temperature on the average molar fraction of CO2 in the oil phase.
3.3. Effect of Original Reservoir Pressure on CO2 Flooding and Storage
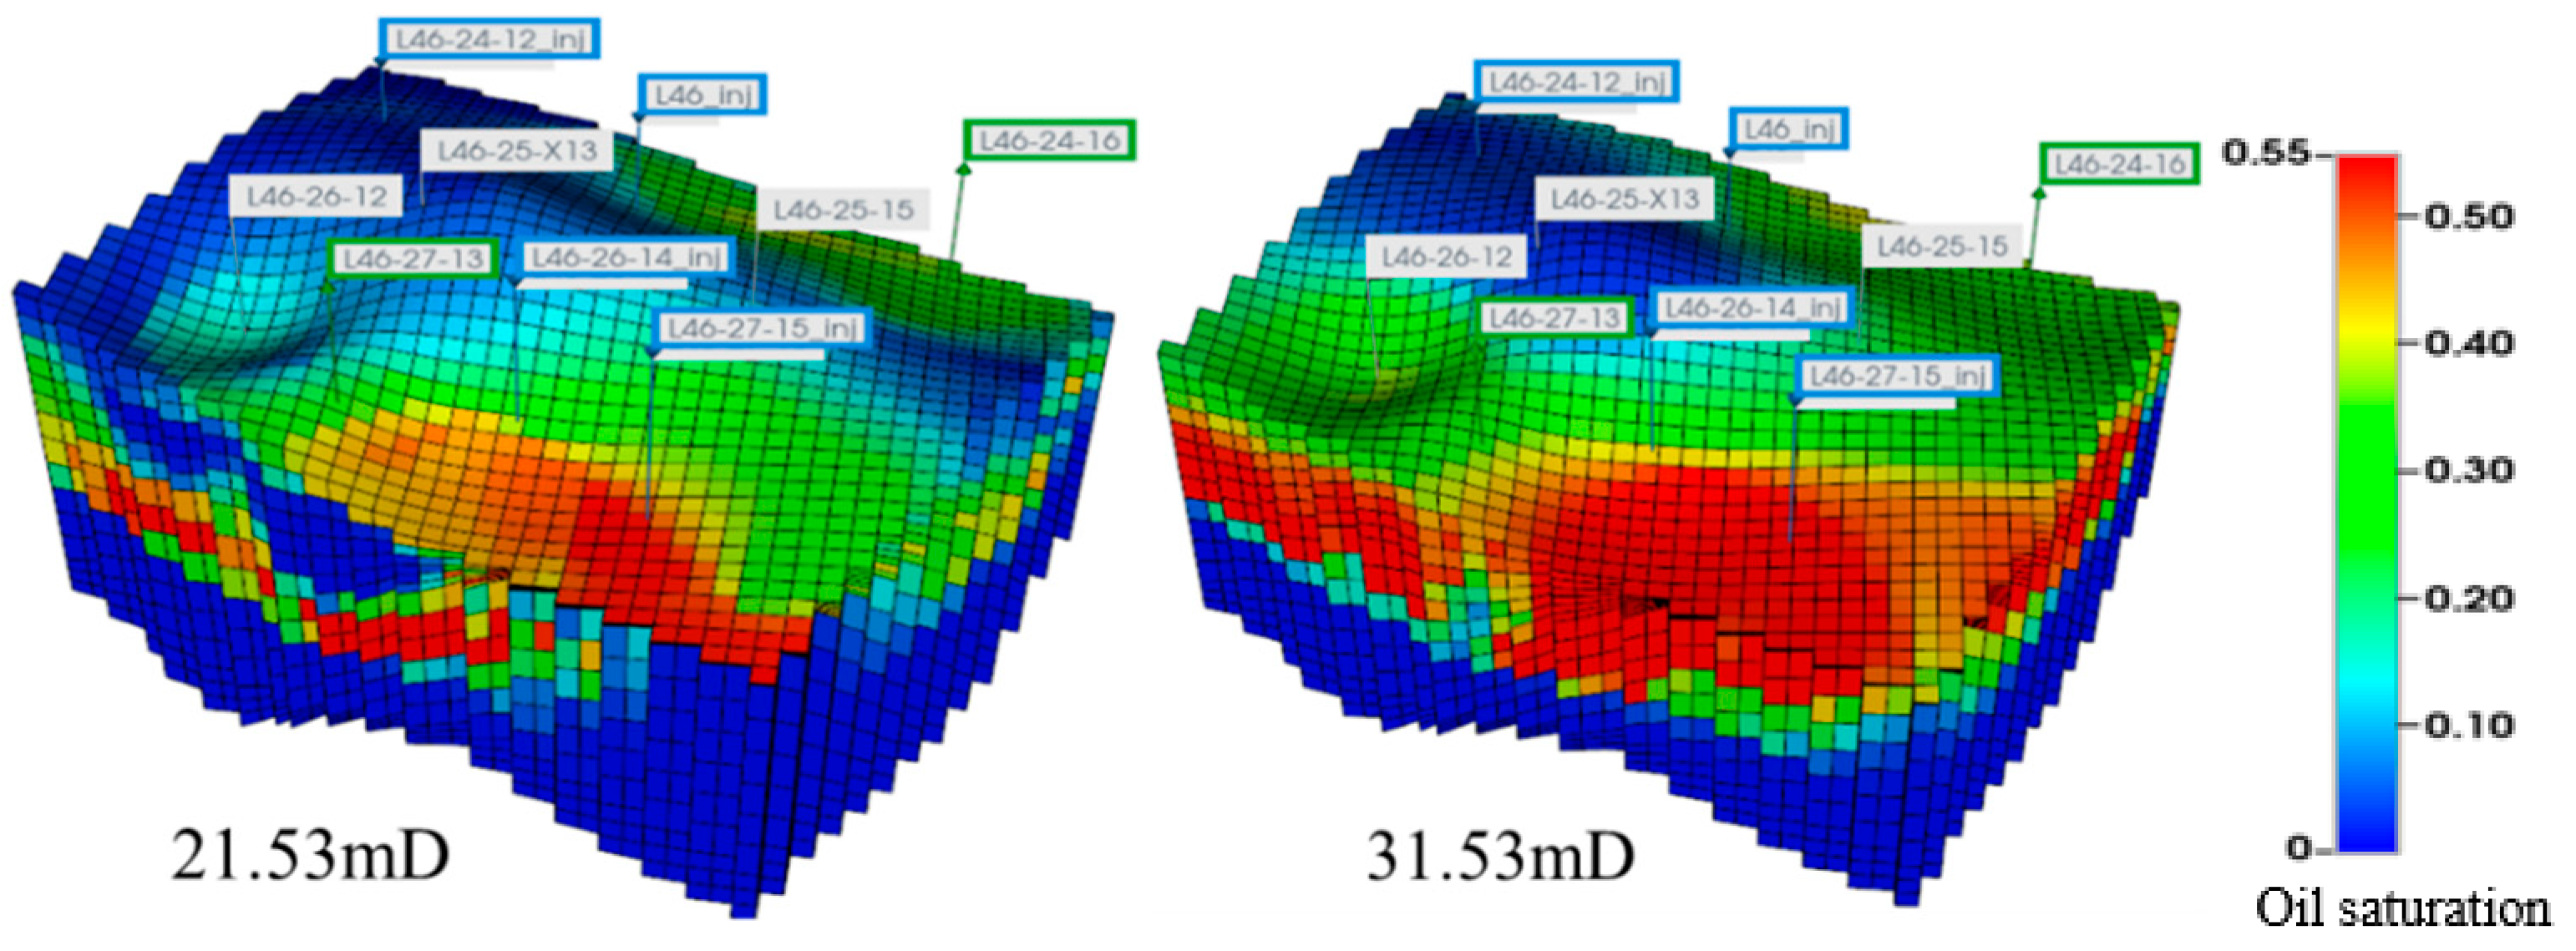
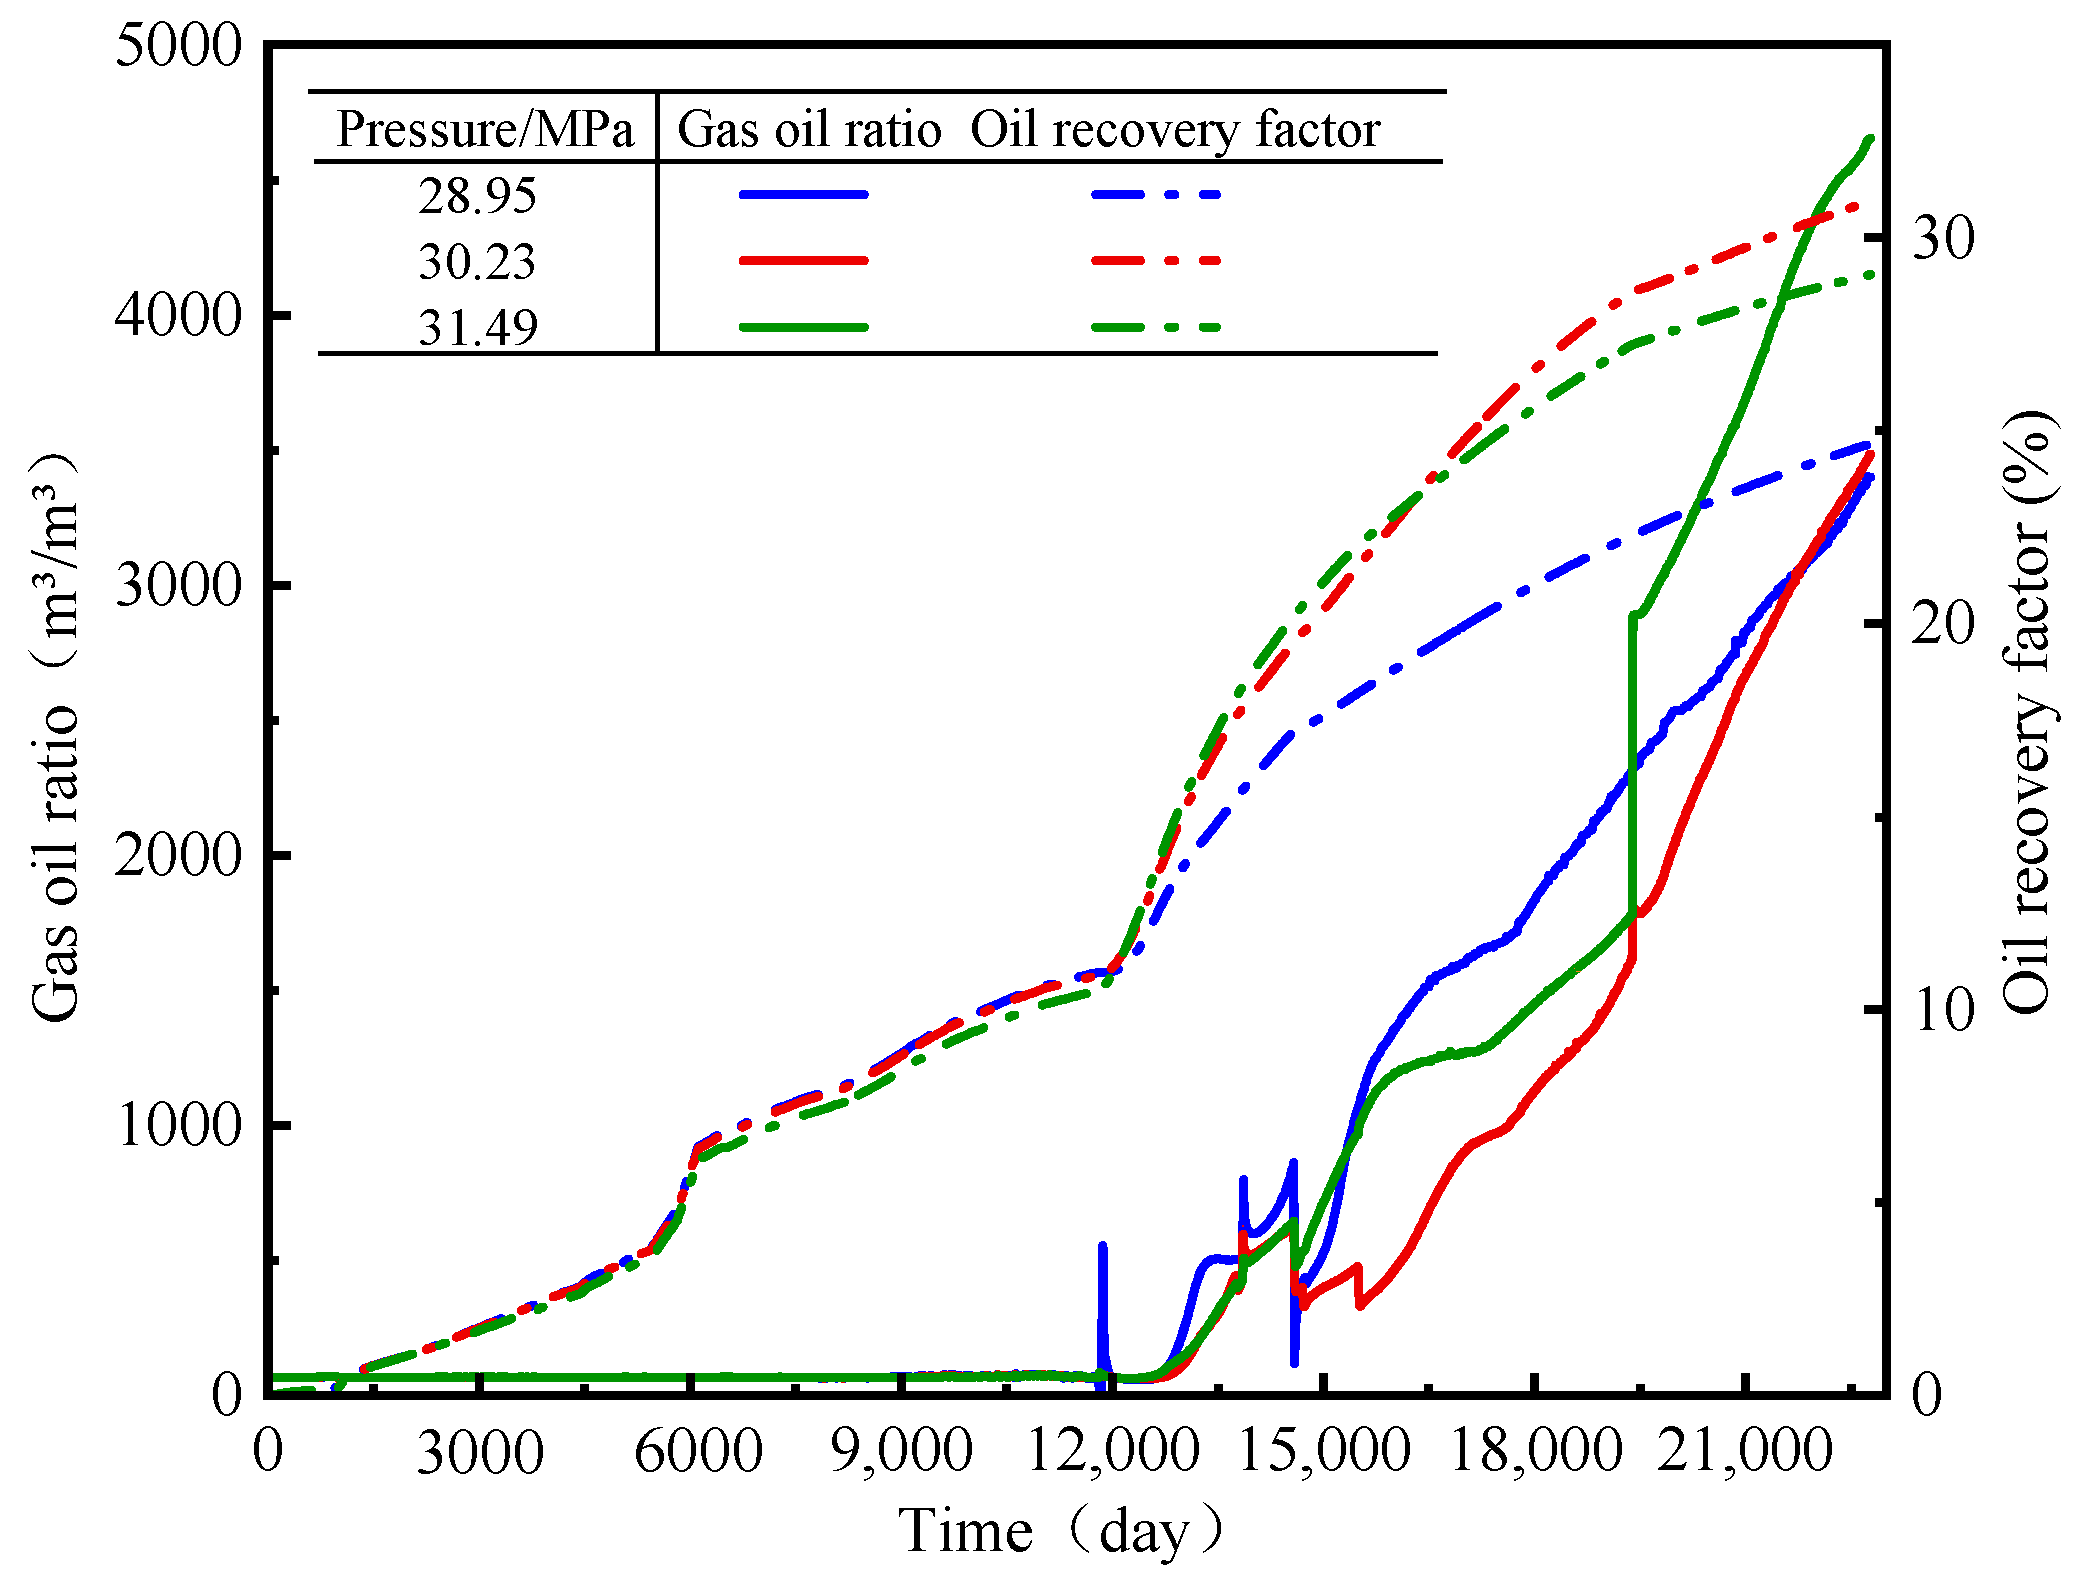
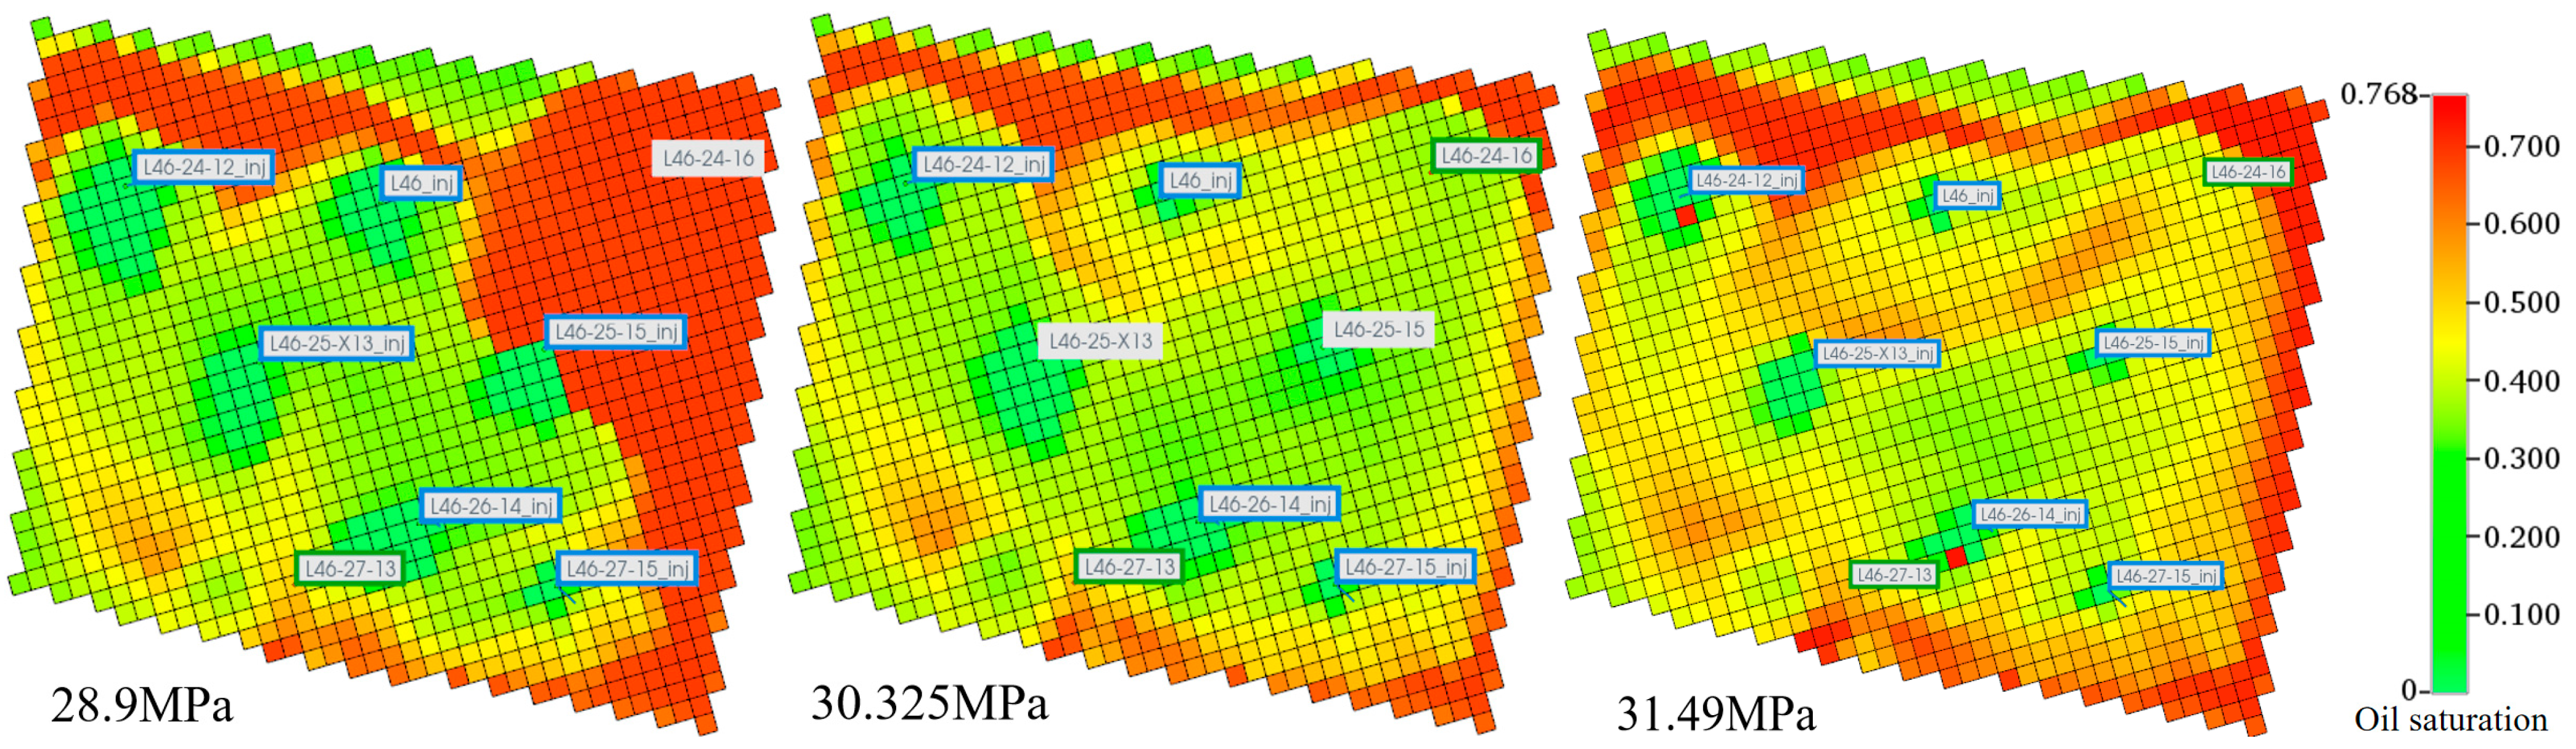
Keeping other model parameters unchanged, the original reservoir pressures were adjusted to 28.95 MPa, 30.24 MPa, and 31.49 MPa to investigate their impacts on CO2 flooding and storage. Simulation results indicate that as reservoir pressure increases, crude oil recovery initially increases significantly before slightly decreasing, as depicted in Figure 9. At an original formation pressure of 31.49 MPa, recovery decreases due to excessive initial formation pressure, resulting in early recovery of most crude oil from pore spaces compared to lower pressure reservoirs. Additionally, gas channeling during later stages of gas injection exacerbates this trend, reducing overall recovery efficiency. Increasing formation pressure decreases the proportion of structurally stored CO2 while increasing the dissolved CO2 fraction in oil and water. This relationship arises because burial upper limits are governed by original formation pressures, with higher pressures enhancing CO2 solubility in oil and water post-burial. Consequently, dissolved CO2 fractions rise accordingly. Figure 10 illustrates the distribution of residual oil following CO2 flooding at various formation pressures. It is evident that as the pressure increases, the residual oil first decreases significantly before slightly increasing. Therefore, in CO2 storage processes, a higher storage pressure is not always beneficial. An optimal storage pressure can help prevent gas channeling, thereby improving both oil recovery and storage efficiency.

Figure 9.
The curves of recovery factor and gas–oil ratio under different initial reservoir pressure conditions.
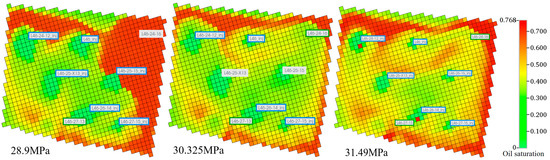
Figure 10.
Distribution of residual oil after CO2 flooding under different original formation pressures.
4. Prediction Model for the Effective Storage Coefficient Using Artificial Intelligence
4.1. Prediction Model for Effective Burial Coefficient
Building on the results of numerical simulations and utilizing the regression learner in MATLAB 2022 version software, we employed a supervised machine learning approach to develop regression models. The input variables included layer permeability, reservoir temperature, and initial formation pressure, with the effective storage coefficient as the target variable. We allocated 80% of the data to the training set and 20% to the test set for regression analysis. The regression algorithms comprised six main categories: support vector regression, Gaussian process regression (GPR), tree ensembles, neural networks, linear regression, and regression trees. The model with the lowest regression error was chosen as the surrogate model. To eliminate the influence of dimensionality, index values were standardized using the z-score method, which is based on the mean and standard deviation of the raw data. The R-square coefficient, mean square error (MSE), root mean squared error (RMSE), and mean absolute error (MAE) were used as the basis for evaluating the performance of the machine learning models. The coefficient of determination, also know as R2, is a numerical measure that represents the relationship between a dependent variable and multiple independent variables. It reflects the reliability of the regression model in explaining variations in the dependent variable, similar to the multiple correlation coefficient.
The GPR using the quadratic rational kernel function and the exponential kernel exhibits the highest fitting accuracy for the block model of the low-permeability thin oil reservoir. The model training results are shown in Table 4. Models with a fitting accuracy greater than 0.8 include quadratic rational GPR, exponential GPR, and square exponential GPR, among others. The GPR demonstrates superior adaptability to the studied block.
Table 4.
Training results of a single model in a thin oil reservoir with low permeability.
4.2. Establishment and Application of Effective Storage Coefficient Plates
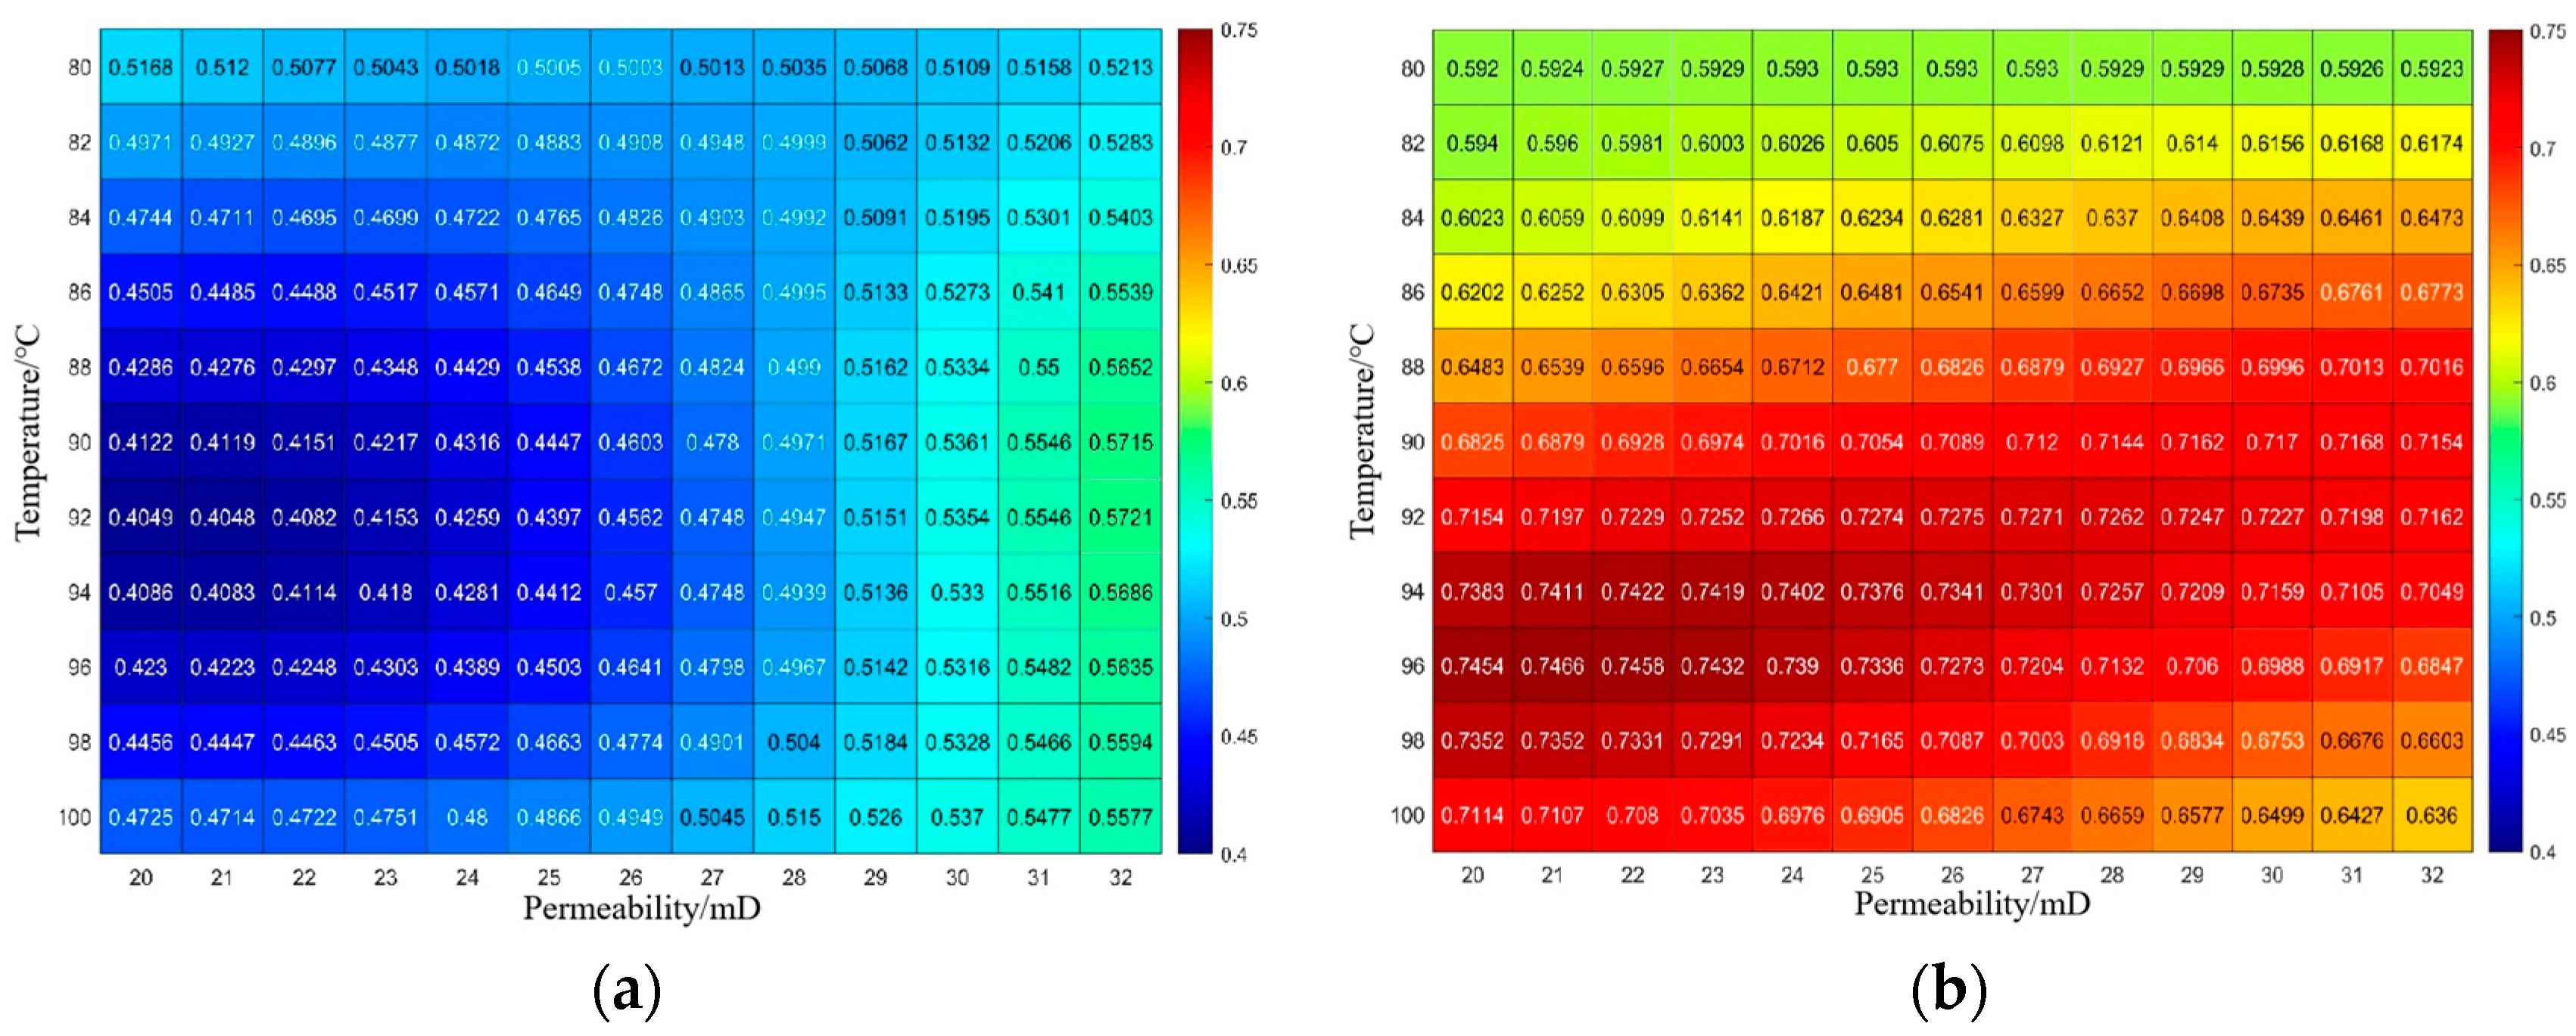
Using the constructed proxy model, predictions were made for the effective storage coefficient under different storage conditions (permeability, original reservoir pressure, reservoir temperature). A computational graph (Figure 11) illustrating the effective storage coefficient was established. Referring to the graph allows one to obtain the effective storage coefficient under various storage conditions and calculate the corresponding effective burial volume accordingly. Regions on the graph closer to red indicate larger effective burial coefficients, suggesting reservoir conditions more favorable for burial, facilitating the determination of favorable burial reservoir conditions. In the favorable burial area, the permeability ranges from 26 to 32 mD, and the temperature ranges from 86 °C to 98 °C. The permeability in this area increases significantly with pressure, leading to an expansion of the favorable burial zone into higher temperature and lower permeability regions. Under a pressure of 31 MPa, the effective storage coefficient increases to approximately 0.746.
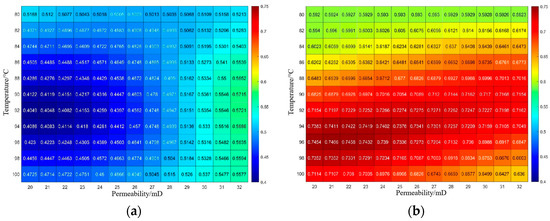
Figure 11.
Calculation graph of the effective storage coefficient of a low-permeability reservoir in the study area. (a) 28 MPa. (b) 31 MPa.
Using the parameters provided, the effective buried stock was calculated. The basic reservoir parameters are listed in Table 5. The values of recovery before CO2 breakout refers to the oil recovery from the start of CO2 flooding to just before gas breakout occurs. The values of recovery after CO2 breakout refers to the oil recovery from the start of CO2 flooding to a specific moment after gas breakout occurs. The CO2 density is 737.06 kg/m3 at the reservoir’s temperature and pressure. The solubility of CO2 is 207.86 m3/m3 in crude oil and 27.63 m3/m3 in water under standard conditions, as measured in the study area. According to the effective storage coefficient calculation, with a permeability of 22 mD and an initial formation pressure of 31 MPa, the effective storage coefficient is 0.5981 at 82 °C. The theoretical amount of CO2 burial, calculated using Equation (2), is 700,400 tons, while the effective CO2 burial amount, calculated using Equation (3), is 418,900 tons.
Table 5.
The basic parameters of the reservoir of the well group of the low-permeability reservoir in the block are studied.
5. Conclusions
- (1)
- In low-permeability oil reservoirs, an increase in permeability results in a decrease in the contribution rate of CO2 dissolution and sequestration in oil and water, while the proportion of structurally bound sequestration increases from 55% to 60%.
- (2)
- Temperature has little impact on the contribution rate of different CO2 sequestration mechanisms. The proportion of CO2 sequestration through dissolution in oil and water decreases slightly due to the reduced solubility coefficient of CO2 in oil and water at higher temperatures.
- (3)
- Higher initial reservoir pressure improves the effectiveness of CO2 enhanced oil recovery. However, when the pressure surpasses a certain threshold, gas channeling may occur during the later stages of injection, which can lead to decreased recovery and storage efficiency. During field implementation, it is crucial to ensure that the reservoir pressure exceeds the minimum miscibility pressure of CO2 and crude oil, while also maintaining it below the maximum allowable pressure of the injection equipment and pipelines.
- (4)
- A method was established using supervised machine learning to train regression models—with permeability, reservoir temperature, and initial reservoir pressure as the input variables, and the effective storage coefficient as the target function—to determine CO2 effective sequestration coefficients through artificial intelligence training models. Charts depicting effective sequestration coefficients under various conditions (permeability, reservoir pressure, temperature) enable accurate and rapid calculation of effective sequestration volumes and identification of favorable sequestration areas.
Author Contributions
Conceptualization, Z.F.; methodology, T.S. and Z.L.; software, T.S. and J.C.; validation, Y.M.; formal analysis, T.S.; investigation, M.T. and M.L.; resources, Z.F.; data curation, Y.M.; writing—original draft preparation, Z.F.; writing—review and editing, T.S. and Z.L.; visualization, J.C.; supervision, Y.J. and Z.L.; project administration, Z.F. and M.T.; funding acquisition, Z.F. All authors have read and agreed to the published version of the manuscript.
Funding
This research was funded by the National Natural Science Foundation of China and Enterprise Innovation Development Joint Fund—Integrated Project, “Fundamental research on synergistic steam injection to significantly enhance heavy oil recovery through multiple chemical reactions and heat generation in the wellbore”, grant number U23B6003.
Data Availability Statement
The data presented in this study are available on request from the corresponding author due to legal and privacy reasons.
Conflicts of Interest
Authors Z.F., M.T., M.L., Y.M. and Y.J. were employed by the Liaohe Oilfield Company.
References
- Wang, Z.; Fan, Z.; Chen, X.; Fan, Z.; Wei, Q.; Wang, X.; Yue, W.; Liu, B.; Wu, Y. Global Oil and Gas Development in 2022: Situation, Trends, and Enlightenment. Pet. Explor. Dev. 2023, 50, 1167–1186. [Google Scholar] [CrossRef]
- Wang, Q.; Li, S.; Li, R. China’s Dependency on Foreign Oil Will Exceed 80% by 2030: Developing a Novel NMGM-ARIMA to Forecast China’s Foreign Oil Dependence from Two Dimensions. Energy 2018, 163, 151–167. [Google Scholar] [CrossRef]
- Tang, X.; Li, Y.; Cao, J.; Liu, Z.Y.; Chen, X.; Liu, L.; Zhang, Y.Q. Adaptability and enhanced oil recovery performance of surfactant polymer flooding in inverted seven-spot well pattern. Phys. Fluids 2023, 35, 053116. [Google Scholar] [CrossRef]
- Wei, B.; Song, T.; Zhao, J.Z.; Valeriy, K.; Pu, W.F. Improving the Recovery Efficiency and Sensitivity of Tight Oil Reservoirs by Dissolved Gas Reinjection. J. Southwest Pet. Univ. Sci. Technol. Ed. 2019, 41, 85–95. [Google Scholar]
- Wang, R.; Zhang, Y.; Lyu, C.; Lun, Z.M.; Cui, M.L.; Lang, D.J. Displacement characteristics of CO2 flooding in extra-high water-cut reservoirs. Energy Geosci. 2024, 5, 100115. [Google Scholar] [CrossRef]
- Wei, B.; Song, T.; Gao, Y.; Xiang, H.; Xu, X.G.; Valeriy, K.; Bai, J.L.; Zhai, Z.W. Effectiveness and sensitivity analysis of solution gas re-injection in Baikouquan tight formation, Mahu sag for enhanced oil recovery. Petroleum 2020, 6, 253–263. [Google Scholar] [CrossRef]
- Zou, C.; Lin, M.; Ma, F. Development, challenges and strategies of natural gas industry under carbon neutral target in China. Pet. Explor. Dev. 2024, 51, 476–497. [Google Scholar] [CrossRef]
- Davoodi, S.; Al-Shargabi, M.; Wood, D.A.; Mehrad, M.; Rukavishnikov, S. Carbon dioxide sequestration through enhanced oil recovery: A review of storage mechanisms and technological applications. Fuel 2024, 366, 131313. [Google Scholar] [CrossRef]
- Shi, C.; Zhi, J.; Yao, X.; Zhang, H.; Yu, Y.; Zeng, Q.S.; Li, L.J.; Zhang, Y.X. How can China achieve the 2030 carbon peak goal—A crossover analysis based on low-carbon economics and deep learning. Energy 2023, 269, 126776. [Google Scholar] [CrossRef]
- Zhong, Z.; Chen, Y.; Fu, M.; Li, M.Z.; Yang, K.S.; Zeng, L.P.; Liang, J.; Ma, R.P.; Xie, Q. Role of CO2 geological storage in China’s pledge to carbon peak by 2030 and carbon neutrality by 2060. Energy 2023, 272, 127165. [Google Scholar] [CrossRef]
- Tang, X.-C.; Li, Y.-Q.; Liu, Z.-Y.; Zhang, N. Nanoparticle-reinforced foam system for enhanced oil recovery (EOR): Mechanistic review and perspective. Pet. Sci. 2023, 20, 2282–2304. [Google Scholar] [CrossRef]
- Dou, L.; Sun, L.; Lyu, W.; Wang, M.Y.; Gao, F.; Gao, M.; Jiang, H. Trend of global carbon dioxide capture, utilization and storage industry and challenges and countermeasures in China. Pet. Explor. Dev. 2023, 50, 1246–1260. [Google Scholar] [CrossRef]
- Tang, X.; Li, Y.; Han, X.; Zhou, Y.B.; Zhan, J.F.; Xu, M.M.; Zhou, R.; Cui, K.; Chen, X.L.; Wang, L. Dynamic characteristics and influencing factors of CO2 huff and puff in tight oil reservoirs. Pet. Explor. Dev. 2021, 48, 946–955. [Google Scholar] [CrossRef]
- Zhang, Z.H.; Yang, Z.M.; Liu, X.G.; Xiong, W.; Wang, X.W. A grading evaluation method for low-permeability reservoirs and its application. Acta Pet. Sin. 2012, 33, 437–441. [Google Scholar]
- Mahdaviara, M.; Sharifi, M.; Ahmadi, M. Toward evaluation and screening of the enhanced oil recovery scenarios for low permeability reservoirs using statistical and machine learning techniques. Fuel 2022, 325, 124795. [Google Scholar] [CrossRef]
- Wei, B.; Zhang, X.; Wu, R.; Zou, P.; Gao, K.; Xu, X.G.; Pu, W.F.; Wood, C. Pore-scale monitoring of CO2 and N2 flooding processes in a tight formation under reservoir conditions using nuclear magnetic resonance (NMR): A case study. Fuel 2019, 246, 34–41. [Google Scholar] [CrossRef]
- Hill, L.B.; Li, X.; Wei, N. CO2-EOR in China: A comparative review. Int. J. Greenh. Gas Control 2020, 103, 103173. [Google Scholar] [CrossRef]
- Wang, L.; Wei, B.; You, J.; Pu, W.F.; Tang, J.Y.; Lu, J. Performance of a tight reservoir horizontal well induced by gas huff–n–puff integrating fracture geometry, rock stress-sensitivity and molecular diffusion: A case study using CO2, N2 and produced gas. Energy 2023, 263, 125696. [Google Scholar] [CrossRef]
- Lu, L.; Liu, B. A Feasibility Research Method and Project Design on CO2 Miscible Flooding for a Small Complex Fault Block Field. In Proceedings of the SPE International Oil and Gas Conference and Exhibition in China, Beijing, China, 2–6 November 1998; pp. SPE-50930-MS, 501–515. [Google Scholar]
- Xu, S.; Ren, G.; Younis, R.M.; Feng, Q. Revisiting field estimates for carbon dioxide storage in depleted shale gas reservoirs: The role of geomechanics. Int. J. Greenh. Gas Control 2021, 105, 103222. [Google Scholar] [CrossRef]
- Haishui, H.A.N.; Shiyi, Y.U.A.N.; Shi, L.I.; Xiaolei, L.; Xinglong, C. Dissolving capacity and volume expansion of carbon dioxide in chain n-alkanes. Pet. Explor. Dev. 2015, 42, 97–103. [Google Scholar]
- He, Y.; Liu, M.; Tang, Y.; Jia, C.Q.; Wang, Y.; Rui, Z.H. CO2 storage capacity estimation by considering CO2 Dissolution: A case study in a depleted gas Reservoir, China. J. Hydrol. 2024, 630, 130715. [Google Scholar] [CrossRef]
- Kutsienyo, E.J.; Ampomah, W.; Sun, Q.; Balch, R.S.; You, J.; Aggrey, W.N.; Cather, M. Evaluation of CO2-EOR Performance and Storage Mechanisms in an Active Partially Depleted Oil Reservoir. In Proceedings of the SPE Europec featured at 81st EAGE Conference and Exhibition, London, UK, 3–6 June 2019; p. SPE-195534-MS. [Google Scholar]
- Sedaghatinasab, R.; Kord, S.; Moghadasi, J.; Soleymanzaden, A. Relative Permeability Hysteresis and Capillary Trapping during CO2 EOR and Sequestration. Int. J. Greenh. Gas Control 2021, 106, 103262. [Google Scholar] [CrossRef]
- Wang, Y.Z.; Cao, R.Y.; Jia, Z.H.; Wang, B.Y.; Ma, M.; Cheng, L.S. A multi-mechanism numerical simulation model for CO2-EOR and storage in fractured shale oil reservoirs. Pet. Sci. 2024, 21, 1814–1828. [Google Scholar] [CrossRef]
- Zhang, R.H.; Wu, J.F.; Zhao, Y.L.; He, X.; Wang, R.H. Numerical simulation of the feasibility of supercritical CO2 storage and enhanced shale gas recovery considering complex fracture networks. J. Pet. Sci. Eng. 2021, 204, 108671. [Google Scholar] [CrossRef]
- Yamaguchi, A.J.; Sato, T.; Tobase, T.; Wei, X.; Huang, L.; Zhang, J.; Bian, J.; Liu, T. Multiscale numerical simulation of CO2 hydrate storage using machine learning. Fuel 2023, 334, 126678. [Google Scholar] [CrossRef]
- Liu, D.; Li, Y.; Agarwal, R.K. Numerical simulation of long-term storage of CO2 in Yanchang shale reservoir of the Ordos basin in China. Chem. Geol. 2016, 440, 288–305. [Google Scholar] [CrossRef]
- Andrić, I.; Pinaa, A.; Ferrão, P.; Fournier, J.; Lacarrière, B.; Le Corre, O. Assessing the feasibility of using the heat demand-outdoor temperature function for a long-term district heat demand forecast. Energy Procedia 2017, 158, 6079–6086. [Google Scholar] [CrossRef]
- Thibeau, S.; Bachu, S.; Birkholzer, J.; Holloway, S.; Neele, F.; Zhou, Q. Using Pressure and Volumetric Approaches to Estimate CO2 Storage Capacity in Deep Saline Aquifers. Energy Procedia 2014, 63, 5294–5304. [Google Scholar] [CrossRef]
- Shen, P.P.; Liao, X.W.; Liu, Q.J. Methodology for estimation of CO2 storage capacity in reservoirs. Pet. Explor. Dev. 2009, 36, 216–220. [Google Scholar] [CrossRef]
- Zhao, X.; Liao, X.; Wang, W.; Chen, C.Z.; Rui, Z.H.; Wang, H. The CO2 storage capacity evaluation: Methodology and determination of key factors. J. Energy Inst. 2014, 87, 297–305. [Google Scholar] [CrossRef]
- Abdulwarith, A.; Ammar, M.; Dindoruk, B. Prediction/Assessment of CO2 EOR and Storage Efficiency in Residual Oil Zones Using Machine Learning Techniques. In Proceedings of the SPE/AAPG/SEG Carbon, Capture, Utilization, and Storage Conference and Exhibition, Houston, TX, USA, 11–13 March 2024; p. SPE-CCUS-2024-4011705. [Google Scholar]
- Ren, D.; Wang, X.; Kou, Z.; Wang, S.C.; Wang, H.; Wang, X.G.; Tang, Y.; Jiao, Z.S.; Zhou, D.S.; Zhang, R.J. Feasibility evaluation of CO2 EOR and storage in tight oil reservoirs: A demonstration project in the Ordos Basin. Fuel 2023, 331, 125652. [Google Scholar] [CrossRef]
- Gao, R.; Lv, C.Y.; Zhou, K.; Lun, Z.M.; Zhou, B. A CO2 flooding dynamic storage potential calculation method based on compositional flash calculation. Oil Drill. Prod. Technol. 2021, 43, 70–75. [Google Scholar]
- Li, S.Y.; Qiao, C.Y.; Li, Z.M.; Hui, Y.T. The effect of permeability on supercritical CO2 diffusion coefficient and determination of diffusive tortuosity of porous media under reservoir conditions. J. CO2 Util. 2018, 28, 1–14. [Google Scholar] [CrossRef]


Disclaimer/Publisher’s Note: The statements, opinions and data contained in all publications are solely those of the individual author(s) and contributor(s) and not of MDPI and/or the editor(s). MDPI and/or the editor(s) disclaim responsibility for any injury to people or property resulting from any ideas, methods, instructions or products referred to in the content. |
© 2024 by the authors. Licensee MDPI, Basel, Switzerland. This article is an open access article distributed under the terms and conditions of the Creative Commons Attribution (CC BY) license (https://creativecommons.org/licenses/by/4.0/).