Abstract
As renewable energies need to be extended massively, new concepts are necessary to prevent land conflicts with other uses. Such concepts should have a high generality to offer a swift expansion of renewables anywhere. Within the project, the Photovoltaic Road Roofing Concept (PV-SÜD), a concept for the roofing of roadways with solar panels, was investigated. Its effects on the road infrastructure were analyzed, and a demonstrator was built. The technical boundary conditions and requirements resulting from the specific application type were determined regarding the photovoltaic technology, the possible energy generation, and the supporting structure. The study was completed for a technical solution of 10 m length, 17 m width, and 6.8 m height, with the option of a pent roof (highways running east–west) or gable roofs (highways running north–south). The main target aim was to investigate the potential for widespread use at any site, in contrast to previous studies which mainly aimed at a singular site or demonstrator project. The final solution can support a 38.5 kWp photovoltaic system with a specific annual yield of between 37.5 MWh and 44.0 MWh. The yield variation in sites in Austria and Germany was 14.7% and 17.9%, respectively. One demonstrator roofing was realized as a steel-frame construction with active glass–glass photovoltaic technology at a highway in Hegau (GE).
1. Introduction
Energy generation by photovoltaics (PV) is one of the key technologies for increasing the share of renewable energy sources in primary energy production [1,2]. However, this requires the availability of corresponding areas. In highly populated countries with large shares of PV generation, the available area for PV is becoming increasingly scarce, and societies are exploring technologies where already concealed land mass can be used for PV generation [3]. The high-ranking road network and the associated areas in Germany, Austria, and Switzerland currently represent a largely untapped potential [4,5,6,7]. More demonstration plants are already planned (e.g., in Switzerland [8]).
The technical possibility of integrating PV into the high-ranked street network is still a matter of discussion and open discourse. One argument in favor of PV roofing is that sealed surfaces (e.g., building surfaces) are especially useful for solar photovoltaic installations and are needed to match climate goals [9].
It is assumed that the total infrastructure costs of housing or roofing highways with PV systems will always be significantly higher than installing PV systems in other sites. This, combined with the need for resources (e.g., steel and concrete), is one of the strongest arguments against this type of installation.
Other studies argue that it is not technically or economically possible to activate all potential in buildings to be activated and that BIPV installations will not allow us to meet national installation goals [10]. This would increase the need to activate other areas, preferentially already-sealed ones, such as high-ranked road networks. A strong argument for PV installation on the high-ranking road network is the increasing electrification and rise of electric energy consumption along the road network [11]. This demand may be from lighting, communication, or tunnel ventilation. Another need arises from electric vehicle charging demand at highway gas stations, especially those stations located far away from strong grid infrastructure.
In this study, the main focus was put on the investigation of a useful, applicable solution with the potential to be multiplied (i.e., by using standardized components). The central research questions included the structural stability and agreement to the standards and regulations of the PV elements and the supporting structure. The sensitivity of the electric yield to a variety of sites and orientations was also observed. Investigations have shown that PV roofing in the high-ranking road network is technically feasible with currently available technology (ideally using industrially standardized components and not tailor-made parts) and can make a relevant contribution to sustainable energy production in the related energy sector. The technical feasibility of roofing sealed street road areas has been demonstrated in principle by a live demonstrator. This study uses a more general approach and identifies a modular concept for flexible use in the high-level road network that can increase its energy yield potential while providing further beneficial effects.
2. PV-SÜD Concept
In the PV-SÜD project, the concept for photovoltaic road roofing was developed and a demonstrator was built, taking into account the diverse requirements of the high-ranking road application area, both for the solar modules and for the supporting structure.
2.1. Supporting Structure Constraints
The following goals were used as a guideline for the technical developments and analysis:
- Energy generation through photovoltaics based on suitable PV module technology;
- Utilization of existing sealed street areas;
- Flexible use in the high-level road network;
- Flexible integration with minimum yield variety for different sites and geographical orientation;
- Increase the durability of the roadway by protecting against overheating and precipitation;
- Positive effects on road surface properties.
The main goal was to develop a concept that could be easily multiplied (to allow for the mass manufacturing of components) using established concepts from other road constructions (to operate on a high technology readiness level) and provide a simple scheme for planners. Basic decisions in the design of the supporting structure were made regarding structural safety and were chosen in agreement with the needs of the end-user stakeholders in the D-A-CH (Germany, Austria, Switzerland) region:
- The canopy structure had to be easily adaptable to the existing road layout.
- The design of the basic geometry should be optimized for power generation, aesthetics, and road operation requirements.
- The design in terms of geometry, length, and cross-section should be in such a way that no rules and regulations for tunnel structures have to be mandatorily applied.
- The supporting structure should be designed in such a way that no system failure can occur in the exceptional load case of fire or impact.
2.2. PV Systems Constraints
The main decisions in the design for the PV generator were examined with regard to the safety, yield optimization, and later scalability of the solution. The plant should meet the following requirements:
- The PV solution should be scalable on highways with two and three lanes with and without a shoulder and should be duplicable, i.e., not require a site-specific special solution.
- Regular commercially designed products should be preferred versus specially designed solutions.
- The energy generation should be optimized and maximized with regard to the structural conditions, i.e., the entire covered area should be used by PV if possible, excluding openings for lighting or ventilation.
- Energy generation should be as independent as possible from the direction of travel of the roadway (north–south (N-S), or east–west (E-W), etc.) due to the type of construction and structural solution.
- Facilities should be constructed to eliminate or minimize self-shading.
Further constraints related to PV design as well as construction design were fire protection on high-ranked roads, rainwater drainage, icicle formation protection, wind- and snow-load, load from traffic noise, low impact on maintenance work, and safety and security in agreement with road network regulations (e.g., a fire or accident impacting the construction) [12,13,14,15].
2.3. Evaluation of Different Geometric Shapes
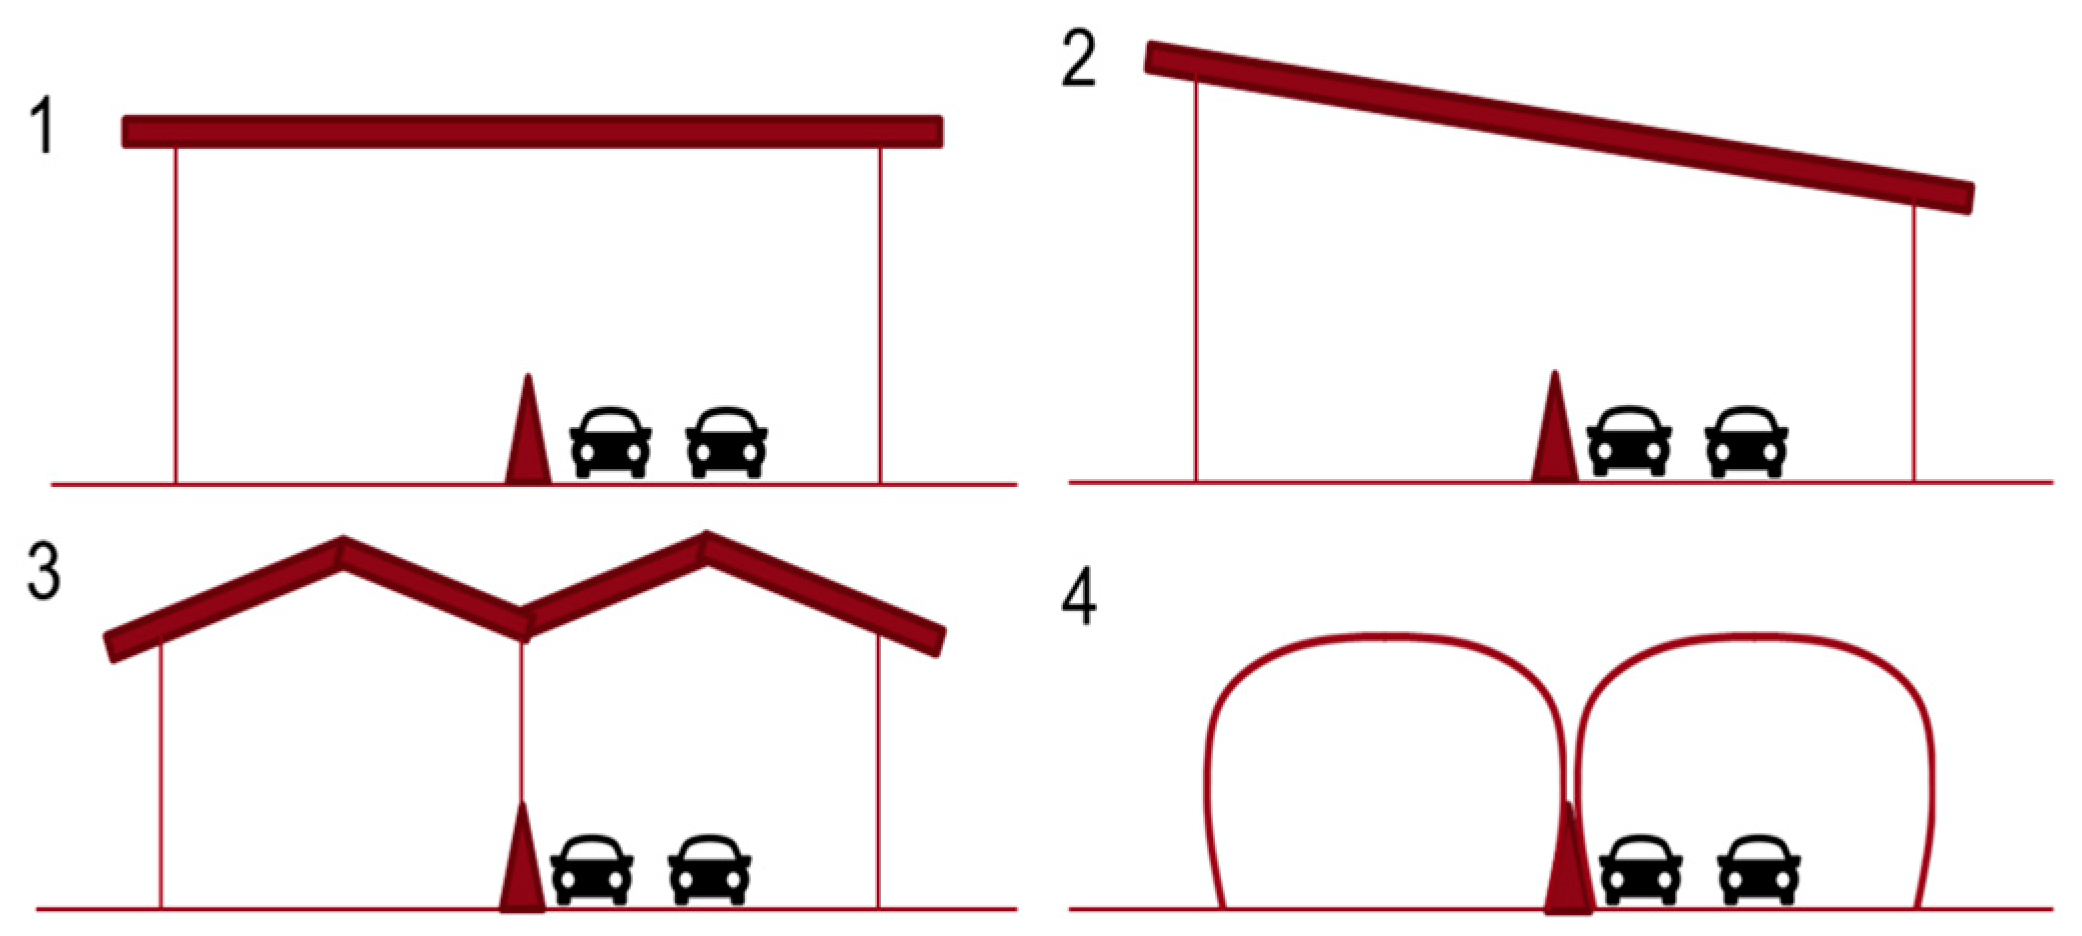
In the design process, possible shapes were evaluated against common and successfully implemented technical designs. Particular attention was paid to the designs’ satisfaction. Figure 1 shows four variants for possible designs.
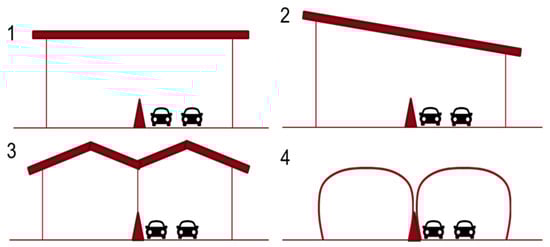
Figure 1.
The four variants considered in the discussion on the design of the roofing in the transverse direction: (1) a completely flat roof, (2) a pent roof inclined at an indeterminate angle, (3) a gable roof inclined at an indeterminate angle, and (4) roofing with an arched cross-section.
All of them were evaluated and also assessed in terms of their flexibility for different lane widths and PV module mounting types.
Depending on the east–west or north–south course of the traffic axis, pent or gable roofs are more suitable due to the energy yield. Flat roofs have a disadvantage in drainage, while an energy-efficient elevation of photovoltaic modules could always be realized on them. Constructions with an arch shape are not suitable due to an unsatisfactory impact on the energy yield and the manufacturing costs, as well as shifting the roofing towards the regulatory restrictions of road tunnels.
The evaluation of different support structure forms in the longitudinal direction showed that a design with four supports and a cantilevered roof is the most suitable (for variants, see Figure 2). It was assumed that a structure with four columns will not collapse immediately in the case of the failure of one column.

Figure 2.
Three variants of roofing in the longitudinal direction: (1) supports in the corners, (2) supports in the center, (3) cantilever with supports in the perimeter.
A certain distance between the supports has a disadvantage in terms of the number of foundations, but there is an advantage of the lower material consumption of the steel structure due to the reduced spans.
2.4. PV-SÜD Concepts
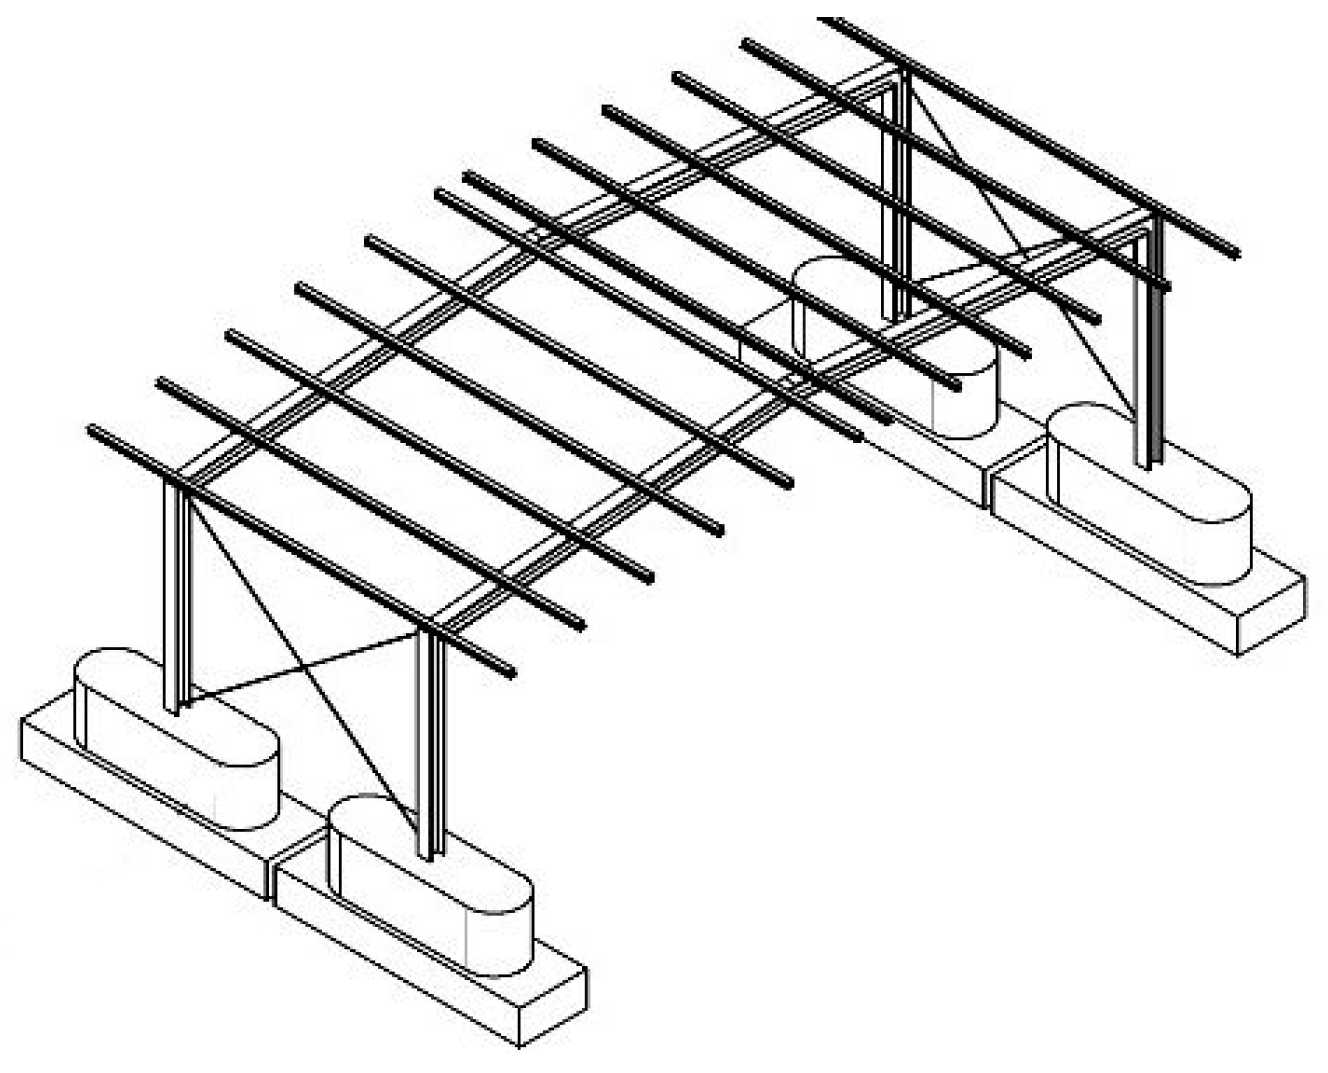
The result is a concept that provides a 10 m long base element consisting of a supporting structure made of steel, which is arranged either in a gable roof or pent roof form, depending on the street orientation. It is used to mount overhead-certified silicon PV modules, with a glass/glass configuration. A gable roof for road sections with a predominantly north–south course and a pent roof for road sections with a predominantly east–west course (see Figure 3, Figure 4 and Figure 5, and Figure 6, respectively) were chosen.

Figure 3.
Three-dimensional graphics of the gable roof variant.

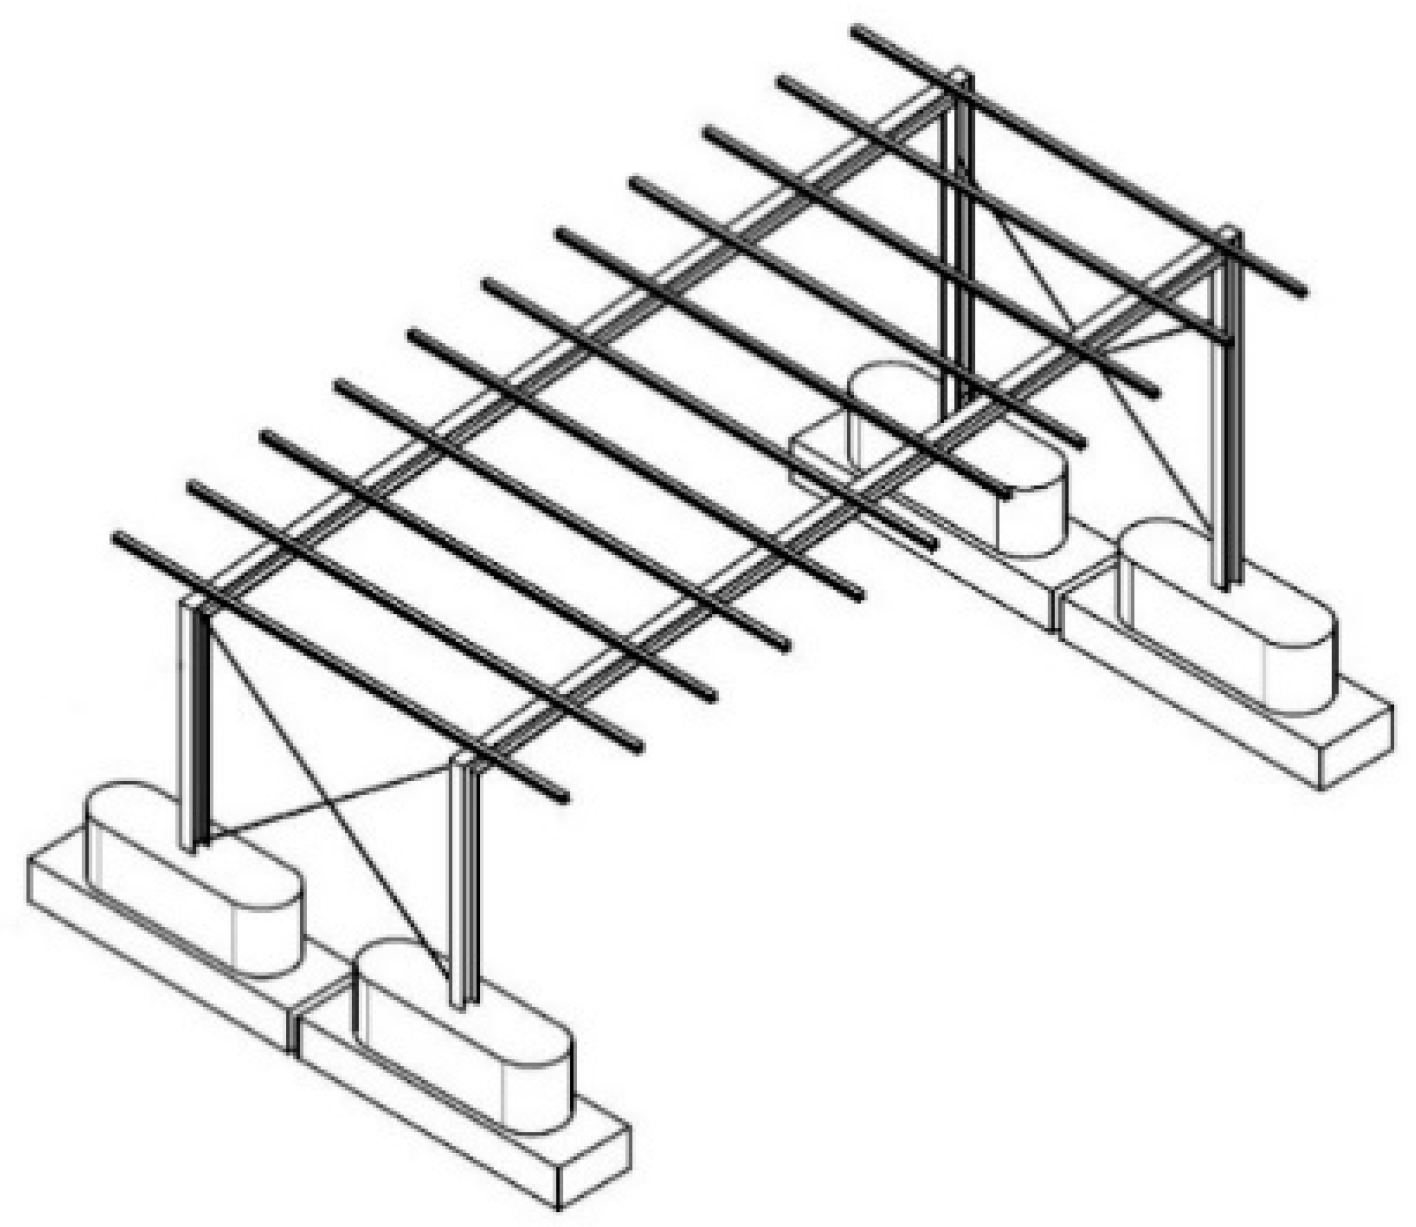
Figure 4.
Three-dimensional graphics of the pent roof variant.

Figure 5.
Visualization of the gable roof variant.
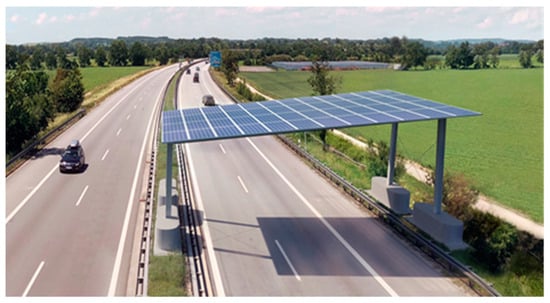
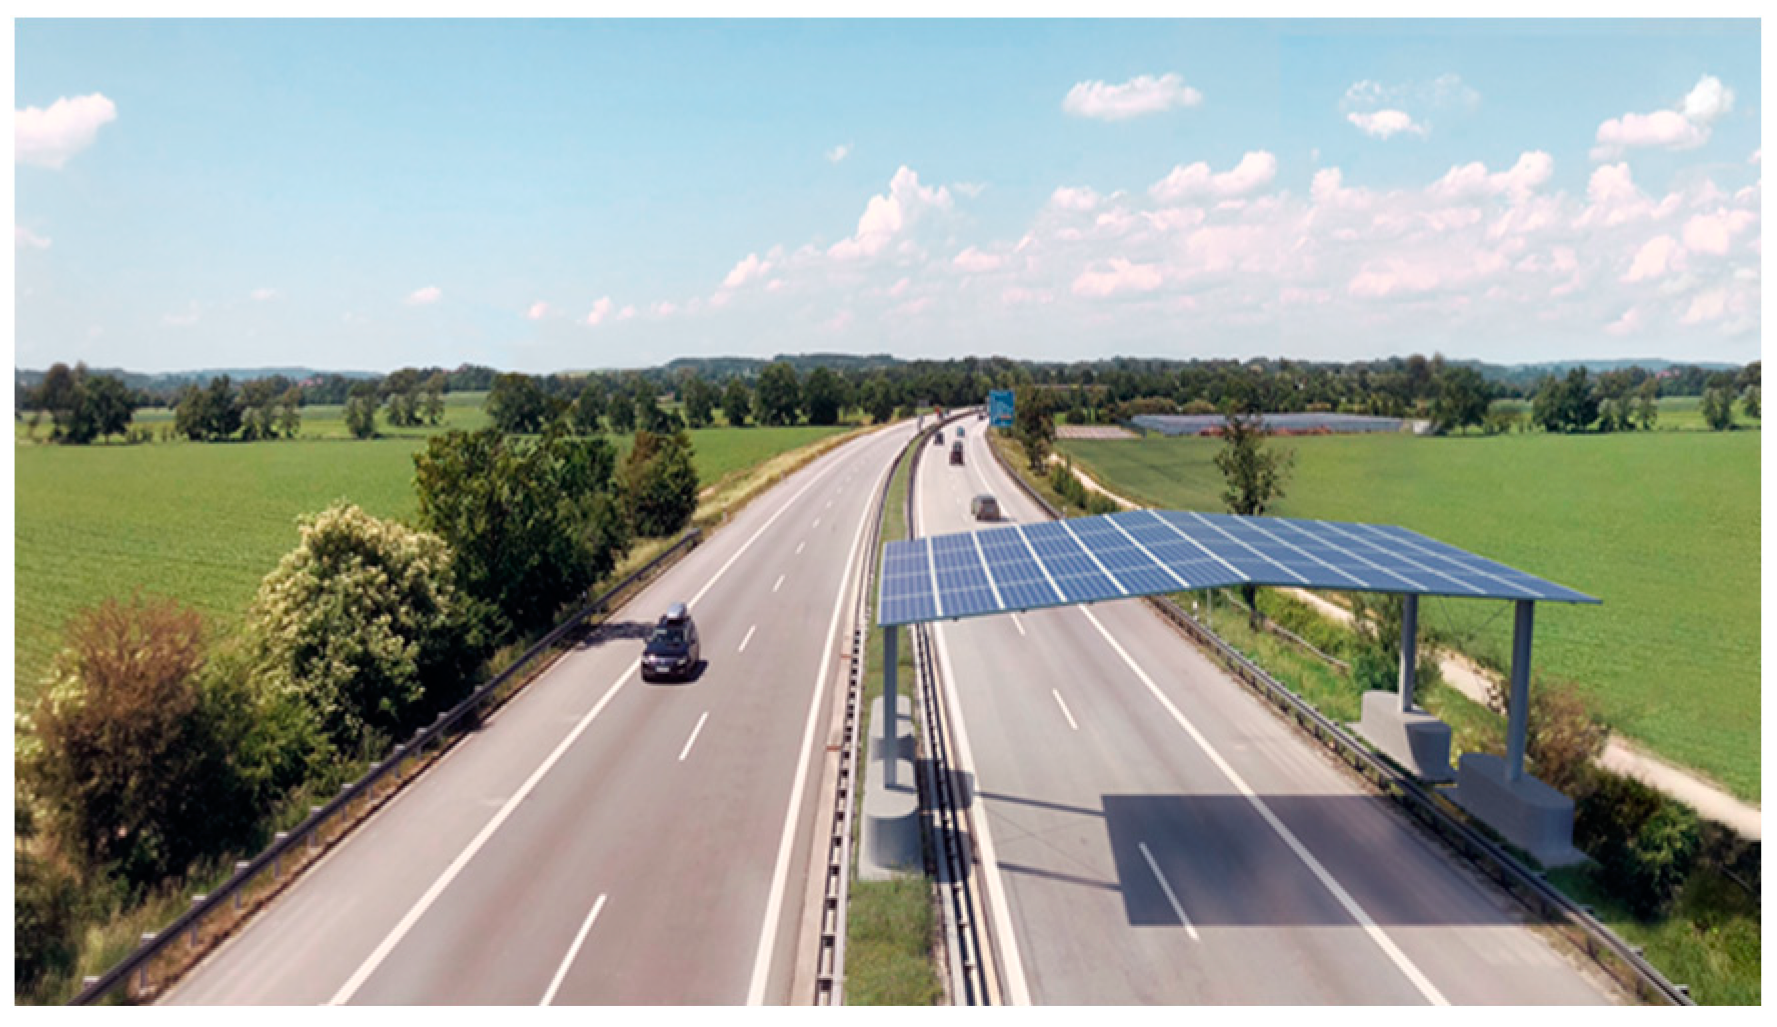
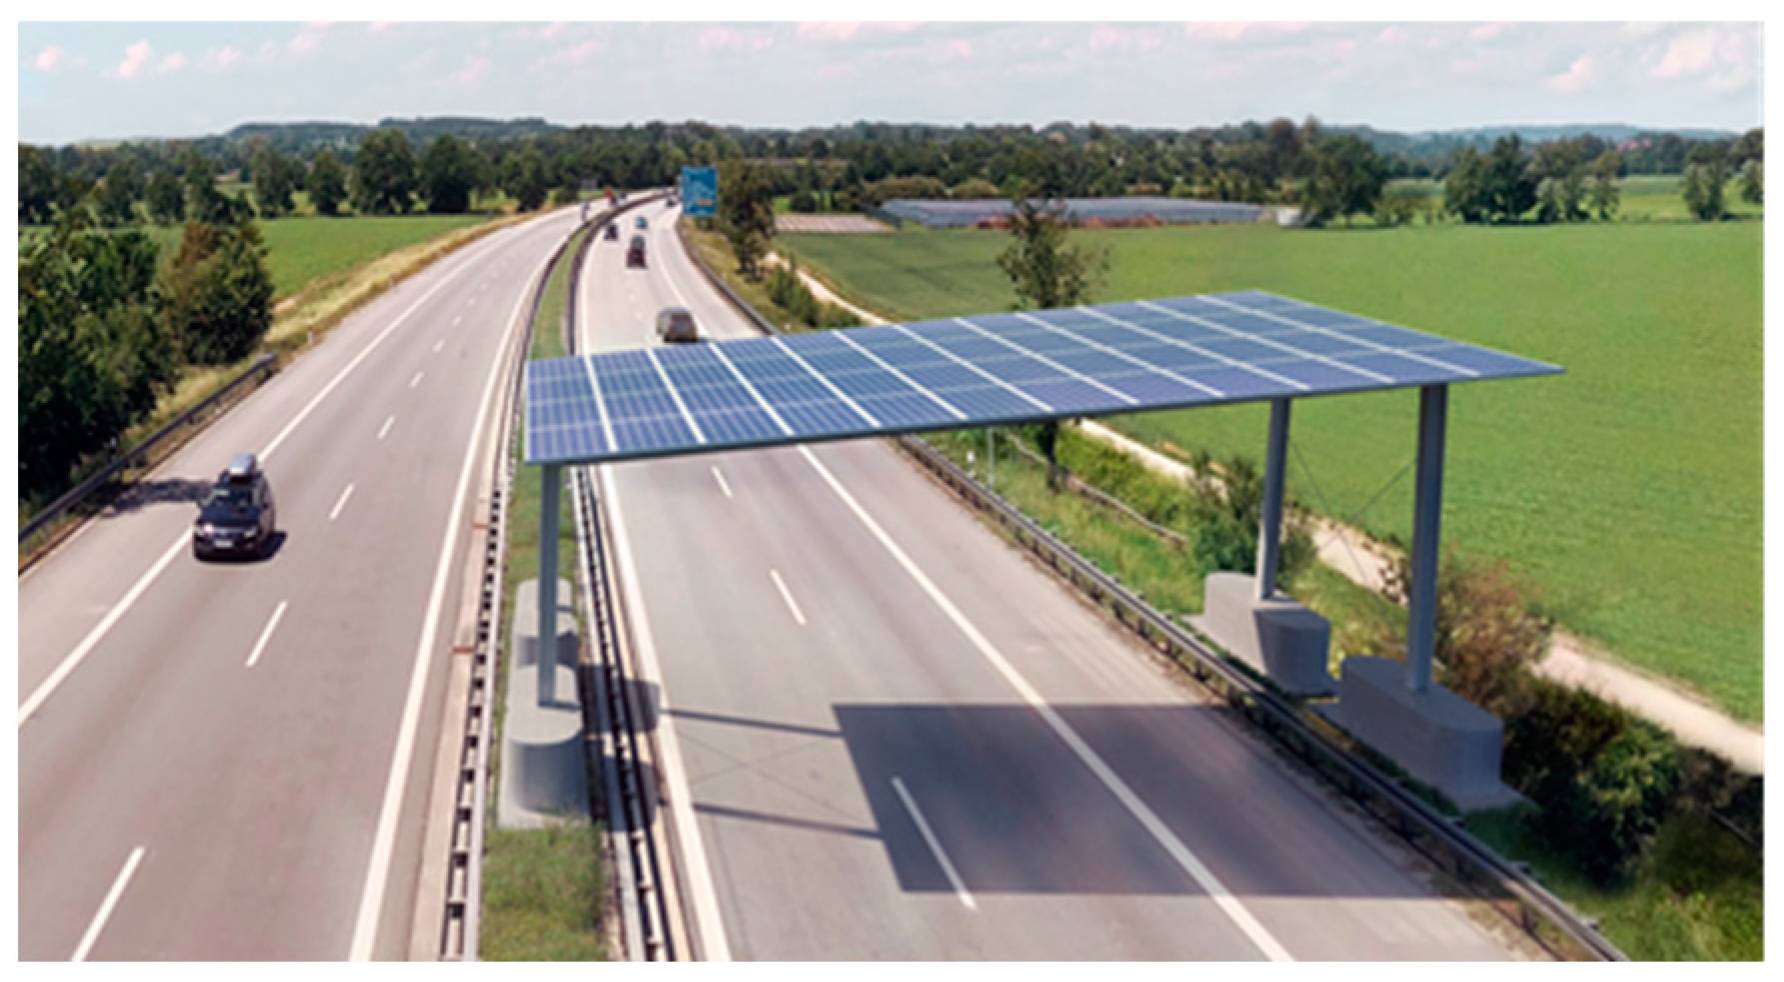
Figure 6.
Visualization of the pent roof variant.
They offer a very flexible solution and do not negatively affect the traffic and allow the stability of the influence of orientation on the energy yield.
Most requirements can be met with (certified) components suitable for overhead installations, currently in a growing supply for e.g., building integrated PV applications (BIPV). The performance of different PV module setups was investigated following the results of [16]. This concept was analyzed in detail regarding the achievable solar yields as well as the expected side effects on the roadway and propagation.
For the given geometries, pent roof or gable roof, the useful area of PV modules was the same, as well as for the footprint and the external dimensions of the sub-structure. Table 1 shows the planning parameters including the technical planning specifications of the PV system.

Table 1.
Planning parameters for PV-SOL.
3. Results
3.1. Yield Sensitivity of PV-SÜD
Various locations were analyzed for a potential positioning of the PV-SÜD demonstrator on highways in Austria and Germany, to prove the yield stability of the design. For this purpose, energy yield simulations were carried out for the different distinct locations on highways with a design and simulation software (PV-SOL premium, valentin-software.com/en/products/pvsol-premium) using the planning parameters from Table 1.
If the road runs north–south, a gable roof with east/west (E/W) orientation of the roof surfaces and thus of the PV module arrays was selected. If the street runs from west to east, a pent roof was selected with the roof surfaces and thus the PV module fields were oriented to the south (S).
The sites for the sensitivity study, distributed in various regions of Austria and Germany in the south as well as in the north, respectively, were the following.
- ASFINAG Rastplatz Leobersdorf A2,
coordinates: 47.910139° N, 16.208328° E;
- A1 Raststation St. Pölten SÜD,
coordinates: 48.177632° N, 15.555647° E;
- A2 Klagenfurt am Wörthersee,
coordinates: 46.648452° N, 14.253953° E;
- Parken mit WC-Anlage “Brandbühl” an der B 33 (Radolfzell am Bodensee, LK Konstanz),
coordinates: 47.770195° N, 8.965138° E;
- Park and Ride Anlage Engen an der A 81 (Engen, LK Konstanz),
coordinates: 47.856474° N, 8.794141° E;
- Petrol and Ride Anlage Hegau an der A 81 (Engen, LK Konstanz),
coordinates: 47.862292° N, 8.785754° E;
- Hamburg Seevetal, Rastplatz Sunderblick A1,
coordinates: 53.377801° N, 9.951588° E.
Figure 7 gives the results for the yield calculation for all sites. Note that they are geographically distributed in two countries from the sea in the north to the south of the Alps. Further, they represent the two solutions in different orientations. It can be seen from the table that two main influencing factors are the geographical altitude and also the orientation (design).
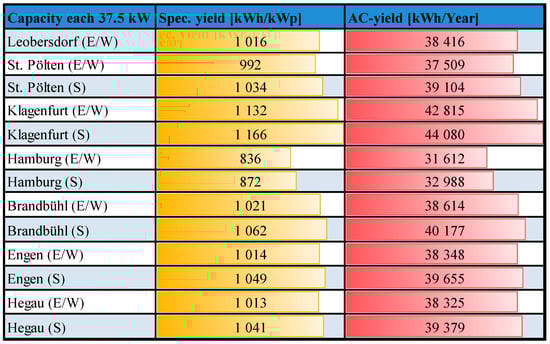
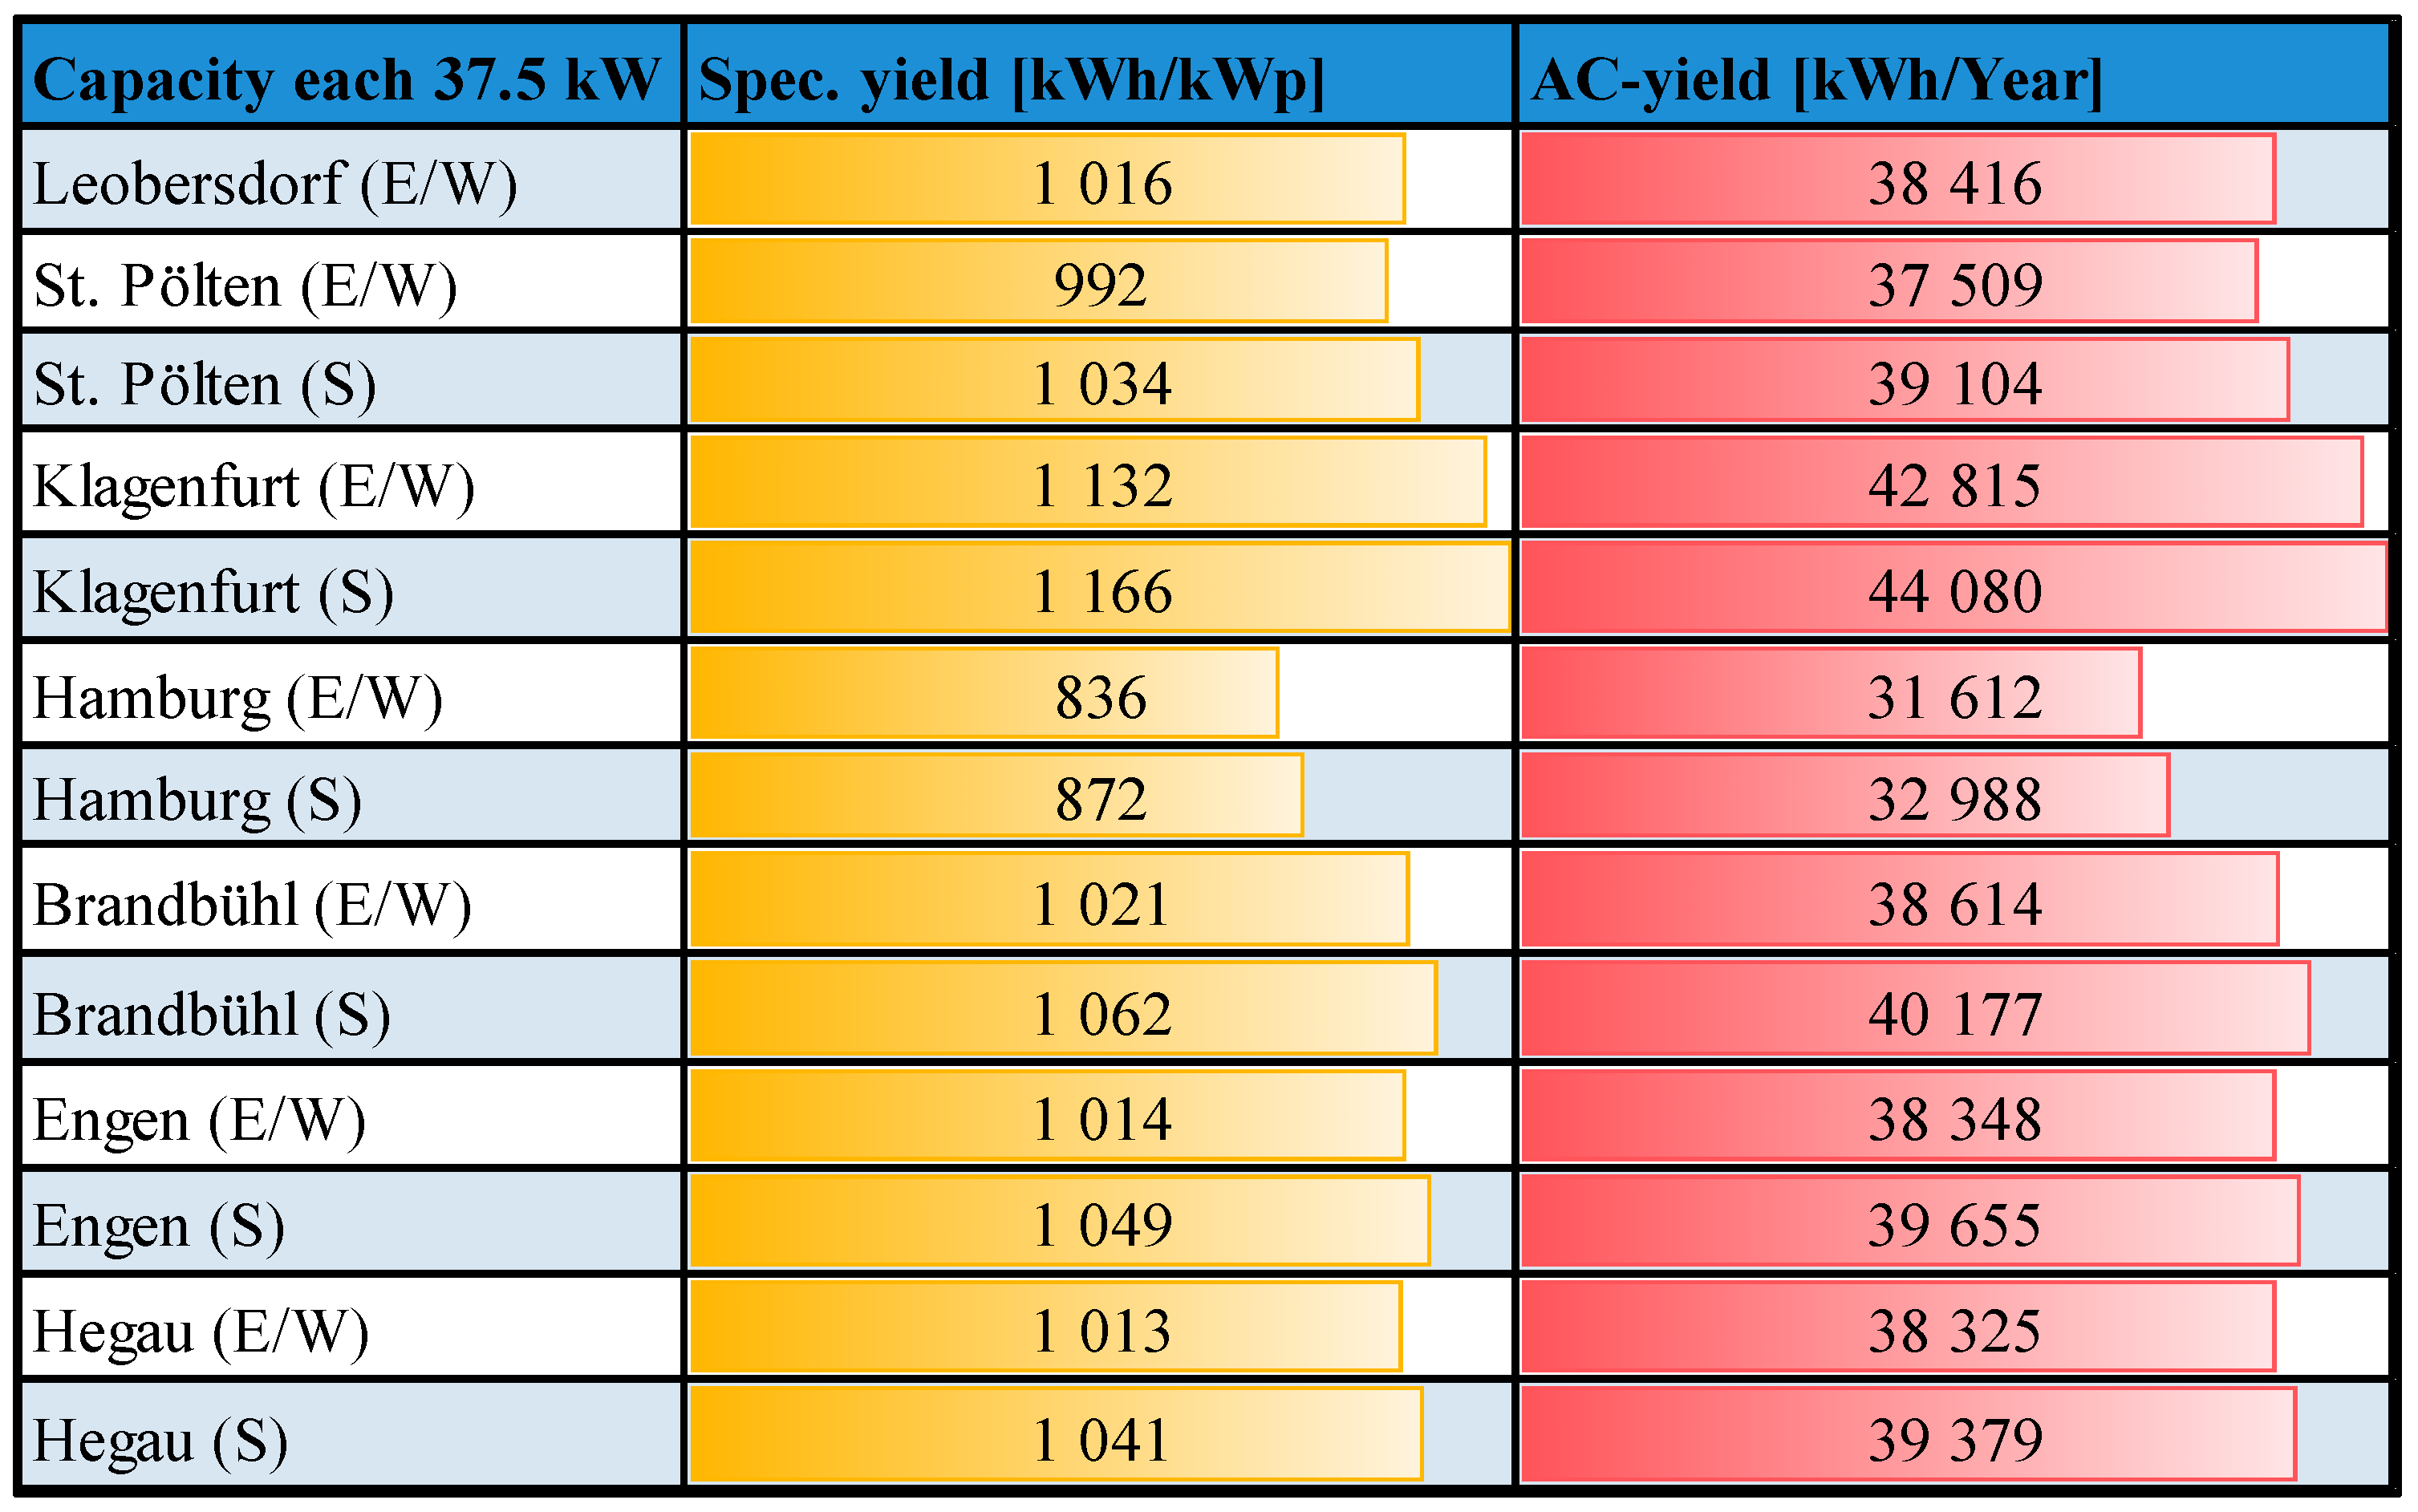
Figure 7.
Results for the yield calculation of the sites.
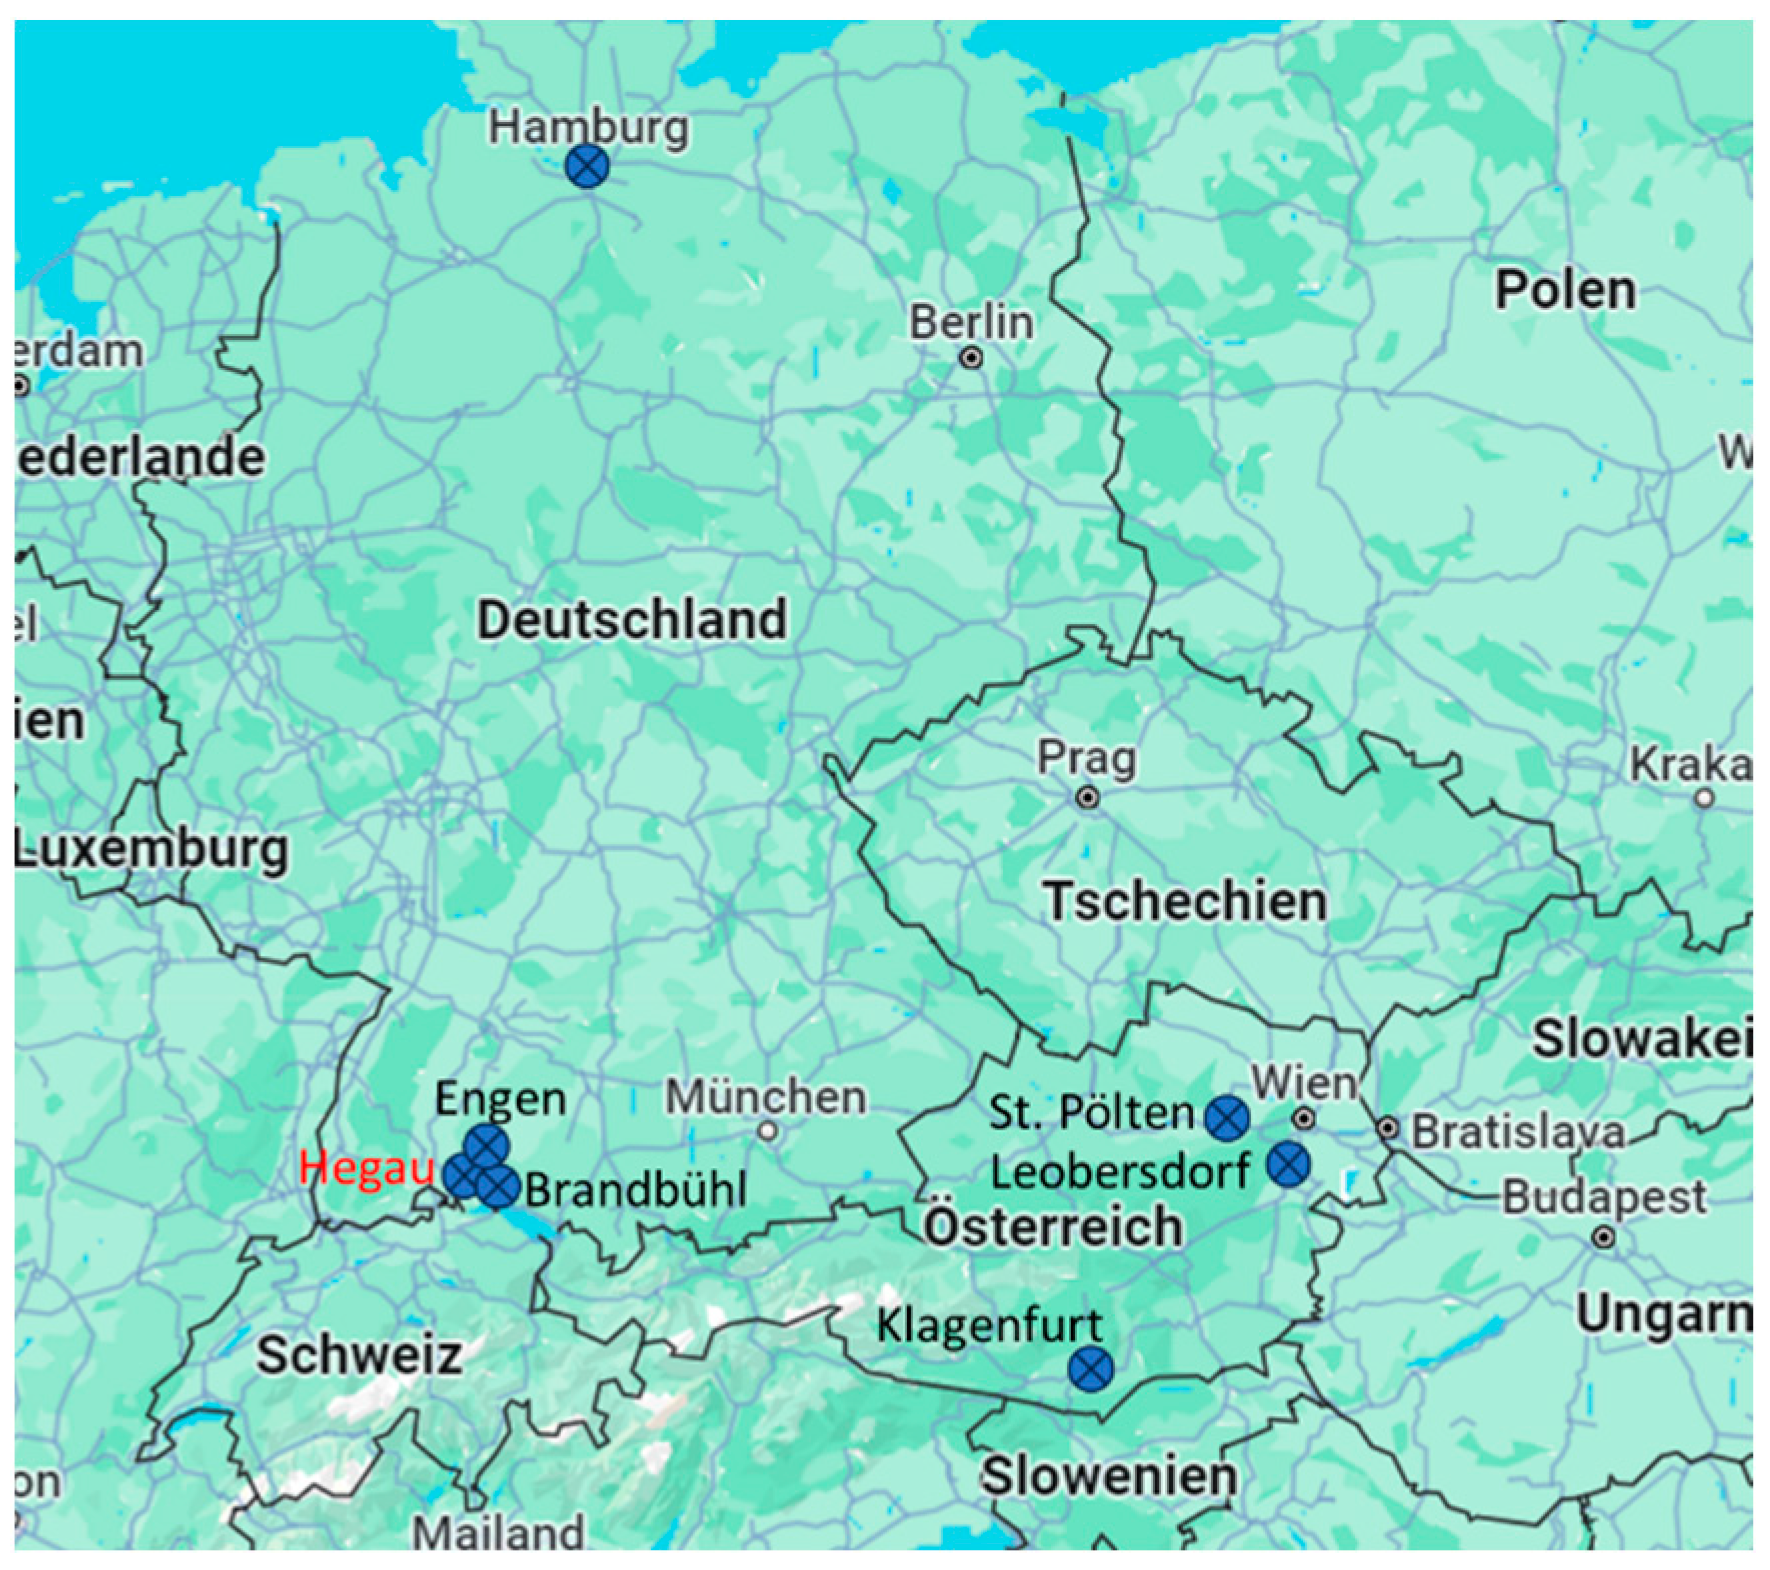
Figure 8 shows a map of Central Europe, where the calculated sites are marked with blue dots.
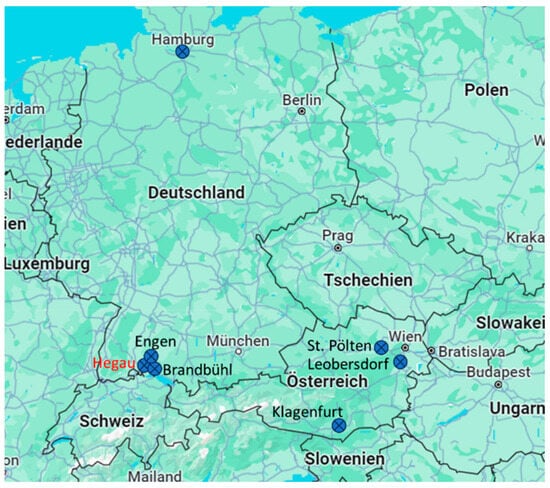
Figure 8.
Position of the calculated sites (marked with blue dots).
In terms of latitude, the annual specific yields vary for about 25% for the (S)-orientation from the maximum in Klagenfurt with 1166 kWh/kWp to the minimum in Hamburg with 872 kWh/kWp. The comparison of the (E/W)-orientation gives almost the same result with a variation of 26% from Klagenfurt with 1132 kWh/kWp to Hamburg with 836 kWh/kWp.
The (S)-orientation compared to the (E/W)-orientation gives a variation per site of between 2.8% more yield for (S) than (E/W) in Hegau to 4.4% in Hamburg. Nevertheless, the variation in latitude must also be seen in a regional context. Comparing sites only in Austria, the total variation between all sites and orientations results in a maximum of only 15% (Klagenfurt (S) vs. St. Pölten (E/W)). In Germany, the same calculation gives a maximum total variation of about 5% (Brandbühl (S) vs. Engen (E/W)) excluding Hamburg. The result including Hamburg would show 18% less and 22% less than Brandbühl (S) for the (S)-orientation and the (E/W)-orientation, respectively.
The yield values for one unit of PV-SÜD (10 m roofing of road network) lie between 37.5 MWh/year (St. Pölten (E/W) and 44.0 MWh/year (Klagenfurt (S))—except 31.6 MWh/year and 33.0 MWh/year for Hamburg (E/W) and Hamburg (S), respectively. The regional annual energy yield planning values for Austria therefore would be between 37.5 MWh and 44.0 MWh with a mean value of 40.4 MWh. The regional annual energy yield planning values for Germany would be between 38.3 MWh and 40.2 MWh with a mean value of 39.1 MWh which is only 1.3 MWh or 3.2% lower than the Austrian site evaluation. The total mean annual energy yield planning value of all sites (except Hamburg) is 39.7 MWh/year and 10 m units.
Concluding, the results give a low variation even under wide regional variation in sites within a similar latitude and a very low variation between different orientations. This proves that the PV-SÜD design is very robust towards the impact of site and orientation for its final yield values. This finding makes the planning of energy output for several 10 m-units at different sites easier for the final implementation of the stakeholders hosting the road network.
3.2. Results for the Demonstration Site (Hegau)
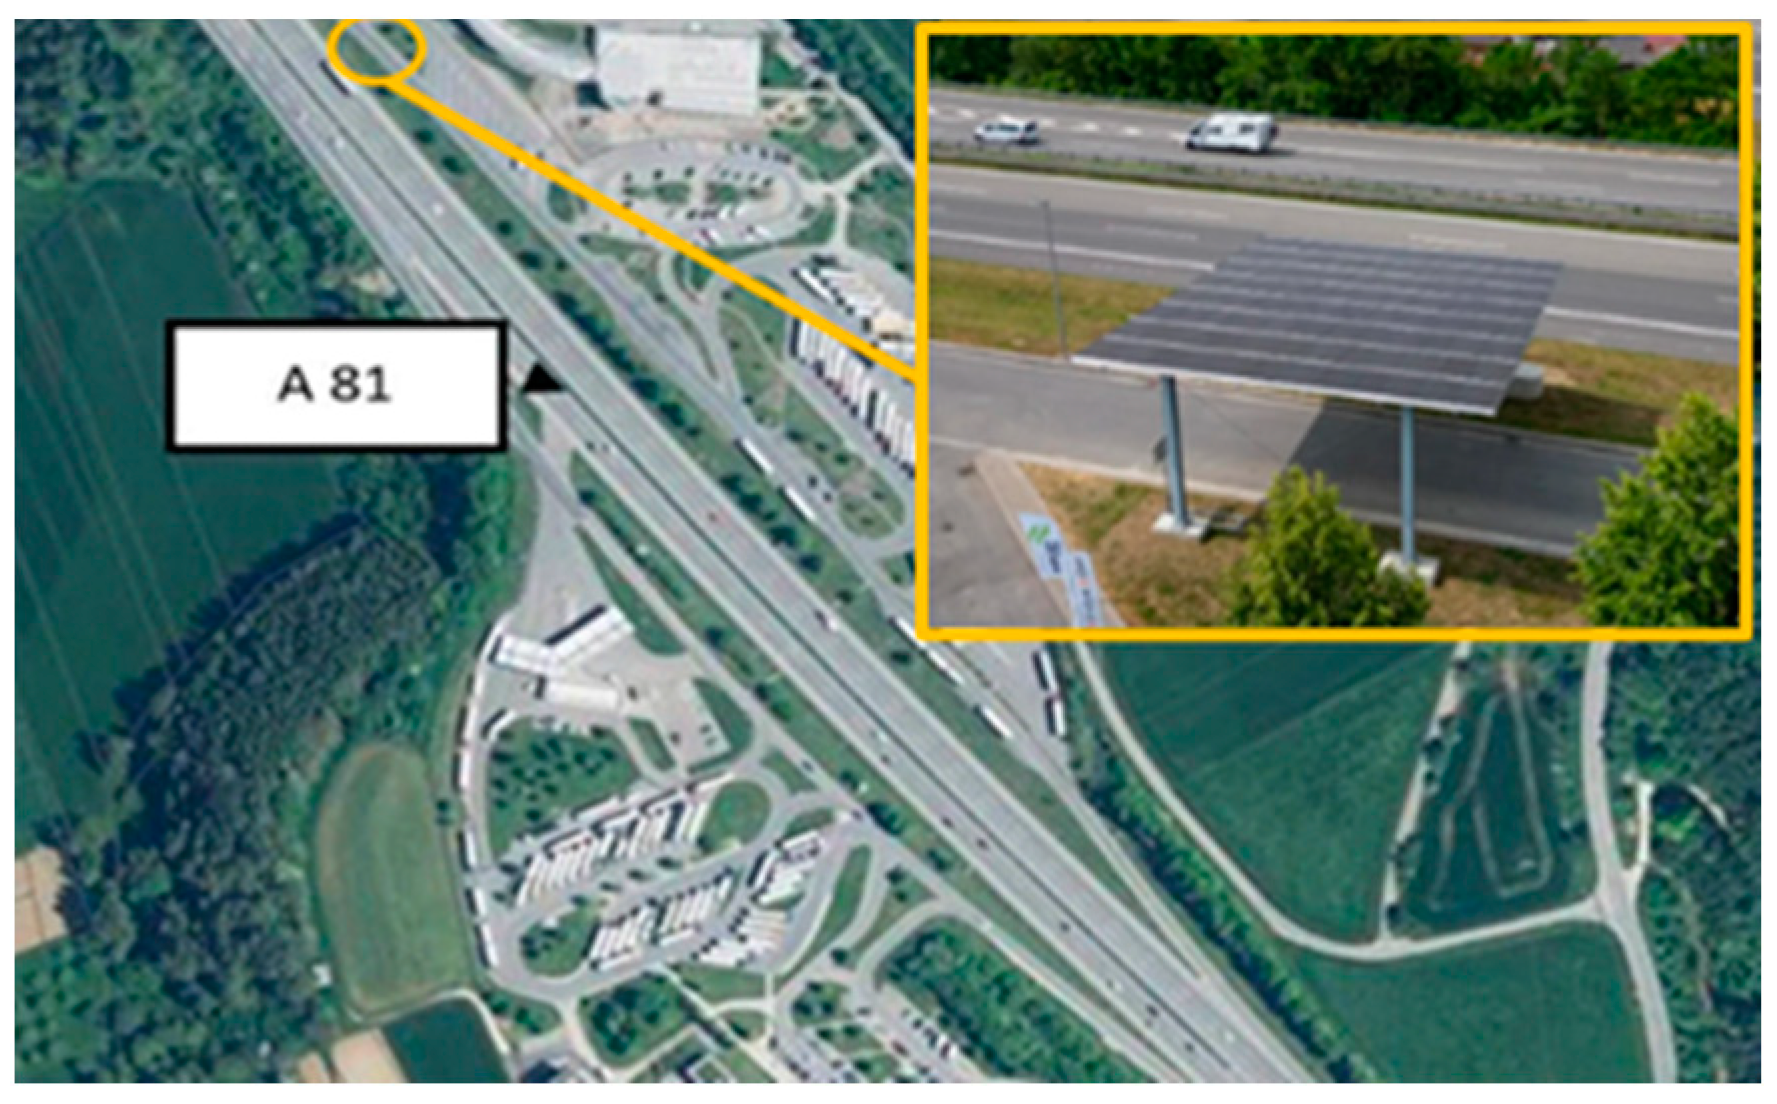
The positioning of the system for the purpose of the calculation is shown in Figure 9.
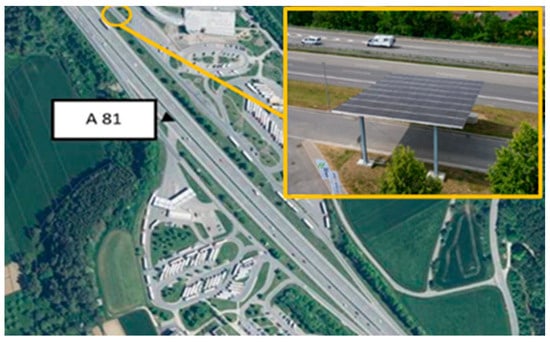
Figure 9.
Position of the PV-SÜD demonstrator at the Hegau site.
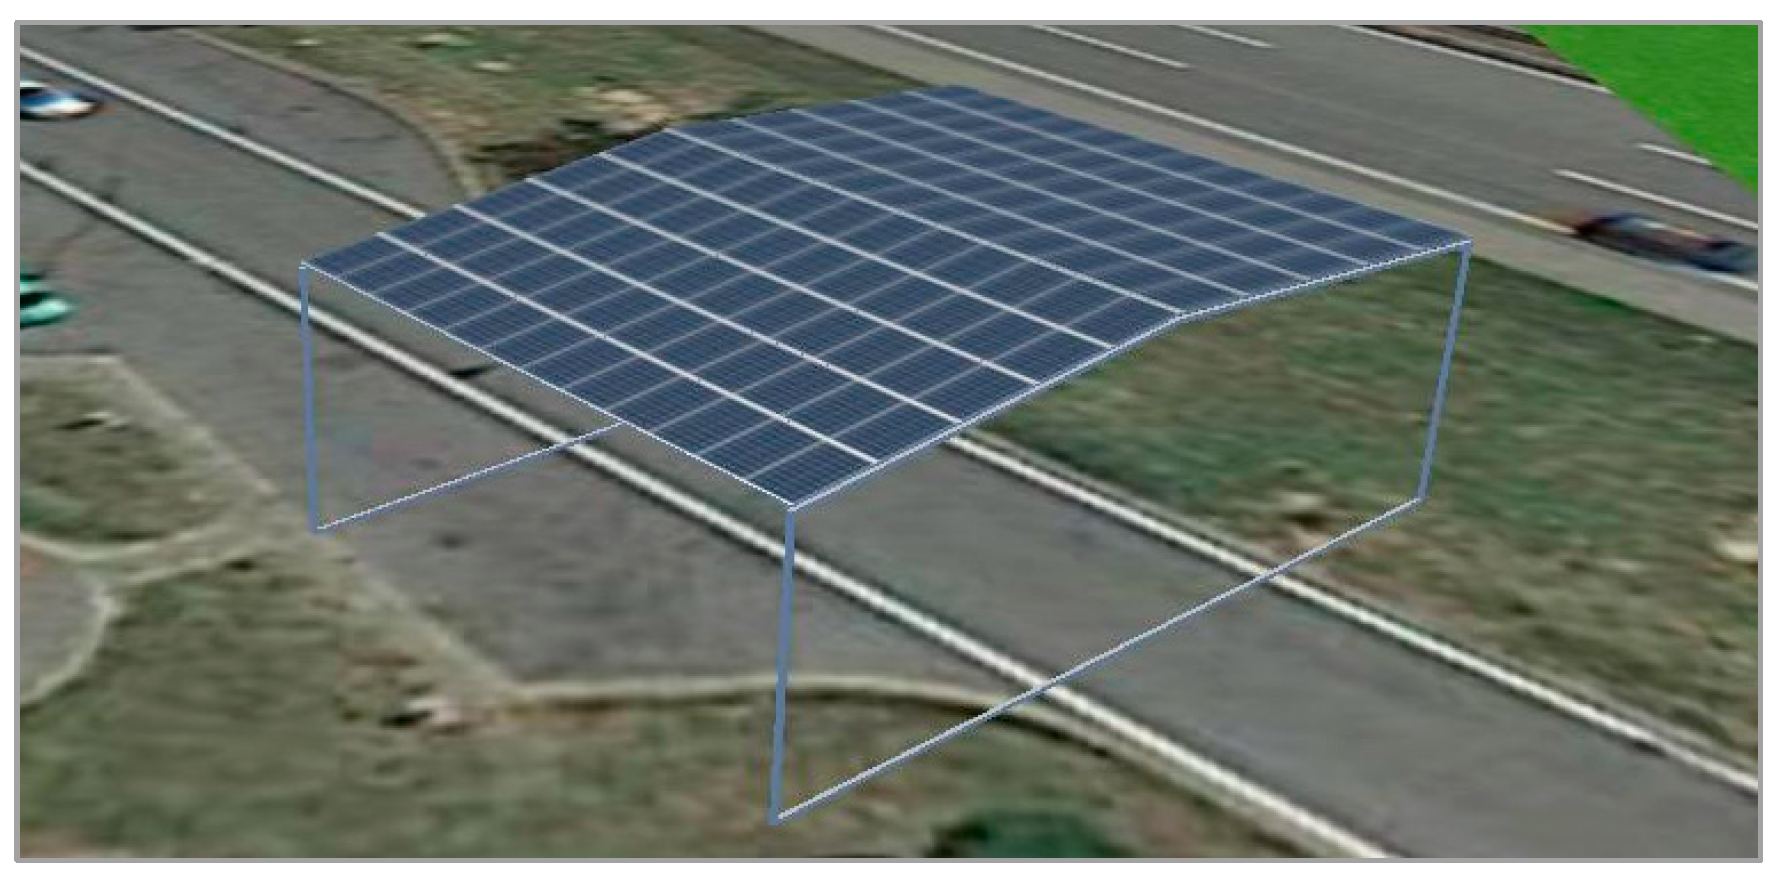
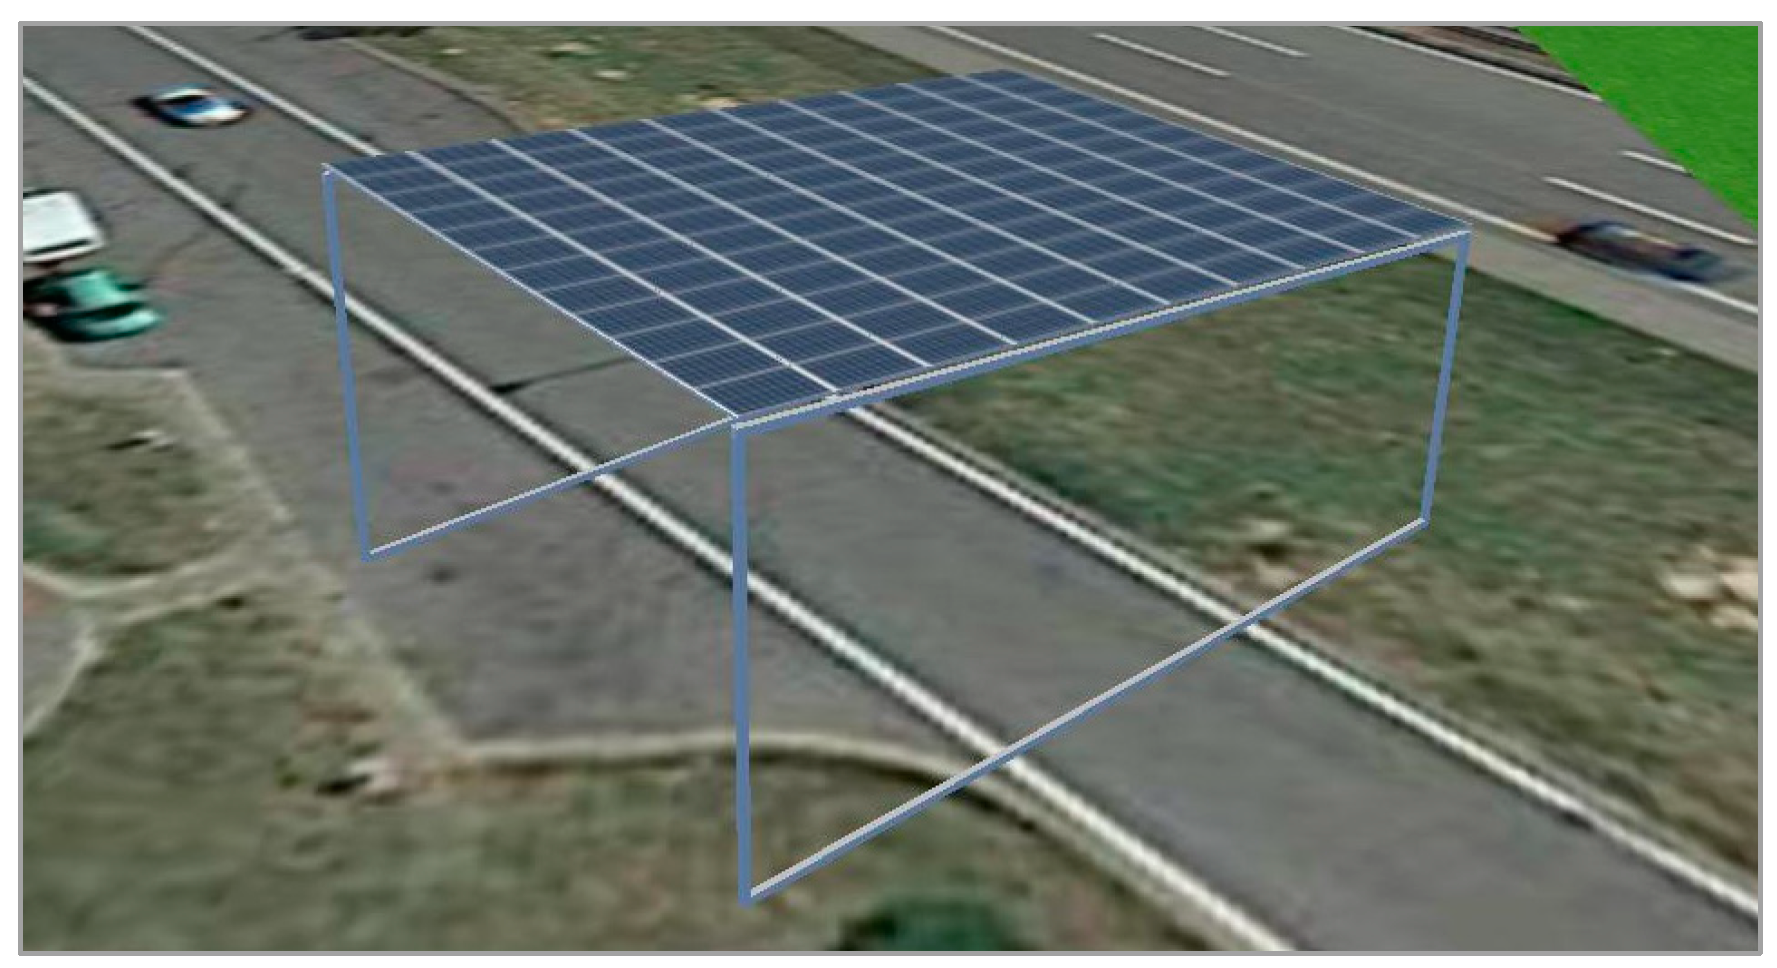
For both roof types (see Figure 10 and Figure 11), the energy yield calculation was performed over the course of the year. The monthly yield of the system in both configurations can be found in Figure 12.

Figure 10.
PV-SÜD demonstrator at the Hegau site: The roof-type variant is the gable roof.
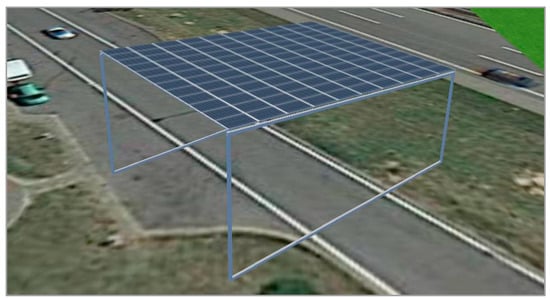
Figure 11.
PV-SÜD demonstrator at the Hegau site: The roof-type variant is the pent roof.
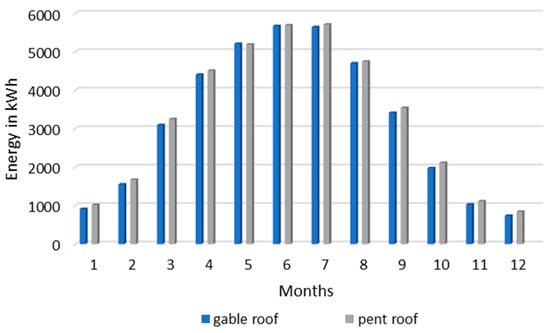
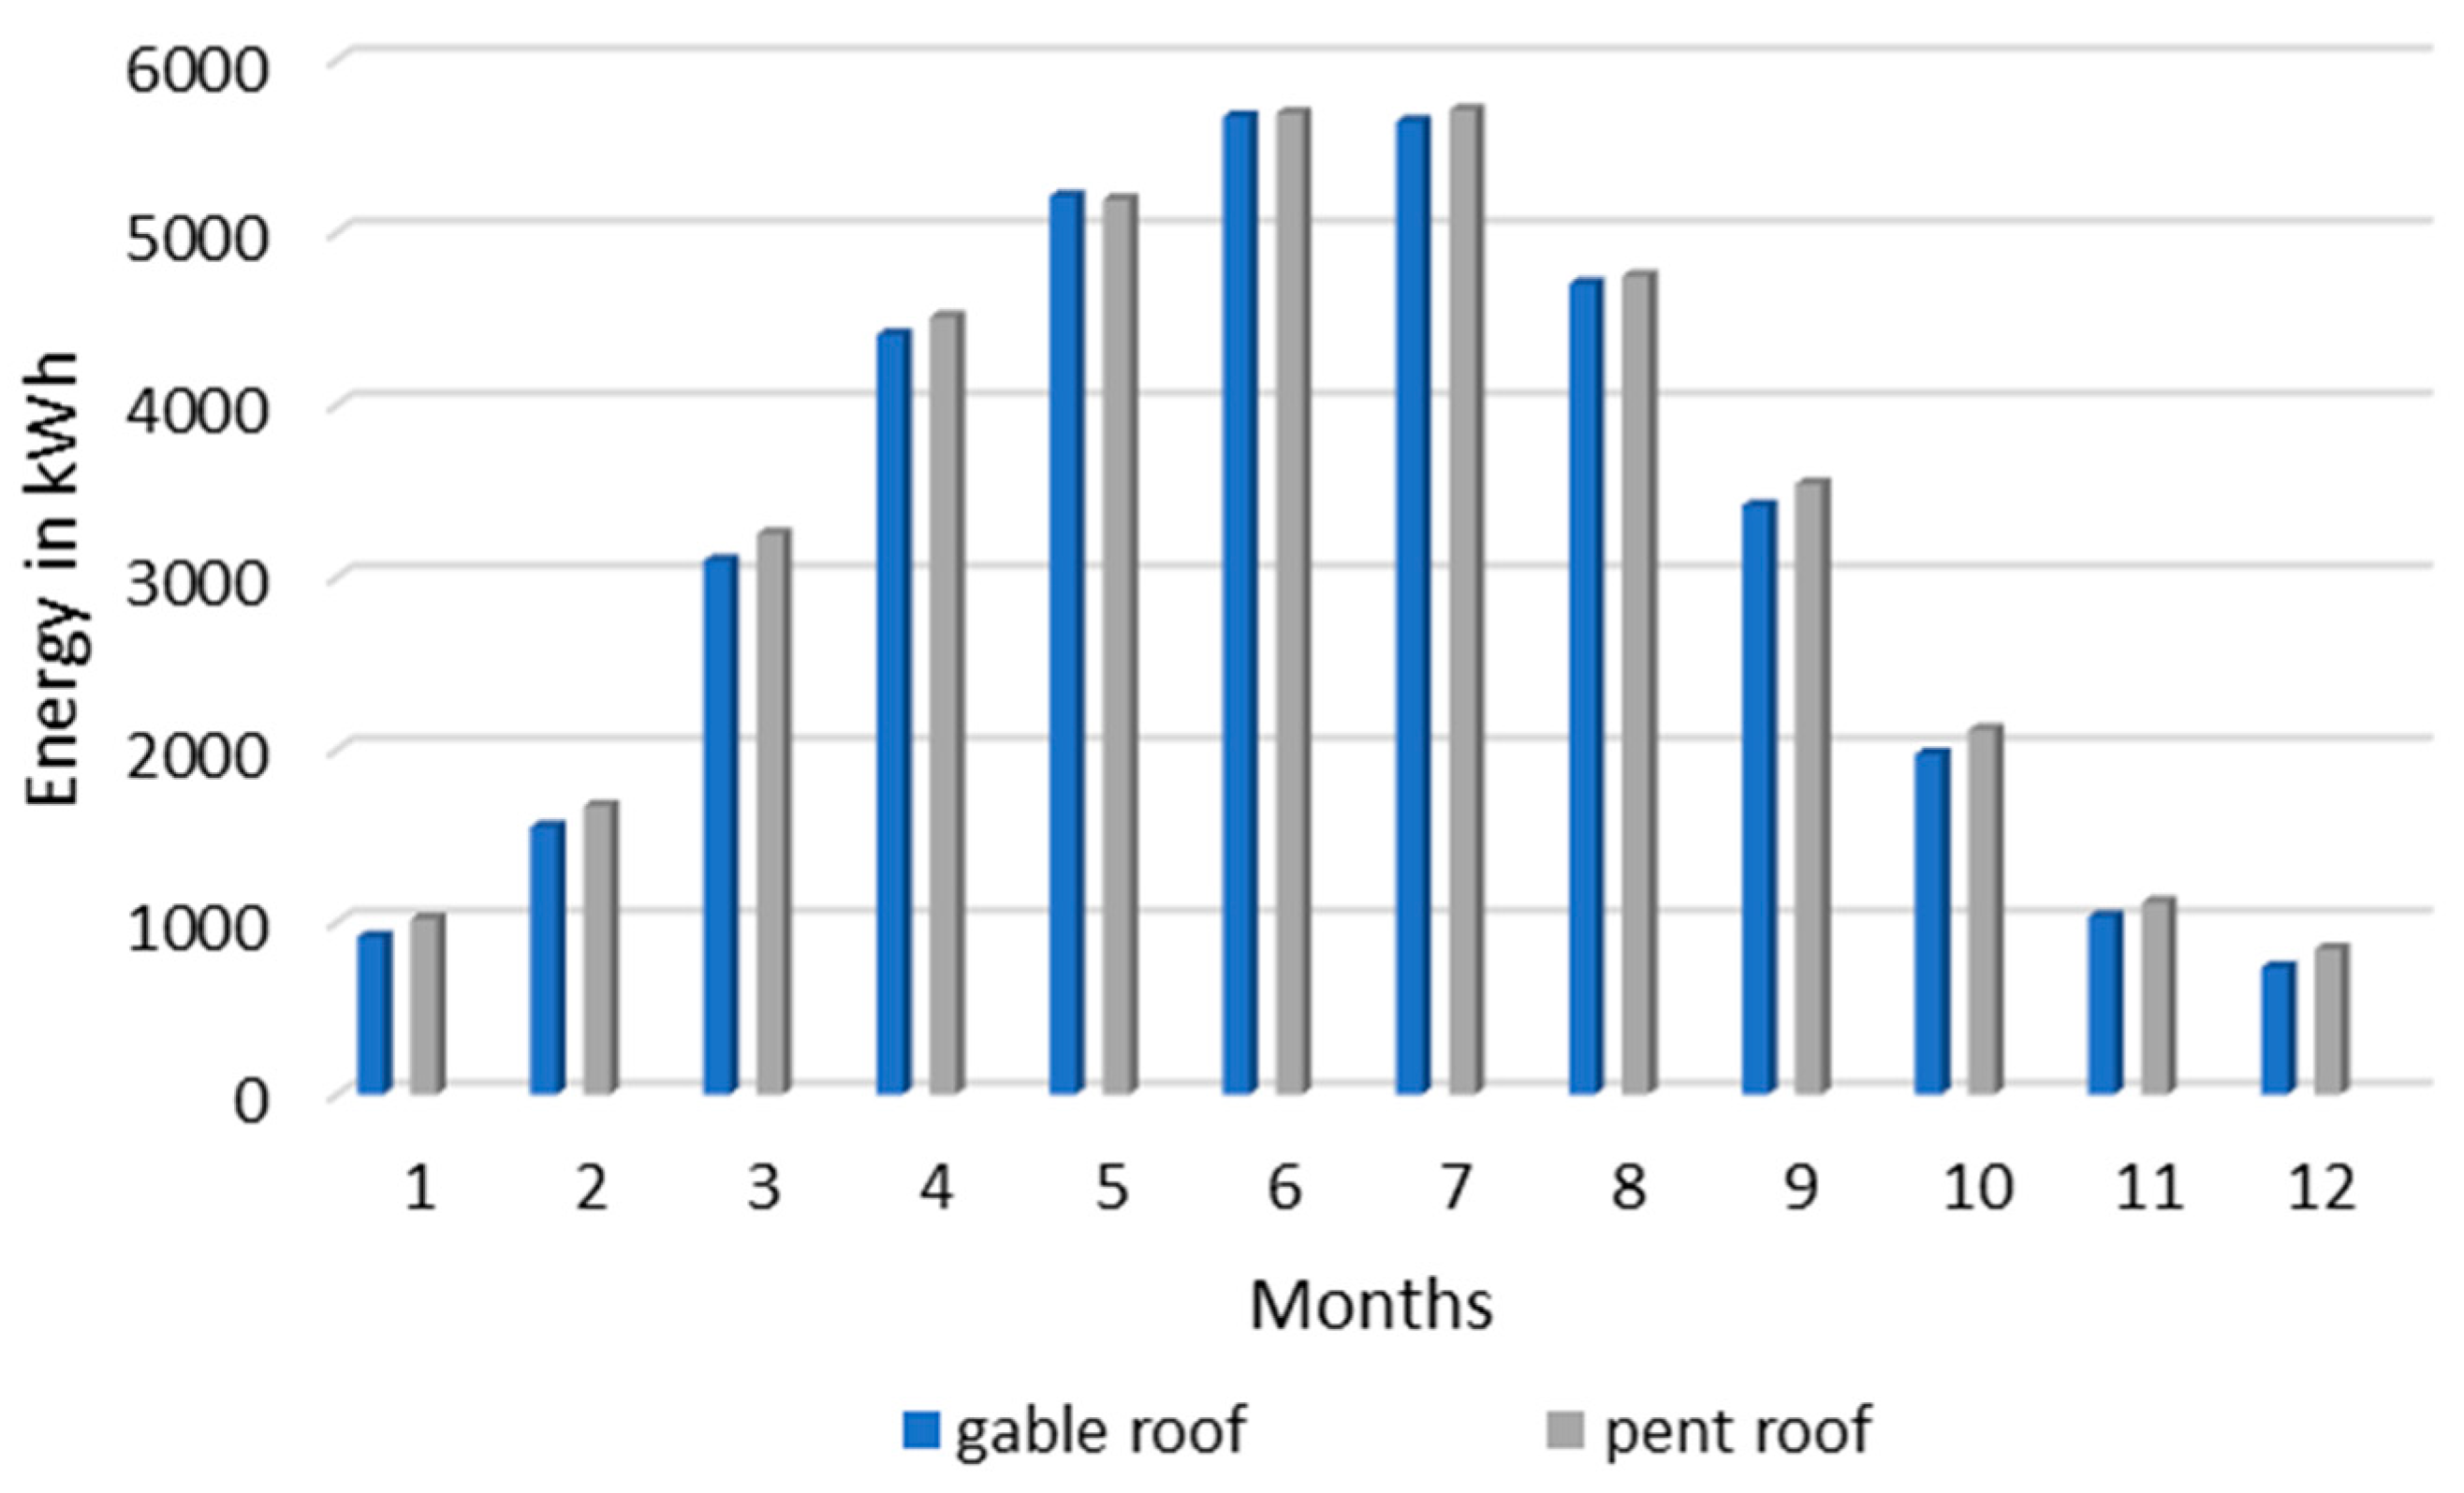
Figure 12.
PV-SÜD demonstrator at the Hegau site: Yield forecast for the gable roof and pent roof for monofacial module technology.
The Hegau site (A 81, Engen, LK Konstanz, with the GIS-coordinates: 47.82292° N, 8.785754° E) was chosen as the location for real demonstration because it has sufficient consumers and suitable access and infrastructure.
At the Hegau site, the PV system on the pent roof with 40° orientation to the west generates between 1% (August) and 14% (December) more energy over the year (in total ~3%) than the variant with the gable roof (E/W orientation); see Figure 12.
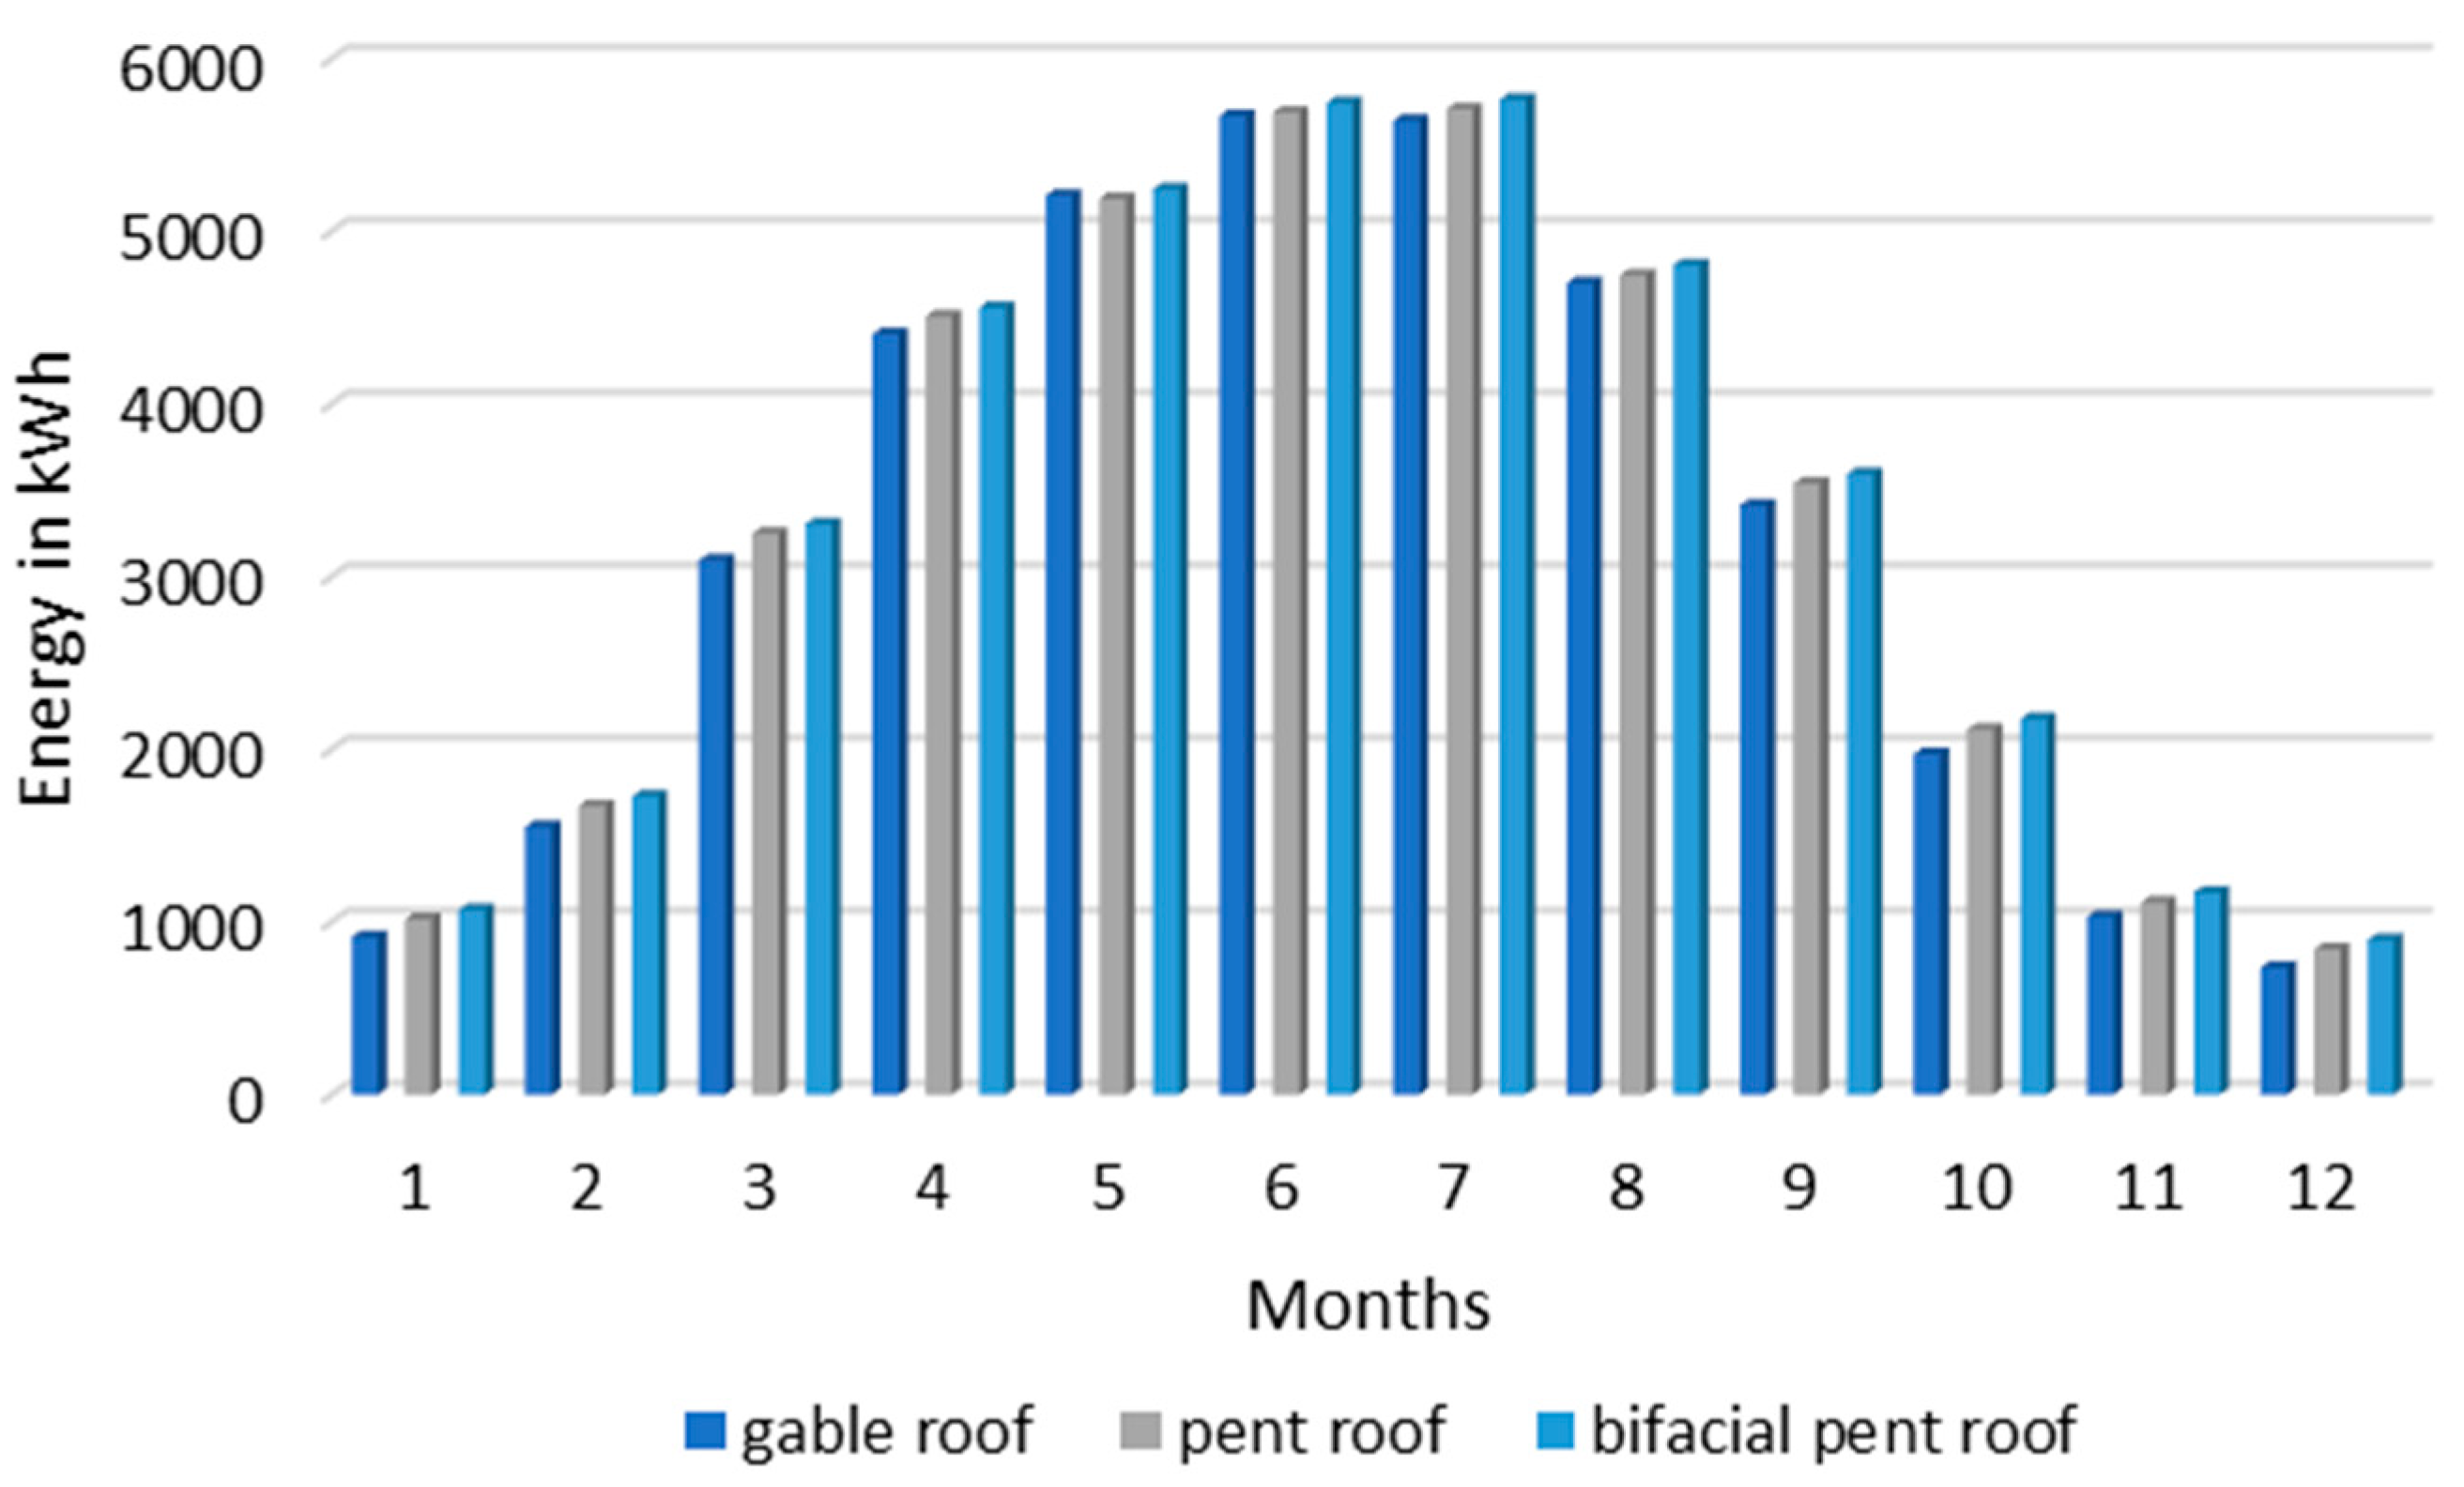
Further, different PV module technologies were compared at the Hegau site. The 37.8 kWp system (pent roof and gable roof) composed of monofacial modules was compared to a system of bifacial modules of the same nominal generator capacity. The yield predictions and system performance indicators for both technologies are summarized in Table 2 and Figure 13.
Table 2.
Comparison of different configurations and module technologies for the Hegau location.
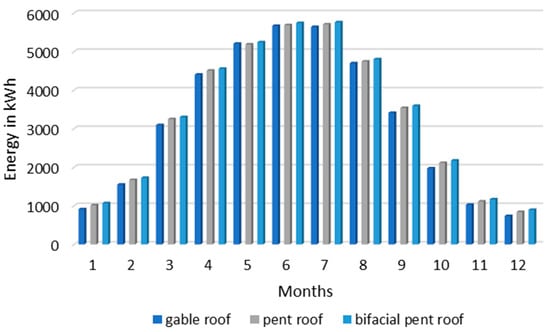
Figure 13.
Yield forecast per month over the course of the year in comparison between monofacial (gable roof and pent roof) and bifacial PV modules (pent roof).
The bifacial variant only increased the yield by about 0.67 MWh/year (1.7%) and the performance ratio by about 2.0%. Concluding, this simulation showed that the bifacial PV modules only provide a small additional yield in this case. The main reason might be the general system’s almost horizontal design and sizing and the low albedo values of the bitumen pavement.
3.3. Realization of PV-SÜD Demonstrator (Hegau)
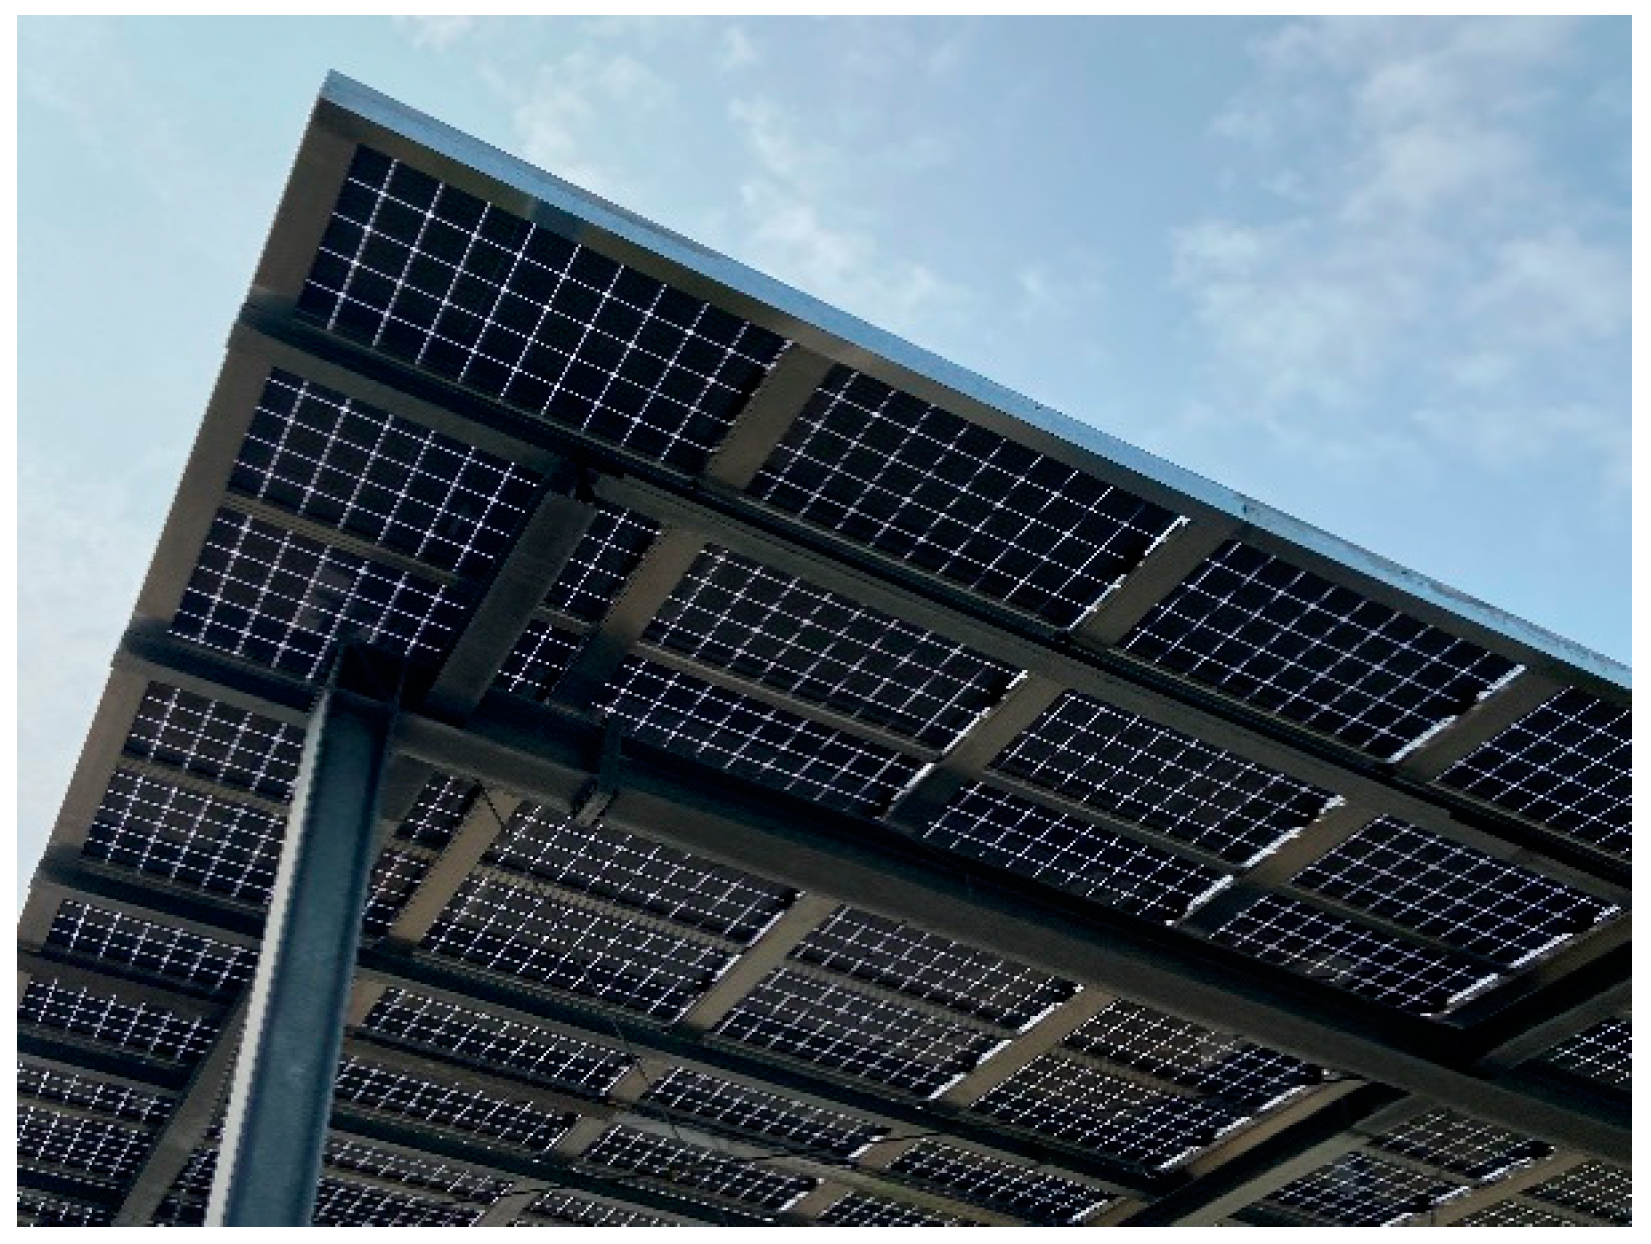
After comparing all of the results, the roof-type variant pent roof was selected for the realization of the PV-SÜD demonstrator and the demonstrator was built roofing one of the exit lanes of the motorway station at the Hegau site (see Figure 14 and Figure 15).
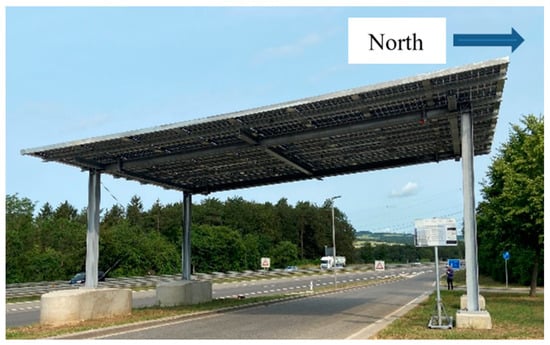
Figure 14.
Final PV-SÜD demonstrator at the Hegau site (Engen). View from the motorway station along the exit lane towards the highway. @AIT.

Figure 15.
Final PV-SÜD demonstrator at the Hegau site, with the view from below showing the overhead proof of glass–glass PV modules with the dedicated water draining supporting structure @AIT.
The demonstrator consists of a 12 m × 14 m roof surface made of photovoltaic modules, which stands about 5.50 m above the roadway on a steel structure. The demonstrator is located in the area of the heavy goods lane running parallel to the A81 freeway at the “Im Hegau—Ost” service station near Singen in Baden-Württemberg.
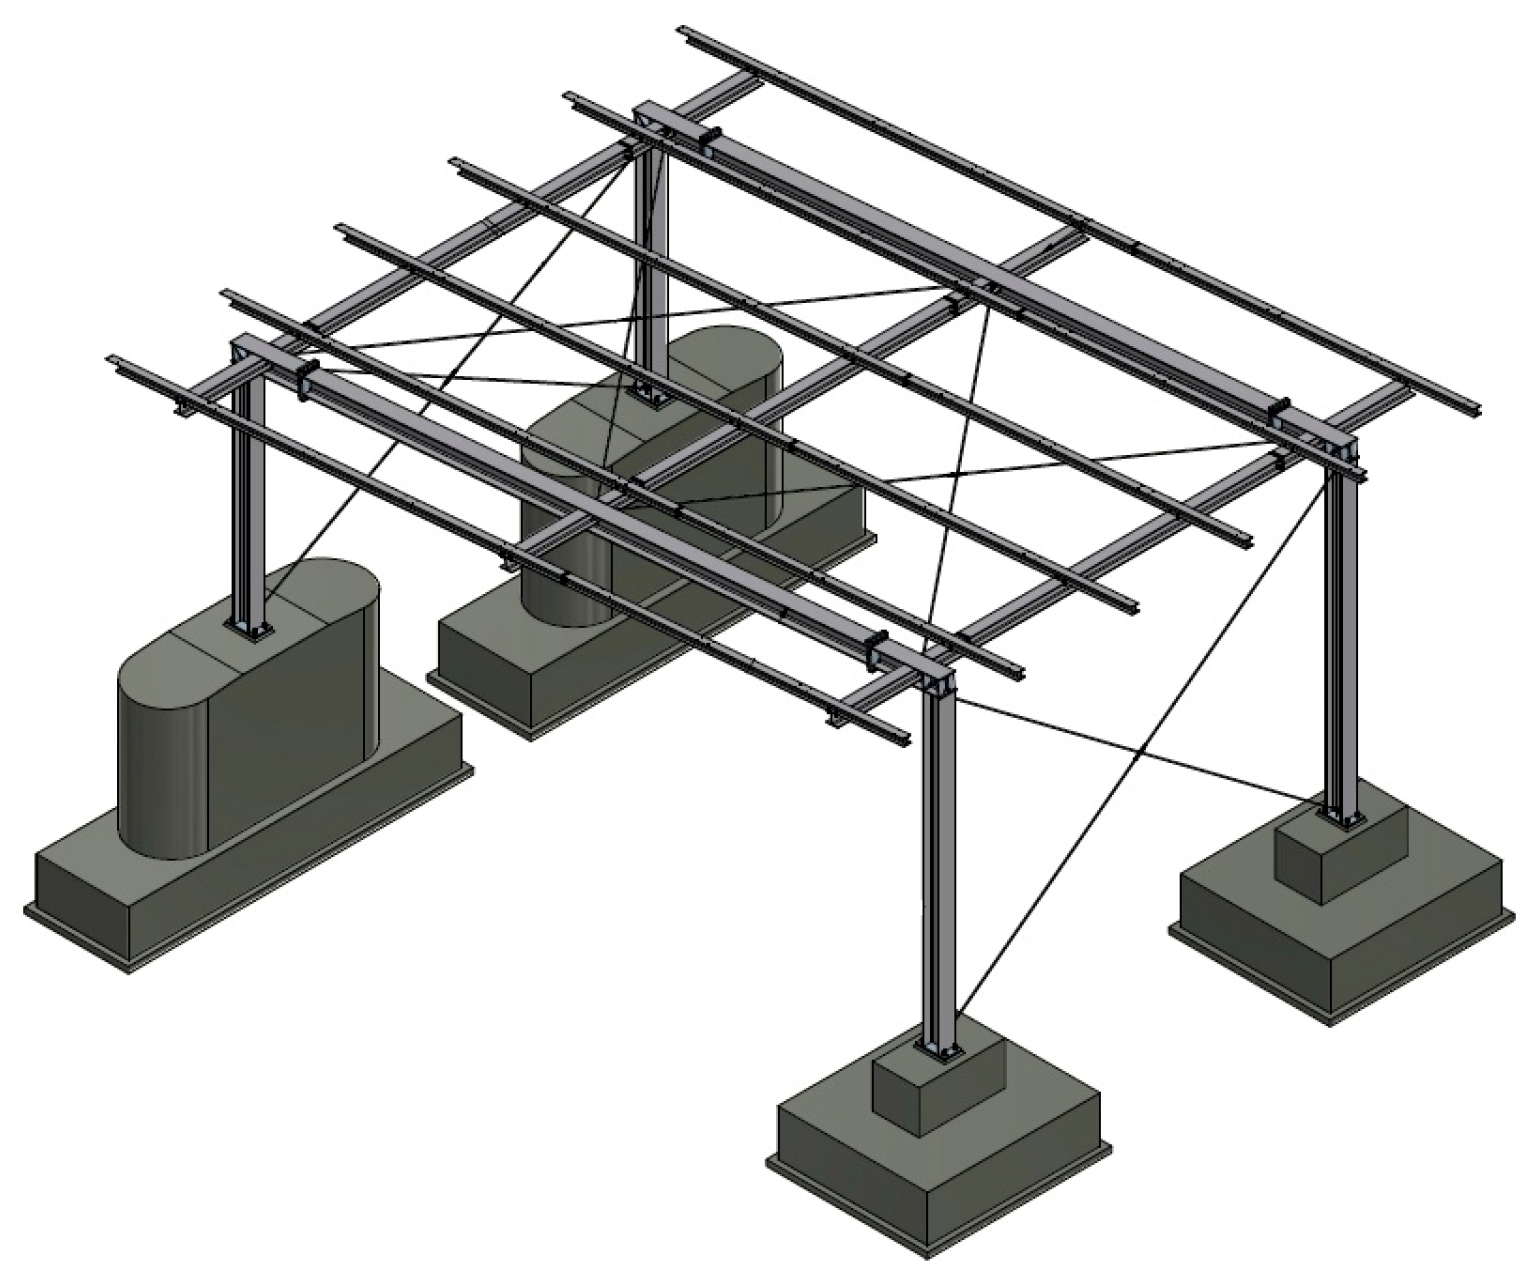
The structure and the construction layout of the demonstrator are shown in Figure 16.
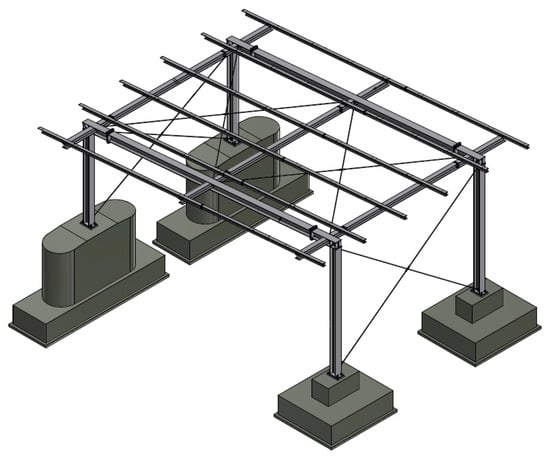
Figure 16.
Structure of the PV-SÜD demonstrator.
The total investment for the final installation were 225.000 EUR (demonstrator costs of 2023). Assuming an electricity retail price range for Germany, in the years 2023–2024, between 25 EUR/MWh and 40 EUR/MWh, payback time would be achieved after 14.2 years–22.7 years, respectively. Please note that the investment costs include the costs for the total installation, whereas the PV system alone sums up to a maximum of 30% of this cost, depending on the modules’ types and configuration.
3.3.1. PV Module Used for the PV-SÜD Demonstrator
For the PV-SÜD demonstrator, glass–glass modules with PERC solar cells from SOLARWATT GmbH were used. The electrical module data are given in Table 3.
Table 3.
Data from SOLARWATT Vision 60 M construct.
- General Module Data: Vision 60 M construct.
- Module technology: Glass-glass laminate, aluminum frame, black.
- Covering material: Tempered solar float glass 2 mm, anti-reflective finish.
- Encapsulant: Solar cells in polymer encapsulation, transparent.
- Backing material: Tempered float glass, 2 mm.
- Solar cells: 60 monocrystalline high-power PERC solar cells, 157 mm × 157 mm.
- Module dimensions: L × W × H/Weight: 1.680 ± 2 × 990 ± 2 × 40 ± 0.3 mm/weight: appr. 22.8 kg
- Protection class: II (acc. to IEC 61140).
- Fire class: A (acc. to IEC 61730/UL 790), E (acc. to EN 13501-1), BROOF (t1) (acc. to EN 13501-5).
- Certified mechanical ratings as per IEC 61215: Suction load up to 2.400 Pa (test load 3.600 Pa), Pressure load up to 5.400 Pa (test load 8.100 Pa).
- Qualifications: IEC 61215 (incl. LeTID)|IEC 61730|IEC 61701|IEC 62804|IEC 62716 [17,18,19,20,21,22,23,24,25].
At AIT, additionally an insulation test was successfully performed on two modules.
3.3.2. Inverter Used for the PV-SÜD Demonstrator
The three-phase Fronius Eco in the power category 27 kW was used for the demonstrator (see Table 4). The transformer-less inverter is of the IP 66 protection class.
Table 4.
Inverter data.
3.3.3. Vibration Test of the PV-SÜD Demonstrator
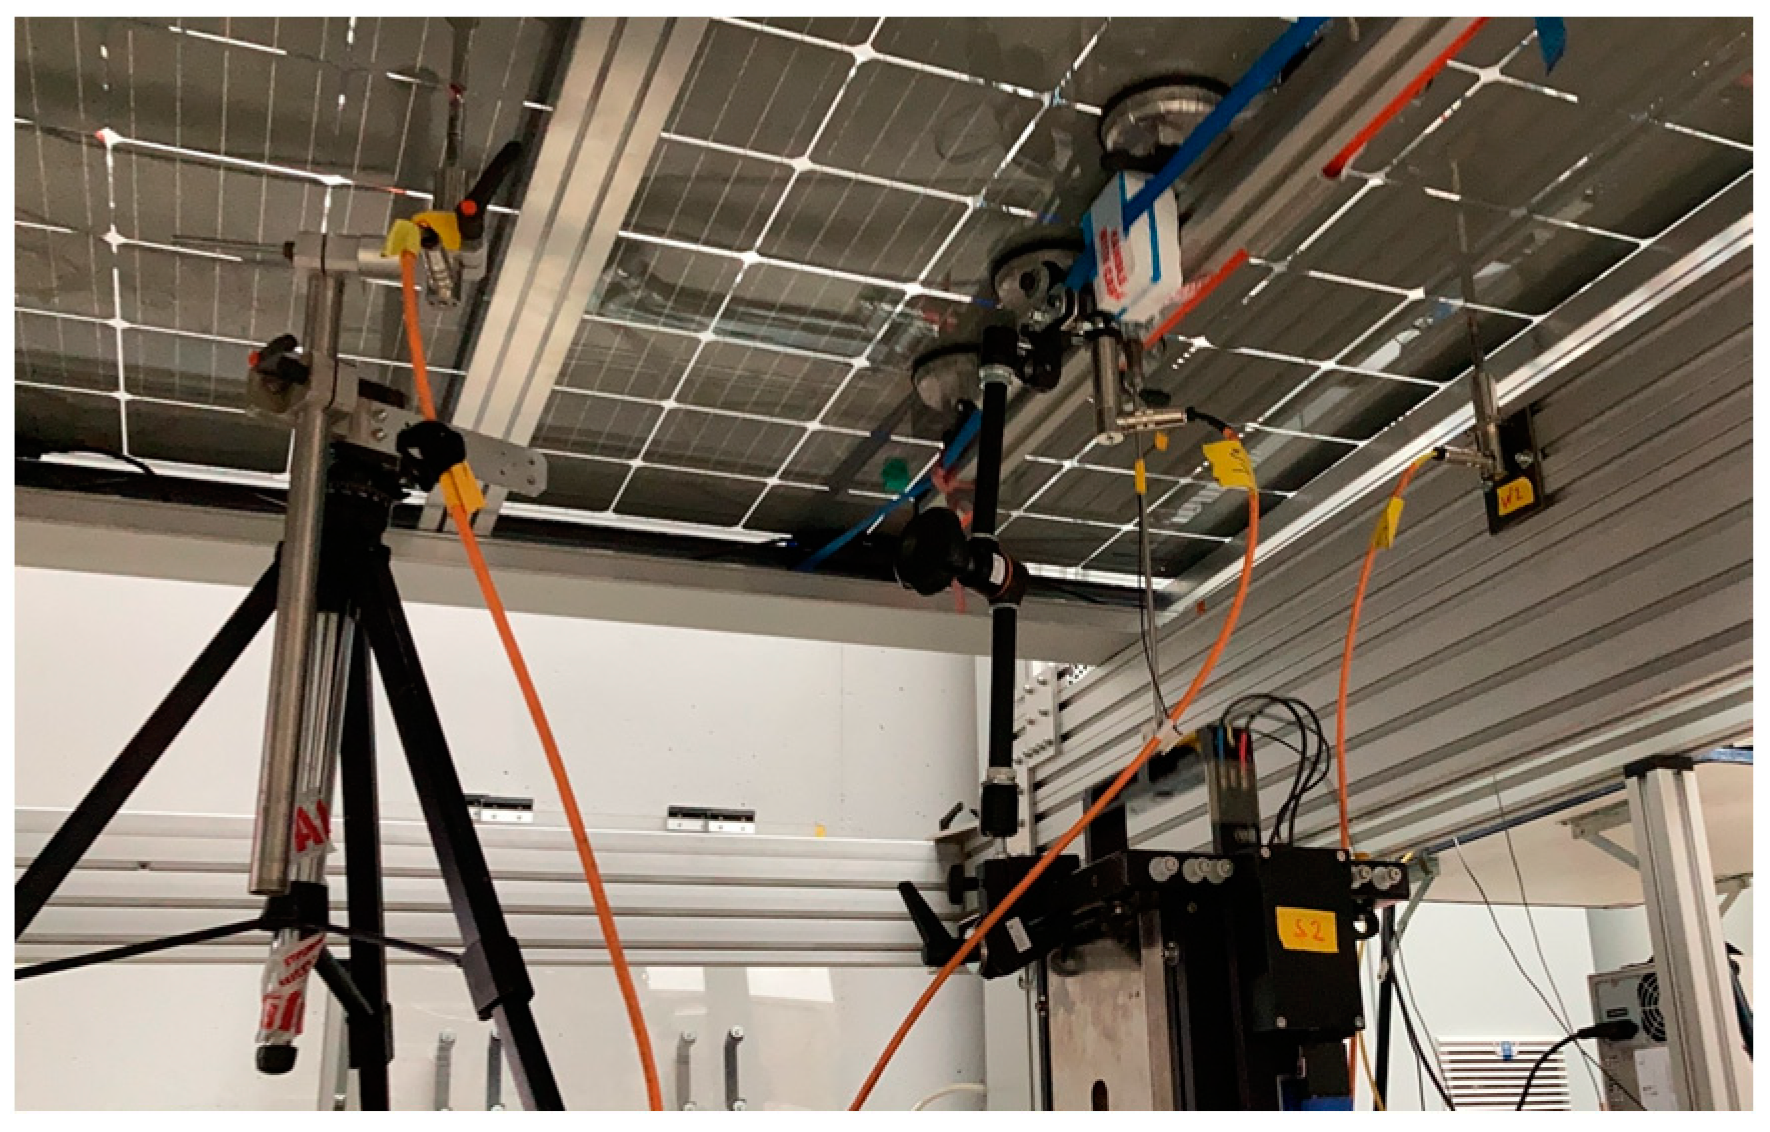
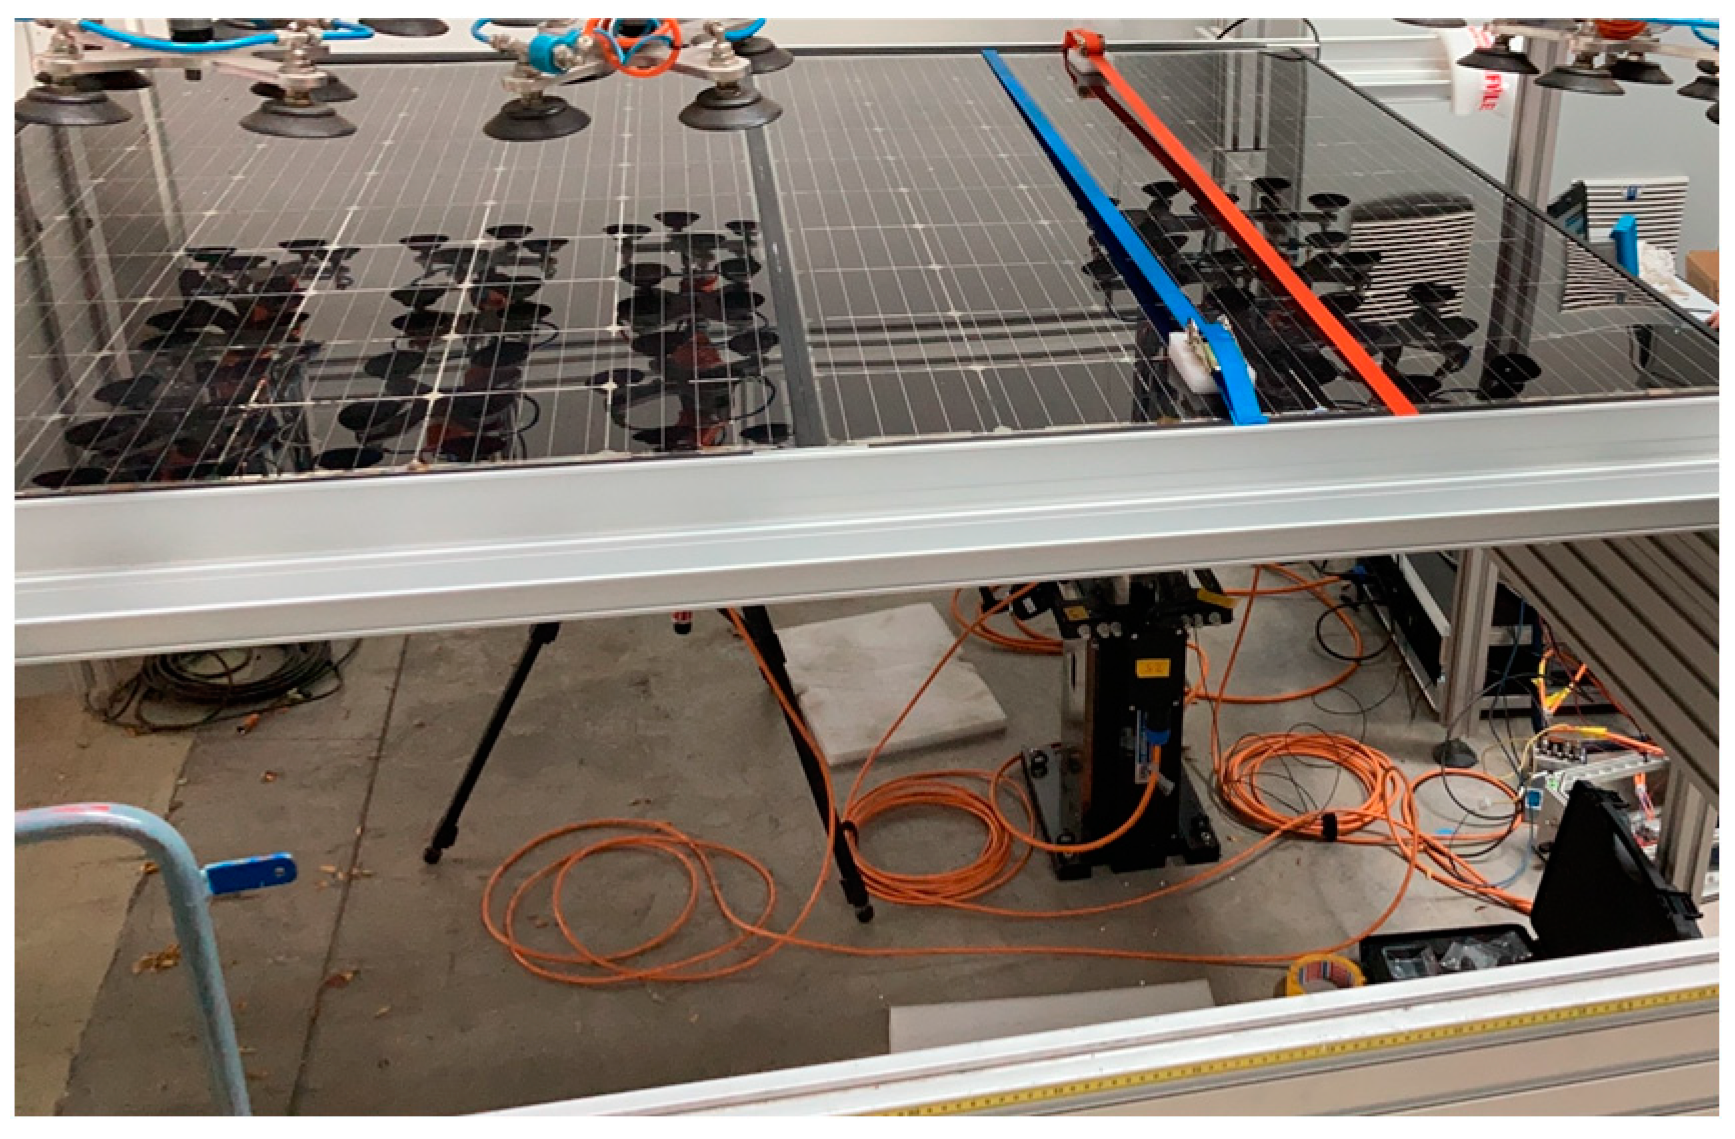
Vibration tests of two PV modules were performed using a mechanical shaker and vibrational testing setup to prove the mechanical stability for highway roofing integration. Representing the PV-SÜD installation, the modules were tested using the same distance and mounting structure. Figure 17 and Figure 18 show images of the vibration test setup in bottom and top views.
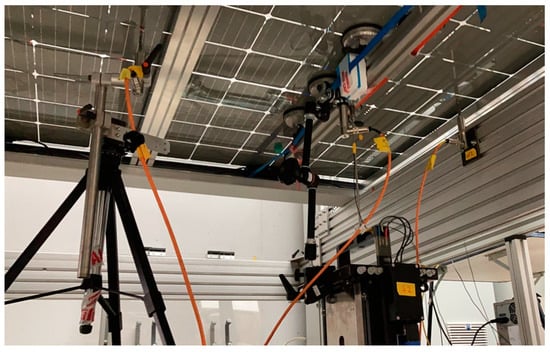
Figure 17.
Vibration-test setup, bottom view.
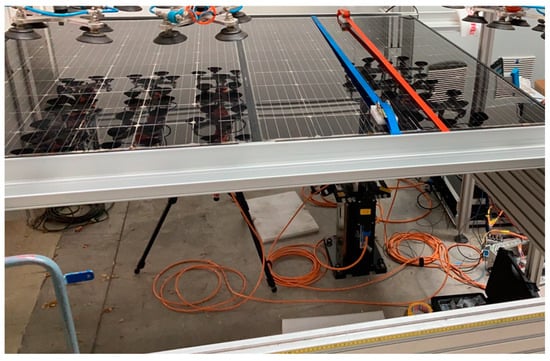
Figure 18.
Vibration-test setup, top view.
Three distance sensors were mounted to measure the deflection and a shaker was mounted on the bottom of the modules. Loads up to +73 Pa (133 N) were applied to the test modules. The maximum module-deflection was 2.2 mm (Sensor 1 : 2.2 mm, Sensor 2: 1.1 mm; and Sensor 3: 0.38 mm). In total, 8 million cycles were performed. The fundamental frequency measured at a tunnel ceiling, with large and fast trucks passing underneath, is around 1 Hz.
The vibration testing in the experiment was performed at a much higher frequency of 37.5 Hz, so that the module’s force to deflection ratio equals the one measured at 1 Hz [26,27].
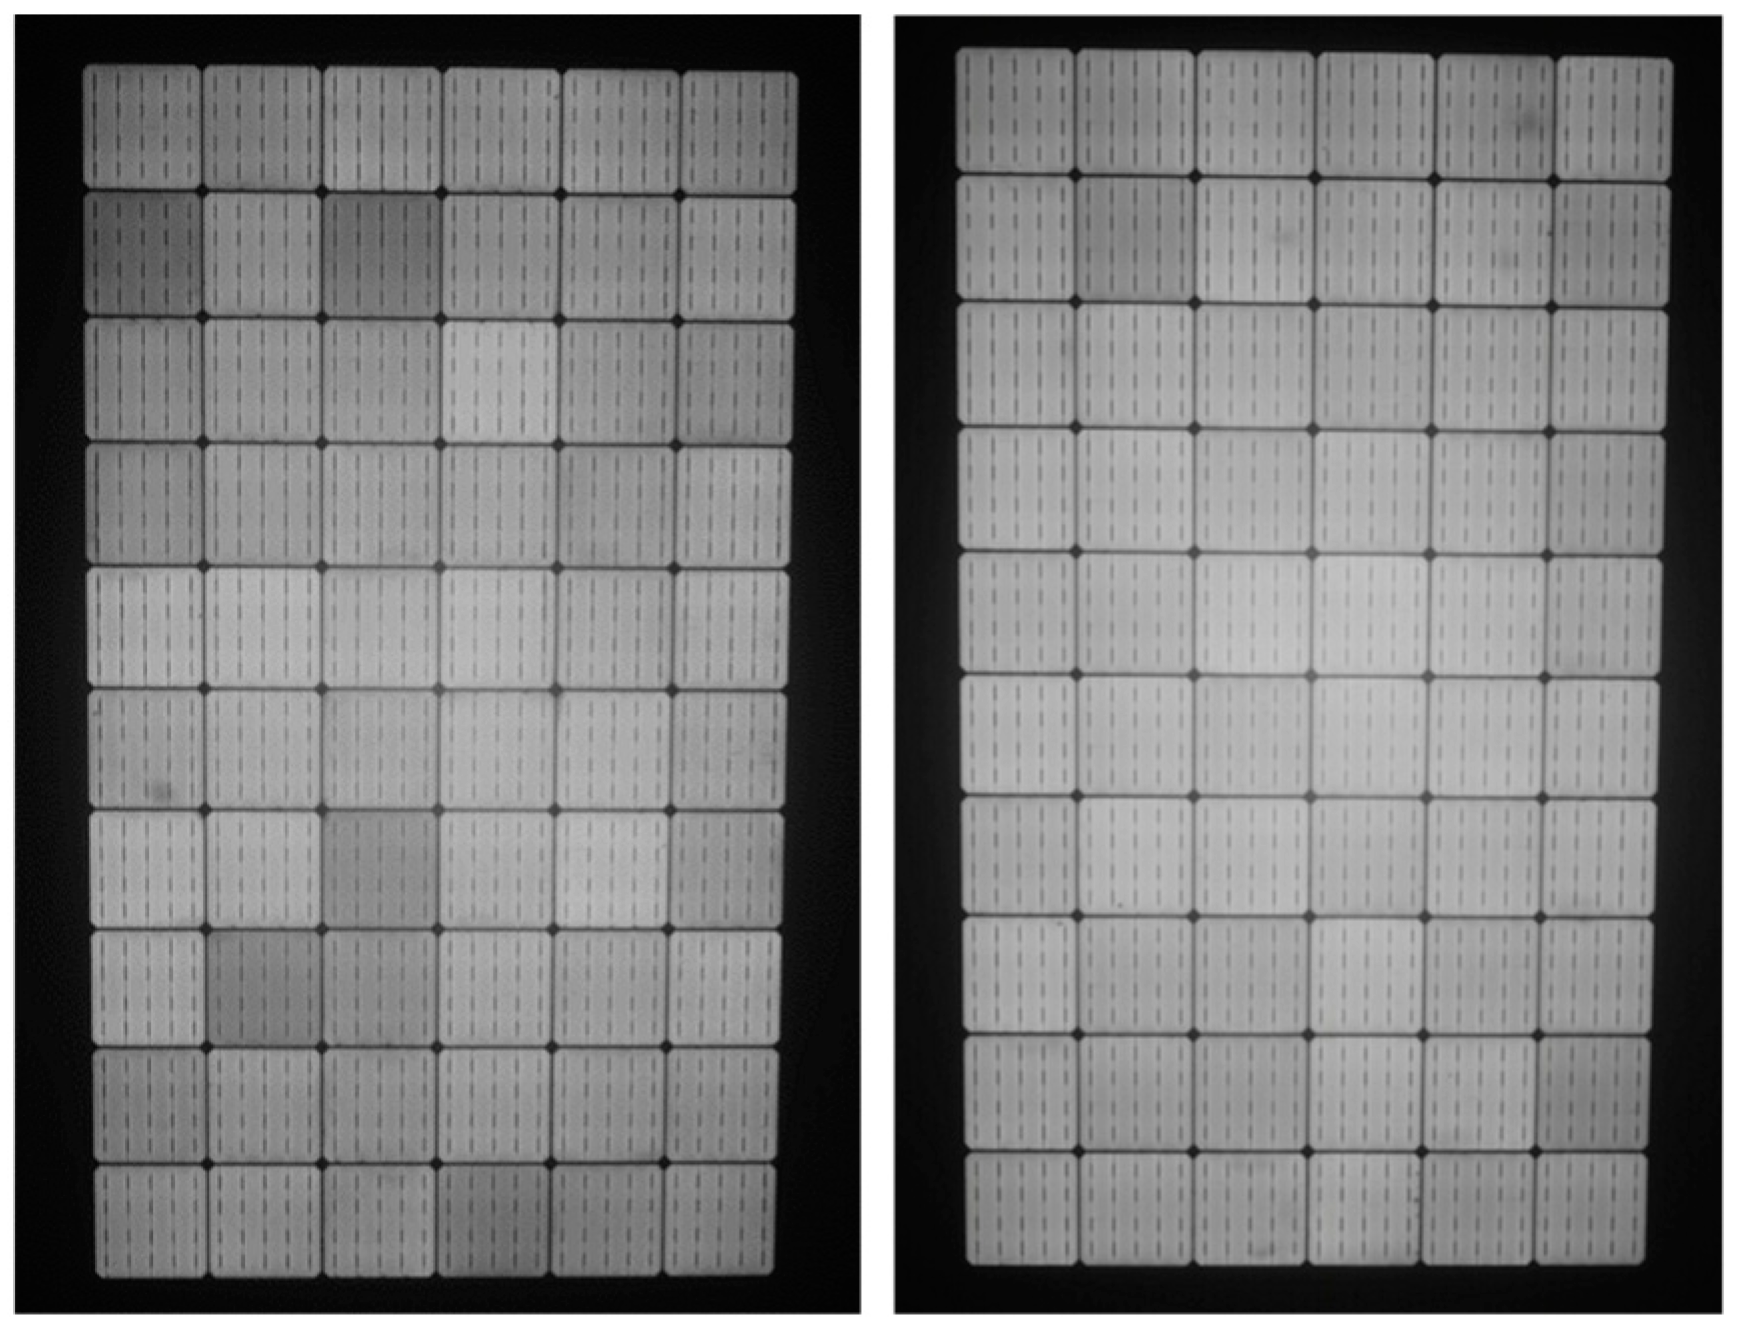
Figure 19 and Figure 20 depict the EL images of Module 1 and Module 2 before and after the performed vibration tests. Module 2 was the stimulated module and Module 1 resonated.
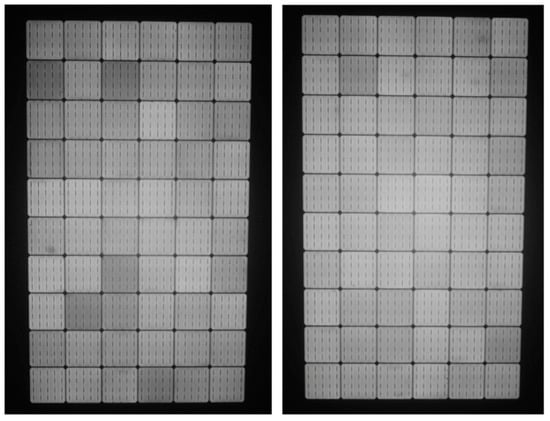
Figure 19.
Initial EL images of Module 1 (left) and Module 2 (right).
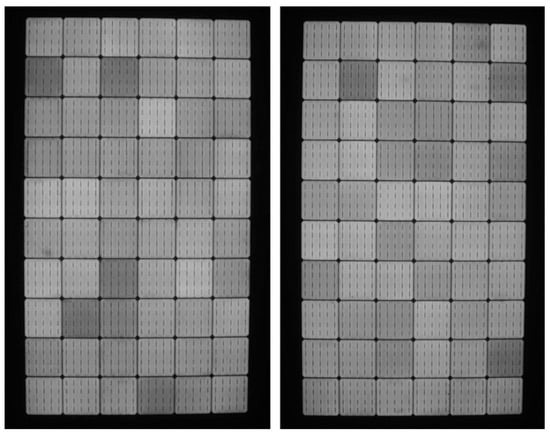
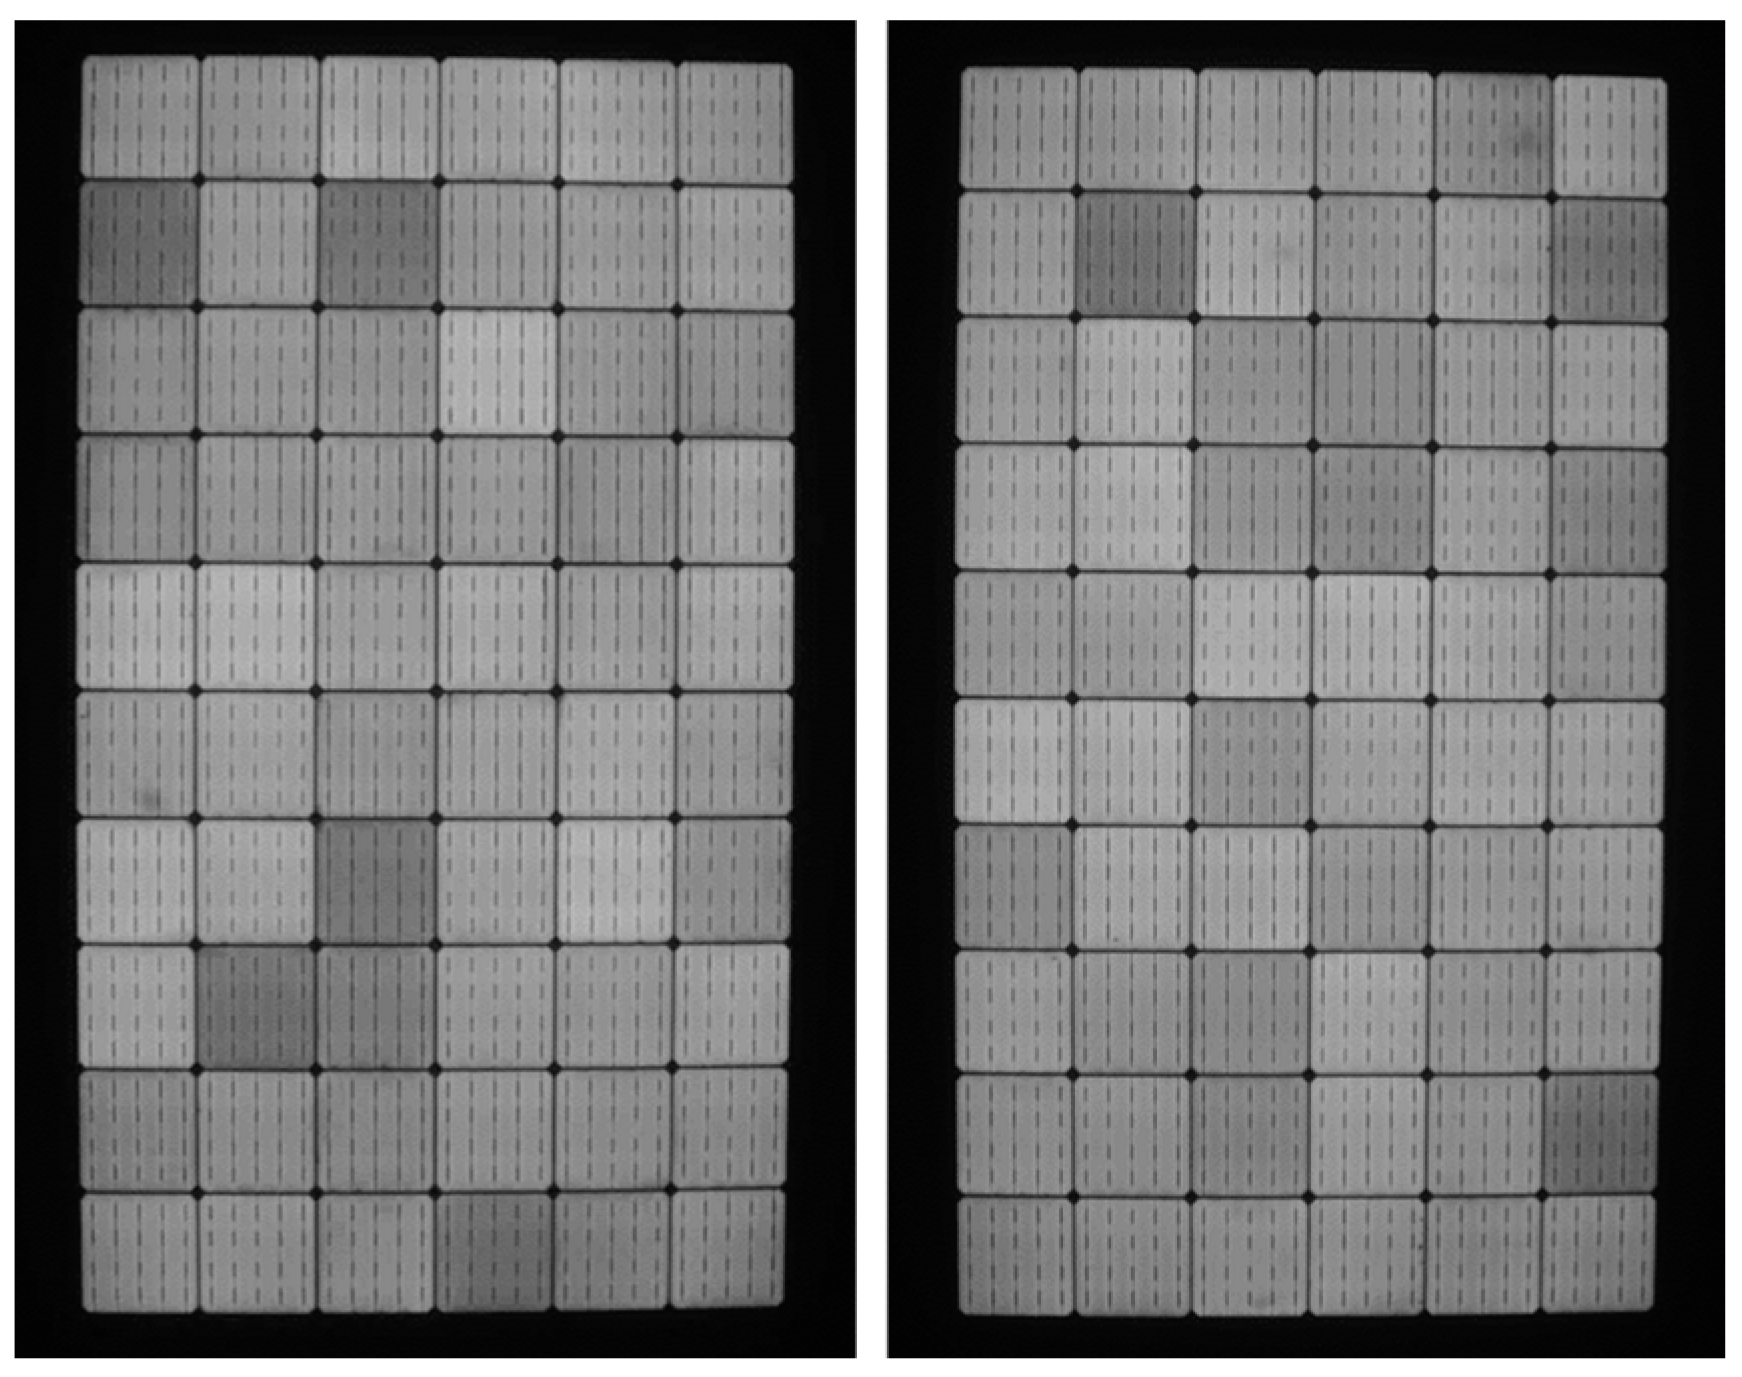
Figure 20.
EL images of Module 1 (left) and Module 2 (right) after vibration testing.
The EL images of Module 1 before and after the vibration test seem to be almost similar.
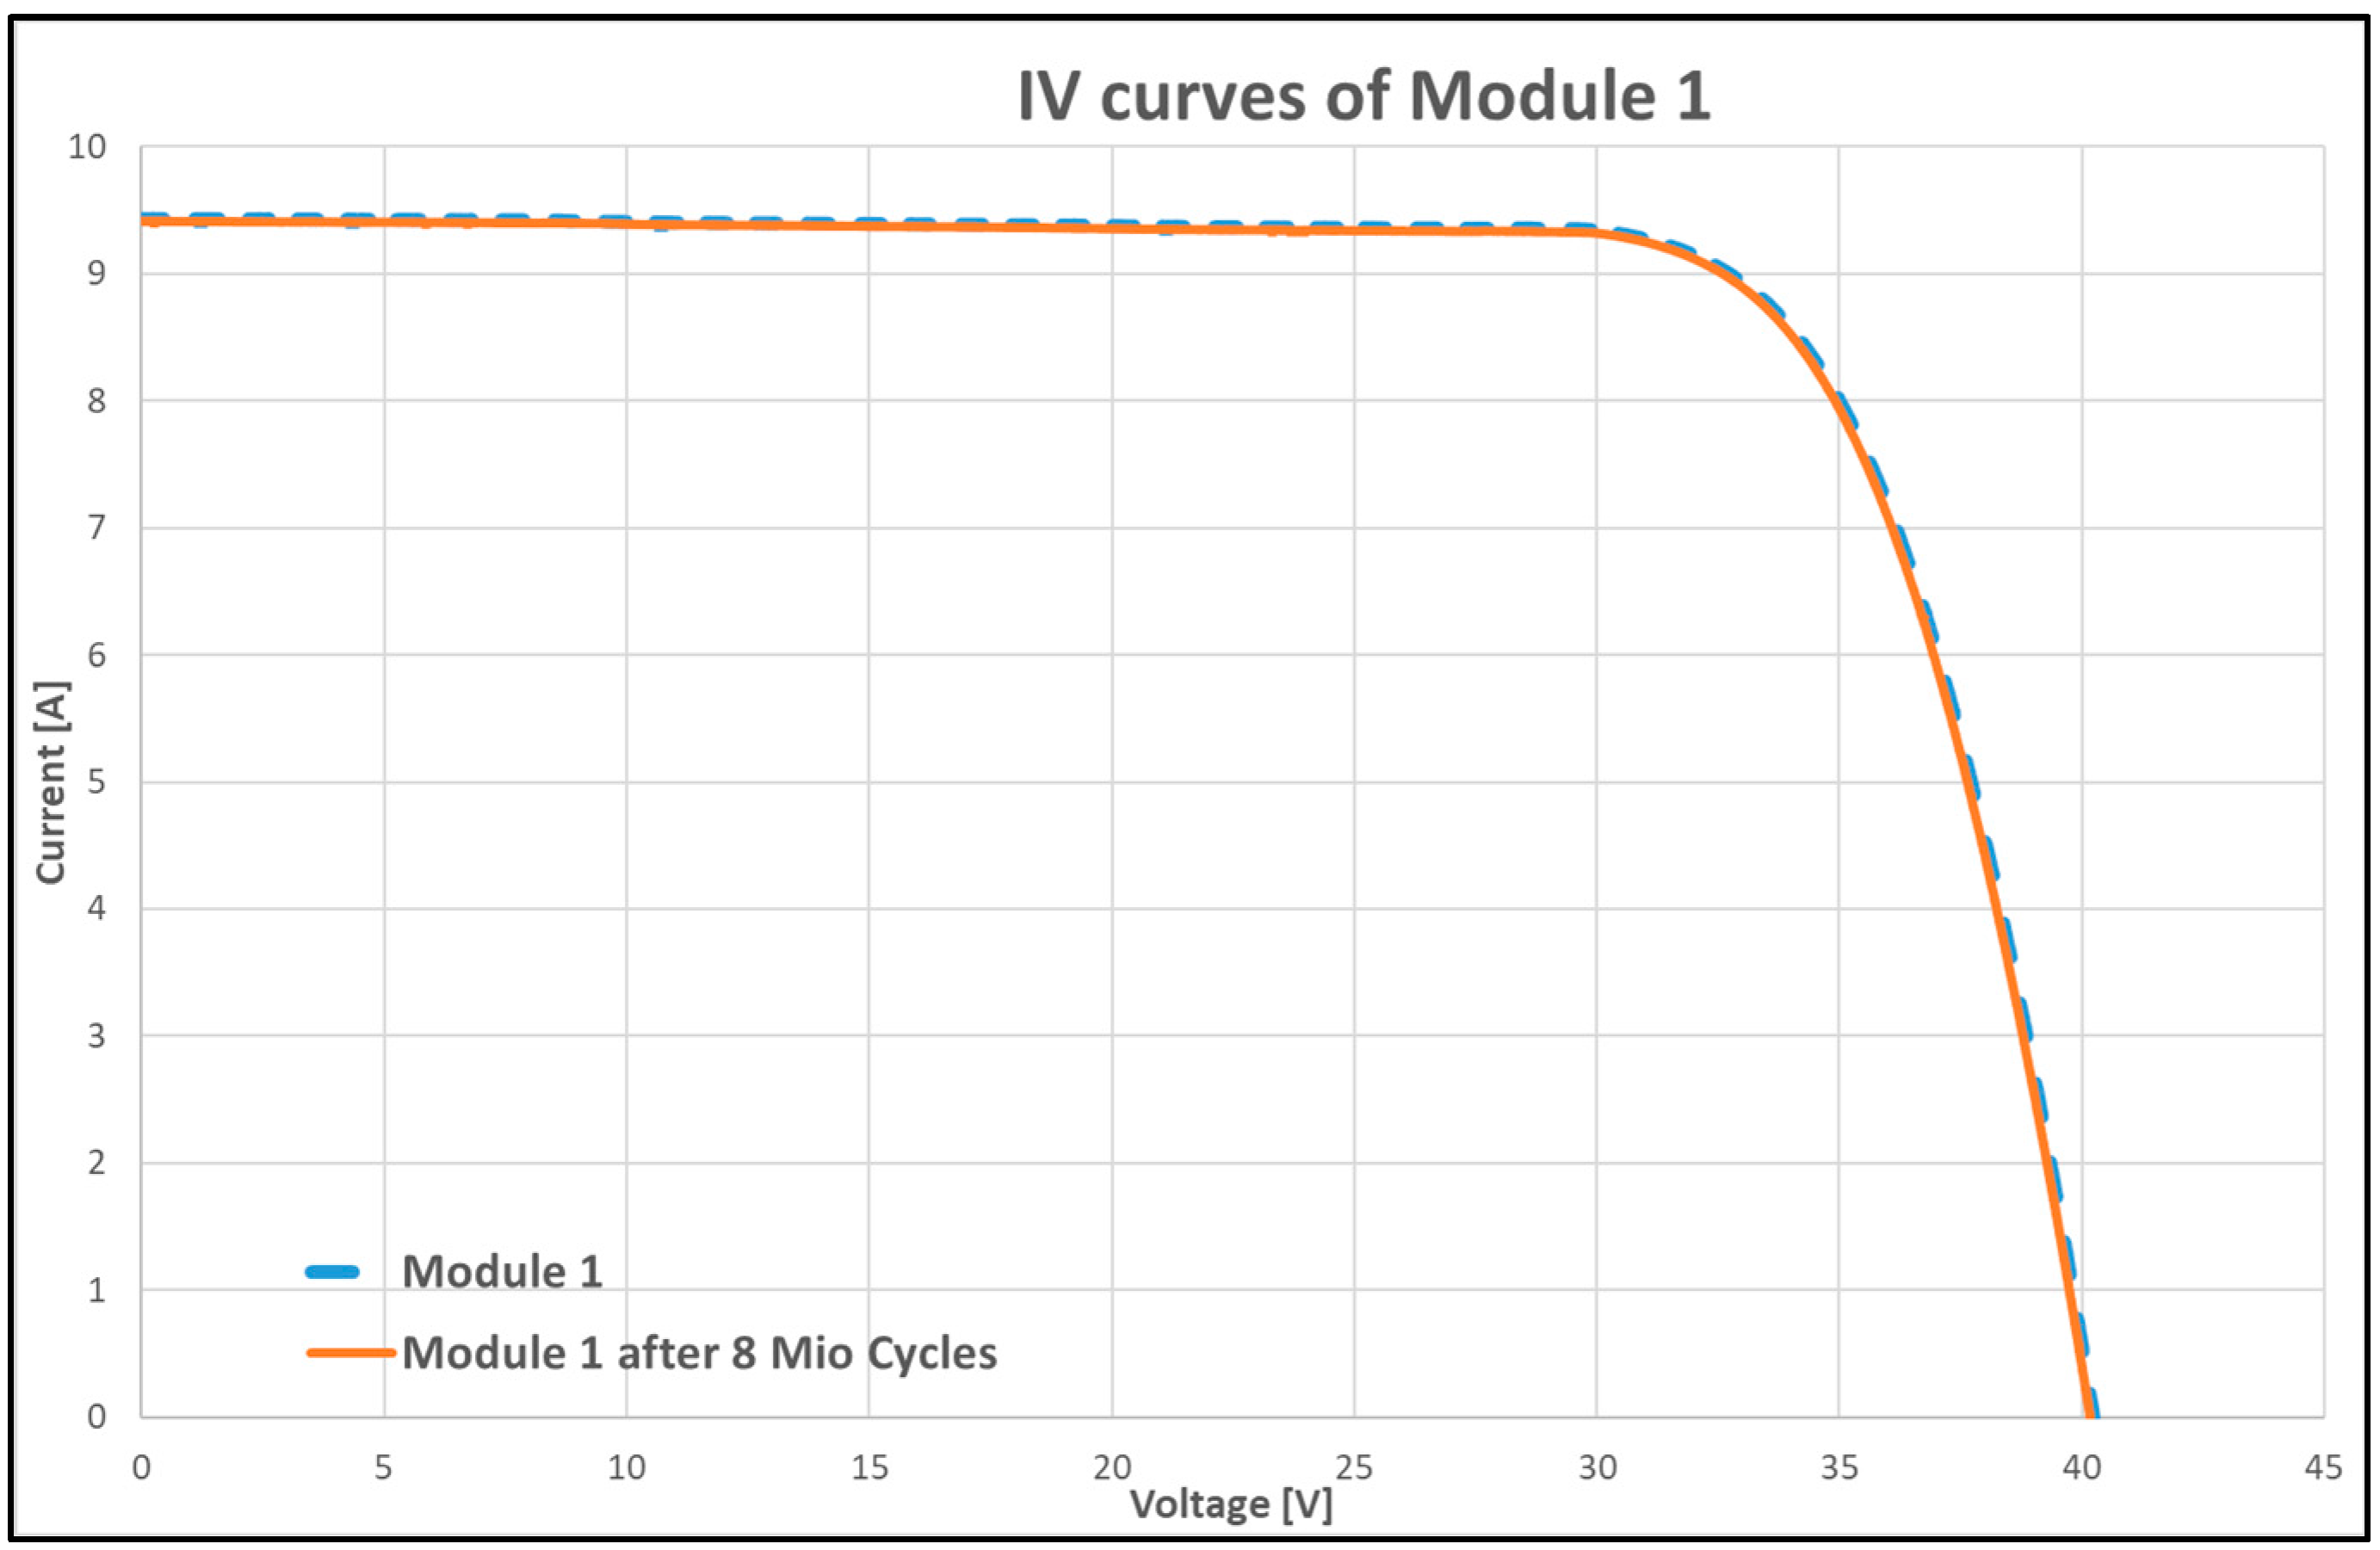
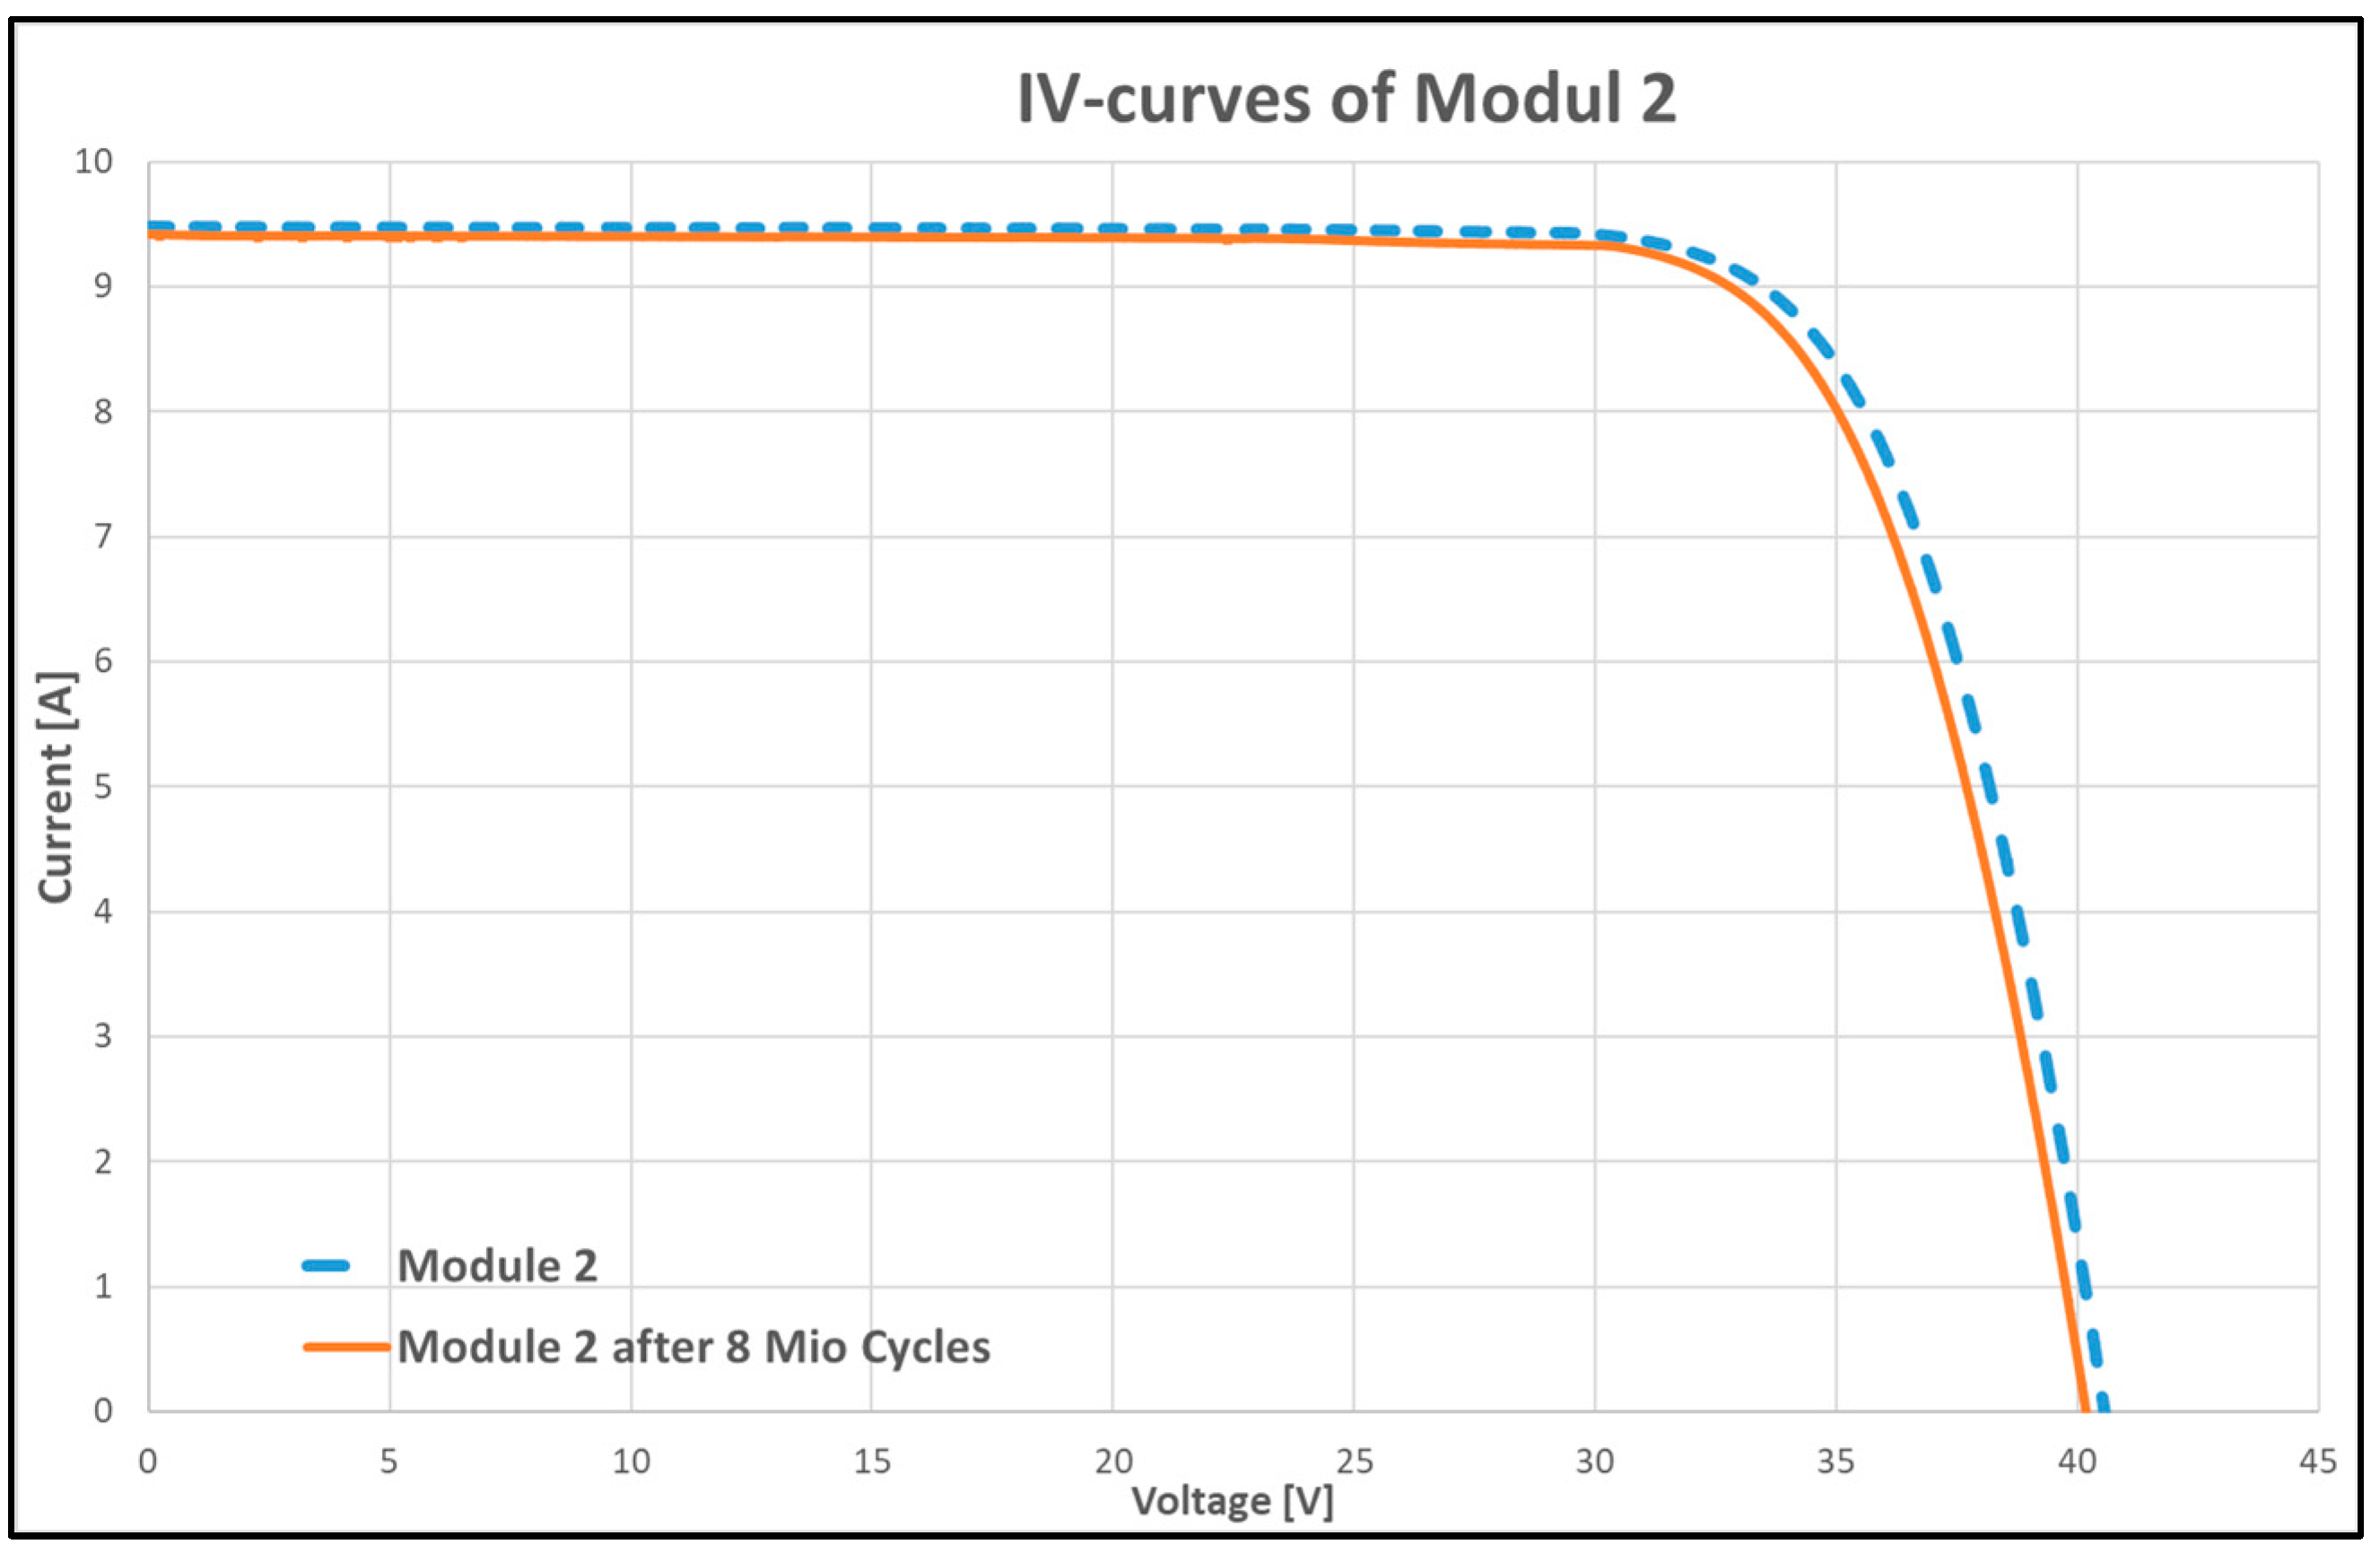
Figure 21 and Figure 22 depict the IV curves of Module 1 and Module 2 before and after the vibration testing. Figure 21 shows an overlap of the curves, while in Figure 22 a slight decrease in the open circuit voltage Voc is visible.
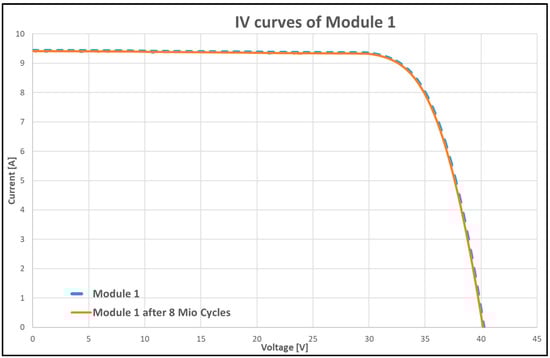
Figure 21.
IV curves of Module 1, before and after vibration tests.
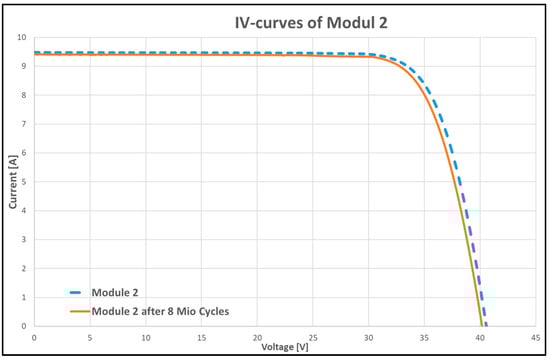
Figure 22.
IV curves of Module 2, before and after vibration tests.
Only Module 2 resulted a different EL image after the vibration test. More dark cells and thus a slight degradation were visible.
No further degradation was observed; only after the test was an abrasion along the module edge noticed (see Figure 23), likely due to the mounting of the modules for the test.
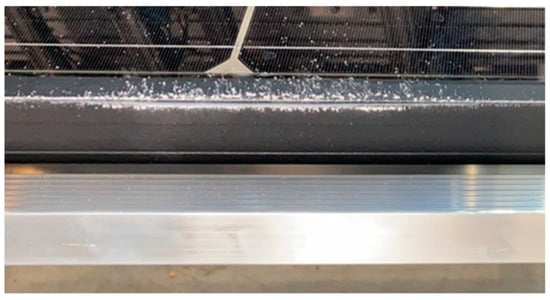
Figure 23.
Abrasion along the module edge.
Table 5 depicts the relative decrease in the maximum power point (Pmax = Vmpp × Impp), of the open circuit voltage (Voc), of the short circuit current (Isc), and of the fill factor (FF) in %. Module 2 shows a slight decrease in the Voc of −1.4% and thus of the Pmax of −2%, which could be regarded within the measurement uncertainty of our measurement setup.
Table 5.
Relative decrease in the modules’ maximum power point under vibration testing.
4. Conclusions
In this study, the integration of PV systems as roofing for high-ranked street networks was investigated and demonstrated. The importance of the presented study lies in investigating, developing, and demonstrating a possibility to integrate PV systems for a future electric energy systems of high PV penetration. Solutions like PV-SÜD might also allow us to systematically exploit already-sealed surfaces for electric generation. The project offers a design concept and demonstrates the technical feasibility in real life. The created designs or similar further developments may enable fostering the development of blueprint solutions to be industrially multiplied. In the given demonstration, it was also proven that a PV system of this type conforms to standards by only using standardized components from the stock. In detail, the investigation results include the following findings.
The boundary conditions and challenges of different locations were taken into account regarding the solar energy production of the roofing and the design of the structure. A design was possible based on standards and regulations for the condition of the road surface and traffic safety and security. Optimized design parameters of a robust concept were presented as one self-sustained unit of 12 m length and 14 m width and 37.8 kWp solar capacity. The site-specific and orientation-specific analysis of the PV electric yield showed that using the flat pent-roof design, the yield is between 37.5 MWh and 44.0 MWh per unit with a maximum variation of only 17.9%. The reliability and durability of the PV elements, their supporting structure, and their structural suitability and efficiency were proven by laboratory testing. A demonstrator was built at Hegau (Engen, Germany) which has been in operation since 10/2023. It will enable researchers to investigate in more detail how such a structure can meet the diverse requirements of the high-level road network with respect to drainage, wind and snow loads, stability and impact resistance, maintenance procedures, and traffic safety [28,29,30,31].
The presented work not only shows that a lot of engineering and scientific questions could be solved, but it also opens a new set of questions and routes for future investigations, which could not be covered in this work. One is to study the long-time development of the electric yield in detail. This is of interest regarding the site and orientation dependency, as well as the degradation of the PV systems due to traffic interaction. In addition, the impact of the PV system roofing on the street surface is also of interest concerning important road parameters. These are, e.g., the surface temperature, moisture, rain, snow or ice, and soiling. From these parameters, conclusions on the lifetime impact of the road surface can be deduced. Finally, economic evaluations for different user-scenarios and for multiplied or up-scaled application would be of importance.
Author Contributions
Validation, C.M.; Writing – original draft, R.E., M.R., K.A.B., M.H. (Martin Heinrich), F.B., A.J.B., J.D.H., M.H. (Manfred Haider), D.P., A.V., M.F. and T.B. All authors have read and agreed to the published version of the manuscript.
Funding
FFG-Project: 878205. The research projects PV-SÜD-K and PV-SÜD-D are financed within the D-A-CH cooperation Transport Infrastructure Research 2019 by the Federal Ministry for Digital and Transport (Germany), the Federal Ministry for Climate Action, Environment, Energy, Mobility, Innovation, and Technology (BMK) (Austria), and the Federal Roads Office ASTRA (Switzerland).
Data Availability Statement
The original contributions presented in the study are included in the article, further inquiries can be directed to the corresponding author.
Conflicts of Interest
Authors Rita Ebner, Christoph Mayr, Marcus Rennhofer, Karl A. Berger, Manfred Haider, Dominik Prammer and Alois Vorwagner were employed by the research company AIT Austrian Institute of Technology GmbH (AIT). Authors Markus Fehringer and Tobias Beck were employed by the company Forster Industrietechnik GmbH. The remaining authors declare that the research was conducted in the absence of any commercial or financial relationships that could be construed as a potential conflict of interest.
References
- IRENA. World Energy Transitions Outlook 2023: 1.5 °C Pathway; International Renewable Energy Agency: Abu Dhabi, United Arab Emirates, 2023; Volume 1, Available online: www.researchgate.net/publication/350636989_WORLD_ENERGY_TRANSITIONS_OUTLOOK_-_15C_PATHWAY#fullTextFileContent (accessed on 1 August 2024).
- IEA-PVPS. Snapshot of Global PV Markets 2023. Report IEA-PVPS T1-44:2023. Available online: https://iea-pvps.org/snapshot-reports/snapshot-2023 (accessed on 1 August 2024).
- Wirth, H.; Eggers, J.B.; Trommsdorff, M.; Neuhaus, H.; Heinrich, M.; Wieland, S.; Schill, C. Potenziale der Integrierten Photovoltaik in Deutschland. In Proceedings of the 36. PV-Symposium, Pforzheim, Germany, 18–26 May 2021; Available online: https://freidok.uni-freiburg.de/data/224889 (accessed on 1 August 2024).
- Ebner, R.; Mayr, C.; Rennhofer, M.; Berger, K.A.; Heinrich, M.; Basler, F.; Beinert, A.J.; Huyeng, J.D.; Haider, M.; Prammer, D.; et al. PV Roofing for High Ranking Road Networks: Technical Feasibility and Yield Estimation. In Proceedings of the WCPEC-8, Milan, Italy, 26–30 September 2022. [Google Scholar]
- Huyeng, J.D.; Forster, J.; Basler, F.; Romer, P.; Beinert, A.J.; Schill, C.; Heinrich, M.; Neuhaus, D.-H.; Wirth, H. Technical Aspects for Road Integrated Photovoltaics Towards a More Sustainable Mobility Sector. In Proceedings of the WCPEC-8, Milan, Italy, 26–30 September 2022. [Google Scholar]
- Hrapović, K. Photovoltaics—Highway Roofing. Int. J. Multidiscip. Res. Publ. (IJMRAP) 2022, 4, 91–95. [Google Scholar]
- Jiang, H.; Lu, N.; Qin, J.; Yao, L.; Lian, X.; He, J.; Liu, T.; Zhou, C. Roofing Highways with Solar Pannels substantially reduces Carbon Emission and Traffic Losses. Earth’s Future 2024, 12, e2023EF003975. [Google Scholar] [CrossRef]
- SWISS ENERGYPIER. 2 Planned Demonstrator Plants in Switzerland. Available online: https://energypier.ch/pages/projects#pilot_project_fully (accessed on 1 August 2024).
- Mikovits, C.; Schauppenlehner, T.; Scherhaufer, P.; Schmidt, J.; Schmalzl, L.; Dworzak, V.; Hampl, N.; Sposato, R.G. A Spatially Highly Resolved Ground Mounted and Rooftop Potential Analysis for Photovoltaics in Austria. ISPRS Int. J. Geo-Inf. 2021, 10, 418. [Google Scholar] [CrossRef]
- Fechner, H. Ermittlung des Flächenpotentials für den Photovoltaik-Ausbau in Österreich: Welche Flächenkategorien sind für die Erschließung von besonderer Bedeutung, um das Ökostromziel realisieren zu können. Study for Austria’s Energy. 2020. Available online: https://oesterreichsenergie.at/fileadmin/user_upload/Oesterreichs_Energie/Publikationsdatenbank/Studien/2020/PV-Studie_2020.pdf (accessed on 1 August 2024).
- Desai, A.; Kanika; Patel, C.R. The impact of electric vehicle charging infrastructure on the energy demand of a city. Energy Rep. 2023, 9, 814–823. [Google Scholar] [CrossRef]
- Drakulić, M.; Brandt, R.; Borchiellini, R.; Del Ray, I.; Dix, A.; Fresta, M.; Harvey, N.; Huijben, H. Design Fire Characteristics for Road Tunnels, Technical Committee 3.3; 2017R01EN; World Road Association (PIARC): La Défense, France, 2017. [Google Scholar]
- Pirringer, S. Brandberechnung von Stahlbetontunnels- Eine Gegenüberstellung; Diplomarbeit TU Wien, Institut für Tragkonstruktionen: Vienna, Austria, 2008. [Google Scholar]
- ÖNORM EN 13501-5:2016 11 01; Klassifizierung von Bauprodukten und Bauarten zu ihrem Brandverhalten—Teil 5: Klassifizierung mit den Ergebnissen aus Prüfungen von Bedachungen bei Beanspruchung durch Feuer von außen. DIN: Berlin, Germany, 2016.
- ÖNORM EN 1793-5:2019 02 15; Lärmschutzvorrichtungen an Straßen—Prüfverfahren zur Bestimmung der akustischen Eigenschaften—Teil 5: Produktspezifische Merkmale—In-situ-Werte der Schallreflexion in gerichteten Schallfeldern. DIN: Berlin, Germany, 2019.
- Beinert, A.J.; Romer, P.; Heinrich, M.; Mittag, M.; Aktaa, J.; Neuhaus, D.H. The Effect of Cell and Module Dimensions on Thermomechanical Stress in PV Modules. IEEE J. Photovolt. 2020, 10, 70–77. [Google Scholar] [CrossRef]
- IES 61140:2016; Protection against Electric Shock—Common Aspects for Installation and Equipment. IEC: Geneva, Switzerland, 2016.
- IEC 61215-1:2021 Edition 2.0 (2021-02-23); Terrestrial Photovoltaic (PV) Modules—Design Qualification and Type Approval—Part 1: Test Requirements. IEC: Geneva, Switzerland, 2021.
- IEC 61215-2:2021 Edition 2.0 (2021-02-24); Terrestrial Photovoltaic (PV) Modules—Design Qualification and Type Approval—Part 2: Test Procedures. IEC: Geneva, Switzerland, 2021.
- IEC 61730-1:2016 Edition 2.0 (2016-08-17); Photovoltaic (PV) Module Safety Qualification—Part 1: Requirements for Construction. IEC: Geneva, Switzerland, 2016.
- IEC 61730-2:2016 Edition 2.0 (2016-08-18); Photovoltaic (PV) Module Safety Qualification—Part 2: Requirements for Testing. IEC: Geneva, Switzerland, 2016.
- UL 790 Edition 9-2022; Standard Test Methods for Fire Tests of Roof Coverings (Building Integrated Photovoltaics -BIPV products only). UL Standards & Engagement: Evanston, IL, USA, 2022.
- IEC 61701:2020; Photovoltaic (PV) modules—Salt mist corrosion testing. IEC: Geneva, Switzerland, 2020.
- IEC 62804-1-1:2020 Edition 1.0; Photovoltaic (PV) Modules -Test Methods for the Detection of Potential-Induced Degradation – Part 1-1: Crystalline Silicon—Delamination. IEC: Geneva, Switzerland, 2020.
- IEC 62716:2013 Edition 1.0; Photovoltaic (PV) Modules—Ammonia Corrosion Testing. IEC: Geneva, Switzerland, 2020.
- Prammer, D.; Vorwagner, A.; Berger, K.; Lachinger, S.; Lechner, A. Green New Deal: Neue baudynamische Herausforderungen für PV-Überdachungen über Autobahnen. In 17. D-A-CH Tagung; 2021; Available online: https://sgeb.ch/userdata/uploads/pdf/dokumentationen/tagungsband-d-a-ch-2021.pdf (accessed on 1 August 2024).
- Assmus, M.; Jack, S.; Weiss, K.A.; Koehl, M. Measurement and simulation of vibrations of PV-modules induced by dynamic mechanical loads. Prog. Photovolt. Res. Appl. 2011, 19, 688–694. [Google Scholar] [CrossRef]
- Weninger-Vycudil, A.; Simanek, P.; Haberl, P.; Rohringer, T. Handbuch Pavement Management in Österreich; Straßenforschungsheft Nr. 584; Bundesministerium für Verkehr, Innovation und Technologie BMVIT: Wien, Germany, 2009. [Google Scholar]
- Bettin, M.; Maurer, R.; Bach, A. Anprall gegen Pfeiler von Bestandsbauwerken. Brückenkolloquium 2020, 4, 531–544. Available online: https://elibrary.narr.digital/article/99.125005/kbr202010531 (accessed on 1 August 2024).
- ÖNORM EN 1991-2:2012 03 01; Eurocode 1: Einwirkungen auf Tragwerke—Teil 2: Verkehrslasten auf Brücken (Konsolidierte Fassung). DIN: Berlin, Germany, 2012.
- ÖNORM B 1991-2:2018 08 01; Eurocode 1—Einwirkungen auf Tragwerke—Teil 2: Verkehrslasten auf Brücken—Nationale Festlegungen zu ÖNORM EN 1991-2 und Nationale Ergänzungen. DIN: Berlin, Germany, 2018.


Disclaimer/Publisher’s Note: The statements, opinions and data contained in all publications are solely those of the individual author(s) and contributor(s) and not of MDPI and/or the editor(s). MDPI and/or the editor(s) disclaim responsibility for any injury to people or property resulting from any ideas, methods, instructions, or products referred to in the content. |
© 2024 by the authors. Licensee MDPI, Basel, Switzerland. This article is an open access article distributed under the terms and conditions of the Creative Commons Attribution (CC BY) license (https://creativecommons.org/licenses/by/4.0/).