E-Fuels: A Comprehensive Review of the Most Promising Technological Alternatives towards an Energy Transition


 , , and
Abstract
:
1. Introduction
2. Raw Materials for E-Fuels Production
2.1. Hydrogen
2.1.1. General Information
2.1.2. E-Hydrogen
2.2. Carbon Dioxide
2.2.1. CCUS
2.2.2. DAC
Absorption and Electrodialysis
Absorption and Calcination
Adsorption and Desorption (TSA)
2.3. Nitrogen
2.4. Electricity Consumption
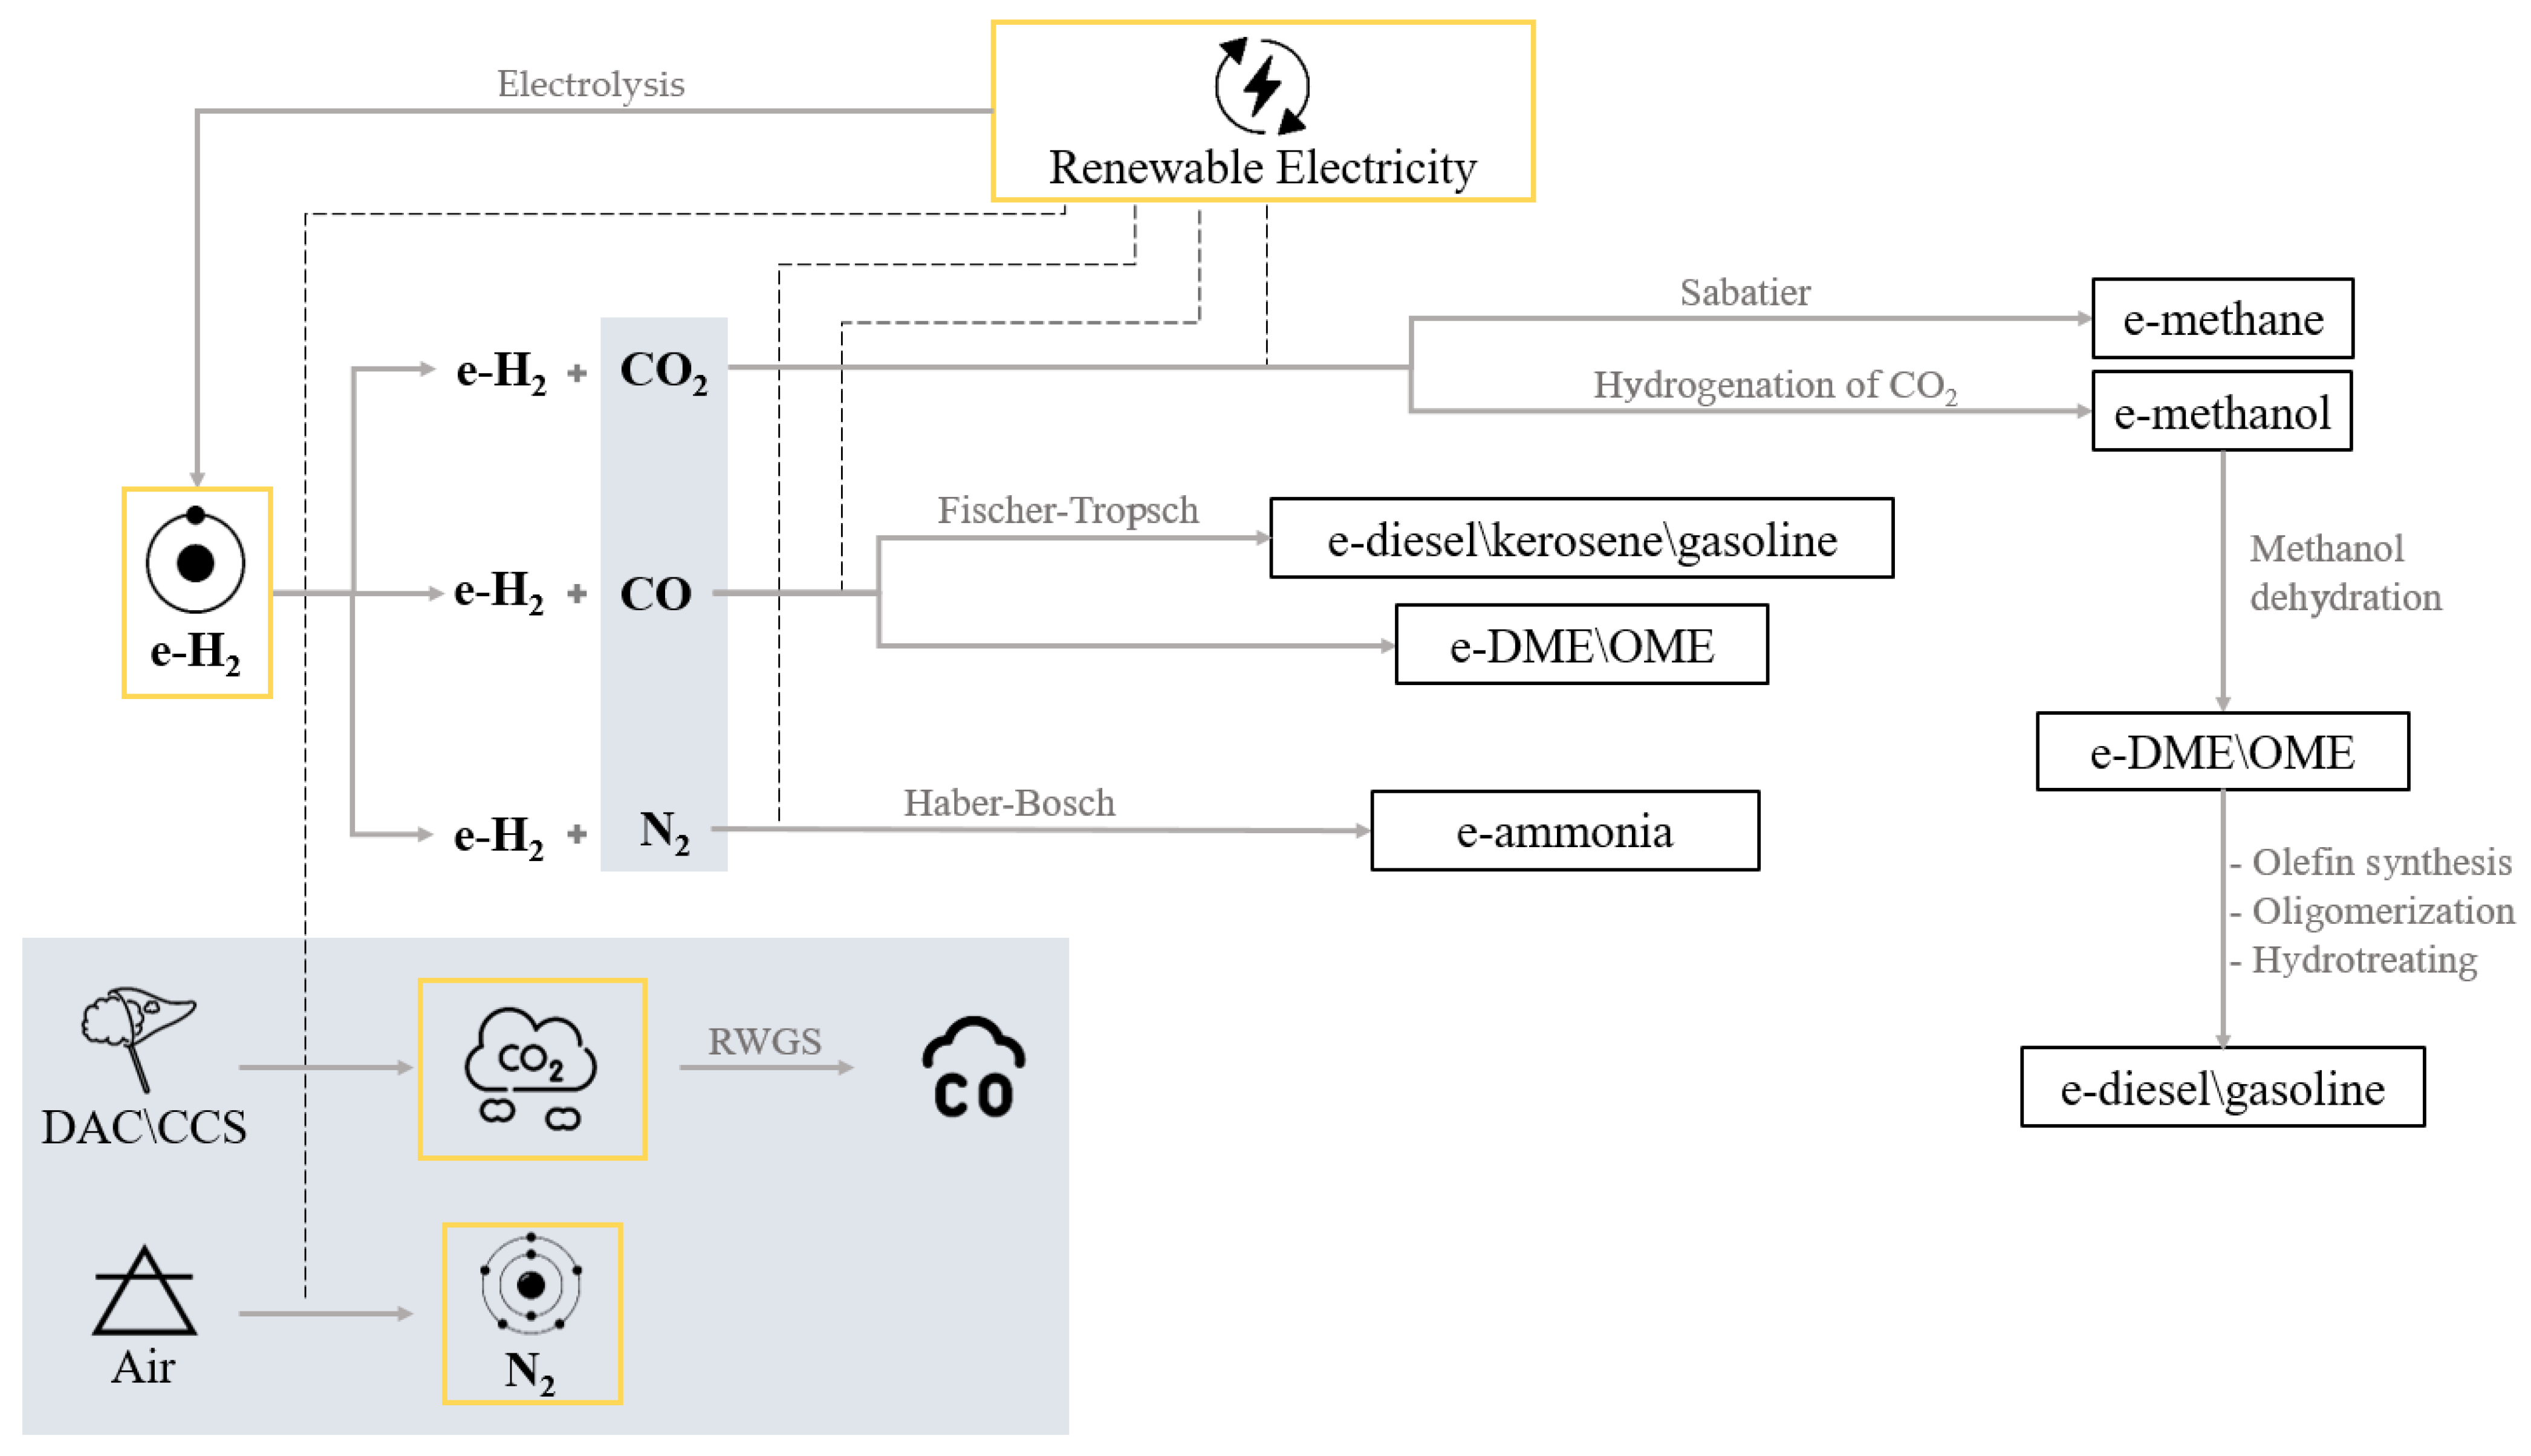
3. E-Fuels Types
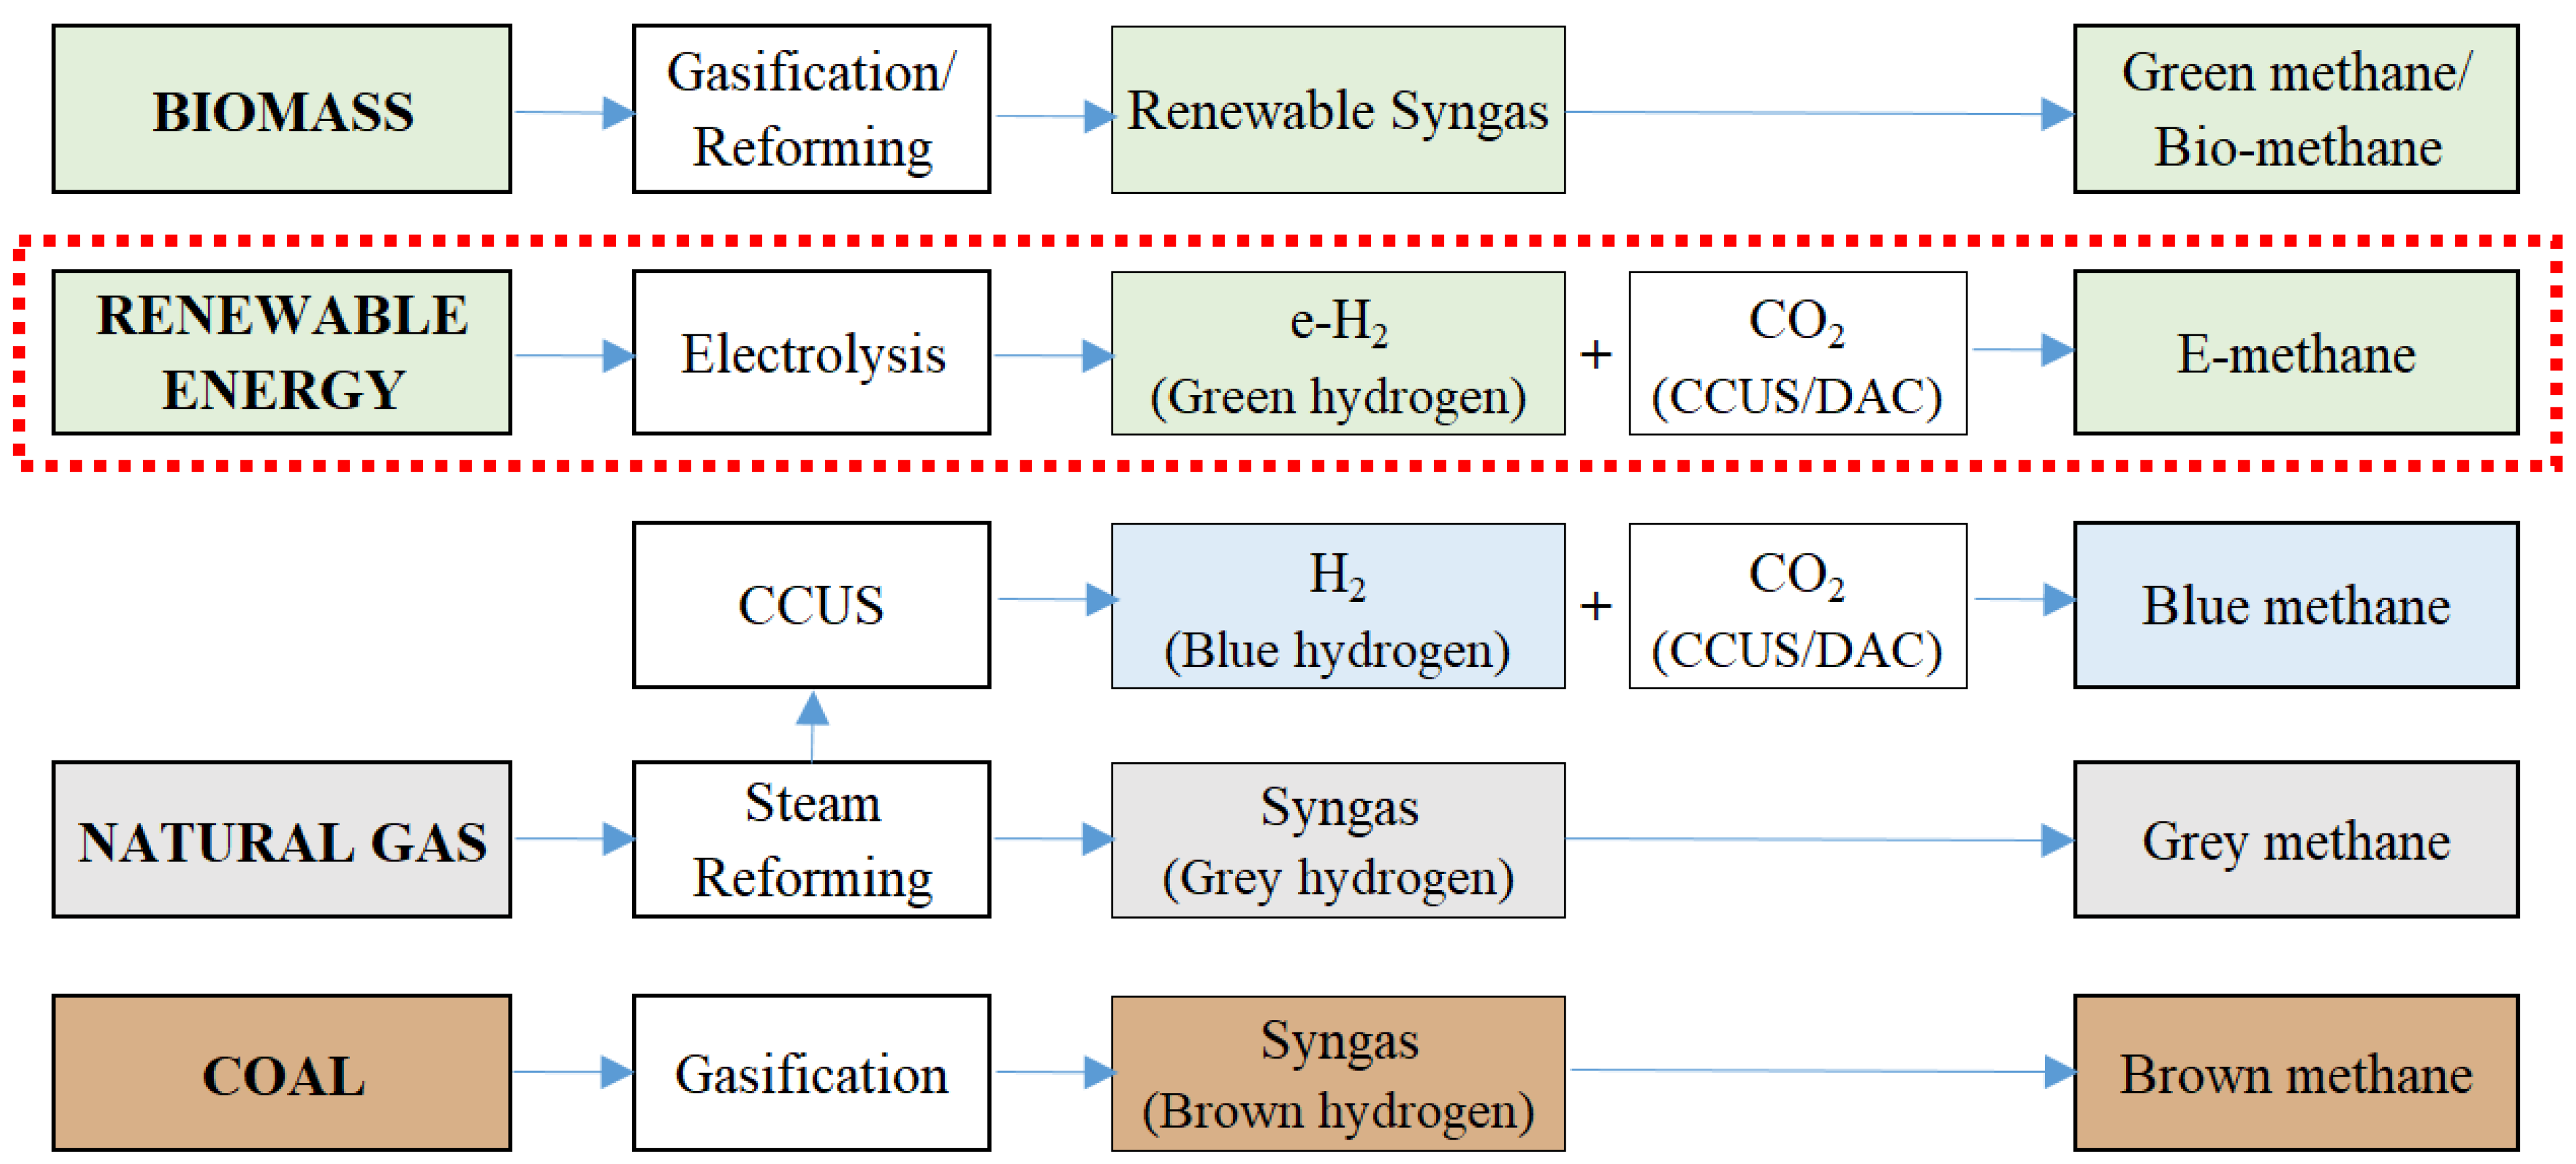
3.1. E-Methane
3.2. E-Methanol
3.3. E-DME/OME
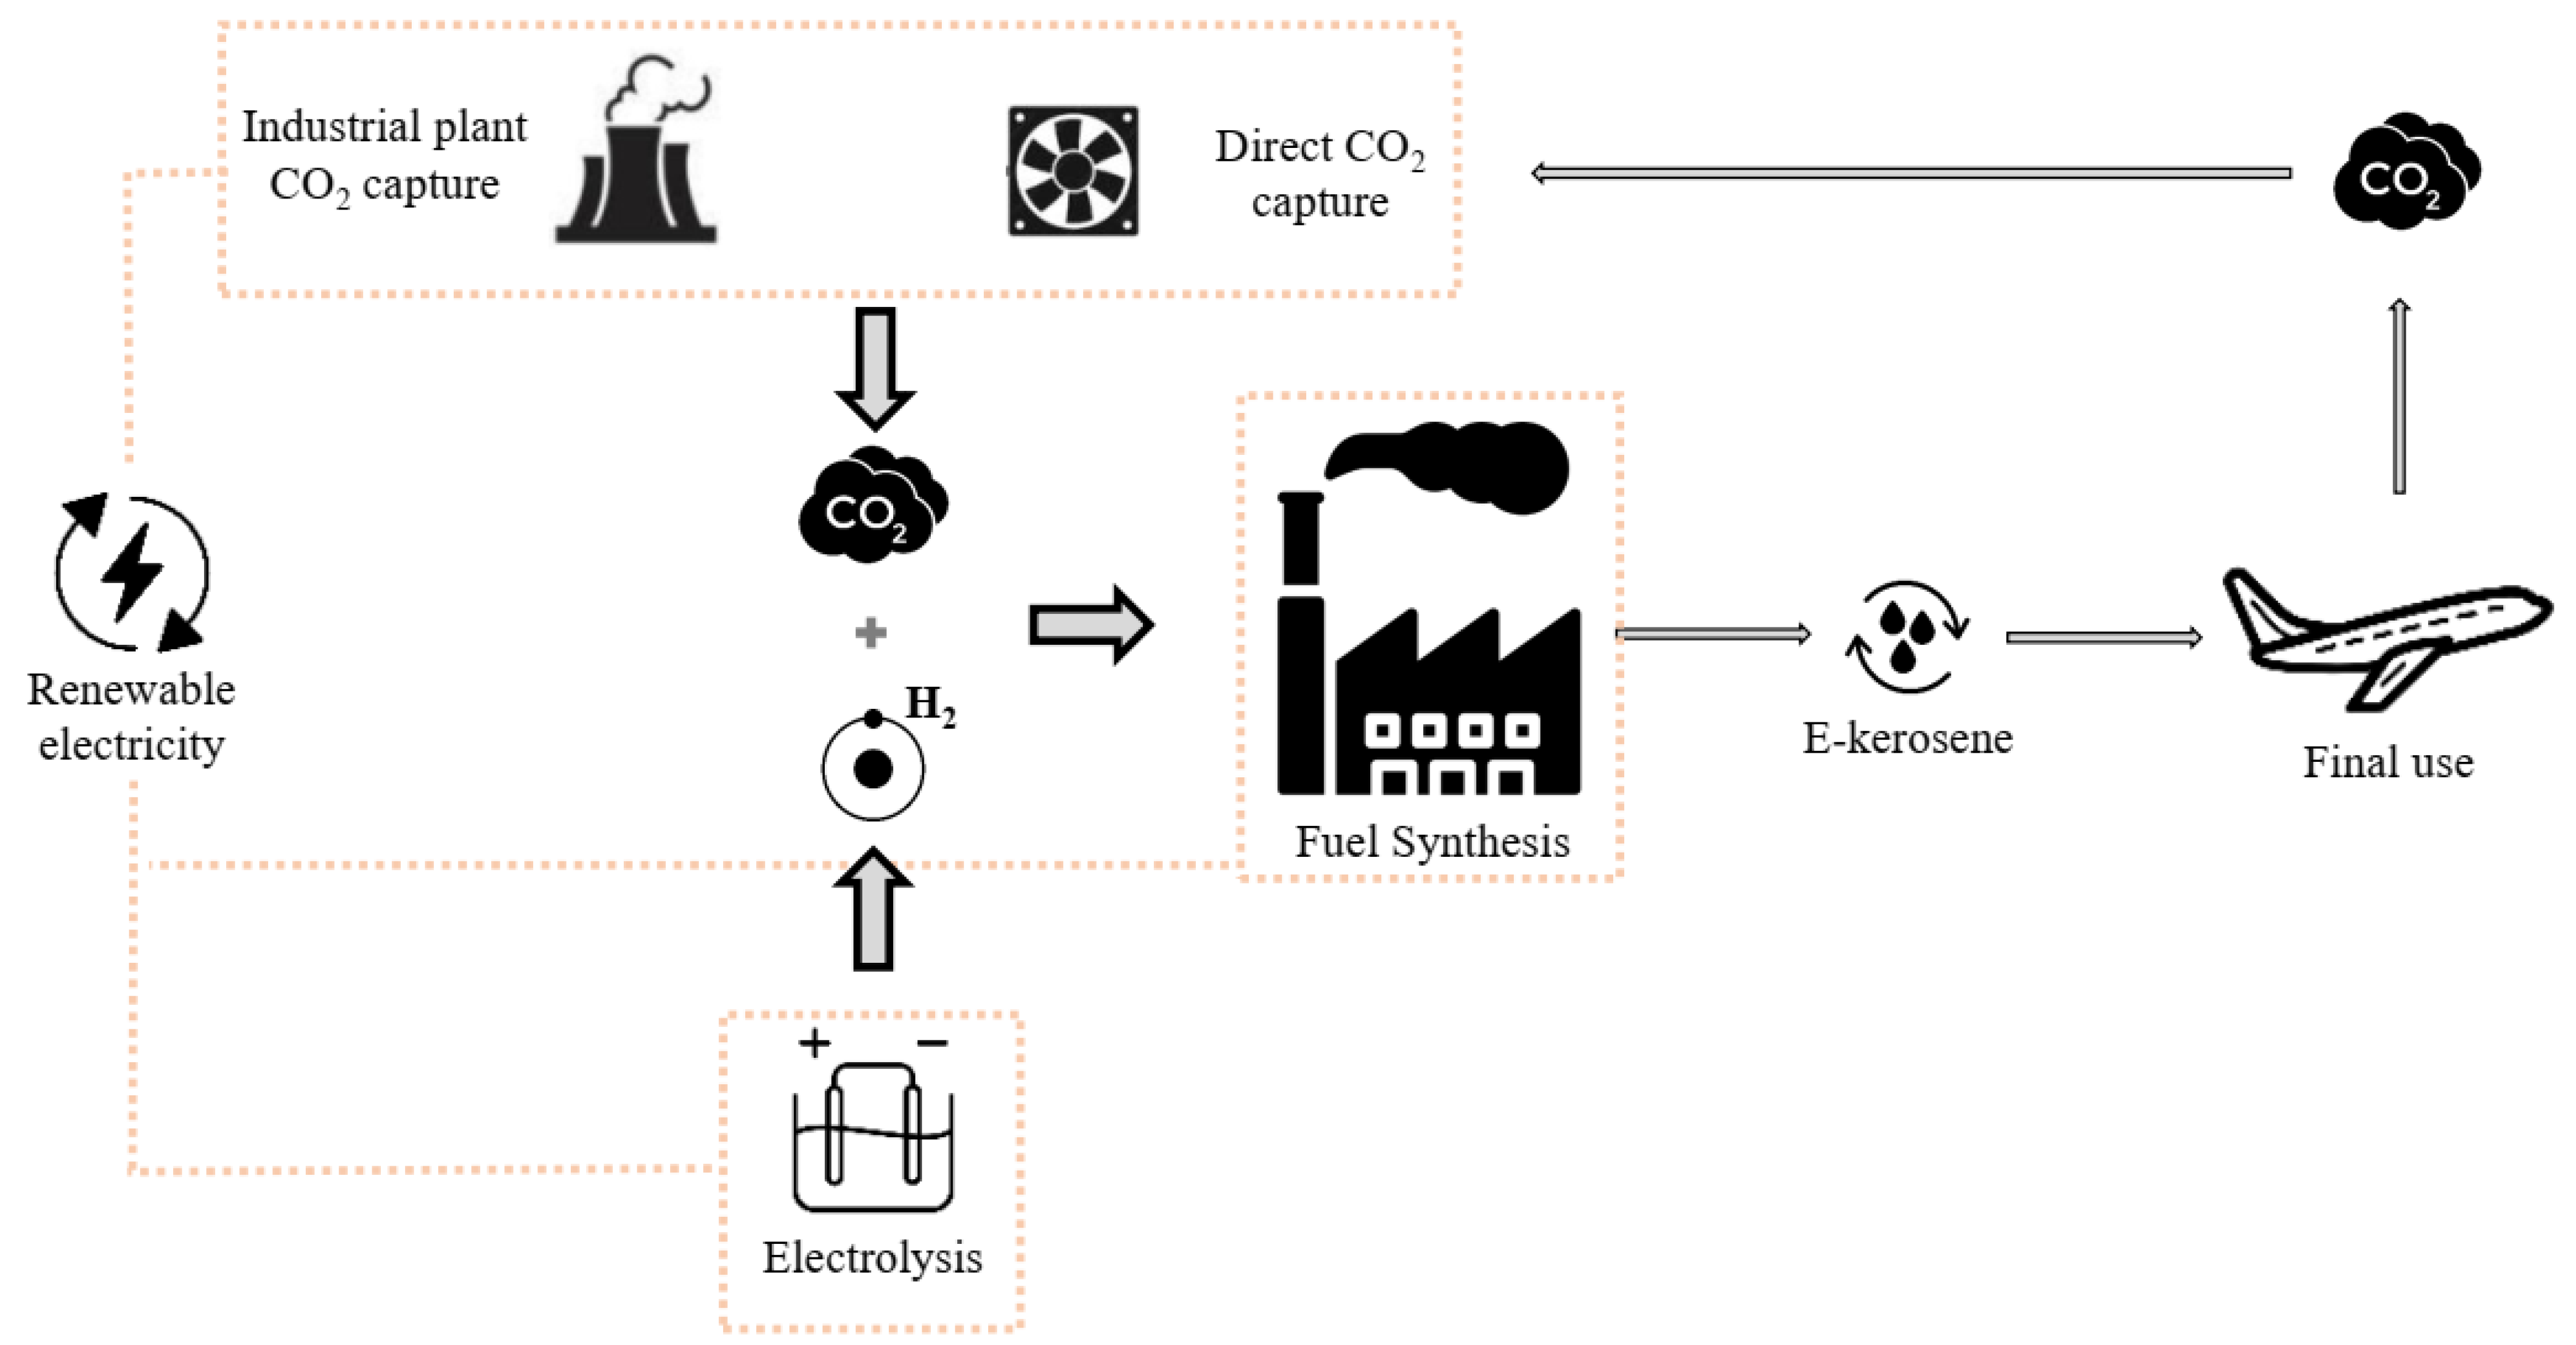
3.4. E-Diesel/Kerosene/Gasoline
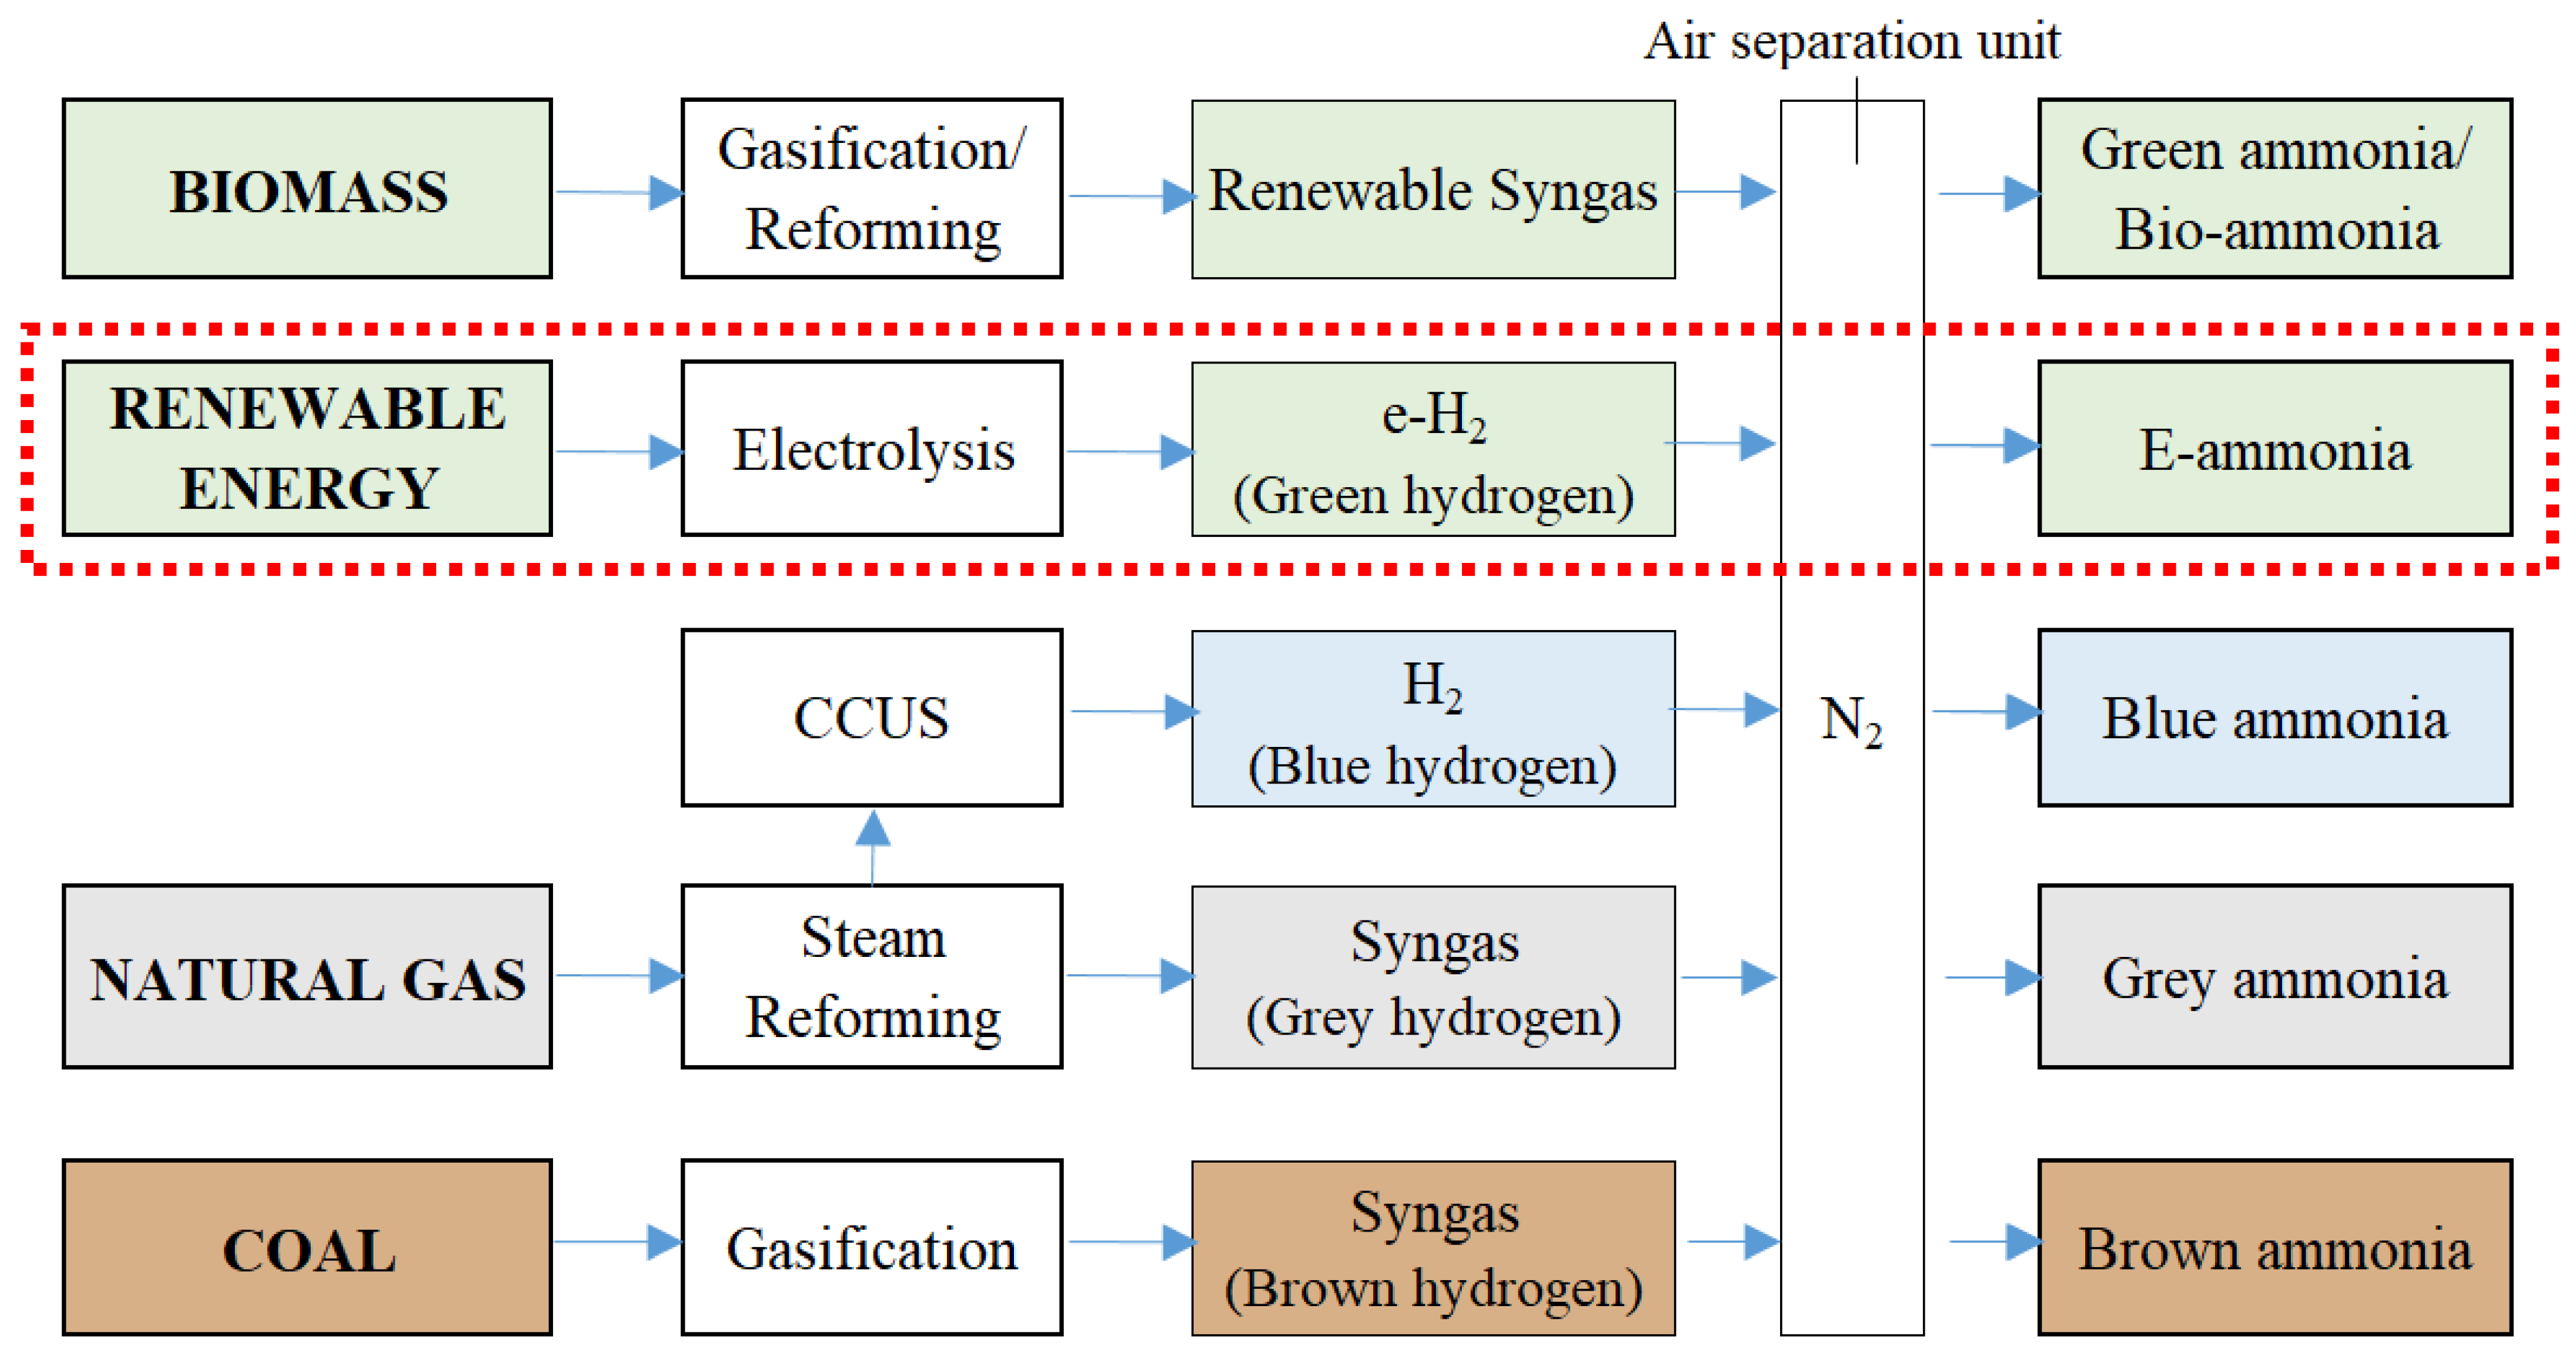
3.5. E-Ammonia
4. Technological and Environmental Analysis
4.1. Readiness Level Indicators
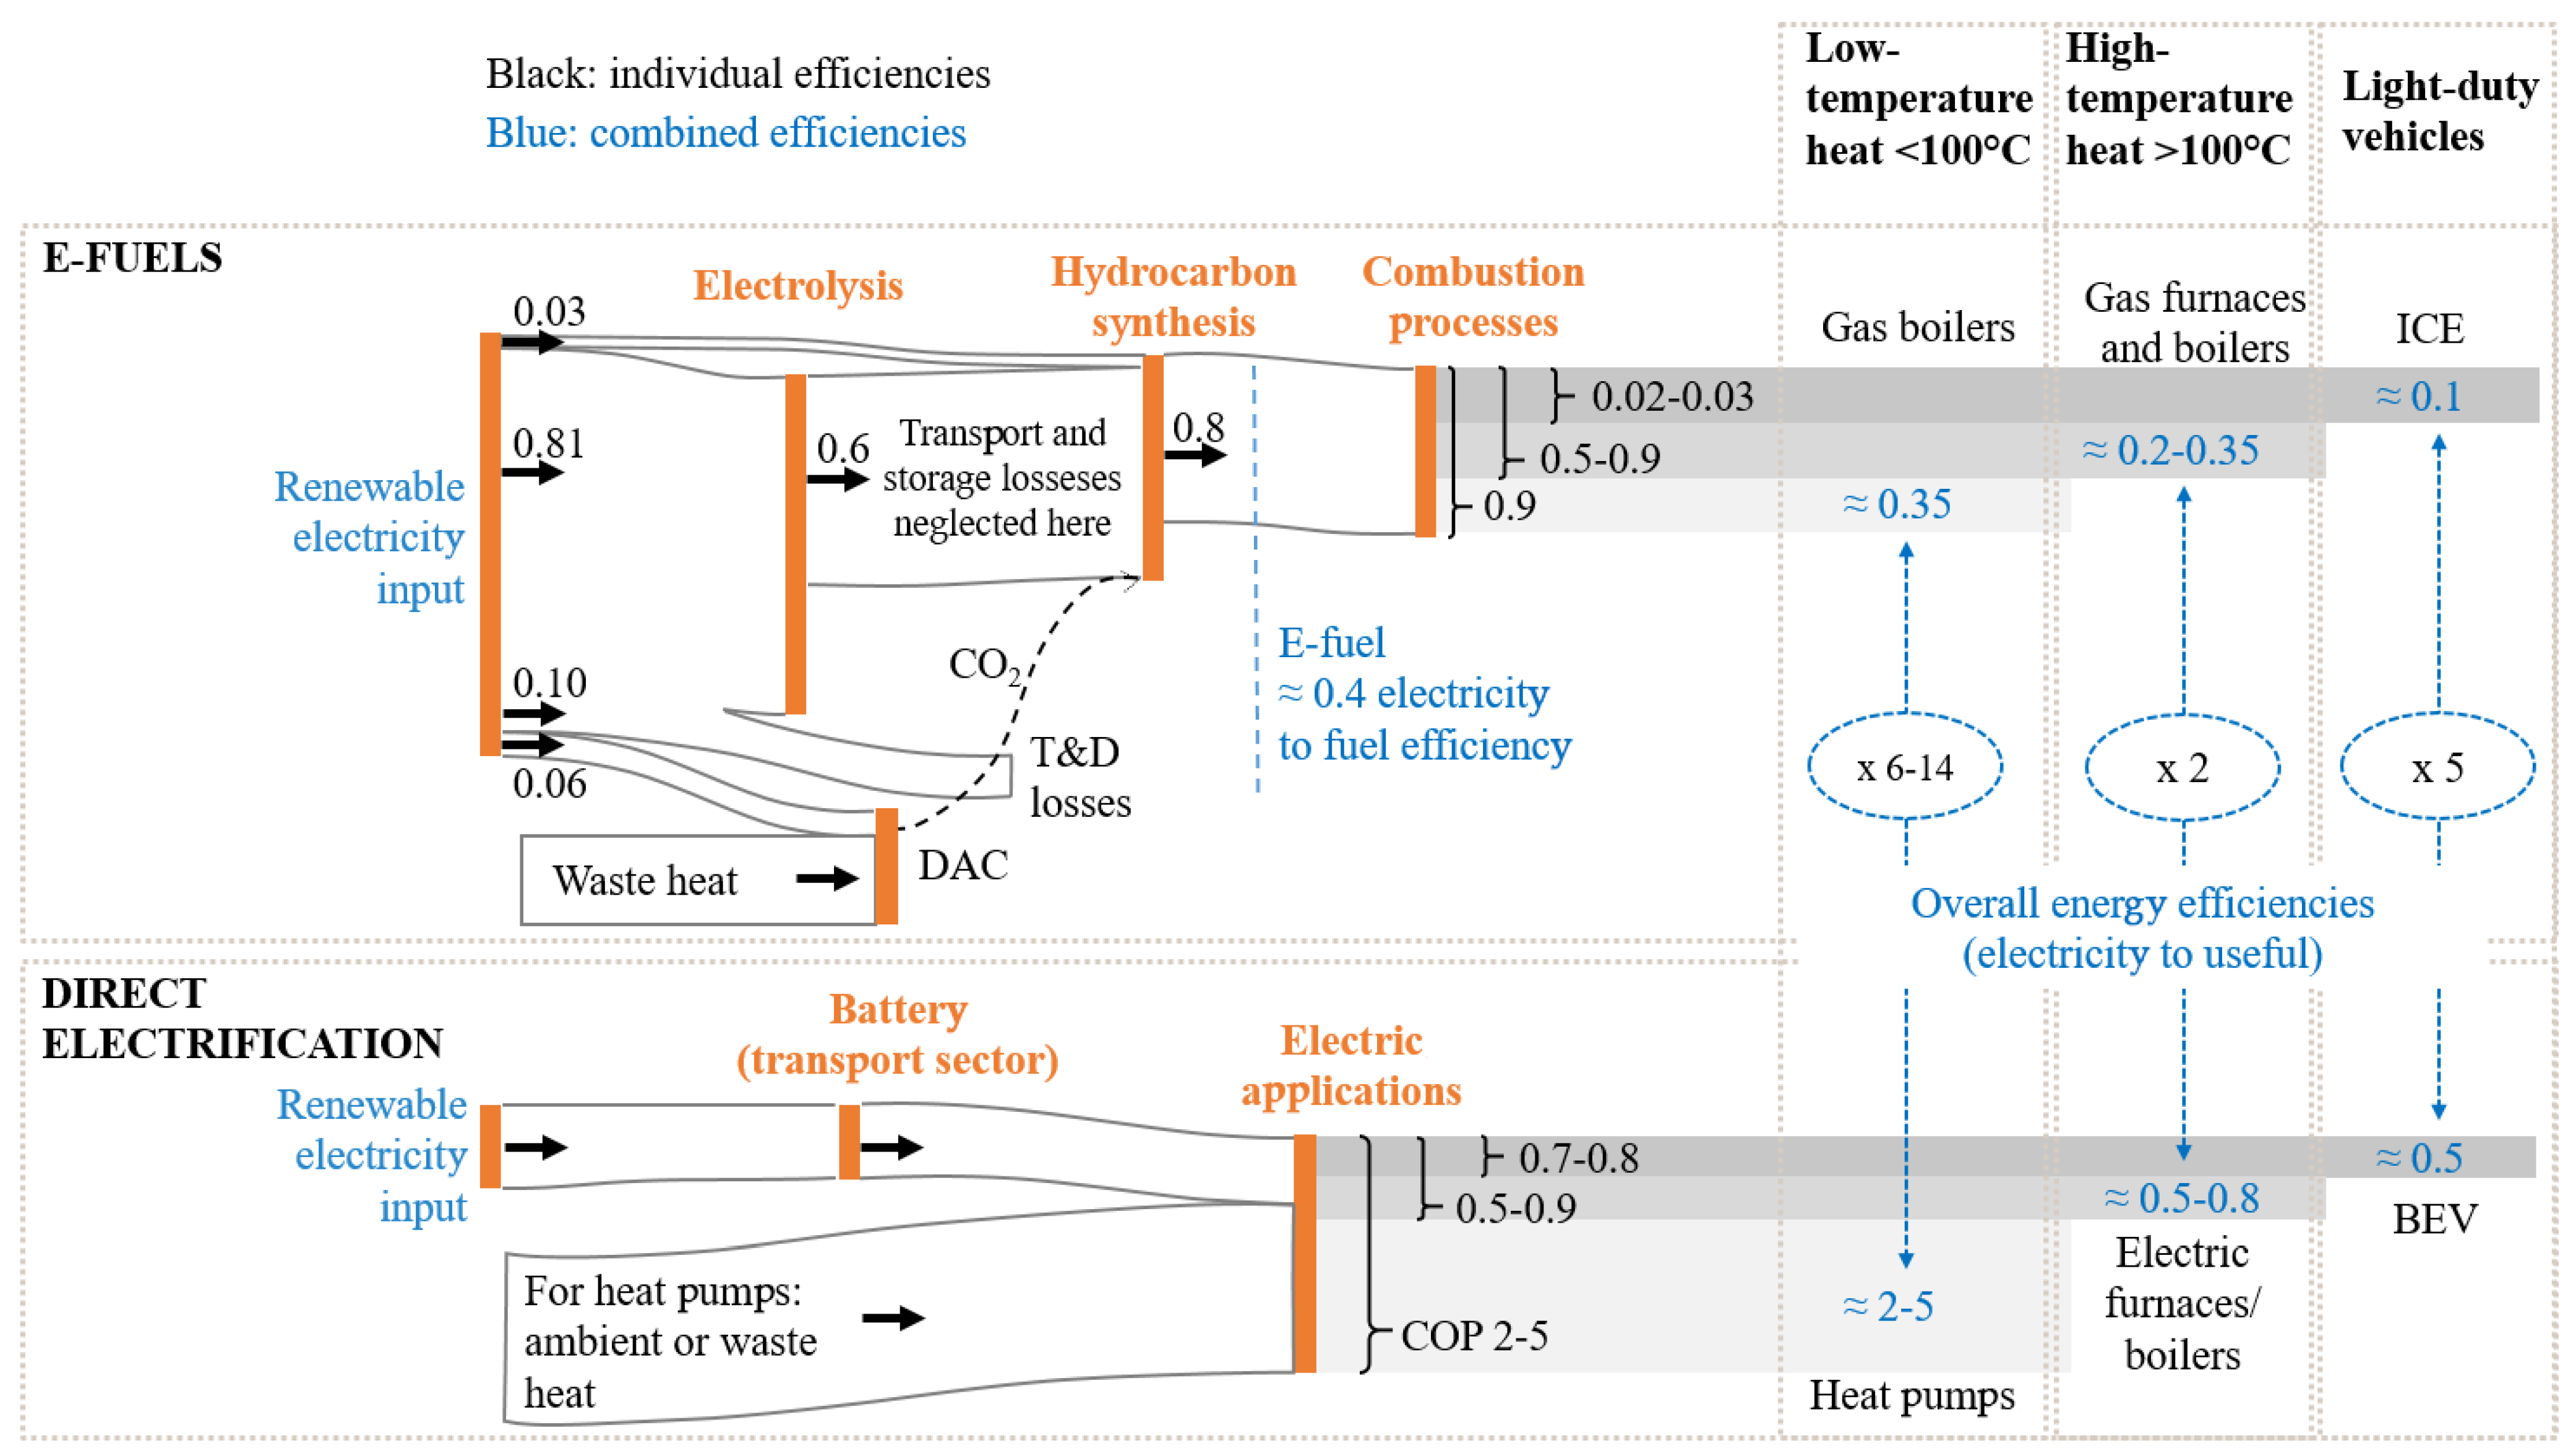
4.2. Conversion Efficiency
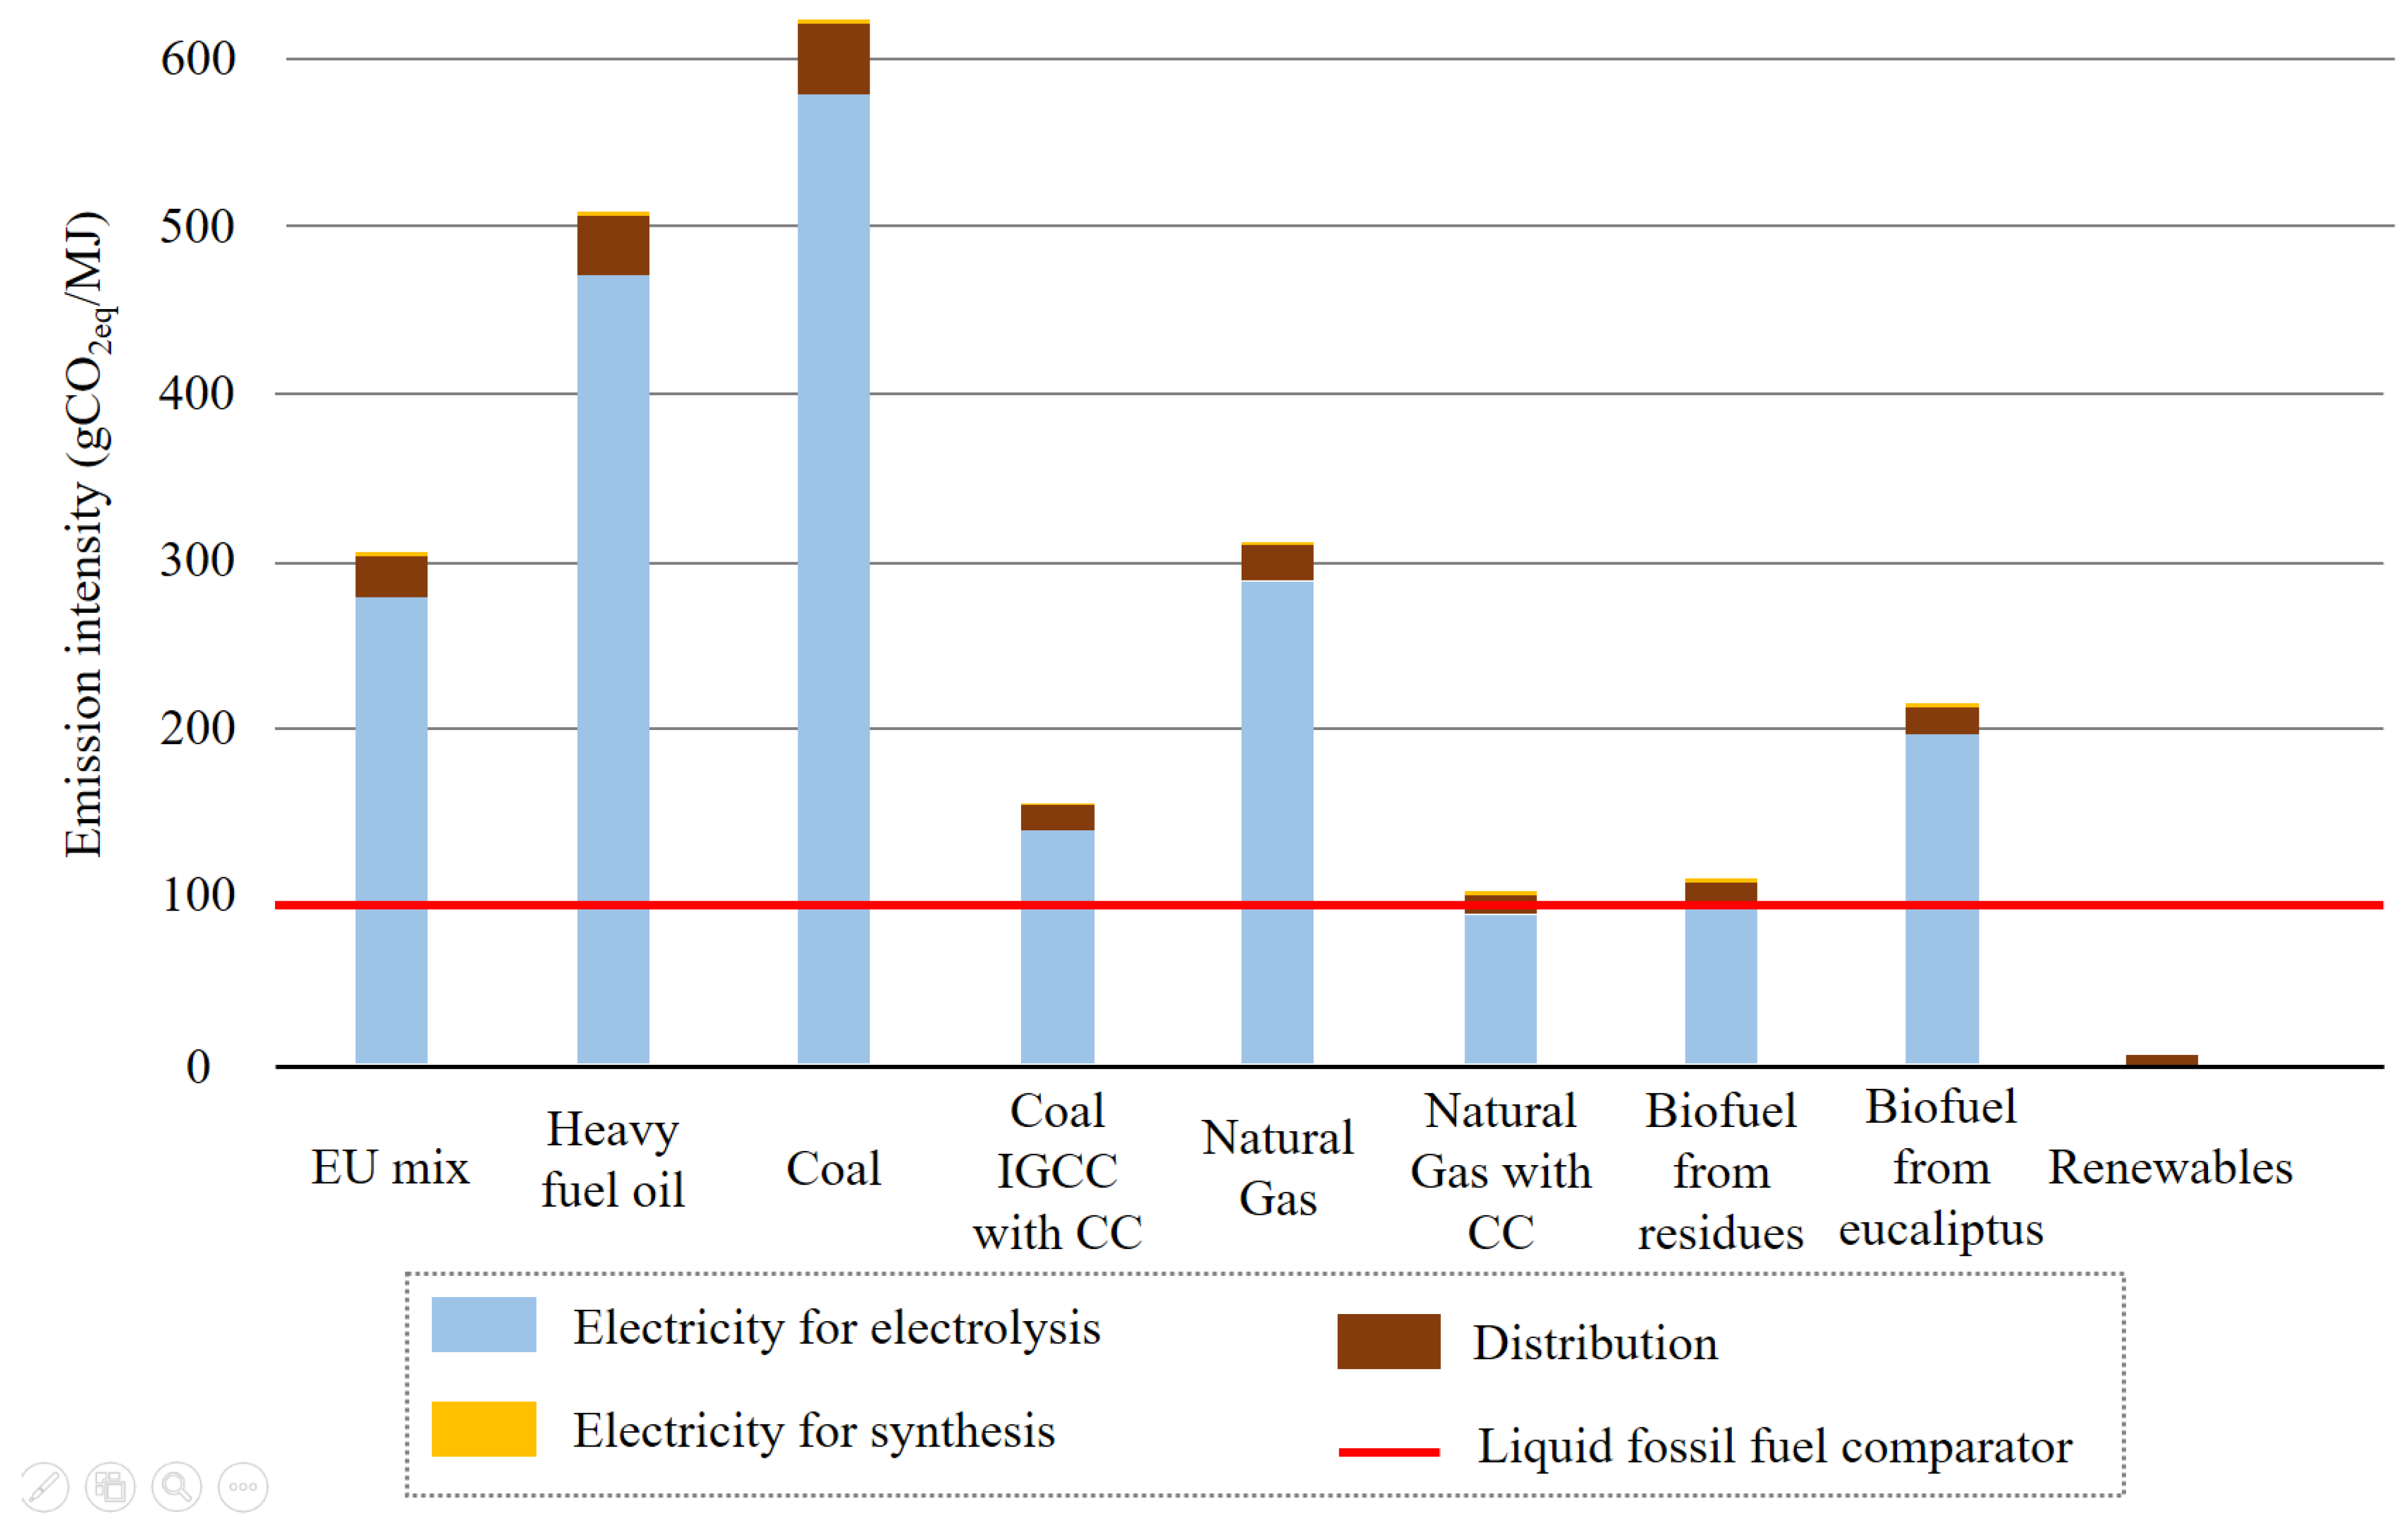
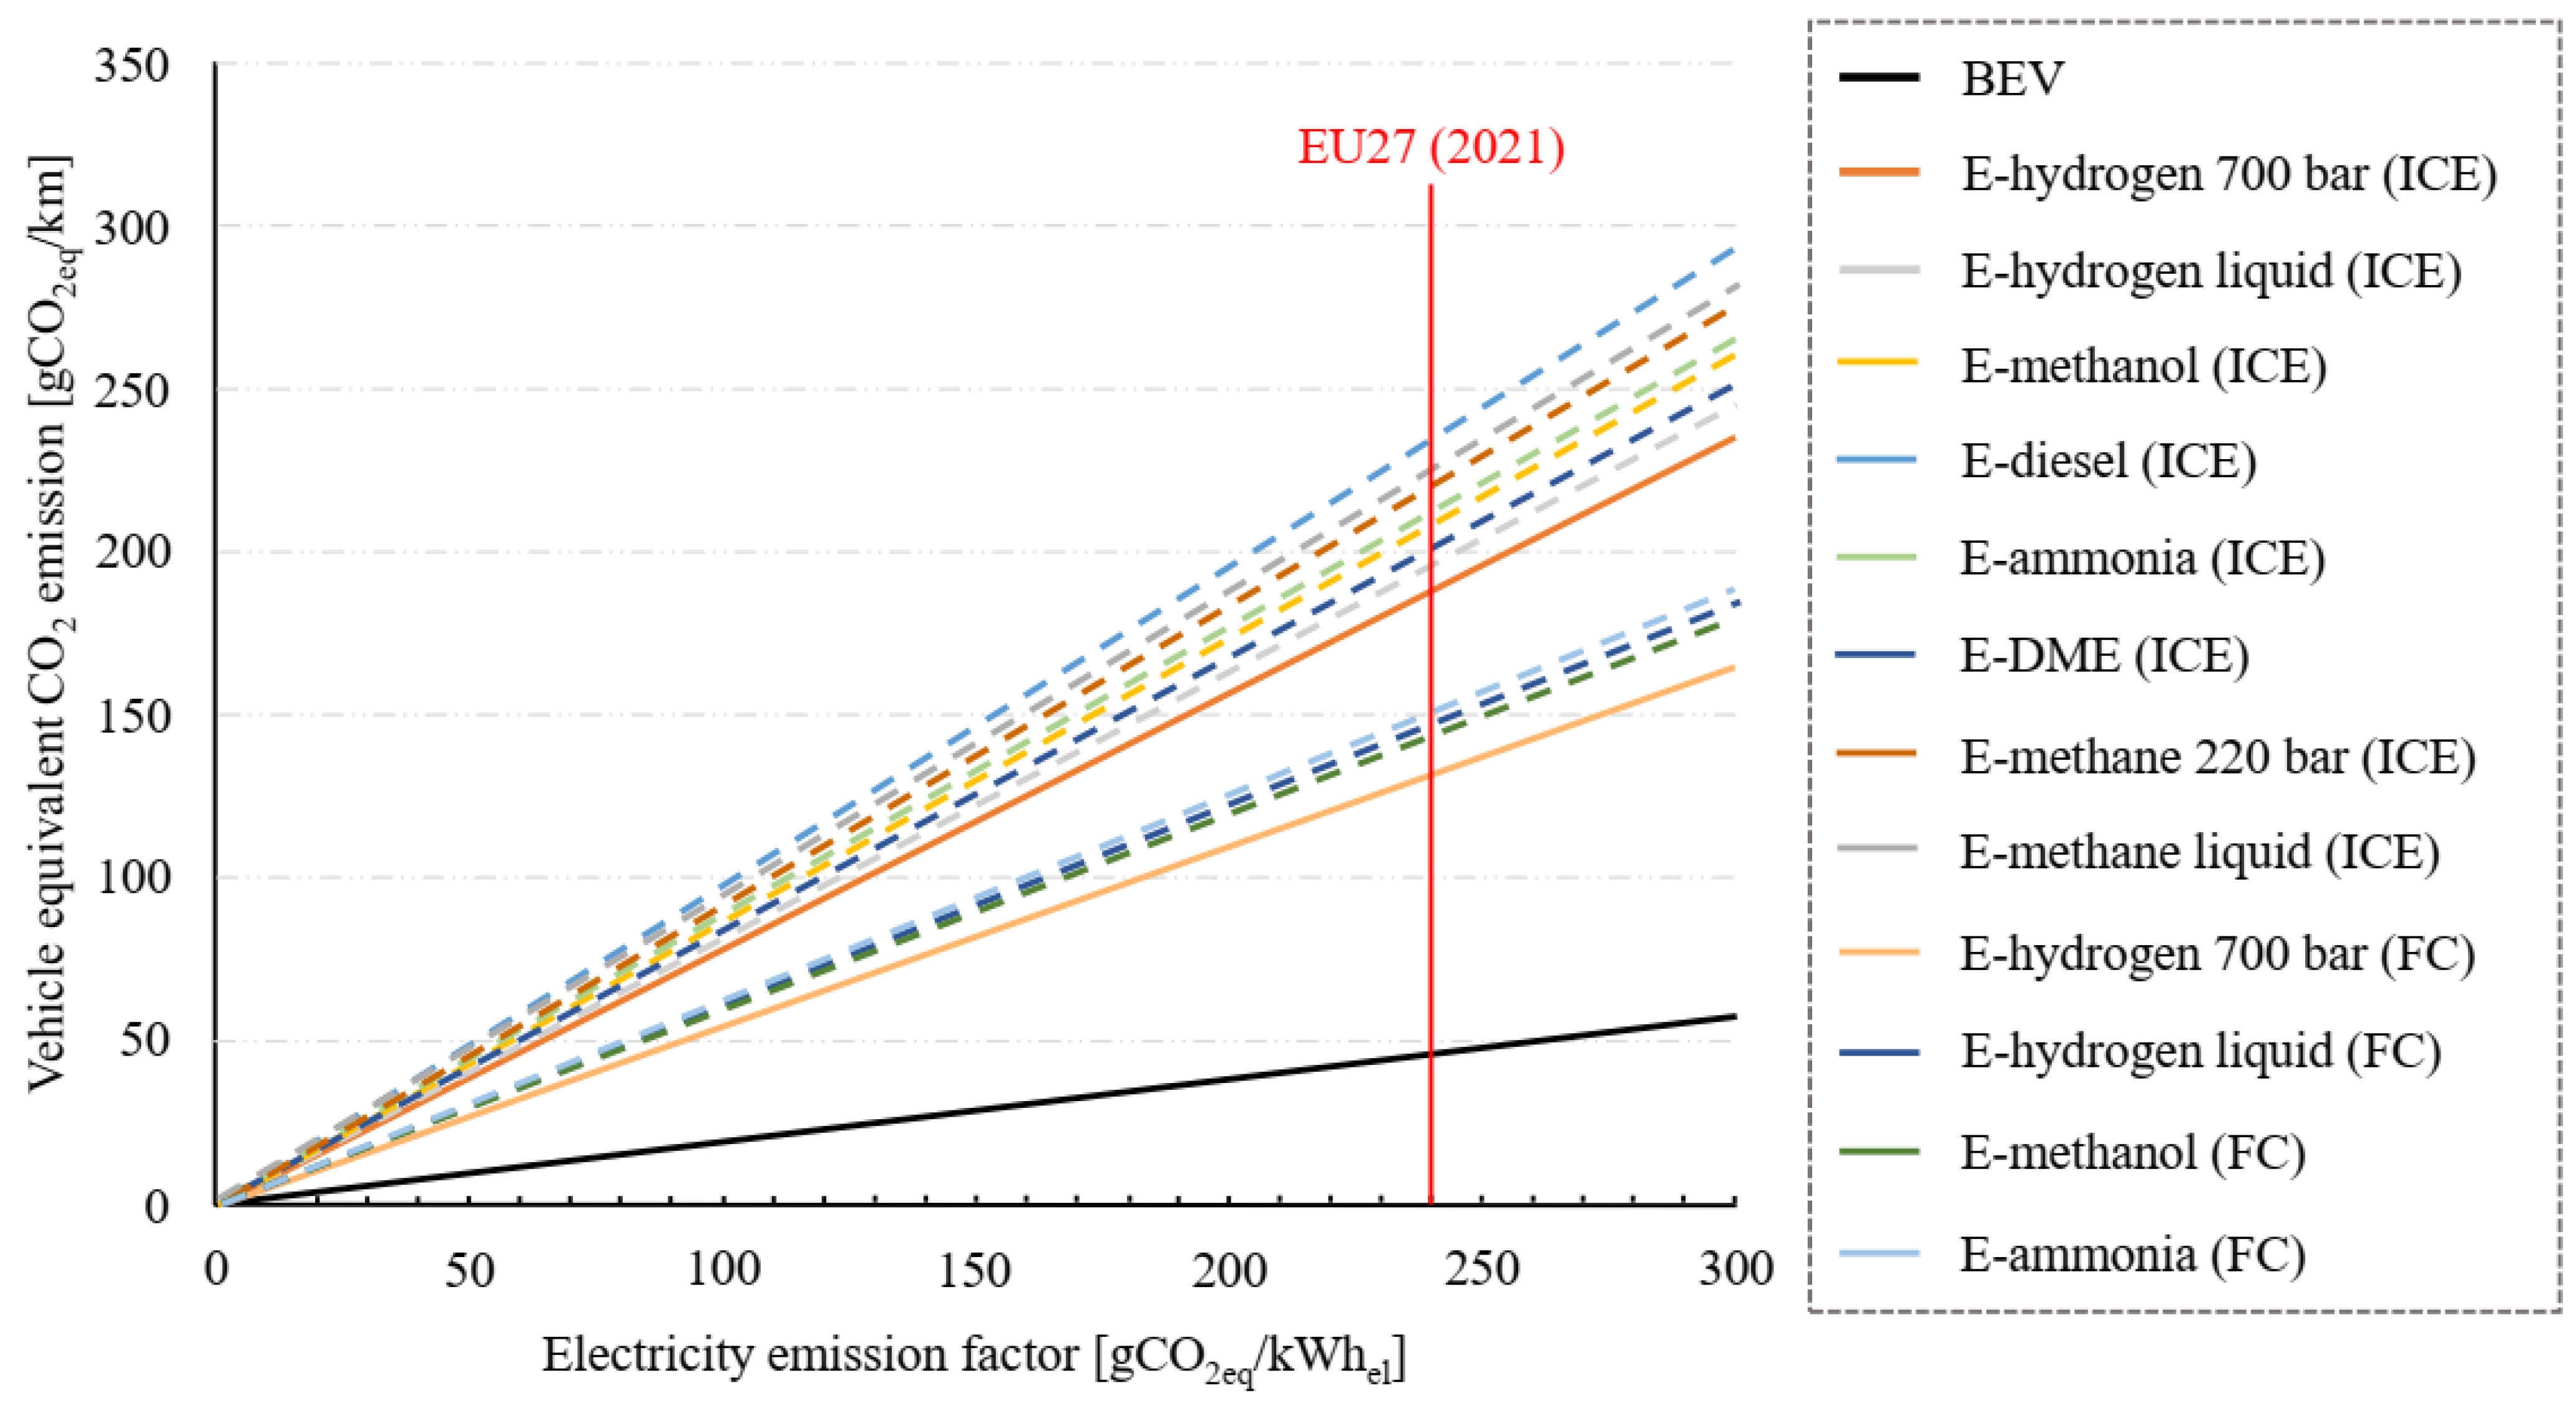
4.3. Climate Mitigation Effectiveness
5. E-Fuel Challenges and Perspectives
6. Conclusions
Author Contributions
Funding
Conflicts of Interest
Abbreviations
| AEC | Alkaline electrolyzer cell |
| BEV | Battery electric vehicles |
| CCS | Carbon capture and storage |
| CCUS | Carbon capture utilization and storage |
| CRL | Commercial readiness level |
| CSIRO | Commonwealth scientific and industrial research organization |
| DAC | Direct air capture |
| DME | Dimethyl ether |
| FC | Fuel-Cell |
| FT | Fischer–Tropsch synthesis |
| GHG | Greenhouse gas |
| GtL | Gas-to-liquid |
| GWP | Global warming potential |
| ICE | Internal combustion engine |
| JRC | Joint research centre |
| LCA | Life cicle assessment |
| LHV | Lower Heating Value |
| LPG | Liquefied Petroleum Gas |
| MRL | Market readiness level |
| MTG | Methanol-to-Gasoline |
| OMEx | Oxymethylene ethers |
| PEM | Proton exchange membrane |
| PtF | Power-to-fuel |
| PtG | Power-to-gas |
| PtL | Power-to-liquid |
| PtX | Power-to-X |
| RES | Renewable energy sources |
| RFNBO | Renewable fuels of non-biological origin |
| RWGS | Reverse water gas shift |
| SAF | Sustainable Aviation Fuel |
| SOEC | Solid oxide electrolyzer cell |
| TRL | Technology readiness level |
| TSA | Temperature swing adsorption |
| TTW | Tank-to-Wheel efficiency |
| WLTP | Worldwide harmonized vehicles test procedure |
| WTT | Well-to-Tank efficiency |
| WTW | Well-to-Wheel efficiency |
References
- Our World in Data. Available online: https://ourworldindata.org/grapher/global-fossil-fuel-consumption (accessed on 12 February 2024).
- Energy Institute. Available online: https://www.energyinst.org/statistical-review (accessed on 12 February 2024).
- Bp Global. Available online: https://www.bp.com/content/dam/bp/business-sites/en/global/corporate/pdfs/energy-economics/statistical-review/bp-stats-review-2021-full-report.pdf (accessed on 12 February 2024).
- Lund, L. Introduction to Chemistry; LibreTexts: Coon Rapids, MN, USA, 2023; pp. 16.1.1–16.14.1. [Google Scholar]
- Kovacs, B.; Mathijs, E.; Freibauer, A.; Brunori, G.; Damianova, Z.; Faroult, E.; Girona, J.; OBrien, L.; Treyer, S. Sustainable Food Consumption and Production in a Resource-Constrained World, 3rd ed.; EuroChoices: Leeuwarden, The Netherlands, 2011. [Google Scholar]
- Our World in Data. Available online: https://ourworldindata.org/grapher/ghg-emissions-by-gas (accessed on 12 February 2024).
- Our World in Data. Available online: https://ourworldindata.org/explorers/climate-change?facet=none&Metric=Temperature+anomaly&Long-run+series=false&country=OWID_WRL~ATA~Gulkana+Glacier~Lemon+Creek+Glacier~OWID_NAM~South+Cascade+Glacier~Wolverine+Glacier~Hawaii~Arctic+Ocean (accessed on 12 February 2024).
- GISTEMP Team. GISS Surface Temperature Analysis (GISTEMP), Version 4; NASA Goddard Institute for Space Studies: New York, NY, USA, 2024. Available online: https://data.giss.nasa.gov/gistemp/ (accessed on 12 February 2024).
- Newman, R.; Noy, I. The global costs of extreme weather that are attributable to climate change. Nat. Commun. 2023, 14, 6103. [Google Scholar] [CrossRef] [PubMed]
- Arshad, M.; Zia, M.; Shah, S.F.; Ahmad, M. An Overview of Biofuel. In Perspectives on Water Usage for Biofuels Production; Arshad, M., Ed.; Springer: Lahore, Pakistan, 2018; pp. 1–37. [Google Scholar]
- Das, P.; Gundimeda, H. Is biofuel expansion in developing countries reasonable? A review of empirical evidence of food and land use impacts. J. Clean. Prod. 2022, 372, 133501. [Google Scholar] [CrossRef]
- Ruth, C.; Stephanopoulos, G. Synthetic fuels: What are they and where do they come from? Curr. Opin. Biotechnol. 2023, 81, 102919. [Google Scholar] [CrossRef] [PubMed]
- Ram, V.; Salkuti, S.R. An Overview of Major Synthetic Fuels. Energies 2023, 16, 2834. [Google Scholar] [CrossRef]
- Nemmour, A.; Inayat, A.; Janajreh, I.; Ghenai, C. Green hydrogen-based E-fuels (E-methane, E-methanol, E-ammonia) to support clean energy transition: A literature review. Int. J. Hydrogen Energy 2023, 48, 29011–29033. [Google Scholar] [CrossRef]
- Ueckerdt, F.; Bauer, C.; Dirnaichner, A.; Everall, J.; Sacchi, R.; Luderer, G. Potential and risks of hydrogen-based e-fuels in climate change mitigation. Nat. Clim. Chang. 2021, 11, 384–393. [Google Scholar] [CrossRef]
- Ababneh, H.; Hameed, B.H. Electrofuels as emerging new green alternative fuel: A review of recent literature. Energy Convers. Manag. 2022, 254, 115213. [Google Scholar] [CrossRef]
- Reddy, V.J.; Hariram, N.P.; Maity, R.; Ghazali, M.F.; Kumarasamy, S. Sustainable E-Fuels: Green Hydrogen, Methanol and Ammonia for Carbon-Neutral Transportation. World Electr. Veh. J. 2023, 14, 349. [Google Scholar] [CrossRef]
- Bharti, S.; Chauhan, B.V.S.; Garg, A.; Vedrtnam, A.; Shukla, M.K. Potential of E-Fuels for Decarbonization of Transport Sector. In Greener and Scalable E-Fuels for Decarbonization of Transport; Agarwal, A.K., Valera, H., Eds.; Springer: Singapore, 2022; pp. 9–32. [Google Scholar]
- Galimova, T.; Ram, M.; Bogdanov, D.; Fasihi, M.; Khalili, S.; Gulagi, A.; Karjunen, H.; Mensah, T.N.O.; Breyer, C. Global demand analysis for carbon dioxide as raw material from key industrial sources and direct air capture to produce renewable electricity-based fuels and chemicals. J. Clean. Prod. 2022, 373, 133920. [Google Scholar] [CrossRef]
- Galimova, T.; Ram, M.; Bogdanov, D.; Fasihi, M.; Gulagi, A.; Khalili, S. Global trading of renewable electricity-based fuels and chemicals to enhance the energy transition across all sectors towards sustainability. Renew. Sustain. Energy Rev. 2023, 183, 113420. [Google Scholar] [CrossRef]
- Perner, J.; Unteutsch, M.; Lövenich, A. The Future Cost of Electricity-Based Synthetic Fuels. In Agora Verkehrswende, Agora Energiewende and Frontier Economics (2018): The Future Cost of Electricity-Based Synthetic Fuels; Energiewende, A., Verkehrswende, A., Eds.; Frontier Economics: Cologne, Germany; Im Zollhafen: Cologne, Germany, 2018; pp. 7–41. [Google Scholar]
- Tsiklios, C.; Schneider, S.; Hermesmann, M.; Müller, T.E. Efficiency and optimal load capacity of E-Fuel-Based energy storage systems. Adv. Appl. Energy 2023, 10, 100140. [Google Scholar] [CrossRef]
- Viscardi, R.; Nigliaccio, G.; Bassano, C.; Deiana, P. The potential of E-fuels as future fuels. FOCUS ENEA 2021, 112–116. [Google Scholar]
- Palys, M.J.; Daoutidis, P. Power-to-X: A review and perspective. Comput. Chem. Eng. 2022, 165, 107948. [Google Scholar] [CrossRef]
- Decourt, B. Weaknesses and drivers for power-to-X diffusion in Europe. Insights from technological innovation system analysis. Int. J. Hydrogen Energy 2019, 44, 17411–17430. [Google Scholar] [CrossRef]
- Research Gate. Available online: https://www.researchgate.net/publication/369229902_The_Best_Fuels_For_The_Future (accessed on 12 February 2024).
- Yugo, M.; Soler, A. Role of e-Fuels in the European Transport System—Literature Review; Report no. 14/19; Concawe: Brussels, Belgium, 2020. [Google Scholar]
- Zlenko, M.; Terenchenko, A. E-fuels—Last hope for internal combustion engine. Tr. NAMI 2023, 81, 15–34. [Google Scholar] [CrossRef]
- ICCT. The International Council on Clean Transportation. Available online: https://theicct.org/e-fuels-wont-save-the-internal-combustion-engine/#:~:text=To%20compound%20the%20problem%2C%20according%20to%20various%20studies,energy%20from%20the%20sun%20or%20wind%20is%20lost. (accessed on 12 February 2024).
- Transport & Environment. Available online: https://www.transportenvironment.org/discover/e-fuels-in-trucks-expensive-scarce-and-less-green-than-batteries/ (accessed on 12 February 2024).
- Krajinska, A. Magic green fuels. Why synthetic fuels in cars will not solve Europe’s pollution problems. Transp. Environ. 2021, 33–39. Available online: https://www.concawe.eu/publication/concawes-response-to-the-publication-and-presentation-of-tes-report-magic-green-fuels-why-synthetic-fuels-in-cars-will-not-solve-europes-pollution-problems/ (accessed on 12 February 2024).
- Pasini, G.; Lutzemberger, G.; Ferrari, L. Renewable Electricity for Decarbonisation of Road Transport: Batteries or E-Fuels? Batteries 2023, 9, 135. [Google Scholar] [CrossRef]
- Baykara, S.Z. Hydrogen: A brief overview on its sources, production and environmental impact. Int. J. Hydrogen Energy 2018, 43, 10605–10614. [Google Scholar] [CrossRef]
- Rameez, P.V.; Mohamed Ibrahim, M. A comprehensive review on the utilization of hydrogen in low temperature combustion strategies: Combustion, performance and emission attributes. J. Energy Inst. 2024, 113, 101511. [Google Scholar] [CrossRef]
- Bonah Agyekum, E.; Odoi-Yorke, F.; Abeley Abbey, A.; Kafui Ayetor, G. A review of the trends, evolution, and future research prospects of hydrogen fuel cells—A focus on vehicles. Int. J. Hydrogen Energy 2024, 72, 918–939. [Google Scholar] [CrossRef]
- Taskin, J.; Shafiullah, G.M.; Dawood, F.; Kaur, A.; Arif, M.T.; Pugazhendhi, R.; Elavarasan, R.M.; Forruque, S.A. Fuelling the future: An in-depth review of recent trends, challenges and opportunities of hydrogen fuel cell for a sustainable hydrogen economy. Energy Rep. 2023, 10, 2103–2127. [Google Scholar]
- Lixin, F.; Zhengkai, T.; Siew, H.C. Recent development of hydrogen and fuel cell technologies: A review. Energy Rep. 2021, 7, 8421–8446. [Google Scholar]
- European Hydrogen Observatory. Available online: https://observatory.clean-hydrogen.europa.eu/hydrogen-landscape/end-use/hydrogen-fuel-cell-electric-vehicles (accessed on 3 January 2024).
- Statista. Global Hydrogen Fuel Cell Electric Vehicle Sales in 2023, by Country or Region. Available online: https://www.statista.com/statistics/1454512/annual-fcev-sales-by-country-or-region/ (accessed on 3 January 2024).
- Pramuanjaroenkij, A.; Kakaç, S. The fuel cell electric vehicles: The highlight review. Int. J. Hydrogen Energy 2023, 48, 9401–9425. [Google Scholar] [CrossRef]
- Gómez, J.; Santos, D. The Status of On-Board Hydrogen Storage in Fuel Cell Electric Vehicles. Designs 2023, 7, 97. [Google Scholar] [CrossRef]
- International Energy Agency. Global Hydrogen Review 2023; Licence: CC BY 4.0.; IEA: Paris, France, 2021; Available online: https://www.iea.org/reports/global-hydrogen-review-2023 (accessed on 12 February 2024).
- Mahajan, D.; Tan, K.; Venkatesh, T.; Kileti, P.; Clayton, C.R. Hydrogen Blending in Gas Pipeline Networks—A Review. Energies 2022, 15, 3582. [Google Scholar] [CrossRef]
- Habib, M.A.; Abdulrahman, G.A.Q.; Alquaity, A.B.S.; Qasem, N.A.A. Hydrogen combustion, production, and applications: A review. Alex. Eng. J. 2024, 100, 182–207. [Google Scholar] [CrossRef]
- Yip, H.L.; Srna, A.; Yuen, A.C.Y.; Kook, S.; Taylor, R.A.; Yeoh, G.H.; Medwell, P.R.; Chan, Q.N. A Review of Hydrogen Direct Injection for Internal Combustion Engines: Towards Carbon-Free Combustion. Appl. Sci. 2019, 9, 4842. [Google Scholar] [CrossRef]
- Alasali, F.; Abuashour, M.I.; Hammad, W.; Almomani, D.; Obeidat, A.M.; Holderbaum, W. A review of hydrogen production and storage materials for efficient integrated hydrogen energy systems. Energy Sci. Eng. 2024, 12, 1934–1968. [Google Scholar] [CrossRef]
- Muhammad, R.U. Hydrogen storage methods: Review and current status. Renew. Sust. Energ. Rev. 2022, 167, 112743. [Google Scholar]
- Zuttel, A. Hydrogen storage methods. Naturwissenschaften 2004, 91, 157–172. [Google Scholar] [CrossRef]
- Prabhukhot, P.R.; Wagh, M.M.; Gangal, A.C. A review on solid state hydrogen storage material. Adv. Energy Power 2016, 4, 11–22. [Google Scholar]
- Barthelemy, H.; Weber, M.; Barbier, F. Hydrogen storage: Recent improvements and industrial perspectives. Int. J. Hydrogen Energy 2017, 42, 7254–7262. [Google Scholar] [CrossRef]
- Froudakis, G.E. Hydrogen storage in nanotubes & nanostructures. Mater. Today 2011, 14, 324–328. [Google Scholar]
- Ren, J.; Musyoka, N.M.; Langmi, H.W.; Mathe, M.; Liao, S. Current research trends and perspectives on materials-based hydrogen storage solutions: A critical review. Int. J. Hydrogen Energy 2017, 42, 289–311. [Google Scholar] [CrossRef]
- Bartocci, P.; Russo, G.; Yang, H.; Hu, S.; Skreiberg, O.; Wang, L.; Gallucci, F.; Bidini, G.; Fantozzi, F. Carbon Nanotubes for Hydrogen Purification and Storage. In Green Synthesis of Nanomaterials for Bioenergy Applications; John Wiley & Sons, Ltd.: Hoboken, NJ, USA, 2020; pp. 211–238. [Google Scholar]
- Gas World. Available online: https://www.gasworld.com/story/air-liquide-commissions-worlds-largest-hydrogen-storage-facility-in-texas/ (accessed on 3 January 2024).
- Younas, M.; Shafique, S.; Hafeez, A.; Javed, F.; Rehman, F. An Overview of Hydrogen Production: Current Status, Potential, and Challenges. Fuel 2022, 316, 123317. [Google Scholar] [CrossRef]
- Sengodan, S.; Lan, R.; Humphreys, J.; Du, D.; Xu, W.; Wang, H.; Tao, S. Advances in reforming and partial oxidation of hydrocarbons for hydrogen production and fuel cell applications. Renew. Sustain. Energy Rev. 2018, 82, 761–780. [Google Scholar] [CrossRef]
- Vita, A.; Pino, L.; Italiano, C.; Palella, A. Chapter 6—Steam Reforming, Partial Oxidation, and Autothermal Reforming of Ethanol for Hydrogen Production in Conventional Reactors. In Ethanol; Basile, A., Iulianelli, A., Dalena, F., Nejat Veziroğlu, T., Eds.; Elsevier: Amsterdam, The Netherlands, 2019; pp. 159–191. [Google Scholar]
- Chen, W.H.; Biswas, P.P.; Ong, H.C.; Hoang, A.T.; Nguyen, T.B.; Dong, C.D. A critical and systematic review of sustainable hydrogen production from ethanol/bioethanol: Steam reforming, partial oxidation, and autothermal reforming. Fuel 2023, 333, 126526. [Google Scholar] [CrossRef]
- Yusaf, T.; Fernandes, L.; Abu Talib, A.R.; Altarazi, Y.; Alrefae, W.; Kadirgama, K.; Ramasamy, D. Sustainable aviation—Hydrogen is the future. Sustainability 2022, 14, 548. [Google Scholar] [CrossRef]
- Qing, L.; Baoguo, W.; Peican, W.; Shuai, L. Hydrogen generation with acid/alkaline amphoteric water electrolysis. J. Energy Chem. 2019, 38, 162–169. [Google Scholar] [CrossRef]
- Ahmad Kamaroddin, M.F.; Sabli, N.; Tuan Abdullah, T.A.; Siajam, S.I.; Abdullah, L.C.; Abdul Jalil, A.; Ahmad, A. Membrane-Based Electrolysis for Hydrogen Production: A Review. Membranes 2021, 11, 810. [Google Scholar] [CrossRef]
- Pandiyan, A.; Uthayakumar, A.; Subrayan, R.; Cha, S.; Krishna Moorthy, S.B. Review on Solid Oxide Electrolysis Cell: A Clean Energy Strategy for Hydrogen Generation. Nanomater. Energy 2019, 8, 2–22. [Google Scholar] [CrossRef]
- Luo, Y.; Liu, T.; Wang, Y.; Ding, M. High-temperature CO2 electrolysis in solid oxide electrolysis cells cathode: Advances and perspective. Chem. Catal. 2023, 3, 100815. [Google Scholar] [CrossRef]
- Wolf, S.E.; Winterhalder, F.E.; Vibhu, V.; de Haart, L.G.J.; Guillon, O.; Eichel, R.A.; Menzler, N.H. Solid oxide electrolysis cells—Current material development and industrial application. J. Mater. Chem. A 2023, 11, 17977–18028. [Google Scholar] [CrossRef]
- Nechache, A.; Hody, S. Alternative and innovative solid oxide electrolysis cell materials: A short review. Renew. Sustain. Energy Rev. 2021, 149, 111322. [Google Scholar] [CrossRef]
- Lahrichi, A.; El Issmaeli, Y.; Kalanur, S.S.; Pollet, B.G. Advancements, strategies, and prospects of solid oxide electrolysis cells (SOECs): Towards enhanced performance and large-scale sustainable hydrogen production. J. Energy Chem. 2024, 94, 688–715. [Google Scholar] [CrossRef]
- Dermühl, S.; Riedel, U. A comparison of the most promising low-carbon hydrogen production technologies. Fuel 2023, 340, 127478. [Google Scholar] [CrossRef]
- Nicita, A.; Maggio, G.; Andaloro, A.P.F.; Squadrito, G. Green hydrogen as feedstock: Financial analysis of a photovoltaic-powered electrolysis plant. Int. J. Hydrogen Energy 2020, 45, 11395–11408. [Google Scholar] [CrossRef]
- IRENA. Green Hydrogen Cost Reduction; IRENA: Masdar City, United Arab Emirates, 2020; ISBN 9789292602956. [Google Scholar]
- Yoro, K.O.; Daramola, M.O. Chapter 1—CO2 emission sources, greenhouse gases, and the global warming effect. In Advances in Carbon Capture; Rahimpour, M.R., Farsi, M., Makarem, M.A., Eds.; Woodhead Publishing: Cambridge, UK, 2020; pp. 3–28. [Google Scholar]
- Yue, X.L.; Gao, Q.X. Contributions of natural systems and human activity to greenhouse gas emissions. Adv. Clim. Chang. Res. 2018, 9, 243–252. [Google Scholar] [CrossRef]
- Bruhwiler, L.; Michalak, A.M.; Birdsey, R.; Fisher, J.B.; Houghton, R.A.; Huntzinger, D.N.; Miller, J.B. Chapter 1: Overview of the global carbon cycle. In Second State of the Carbon Cycle Report (SOCCR2): A Sustained Assessment Report; U.S. Global Change Research Program: Washington, DC, USA, 2018; pp. 42–70. [Google Scholar]
- CO2 Human Emissions. How do Human CO2 Emissions Compare to Natural CO2 Emissions? Available online: https://www.che-project.eu/news/how-do-human-co2-emissions-compare-natural-co2-emissions (accessed on 3 January 2024).
- Oke, D.; Dunn, J.B.; Hawkins, T.R. Reducing Economy-Wide Greenhouse Gas Emissions with Electrofuels and Biofuels as the Grid Decarbonizes. Energy Fuels 2024, 38, 6048–6061. [Google Scholar] [CrossRef]
- Wilberforce, T.; Olabi, A.G.; Sayed, E.T.; Elsaid, K.; Abdelkareem, M.A. Progress in carbon capture technologies. Sci. Total Environ. 2021, 761, 143203. [Google Scholar] [CrossRef]
- Global CCS Institute. Available online: https://www.globalccsinstitute.com/resources/global-status-of-ccs-2022/ (accessed on 4 March 2023).
- Wilberforce, T.; Baroutaji, A.; Soudan, B.; Al-Alami, A.H.; Olabi, A.G. Outlook of carbon capture technology and challenges. Sci. Total Environ. 2019, 657, 56–72. [Google Scholar] [CrossRef]
- Bae, J.S.; Su, S. Macadamia nut shell-derived carbon composites for post combustion CO2 capture. Int. J. Greenh. Gas Control 2013, 19, 1750–5836. [Google Scholar] [CrossRef]
- D’Alessandro, D.M.; Smit, B.; Long, J.R. Carbon dioxide capture: Prospects for new materials. Angew. Chem. Int. Ed. 2010, 49, 6058–6082. [Google Scholar] [CrossRef] [PubMed]
- Soler, A.; Dekeyser, J.; Gordillo, V.; Lilley, W. E-Fuels: A Techno-Economic Assessment of European Domestic Production and Imports Towards 2050—Update; Report no. 4/24; Concawe: Brussels, Belgium, 2024. [Google Scholar]
- LBST. The Potential of Electricity-Based Fuels for a Low-Emission Transport Sector in the EU. Available online: https://en.lbst.de/publikationen/e-fuels-study/ (accessed on 24 March 2024).
- Wang, E.; Navik, R.; Miao, Y.; Gao, Q.; Izikowitz, D.; Chen, L.; Li, J. Reviewing direct air capture startups and emerging technologies. Cell Rep. Phys. Sci. 2024, 5, 101791. [Google Scholar] [CrossRef]
- Ozkan, K.; Nayak, S.P.; Ruiz, A.D.; Jiang, W. Current status and pillars of direct air capture technologies. iScience 2022, 25, 103990. [Google Scholar] [CrossRef] [PubMed]
- iea50. Available online: https://www.iea.org/energy-system/carbon-capture-utilisation-and-storage/direct-air-capture (accessed on 24 March 2024).
- Schmidt, P.; Zittel, W.; Weindorf, W.; Rakasha, T.; Goericke, D. Renewables in transport 2050—Empowering a sustainable mobility future with zero emission fuels. In Proceedings of the 16 Internationales Stuttgarter Symposium, Wiesbaden, Germany, 3 March 2016. [Google Scholar] [CrossRef]
- Carbon Engeneering. Available online: https://carbonengineering.com/our-technology/ (accessed on 12 March 2024).
- Keith, D.W.; Holmes, G.; St. Angelo, D.; Heidel, K. A Process for Capturing CO2 from the Atmosphere. Joule 2018, 2, 1573–1594. [Google Scholar] [CrossRef]
- Sodiq, A.; Abdullatif, Y.M.; Aissa, B.; Ostovar, A.; Nassar, N.N.; El-Naas, M.; Amhamed, A. A review on progress made in direct air capture of CO2. Environ. Technol. Innov. 2023, 29, 102991. [Google Scholar]
- Climeworks. Available online: https://climeworks.com/plant-mammoth (accessed on 12 March 2024).
- Smith, A.R.; Klosek, J. A review of air separation technologies and their integration with energy conversion processes. Fuel Process. Technol. 2001, 70, 115–134. [Google Scholar] [CrossRef]
- Fúnez Guerra, C.; Reyes-Bozo, L.; Vyhmeister, E.; Jaén Caparrós, M.; Salazar, J.L.; Clemente-Jul, C. Technical-economic analysis for a green ammonia production plant in Chile and its subsequent transport to Japan. Renew. Energy 2020, 157, 404–414. [Google Scholar] [CrossRef]
- Klein, H.; Fritsch, P.; Haider, P.; Kender, R.; Rößler, F.; Rehfeldt, S.; Freko, P.; Hoffmann, R.; Thomas, I.; Wunderlich, B. Flexible Operation of Air Separation Units. ChemBioEng Rev. 2020, 8, 357–374. [Google Scholar] [CrossRef]
- Bozorg, M.; Addis, B.; Piccialli, V.; Ramírez-Santos, A.A.; Castel, C.; Pinnau, I.; Favre, E. Polymeric membrane materials for nitrogen production from air: A process synthesis study. Chem. Eng. Sci. 2019, 207, 1196–1213. [Google Scholar] [CrossRef]
- Lemcoff, N.O. Nitrogen separation from air by pressure swing adsorption. In Adsorption and Its Applications in Industry and Environmental Protection; Dąbrowski, A., Ed.; Elsevier: Philadelphia, PA, USA, 1999; pp. 347–370. [Google Scholar]
- Hardenburger, T.L.; Ennis, M. Nitrogen. In Kirk-Othmer Encyclopedia of Chemical Technology; John Wiley & Sons, Ltd.: London, UK, 2000. [Google Scholar]
- Sánchez, A.; Martín, M. Scale up and scale down issues of renewable ammonia plants: Towards modular design. Sustain. Prod. Consum. 2018, 16, 176–192. [Google Scholar] [CrossRef]
- Rouwenhorst, K.H.R.; Van der Ham, A.G.J.; Mul, G.; Kersten, S.R.A. Islanded Ammonia Power Systems: Technology Review & Conceptual Process Design. Renew. Sustain. Energy Rev. 2019, 114, 109339. [Google Scholar]
- Zhang, H.; Wang, L.; Van herle, J.; Maréchal, F.; Desideri, U. Techno-economic comparison of green ammonia production processes. Appl. Energy 2020, 259, 114135. [Google Scholar] [CrossRef]
- IEA. Nitrogen Demand by End Use and Scenario, 2020–2050. Available online: https://www.iea.org/data-and-statistics/charts/nitrogen-demand-by-end-use-and-scenario-2020-2050 (accessed on 2 March 2024).
- Elishav, O.; Lewin, D.R.; Shter, G.E.; Grader, G.S. The nitrogen economy: Economic feasibility analysis of nitrogen-based fuels as energy carriers. Appl. Energy 2017, 185, 183–188. [Google Scholar] [CrossRef]
- El-Shafie, M. Hydrogen production by water electrolysis technologies: A review. Results Eng. 2023, 20, 101426. [Google Scholar] [CrossRef]
- Dresp, S.; Dionigi, F.; Klingenhof, M.; Strasser, P. Direct Electrolytic Splitting of Seawater: Opportunities and Challenges. ACS Energy Lett. 2019, 4, 933–942. [Google Scholar] [CrossRef]
- Soler, A.; Gordillo, V.; Lilley, W.; Schmidt, P.; Werner, W.; Houghton, T.; Dell’Orco, S. E-Fuels: A Techno-Economic Assessment of European Domestic Production and Imports Towards 2050; Report no. 17/22; Concawe: Brussels, Belgium, 2022. [Google Scholar]
- Cerulogy. What Role Is There for Electrofuel Technologies in European Transport’s Low Carbon Future? Available online: https://www.cerulogy.com/power-to-the-people-what-role-is-there-for-electrofuel-technologies-in-european-transports-low-carbon-future/ (accessed on 2 March 2024).
- Our World in Data. Available online: https://ourworldindata.org/grapher/share-energy-source-sub (accessed on 2 March 2024).
- Our World in Data. Available online: https://ourworldindata.org/grapher/carbon-intensity-electricity?tab=chart (accessed on 12 February 2024).
- Transport & Environment. What the EU’s New Renewable Energy Directive Means for Clean Fuels in Europe. Available online: https://www.transportenvironment.org/discover/what-the-eus-new-renewable-energy-directive-mean-for-clean-fuels-in-europe/ (accessed on 12 February 2024).
- DeutschUrs, M.; Maier, U. The Future Cost of Electricity-Based Synthetic Fuels: Conclusions Drawn by Agora Verkehrswende and Agora Energiewende. In The Future Cost of Electricity-Based Synthetic Fuels; Perner, J., Unteutsch, M., Lövenich, A., Eds.; Frontier Economics: Cologne, Germany; Im Zollhafen: Cologne, Germany, 2018; pp. 41–96. [Google Scholar]
- Qi, M.; Nguyen Vo, D.; Yu, H.; Shu, C.M.; Cui, C.; Liu, Y.; Park, J.; Moon, I. Strategies for flexible operation of power-to-X processes coupled with renewables. Renew. Sustain. Energy Rev. 2023, 179, 113282. [Google Scholar] [CrossRef]
- Guerra, L.; Rossi, S.; Rodrigues, J.; Gomes, J.; Puna, J.; Santos, M.T. Methane production by a combined Sabatier reaction/water electrolysis process. J. Environ. Chem. Eng. 2018, 6, 671–676. [Google Scholar] [CrossRef]
- Myhre, G.; Shindell, D.; Bréon, F.M.; Collins, W.; Fuglestvedt, J.; Huang, J.; Koch, D.; Lamarque, J.F.; Lee, D.; Mendoza, B.; et al. Anthropogenic and natural radiative forcing. In Climate Change 2013: The Physical Science Basis. Contribution of Working Group I to the Fifth Assessment Report of the Intergovernmental Panel on Climate Change; Stocker, T.F., Qin, D., Plattner, G.K., Tignor, M., Allen, S.K., Doschung, J., Nauels, A., Xia, Y., Bex, V., Midgley, P.M., Eds.; Cambridge University Press: Cambridge, UK, 2013; pp. 659–740. [Google Scholar]
- Barbarossa, V.; Bassano, C.; Deiana, P.; Vanga, G. CO2 Conversion to CH4. In CO2: A Valuable Source of Carbon; Springer: London, UK, 2013; pp. 123–145. [Google Scholar]
- Foscolo, P.U.; Gallucci, K.; Micheli, F. Studio della Valorizzazione Dell’Impianto di Gassificazione di Biomasse a Letto Fluidizzato Internamente Ricircolante per la Produzione di Metano; Report RdS/2011/137; ENEA: Rome, Italy, 2011. [Google Scholar]
- Baccioli, A.; Bargiacchi, E.; Barsali, S.; Ciambellotti, A.; Fioriti, D.; Giglioli, R.; Pasini, G. Cost effective power-to-x plant using carbon dioxide from a geothermal plant to increase renewable energy penetration. Energy Convers. Manag. 2020, 226, 113–494. [Google Scholar] [CrossRef]
- Wang, L.; Rao, M.; Diethelm, S.; Lin, T.E.; Zhang, H.; Hagen, A.; Maréchal, F.; Van-herle, J. Power-to-methane via co-electrolysis of H2O and CO2: The effects of pressurized operation and internal methanation. Appl. Energy 2019, 250, 1432–1445. [Google Scholar] [CrossRef]
- Africa, S.; Rivarolo, M.; Porcheddu, E.; Magistri, L. Distributed hydro-methane generation from renewable sources: Influence of economic scenario. In Proceedings of the ICAE 2013, Pretoria, South Africa, 12–15 November 2013; pp. 1–10. Available online: https://www.researchgate.net/publication/263633789_DISTRIBUTED_HYDRO-METHANE_GENERATION_FROM_RENEWABLE_SOURCES_INFLUENCE_OF_ECONOMIC_SCENARIO (accessed on 12 February 2024).
- Audi. Power-to-Gas Plant. Available online: https://www.audi.com.mt/mt/web/en/models/layer/technology/g-tron/power-to-gas-plant.html (accessed on 12 February 2024).
- Irena and Methanol Institute. Innovation Outlook: Renewable Methanol; International Renewable Energy Agency: Abu Dhabi, United Arab Emirates, 2021; ISBN 978-92-9260-320-5. [Google Scholar]
- Methanol Institute. Available online: https://www.methanol.org/ (accessed on 12 February 2024).
- Kajaste, R.; Hurme, M.; Oinas, P. Methanol-Managing greenhouse gas emissions in the production chain by optimizing the resource base. AIMS Energy 2018, 6, 1074–1102. [Google Scholar] [CrossRef]
- Araya, S.; Liso, V.; Cui, X.; Li, N.; Zhu, J.; Sahlin, S.L.; Jensen, S.H.; Nielsen, M.P.; Kaer, S.K. A review of the methanol economy: The fuel cell route. Energies 2020, 13, 596. [Google Scholar]
- Bower, M. Methanol Synthesis from CO2 Hydrogenation. ChemCatChem 2019, 11, 4238–4246. [Google Scholar] [CrossRef] [PubMed]
- Ma, J.; Sun, N.; Zhang, X.; Zhao, N.; Xiao, F.; Wei, W.; Sun, Y. A short review of catalysis for CO2 conversion. Catal. Today 2009, 148, 221–231. [Google Scholar] [CrossRef]
- Yousaf, M.; Mahmood, A.; Elkamel, A.; Rizwan, M.; Zaman, M. Techno-economic analysis of integrated hydrogen and methanol production process by CO2 hydrogenation. Int. J. Greenh. Gas. Control 2022, 115, 103615. [Google Scholar] [CrossRef]
- Dieterich, V.; Buttler, A.; Hanel, A.; Spliethoff, H.; Fendt, S. Power-to-liquid via synthesis of methanol, DME or Fischer—Tropsch-fuels: A review. Energy Environ. Sci. 2020, 13, 3207–3252. [Google Scholar] [CrossRef]
- Rivarolo, M.; Bellotti, D.; Magistri, L.; Massardo, A.F. Feasibility study of methanol production from different renewable sources and thermo-economic analysis. Int. J. Hydrogen Energy 2016, 41, 2105–2116. [Google Scholar] [CrossRef]
- Olah, G.A. Beyond oil and gas: The methanol economy. Angew. Chem. Int. Ed. 2005, 2636–2639. [Google Scholar] [CrossRef]
- Battaglia, P.; Buffo, G.; Ferrero, D.; Santarelli, M.; Lanzini, A. Methanol synthesis through CO2 capture and hydrogenation: Thermal integration, energy performance and techno-economic assessment. J. CO2 Util. 2021, 44, 101407. [Google Scholar] [CrossRef]
- Meesattham, S.; Kim-Lohsoontorn, P. Low-temperature alcohol-assisted methanol synthesis from CO2 and H2: The effect of alcohol type. Int. J. Hydrogen Energy 2022, 47, 22691–22703. [Google Scholar] [CrossRef]
- Jiang, H.; Zhang, L.; Han, Z.; Tang, Y.; Sun, Y.; Wan, P.; Chen, Y.; Argyle, M.D.; Fan, M. Direct conversion of methane to methanol by electrochemical methods. Green Energy Environ. 2022, 7, 1132–1142. [Google Scholar]
- Methanol Institute. Methanol Fuel in China; China Association of Alcohol and Ether Fuel and Automobiles (CAAEFA): Beijing, China, 2021. [Google Scholar]
- Sollai, S.; Porcu, A.; Tola, V.; Ferrara, F.; Pettinau, A. Renewable methanol production from green hydrogen and captured CO2: A techno-economic assessment. J. CO2 Util. 2023, 68, 102345. [Google Scholar] [CrossRef]
- Singh, H.; Li, C.; Cheng, P.; Wang, X.; Liu, Q. A critical review of technologies, costs, and projects for production of carbon-neutral liquid e-fuels from hydrogen and captured CO2. Energy Adv. 2022, 1, 580–605. [Google Scholar]
- ERTRAC. Sustainable Energies and Powertrains for Road Transport Towards Electrification and Other Renewable Energy Carriers. Available online: https://www.ertrac.org/documents/ (accessed on 12 February 2024).
- Olah, G.A.; Goeppert, A.; Surya Prakash, G.K. Chemical Recycling of Carbon Dioxide to Methanol and Dimethyl Ether: From Greenhouse Gas to Renewable, Environmentally Carbon Neutral Fuels and Synthetic Hydrocarbons. J. Org. Chem. 2009, 74, 487–498. [Google Scholar] [CrossRef]
- Baraj, E.; Ciahotný, K.; Hlinčík, T. The water gas shift reaction: Catalysts and reaction mechanism. Fuel 2021, 288, 119817. [Google Scholar] [CrossRef]
- Sunfire-Synlink Factsheet. Available online: https://www.sunfire.de/files/sunfire/images/content/Produkte_Technologie/factsheets/Sunfire-SynLink_FactSheet.pdf (accessed on 12 February 2024).
- Gonzalez-Castano, M.; Dorneanu, B.; Arellano-García, H. The reverse water gas shift reaction: A process systems engineering perspective. React. Chem. Eng. 2021, 6, 954–976. [Google Scholar] [CrossRef]
- Catizzone, E.; Bonura, G.; Migliori, M.; Frusteri, F.; Giordano, G. CO2 recycling to dimethyl ether: State-of-the-art and Perspectives. Molecules 2017, 23, 31. [Google Scholar] [CrossRef]
- Breitkreuz, C.F.; Hevert, N.; Schmitz, N.; Burger, J.; Hasse, H. Synthesis of Methylal and Poly(Oxymethylene) Dimethyl Ethers from Dimethyl Ether and Trioxane. Ind. Eng. Chem. Res. 2022, 61, 7810–7822. [Google Scholar] [CrossRef]
- Styring, P.; Dowson, G.; Tozer, I. Synthetic Fuels Based on Dimethyl Ether as a Future Non-Fossil Fuel for Road Transport From Sustainable Feedstocks. Front. Energy Res. 2021, 9, 663331. [Google Scholar] [CrossRef]
- Wiesmann, F.; Han, D.; Qiu, Z.; Straub, L.; Rieb, S.; Wensing, M.; Lauer, T. Numerical study of novel OME1-6 combustion mechanism and spray combustion at changed ambient environments. Front. Energy 2024, 18, 483–505. [Google Scholar] [CrossRef]
- Bakhtyari, A.; Bardool, R.; Rahimpour, M.R.; Iulianelli, A. Dehydration of Bio-Alcohols in an Enhanced Membrane-Assisted Reactor: A Rigorous Sensitivity Analysis and Multi-Objective Optimization. Renew. Energy 2021, 177, 519–543. [Google Scholar] [CrossRef]
- Calis, H.; Lüke, W.; Drescher, I.; Schütze, A. Synthetic Diesel Fuels. In Handbook of Fuels; Elvers, B., Schütze, A., Eds.; John Wiley & Sons, Ltd.: Hoboken, NJ, USA, 2021; pp. 161–200. [Google Scholar]
- Fabiś, P.; Flekiewicz, B. Influence of LPG and DME composition on spark ignition engine performance. Energies 2021, 14, 55–83. [Google Scholar] [CrossRef]
- Zhang, T.; Ou, K.; Jung, S.; Choi, B.; Kim, Y.-B. Dynamic analysis of a PEM fuel cell hybrid system with an on-board dimethyl ether (DME) steam reformer (SR). Int. J. Hydrogen Energy 2018, 43, 13521–13531. [Google Scholar] [CrossRef]
- O’Connell, A.; Konti, A.; Padella, M.; Prussi, M.; Lonza, L. Advanced Alternative Fuels Technology Market Report 2018; EUR 29937 EN; European Commission: Luxembourg, 2019; ISBN 978-92-76-12602-7. [Google Scholar] [CrossRef]
- Avidan, A.A. Gasoline and Distillate Fuels From Methanol. In Methane Conversion; Bibby, D.M., Chang, C.D., Howe, R.F., Yurchak, S., Eds.; Elsevier: Amsterdam, The Netherlands, 1988; pp. 307–323. [Google Scholar]
- Exxonmobil. Methanol to Gasoline Technology (MTG). Available online: https://www.exxonmobilchemical.com/en/catalysts-and-technology-licensing/methanol-to-gasoline-technology (accessed on 12 February 2024).
- Chun, D.H.; Rhim, G.B.; Youn, M.H.; Deviana, D.; Lee, J.E.; Park, J.C.; Jeong, H. Brief Review of Precipitated Iron-Based Catalysts for Low-Temperature Fischer–Tropsch Synthesis. Top. Catal. 2020, 63, 793–809. [Google Scholar] [CrossRef]
- Dos Santos, R.G.; Alencar, A.C. Biomass-Derived Syngas Production via Gasification Process and Its Catalytic Conversion into Fuels by Fischer Tropsch Synthesis: A Review. Int. J. Hydrogen Energy 2020, 45, 18114–18132. [Google Scholar] [CrossRef]
- Gupta, P.K.; Kumar, V.; Maity, S. Renewable Fuels from Different Carbonaceous Feedstocks: A Sustainable Route through Fischer–Tropsch Synthesis. J. Chem. Technol. Biotechnol. 2021, 96, 853–868. [Google Scholar] [CrossRef]
- Sun, J.; Yang, G.; Peng, X.; Kang, J.; Wu, J.; Liu, G.; Tsubaki, N. Beyond Cars: Fischer–Tropsch Synthesis for Non-Automotive Applications. ChemCatChem 2019, 11, 1412–1424. [Google Scholar] [CrossRef]
- Jones, M.P.; Krexner, T.; Bismarck, A. Repurposing Fischer–Tropsch and Natural Gas as Bridging Technologies for the Energy Revolution. Energy Convers. Manag. 2022, 267, 115882. [Google Scholar] [CrossRef]
- Bahmanpour, A.M.; Héroguel, F.; Kılıç, M.; Baranowski, C.J.; Artiglia, L.; Röthlisberger, U.; Luterbacher, J.S.; Kröcher, O. CuAl Spinel as a Highly Active and Stable Catalyst for the Reverse Water Gas Shift Reaction. ACS Catal. 2019, 9, 6243–6251. [Google Scholar] [CrossRef]
- Evans, G.; Smith, C. 5.11—Biomass to Liquids Technology. In Comprehensive Renewable Energy; Sayigh, A., Ed.; Elsevier: Oxford, UK, 2012; pp. 155–204. [Google Scholar]
- Konarova, M.; Aslam, W.; Perkins, G. Chapter 3—Fischer-Tropsch Synthesis to Hydrocarbon Biofuels: Present Status and Challenges Involved. In Hydrocarbon Biorefinery; Maity, S.K., Gayen, K., Bhowmick, T.K., Eds.; Elsevier: Amsterdam, The Netherlands, 2022; pp. 77–96. [Google Scholar]
- Adolf, J.; Balzer, C.; Warnecke, W.; Fu, X. The road to sustainable fuels for zero emissions mobility: Status of, and perspectives for, power-to-liquids fuels. In Proceedings of the 39th International Vienna Motor Symposium, Vienna, Austria, 26–27 April 2018; Available online: https://www.researchgate.net/publication/350955491_The_Road_to_Sustainable_Fuels_for_Zero-Emissions_Mobility_Status_of_and_Perspectives_for_Power-to-Liquids_PTL_Fuels (accessed on 12 February 2024).
- Melin, K.; Hurme, M. Evaluation of lignocellulosic biomass upgrading routes to fuels and chemicals. Cellul. Chem. Technol. 2010, 44, 117. [Google Scholar]
- Loewert, M.; Pfeifer, P. Dynamically Operated Fischer–Tropsch Synthesis in PtL-Part 1: System Response on Intermittent Feed. ChemEngineering 2020, 4, 21. [Google Scholar] [CrossRef]
- Jahangiri, H.; Bennett, J.; Mahjoubi, P.; Wilson, K.; Gu, S. A review of advanced catalyst development for Fischer–Tropsch synthesis of hydrocarbons from biomass derived syn-gas. Catal. Sci. Technol. 2014, 4, 2210–2229. [Google Scholar] [CrossRef]
- Speight, J.G. Chapter 8—Hydrocarbons from synthesis gas. In Hydrocarbon Biorefinery; Speight, J.G., Ed.; Gulf Professional Publishing: Boston, MA, USA, 2020; pp. 343–386. [Google Scholar] [CrossRef]
- Martinelli, M.; Gnanamani, M.K.; LeViness, S.; Jacobs, G.; Shafer, W.D. An overview of Fischer–Tropsch Synthesis: XtL processes, catalysts and reactors. Appl. Catal. A Gen. 2020, 608, 117740. [Google Scholar] [CrossRef]
- Bassano, P.; Deiana, P. Analisi dello Stato Dell’Arte Attuale Delle Tecnologie CTL e Modellazione di un Impianto Dimostrativo. Available online: https://www2.enea.it/it/Ricerca_sviluppo/documenti/ricerca-di-sistema-elettrico/gassificazione-carbone/05-enea-rt-5252-ctl.pdf (accessed on 12 February 2024).
- Spath, P.L.; Dayton, D.C. Preliminary Screening—Technical and Economic Assessment of Synthesis Gas to Fuels and Chemicals with Emphasis on the Potential for Biomass-Derived Syngas; NREL/TP-510-34929; National Renewable Energy Laboratory (NREL): Golden, CO, USA, 2003. [Google Scholar]
- Zang, G.; Sun, P.; Elgowainy, A.A.; Bafana, A.; Wang, M. Performance and cost analysis of liquid fuel production from H2 and CO2 based on the Fischer–Tropsch process. J. CO2 Util. 2021, 46, 101459. [Google Scholar] [CrossRef]
- Yao, B.; Xiao, T.; Makgae, O.A.; Jie, X.; Gonzalez-Cortes, S.; Guan, S.; Kirkl, A.I.; Dilworth, J.R.; Al-Megren, H.A.; Alshihri, S.M.; et al. Transforming carbon dioxide into jet fuel using an organic combustion-synthesized Fe-Mn-K catalyst. Nat. Commun. 2020, 11, 6395. [Google Scholar] [CrossRef]
- Hannula, I.; Kurkela, E. Liquid Transportation Fuels Via Large-Scale Fluidised-Bed Gasification of Lignocellulosic Biomass; VTT Technical Research Centre of Finland: Espoo, Finland, 2013; ISBN 978-951-38-7979-2. [Google Scholar]
- Tucker, C.L.; Bordoloi, A.; van Steen, E. Novel Single Pass Biogas-to-Diesel Process Using a Fischer–Tropsch Catalyst Designed for High Conversion. Sustain. Energy Fuels 2021, 5, 5717–5732. [Google Scholar] [CrossRef]
- Detz, R. Available online: https://energy.nl/wp-content/uploads/technology-factsheets-rwgs-to-co-from-co2-and-h2-1.pdf (accessed on 18 February 2024).
- De Klerk, A. Fischer–Tropsch fuels refinery design. Energy Environ. Sci. 2011, 4, 1177–1205. [Google Scholar] [CrossRef]
- Meyers, D.; Willis, K. Sorting Through the Many Total-Energy-Cycle Pathways Possible with Early Plug-In Hybrids. World Electr. Veh. J. 2008, 22, 66–88. [Google Scholar] [CrossRef]
- Schmidt, P.; Batteiger, V.; Roth, A.; Weindorf, W.; Raksha, T. Power-to-Liquids as Renewable Fuel Option for Aviation: A Review. Chem. Ing. Tech. 2018, 90, 127–140. [Google Scholar] [CrossRef]
- Schemme, S.; Samsun, R.C.; Peters, R.; Stolten, D. Power-to-fuel as a key to sustainable transport systems—An analysis of diesel fuels produced from CO2 and renewable electricity. Fuel 2017, 205, 198–221. [Google Scholar] [CrossRef]
- Stadler, T.J.; Bertin-Mente, B.; Dittmeyer, R.; Brubach, L.T.; Boltken, T.; Pfeifer, P. Influence of CO2-Rich Syngas on the Selectivity to C10–C14 in a Coupled Fischer–Tropsch/Hydrocracking Process. CHemie Ing. Tech. 2022, 94, 289–298. [Google Scholar] [CrossRef]
- Rojas-Michaga, M.F.; Michailos, S.; Cardozo, E.; Akram, M.; Hughes, K.J.; Ingham, D.; Pourkashanian, M. Sustainable aviation fuel (SAF) production through power-to-liquid (PtL): A combined techno-economic and life cycle assessment. Energy Convers. Manag. 2023, 292, 117427. [Google Scholar] [CrossRef]
- Drünert, S.; Neuling, U.; Zitscher, T.; Kaltschmitt, M. Power-to-Liquid Fuels for Aviation—Processes, Resources and Supply Potential under German Conditions. Appl. Energy 2020, 277, 115578. [Google Scholar] [CrossRef]
- Micheli, M.; Moore, D.; Bach, V.; Finkbeiner, M. Life-Cycle Assessment of Power-to-Liquid Kerosene Produced from Renewable Electricity and CO2 from Direct Air Capture in Germany. Sustainability 2022, 14, 10658. [Google Scholar] [CrossRef]
- Meurer, A.; Kern, J. Fischer–Tropsch Synthesis as the Key for Decentralized Sustainable Kerosene Production. Energies 2021, 14, 1836. [Google Scholar] [CrossRef]
- Richter, S.; Kukkadapu, G.; Westbrook, C.K.; Braun-Unkhoff, M.; Naumann, C.; Köhler, M.; Riedel, U. A Combined Experimental and Modeling Study of Combustion Properties of an Isoparaffinic Alcohol-to-Jet Fuel. Combust. Flame 2022, 240, 111994. [Google Scholar] [CrossRef]
- Kalligeros, S. Evolution of Fuels with the Advancement of Powertrains. In Advances in Engine and Powertrain Research and Technology: Design Simulation Testing Manufacturing; Parikyan, T., Ed.; Springer International Publishing: Cham, Switzerland, 2022; pp. 207–235. [Google Scholar]
- O’Malley, J.; Pavlenko, N.; Searle, S. Estimating Sustainable Aviation Fuel Feedstock Availability to Meet Growing European Union Demand—International Council on Clean Transporation; International Council on Clean Transportation: Berlin, Germany, 2021. [Google Scholar]
- Mawhood, R.; Gazis, E.; de Jong, S.; Hoefnagels, R.; Slade, R. Production Pathways for Renewable Jet Fuel: A Review of Commercialization Status and Future Prospects. Biofuels Bioprod. Biorefin. 2016, 10, 462–484. [Google Scholar] [CrossRef]
- Stančin, H.; Mikulčić, H.; Wang, X.; Duić, N. A review on alternative fuels in future energy system. Renew. Sustain. Energy Rev. 2020, 128, 109927. [Google Scholar] [CrossRef]
- Danasa, A.S.; Soesilo, T.E.B.; Martono, D.N.; Sodri, A.; Hadi, A.S.; Chandrasa, G.T. The Ammonia Release Hazard and Risk Assessment: A Case Study of Urea Fertilizer Industry in Indonesia. IOP Conf. Ser. Earth Environ. Sci. 2019, 399, 12087. [Google Scholar] [CrossRef]
- Valera-Medina, A.; Amer-Hatem, F.; Azad, A.K.; Dedoussi, I.C.; de Joannon, M.; Fernandes, R.X.; Glarborg, P.; Hashemi, H.; He, X.; Mashruk, S.; et al. Review on Ammonia as a Potential Fuel: From Synthesis to Economics. Energy Fuels 2021, 35, 6964–7029. [Google Scholar] [CrossRef]
- Ammonia: Zero-Carbon Fertiliser, Fuel and Energy Store. 2020. Available online: https://royalsociety.org/news-resources/projects/low-carbon-energy-programme/green-ammonia/ (accessed on 12 February 2024).
- Aziz, M.; Wijayanta, A.T.; Nandiyanto, A.B.D. Ammonia as Effective Hydrogen Storage: A Review on Production, Storage and Utilization. Energies 2020, 13, 3062. [Google Scholar] [CrossRef]
- Cheema, I.I.; Krewer, U. Operating envelope of Haber-Bosch process design for power-to-ammonia. RSC Adv. 2018, 8, 34926–34936. [Google Scholar] [CrossRef] [PubMed]
- Hendrik, K.; Rouwenhorst, R.; Engelmann, Y.; Van’t-Veer, K.; Postma, S.P.; Bogaerts, A.; Lefferts, L. Plasma-driven catalysis: Green ammonia synthesis with intermittent electricity. Green Chem. 2020, 22, 6258–6287. [Google Scholar]
- Osman, O.; Sgouridis, S. Optimizing the production of ammonia as an energy carrier in the UAE. In Proceedings of the 5th International Conference on Renewable Energy: Generation and Applications (ICREGA), Al Ain, United Arab Emirates, 25–28 February 2018. [Google Scholar]
- Morlanés, N.; Katikaneni, S.P.; Paglieri, S.N.; Harale, A.; Solami, B.; Sarathy, S.M.; Gascon, J. A Technological Roadmap to the Ammonia Energy Economy: Current State and Missing Technologies. Chem. Eng. J. 2021, 408, 127310. [Google Scholar] [CrossRef]
- Inal, O.B.; Zincir, B.; Deniz, C. Investigation on the decarbonization of shipping: An approach to hydrogen and ammonia. Int. J. Hydrogen Energy 2022, 57, 19888–19900. [Google Scholar] [CrossRef]
- Zincir, B. A Short Review of Ammonia as an Alternative Marine Fuel for Decarbonised Maritime Transportation. In Proceedings of the Name of the International Conference on Energy, Environment and Storage of Energy (ICEESEN2020), Kayseri, Turkey, 19–21 November 2020. [Google Scholar]
- MacFarlane, D.R.; Cherepanov, P.V.; Choi, J.; Suryanto, B.H.R.; Hodgetts, R.Y.; Bakker, J.M.; Ferrero Vallana, F.M.; Simonov, A.N. A Roadmap to the Ammonia Economy. Joule 2020, 4, 1186–1205. [Google Scholar] [CrossRef]
- Yousefi Rizi, H.A.; Shin, D. Green Hydrogen Production Technologies from Ammonia Cracking. Energies 2022, 15, 8246. [Google Scholar] [CrossRef]
- Frigo, S.; Gentili, R. Analysis of the behaviour of a 4-stroke SI engine fuelled with ammonia and hydrogen. Int. J. Hydrogen Energy 2013, 38, 1607–1615. [Google Scholar] [CrossRef]
- Qiu, Y.; Zhang, Y.; Shi, Y.; Zhang, Y.; Wang, Z.; Lin, H.; Han, D.; Huang, Z. Ammonia fueled engine with diesel pilot ignition: Approach to achieve ultra-high ammonia substitution. Int. J. Engine Res. 2024, 2024, 14680874241248507. [Google Scholar] [CrossRef]
- Morgan, E.R.; Manwell, J.F.; McGowan, J.G. Sustainable ammonia production from U.S. Offshore wind farms: A technoeconomic review. ACS Sustain. Chem. Eng. 2017, 5, 9554–9567. [Google Scholar] [CrossRef]
- Matzen, M.; Alhajji, M.; Demirel, Y. Technoeconomics and sustainability of renewable methanol and ammonia productions using wind power-based hydrogen. J. Adv. Chem. Eng. 2015, 5, 1000128. [Google Scholar]
- CSIROU. Origin Green Hydrogen and Ammonia Project. 2022. Available online: https://research.csiro.au/hyresource/origin-green-hydrogen-and-ammonia-project/ (accessed on 18 February 2024).
- Li, M.M.J.; Tsang, S.C.E. Bimetallic catalysts for green methanol production via CO2 and renewable hydrogen: A mini-review and prospects. Catal. Sci. Technol. 2018, 8, 3450–3464. [Google Scholar] [CrossRef]
- Bartles, J.R. A Feasibility Study of Implementing an Ammonia Economy. Master’s Thesis, Iowa State University, Ames, IA, USA, 2008. [Google Scholar]
- ADNOC. ADNOC to Build World-Scale Blue Ammonia Project. Available online: https://adnoc.ae/en/news-and-media/press-releases/2021/adnoc-to-build-world-scale-blue-ammonia-project (accessed on 18 February 2024).
- Horizon 2020: Work Programme 2014–2015: General Annexes; Extract from Part 19—Commission Decision C(2014)4995. Available online: https://ec.europa.eu/research/participants/data/ref/h2020/wp/2014_2015/annexes/h2020-wp1415-annex-g-trl_en.pdf (accessed on 5 March 2024).
- Muradovich, B.M. Conceptual aspects of marketing readiness level assessment model. Glob. J. Eng. Sci. Res. Manag. 2017, 4, 34–44. [Google Scholar]
- Alkusayer, K.T.; Ollerhead, A.; Kmiotek, S.J. Ammonia Synthesis for Fertilizer Production. MQP Report, 2015. Digital WPI. Available online: https://digital.wpi.edu/concern/student_works/zg64tn32f?locale=en (accessed on 12 February 2024).
- Afif, A.; Radenahmad, N.; Cheok, Q.; Shams, S.; Jung, H.K.; Azad, A.K. Ammonia-fed fuel cells: A comprehensive review. Renew. Sustain. Energy Rev. 2016, 60, 822–835. [Google Scholar] [CrossRef]
- Rathore, S.S.; Biswas, S.; Fini, D.; Kulkarni, A.P.; Giddey, S. Direct ammonia solid-oxide fuel cells: A review of progress and prospects. Int. J. Hydrogen Energy 2021, 46, 35365–35384. [Google Scholar] [CrossRef]
- Jeerh, G.; Zhang, M.; Tao, S. Recent progress in ammonia fuel cells and their potential applications. J. Mater. Chem. A 2021, 9, 727–752. [Google Scholar] [CrossRef]
- Stöckl, F.; Schill, W.P.; Zerrahn, A. Optimal supply chains and power sector benefits of green hydrogen. Sci. Rep. 2021, 11, 14191. [Google Scholar] [CrossRef] [PubMed]
- Beuttler, C.; Charles, L.; Wurzbacher, J. The Role of Direct Air Capture in Mitigation of Anthropogenic Greenhouse Gas Emissions. Front. Clim. 2019, 1, 469555. [Google Scholar] [CrossRef]
- Deutz, S.; Bardow, A. Life-cycle assessment of an industrial direct air capture process based on temperature–vacuum swing adsorption. Nat. Energy 2021, 6, 203–213. [Google Scholar] [CrossRef]
- Yilmaz, H.U.; Keles, D.; Chiodi, A.; Hartel, R.; Mikulić, M. Analysis of the power-to-heat potential in the European energy system. Energy Strategy Rev. 2018, 20, 6–19. [Google Scholar] [CrossRef]
- Joint Research Centre; Institute for Energy and Transport; Hamje, H.; Nelson, R.; Godwin, S.; Weindorf, W.; Reid, A.; Maas, H.; Rose, K.; Lonza, L.; et al. Well-to-Wheels Report Version 4.a—JEC Well-to-Wheels Analysis—Well-to-Wheels Analysis of Future Automotive Fuels and Powertrains in the European Context; Publications Office: Luxembourg, 2014. [Google Scholar] [CrossRef]
- European Commission. Proposal for a Directive of the European Parliament and of the Council on the Promotion of the Use of Energy from Renewable Sources; European Commission: Brussels, Belgium, 2016; Available online: https://eur-lex.europa.eu/legal-content/EN/TXT/?uri=CELEX:52016PC0767R%2801%29 (accessed on 12 February 2024).
- Schmidt, P.; Weindorf, W.; Roth, A.; Batteiger, V.; Riegel, F.; Deutschland Umweltbundesamt. Power-to-Liquids: Potentials and Perspectives for the Future Supply of Renewable Aviation Fuel; German Environment Agency: Dessau-Roßlau, Germany, 2016. [Google Scholar]
- Green Car Congress. PSI Team Develops Web Tool for Consumers to Compare Environmental Impact of Passenger Cars in Detail.; Green Car Congress; Bioage Group LLC: Richmond, CA, USA, 2020; Available online: https://www.umweltbundesamt.de/sites/default/files/medien/377/publikationen/161005_uba_hintergrund_ptl_barrierrefrei.pdf (accessed on 12 February 2024).
- Sacchi, R.; Bauer, C.; Cox, B. Does size matter? The influence of size, load factor, range autonomy and application type on the life cycle assessment of current and future medium- and heavy-duty vehicles. Environ. Sci. Technol. 2021, 55, 5224–5235. [Google Scholar] [CrossRef] [PubMed]
- Ecoinvent. Life Cycle Inventory Database, v3.7; Ecoinvent: Zurich, Switzerland, 2020; Available online: www.ecoinvent.org (accessed on 12 February 2024).
- Knobloch, F.; Hanssen, S.V.; Lam, A.; Pollitt, H.; Salas, P.; Chewpreecha, U.; Huijbregts, M.A.J.; Mercure, J.F. Net emission reductions from electric cars and heat pumps in 59 world regions over time. Nat. Sustain. 2020, 3, 437–447. [Google Scholar] [CrossRef] [PubMed]
- Istituto Superiore per la Protezione e la Ricerca Ambientale (ISPRA). National Inventory Report 2021. In Italian Greenhouse Gas Inventory 1990–2019; Rapporti 341/21; ISPRA: Bologna, Italy, 2021; ISBN 978-88-448-1046-7. [Google Scholar]
- Huss, A.; Weingerl, P. JEC Tank-to-Wheel Report v5: Passenger Cars; Maas, H., Herudek, C., Wind, J., Hollweck, B., De Prada, L., Deix, S., Lahaussois, D., Faucon, R., Heurtaux, F., Perrier, B., Eds.; EUR 30270 EN; JRC117560; Publications Office of the European Union: Luxembourg, 2020; ISBN 978-92-76-19927-4. [Google Scholar]
- Transport & Environment. Electrofuels? Yes, We Can, if We’re Efficient, Annex II; Transport & Environment: Brussels, Belgium, 2020; Available online: https://www.transportenvironment.org/wp-content/uploads/2020/12/2020_12_Briefing_feasibility_study_renewables_decarbonisation.pdf (accessed on 5 March 2024).
- El Hassani, S.; Lebrouhi, B.E.; Kousksou, T. A feasibility study of green hydrogen and E-fuels production from a renewable energy hybrid system in the city of Dakhla, Morocco. Int. J. Hydrogen Energy 2024, 73, 316–330. [Google Scholar] [CrossRef]
- Demuynck, J.; Mendoza Villafuerte, P.; Bosteels, D.; Kuhrt, A.; Brauer, M.; Sens, M.; Williams, J.; Chaillou, C.; Gordillo, V. Advanced Emission Controls and E-fuels on a Gasoline Car for Zero-Impact Emissions. SAE Int. J. Adv. Curr. Prac. Mobil. 2023, 5, 1063–1069. [Google Scholar] [CrossRef]
- Massoud, M.; Vega, G.; Subburaj, A.; Partheepan, J. Review on recycling energy resources and sustainability. Heliyon 2023, 9, 15107. [Google Scholar] [CrossRef]
- Chowdhury, M.S.; Rahman, K.S.; Chowdhury, T.; Nuthammachot, N.; Techato, K.; Akhtaruzzaman, M.; Tiong, S.K.; Sopian, K.; Amin, N. An overview of solar photovoltaic panels’ end-of-life material recycling. Energy Strategy Rev. 2020, 27, 100431. [Google Scholar] [CrossRef]
- Richter, S.; Planke, K.; Osterle, I.; Braun-Unkhoff, M.; Prause, J.; Aigner, M. E-fuels for the Energy Transition in the Transport Sector—Properties and Application: Current State of Research. In Proceedings of the International Colloquium for Fuels—Conventional and Future Energy for Automobiles, Ostfildern, Germany, 15–16 September 2021. [Google Scholar]
- Yuan, M.; Zinck Thellufsen, J.; Lund, H.; Liang, Y. The electrification of transportation in energy transition. Energy 2021, 236, 121564. [Google Scholar] [CrossRef]
- International Energy Agency. The Role of Critical Minerals in Clean Energy Transitions; Licence: CC BY 4.0; IEA: Paris, France, 2021; Available online: https://www.iea.org/reports/the-role-of-critical-minerals-in-clean-energy-transitions (accessed on 12 February 2024).
- Transport & Environment. Analysis of Green Jet Fuel Production in Europe. 2022. Available online: https://www.transportenvironment.org/articles/green-aviation-fuels-could-save-5-million-tonnes-of-co2-in-2030 (accessed on 12 February 2024).
- Oxford Institute for Energy Studies. E-Diesel in the Shipping Sector: Prospects and Challenges. 2024. Available online: https://www.transportenvironment.org/articles/analysis-of-green-jet-fuel-production-in-europe (accessed on 12 February 2024).
- Tno Innovation for Life. E-Fuels: Towards a More Sustainable Future for Truck Transport, Shipping and Aviation. 2020. Available online: https://publications.tno.nl/publication/34636875/KDhcac/vankranenburg-2020-efuels.pdf (accessed on 12 February 2024).
- Tno Innovation for Life. E-Fuels Crucial to Sustainable Heavy Transport. 2020. Available online: https://www.tno.nl/en/newsroom/2020/09/fuels-crucial-sustainable-heavy/ (accessed on 12 February 2024).
- Soltic, P.; Hilfiker, T.; Wright, Y.; Hardy, G.; Fröhlich, B.; Klein, D. The potential of dimethyl ether (DME) to meet current and future emissions standards in heavy-duty compression-ignition engines. Fuel 2024, 129357. [Google Scholar] [CrossRef]
- Seemungal, L.; Arrigoni, A.; Davies, J.; Weidner, E.; Hodson, P. Decarbonisation of Heavy Duty Vehicle Transport: Zero Emission Heavy Goods Vehicles; Workshop Summary Report (28 October 2020, JRC Petten, The Netherlands), EUR 30773 EN; JRC125149.; Publications Office of the European Commission: Luxembourg, 2021; ISBN 978-92-76-40326-5. [Google Scholar]
- Prussi, M.; Laveneziana, L.; Testa, L.; Chiaramonti, D. Comparing e-Fuels and Electrification for Decarbonization of Heavy-Duty Transports. Energies 2022, 15, 8075. [Google Scholar] [CrossRef]
- Vennapusa, J.; Hariram, N.; Maity, R.; Ghazali, M.F.; Kumarasamy, S. Sustainable E-Fuels: Green Hydrogen, Methanol and Ammonia for Carbon-Neutral Transportation. World Electr. Veh. J. 2023, 14, 349. [Google Scholar] [CrossRef]
- Peacock, J.; Cooper, R.; Waller, N.; Richardson, G. Decarbonising aviation at scale through synthesis of sustainable e-fuel: A techno-economic assessment. Int. J. Hydrogen Energy 2024, 50, 869–890. [Google Scholar] [CrossRef]
- D’Adamo, I.; Gastaldi, M.; Giannini, M.; Nizami, A.S. Environmental implications and levelized cost analysis of E-fuel production under photovoltaic energy, direct air capture, and hydrogen. Environ. Res. 2024, 246, 118163. [Google Scholar] [CrossRef] [PubMed]
- Ravi, S.S.; Mazumder, J.; Sun, J.; Brace, C.; Turner, J.W.G. Techno-Economic assessment of synthetic E-Fuels derived from atmospheric CO2 and green hydrogen. Energy Convers. Manag. 2023, 291, 117271. [Google Scholar] [CrossRef]


| CCUS Technology | Post Combustion | Pre Combustion | Oxyfuel Combustion |
|---|---|---|---|
| Technology maturity | Commercial | Commercial | Under development |
| Applications | Commercial and industrial power plants | Natural gas power plants and process industry | Appropriate for some types of coal fuels |
| Advantages | - Excellent for renovation of existing power plants; - Matured technology | - Low gas volume; - High pressure; - High CO2 concentration; - Less energy intensive; - Easy CO2 separation; - Lower water consumption | - More sustainable; - No chemical operation; - High efficiency; - Reduction of NOx; - Easy to capture CO2. |
| Disadvantages | Low CO2 partial pressure in flue gas | High energy loss due to sorbent regeneration | Low net power output |
| Capital cost | Excessive cost of system operation | Excessive cost compared to a coal plant cost | Excessive cost of air separation system |
| Flow | Quantity |
|---|---|
| H2 consumption (total) | 0.493 kg |
| H2 consumption from RWGS | 0.169 kg |
| H2 consumption from FT and hydrocracking | 0.324 kg |
| CO2 consumption | 3.715 kg |
| CO equivalent | 2.364 kg |
| Gas burned | 0.237 kg |
| H2O production | 2971 kg |
| Power consumption | 1.90 MJ |
| Heat production | 9.22 MJ |
| Description TRL | TRL | MRL | CRL |
|---|---|---|---|
| Basic principles observed | 1 | - | - |
| Technology concept formulated | 2 | - | - |
| Experimental proof of concept | 3 | - | - |
| Technology validated in lab | 4 | 1 | - |
| Technology validated in relevant environment (industrially relevant environment in the case of key enabling technologies) | 5 | 2 | - |
| Technology demonstrated in relevant environment (industrially relevant environment in the case of key enabling technologies) | 6 | 3 | - |
| System prototype demonstration in operational environment | 7 | 4 | 1 |
| System complete and qualified | 8 | 5 | 2 |
| Actual system is proven in operational environment (competitive manufacturing in the case of key enabling technologies or in space) | 9 | 6 | 3 |
| Multiple commercial applications becoming evident locally although still subsidized. Verifiable data on technical and financial performance in the public domain driving interest from a variety of debt and equity sources however still requiring government support. Regulatory challenges being addressed in multiple jurisdictions | - | - | 4 |
| Market competition driving widespread deployment in the context of long-term policy settings. Competition emerging across all areas of the supply chain with commoditization of key components and financial products occurring | - | - | 5 |
| ‘Bankable’ grade asset class driven by the same criteria as other mature energy technologies. Considered as a ‘blankable’ grade asset class with known standards and performance expectations. Market and technology risks do not drive investment decisions. Proponent capability, pricing, and other typical market forces driving uptake | - | - | 6 |
| Fuel | Pathway | TRL | MRL | CRL |
|---|---|---|---|---|
| e-H2 | AEC | 9 | - | - |
| PEM | 5–7 | - | - | |
| SOEC | 3–5 | - | - | |
| CO2 capture | post combustion | 9 | - | - |
| pre combustion | 7 | - | - | |
| oxyfuel combustion | 7 | - | - | |
| DAC adsorption/desorption | 6 | 3 | 1 | |
| DAC absorption/calcination | 5 | 2 | - | |
| DAC adbsorption/electrodialysis | 4 | 1 | - | |
| e-CH4 | Catalyt. methanation with low temperature electrolysis | 6–9 (DAC a) | ≥5 | ≥2 |
| Catalyt. methanation with high temperature electrolysis | 6 (SOEC b) | 3 | 1 | |
| e-CH3OH | Methanol synthesis with low temperature electrolysis | 6–9 (DAC) | ≥5 | ≥2 |
| Methanol synthesis with high temperature electrolysis | 6 (SOEC) | 3 | 1 | |
| PtL | Fischer–Tropsch route with low temperature electrolysis | 6 (RWGS c) | 3 | 1 |
| Fischer–Tropsch route with high temperature electrolysis | 6 (SOEC, RWGS) | 3 | 1 | |
| Methanol route with low temperature electrolysis | 6–9 (DAC) | ≥5 | ≥2 | |
| Methanol route with high temperature electrolysis | 6 (SOEC) | 3 | 1 |
| Powertrain Type | Energy Vector | WTT Efficiency | TTW Efficiency | WTW Efficiency | Specific Electric Consumption for Medium Size Cars in WLTP [kWh/100 km] |
|---|---|---|---|---|---|
| BEV | Electricity | 0.85 | 0.90 | 0.77 | 19.5 |
| ICE | E-hydrogen (700 bar) | 0.55 | 0.35 | 0.19 | 78.5 |
| E-hydrogen (liquid) | 0.49 | 0.35 | 0.17 | 88.2 | |
| E-methanol | 0.49 | 0.35 | 0.17 | 86.9 | |
| E-diesel | 0.44 | 0.35 | 0.15 | 98.1 | |
| E-ammonia | 0.48 | 0.35 | 0.17 | 88.6 | |
| E-DME | 0.51 | 0.35 | 0.18 | 83.6 | |
| E-methane (220 bar) | 0.47 | 0.35 | 0.16 | 92.2 | |
| E-methane (liquid) | 0.46 | 0.35 | 0.16 | 94.0 | |
| FC | E-hydrogen (700 bar) | 0.55 | 0.5 | 0.27 | 54.9 |
| E-hydrogen (liquid) | 0.49 | 0.5 | 0.24 | 61.7 | |
| E-methanol | 0.49 | 0.5 | 0.25 | 60.9 | |
| E-ammonia | 0.48 | 0.5 | 0.24 | 62.0 |
| Properties | Fossil Fuels | |||
|---|---|---|---|---|
| Gasoline | Diesel | Kerosene | LPG | |
| Density (kg/m3) | 715–780 | 815–855 | 780–810 | 540 (at 10 bar) |
| Boiling point (°C) | 25–215 | 170–380 | 151–301 | −41 to−0.5 |
| LHV (MJ/L) | 31.2–32.2 | 35.3–36 | 35.3 | 24.8 |
| Octane number | 90–95 | - | - | 105–115 |
| Cetane number | - | 45–53 | - | - |
| Proprietà | E-Fuels | |||||||
|---|---|---|---|---|---|---|---|---|
| FT-Diesel | FT-Gasoline | MtG | FT-Kerosene | MtJ * | DME | OME2–5 | Methanol | |
| Miscibility | In diesel | in gasoline | In gasoline | In jet fuel | in jet fuel | In LPG | In diesel | In gasoline and diesel |
| Density (kg/m3) | 765–845 | 720–755 | 720–755 | 730–770 | 730–770 | gas | 961–1100 | 792 |
| Boiling point (°C) | 85–360 | 210 (FBP) ** | 210 (FBP) * | 205–300 | 205–300 | −24.8 | 105–280 | 65 |
| LHV (MJ/l) | 33.1–34.3 | 30–33 | 30–33 | - | - | 18.3–19.3 | 19.5–19.7 | 15.4–15.6 |
| Octane number | - | up to 85 | up to 85 | - | - | - | - | 110–112 |
| Cetane number | 70–80 | - | - | - | - | up to 55 | 63–110 | 5 |
| E-Fuels | Storage | Additional Infrastructures | Powertrain Development | |
|---|---|---|---|---|
| GAS | E-hydrogen | Difficult | Yes | No ** |
| E-methane | Medium * | No | No | |
| LIQUID | E-ammonia | Easy | Yes | Yes |
| E-methanol | Easy | No | Yes | |
| E-DME/OME | Easy | Yes | Yes | |
| E-diesel/gasoline/kerosene | Easy | No | No |
| Transport Sectors | Infrastructure | Storage | Investment | GHG Reduction | |
|---|---|---|---|---|---|
| Fossil fuels | All | Existing | Easy | Low | Low |
| Electricity | LDV/HDV * | New | Difficult | High | High |
| Biofuels | All ** | Existing | Easy | Medium | High |
| E-fuels | All | Existing *** | Easy | High | High |
| E-Fuels | Light Duty | Heavy Duty | Maritime | Aviation | Other Sectors | |
|---|---|---|---|---|---|---|
| GAS | E-hydrogen | XX | XX | X | X | |
| E-methane | X | XX | XX | XXX | ||
| LIQUID | E-ammonia | X | X | XXX | ||
| E-methanol | XX | X | X | |||
| E-DME/OME | X | XX | XX | |||
| E-diesel/gasoline/kerosene | X | XXX | XX * | XXX ** |
Disclaimer/Publisher’s Note: The statements, opinions and data contained in all publications are solely those of the individual author(s) and contributor(s) and not of MDPI and/or the editor(s). MDPI and/or the editor(s) disclaim responsibility for any injury to people or property resulting from any ideas, methods, instructions or products referred to in the content. |
© 2024 by the authors. Licensee MDPI, Basel, Switzerland. This article is an open access article distributed under the terms and conditions of the Creative Commons Attribution (CC BY) license (https://creativecommons.org/licenses/by/4.0/).
Share and Cite
Dell’Aversano, S.; Villante, C.; Gallucci, K.; Vanga, G.; Di Giuliano, A. E-Fuels: A Comprehensive Review of the Most Promising Technological Alternatives towards an Energy Transition. Energies 2024, 17, 3995. https://doi.org/10.3390/en17163995
Dell’Aversano S, Villante C, Gallucci K, Vanga G, Di Giuliano A. E-Fuels: A Comprehensive Review of the Most Promising Technological Alternatives towards an Energy Transition. Energies. 2024; 17(16):3995. https://doi.org/10.3390/en17163995
Chicago/Turabian StyleDell’Aversano, Sonia, Carlo Villante, Katia Gallucci, Giuseppina Vanga, and Andrea Di Giuliano. 2024. "E-Fuels: A Comprehensive Review of the Most Promising Technological Alternatives towards an Energy Transition" Energies 17, no. 16: 3995. https://doi.org/10.3390/en17163995