Article

Research on the Mechanism of Evolution of Mechanical Anisotropy during the Progressive Failure of Oil Shale under Real-Time High-Temperature Conditions

1
College of Engineering for Safety and Emergency Management, Taiyuan University of Science and Technology, Taiyuan 030024, China
2
Intelligent Monitoring and Control of Coal Mine Dust Key Laboratory of Shanxi Province, Taiyuan 030024, China
3
Key Laboratory of In-Situ Property-Improving Mining of Ministry of Education, Taiyuan University of Technology, Taiyuan 030024, China
*
Author to whom correspondence should be addressed.
Energies 2024, 17(16), 4004; https://doi.org/10.3390/en17164004
Submission received: 8 July 2024 / Revised: 5 August 2024 / Accepted: 10 August 2024 / Published: 13 August 2024
(This article belongs to the Special Issue Recent Advances in Oil Shale Conversion Technologies)

Abstract

:
Real-time high-temperature CT scanning and a rock-mechanics test system were employed to investigate the mechanical properties of oil shale at temperatures from 20 to 600 °C. The results reveal that up to 400 °C, the aperture of fractures initially decreases and then increases when loading is perpendicular to the bedding. However, the number and aperture continuously increase when loading is parallel to the bedding. Beyond 400 °C, the number of pores increases and the aperture of the fractures becomes larger with rising temperature. The changes in microstructures significantly impact the mechanical properties. Between 20 and 600 °C, the compressive strength, elastic modulus, and Poisson’s ratio initially decrease and then increase under perpendicular and parallel bedding loadings. The compressive strength and elastic modulus reach minimum values at 400 °C. However, for Poisson’s ratio, the minimum occurs at 500 °C and 200 °C under perpendicular and parallel bedding loadings, respectively. Simultaneously, while the crack damage stress during perpendicular bedding loading, σcd-per, initially exhibits an upward trend followed by a decline and subsequently increases again with temperature increasing, the initial stress during perpendicular bedding loading, σci-per, parallel bedding loading, σci-par, and damage stress, σcd-par, decrease initially and then increase, reaching minimum values at 400 °C. These research findings provide essential data for reservoir reconstruction and cementing technology in the in situ mining of oil shale.

1. Introduction

Oil shale is a fine-grained sedimentary rock that possesses high ash content and abundant combustible organic matter [1,2]. The organic component within oil shale, referred to as kerogen, remains insoluble in common organic solvents [3]. In its reservoir state, oil shale cannot be extracted as an oil-and-gas resource. However, subjecting oil shale to high temperatures (typically exceeding 400 °C) through thermal decomposition allows for pyrolysis, resulting in the production of shale oil and a mixture of hydrocarbon gases [4]. This process enables the extraction of resources. In recent years, with international crude-oil supplies dwindling and prices on the rise, oil shale has emerged as a potential solution to address the gap in global fossil-energy resources due to its substantial reserves and widespread distribution [5,6,7].
Currently, in situ pyrolysis technology for oil shale is considered the sole viable method for large-scale industrial extraction owing to its high heating efficiency and the advantage of not being constrained by the thickness and burial depth of the target reservoir [3,8,9]. The Modified Thermal Injection (MTI) technique, proposed by the Taiyuan University of Technology (Figure 1), stands out as a notable approach to the in situ pyrolysis of oil shale. This technique employs hydraulic fracturing to transform the oil-shale reservoir; this step is followed by heating of the mineral body using high-temperature steam (above 550 °C) as the heat carrier. The resultant oil and gas products from the pyrolysis process are then transported through the fluid to the production well, completing the in situ pyrolysis of oil shale. When utilizing convective heating for in situ pyrolysis of oil shale, a crucial consideration arises: given the typical anisotropic characteristics of oil shale’s thermal conductivity [10], variations in internal temperature distribution are inevitable as the formation’s temperature steadily increases. Under the coupled influence of thermal cracking and pyrolysis, the internal pore−fracture structure, mechanical strength, and deformation characteristics of the oil shale will undergo changes, subsequently impacting the aperture, the connectivity of the fracture network, and even the efficiency of pyrolysis [11,12]. Therefore, a comprehensive study of the microstructural and macroscopic mechanical properties of oil shale along different bedding directions under high-temperature conditions is necessary to ensure the successful implementation of in situ pyrolysis technology for oil shale.
The presence of bedding planes and pores and the oriented distribution of mineral particles impart significant mechanical anisotropic characteristics to oil shale [13,14,15]. In recent years, numerous scholars have explored the mechanical anisotropy of rocks under ambient conditions. Roy investigated the influence of joint geometric characteristics on the fracture toughness and tensile strength of sandstone, revealing a decrease in both fracture toughness and tensile strength with reduced joint spacing [16]. Jin conducted tests on the uniaxial compressive strength and direct tensile strength of the Marcellus shale loaded along different bedding orientations, discovering that the compressive strength was at its minimum at a bedding angle of 60° [17]. Li et al. explored the variation in crack-initiation mechanisms during the progressive failure of shale, considering bedding angles ranging from 0° to 90°. The results indicated an increasing trend followed by a decreasing trend in the ratios of crack-initiation stress and damage stress to peak strength with rising inclination angles [18,19,20]. Wang et al. conducted tests to examine the influence of normal stress and bedding angle on the shear strength of laminated sandstone. The findings revealed a higher sensitivity of shear strength to changes in the bedding angle, and the maximum value of the anisotropy coefficient consistently aligned with the orientation of the bedding planes [21,22]. While extensive research has focused on the impact of rock bedding on its mechanical anisotropic properties under ambient temperature conditions, the in situ pyrolysis of oil shale involves subjecting the mineral body to a transition from ambient temperature to high-temperature conditions [23]. Therefore, it is essential to investigate the effects of exposure to high temperatures on its mechanical characteristics.
The temperature conditions to which rocks are subjected are crucial parameters influencing their mechanical properties [13,24]. In recent years, the impact of high temperatures on the mechanical properties of rocks has become a central focus in various engineering fields, including geothermal-energy development, in situ pyrolysis of oil shale, nuclear-waste disposal, and heavy-oil extraction. Vishal et al. investigated the temperature-dependent variation in the Mode I fracture toughness of shale within the temperature range of 20 to 400 °C. They observed a continuous increase in shale fracture toughness with temperatures from 20 to 100 °C, which was followed by a decrease until 400 °C [25]. Ranjith conducted mechanical-property testing on sandstone exposed to high temperatures in the range of 20 to 950 °C. The results indicated that, up to 500 °C, the compressive strength and elastic modulus of the sandstone increased with rising temperature. However, beyond 500 °C, both parameters exhibited a decreasing trend with further increases in temperature [26]. While the aforementioned studies primarily focused on conducting mechanical tests on specimens subjected to high temperatures due to limitations imposed by experimental equipment, it is essential to recognize that under real-time high-temperature conditions, changes in thermal stress, interparticle cohesion among mineral grains, and pore pressure can directly influence the mechanical properties of rocks [27]. To address this issue, Closmann investigated the tensile and compressive strength of oil shale under high-temperature conditions ranging from 20 to 400 °C. The study revealed a continuous decrease in both tensile and compressive strength with increasing temperature [12]. Guo et al. conducted triaxial-compression experiments on shale under high-temperature conditions ranging from 25 to 150 °C, showing a decrease in the compressive strength and elastic modulus of shale by 13.7% and 36.9%, respectively, in the 150 °C environment [28]. Additionally, Fan et al. investigated the dynamic mechanical parameters of shale under high-temperature conditions when the shale was loaded along different bedding angles, revealing that the critical temperature at which the mechanical parameters of shale undergo a transition varied across different bedding angles. Moreover, the roughness of the fracture surface showed a positive correlation with the dynamic compressive strength of shale [29]. Currently, there is a relative scarcity of research on the evolution of the mechanical properties of rock under high-temperature real-time conditions. Furthermore, the experimental temperatures tested so far have been below 400 °C. However, during the in situ pyrolysis of oil shale, the effective pyrolysis temperature falls within the range of 450 to 550 °C. In this temperature range, oil shale is concurrently influenced by the thermal cracking of inorganic minerals and the thermal decomposition of organic matter [3]. Consequently, the mechanism controlling the evolution of its mechanical properties is expected to be more complex compared to that seen at temperatures below 400 °C. Therefore, it is imperative to continue research on the evolution of the mechanical properties of oil shale under high-temperature real-time conditions.
The thermal cracking that occurs within rocks under high-temperature conditions is a key factor causing changes in their mechanical properties. Arash Rabbani employed CT imaging to investigate variations in the pore structure of oil shale during the pyrolysis process. The study found a significant increase in both the porosity and fracture aperture of oil shale within the temperature range of 390 to 400 °C [30]. Bai F conducted a study on the pore and fracture characteristics of oil shale after retort and pyrolysis using a combination of SEM and nitrogen-adsorption techniques. Within the temperature range of 350–450 °C, the liquefaction of kerogen resulted in pore throat blockage, and post-pyrolysis led to the roughening of pore and fracture surfaces [31]. Liu Z utilized nuclear magnetic resonance (NMR) techniques to analyze the pore-connectivity characteristics of oil shale after exposure to high temperatures. The study revealed that beyond 300 °C, the connectivity of pores and fractures at the same level increased. Additionally, the contribution of mobile fluid-filled pores to the overall increase in porosity was significant [32]. After subjecting oil shale to high-temperature steam pyrolysis, Wang L. observed a substantial transformation in the pore and fracture structures of the oil shale when the temperature exceeded 314 °C. The average pore size increased by a factor of 9.2, and the permeability exhibited an increase by a factor ranging from 915 to 2777 [33]. However, the aforementioned studies on oil shale were conducted under stress-free conditions, neglecting the influence of thermal stress on the internal fracturing characteristics. Therefore, it is necessary to conduct research on the micro-fracture features of oil shale under thermomechanical-coupling conditions to elucidate the mechanisms governing the evolution of its macroscopic mechanical properties.
This study employs a combined macro−microscopic approach to investigate the anisotropic variation in the physical and mechanical properties of oil shale under real-time high-temperature conditions ranging from 20 to 600 °C. Firstly, the self-developed thermo-mechanical-coupling CT-scanning loading device was used to analyze the pattern of evolution of pores and fractures in oil shale under the two loading models of loading perpendicular and parallel to the bedding plane. Secondly, the mechanical properties of oil shale under uniaxial compression loading perpendicular and parallel to the bedding plane were tested and analyzed using the self-developed real-time high-temperature rock-mechanics test system. The objective of these analyses is to establish patterns of modification in the physical and mechanical properties of oil shale under high-temperature conditions. The aim is for the obtained results to provide fundamental data for understanding reservoir transformation and wellbore-engineering processes during the in situ pyrolysis of oil shale.

2. Sampling and Methodology

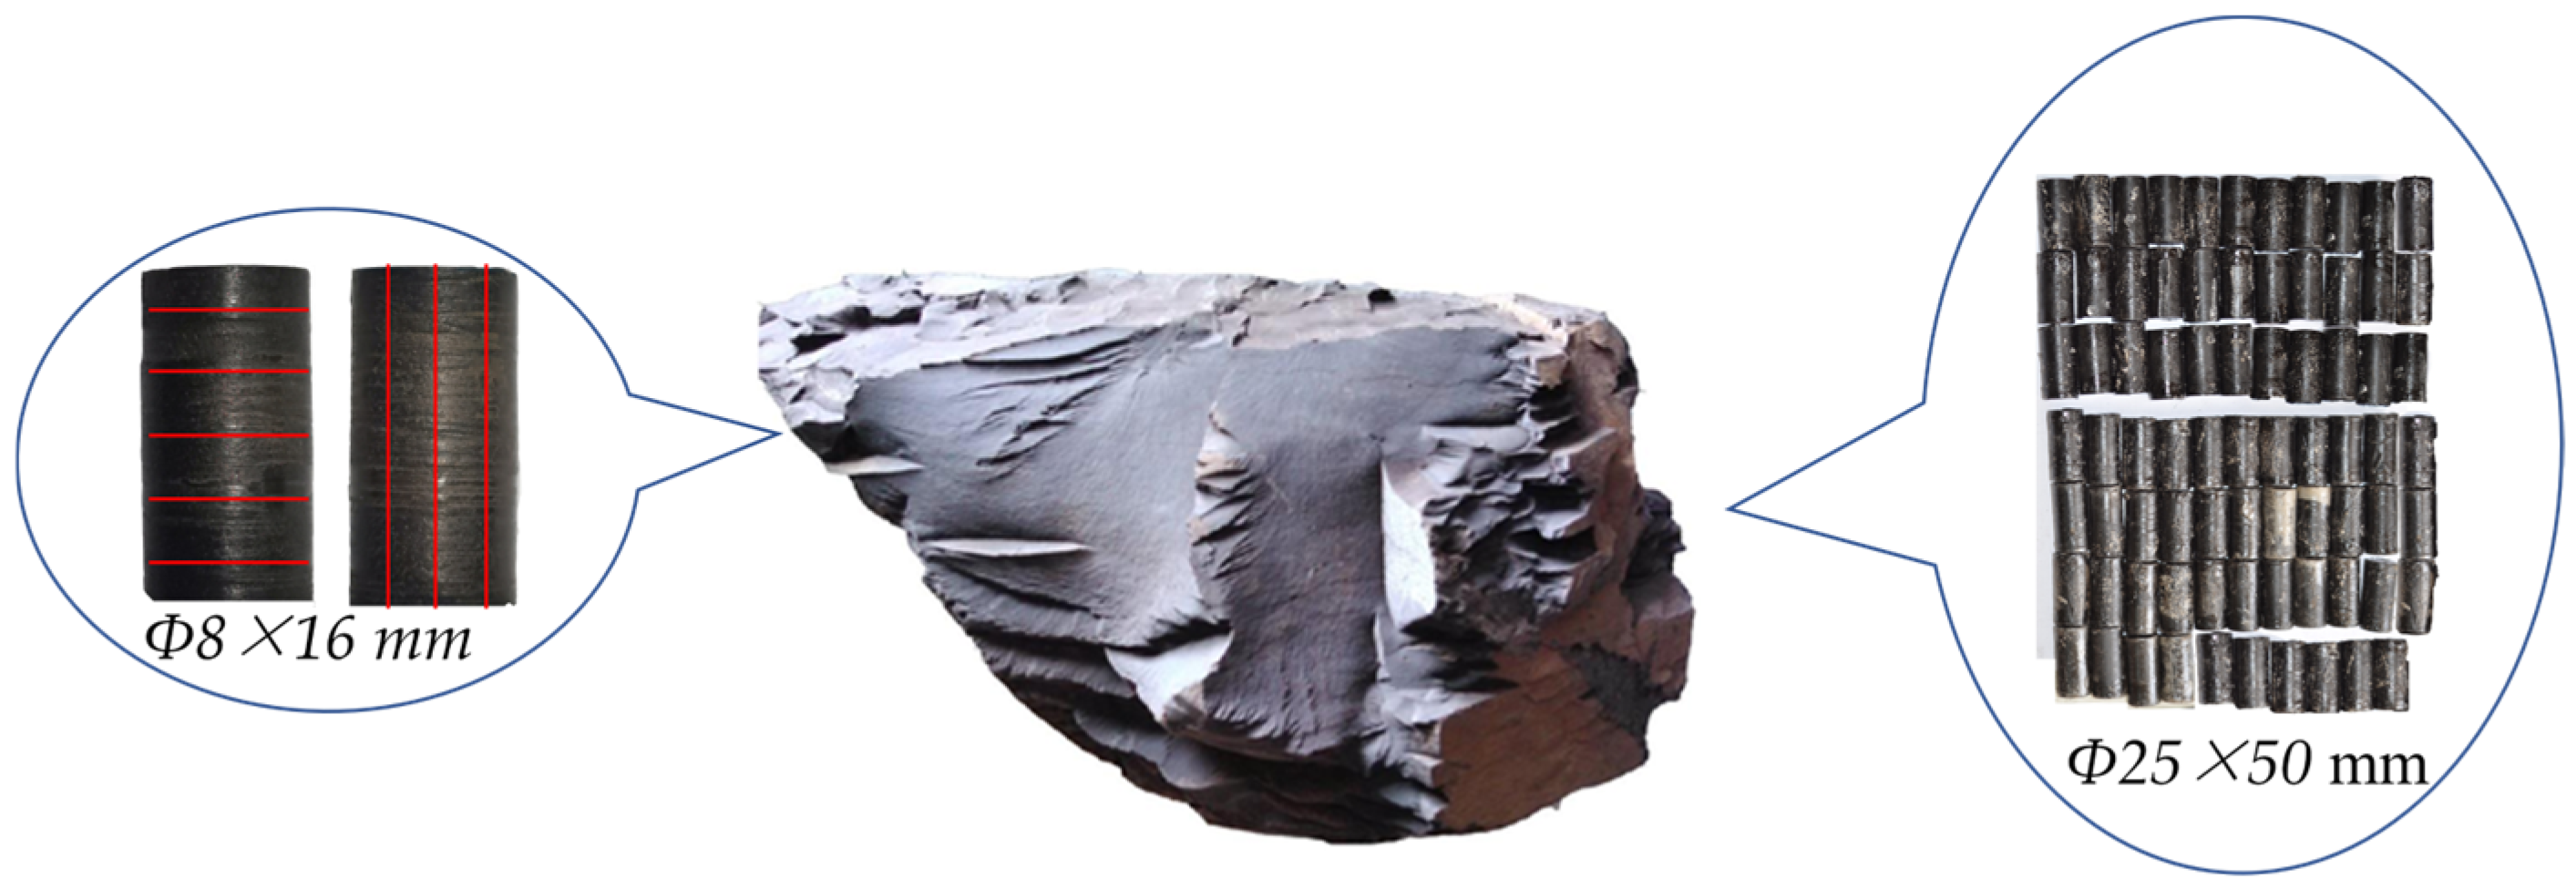
2.1. Sample Preparation

The aim of this study was to establish the law governing the evolution of the microstructure characteristics and macroscopic mechanical properties of oil shale during in situ pyrolysis and promote the in situ pyrolysis of oil shale to achieve industrial mining. The samples were obtained from the −120 m position of the Taimu Lignite Mine in Xinjiang, China. Under normal temperature conditions, these samples exhibited a density of 0.9324 g/cm3 and a porosity of 2.09%; the mineralogical composition is shown in Table 1.
To minimize variability among specimens, all samples were taken from the same large block of oil shale (Figure 2). In the process of specimen processing, in order to eliminate the influence of drill torque on the bedding surface of oil shale, a carborundum saw cutting machine was used for sample processing. Upon completion of specimen processing, an ultrasonic testing analyzer was employed to rigorously screen the samples. The selected samples were sealed with paraffin wax to effectively prevent oxidation, so as to ensure the accuracy of the experimental results. The specifications for each experimental sample were as follows: (1) cylindrical oil-shale samples measuring Φ8 × 16 mm, employed for CT observations of the microstructure of oil shale under thermal−mechanical coupling; (2) cylindrical samples with dimensions of Φ25 × 50 mm, used for high-temperature real-time uniaxial-compression experiments on oil shale.
It is important to emphasize that the processing and selection of samples required for CT scanning and uniaxial-compression experiments strictly adhered to the ISRM standards [34]. The tolerance for end-face unevenness was within ±0.05 mm. Due to the potential impact of bedding planes on oil shale on experimental results, 4 to 7 specimens were tested under each experimental condition in uniaxial-compression tests. The number of specimens could be adjusted based on the degree of dispersion in the test result.

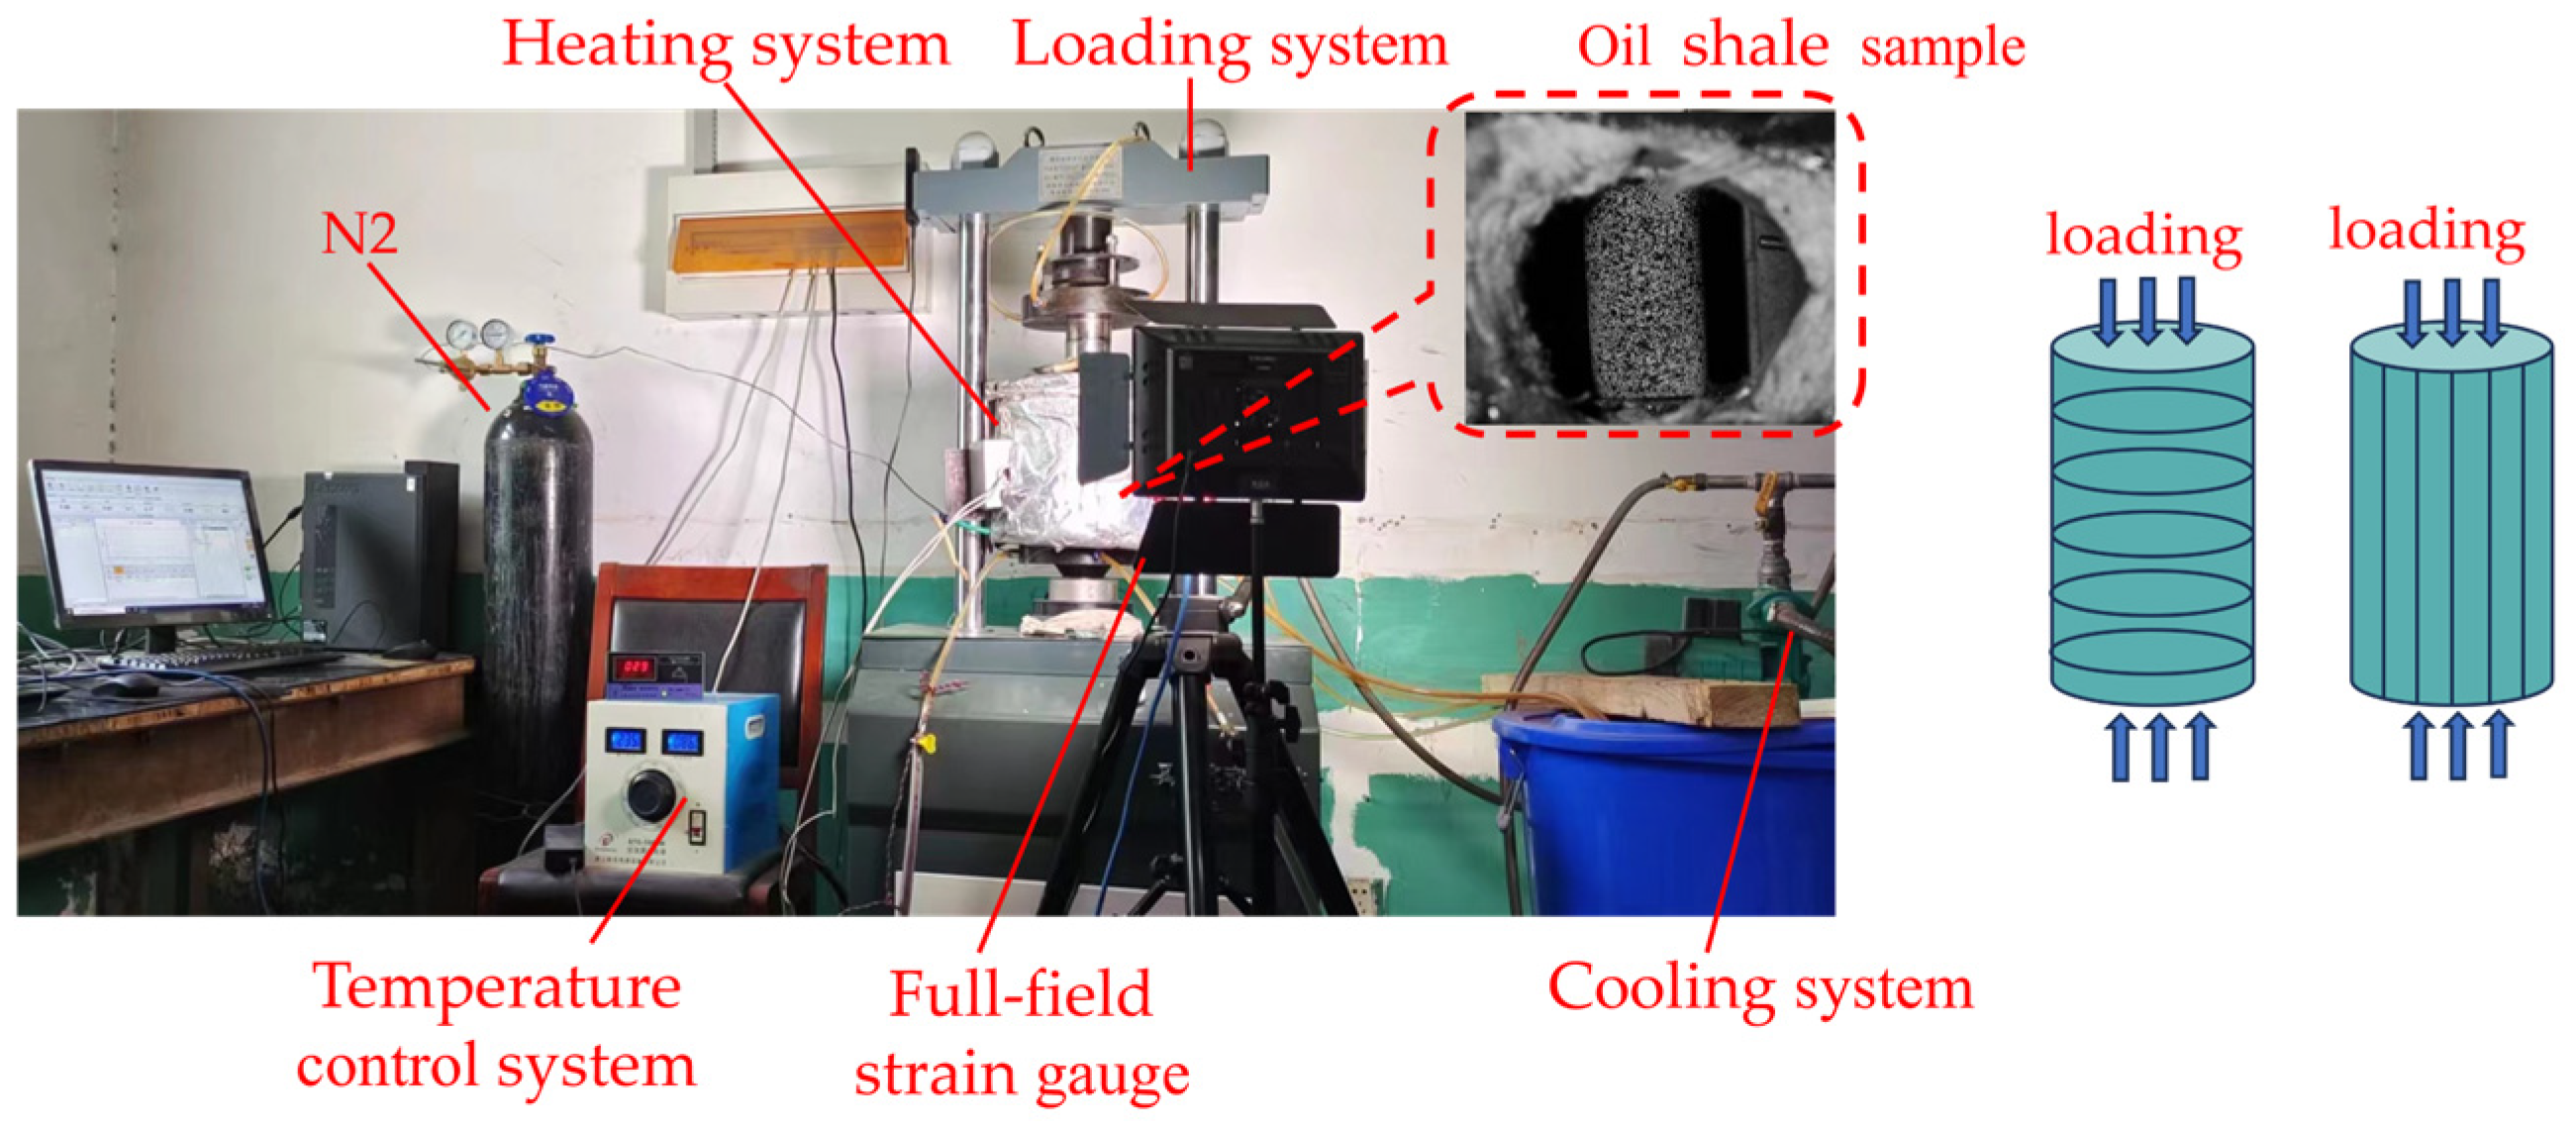
2.2. Experimental Equipment and Test Methods

2.2.1. Microstructure Test

The testing and analysis of microstructures were carried out using a NanoVoxel-4000 CT detection system and a thermally coupled CT-scanning loading device developed by the Taiyuan University of Technology (Figure 3). The voltage range of the ray source of the nanoVoxel-4000 high-resolution-X-ray three-dimensional-CT detection system was 20~225 kV; the range of the tube current was 0.05~3 mA; the flat-panel detector was 3072 × 3072 pixels 16 bit; and the pixel size was 139 um. The effective imaging area was 427 × 427 mm, and the highest spatial resolution was 2 μm.
Before the experiment, Φ8 × 16 mm oil shale specimens were placed in the loading device and subjected to an axial stress of 2 MPa perpendicular to the bedding plane. Subsequently, the CT equipment was employed to scan and record the initial development state of pores and fractures within the specimens. After the scanning process was complete, the heating device was used to increase the temperature at a rate of 0.5 °C/min, sequentially reaching 100 °C, 200 °C, 300 °C, 400 °C, 500 °C, and 600 °C. Simultaneously, N2 gas was introduced to prevent the combustion of the oil shale. Once the target temperature was reached, the specimens were maintained at a constant temperature for 2 h to satisfy the overall temperature balance within the rock [35]. Following this, CT scanning was performed to document the characteristics of the evolution of pores and fractures within the oil shale at that specific temperature. This methodology was then replicated for the CT scanning of specimens oriented parallel to the laminations.

2.2.2. Mechanical-Properties Test

The evaluation of mechanical properties in oil shale under real-time conditions was performed using the high-temperature rock-mechanics testing system developed by the Taiyuan University of Technology (Figure 4). The loading system boosted a maximum load capacity of 200 kN and a displacement resolution of 0.048 µm. The heating system employed radiation heating and could attain a maximum temperature of 800 °C, ensuring a temperature-control accuracy of ±0.1 °C [35]. For deformation monitoring, a MatchID-2D/Stereo full-field displacement, strain-measurement, and simulation-optimization analysis system was used, featuring a surface resolution of 0.02195 mm/pixel and a displacement accuracy of 0.01 pixels.
The experimental procedure was performed as follows: (1) a pre-fabricated Φ25 × 50 mm oil-shale specimen with artificially generated scattered spots on the surface was positioned in a heating furnace, and a pre-stress of 0.05 kN was applied to both ends of the specimen; (2) the specimen underwent sequential heating to 100 °C, 200 °C, 300 °C, 400 °C, 500 °C, and 600 °C at a heating rate of 0.5 °C/min. Simultaneously, N2 was added to prevent the combustion of the oil shale. Once the target temperature was reached, the specimen was held at a constant temperature for 2 h; (3) the specimen experienced stress at a displacement loading rate of 0.02 mm/min, and the full-field strain-measurement system was activated at that time and remained active until the specimen failed. Following these steps, uniaxial compression-loading tests parallel and perpendicular to the bedding plane were conducted on oil-shale specimens under varying temperature conditions.

3. Results and Discussion

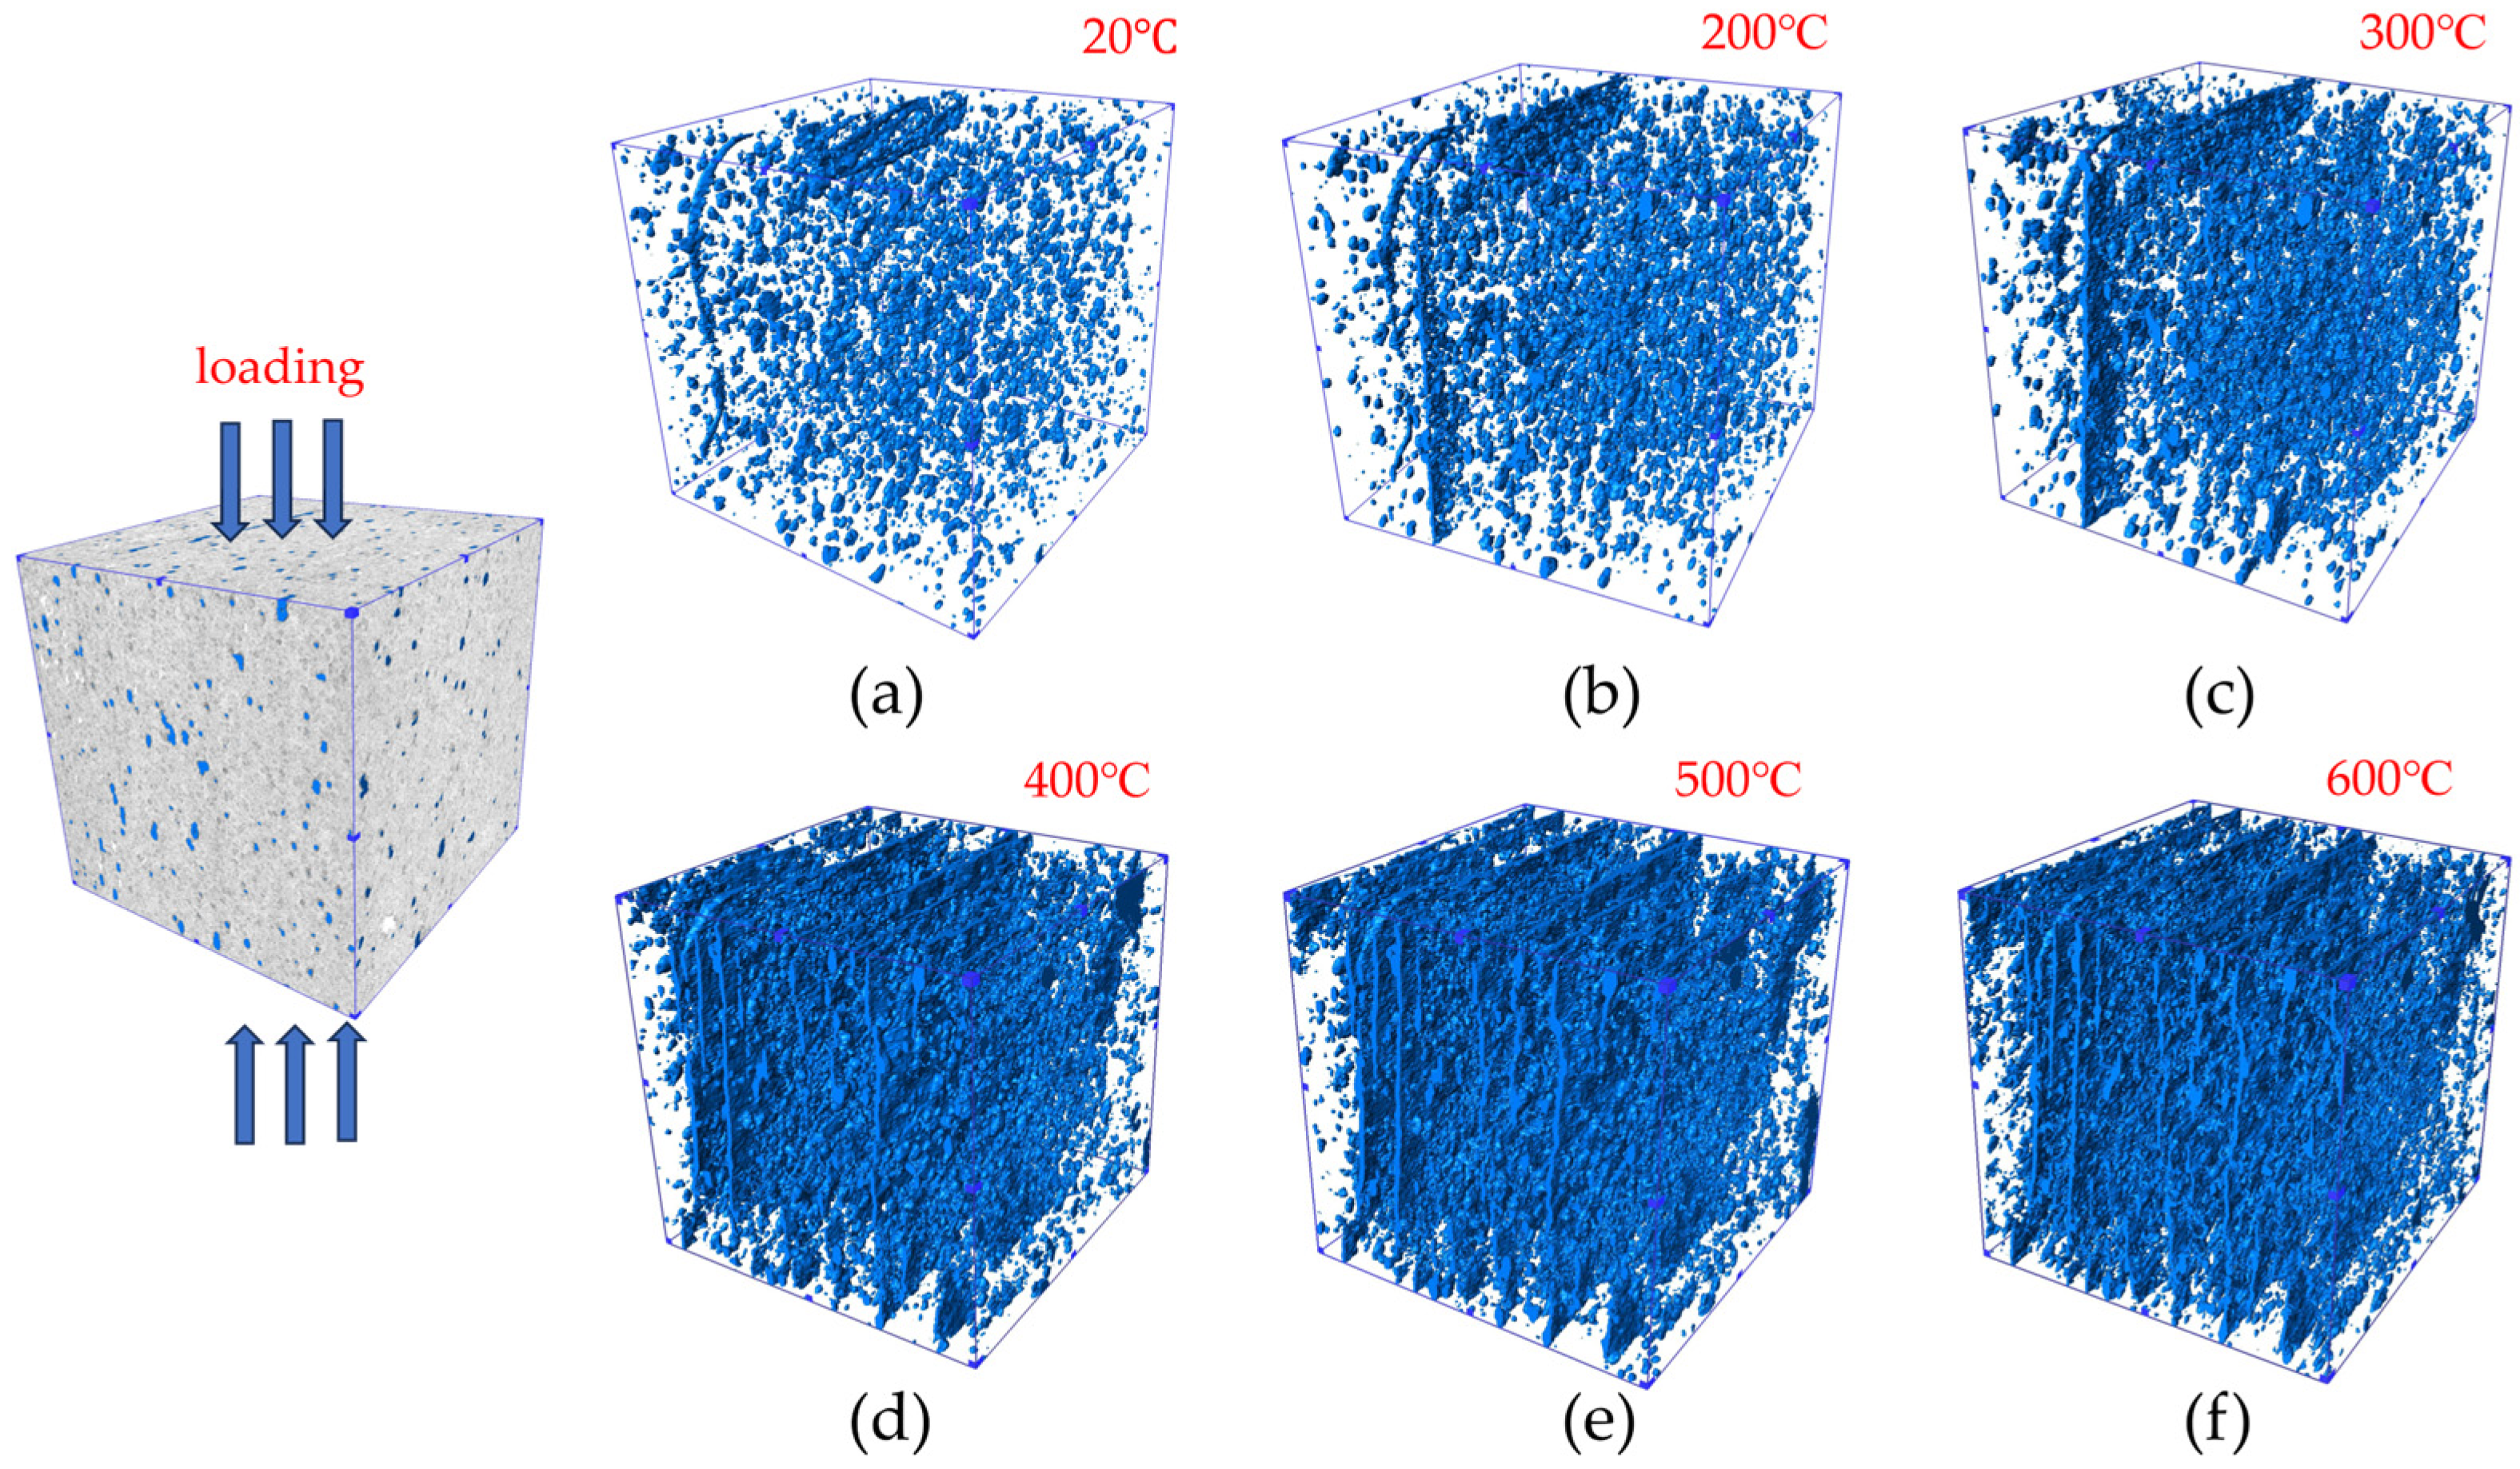
3.1. Characteristics of the Evolution of Pore and Fracture Structures in Oil Shale

Subsubsection

The thermal cracking and pyrolysis phenomena induced by high-temperature effects in oil shale resulted in modifications in the number, size, and connectivity of internal pores and fractures, thereby impacting the physical and mechanical properties of the shale. Figure 5 and Figure 6 depict 3D-rendered images of the internal pore and fracture structures of oil shale after thermal treatment. Due to the resolution of the imaging technique, this study focuses on pore structures with diameters exceeding 10 μm. Based on Figure 5 and Figure 6, variations in the size and quantity of pores and fractures across different specimens under ambient conditions are apparent. Moreover, these pores and fractures were segregated and existed in an isolated state. The lengths of the fractures ranged from 1.8 to 5.2 mm, with a maximum aperture of 8 μm.
When the shale was heated to 200 °C, there was minimal change in the number of internal pores and fractures (Figure 5b). However, there was a notable reduction in fracture aperture. This result significantly differs from the observed increases in pore and fracture numbers and sizes measured under unstressed or unconstrained conditions [36,37]. Conversely, both the numbers and apertures of pores and fractures increased (Figure 6b). This phenomenon stems from the existence of primary pores and fractures within the oil shale under perpendicular-bedding conditions, which offer expansion space for mineral particles. The internal pore and fracture structures progressively close inward, leading to decreases in their numbers, sizes, and apertures [28]. Additionally, matrix dehydration generates new pores and fractures, causing minimal changes in their quantity under these conditions. However, under parallel-bedding conditions, thermal expansion of the matrix increases axial stress. Under lateral stress, primary pores and fractures extend along the bedding, generating a small number of new pore and fracture structures, thereby increasing their numbers and scales.
Upon heating to 300 °C, the numbers of pores and fractures showed little change (Figure 5c), but the aperture of bedding-related fractures increased compared to that at 200 °C. This increase was due to the continual loss of strongly bound water within the oil shale at this temperature range [38]. It is worth noting that these results significantly differ from the observation of a marked increase in the numbers of pores and fractures within oil shale under unstressed conditions [39,40]. Simultaneously, the conversion of kerogen from a solid to a liquid state results in further expansion of rigid minerals at the primary fracture locations, contributing to increased fracture aperture [41]. Meanwhile, the numbers of pores and fractures continued to increase (Figure 6c), with pores and fractures primarily distributed along the bedding planes. This is attributed to the loss of strongly bound water, which led to separation and reduced cohesion between bedding planes. With increased lateral stress, primary and newly formed fractures develop and propagate along the weaker planes between bedding planes.
Between 400 and 600 °C, the numbers and sizes of pores and fractures within the oil shale increased significantly under both perpendicular- and parallel-bedding-plane loading conditions. At this stage, pores and fractures predominantly appeared as discrete entities (Figure 5d,f). However, at the same temperature, the connectivity of pores and fractures within the same bedding plane was notably higher (Figure 6d,f) compared to that of those shown in Figure 5. Especially significant is the emergence of interlayer fracturing phenomena between different bedding planes after temperatures reached 500 °C. This occurred because, at 400 °C, kerogen begins to break down into bitumen and to release gas [37,41], resulting in a substantial increase in the numbers of internal pores and fractures within the oil shale. The temperature range of 450 to 550 °C is the primary temperature range for kerogen pyrolysis. Upon reaching this temperature, bitumen undergoes rapid breakdown into mixed hydrocarbon gases. As a result of pyrolysis, thermal cracking, and pyrite decomposition within the shale matrix, significant numbers of pores and fractures were generated [24,42], establishing connectivity between fractures in distinct bedding planes.

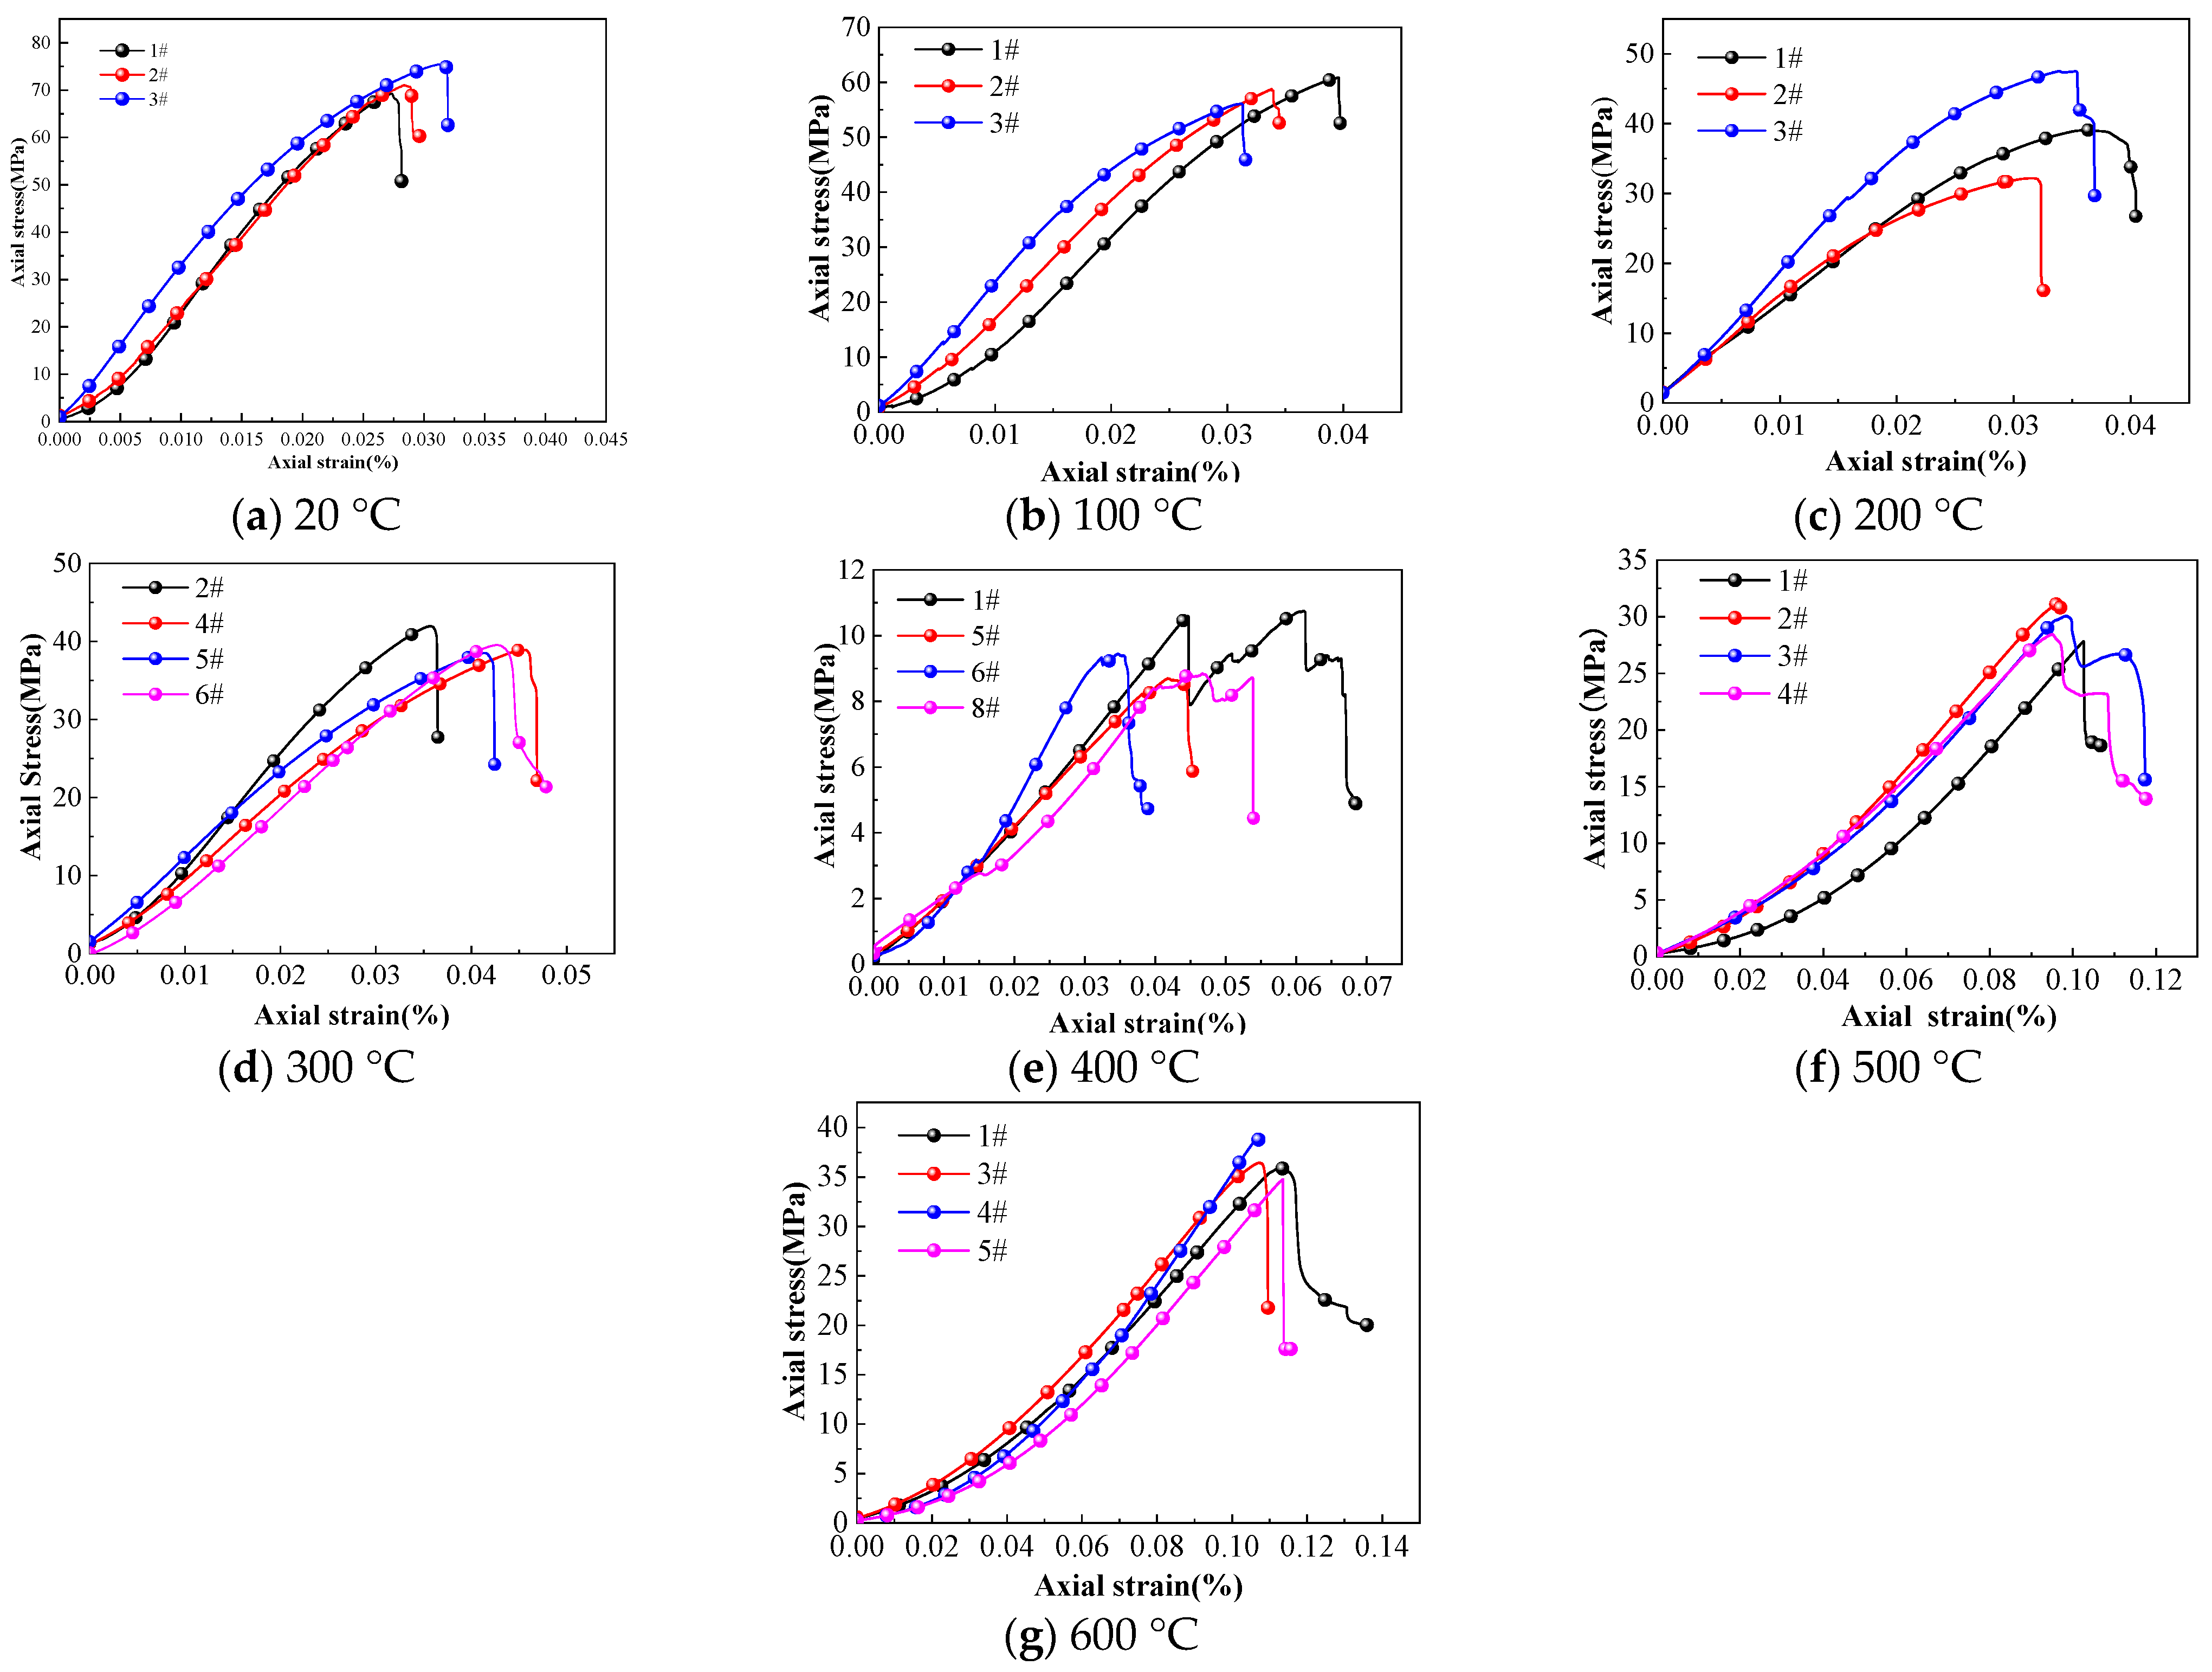
3.2. Deformation Characteristics of Oil Shale under High-Temperature Real-Time Conditions

Figure 7 illustrates the stress−strain curves for uniaxial compression of vertical oil-shale layers at various temperatures.
At 20 °C, the stages of deformation of the oil shale included the compaction stage, the linear elastic stage, the yielding stage, and eventually the failure stage, showcasing characteristics typical of brittle failure. As the temperature increases from room temperature to 600 °C, the stress−strain curve displays two distinct transitional features. Firstly, the duration of the compaction stage initially decreased, then increased, reaching a minimum at 200 °C. Secondly, the duration of the yielding stage increased up to 400 °C and then decreased as the temperature rose further temperature. By combining the evolutionary characteristics of pore−fracture structures (Figure 5), it can be inferred that the reduction in the duration of the compaction stage within the 200 °C temperature range can be attributed to the inward expansion and closure of primary pore fractures.
Beyond 200 °C, as kerogen transitions from a solid to a liquid state and gradually breaks down with increasing temperature, the combined effects of thermal cracking and pyrolysis lead to the generation of a significant amount of new pore−fracture structures within the oil shale, resulting in the reappearance and prolongation of the compaction stage. The initial increase, which is followed by a decrease, in the duration of the yielding stage, is attributed to a significant decrease in the strength of oil shale within the temperature range of 20 to 400 °C. This decrease occurs due to a reduction in cohesive forces among mineral particles, which is the result of dehydration, and an increase in pore−fracture formation due to thermal cracking and pyrolysis, which leads to a continuous prolongation of the yielding stage [43]. However, when the temperature exceeds 400 °C, changes in mineralogical composition, including the transformation of kaolinite to metakaolinite, the dissociation of structural crystalline water in the form of H+ and OH-, and phase transitions in quartz, result in the hardening of the oil-shale matrix, leading to a subsequent increase in strength [38,44,45]. Consequently, this temperature range leads to a reduction in the length of the yielding stage.
At 20 °C, the stress−strain curve for loading parallel to the bedding planes shows a much smaller compaction segment and almost no yielding stage compared to that for loading perpendicular to the bedding planes (Figure 8). As the temperature increases up to 600 °C, the stress−strain curve reveals the following characteristics: firstly, the compaction segment gradually diminishes with increasing temperature and reappears at 600 °C; secondly, the yielding stage continually expands, accompanied by a distinct post-peak segment in the stress−strain curve. Because of the dense nature of the oil-shale matrix, there is limited closure of bedding-plane fractures when loading is parallel to the bedding planes. Moreover, since the strength of the matrix significantly surpasses that of the bedding planes, external loading results in horizontal tensile failure between the bedding planes in the oil shale, with relatively minor axial plastic deformation. Consequently, the compaction segment and yielding stage are considerably shorter compared to those observed when loading was in the direction of the vertical bedding plane.
Between 20 and 200 °C, the primary factor leading to the reduction of the compaction segment is the inward closure of the matrix pores. Beyond 200 °C, the generation of bedding-plane fractures significantly decreases the mechanical strength of the bedding planes (Figure 6c). Because the critical load for horizontal tensile deformation is lower than the critical load for matrix pore closure, oil shale primarily undergoes horizontal tensile deformation failure under external loading, with minimal matrix compression deformation. Therefore, within the range of 200 to 500 °C, there is almost no compaction stage.
Upon the sample’s reaching 600 °C, the peak load significantly increased compared to that measured at 500 °C. The increase in the quantity and connectivity of internal pore fractures (Figure 6e,f), reduces the stress required for pore closure. At this stage, the external load that the oil shale can bear surpasses the stress needed for pore closure, leading to the reappearance of the compaction segment at 600 °C. The decrease in inter-particle cohesion and the increase in pore fractures caused by temperature rise both contribute to increased plastic deformation, resulting in a continuous expansion of the yield segment with temperature. The emergence of the post-peak segment occurs because, under horizontal stress, the oil shale transitions into a multi-layer composite material due to delamination and various bedding planes exhibit differing mechanical strengths. Even after the axial stress reaches its peak strength, it does not instantly lose its load-bearing capacity; hence the appearance of the post-peak segment.

3.3. Evolution Characteristics of Compressive Strength

As depicted in Figure 9a, the variation in the compressive strength σper in the perpendicular bedding direction of the oil shale unfolds across four distinct stages within the temperature range of 20 to 600 °C as the temperature increases.
Stage 1: Between 20 and 200 °C, σper experienced a rapid decline with increasing temperature. At 20 °C, σper measured 72 MPa. Upon reaching 200 °C, σper diminished to 39 MPa, representing only 54% of its value at room temperature. This result stands in stark contrast to the findings obtained from post-temperature treatment testing [46]. Despite the absence of new pores or fractures within the oil shale at 200 °C (Figure 5b), the amount of adsorbed and bound water within the oil shale gradually diminishes as the temperature rose to 70 °C and 150 °C, leading to a reduction in the cohesive strength of the oil shale [45,47]. Consequently, the compressive strength rapidly decreases with increasing temperature.
Stage 2: Between 200 and 300 °C, σper remained relatively constant. The disappearance of strongly bound water in this temperature range increases the number of bedding cracks [47] (Figure 5c). Simultaneously, the pore structure in the matrix is squeezed due to the expansion of mineral particles, which strengthens the matrix [41]. Under the combined action of the two, σper remains essentially unchanged.
Stage 3: Between 300–400 °C, σper underwent a rapid decline as the temperature rose. At 400 °C, σper measured 8.57 MPa, representing only 11.8% of the compressive strength under room-temperature conditions. This decline can be attributed to kerogen generating liquid asphalt and releasing volatile gases after its temperature exceeds 350 °C, resulting in the formation of numerous pore and crack structures within the matrix [3] and thus leading to the rapid decrease of σper during this stage.
Stage 4: In the temperature range of 400 to 600 °C, the compressive strength σper of oil shale samples after heat treatment decreases as the temperature increases [45]. In this study, however, σper experienced a rapid increase with rising temperature. At 600 °C, σper rebounded to 38.4 MPa. This phenomenon is attributed to the dissociation of crystalline water existing in the mineral lattice structure in the form of H+ and OH- at high temperatures ranging between 450 and 500 °C; this dissociation causes a transformation of the mineral lattice. For example, kaolinite transforms into metakaolinite and undergoes sintering processes [46,48]. This process may be the primary reason for the enhancement of the matrix’s compressive strength within this temperature range.
Within the temperature range of 20 to 600 °C, the compressive strength σpar of oil shale in the parallel layer direction can be divided into two stages with increasing temperature (Figure 9b).
Stage 1: In the range of 20 to 400 °C, σpar experienced a rapid decrease with increasing temperature. At room temperature, the average value of σpar was 48.5 MPa, which accounted for 67% of σper under the same conditions. This was associated with the presence of inherent fissures randomly distributed within the oil shale under natural conditions (Figure 6a). Because the strength between bedding planes is significantly lower than the matrix strength [30], when it is subjected to uniaxial compression loading parallel to the bedding plane, the shale will undergo tensile failure in the lateral direction due to the horizontal stress, resulting in a lower compressive strength compared to loading perpendicular to the bedding plane. Upon heating to 400 °C, σpar measured only 2.99 MPa, which was merely 6% of the compressive strength at room temperature. This decline can be attributed to the continuous increase in internal layering fractures of oil shale during the gradual temperature rise to 400 °C, which resulted from dehydration, transformation of kerogen, and thermal decomposition (Figure 6b–d). Therefore, σpar exhibited a rapid decrease with increasing temperature during this stage.
Stage 2: In the temperature range of 400–600 °C, σpar gradually increased as the temperature rises. This result is contrary to that obtained after high-temperature treatment [45]. At 600 °C, σpar reached 6.5 MPa, which was 13.4% of its value at room temperature. This increase occurred because when the parallel bedding is loaded, the primary reason for the oil shale’s loss of bearing capacity is the tensile failure caused by lateral-component stress. However, when the temperature reached 400 °C, further heating had minimal effects on bedding cracks (Figure 6d–f). At this point, the increase in matrix strength due to changes in the mineralogical composition was the primary reason for the increase in σpar.

3.4. Evolution of Elastic Modulus

As per Figure 10a,b, it is evident that within the range from room temperature to 600 °C, the elastic modulus in the vertical bedding-plane direction (Eper) and the elastic modulus in the parallel bedding-plane direction (Epar) undergo two distinct stages of change with increasing temperature.
Stage 1: Within the temperature range of 20–400 °C, both Eper and Epar decreased as the temperature rose. At room temperature, Eper and Epar were 3.28 GPa and 4.5 GPa, respectively, with Eper being 72.9% of Epar. This occurred because when loading is perpendicular to the stratification, the stratification fractures gradually close and compact with the increase of load. Conversely, when loading is parallel to the stratification, the same stratification surface is relatively denser than the former, resulting in Eper being less than Epar. At 400 °C, Eper and Epar decreased to 0.23 GPa and 0.69 GPa, respectively. Before 300 °C, the decrease in cohesion caused by high-temperature water loss continuously increases with the rise of temperature [37,48], making mineral particles more prone to sliding under external loads, resulting in a continuous decrease in Eper and Epar. In the temperature range of 300–400 °C, as the kerogen changes from a solid to a liquid state, the oil shale softens, leading to a further decrease in Eper and Epar. Notably, in the temperature range of 200–300 °C, the rate of decline in Epar is significantly slower than that in Eper. As depicted in Figure 5 and Figure 6, the pore−fracture distribution in oil shale within this temperature range is dominated by the generation of stratification cracks, while the number of new pores within the same stratification plane is significantly less than that of stratification cracks. Consequently, Eper decreases rapidly, while Epar decreases slowly.
Stage 2: Between 400 and 600 °C, both Eper and Epar experienced a gradual increase with temperature. At the elevated temperature of 600 °C, Eper and Epar reached 0.439 Gpa and 1.15 Gpa, respectively. This trend correlates with the changes observed in compressive strength and is attributed to the transformation of kaolinite and the clay sintering process.

3.5. Evolution of Poisson’s Ratio

Poisson’s ratios (μper and μpar) of oil shale under uniaxial compression in the perpendicular and parallel bedding directions were obtained using digital image correlation, illustrating their variation with temperature (Figure 11a,b).
As depicted in Figure 11a, the Poisson’s ratio μper of oil shale subjected to load perpendicular to its bedding plane goes through four distinct stages as the temperature increases from 20 to 600 °C.
Stage 1: Between 20 and 200 °C, μper rapidly declined from 0.326 at room temperature to 0.2, which is 61% of its initial value. This reduction stemmed from the continuous dehydration reactions occurring within the shale, which resulted in a decline in cementation force among mineral particles and the loss of water lubrication. Consequently, relative motion between mineral particles became more challenging, leading to a continuous decrease in μper.
Stage 2: Between 200 and 300 °C, the variation in μper was minimal. As depicted in Figure 5b,c, hard minerals such as quartz and feldspar contributed to an increased aperture of pore and fracture structures within this temperature range [41]. This expansion allowed for lateral deformation of the matrix, resulting in minimal changes to μper.
Stage 3: Within the temperature range of 300–500 °C, μper decreased rapidly with rising temperature. By the time the temperature reached 500 °C, μper decreased to 0.057. This reduction occurred because, beyond 300 °C, the pyrolysis of kerogen leads to an increase in internal pore and crack formation (Figure 5c–e). Under external loading, mineral components within the same bedding plane filled the pores through mutual extrusion, reducing lateral deformation and consequently lowering μper.
Stage 4: In the temperature range of 500–600 °C, μper increased continuously with temperature rise. At 600 °C, μper reached 0.094, marking an 11.3% increase compared to 500 °C. This increase may be attributed to the completion of kerogen pyrolysis around 550 °C [3], along with the reconstruction of pore and crack structures. The strengthening of the matrix could account for the increase in μper.
As depicted in Figure 11b, during uniaxial compression parallel to the bedding plane at temperatures from 20 to 600 °C, the Poisson’s ratio μpar exhibited a phased change pattern.
Stage 1: Within the temperature range of 20–200 °C, μpar decreased rapidly from 0.278 to 0.185. This trend aligns with the change in μper and was primarily caused by dehydration of water from the matrix.
Stage 2: In the temperature range of 200–400 °C, the Poisson’s ratio μpar increased rapidly with temperature. At 400 °C, μpar reached 0.339, which is 1.22 times its value at room temperature. As the temperature rose from 300 to 400 °C (Figure 6c,d), the pyrolysis of organic matter intensified thermal cracking within the oil shale, leading to an increase in bedding-plane cracks and a decrease in cohesion between mineral particles. Under lateral stress, lateral deformation increased, resulting in a rapid rise in μpar with temperature.
Stage 3: In the temperature range of 400–600 °C, μpar exhibited a gradual increase with rising temperature. At 600 °C, μpar reached a value of 0.367. This increase is attributed to the pyrolysis of organic matter, which produced a large number of pores and transformed the oil shale into a porous medium, resulting in additional lateral deformation under load. However, by the time the temperature reached 400 °C, the internal bedding fracture network in the oil shale had largely formed (Figure 6d–f) and the influence of temperature on its bedding expansion diminished, leading to a slower increase in μpar.

3.6. Characteristics of Progressive Failure of Oil Shale at Different Temperatures

The process of oil-shale deformation and failure entails the initiation and propagation of internal pore cracks under external loads. By correlating crack-volume strain with stress−strain curves, the loading process can be segmented into four stages: crack closure, linear elasticity, stable crack propagation, and accelerated crack propagation (Figure 12) [49]. Within these stages, the threshold values of initial stress for stable fracture expansion, σci, and the damage-stress threshold for accelerated expansion, σcd, reflect the oil shale’s resistance to crack initiation and failure under varying conditions. These thresholds are pivotal for predicting the deformation and failure of oil-shale reservoirs.

3.6.1. Initial Stress of Fractures at Different Temperatures

Within the temperature range of 20–600 °C, the initial stress of cracks, denoted as σci-per, displayed a “step-like” variation as the temperature increased when loading was in the direction perpendicular to the bedding planes (Figure 13a).
At 20 °C, σci-per was 35.6 MPa and the σci-perc-per ratio was 49.3%, in line with the findings of Brace [50]. Upon reaching 100 °C, there was no significant change in σci-per, indicating that temperature increase had a minimal impact on crack initiation during perpendicular loading within this range. However, when the temperature reached 200 °C, σci-per decreased to 20.77 MPa, 52.6% of the peak load. As shown in Figure 5b, the inorganic minerals in the matrix began to expand at this temperature [31]. Due to the inconsistent expansion properties of different mineral particles and the loss of bound water at 150 °C, the cohesive force between mineral particles decreased, resulting in a reduction in σci-per.
At 300 °C, the value of σci-per was 20.1 Mpa, showing little change compared to that at 200 °C, and the σci-perc-per ratio was 48.7%. When the temperature increased from 200 °C to 300 °C, the pore cracks mainly experienced an increase in crack opening width, with fewer new pore cracks appearing (Figure 5c). At this point, because the decrease in cohesion caused by the loss of bound water had essentially concluded at 200 °C, the expansion of mineral particles will to some extent limit the expansion of cracks. Hence, under this temperature condition, the change in σci-per was not significant. When the temperature rose to 400 °C, σci-per rapidly decreased to 2.97 MPa and the σci-perc-per ratio was 45%. This is attributed to the breakdown of kerogen at this temperature, which softened the matrix, and a large number of pore crack structures were generated within the oil shale (Figure 6d), resulting in a notable decrease in σci-per. At temperatures of 500 °C and 600 °C, the σci-per values were 22.9 MPa and 24 MPa, respectively. The corresponding ratios of σci-perc-per were 78.1% and 70%. This phenomenon can be attributed to the increased strength of the matrix, which restricted the initiation of cracks, consequently leading to a rapid increase in σci-per.
When the load was applied parallel to the bedding plane of oil shale, σci-par decreased rapidly with increasing temperature in the range of 20–400 °C (Figure 13b). At 20 °C, σci-par was 16.87 Mpa and σci-parc-par was 35.2%. When the temperature rose to 400 °C, σci-par decreased to 1.57 Mpa and σci-parc-par became 53.04%. As illustrated in Figure 6a–d, with the temperature increment, the scale and number of pore cracks in oil shale increased continuously and the strength decreased accordingly, leading to a synchronized decrease in σci-par. After the temperature exceeded 400 °C, σci-par experienced a slight recovery as the temperature rises. At 600 °C, σci-par was 2.6 Mpa and σci-parc-par was 41.28%. This occurred because the bedding plane cracks in oil shale had basically formed at 400 °C, and further heating had minimal impact on crack propagation. However, the matrix strength increased at this stage, leading to a recovery in σci-par.

3.6.2. Damage Stress of Fractures at Different Temperatures

The fracture damage stress threshold, σcd, signifies the initiation of unstable expansion of internal fractures. As the load continues to increase, it leads to a transition from linear to nonlinear stress−strain curves, indicating an imminent failure of the rock [51].
At a temperature of 20 °C, the fracture damage stress threshold σcd-per for loading perpendicular to the shale bedding plane was 42.3 MPa and the σcd-perc-per ratio was 58.5% (Figure 14a). Upon heating to 100 °C, σcd-per increased to 47.4 MPa, with a σcd-perc-per ratio of 78%. The increase is attributed to the thermal expansion of mineral grains at 100 °C under vertical-bedding loading, causing inward closure of pore cracks to a certain extent, which restricted the expansion of cracks, resulting in an increase in σcd-per with rising temperature. As the temperature increased from 100 °C to 400 °C, σcd-per continually decreased. At 400 °C, σcd-per is 4.7 MPa, with a σcd-perc-per ratio at 75.6%. This decrease can be attributed to the increase in the scale and quantity of internal pore cracks within the shale as the temperature rose, along with a decline in cohesive strength, which resulted in a gradual reduction in the fracture damage stress. It is noteworthy that within the temperature range of 100 to 200 °C, despite the closure of internal pore cracks due to heating, mineral expansion induced by the temperature rise weakened the intergranular cohesive strength, leading to a decline in σcd-per. As the temperature rose from 400 °C to 600 °C, σcd-per consistently increased. At 600 °C, σcd-per reached 31.84 MPa, with a σcd-perc-per ratio at 92%. This variation mirrors that of σper and σci-per. After the kerogen-pyrolysis process ended, further heating led to a transformation of clay minerals, resulting in increased strength that restricted crack propagation, thereby causing a continuous rise in σcd-per.
When loading was parallel to the bedding planes, at 20 °C, σcd-par stood at 38.3 Mpa, with a σcd-parc-par ratio of 78.7% (Figure 14b). As the temperature increased from 20 °C to 500 °C, σcd-par continuously decreased. Under 500 °C conditions, σcd-par is 1.86 MPa, with a σcd-par/σc-par ratio at 91.7%. This decline occurred because, when loading is parallel to the bedding planes, oil shale predominantly experiences tensile failure along these planes. With rising temperatures, the tensile strength between bedding planes diminishes. Pyrolysis and thermal cracking contribute to an increase in bedding plane cracks (Figure 6a–e). Once cracks initiate, they swiftly progress into the unstable expansion segment, resulting in a continuous decrease in σcd-par. It is noteworthy that during the heating process from 20 °C to 100 °C, the rate of σcd-par decrease was significantly higher than that in other ranges. Considering Figure 6b and Figure 14b together, it becomes evident that the oil shale did not develop new fractures due to heating in this stage and that the decrease in σci-par was only slight. However, as the adsorbed water dissipated, the cohesion between the bedding planes diminished, resulting in a reduced ability to resist fracture propagation. Consequently, in this stage, the decrease in σcd-par was much more significant than that in other ranges. From 500 °C to 600 °C, there was minimal variation in σcd-par as the temperature increased. This occurred because thermal fracturing induced by the pyrolysis of organic matter becomes the primary factor altering the fracture structure once the temperature surpasses 450 °C. As the temperature rose from 500 °C to 600 °C, the process of pyrolysis had essentially concluded, and further temperature increases had minimal impact on the interlaminar fractures. In parallel lamina loading, the strength of the weak planes within the lamina determines σcd-par. Therefore, during this stage, σcd-par remained nearly unchanged.

4. Conclusions

Considering both temperature and bedding factors, the thermal-mechanical coupling CT-scanning device and the high-temperature rock-mechanics testing system were used to investigate the evolution of pore and fracture structure, macro-mechanical parameters, and fracture characteristics of oil shale under real-time high-temperature conditions ranging from 20 to 600 °C. The conclusions drawn from this research are as follows:
  • Before the temperature reaches 400 °C, the stress state is the key factor determining the expansion behavior of pores and fractures. When the load is applied perpendicular and parallel to the bedding plane of oil shale, the characteristics of the evolution of pores and fractures exhibit significant differences. Within the temperature range of 20~200 °C, the pores and fractures will close inward as the temperature rises when loading is perpendicular to the bedding. However, at 300 °C, the aperture of bedding fractures increases. In contrast, when loading is parallel to the bedding, the fractures tend to propagate along the bedding. As the oil shale reaches the pyrolysis-temperature threshold (>400 °C), the number, size, and connectivity of fractures significantly increase under the combined effects of thermal cracking and organic matter pyrolysis for both loading conditions.
  • When uniaxial compression is applied perpendicular to the bedding plane of oil shale, the proportion of the compaction stage initially decreases with rising temperature and then increases, reaching a minimum value at 200 °C. Up to 400 °C, the duration of the yield stage continuously increases due to the combined effects of increased porosity and fractures along with decreasing cohesion. However, beyond 400 °C, the transformation of clay minerals and sintering effects lead to a reduction in the duration of the yield stage. On the other hand, when uniaxial compression is applied parallel to the bedding plane, the strength between the layers becomes the key factor determining the shape of the stress−strain curve of the oil shale. With increasing temperature, the compaction stage gradually disappears, while the duration of the yield stage progressively increases.
  • At ambient temperature, when loading is perpendicular to the bedding, the uniaxial compressive strength, elastic modulus, and Poisson’s ratio of oil shale are 72 MPa, 3.28 GPa, and 0.326, respectively, whereas those values when loading is parallel to bedding planes are 48.5 MPa, 4.5 GPa, and 0.278, respectively. As the temperature escalates, the compressive strength, elastic modulus, and Poisson’s ratio of oil shale exhibit a trend of initial decline followed by an increase. Specifically, the compressive strength and elastic modulus attain their minimum values at 400 °C, while the minimum Poisson’s ratios when loading is perpendicular to bedding and parallel to bedding are achieved at 500 °C and 200 °C, respectively. Before 300 °C, the loss of moisture, decrease in cohesion, and distribution characteristics of pores and fractures collectively contribute to the decline in the mechanical strength of oil shale. Within the temperature range of 300 °C to 400 °C, the pyrolysis of organic matter becomes the primary factor causing alterations in mechanical properties. Once the temperature surpasses 400 °C, mineral composition and pore and fracture distribution, along with clay-sintering effects, jointly influence the mechanical behavior of oil shale.
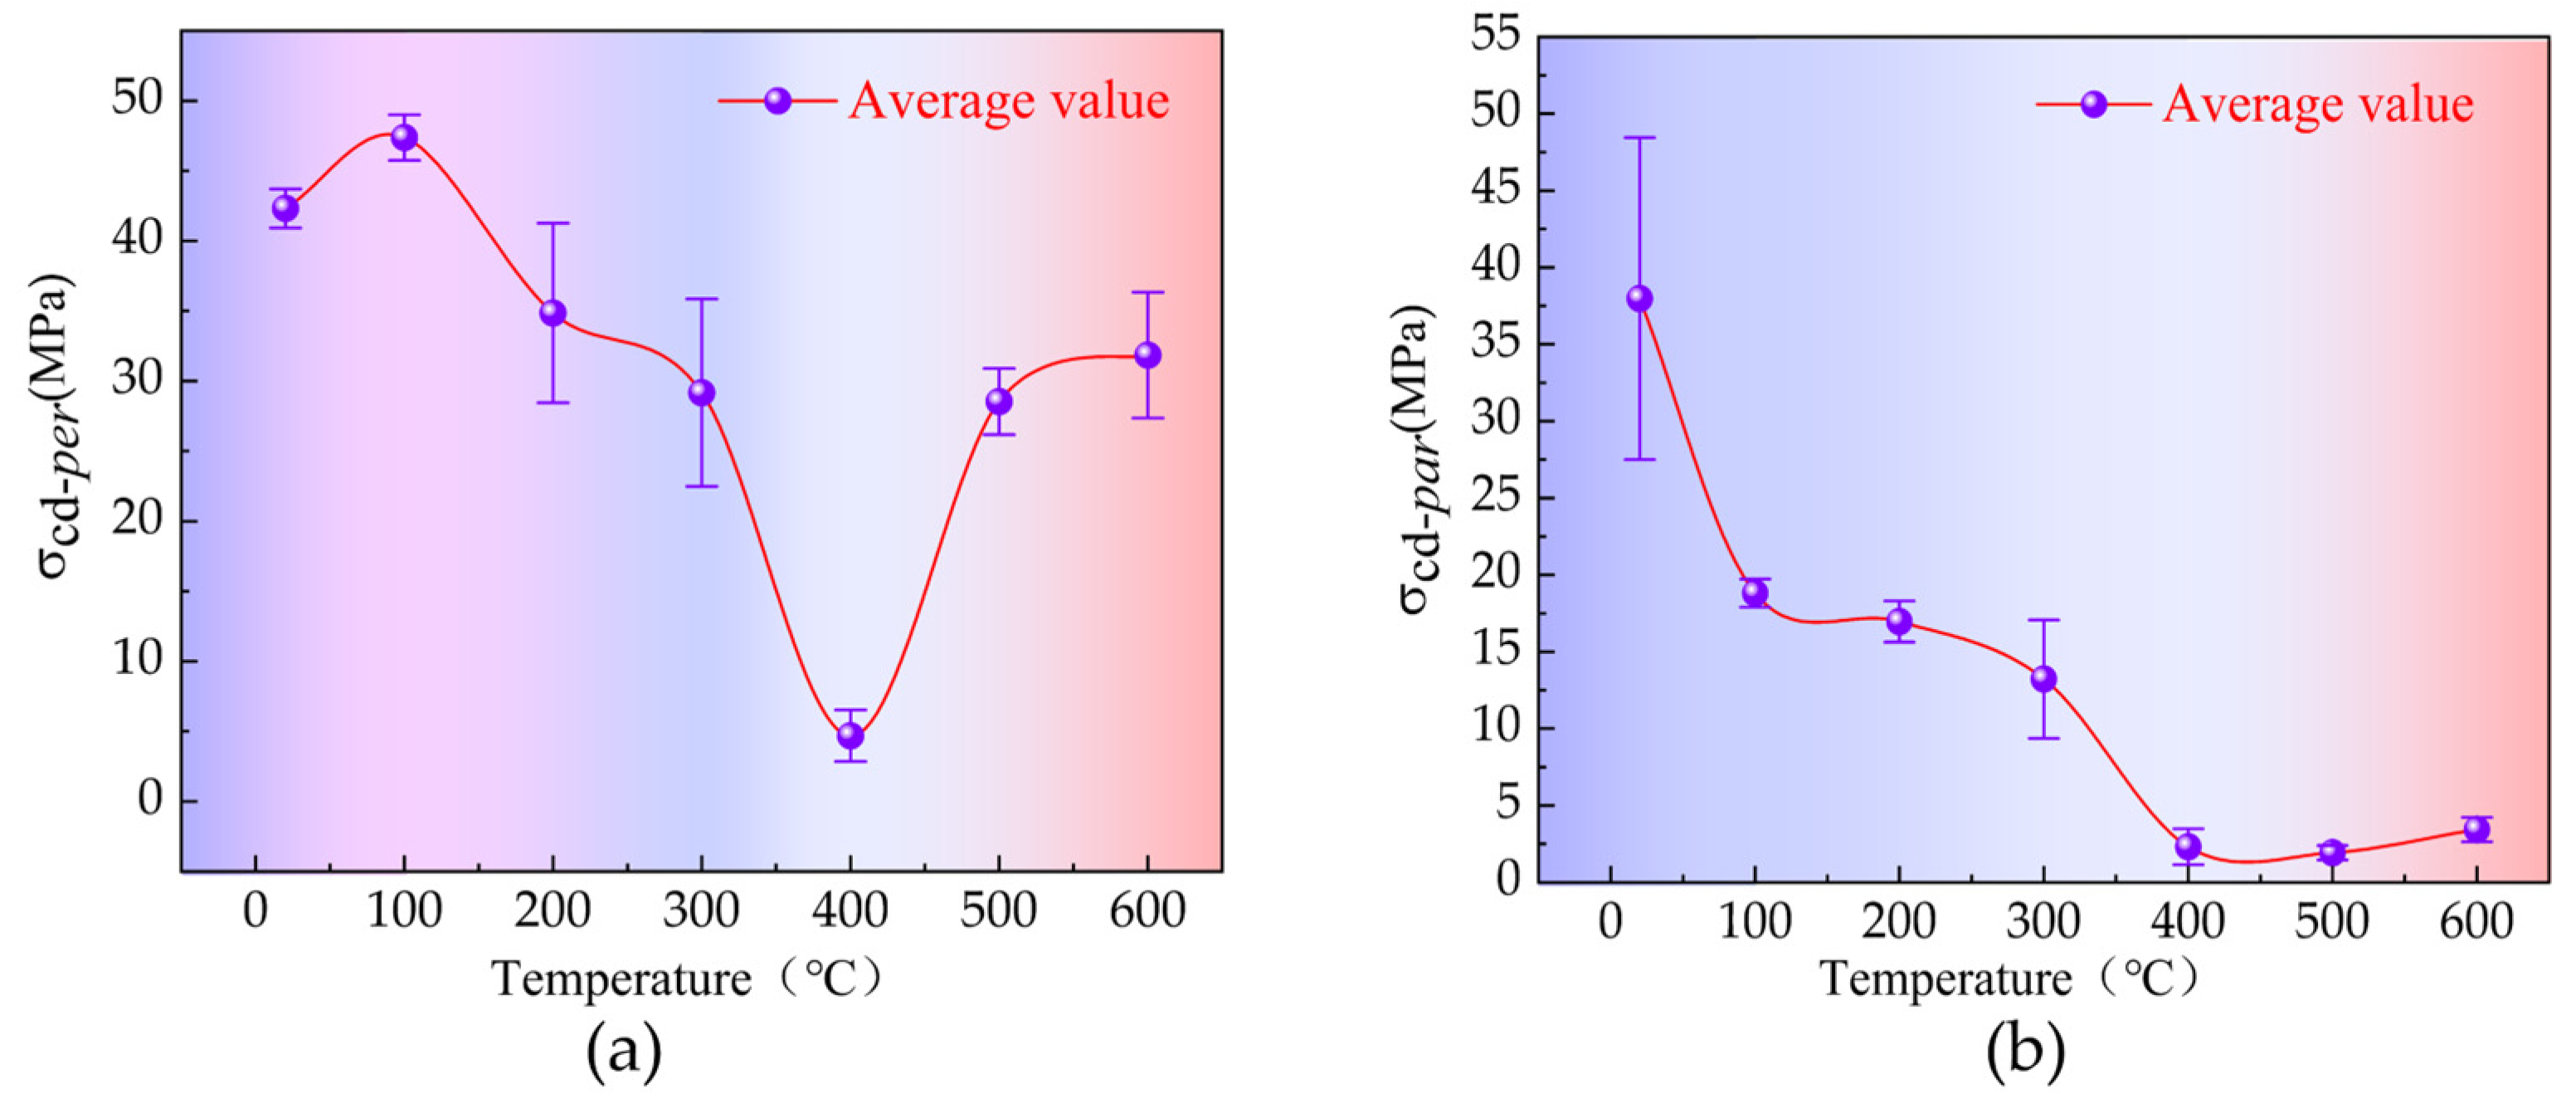
  • When loading is perpendicular to the bedding planes, the initial stress σci-per exhibits a “step-like” decrease followed by an increase with rising temperature, with 400 °C marking the turning point. The damage stress σcd-per, on the other hand, initially increases, then decreases, and finally increases again, with 100 °C and 400 °C as the turning points. When loading is parallel to the bedding planes, both the initial stress σci-par and the damage stress σcd-par follow a pattern of initial decrease followed by an increase, reaching a minimum at 400 °C.

Author Contributions

Conceptualization, Methodology, Validation, Writing—review & editing, Funding acquisition, S.Y.; Data curation, Q.Z.; Software, D.Y.; Investigation, L.W. All authors have read and agreed to the published version of the manuscript.

Funding

This work was supported by Taiyuan University of science and technology Scientific Research Initial Funding (Grant No. 20222028 and 20222036), Fundamental Research Program of Shanxi Province (Grant No. 202203021212311) and Scientific and Technological lnnovation Programs of Higher Education lnstitutions in Shanxi (Grant No. 2022L307).

Institutional Review Board Statement

Not applicable.

Informed Consent Statement

Not applicable.

Data Availability Statement

The original contributions presented in the study are included in the article, further inquiries can be directed to the corresponding author.

Conflicts of Interest

The authors declare no conflicts of interest.

References

  1. Han, X.; Kulaots, I.; Jiang, X.; Suuberg, E.M. Review of Oil Shale Semicoke and Its Combustion Utilization. Fuel 2014, 126, 143–161. [Google Scholar] [CrossRef]
  2. Zhao, X.; Zhang, X.; Liu, Z.; Lu, Z.; Liu, Q. Organic Matter in Yilan Oil Shale: Characterization and Pyrolysis with or without Inorganic Minerals. Energy Fuels 2017, 31, 3784–3792. [Google Scholar] [CrossRef]
  3. Kang, Z.; Zhao, Y.; Yang, D. Review of Oil Shale In-Situ Conversion Technology. Appl. Energy 2020, 269, 115121. [Google Scholar] [CrossRef]
  4. Jiang, X.M.; Han, X.X.; Cui, Z.G. New Technology for the Comprehensive Utilization of Chinese Oil Shale Resources. Energy 2007, 32, 772–777. [Google Scholar] [CrossRef]
  5. Wang, J.; Feng, L.; Steve, M.; Tang, X.; Gail, T.E.; Mikael, H. China’s Unconventional Oil: A Review of Its Resources and Outlook for Long-Term Production. Energy 2015, 82, 31–42. [Google Scholar] [CrossRef]
  6. Clerici, A.; Alimonti, G. World Energy Resources. EPJ Web Conf. 2015, 98, 01001. [Google Scholar] [CrossRef]
  7. Zhu, Y.; Liu, K.; Zhong, X.; Wang, Y.; Gao, S. Experimental Investigation on the Anisotropic Behaviors Induced by Bedding Planes in Mechanical Properties of Ma′quan Oil Shale. Arab. J. Sci. Eng. 2021, 47, 11385–11403. [Google Scholar] [CrossRef]
  8. Raukas, A.; Punning, J.M. Environmental Problems in the Estonian Oil Shale Industry. Energy Environ. Sci. 2009, 2, 723–728. [Google Scholar] [CrossRef]
  9. Crawford, P.M.; Killen, J.C. New Challenges and Directions in Oil Shale Development Technologies. In Oil Shale: A Solution to the Liquid Fuel Dilemma; ACS Symposium Series; American Chemical Society: Washington, DC, USA, 2010; Volume 1032, pp. 21–60. ISBN 9780841225398. [Google Scholar]
  10. Kim, H.; Cho, J.W.; Song, I.; Min, K.B. Anisotropy of Elastic Moduli, P-Wave Velocities, and Thermal Conductivities of Asan Gneiss, Boryeong Shale, and Yeoncheon Schist in Korea. Eng. Geol. 2012, 147–148, 68–77. [Google Scholar] [CrossRef]
  11. Islam, M.A.; Skalle, P. An Experimental Investigation of Shale Mechanical Properties through Drained and Undrained Test Mechanisms. Rock Mech. Rock Eng. 2013, 46, 1391–1413. [Google Scholar] [CrossRef]
  12. Closmann, P.J.; Bradley, W.B. Effect of temperature on tensile and compressive strengths and young’s modulus of oil shale. Soc. Pet. Eng. AIME J. 1979, 19, 301–312. [Google Scholar] [CrossRef]
  13. Mokhtari, M.; Alqahtani, A.A.; Tutuncu, A.N. Impacts of Stress, Natural and Induced Fractures on Mechanical Properties of Organic-Rich Shales. In Proceedings of the Unconventional Resources Technology Conference 2013, Denver, Colorado, 12–14 August 2013. [Google Scholar]
  14. Zheng, D.; Miska, S.; Ozbayoglu, E.; Zhang, J. Combined Experimental and Well Log Study of Anisotropic Strength of Shale. In Proceedings—SPE Annual Technical Conference and Exhibition; SPE: San Antonio, TX, USA, 2023. [Google Scholar]
  15. Zheng, D.; Ozbayoglu, E.; Miska, S.Z.; Liu, Y.; Li, Y. Cement Sheath Fatigue Failure Prediction by ANN-Based Model. In Proceedings of the Annual Offshore Technology Conference, Houston, TX, USA, 3–5 May 2022. [Google Scholar]
  16. Guha Roy, D.; Singh, T.N.; Kodikara, J. Influence of Joint Anisotropy on the Fracturing Behavior of a Sedimentary Rock. Eng. Geol. 2017, 228, 224–237. [Google Scholar] [CrossRef]
  17. Jin, Z.; Li, W.; Jin, C.; Hambleton, J.; Cusatis, G. Anisotropic Elastic, Strength, and Fracture Properties of Marcellus Shale. Int. J. Rock Mech. Min. Sci. 2018, 109, 124–137. [Google Scholar] [CrossRef]
  18. Li, C.; Xie, H.; Wang, J. Anisotropic Characteristics of Crack Initiation and Crack Damage Thresholds for Shale. Int. J. Rock Mech. Min. Sci. 2020, 126, 104178. [Google Scholar] [CrossRef]
  19. Zheng, D.; Miska, S.; Ziaja, M.; Zhang, J. Study of Anisotropic Strength Properties of Shale. AGH Drill. Oil Gas 2019, 36, 93. [Google Scholar] [CrossRef]
  20. Zheng, D.; Ozbayoglu, E.; Miska, S.; Zhang, J. Experimental Study of Anisotropic Strength Properties Of Shale. In Proceedings of the 57th US Rock Mechanics/Geomechanics Symposium, Atlanta, GA, USA, 25–28 June 2023. [Google Scholar]
  21. Wang, P.; Ren, F.; Miao, S.; Cai, M.; Yang, T. Evaluation of the Anisotropy and Directionality of a Jointed Rock Mass under Numerical Direct Shear Tests. Eng. Geol. 2017, 225, 29–41. [Google Scholar] [CrossRef]
  22. Rafieepour, S.; Zheng, D.; Miska, S.; Ozbayoglu, E.; Takach, N.; Yu, M.; Zhang, J. Combined Experimental and Well Log Evaluation of Anisotropic Mechanical Properties of Shales: An Application to Wellbore Stability in Bakken Formation. In Proceedings of the SPE Annual Technical Conference and Exhibition, Virtual, 11–14 October 2020. [Google Scholar]
  23. Zheng, D.; Miska, Z.; Ozbayoglu, E.; Zhang, Y. The Influence of Elliptical-Geometry Wellbore on Zonal Isolation. In Proceedings of the 56th U.S. Rock Mechanics/Geomechanics Symposium, Santa Fe, NM, USA, 26–29 June 2022. [Google Scholar]
  24. Eymery, J.P.; Ylli, F. Study of a Mechanochemical Transformation in Iron Pyrite. J Alloys Compd. 2000, 298, 306–309. [Google Scholar] [CrossRef]
  25. Vishal, V.; Rizwan, M.; Mahanta, B.; Pradhan, S.P.; Singh, T.N. Temperature Effect on the Mechanical Behavior of Shale: Implication for Shale Gas Production. Geosyst. Geoenviron. 2022, 1, 100078. [Google Scholar] [CrossRef]
  26. Ranjith, P.G.; Viete, D.R.; Chen, B.J.; Perera, M.S.A. Transformation Plasticity and the Effect of Temperature on the Mechanical Behaviour of Hawkesbury Sandstone at Atmospheric Pressure. Eng. Geol. 2012, 151, 120–127. [Google Scholar] [CrossRef]
  27. Guo, Y.; Li, X.; Huang, L. Changes in Thermophysical and Thermomechanical Properties of Thermally Treated Anisotropic Shale after Water Cooling. Fuel 2022, 327, 125241. [Google Scholar] [CrossRef]
  28. Guo, W.; Guo, Y.; Cai, Z.; Yang, H.; Wang, L.; Yang, C.; Zhao, G.; Bi, Z. Mechanical Behavior and Constitutive Model of Shale under Real-Time High Temperature and High Stress Conditions. J. Pet. Explor. Prod. Technol. 2023, 13, 827–841. [Google Scholar] [CrossRef]
  29. Fan, X.; Luo, N.; Liang, H.; Sun, X.; Zhai, C.; Xie, L. Dynamic Breakage Characteristics of Shale with Different Bedding Angles under the Different Ambient Temperatures. Rock Mech. Rock Eng. 2021, 54, 3245–3261. [Google Scholar] [CrossRef]
  30. Burnham, A.K. Kinetic Models of Vitrinite, Kerogen, and Bitumen Reflectance. Org. Geochem. 2019, 131, 50–59. [Google Scholar] [CrossRef]
  31. Rabbani, A.; Baychev, T.G.; Ayatollahi, S.; Jivkov, A.P. Evolution of Pore-Scale Morphology of Oil Shale During Pyrolysis: A Quantitative Analysis. Transp. Porous Media 2017, 119, 143–162. [Google Scholar] [CrossRef]
  32. Liu, Z.; Yang, D.; Hu, Y.; Zhang, J.; Shao, J.; Song, S.; Kang, Z. Influence of in Situ Pyrolysis on the Evolution of Pore Structure of Oil Shale. Energies 2018, 11, 755. [Google Scholar] [CrossRef]
  33. Wang, L.; Yang, D.; Zhao, Y.; Wang, G. Evolution of Pore Characteristics in Oil Shale during Pyrolysis under Convection and Conduction Heating Modes. Oil Shale 2020, 37, 224–241. [Google Scholar] [CrossRef]
  34. Hatheway, A.W. The Complete ISRM Suggested Methods for Rock Characterization, Testing and Monitoring; 1974–2006. Environ. Eng. Geosci. 2009, 15, 47–48. [Google Scholar] [CrossRef]
  35. Gorshkov, A.M.; Khomyakov, I.S. Thermal Treatment of Reservoir as One of the Powerful Method of Shale Formation Development in Russia. IOP Conf. Ser. Earth Environ. Sci. 2019, 272, 032004. [Google Scholar] [CrossRef]
  36. Kang, Z.; Zhao, J.; Yang, D.; Zhao, Y.; Hu, Y. Study of the Evolution of Micron-Scale Pore Structure in Oil Shale at Different Temperatures. Oil Shale 2017, 34, 42–54. [Google Scholar] [CrossRef]
  37. Bai, F.; Sun, Y.; Liu, Y.; Guo, M. Evaluation of the Porous Structure of Huadian Oil Shale during Pyrolysis Using Multiple Approaches. Fuel 2017, 187, 1–8. [Google Scholar] [CrossRef]
  38. Yilmaz, G. The Effects of Temperature on the Characteristics of Kaolinite and Bentonite. Sci. Res. Essays 2011, 6, 1928–1939. [Google Scholar] [CrossRef]
  39. Yang, L.; Yang, D.; Zhao, J.; Liu, Z.; Kang, Z. Changes of oil shale pore structure and permeability at different temperatures. Oil Shale 2016, 33, 101. [Google Scholar] [CrossRef]
  40. Geng, Y.; Liang, W.; Liu, J.; Cao, M.; Kang, Z. Evolution of Pore and Fracture Structure of Oil Shale under High Temperature and High Pressure. Energy Fuels 2017, 31, 10404–10413. [Google Scholar] [CrossRef]
  41. Yang, S.; Yang, D.; Kang, Z. Experimental Investigation of the Anisotropic Evolution of Tensile Strength of Oil Shale Under Real-Time High-Temperature Conditions. Nat. Resour. Res. 2021, 30, 2513–2528. [Google Scholar] [CrossRef]
  42. Zheng, D.; Miska, S.Z.; Ozbayoglu, E. The Influence of Formation Creeping on Wellbore Integrity. In Proceedings of the Society of Petroleum Engineers—SPE 2021 Symposium Compilation, Virtual, 26 November 2021. [Google Scholar]
  43. Funatsu, T.; Kuruppu, M.; Matsui, K. Effects of Temperature and Confining Pressure on Mixed-Mode (I-II) and Mode II Fracture Toughness of Kimachi Sandstone. Int. J. Rock Mech. Min. Sci. 2014, 67, 1–8. [Google Scholar] [CrossRef]
  44. Heuze, F.E. High-Temperature Mechanical, Physical and Thermal Properties of Granitic Rocks—A Review. Int. J. Rock Mech. Min. Sci. 1983, 20, 3–10. [Google Scholar] [CrossRef]
  45. Zhang, W.; Sun, Q.; Hao, S.; Geng, J.; Lv, C. Experimental Study on the Variation of Physical and Mechanical Properties of Rock after High Temperature Treatment. Appl. Therm. Eng. 2016, 98, 1297–1304. [Google Scholar] [CrossRef]
  46. Yang, G.; Liu, J.; Li, X.; Bi, J. Effect of Temperature on Shale Strength under Dynamic Impact Loading. Arab. J. Geosci. 2020, 13, 1–9. [Google Scholar] [CrossRef]
  47. Zhang, Y.; Sun, Q.; Li, J.; Zhang, W. Pore and Mechanical Properties of Clay after High Temperature Roasting. Chin. J. Rock Mech. Eng. 2015, 34, 1480–1488. (In Chinese) [Google Scholar]
  48. Liu, J.; Xue, Y.; Zhang, Q.; Yao, K.; Liang, X.; Wang, S. Micro-Cracking Behavior of Shale Matrix during Thermal Recovery: Insights from Phase-Field Modeling. Eng. Fract. Mech. 2020, 239, 107301. [Google Scholar] [CrossRef]
  49. Wang, X.; Xie, H.; Zhang, R.; Zhang, G.; Xu, Z.; Deng, J.; Wang, D.; Li, C.; Feng, G.; Zhang, Z.; et al. Progressive Failure Characterization of Sandstone from Yingjinshan Area in Qinghai-Tibet Plateau. Rock Mech. Rock Eng. 2022, 55, 6723–6740. [Google Scholar] [CrossRef]
  50. Brace, W.F.; Paulding, B.W.; Scholz, C. Dilatancy in the Fracture of Crystalline Rocks. J. Geophys. Res. 1966, 71, 3939–3953. [Google Scholar] [CrossRef]
  51. Luo, J.; Wang, L. High-Temperature Mechanical Properties of Mudstone in the Process of Underground Coal Gasification. Rock Mech. Rock Eng. 2011, 44, 749–754. [Google Scholar] [CrossRef]
Figure 1. Schematic diagram of the convective heating process for in situ pyrolysis of oil shale.
Energies 17 04004 g001
Figure 2. Oil-shale samples.
Energies 17 04004 g002
Figure 3. CT-scanning system and thermo-mechanical-coupling loading device.
Energies 17 04004 g003
Figure 4. Test system for the mechanical properties of rock at high-temperature.
Energies 17 04004 g004
Figure 5. Rendering the distribution characteristics of internal pores and fractures in oil shale under loading along perpendicular bedding planes; (af) show the distribution characteristics if the pores and fractures of oil shale at different temperatures.
Energies 17 04004 g005
Figure 6. Rendering the distribution characteristics of internal pores and fractures in oil shale under loading along parallel bedding planes; (af) show the distribution characteristics of the pores and fractures of oil shale at different temperatures.
Energies 17 04004 g006
Figure 7. Stress−strain curves of perpendicular oil-shale bedding under different temperature conditions.
Energies 17 04004 g007
Figure 8. Stress−strain curves of parallel oil-shale bedding under different temperature conditions.
Energies 17 04004 g008
Figure 9. Variation in oil-shale compressive strength under different temperature conditions: (a) loading perpendicular to the bedding planes; (b) loading parallel to the bedding planes.
Energies 17 04004 g009
Figure 10. Variation in oil-shale elastic modulus with temperature: (a) loading perpendicular to the stratification, Eper; (b) loading parallel to the stratification, Epar.
Energies 17 04004 g010
Figure 11. Variation in Poisson’s ratio of oil shale with temperature under high-temperature real-time conditions: (a) loading perpendicular to the stratification; (b) loading parallel to the stratification.
Energies 17 04004 g011
Figure 12. Schematic division of the crack-propagation stages during progressive failure.
Energies 17 04004 g012
Figure 13. Variation in crack-initiation stress σci with temperature: (a) loading perpendicular to stratification (b) loading parallel to stratification.
Energies 17 04004 g013
Figure 14. Variation in crack-damage stress (σcd) with temperature. (a) loading perpendicular to the bedding plane; (b) loading parallel to the bedding plane.
Energies 17 04004 g014
Table 1. Mineralogical composition of the oil shale.
Non-Clay Minerals and Content (%)Clay Minerals and Content (%)
QuartzPlagioclasePotash feldsparPyriteMixed-layer illiteIlliteKaoliniteChlorite
40.48.415.92.217.879.26813.244.634
Disclaimer/Publisher’s Note: The statements, opinions and data contained in all publications are solely those of the individual author(s) and contributor(s) and not of MDPI and/or the editor(s). MDPI and/or the editor(s) disclaim responsibility for any injury to people or property resulting from any ideas, methods, instructions or products referred to in the content.

