Article

Condition Monitoring Using Digital Fault-Detection Approach for Pitch System in Wind Turbines

1
Applied Automation and Industrial Diagnostics Laboratory, Faculty of Science and Technology, University of Djelfa, Djelfa 17000, Algeria
2
Institute of High-Power Converter Systems (HLU), Technical University of Munich (TUM), 80333 Munich, Germany
3
Center for Energy Transition, Universidad San Sebastián, Santiago 8420524, Chile
4
Electrical Engineering Department, Faculty of Engineering, Assiut University, Assiut 71516, Egypt
*
Authors to whom correspondence should be addressed.
Energies 2024, 17(16), 4016; https://doi.org/10.3390/en17164016
Submission received: 13 May 2024 / Revised: 24 July 2024 / Accepted: 27 July 2024 / Published: 13 August 2024
(This article belongs to the Special Issue Wind Turbine and Wind Farm Flows)

Abstract

:
The monitoring of wind turbine (WT) systems allows operators to maximize their performance, consequently minimizing untimely shutdowns and related hazard situations while maximizing their efficiency. Indeed, the rational monitoring of WT ensures the identification of the main sources of risks at a proper time, such as internal or external failures, hence leading to an increase in their prevention by limiting the faults’ occurrence regarding the different components of wind turbines, achieving production objectives. In this context, the present paper develops a practical monitoring approach using a numerical fault-detection process for the pitch system based on a benchmark wind turbine (WT) model with the main aim of improving safety and security performance. Therefore, the proposed fault-diagnosis procedure deals with eventual faults occurring in the actuators and sensors of the pitch system. In this proposed approach, a simple, logical process is used to generate the correct residuals as fault information based on the redundancy in the actuators and sensors of the pitch sub-systems. The obtained results demonstrate the effectiveness of this proposed process for ensuring the tasks of the fault diagnosis and condition monitoring of the WT systems, and it can be a promising approach for avoiding major damage in such systems, leading to their operational stability and improved reliability and availability.

1. Introduction

Condition monitoring and the optimization of wind turbine (WT) system parameters require the design of a powerful fault-detection system that ensures the enhancement of their performance, availability, and reliability. Indeed, the overall objective of the monitoring of WT systems is to ensure their continuous and stable power generation. Therefore, the main goal of the supervisor is to develop and implement an efficient fault-diagnostic scheme for the real-time monitoring of WT functionality. It is obvious that when failures occur, the operators of the controlled system must quickly plan a short downtime in order to effectively manage the required maintenance related to the detected and predicted WT damage problems.
In order to avoid degradations and to improve WT performances, several research results have been provided recently for improvements in terms of condition monitoring, defect diagnosis, intelligent control, prognosis, and practical control techniques. Zhiwei Gao and Xiaoxu Liu in [1] investigated techniques for monitoring the condition of wind power systems using the recent methods of diagnosis, prognosis, and resilient fault control. This enabled the development of an efficient diagnostic system for wind turbine failures, with the detection of anomalies as early as possible and the prediction of potential faults so that the operator can react in time and correctly. Peter Odgaard et al. in [2] proposed a benchmark reference model for a specific type of wind turbine which they developed and discussed. They also presented the main realistic failures that can occur in the wind turbine, taking three types of failure scenarios into account, including the main parts of the WT such as the transmission system and the generator systems with the converter. On the other hand, Odgaard et al. in [3,4] implemented a fault-tolerant control (FTC) approach of a WT system with different configuration and control concepts and used a benchmark model to test at the same time the fault-tolerant techniques and the detection capability for the different scenarios of failures.
Moreover, Kusiak and Verma in [5] proposed a data-based diagnostic method to monitor the pitch system faults of a WT, and Fernandez-Canti et al. in [6] presented a diagnosis system based on a fault detection and isolation (FDI) process applied it to a WT benchmark using the combined technique of group membership and a Bayesian approach for the different failure cases of the studied wind turbine. Yichuan Fu et al. in [7] investigated an analysis technique using fast Fourier transform (FFT) and uncorrelated multi-linear principal components to accomplish the fault detection and classification of the sensors and actuators of WTs. Colombo et al. in [8] controlled the pitch angle of a WT that operates under critical wind speeds with a sliding-mode control approach for the rotor monitoring of the WT to limit the energy output of the studied turbine at a nominal power value. Hector Sanchez et al. in [9] proposed a fault-diagnosis process using the interval–redundancy relationships of observers with the structural analysis of the signature fault matrix in the isolation step within the studied WT benchmark. Blesa et al. in [10] proposed an FDI and fault-tolerant control (FTC) model-based diagnostic approach for a virtual WT using interval observers for the fault detection of the actuators and sensors under limited configuration, taking into account measurement noise and modeling errors. Davide Astolfi et al. in [11] developed a mechanism for detecting damage to the slip rings of a wind turbine using a method of analyzing the output temperature data of the studied wind turbine system.
Similarly, the fuzzy concept was applied to the FTC of WTs by Silvio Simani et al. in [12]. They developed an approach to the fault detection of a WT using the benchmark model with the fuzzy identification of the operating models of this wind turbine. These fuzzy models were identified to define the dynamic behavior of the WT with an evaluation of diagnostic residues to improve its behavior. Furthermore, Silvio Siman et al. in [13] identified a fuzzy model of a WT with the generation of fault residues based on a benchmark model, which offered simple solutions in the real-time implementation of this diagnostic approach, along with a practical methodology of the detection and isolation of the studied wind turbine faults. Xiaoxu Liu et al. in [14] estimated the faults of a WT with compensation using the fuzzy-type modeling of Takagi–Sugeno; this fuzzy model allowed for improvement in the structure of the fault detection of the studied wind machine. Zafer Civelek in [15] proposed a fuzzy control system for adjusting the pitch angle of a WT using Takagi–Sugeno-type modeling with the use of genetic algorithms to optimize the proposed controller parameters. This enables the regulation system and its configuration to be improved with the implementation of an algorithm of optimization, which makes the generated power of the wind turbine under consideration even better. In [16], Adrian Stetco et al. introduced an efficient review of the different machine learning methods applied to wind turbine condition monitoring, particularly the methods for detecting blade faults. Furthermore, in [17], Adrian Stetco et al. introduced a collection of end-to-end convolutional neural networks for the advanced condition monitoring of wind turbine generators with the aim of having the benefit of utilizing raw, unstructured signals to make predictions about the parameters of interest, where the authors further described an end-to-end, real-time set of models for system diagnostics, which is an integral part of operation and maintenance.
Moreover, other works were carried out in recent years focusing on the development of techniques for diagnosing faults in wind turbines. For instance, in [18], Ben Djoudi et al. applied an FTC approach to a WT through developing prototypes of the identified fuzzy models. Kai Zhang et al. in [19] proposed fault diagnosis approaches with fault source localization for WTs based on a network of heterogeneous nodes and with an adaptive meta-ResNet-based approach. In [20], Jianqun Zhang et al. introduced an approach called FSK-MBCNN for diagnosing compound faults in WT gearboxes which is based on the combination of the fast spectral kurtosis (FSK) approach with a multi-branch convolutional neural network (MBCNN), whereas in [21], Na Jiang et al. carried out detection and localization tests on frequent wind turbine faults using unbalanced and unstable data obtained for the studied wind turbine. Takwa Sellami et al. in [22] conducted a performance analysis of a wind system connected to the electrical network under the presence of inter-turn short-circuit conditions. This analysis makes it possible to make a structure of wind system faults and ensures an improvement in the quality of delivered energy. Satyabrata Sahoo et al. in [23] performed a comparative study on the generated power and control performances of a WT using several intelligent and classical strategies, including PI controllers, fuzzy concepts, and model predictive controls. Hanchao Zeng and Daolian Chen in [24] proposed a voltage-fed single-stage system with a multi-input inverter applied to hybrid WT/PV for power production. Additionally, Weipeng Gao et al. in [25] analyzed the different areas of operation and designed WPT systems employing MEPT control; these studies allow the improvement of the monitoring systems of the wind and photovoltaic energy production systems with increased efficiency.
Recently, Abdelmoumen Saci et al. presented an effective fault diagnosis method which ensures the detection of faults in sensors and actuators applied to wind turbines [26]. Zakaria Zemali et al. proposed an innovative and efficient solution based on the development of an intelligent system of high-performance diagnostic tools, which consists of detecting and locating accurately the various failures affecting the wind turbine to ensure its safe and stable operation [27]. In [28], the authors carried out a detailed study based on the experimental and numerical investigation of the pitch imbalance effect on wind turbines. This study focused mainly on the characterization of power losses and power generated on a small-scale model presenting a prototype, where an analytical framework for validation was proposed by the authors in order to assess the performance of unbalanced rotors in the case of a wind turbine system that can be applied for the full-scale models of such systems. Yanting Li et al. proposed a fault diagnosis method based on parameter-based transfer learning and convolutional autoencoder (CAE) for wind turbines with small-scale data, whereas the main aim of the authors was to apply their proposal for a full-scale WT and to exploit the full available collected information [29]. In [30], Yichao Liu et al. developed a mixed model- and signal-based fault diagnosis (FD) architecture to detect and isolate critical faults in floating offshore wind turbines (FOWTs). Indeed, the authors developed a model-based scheme for detecting and isolating the faults associated with the turbine system. Their study was based mainly on fault detection, approximation estimator, and fault isolation estimators under time-varying taking into account adaptive thresholds that can help in ensuring against false alarms. Yu Pang et al. proposed a new automatic fault diagnosis method for wind turbines where the fault diagnosis system framework is constructed based on the collected vibration data of wind turbines, which is then processed for fault diagnosis [31]. Yun Kong et al. introduced an enhanced sparse representation-based intelligent recognition (ESRIR) method for fault detection in the planet bearing of wind turbines, which involves two stages of structured dictionary designs and intelligent fault recognition [32]. Zhenya Wang et al. developed a novel data-driven fault diagnosis scheme for wind turbines using refined time-shift multiscale fluctuation-based dispersion entropy (RTSMFDE) and cosine pairwise-constrained supervised manifold mapping (CPCSMM). The proposed approach can be used mainly for the classification of faults in WT systems [33]. Francisco et al. proposed a Bayesian framework based on particle filters to ensure specific online fatigue damage diagnosis and prognosis for wind turbine blades (WTBs) [34]. W. Guang and Z. Huang investigated their proposed fault-tolerant control (FTC) system by applying it to a wind turbine benchmark based on the multiple failures that are provoked in the studied system [35]. In [36], the authors developed a fault diagnosis (FD) and fault-tolerant control (FTC) of pitch actuators in wind turbines, where both methods were validated based on several tests, whereas Alexandre Ferreira Diniz et al. in [37] performed a dynamic modeling approach for the development of a water supply system based on WT taking into account the power efficiency improvement. Ahmer Arif et al. in [38] conducted an economic study on the integration of renewable energies in a micro-grid based on WT taking into account the user energy demand management using genetic algorithms. Zemali et al. in [39] applied two estimators such as the Kalman and Luenberger estimators for fault diagnosis in the pitch system actuators. In this study, a comparison study between the two employed observers was investigated. Laouti et al. in [40] used the support vector machine method for fault detection in a WT based on the benchmark model which was initially proposed by Odgaard et al. The main aim was to ensure the production of optimal electrical power under an efficient fault-tolerant control strategy.
Several problems and shortcomings in most of the studied cases in the literature of wind turbine systems were highlighted and investigated [41,42,43,44,45,46,47,48,49,50,51,52,53,54,55], such as the identification of the time required to identify the origin of faults with an analysis of the possible causes and the sensitivity to multiple faults and measurement noise, in addition to the problems of putting new monitoring technologies into practice. However, these new approaches entail high and sometimes costly interventions to provide robust decisions in the presence of possible faults, their location, and their severity [56,57,58]. In addition, the economic losses associated with the complexity of the wind system and their degradation factors, besides the constraints related to reliability, performance, security, and availability, sparked a growing interest in designing robust diagnostic structures suitable for the studied WT [59,60,61].
This paper proposes the application of an efficient fault diagnosis approach for the pitch sub-system of a WT based on a benchmark model which was proposed by Odgaard et al. [2,3,4]. Indeed, the main goal is to ensure the effective monitoring of the WT by using a practical, easy-to-implement, and low-cost method. The proposed approach is based on a logical process strategy for fault detection using the values of the residuals as specific indicators related to the occurred wind turbine faults. Two sets of residuals were defined such as internal residuals and external residuals. The first is obtained from the measurements in the same pitch system, whereas the second is obtained from the difference between two sensor outputs in two different pitch systems of the WT. The advantages of this developed diagnosis process are summarized as follows:
  • The reliability and availability of the studied wind turbine will be improved, thereby an increased useful lifetime can be ensured. This advantage was confirmed through the various simulation validation tests and the assessment of the obtained detection indices on actuators and fault sensors.
  • The risks from the internal and external operation tasks are minimized. This is due to the capabilities of the proposed fault diagnosis approach to characterize, evaluate, and analyze faults to prevent and reduce the risk of faults in time. Indeed, the obtained results confirm clearly the effectiveness of the proposed process based on the evaluation of the detection time, sensitivity, and detection thresholds.
  • The implementation simplicity of the proposed approach in real-time due to its simple structure.
The present paper is organized as follows: In Section 2, the pitch system model of the studied WT machine is presented. In Section 3, the development of the digital algorithm for fault detection based on the pitch angle system is presented in detail. Indeed, in this section, each step of the proposed fault detection approach is introduced and explained sufficiently. The obtained simulation results and investigations on the obtained results are presented and discussed in Section 4, whereas, Section 5 is dedicated to the conclusion.

2. Pitch System Model

The operation principal of a wind generator is based on the transformation of wind kinetic energy to electrical energy. However, the WT is mainly composed of three main sub-systems: the pitch sub-system, drive train, and generator with converter [2,40].
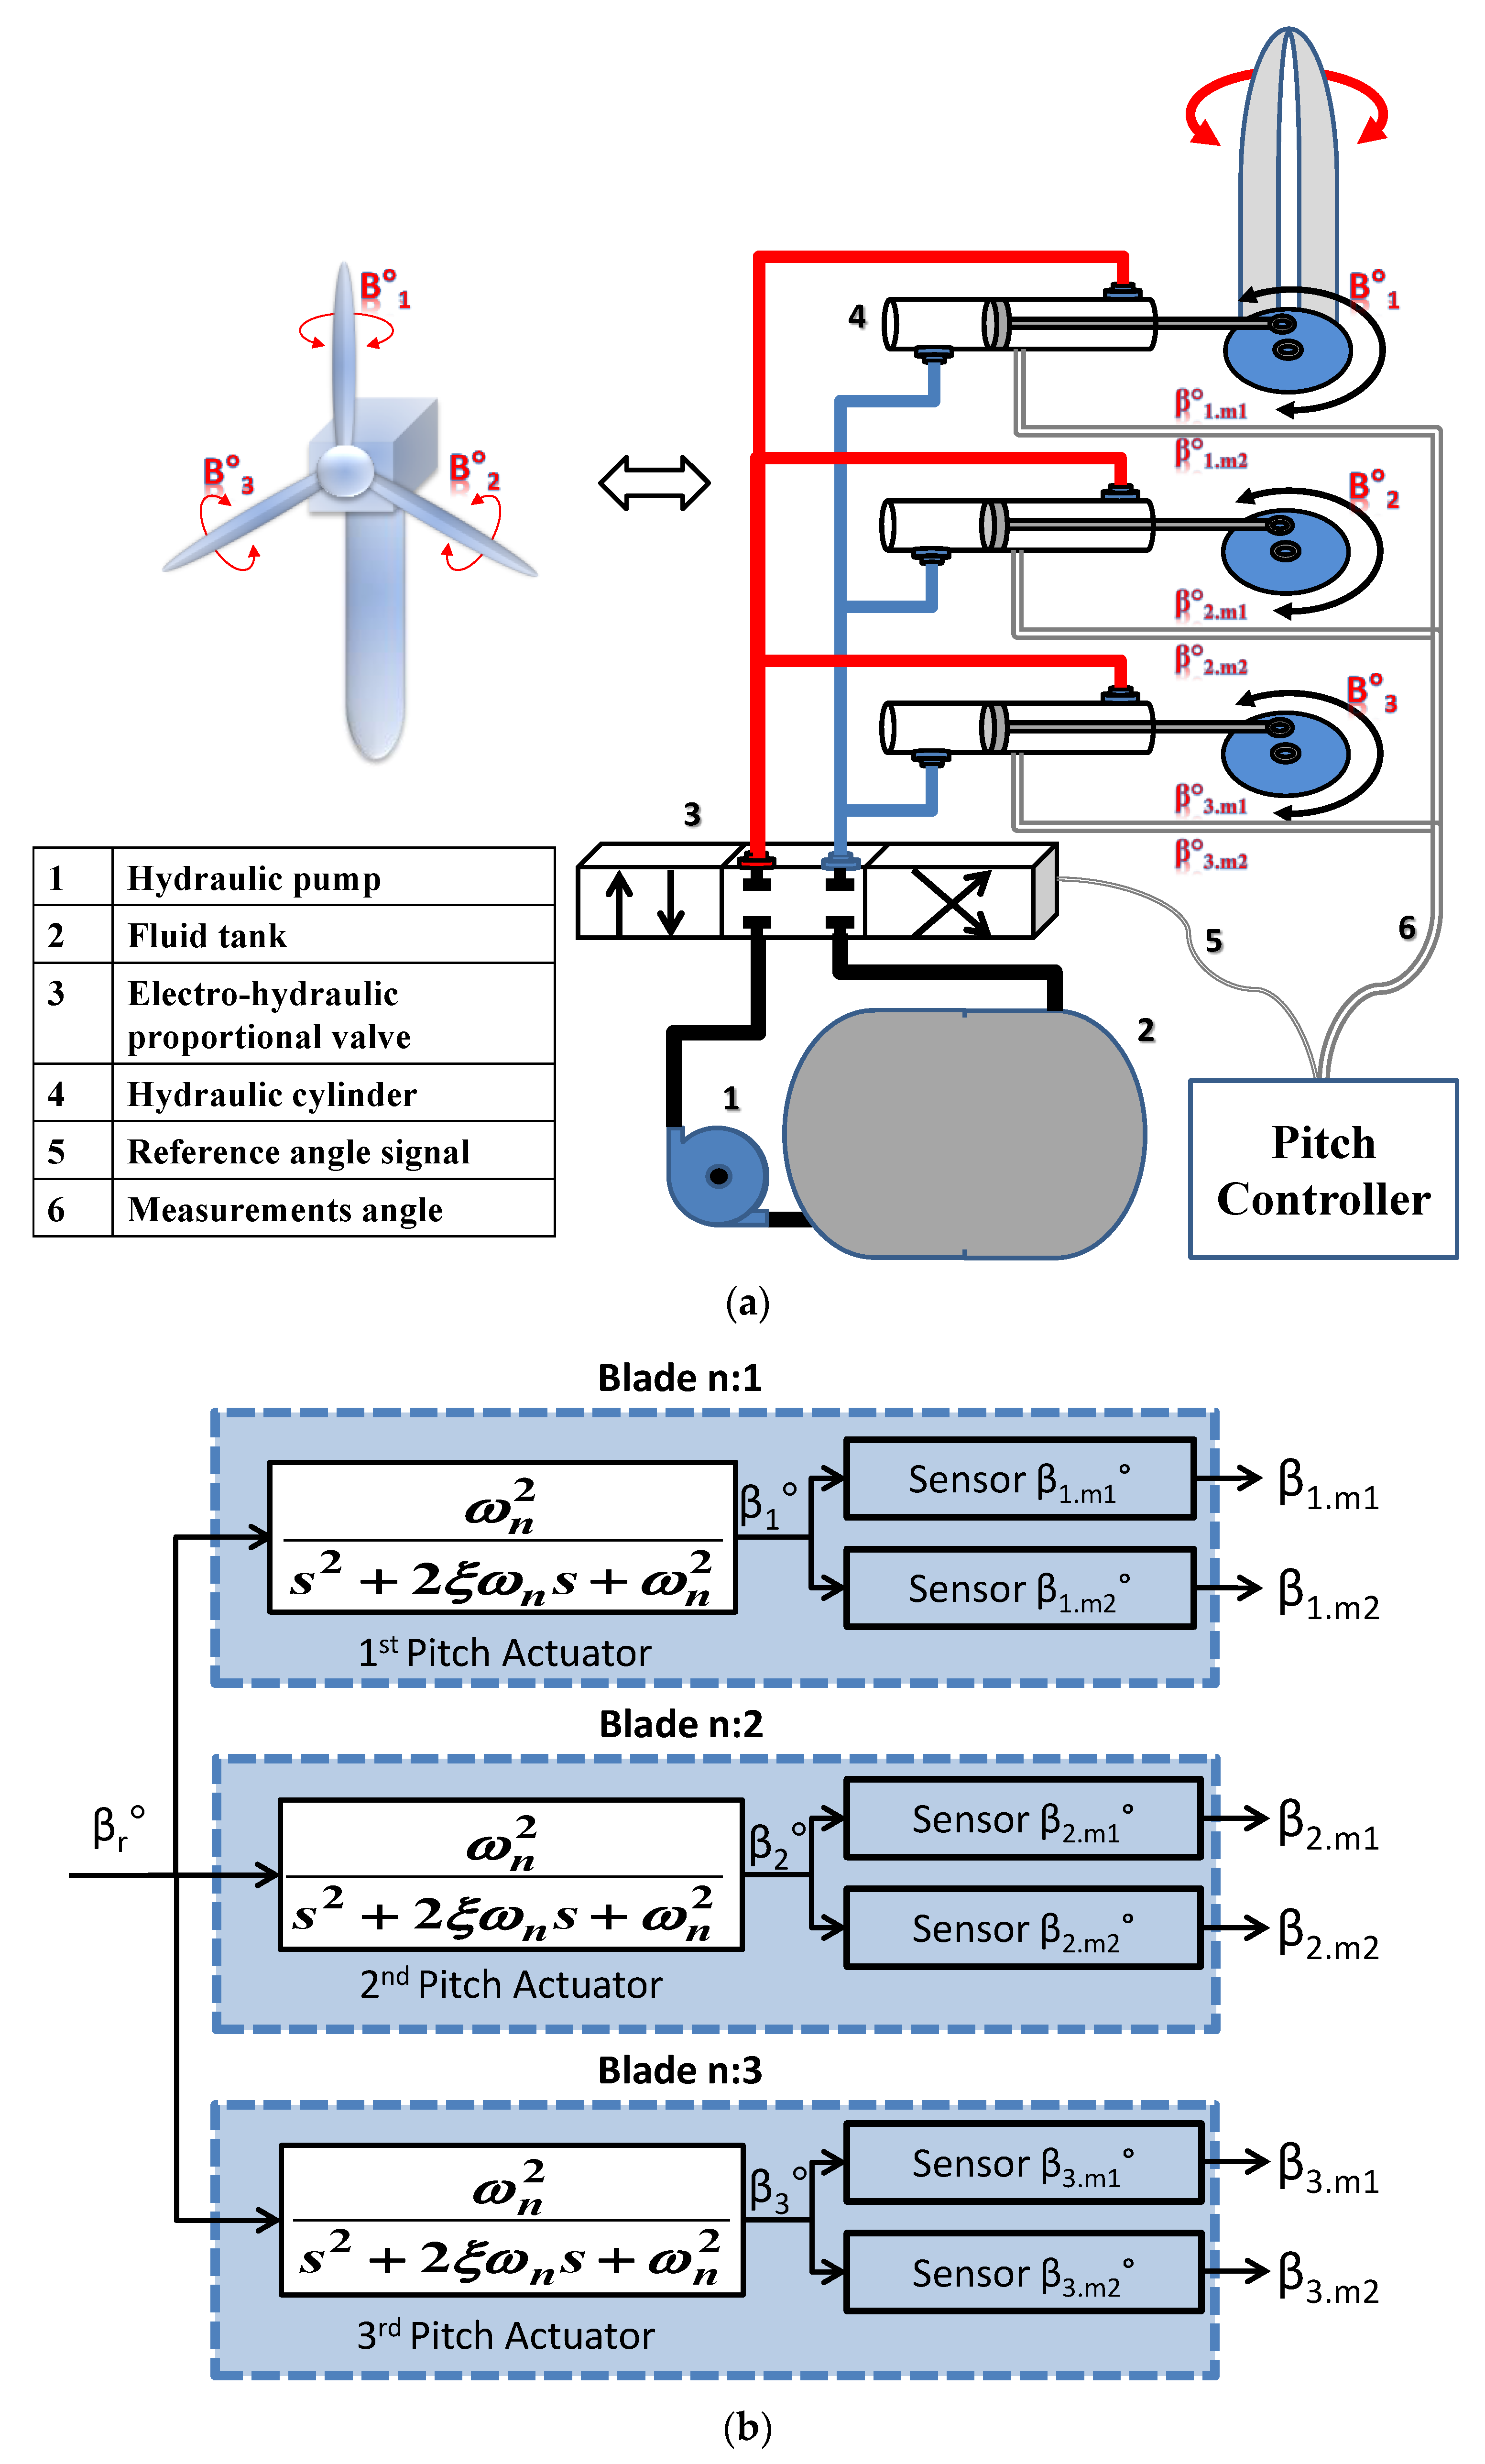
Indeed, this work is devoted to the study of the pitch system part of the WT generator as shown in Figure 1 due to the fact that the monitoring of the pitch system allows for improving the impact of power efficiency and can ensure the protection of the overall wind system face from mechanical constraints. It is worthy to clarify that the two other parts of the WT such as the drive chain and the generator–converter systems are not taken into account in this study.
For this purpose, the study presented in this paper is based on a benchmark model of a wind turbine system, encompassing sensors, actuators, and system faults. This benchmark model represents a real three-blade horizontal variable-speed wind turbine with a rated power of 4.8 MW which was proposed by the works published by Odgaard et al. in [2,3,4] where the drive train and the generator–converter parts are omitted in this study. This benchmark is considered as a reference model to develop fault-tolerant control techniques for WTs. Indeed, the objective of this paper is to propose and develop an approach to diagnose failures in the pitch system part of a wind power system based on this benchmark model. The main aim is to ensure the effective monitoring of such systems using an efficient approach which can be easily implemented with low costs, hence leading to maintaining the continuous operation mode of this kind of systems.
For more details of the used benchmark model, a synoptic representation of the hydraulic pitch angle system for the three-blade horizontal variable speed wind turbine is shown in Figure 2a where the main parts of the pitch systems are indicated and illustrated.
Using the model established by Odgaard in [2,3,4], which is composed of three identical hydraulic piston servos (actuators), each of these pistons can be modeled with a second-order function as a closed control loop using the measured angle ( β m ) and the reference angle ( β r ) [3]. Hence, in this closed-loop control system, a wind turbine uses the measurement β m at the system output to adjust and adapt the pitch actuator parameters of the internal controller. The model of the studied sub-system according to the benchmark model proposed by Odgaard [2,3,4] is defined as follows [3,4,18,41,42]:
β m s β r s = ω n 2 s 2 + 2 ξ ω n + ω n 2
where β m is the measured pitch angle,   β r is the reference pitch angle, s is the Laplace operator, ω n is the natural frequency, and ξ is the damping factor.
The studied pitch angle measurement system is composed of two identical sensors for each actuator. These sensors were modeled taking into account the pitch angle dynamics in the actuators in order to ensure redundancy as shown in Figure 2b, which presents the functional diagram of the three pitch angle sub-systems presented in Equation (1), with ξ = 0.6 and ω n = 11.11   rad/s .
Figure 2b contains a structure which is proposed to ensure the measurement redundancy of the variables of all the pitch angles.
To evaluate the influence of the variations in the natural frequency of the WT ω n and the damping factor ξ , as well as under the eventual appearance of faults on the sensors installed on the studied three pitch angle sub-systems, three situations are considered in this work based on the used benchmark model.
These two main parameters depend on the pitch hydraulic control system or the actuator. Indeed, an increase in the hydraulic head in hydraulic piston systems or an increase in the air content in the hydraulic fluids (oil) can have a significant impact on the damping factor and the frequency that are the main characteristics in the second-order hydraulic piston systems as presented in Equation (1) [3,4]. The mentioned dynamics in the hydraulic piston system which control the pitch angle can be complex and depend on various factors such as the specific system design, fluid properties, and operating conditions [2,3]. It is worthy to clarify the following:
-
When the hydraulic head increases, the bulk modulus (resistance to compression) of the fluid also increases. This can lead to higher internal damping within the system.
-
At a higher hydraulic head, the pump might work harder, potentially leading to an increased heat generation in the fluid, whereas it is obvious that thinner fluids with lower viscosity tend to damp less than thicker, higher-viscosity fluids.
-
The hydraulic head provokes pressure fluctuations that can affect the pressure pulsations within the system, where pulsations can arise from pump imperfections or rapid load changes. The pressure difference caused by the hydraulic head itself can be added to these pulsations, potentially making them worse.
-
At a decreased damping factor, the piston will vibrate more and take longer to settle after hydraulic pressure change.
-
At an increased frequency, the piston moves more rapidly, causing pressure fluctuations and increased pulsation frequency due to air compression and expansion. This can lead to erratic movement and reduced control accuracy.
Thus, with the increase in the air content, these two parameters of the third pitch angle sub-system will be changed from ξ = 0.6 and ω n = 11.11   r a d / s to ξ 3 = 0.9 and ω n 3 = 3.42   r a d / s , whereas the hydraulic head loss modifies the control system parameters of the transfer function of the second pitch angle sub-system from ξ = 0.6 and ω n = 11.11   r a d / s to ξ 3 = 0.45 and ω n 3 = 5.73   r a d / s .
In reality, the wind speed is variable, random, and uncontrollable, which implies that the incidence of the blades changes over time. Thus, with the increase in the air content, the parameters in the third pitch angle sub-system change from ξ = 0.6 and ω n = 11.11   r a d / s to ξ 3 = 0.9 and ω n 3 = 3.42   r a d / s , whereas the hydraulic head loss changes the parameters of the control system transfer function of the second pitch angle sub-system ξ = 0.6 and ω n = 11.11   r a d / s to ξ 3 = 0.45 and ω n 3 = 5.73   r a d / s .
The sensor faults are divided into two types according to their effect on the measurement values. The first type is the additive faults that cause increases or decreases in the measurements within fairly fixed values. These faults often occur due to mechanical defects in the sensor mechanisms. The second type of fault is the multiplicative faults that are caused by electrical faults in the electronic components (amplifier signals) of the sensor under fault. This type of fault multiplies the measured values by fairly constant coefficients (gain factors). Therefore, the occurrence of sensor faults is modeled according to two types: gain factor faults or fixed value faults according to mechanical or electrical defects, which can only occur in just one sensor of each pitch angle sub-system.
The given WT benchmark proposed by Odgaard in [2,4] is based on two sensors for each pitch angle sub-system, which presents a total of six sensors for the overall pitch angle sub-systems, where in the ideal case (the absence of faults), the measurements observed on the system are almost the same. But if a fault appears in the sensor or in the actuator, the observed measurements on the pitch angle system will be different from one sub-system to another.
In the following section, the models of the three pitch angle sub-systems will be used for the development of the proposed digital strategy in order to diagnose the occurred faults in this part. The objective is to monitor the controlled system to decrease the undesirable effects on the operation mode of the studied WT.

3. Development of a Digital Algorithm for the Detection of the Pitch Angle System Faults

The implementation of a robust wind turbine fault detection and monitoring system ensures the wind turbine a smooth and stable operation and preserves the integrity of its various components. Hence, the development of a fault detection methodology that is easy to implement in practice enables the prediction of operating faults in this system. This facilitates sustainable maintenance solutions, improves the adaptation of control and regulation laws for wind turbine sub-systems in real-time, and helps avoid system shutdowns and restarts. It is obvious that the WT rotor control is mainly based on the adjustment and supervision of the pitch angle, which is equipped with measuring instruments and safety devices to detect malfunctions and limit the risks that may occur at the rotor of the wind turbine [7,43,44]. However, wind turbines represent complex dynamics which are difficult to monitor due to several factors, such as weather changes, variations in wind speed, and the malfunctions of the various components due to fatigue and wear. Indeed, wind turbines may have other kinds of degradation factors based on several previous research works, such as Wen Xin Yu et al. in [45], Jianglin Lan et al. [46], Pierre Tchakoua et al. [47], Shiqi Gao et al. [48], Wei Qiao et al. in [49], Yang S. et al. in [50], and Yichuan Fu et al. in [51].
To guarantee the correct operation and availability of WTs, various intelligent and modern structures were developed and investigated. These include real-time condition monitoring [52], machine learning and computational intelligence [53], and advanced diagnosis [27]. These research discussed different approaches that examined the major faults in the three sub-systems of wind turbines such as the pitch system, the drive train, and the generator–converter. These studies highlighted the increased complexity and challenges associated with the real-time implementations of the monitoring, diagnosis, and control of wind turbines.
The objective of the work presented in this paper is the development of an effective fault diagnosis approach for the pitch angle sub-system using a digital detection algorithm. Indeed, by introducing this method in different fault scenarios affecting the pitch angle sub-systems, we can then proceed to establish a digital plan for the developed diagnostic system. Finally, the developed fault diagnosis approach will be validated based on certain validation criteria on the set of faults that can affect the pitch angle sub-system of the studied WT.

3.1. Faults Affecting the Pitch Angle Sub-System

In this study, several fault occurrence scenarios in the pitch angle sub-system were considered, which need to be accurately detected to prevent the operational interruptions of the wind turbine. These faults include three types of faults in sensors and two types of faults in actuators. These different types of faults are given in Table 1 with their parameters and their classes. To achieve the main goal of the accurate detection of these faults based on the implementation of the developed digital fault detection algorithm, an index of the time of detection (TD) is used in this diagnostic approach. In order to realize an improved fault detection system, based on the time of the detection of fault occurrence in the pitch angle sub-systems investigated in this paper, the limit of the time of detection has to fulfill the requirements presented in Table 1.

3.2. Pitch System Diagnostics Using the Proposed Digital Detection Algorithm

This section presents the developed pitch angle sub-system diagnostic approach which is based on the use of a digital algorithm where the main aim is to ensure fault detection, localization, and identification. In this case study, the proposed approach is limited to the monitoring of the used redundant components implemented physically in the concerned system such as sensors and actuators with the main aim to enhance the system’s reliability, accuracy, and safety. Hence, the diagnostic function consists of monitoring the behavior of the system based on the data measured during current operation, which will be compared continuously with the data related to the normal reference operation or healthy operation. Any eventual deviations from the reference data that exceed a detection threshold imply the declaration of fault occurrence.
However, the fault diagnosis approach proposed in this paper for the wind turbine pitch angle sub-system is based on the development of three main different steps. The first step involves determining the fault appearance and occurrence time. This can be achieved through the generation of residuals, which are generated from the comparison of the output data of the observed system with that of the reference model (ideal model). The second step consists of pre-processing and analyzing the residual data obtained in the previous step, whereas the third step is dedicated to the detection, localization, and identification of the occurred faults. In this step, it is important to be able to locate exactly the component affected by the fault, because subsequently, the resulting decision to be taken has to be accurate based on the used diagnostic approach.
In this context, the present work aims to develop a practical approach by integrating the three steps of the proposed fault diagnosis approach. Indeed, this approach considers all the possible combinations of fault occurrences in the WT pitch angle sub-system by comparing the observed (measured) outputs with the reference (estimated) outputs of the three pitch angle sub-systems. This requires the use of validation criteria to confirm the effectiveness of the diagnostic approach in terms of the sensitivities of residues, detection thresholds, false alarms, and apparent values.
This work is based on a simulation benchmark model of a WT and the redundancy of sensors in the pitch angle sub-system by installing two identical sensors in each sub-system. The fault detection method is based on logical schemes to measure all the variables and to detect possible sensor and actuator faults in the three pitch angle sub-systems. It is worthy to clarify that there are two types of residuals such as external and internal residuals. The internal residuals are calculated based on the difference between the measurements of the two sensors in each pitch angle sub-system, whereas the external residuals are calculated based on the difference between two sensor responses in two different pitch angle sub-systems.
After the generation of these residuals, the next step is to determine the residuals that are influenced by each fault in the pitch angle sub-system. A threshold is required to be predefined to ensure an accurate detection of the faults based on the values of the different residuals. Indeed, the threshold value denoted ( T h r ) should be chosen precisely to ensure accurate fault detection. Furthermore, the time of detection (TD) should fulfill certain requirements to ensure the high and accurate performances of fault detection. To achieve this, some considerations are taken into account such as the following:
  • To avoid incorrect and failure detection, the threshold is greater than the marginal variation in uninfluenced residual values.
  • To detect faults correctly, the threshold should be smaller than the values of all the influenced residues of the occurred defect.
  • To avoid delayed and imprecise detections, the detection time (TD) must be decreased continuously.
A.
Generation of residues and pre-processing of detection
The first step in generating residuals in the studied pitch angle sub-system based on the proposed fault detection approach is to determine whether the concerned system is functioning normally or not taking into account the physical and analytical system redundancies, i.e., using the various measurements observed on the outputs of the pitch angle sub-systems and the estimated outputs of the reference models. This allows for obtaining the instantaneous residuals at each time step of the six installed sensors in the three pitch angle sub-systems of the studied wind turbine. Indeed, the residual value for each case must be less than the detection threshold in the case of the healthy state of the studied system. However, an obtained residual which may have a value greater than this threshold implies the presence of one or more faults. It is important to clarify that based on the proposed components redundancy in the three WT pitch angle sub-systems, 15 residuals are defined in the residual vector such as x = {a, b, c, d, e, f, g, h, i, j, k, l, m, n, and o}, and are represented in Table 2. These residuals are defined using the following equation:
x i = β u , m v β u , m v
where u , u 1.2 . 3   n u m b e r   o f   t h e   p i t c h   a n g l e   s u b s y s t e m                                         v , v 1,2       n u m b e r   o f   t h e   s e n s o r   i n   p i t c h   a n g l e   s u b s y s t e m    
These residuals give the values of the difference between the sensor measurements and their associated reference models.
As aforementioned, the generated residuals may be distinguished under two types: internal or external residuals, where the internal residuals are a = β 1 , m 1 β 2 , m 1 , j = β 2 , m 1 β 2 , m 2 , and o = β 3 , m 1 β 3 , m 2 for the 1st, 2nd, and 3rd actuators, respectively, that present the difference between the sensor’s measurements in the same pitch actuator. The external residuals are {b, c, d, e, f, g, h, I, k, l, m, and n} that present the differences between two sensors in two different pitch actuators in the WT.
The second step of the fault detection of the studied pitch angle sub-system consists of the pre-processing of the obtained data from the residuals. In this step, a state vector denoted X is defined, where X = {A, B, C, D, E, F, G, H, I, J, K, L, M, N, and O} which is corresponding to the previously defined residual vector x = {a, b, c, d, e, f, g, h, i, j, k, l, m, n, and o}. The result is defined by comparing them using Equation (3) with a predefined threshold. The obtained result is a scalar logical value (0 or 1) for the elaboration of an electronic diagram thereafter as follows:
i f   x i T h r     X i = 1 i f   x i < T h r     X i = 0
where x i , and X i are elements from the vectors x , and X , respectively.
The threshold is defined graphically for the pitch angle sub-system to guarantee a precise fault detection within a short time of detection (TD), where it is considered as a backstop, which is between the influenced and the uninfluenced residuals.
B.
Fault detection, localization, and identification steps
The operation availability of the studied WT pitch angle sub-system is based on the accurate implementation of the functions of the detection, localization, and identification of faults within a short time to allow the planning of the necessary preventive actions in time. This task can be achieved by the third step of the proposed diagnostic approach, where it is obvious that any fault occurrence may modify the corresponding residuals within the residual vector x = {a, b, c, d, e, f, g, h, i, j, k, l, m, n, and o}. Therefore, the obtained state vector through Equation (3) X = {A, B, C, D, E, F, G, H, I, J, K, L, M, N, O} may also be modified according to the changing of the residuals. Furthermore, in the case of this study, the diagnostic system will be implemented and tested under various faults that may affect the sensors and the actuators of the three pitch angle sub-systems.
a. 
Sensors’ faults
For fault detection and localization in the sensors, the internal residuals { a = β 1 , m 1 β 2 , m 1 , j = β 2 , m 1 β 2 , m 2 , and o = β 3 , m 1 β 3 , m 2 } are employed to observe the occurred difference in the measured values between the two sensors of each actuator, because they are influenced by this type of fault. It is clear when there is a deviation in difference greater than the defined threshold based on Equation (2), the corresponding g states {A, J, O} are affected based on Equation (3), and which are used as indicators of the sensor faults in the three pitch actuators using the following indications:
I f           A = 1               a   f a u l t     s e n s o r     i n     t h e     f i r s t     p i t c h     a c t u a t o r         I f           J = 1               a   f a u l t     s e n s o r     i n   t h e     s e c o n d     p i t c h     a c t u a t o r         I f           O = 1               a   f a u l t     s e n s o r     i n     t h e     t h i r d     p i t c h     a c t u a t o r        
For the identification of the amplitude of faults and in order to determine exactly the affected sensors, the difference between the measured values of the two installed sensors with the observed values is determined; this is represented by a vector such as X = {A, B, C, D, E, F, G, I, J, K, L, M, N, and O}.
a.1 
Scenario: Fault sensor in the 1st actuator A = 1
To identify the fault in the concerned sensor between the sensors of the first actuator, comparisons with the sensors of the other two actuators (second and third actuators) are carried out at the same time. Firstly, if the state J = 0 of the internal residual j = β 2 , m 1 β 2 , m 2 between the sensors of the second actuator, the faulty sensor in the first actuator can be identified using Equation (5) based on the following external residuals: { b = β 1 , m 1 β 2 , m 1 , c = β 1 , m 1 β 2 , m 2 , f = β 1 , m 2 β 2 , m 1 , and g = β 1 , m 2 β 2 , m 2 }.
Secondly, if the state O = 0 of the internal residual o = β 3 . m 1 β 3 . m 2 between the sensors of the third actuator, the faulty sensor in the first actuator can be identified using Equation (5) based on the following external residuals {   d = β 1 , m 1 β 3 , m 1 , e = β 1 , m 1 β 3 , m 2 , h = β 1 , m 2 β 3 , m 1 , and i = β 1 , m 2 β 3 , m 2 }.
The identification rule of the faulty sensors in the first actuator can be summarized as follows:
A = 1 : i f   J = 0   a n d   B = 1   o r   C = 1 o r i f   O = 0   a n d   D = 1   o r   E = 1     T h e   s e n s o r   β 1 , m 1   i s   f a u l t y i f   J = 0   a n d   F = 1   o r   G = 1 o r i f   O = 0   a n d   H = 1   o r   I = 1     T h e   s e n s o r   β 1 , m 2   i s   f a u l t y
a.2 
Scenario: Fault sensor in the 2nd actuator J = 1
If the state A = 0 of the internal residual a = β 1 , m 1 β 2 , m 1 between the sensors of the first actuator, or if the state O = 0 of the internal residual o = β 3 , m 1 β 3 , m 2 between the sensors of the third actuator, the identification of the faulty sensor in the second actuators can be achieved based using one of the following external residuals: Firstly, based on the external residuals that can be obtained from the comparison with the first actuator sensors such as { b = β 1 , m 1 β 2 , m 1 , c = β 1 , m 1 β 2 , m 2 , f = β 1 , m 2 β 2 , m 1 , and g = β 1 , m 2 β 2 , m 2 }. Hence, the faulty sensors can be identified based on Equation (6). Secondly, based on the external residuals that can be obtained from the comparison with the third actuator sensors such as { k = β 2 , m 1 β 3 , m 1 ,   l = β 2 , m 1 β 3 , m 2 , m = β 2 , m 2 β 3 , m 1 , and n = β 2 , m 2 β 3 , m 2 }. Hence, the faulty sensors can be identified based on Equation (6). The identification rule of the faulty sensors in the second actuator can be summarized as follows:
J = 1 : i f   A = 0   a n d   B = 1   o r   F = 1 o r i f   O = 0   a n d   K = 1   o r   L = 1   T h e   s e n s o r   β 2 , m 1   i s   f a u l t y i f   A = 0   a n d   C = 1   o r   G = 1 o r i f   O = 0   a n d   M = 1   o r   N = 1     T h e   s e n s o r   β 2 , m 2   i s   f a u l t y
a.3 
Scenario: Fault sensor in the 3rd actuator O = 1
If the state A = 0 of the internal residual a = β 1 , m 1 β 2 , m 1 between the sensors of the first actuator, or if the state J = 0 of the internal residual j = β 2 , m 1 β 2 , m 2 between the sensors of the second actuator, the identification of the faulty sensor in the third actuator can be carried out based on the external residuals { d = β 1 , m 1 β 3 , m 1 , e = β 1 , m 1 β 3 , m 2 , h = β 1 , m 2 β 3 , m 1 , and i = β 1 , m 2 β 3 , m 2 } obtained from the comparison with the sensors of the first actuator as indicated in Equation (7), or it can be carried out based on the external residuals {   k = β 2 , m 1 β 3 , m 1 ,   l = β 2 , m 1 β 3 , m 2 , m = β 2 , m 2 β 3 , m 1 , and n = β 2 , m 2 β 3 , m 2 } obtained from the comparison with the sensors of the second actuator as indicated in Equation (7). The identification rule of the faulty sensors in the third actuator can be summarized as follows:
O = 1 : i f   A = 0   a n d   D = 1   o r   H = 1 o r i f   J = 0   a n d   K = 1   o r   M = 1   T h e   s e n s o r   β 3 , m 1   i s   f a u l t y i f   A = 0   a n d   E = 1   o r   I = 1 o r i f   J = 0   a n d   L = 1   o r   N = 1     T h e   s e n s o r   β 3 , m 2   i s   f a u l t y
  • b. Actuators’ Faults
The occurrence of actuator fault leads to the change in the global behavior dynamics of the normal operation mode of the actuator in the pitch angle sub-system, where they cannot track the reference operation mode. Indeed, as the fault occurs in the actuator and not in the sensors, the two sensors installed in the same actuator generate the same measurement, which means that the internal residuals { a = β 1 , m 1 β 2 , m 1 , j = β 2 , m 1 β 2 , m 2 , and o = β 3 , m 1 β 3 , m 2 }are equal to zero. Hence, the sensors are not influenced by this kind of fault and the corresponding states {A, J, and O} remain equal to zero. However, the actuator faults influence directly the external residuals {b, c, d, e, f, g, h, I, k, l, m, and n} leading to the change in their corresponding states {B, C, D, E, F, G, H, I, K, L, M, and N} that can be used for identifying the actuator fault occurrence.
However, the detection and localization step of the actuator faults that probably occurred in the pitch angle sub-system is based on the states corresponding to the internal residuals that are obtained between the two sensors of each actuator { a = β 1 , m 1 β 2 , m 1 , j = β 2 , m 1 β 2 , m 2 , and o = β 3 , m 1 β 3 , m 2 }. At the same time, the states corresponding to the external residuals such as { b = β 1 , m 1 β 2 , m 1 , d = β 1 , m 1 β 3 , m 1 , and k = β 2 , m 1 β 3 , m 1 } that are obtained between the two first sensors of each two pitch angle sub-systems are used for the detection and the localization of the faulted actuator occurrence. As a result, the states {A, J, O, B, D, and K} are considered the indicators of the fault occurrence in the three pitch angle sub-system actuators based on the following rule:
i f   A = 0   a n d B = 1   D = 1     T h e   f i r s t   a c t u a t o r   m a y   b e   f a u l t y     i f   J = 0   a n d B = 1   K = 1       T h e   s e c o n d   a c t u a t o r   m a y   b e   f a u l t y i f   A = 0   a n d D = 1   K = 1     T h e   t h i r d   a c t u a t o r   m a y   b e   f a u l t y      
For the identification of the amplitude of the faults and to investigate these actuator faults clearly, the other observed states X = {C, E, F, G, H, I, L, M, and N,} are used for the comparisons between the two sensors in the expected faulty actuator with the sensors installed in the other healthy actuators and that are considered as references in the following scenarios.
  • b.1 Scenario: Fault in the 1st actuator A = 0, B = 1, and D = 1
The detection of fault occurrence in the first actuator can be achieved based on the internal residuals of the two other actuators b and d (the second and the third actuators) that must have their states B = 1 and D = 1, whereas the detection decision is obtained further based on the states (J and G) or (O and I). Firstly, if the state J = 0 of the internal residual j = β 2 , m 1 β 2 , m 2 which is obtained from the sensors of the second actuator, the identification of the fault on the first actuator can be carried out based on the states B and G of the external residuals { b = β 1 , m 1 β 2 , m 1 , and g = β 1 , m 2 β 2 , m 2 } that have been used in the detection step, and obtained from the corresponding sensors in the first actuator and the corresponding sensors in the second actuator as indicated in Equation (9).
Secondly, if the state O = 0 of the internal residual o = β 3 , m 1 β 3 , m 2 between the installed sensors in the third actuator, the identification of the fault occurrence in the first actuator can be achieved based on the states I and D of the external residuals {   i = β 1 , m 2 β 3 , m 2 and d = β 1 , m 1 β 3 , m 1 } that are used in the detection step, as indicated in Equation (9). The identification rule of the faulty actuator in the first pitch angle sub-system can be summarized as follows:
A = 0 B = 1 D = 1 i f   J = 0   a n d   G = 1 o r i f   O = 0   a n d   I = 1 T h e   f i r s t   a c t u a t o r   i s   f a u l t y
b.2 
Scenario: Fault in the 2nd actuator J = 0, K = 1, and B = 1:
In this case, the detection of fault occurrence in the second actuator can be ensured by the values of specific states such as the internal residual (A or O), and the external residuals (G or N). Indeed, if the state A = 0 of the internal residual a = β 1 , m 1 β 2 , m 1 between the sensors in the 1st actuator, or if the state O = 0 of the internal residual o = β 3 , m 1 β 3 , m 2 between the sensors in the 3rd actuator, the identification of the faulty actuator can be obtained based on the external residuals { b = β 1 , m 1 β 2 , m 1 , and g = β 1 , m 2 β 2 , m 2 } that are used in the detection step, or, it can be based on the external residuals { k = β 2 , m 1 β 3 , m 1 and n = β 2 , m 2 β 3 , m 2 } that are used in the detection phase with the external residual.
The identification rule of the faulty actuator in the second pitch angle sub-system can be summarized as follows:
J = 0 K = 1 B = 1 i f   A = 0   a n d   G = 1 o r i f   O = 0   a n d   N = 1 T h e   s e c o n d   a c t u a t o r   i s   f a u l t y
b.3 
Scenario: Fault in the 3rd actuator O = 0, D = 1, and K = 1:
In this case, the detection of fault occurrence in the third actuator can be carried out by the values of specific states such as the internal residual (A or I), and the external residuals (J or N). If the state A = 0 of the internal residual a = β 1 , m 1 β 2 , m 1 between the sensors in the 1st actuator, or if the state J = 0 of the internal residual j = β 2 , m 1 β 2 , m 2 between the sensors in the 3rd actuator, the identification of the faulty actuator can be based on the states I and D of the external residuals { i = β 1 , m 2 β 3 , m 2 and d = β 1 , m 1 β 3 , m 1 }, respectively, and that are used in the detection phase, or, it can be based on the external residual { k = β 2 , m 1 β 3 , m 1 and n = β 2 , m 2 β 3 , m 2 } that are used in the detection phase with the external residual.
The identification rule of the faulty actuator in the second pitch angle sub-system can be summarized as follows:
O = 0 D = 1 K = 1 i f   A = 0   a n d   I = 1 o r i f   J = 0   a n d   N = 1 T h e   f i r s t   a c t u a t o r   i s   f a u l t y
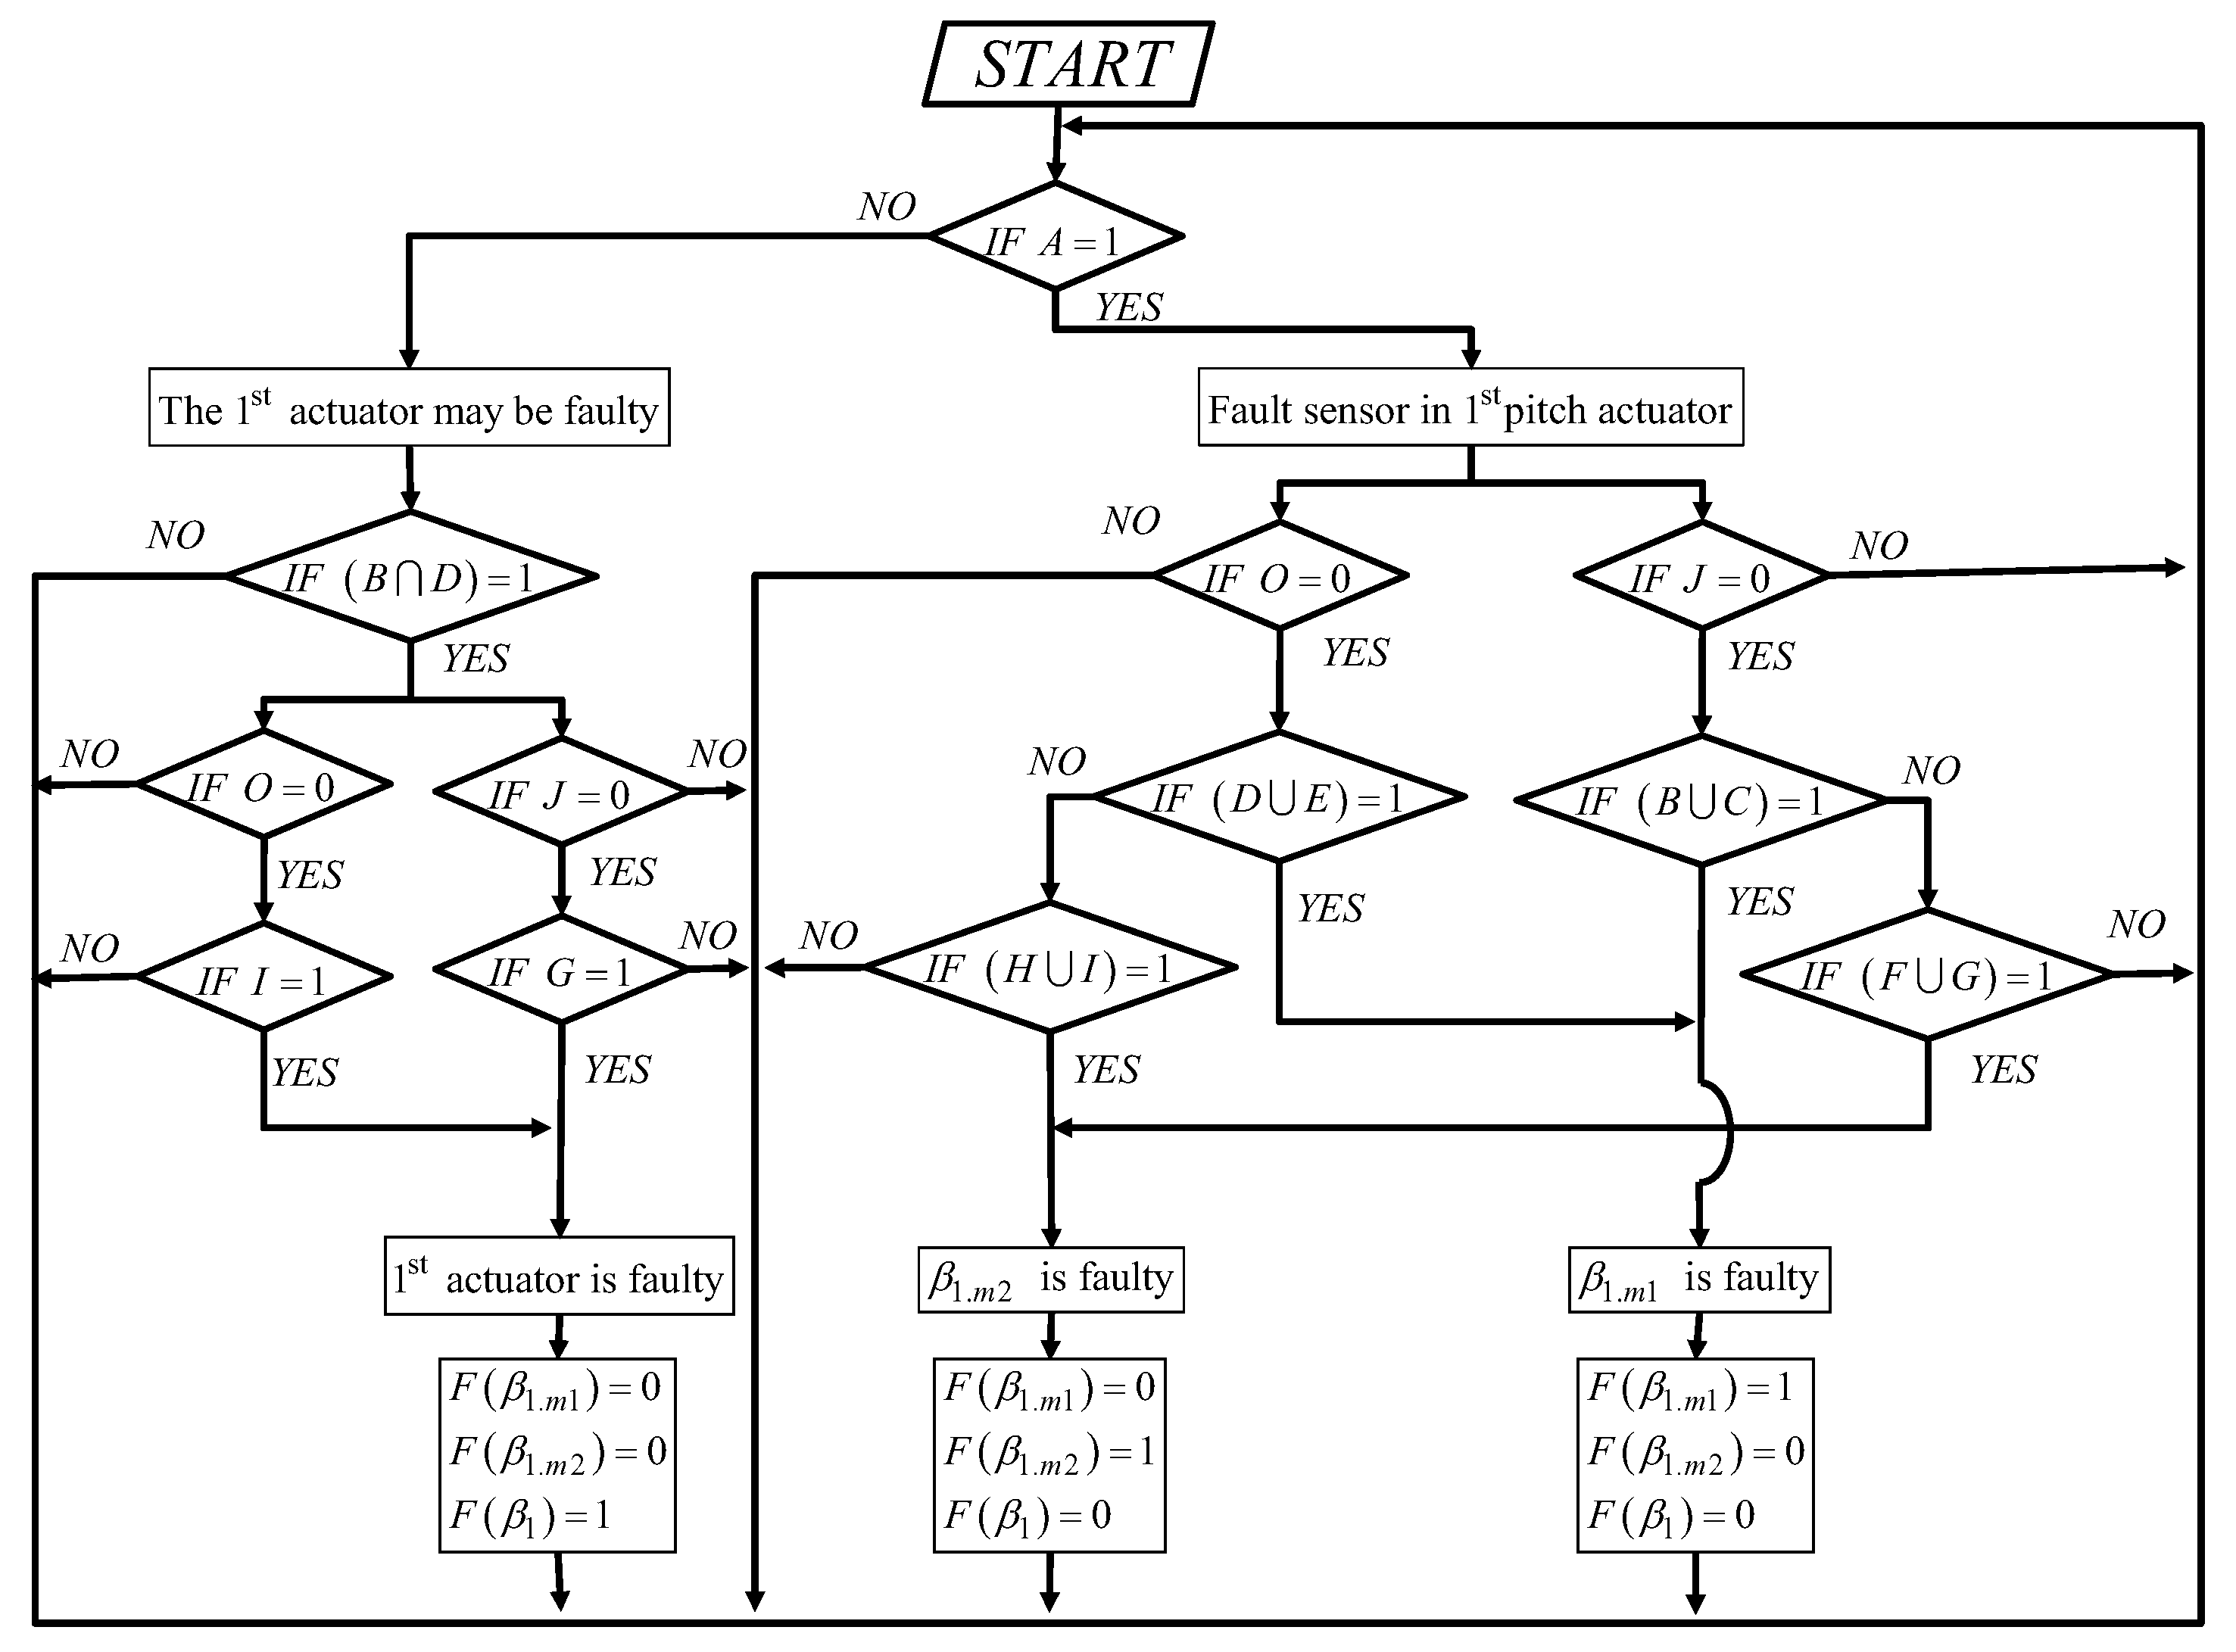
To clearly explain the operation process of these logical statements, Figure 3 presents an organizational structure for the proposed diagnosis method. This flowchart demonstrates how the binary data are analyzed for the fault detection, localization, and identification stages for both the sensors and actuators in the 1st pitch angle sub-system as an illustration example.

3.3. Construction of the Diagnostic System Using the Equivalent Electronic Logic Diagrams

In this section, the modeling of the proposed diagnostic approach using the equivalent electronic logic diagrams including different steps is presented in detail. Indeed, the main logical criteria for the detection of the faults related to each considered component are presented under logical expressions. It is worth to clarify that the aspect of the ease of the implementation of the proposed diagnosis approach is taken in to account to ensure the detection of the faults in the sensors and actuators of the three pitch angle sub-systems of the studied WT. The logic criterion of the first sensor is given by Equation (12):
F β 1 . m 1 = A J ¯ B C O ¯ D E F β 1 . m 2 = A J ¯ F G O ¯ H I
Whereas the logic criterion of the second and third sensors are expressed in Equations (13) and (14):
F β 2 . m 1 = J A ¯ B F O ¯ K L F β 2 . m 2 = J A ¯ C G O ¯ M N
F β 3 . m 1 = O A ¯ D H J ¯ K M F β 3 . m 2 = O A ¯ E I J ¯ L N
It is noted here that all the sensor fault criteria have an identical form to that of the following equation:
F β u , m v = S 1 ( S 2 ¯ ( S 3 S 4 ) ) ( S 5 ¯ ( S 6 S 7 ) )
where: S 1 ,   S 2 , S 3 , S 4 , S 5 , S 6 , and S 7 correspond to the elements of the vector of state X but not in the same numerical order.
The same logic is used for the elaboration of the three actuators’ criteria of faults as follows:
F β 1 = A J G ¯ O I ¯ ¯ B D F β 2 = J A G ¯ O N ¯ ¯ K B F β 3 = O A I ¯ J N ¯ ¯ D K
Similarly, the criteria of actuator faults can have the same form for all the actuators as follows:
F β u , m v = S 1 S 2 S 3 ¯ S 4 S 5 ¯ ¯ S 6 S 7
where: S 1 ,   S 2 , S 3 , S 4 , S 5 , S 6 , and S 7 correspond to the elements of the vector of state X but not in the same numerical order.
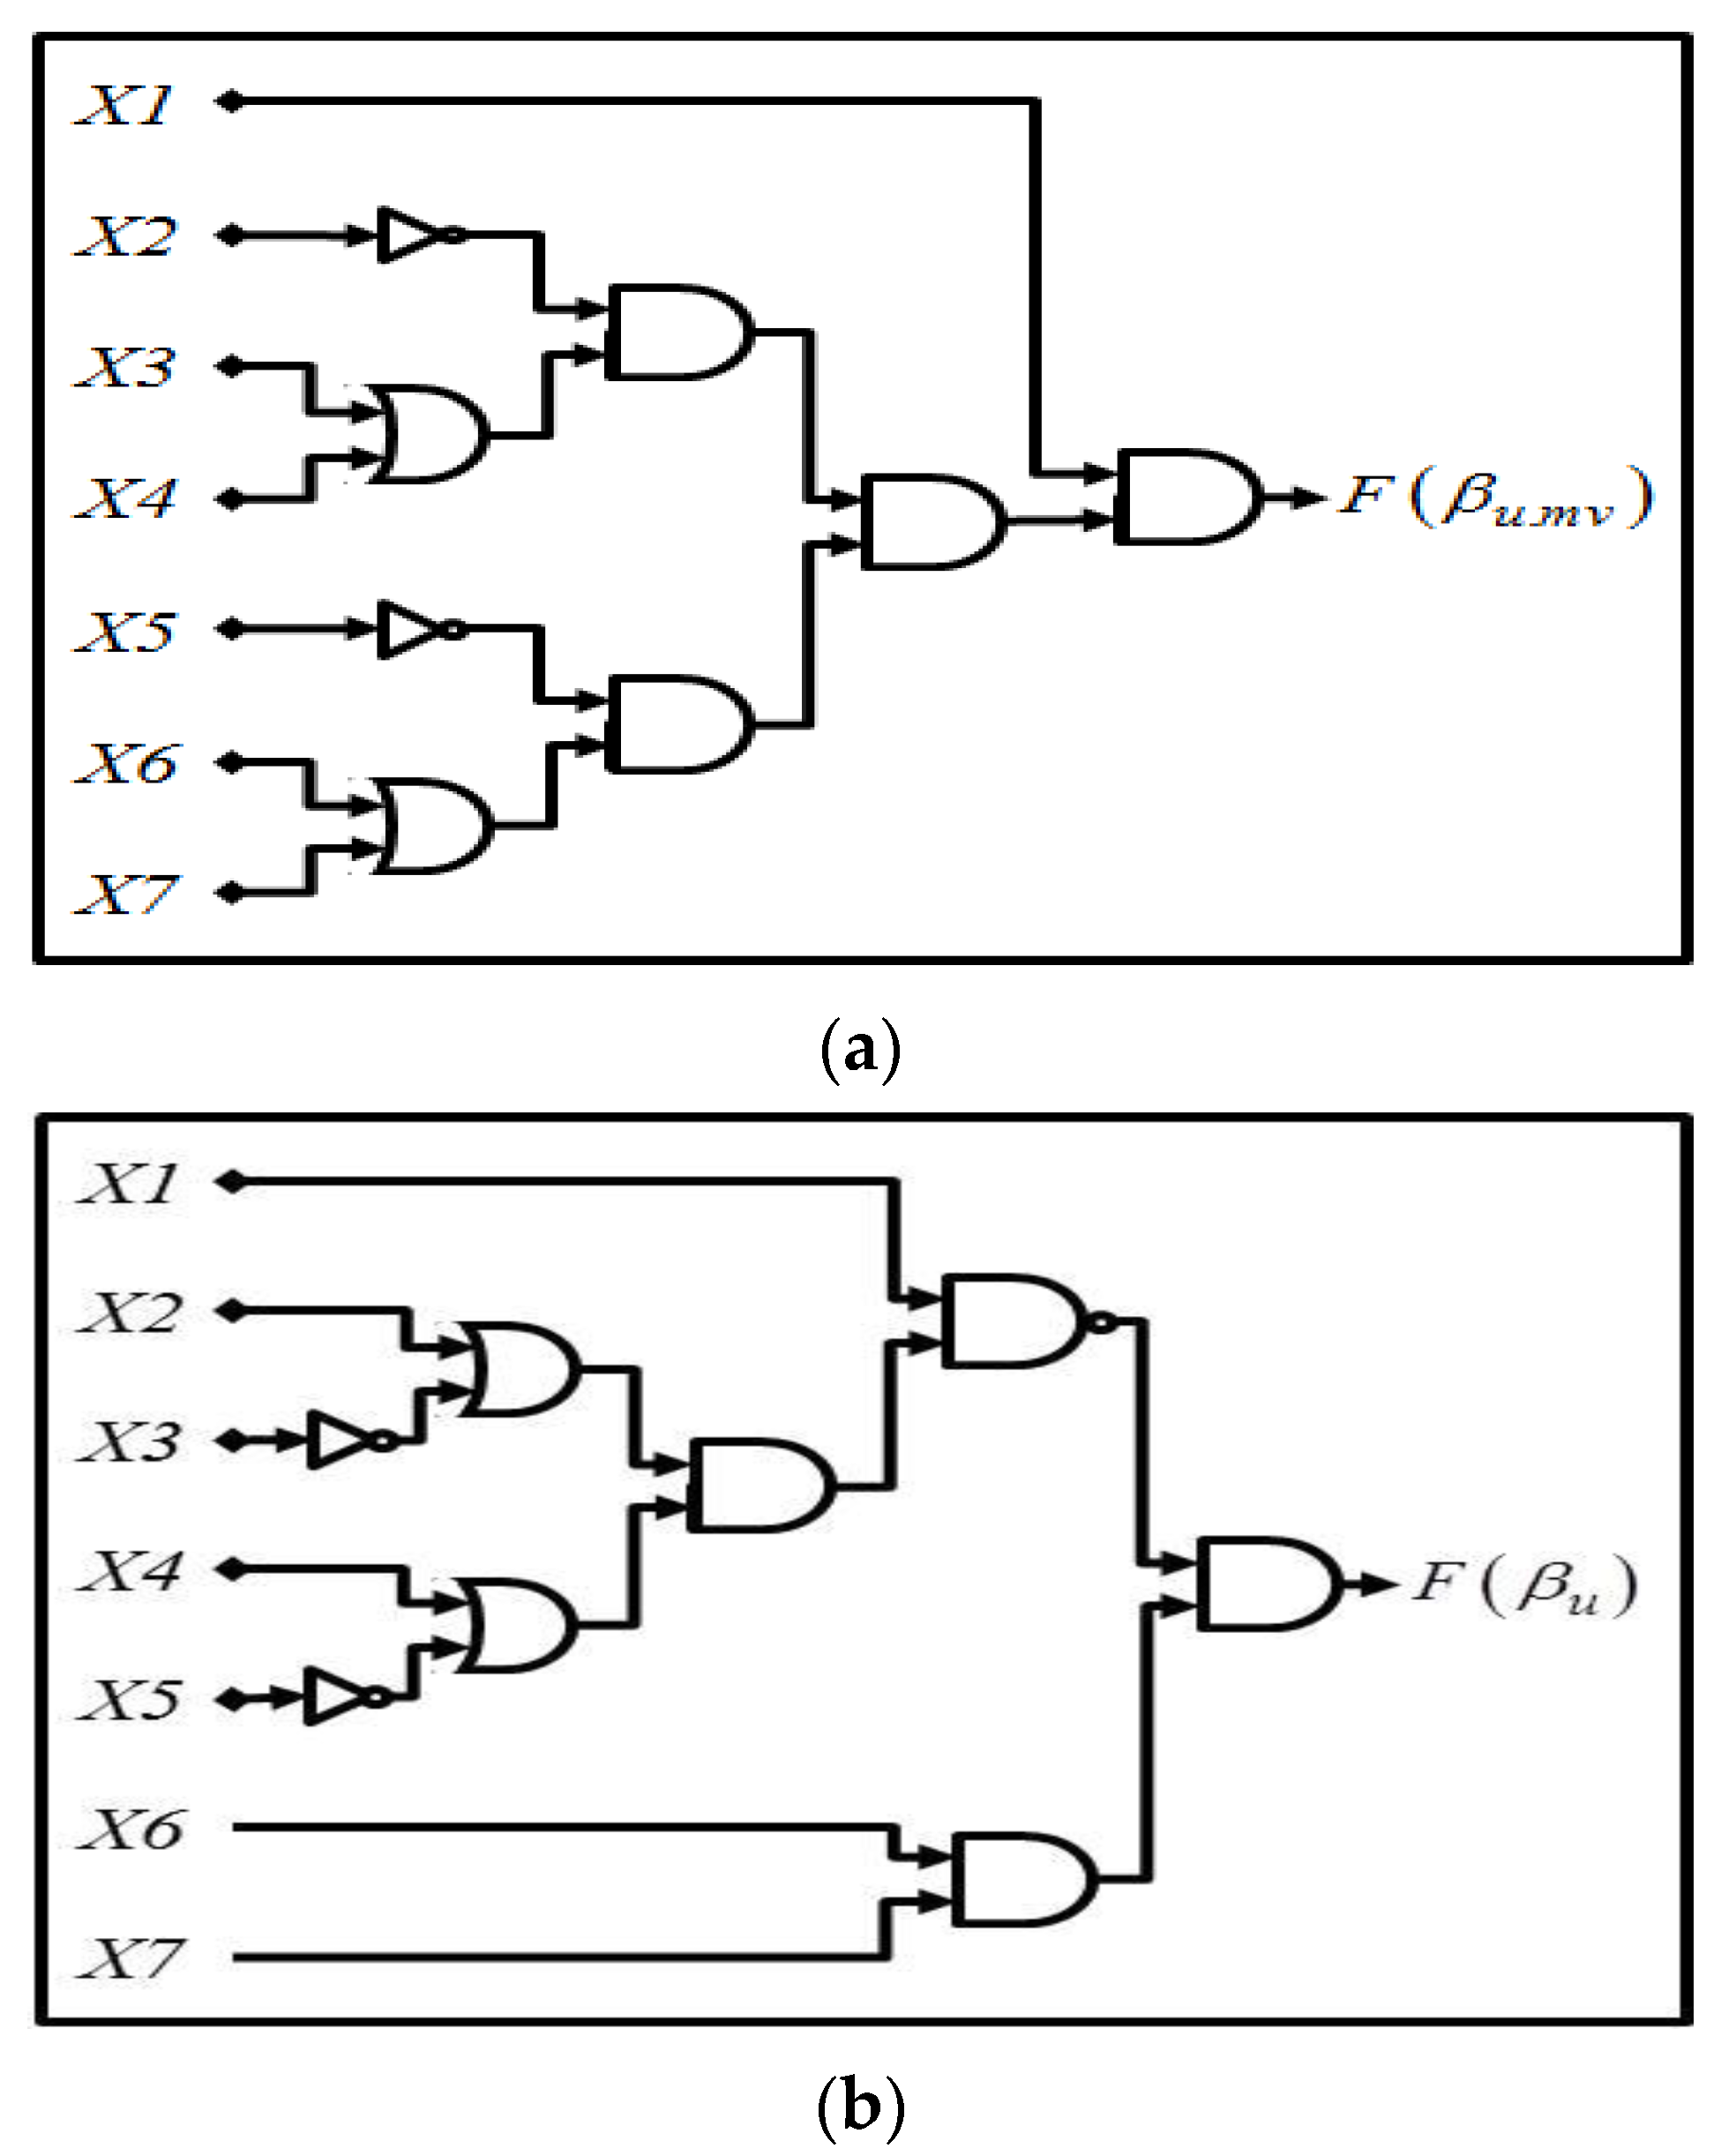
So, according to the similarity of the above forms, logical electronic schemes have been built based on the binary system that can be equivalent to the sensor and actuator fault criteria as shown in Figure 4a,b, where Figure 4a shows the digital scheme of the sensor fault criteria and Figure 4b shows the digital schema of the actuator faults.
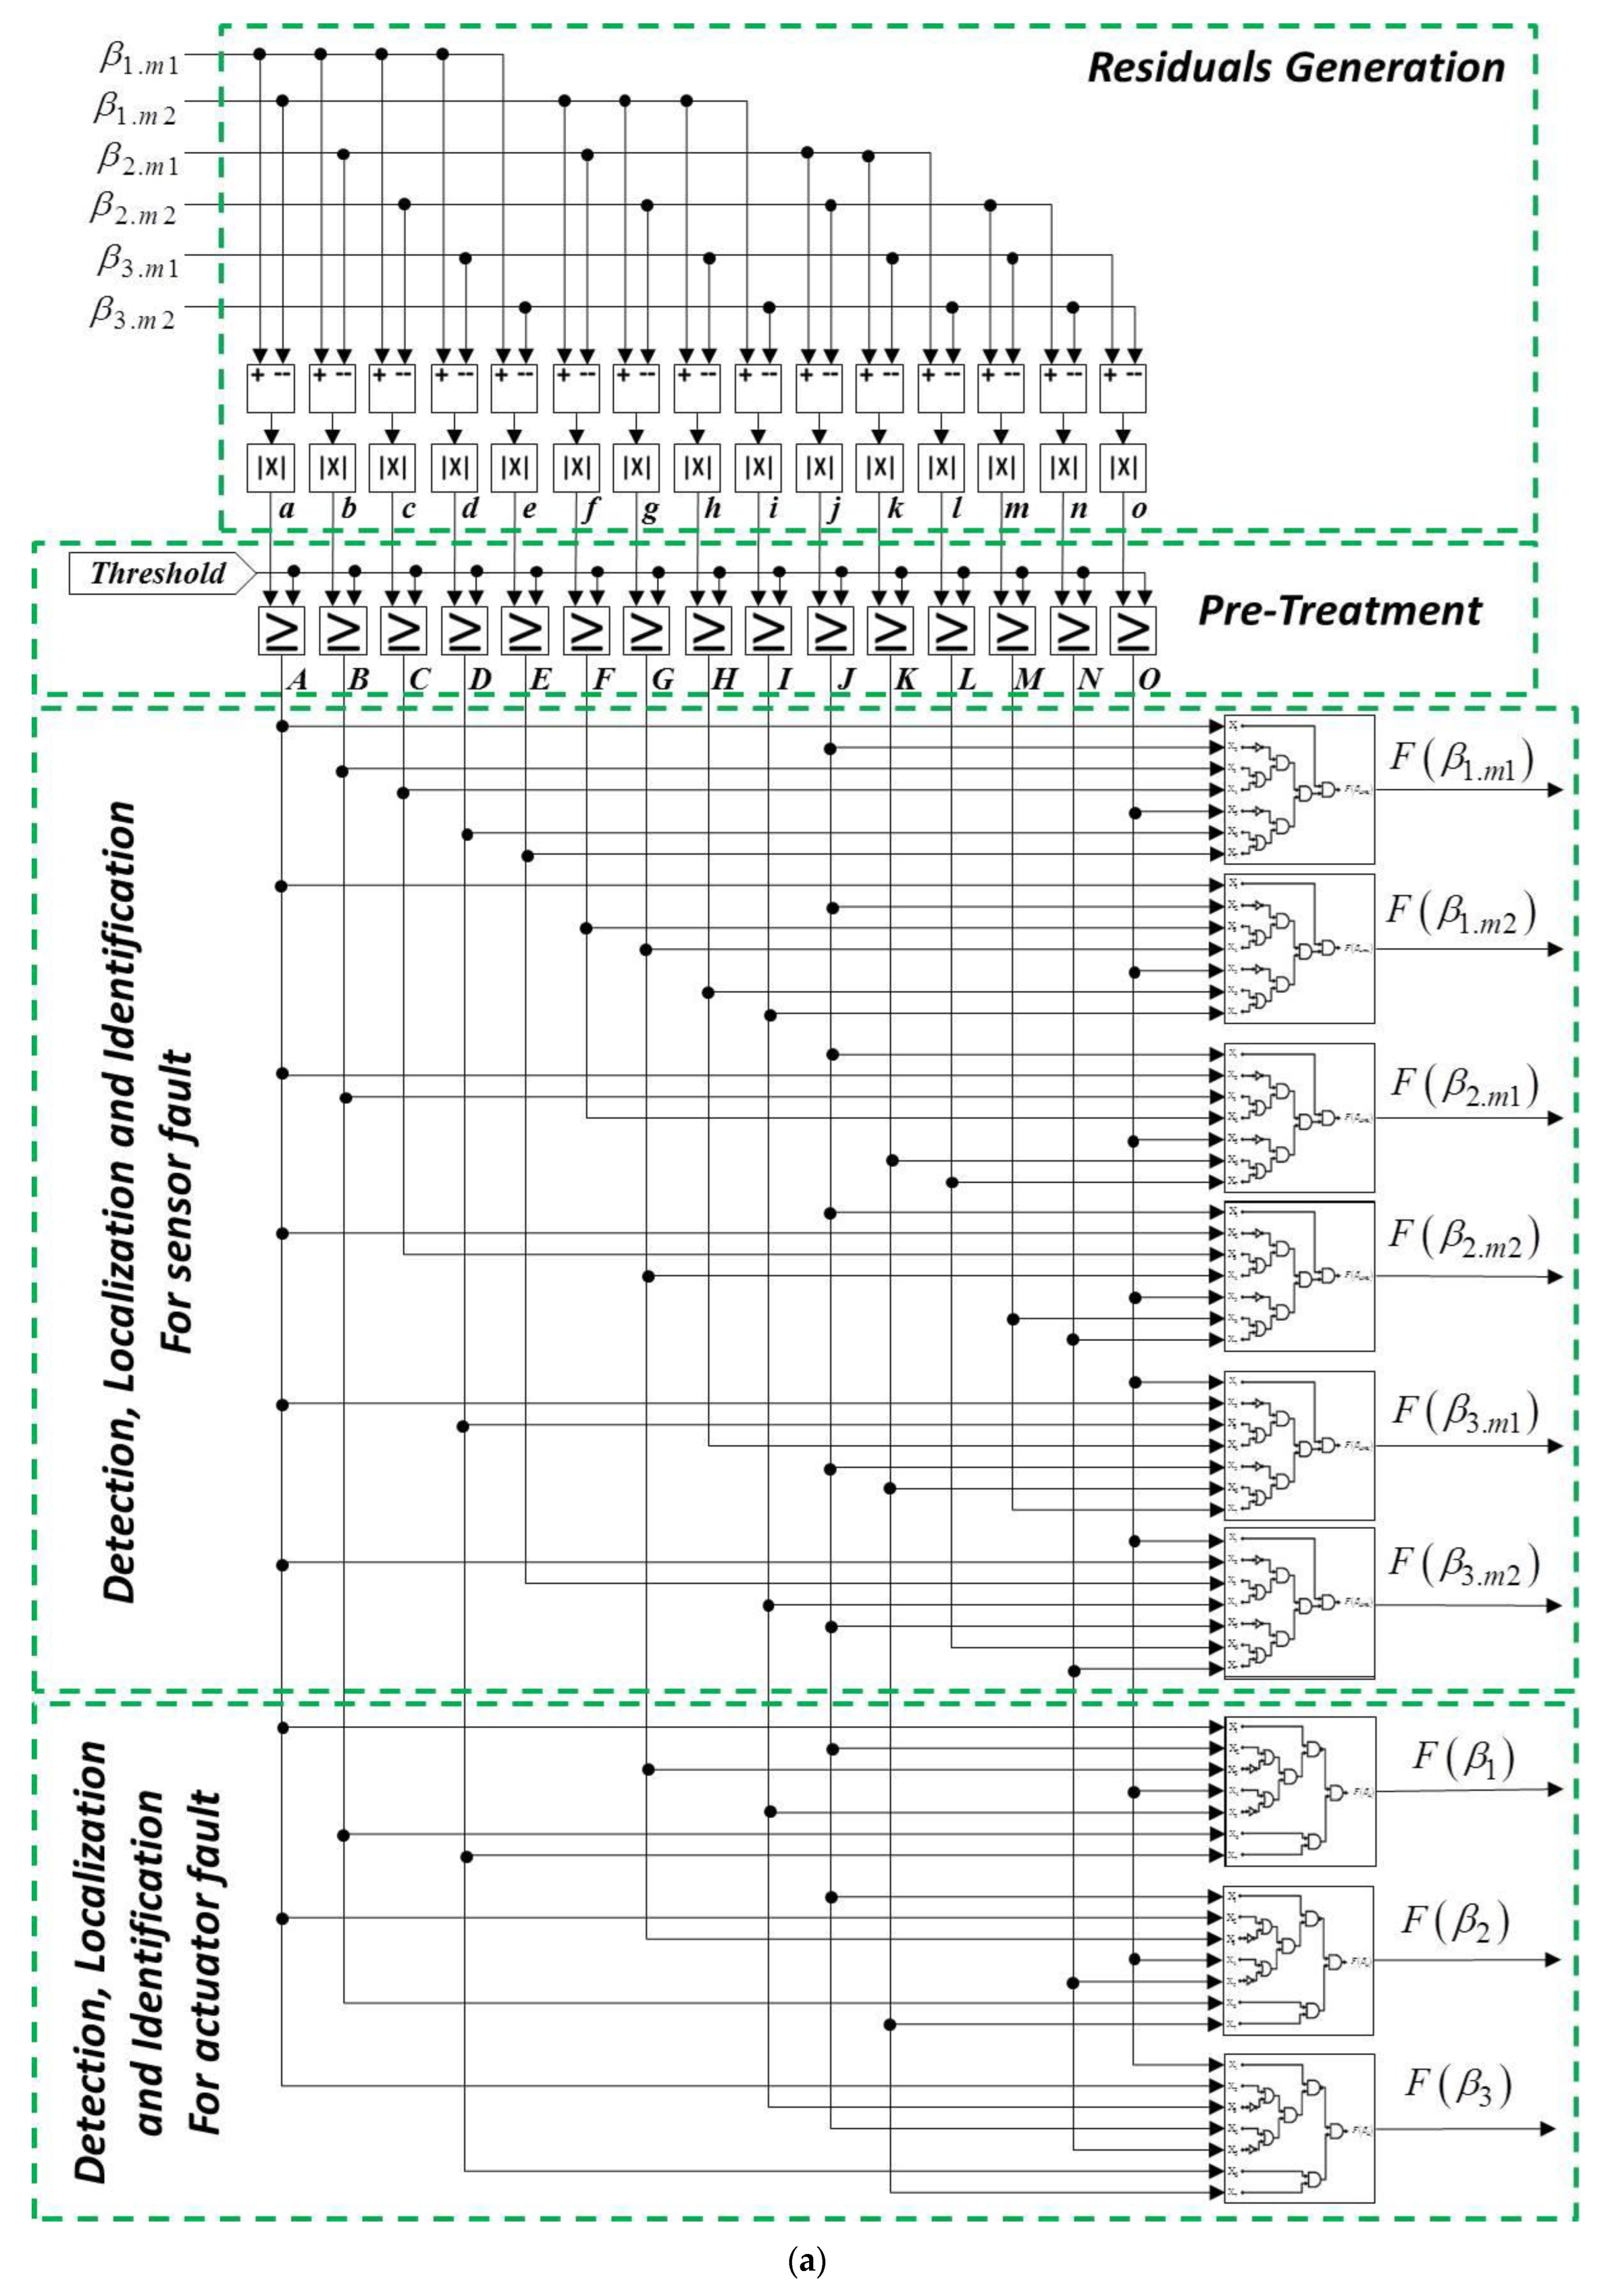
Finally, the implementation of the global digital scheme of the proposed diagnosis approach is presented in Figure 5a, which is based on the two built sub-systems shown in Figure 4a,b.
After the generation of these residuals, the next step is to determine the residuals that have been influenced by each fault in the pitch system. A threshold value is calculated by observing the system responses, which presents the difference between the outputs of the real system of the wind turbine and the outputs obtained from the mathematical model. The threshold value ( T h r ) is calculated taking into account the accuracy of fault detection and the less time of detection (TD). Furthermore, the considerations aforementioned at the end of Section 3.2 are taken into account.
To test the effectiveness of the proposed fault diagnosis approach for the studied wind turbine system, the selected benchmark model is used to represent the behavior of the considered WT. Indeed, this model reflects the dynamics of the essential components of the wind system studied under normal operating conditions (without faults). Therefore, the experimental results obtained are based on this reference model to detect and isolate the faults in the different parts of the studied wind turbine. Indeed, the overall structure of the proposed diagnostic system is based on three steps: the first step consists of generating the fault residuals, the second step focuses on their processing, and the third step represents the model-based fault detection phase for the various sensors and actuators of the studied WT.
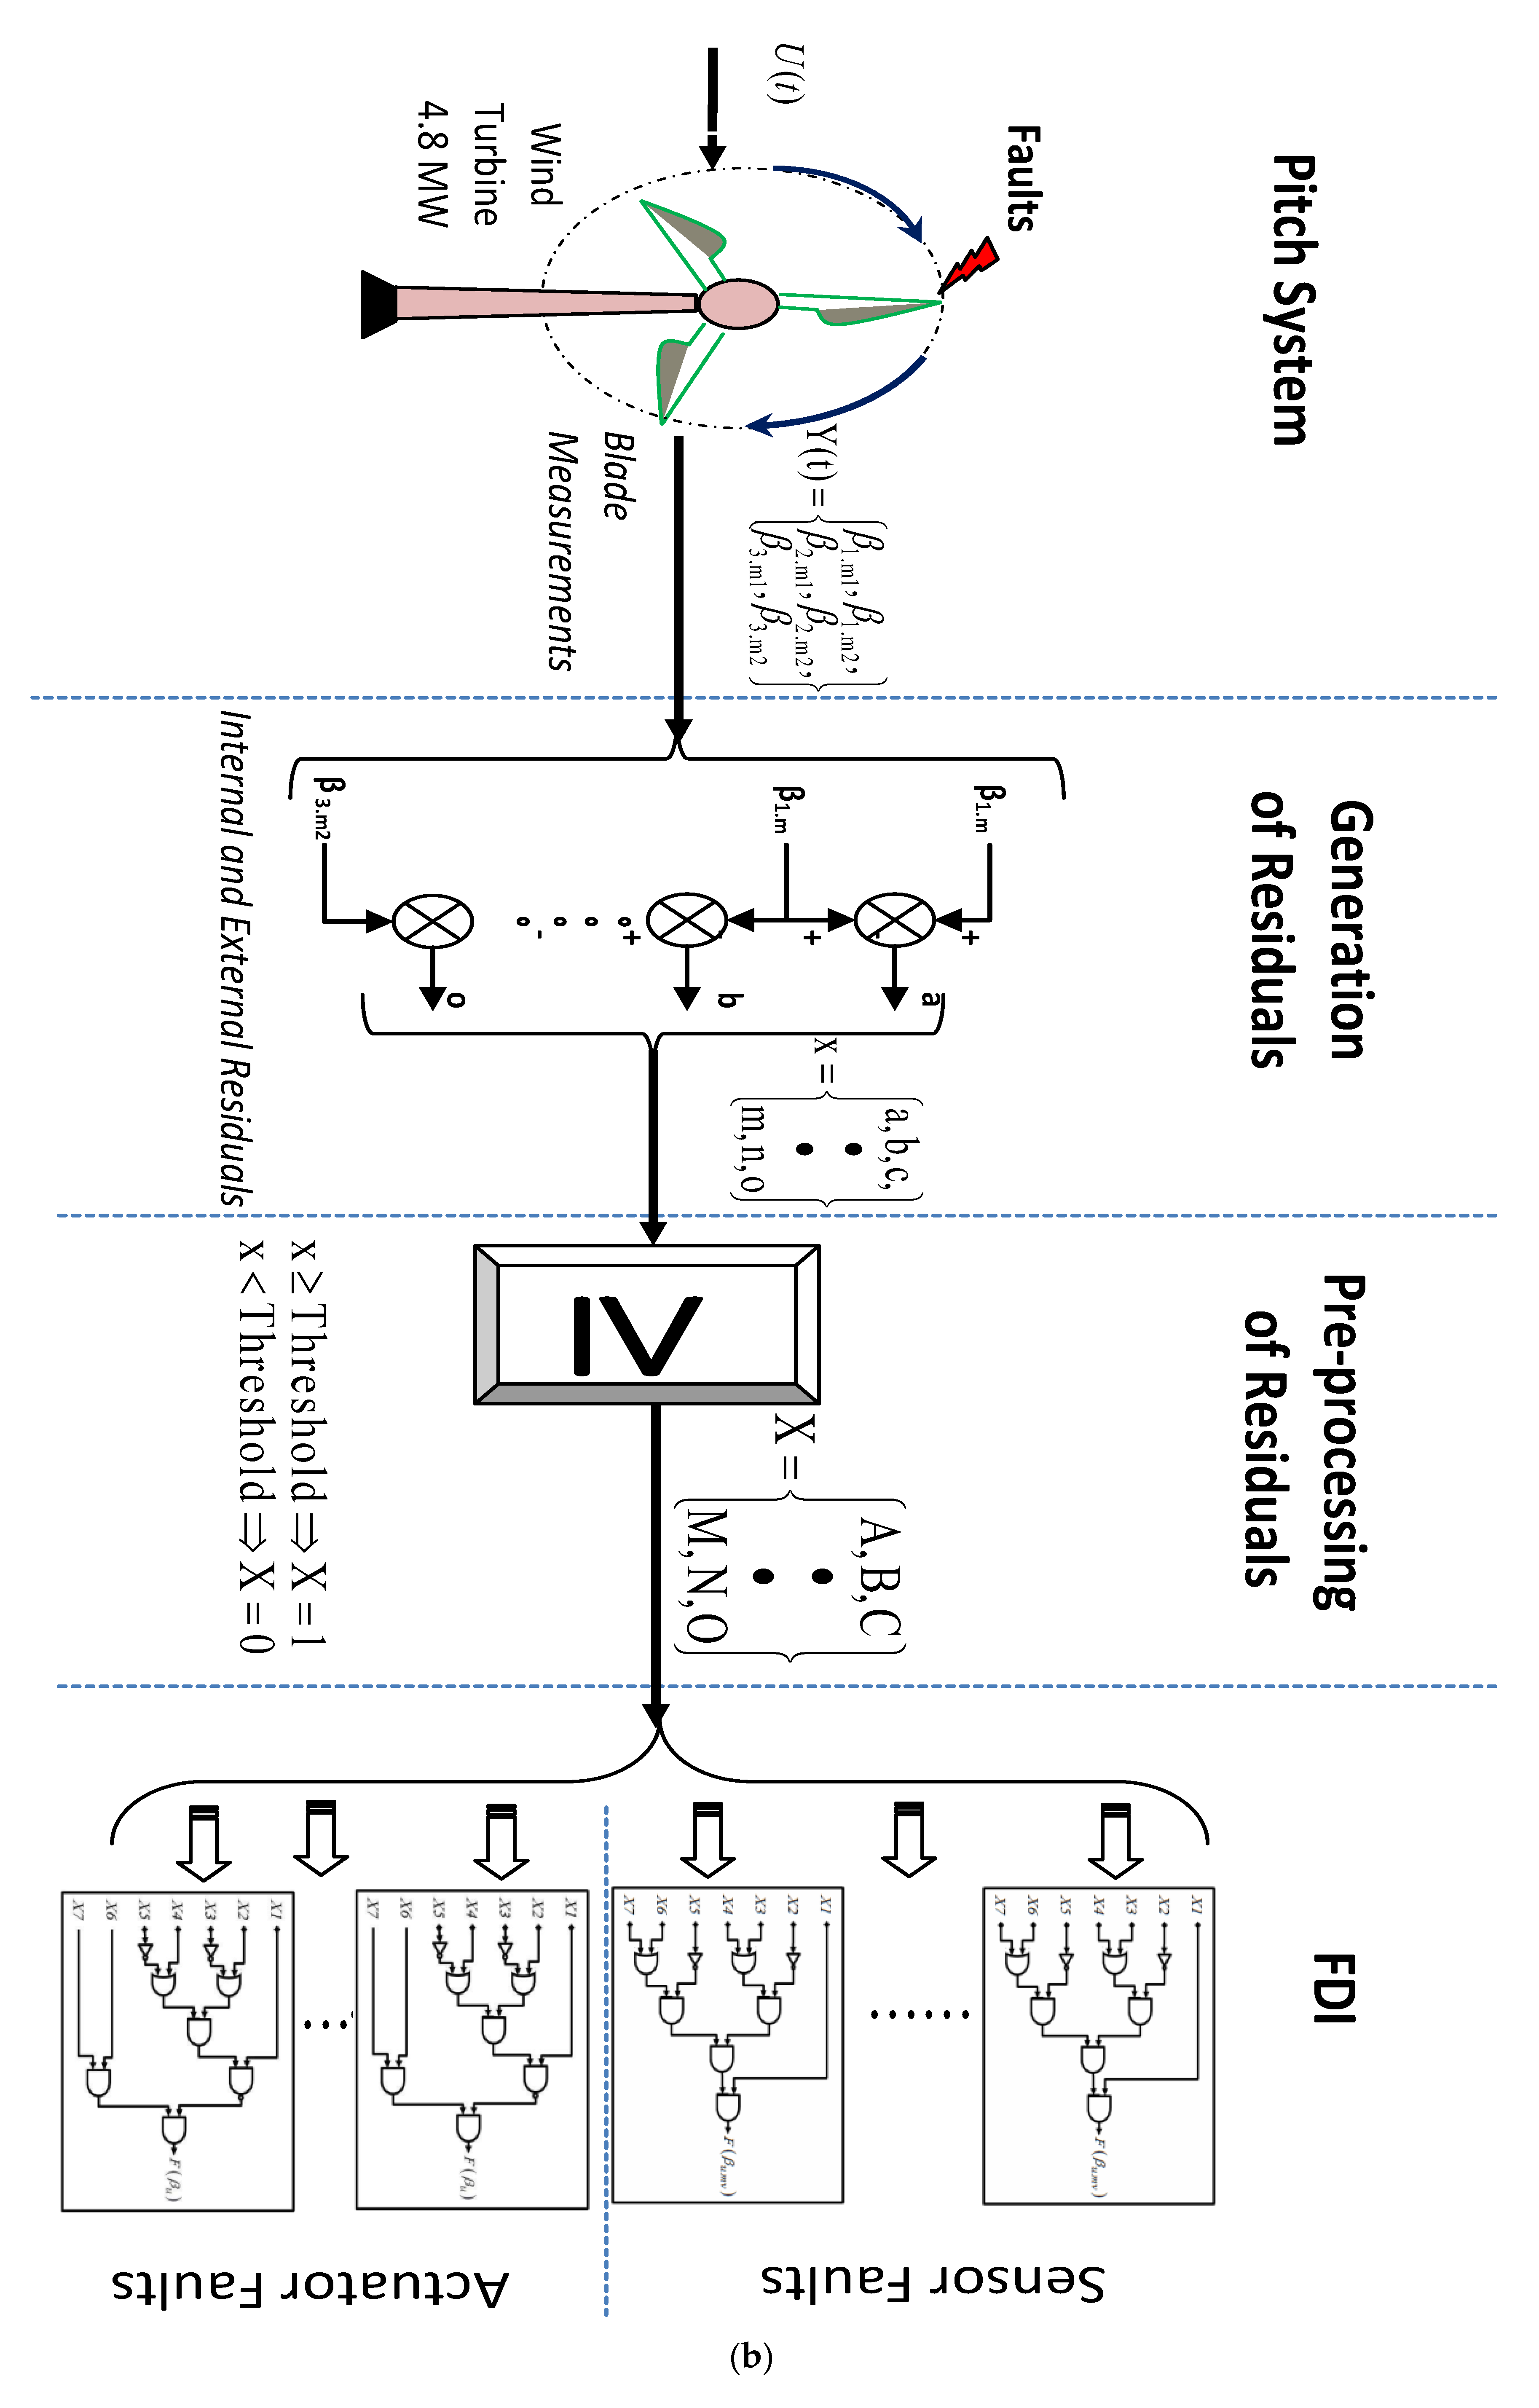
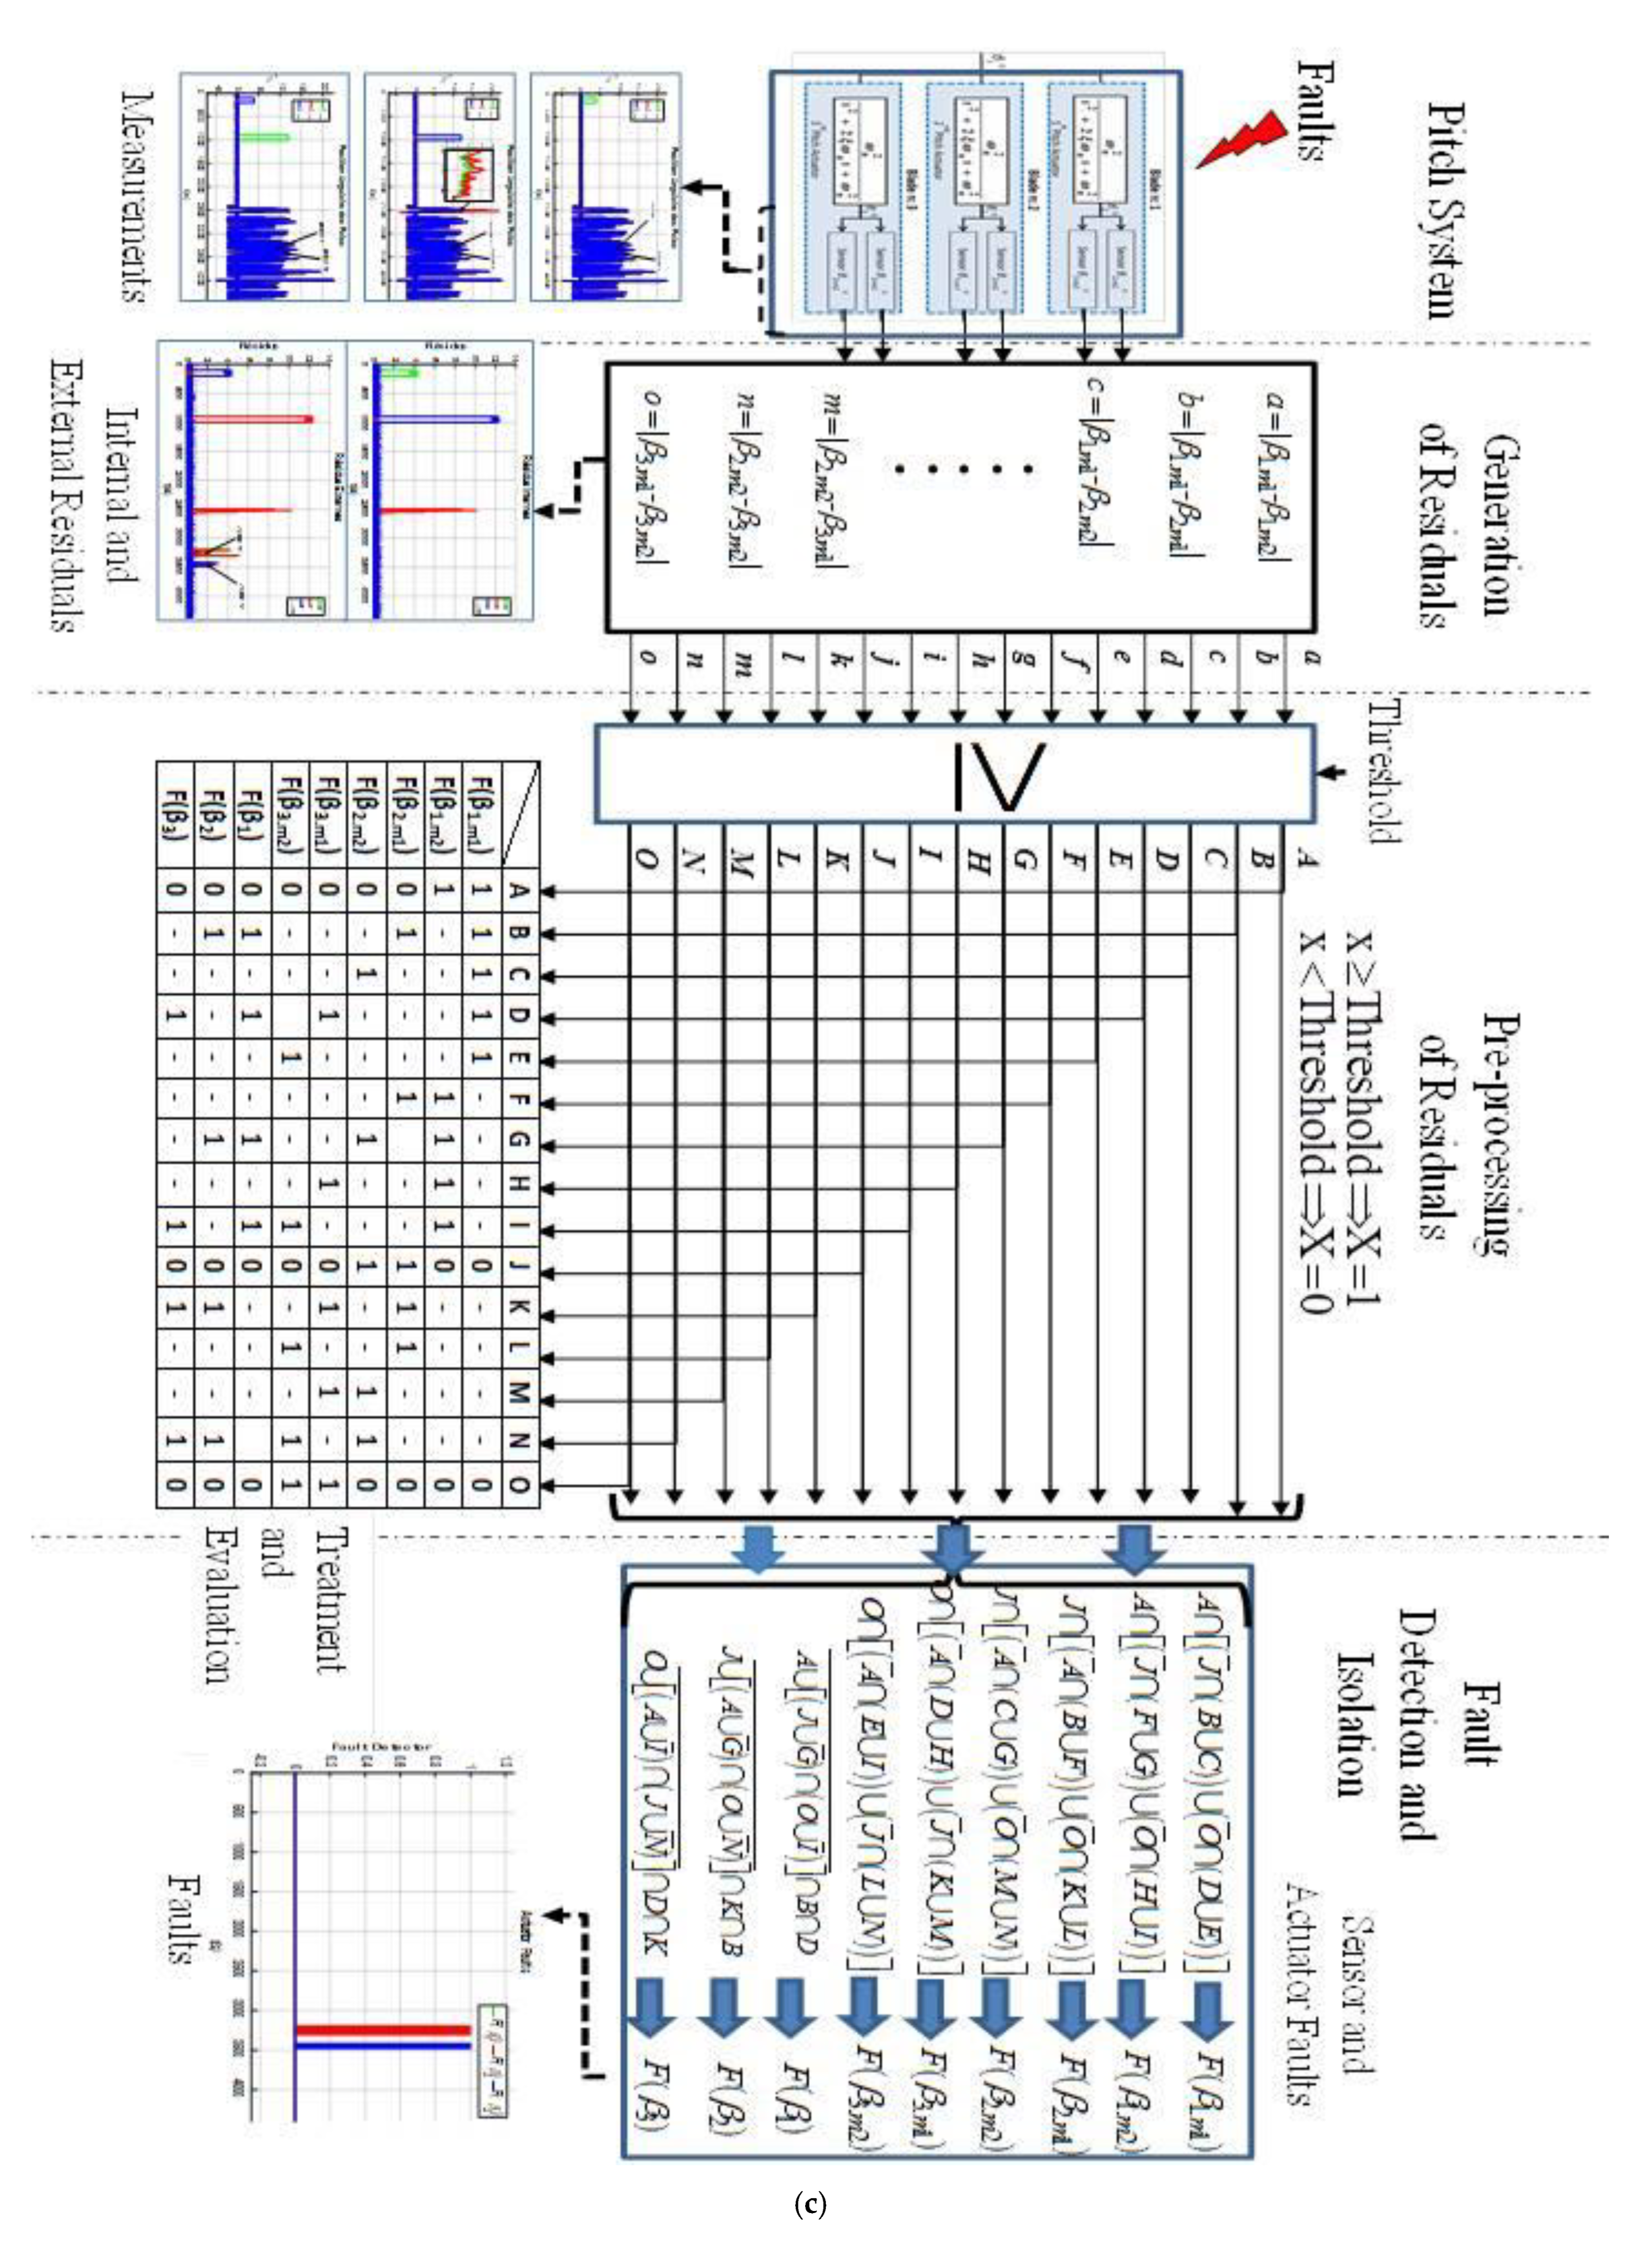
The diagnosis approach proposed in this paper can improve the performances of WTs, as well as their profitability, based on the diagnostic methodology included in this proposal. Indeed, with the use of the diagnostic indicators of the proposed approach, the availability and operational safety of the studied wind turbine are assured in normal mode and under the presence of faults. Therefore, the main aim of the proposed approach is to ensure the accurate detection of faults, early fault symptoms, and early fault occurrences while limiting the shutdowns caused by faults. This allows for efficient and fast problem resolution, overcoming monitoring gaps with a robust and easy-to-use strategy, and provides a high capability of detecting sudden dynamic changes in the wind turbine behavior under study. Figure 5b,c show the block diagrams introducing the steps of the proposed fault detection approach and the formulation used in the proposed approach, respectively. It is obvious, as shown in these two figures, that after the acquisition of the pitch angle sub-system measurements, the residuals are generated. Then, a pre-processing of these residuals is carried out. Finally, the fault detection and isolation (FDI) is activated for the accurate identification of the occurred sensor/actuator faults. The resulting fault signature table and all the implemented steps are illustrated in Figure 5c.

4. Obtained Results and Investigations

This section is dedicated to the validation of the proposed fault diagnosis approach based on the investigation of the obtained results under the studied relevant selected faults using a benchmark model of the studied WT. For this purpose, Table 3 presents the studied selected faults and their time of application which are used in the present study on the pitch angle sub-system of the studied WT taking into account a fixed detection threshold (   T h r = 0.85 ° ). This threshold is chosen based on the practical range within which the pitch angle system is not affected by its normal operating mode.
Concerning fault type A1, it is related to the false measurement of the pitch position which is due to electrical or mechanical faults, where in this paper two cases are taken into consideration: the first one is related to the first sensor in the first pitch angle sub-system F (β1.m1), and the second one is related to the first sensor of the third pitch angle sub-system F (β3.m1) as represented in Table 3. Fault type A2 corresponds to the gain factor measurement change in the second sensor of the second pitch angle sub-system which is due either to electrical or mechanical faults. The fault types B3 and B4 correspond to the faults in the hydraulic system resulting in changed dynamics, and that are due to either a drop in pressure in the hydraulic supply system (B3) or high air content in the oil (B4). These faults are caused mainly by the leakage in the hose, poor circulation of oil or air, blocked pump, pump malfunction, etc. It is important to clarify that in case the concerned residuals exceed the predefined detection threshold, the fault detection signals F(β1.m1), F (β2.m2), F (β3.m1), F(β2), and F(β3) have the value of one; otherwise, they remain equal to zero.
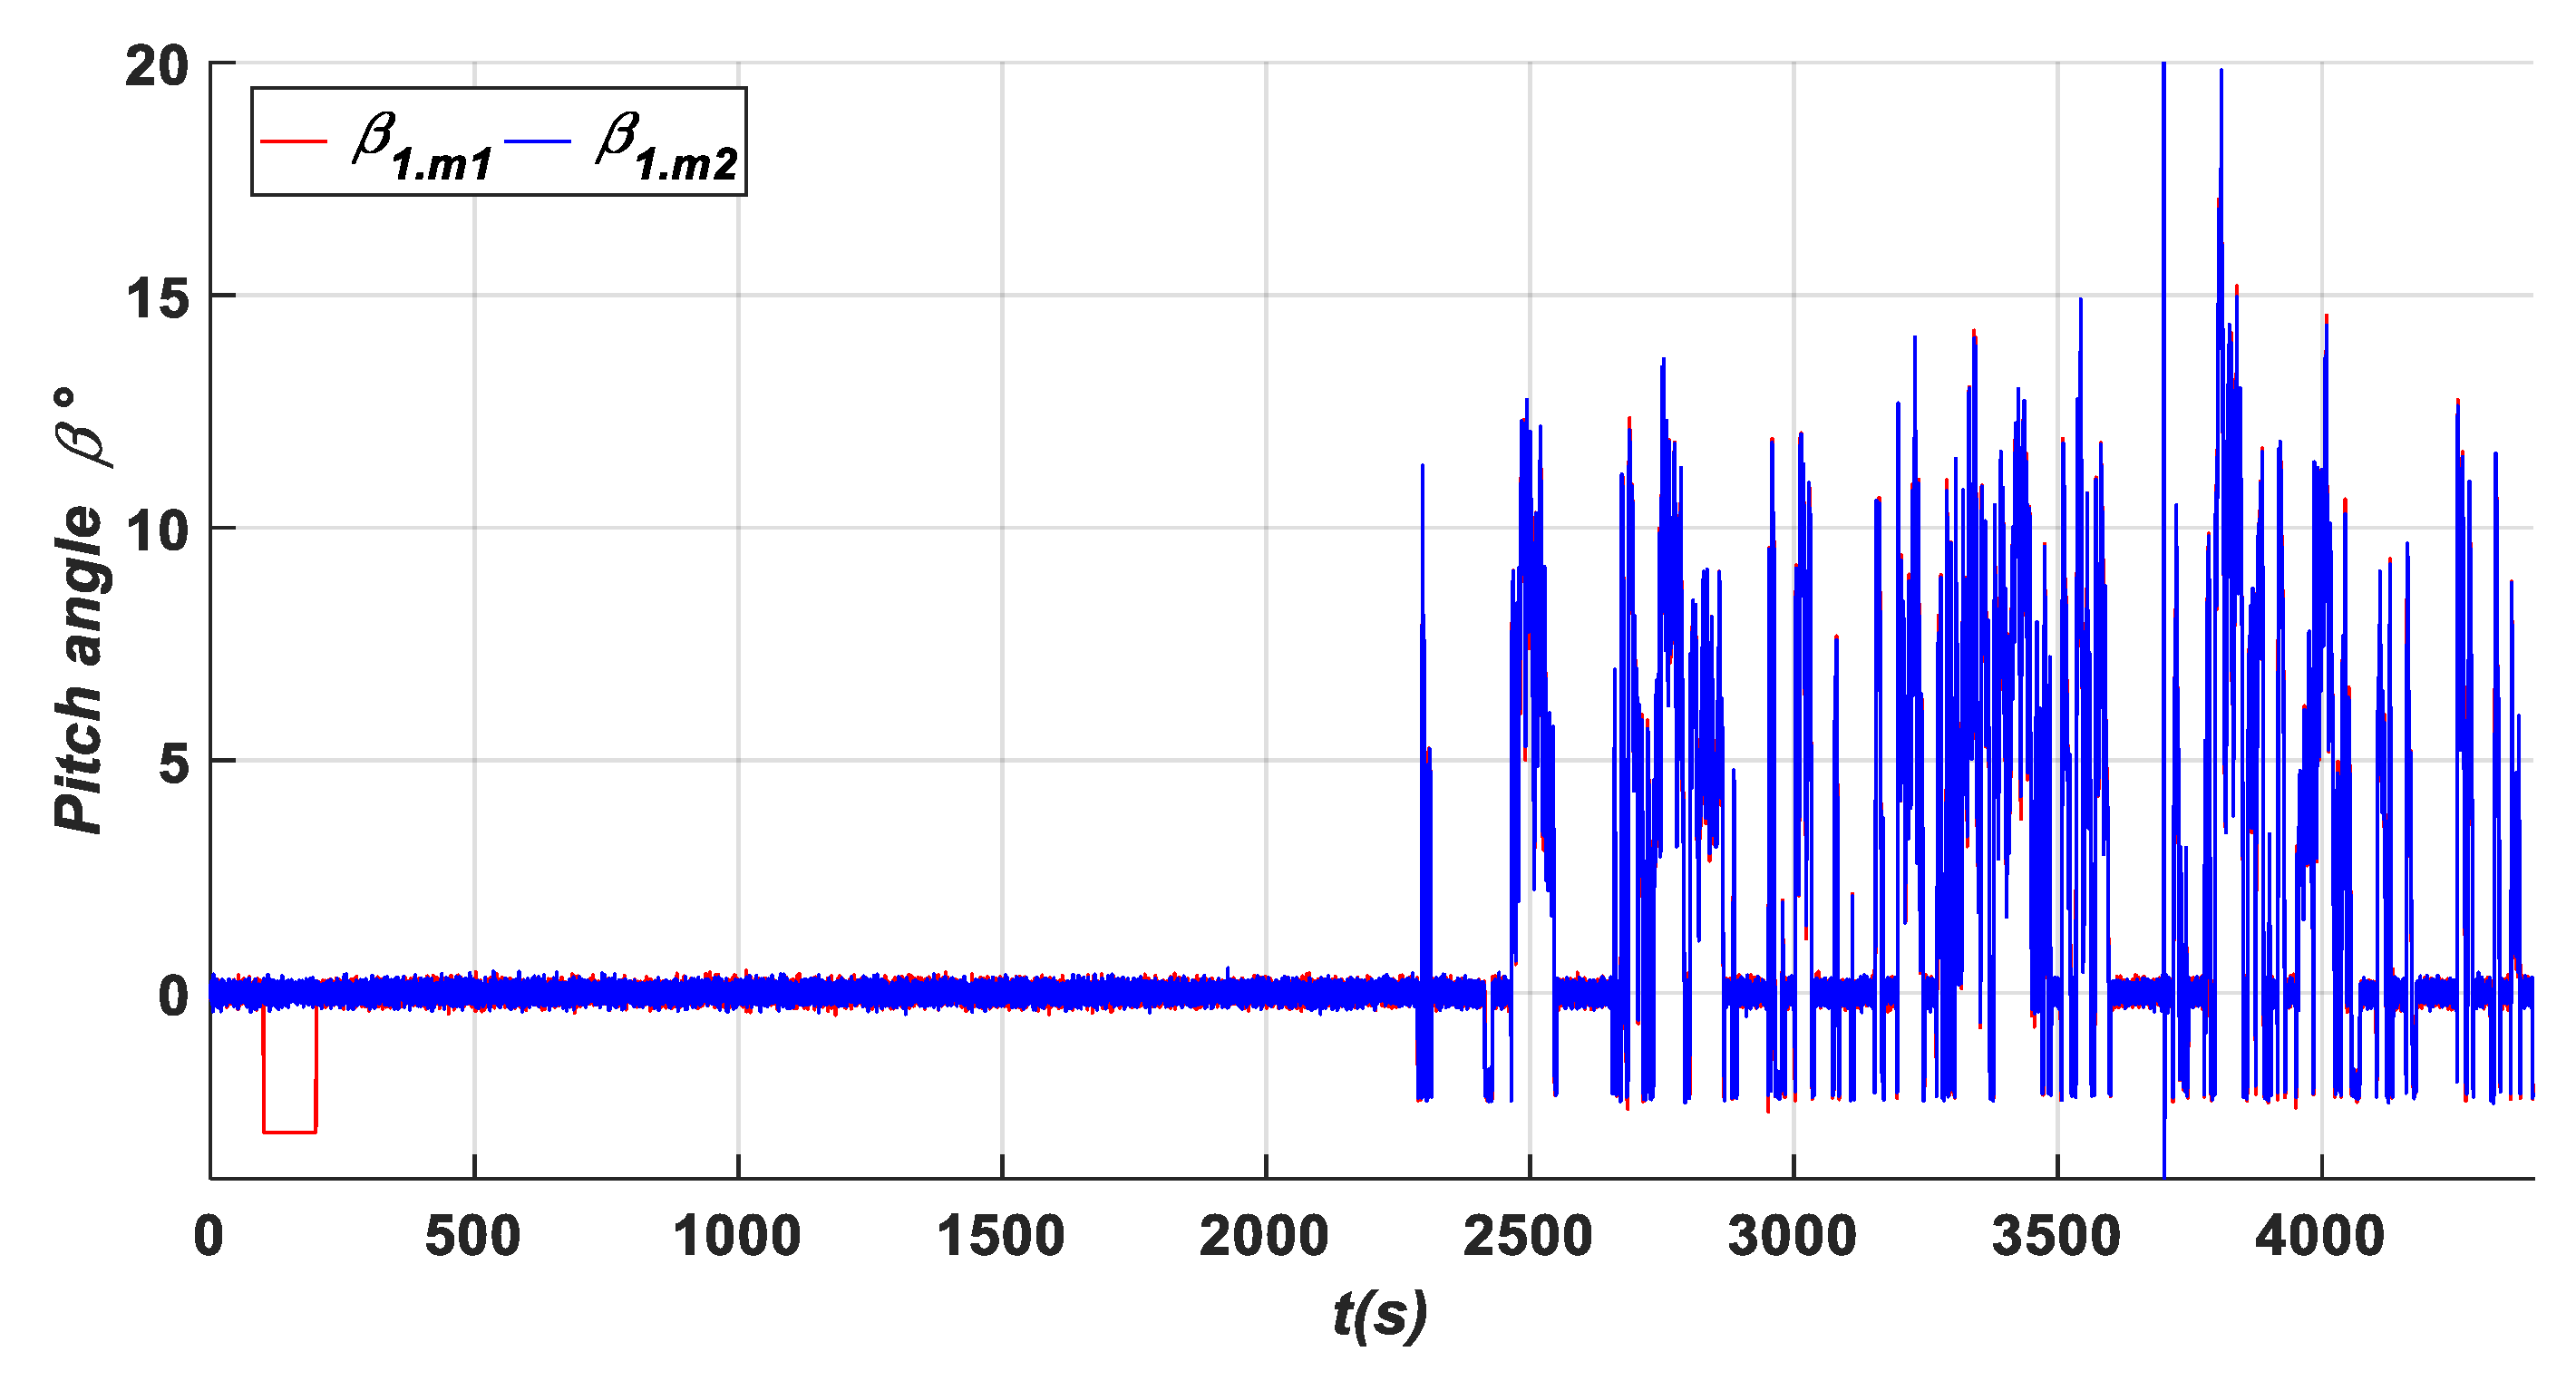
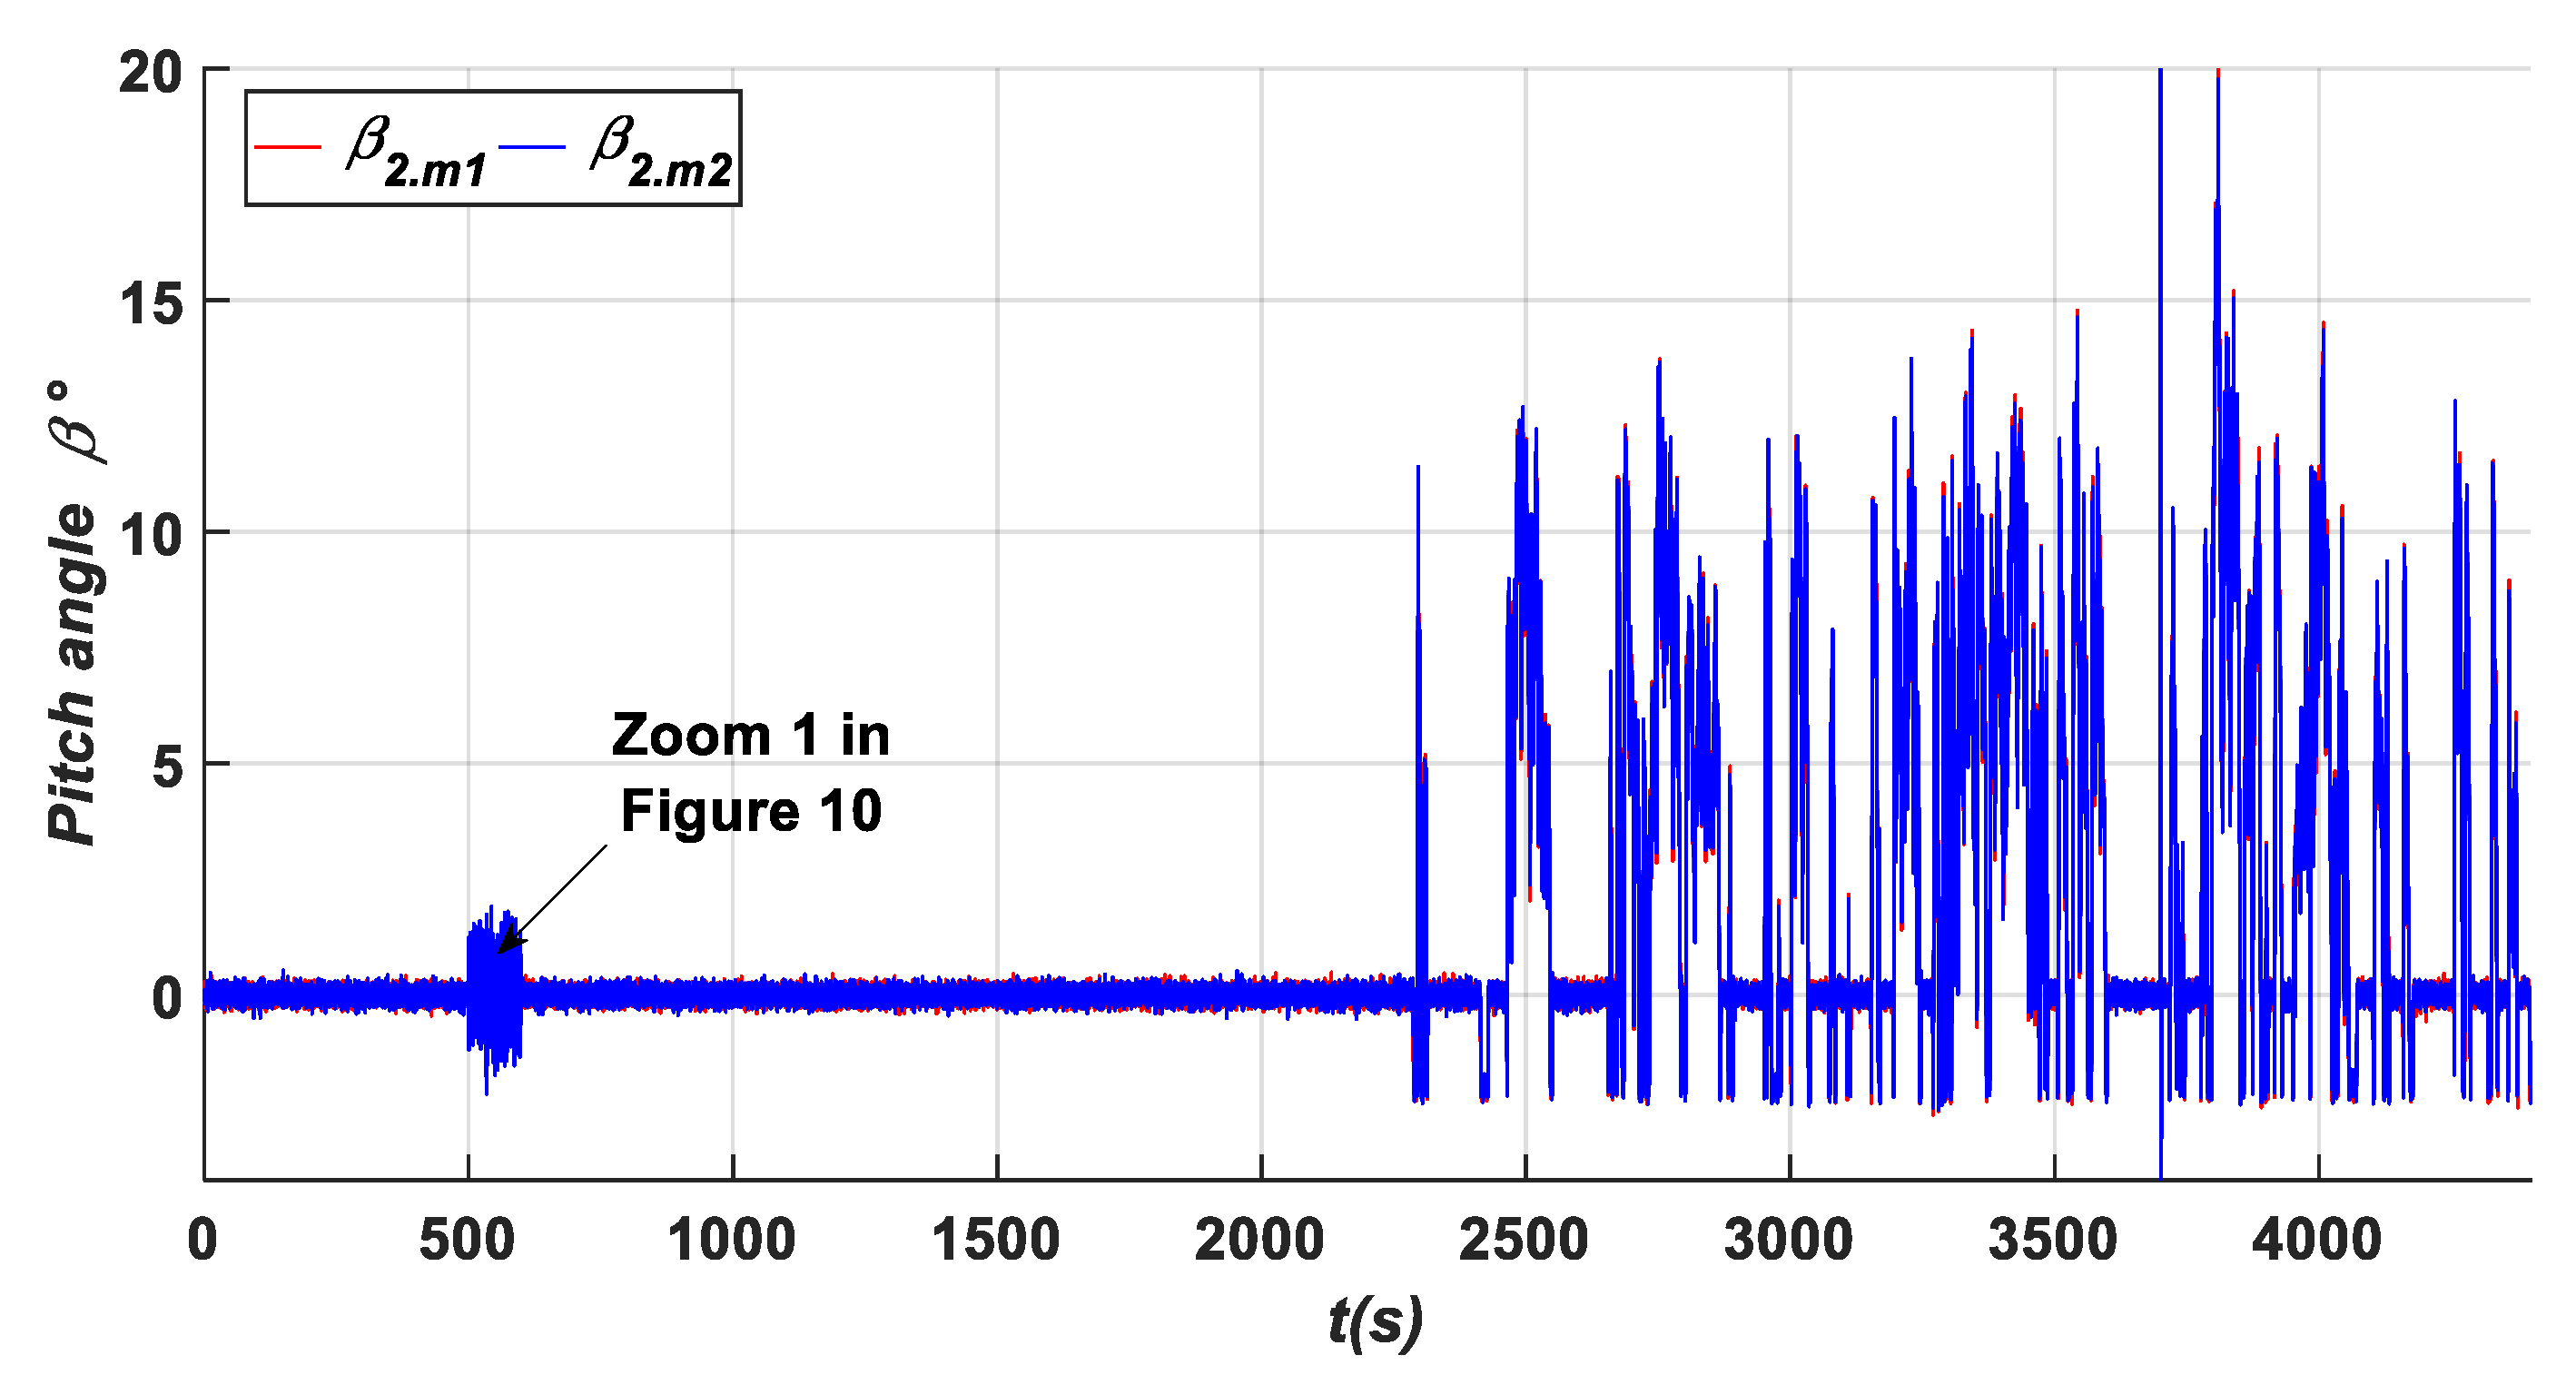
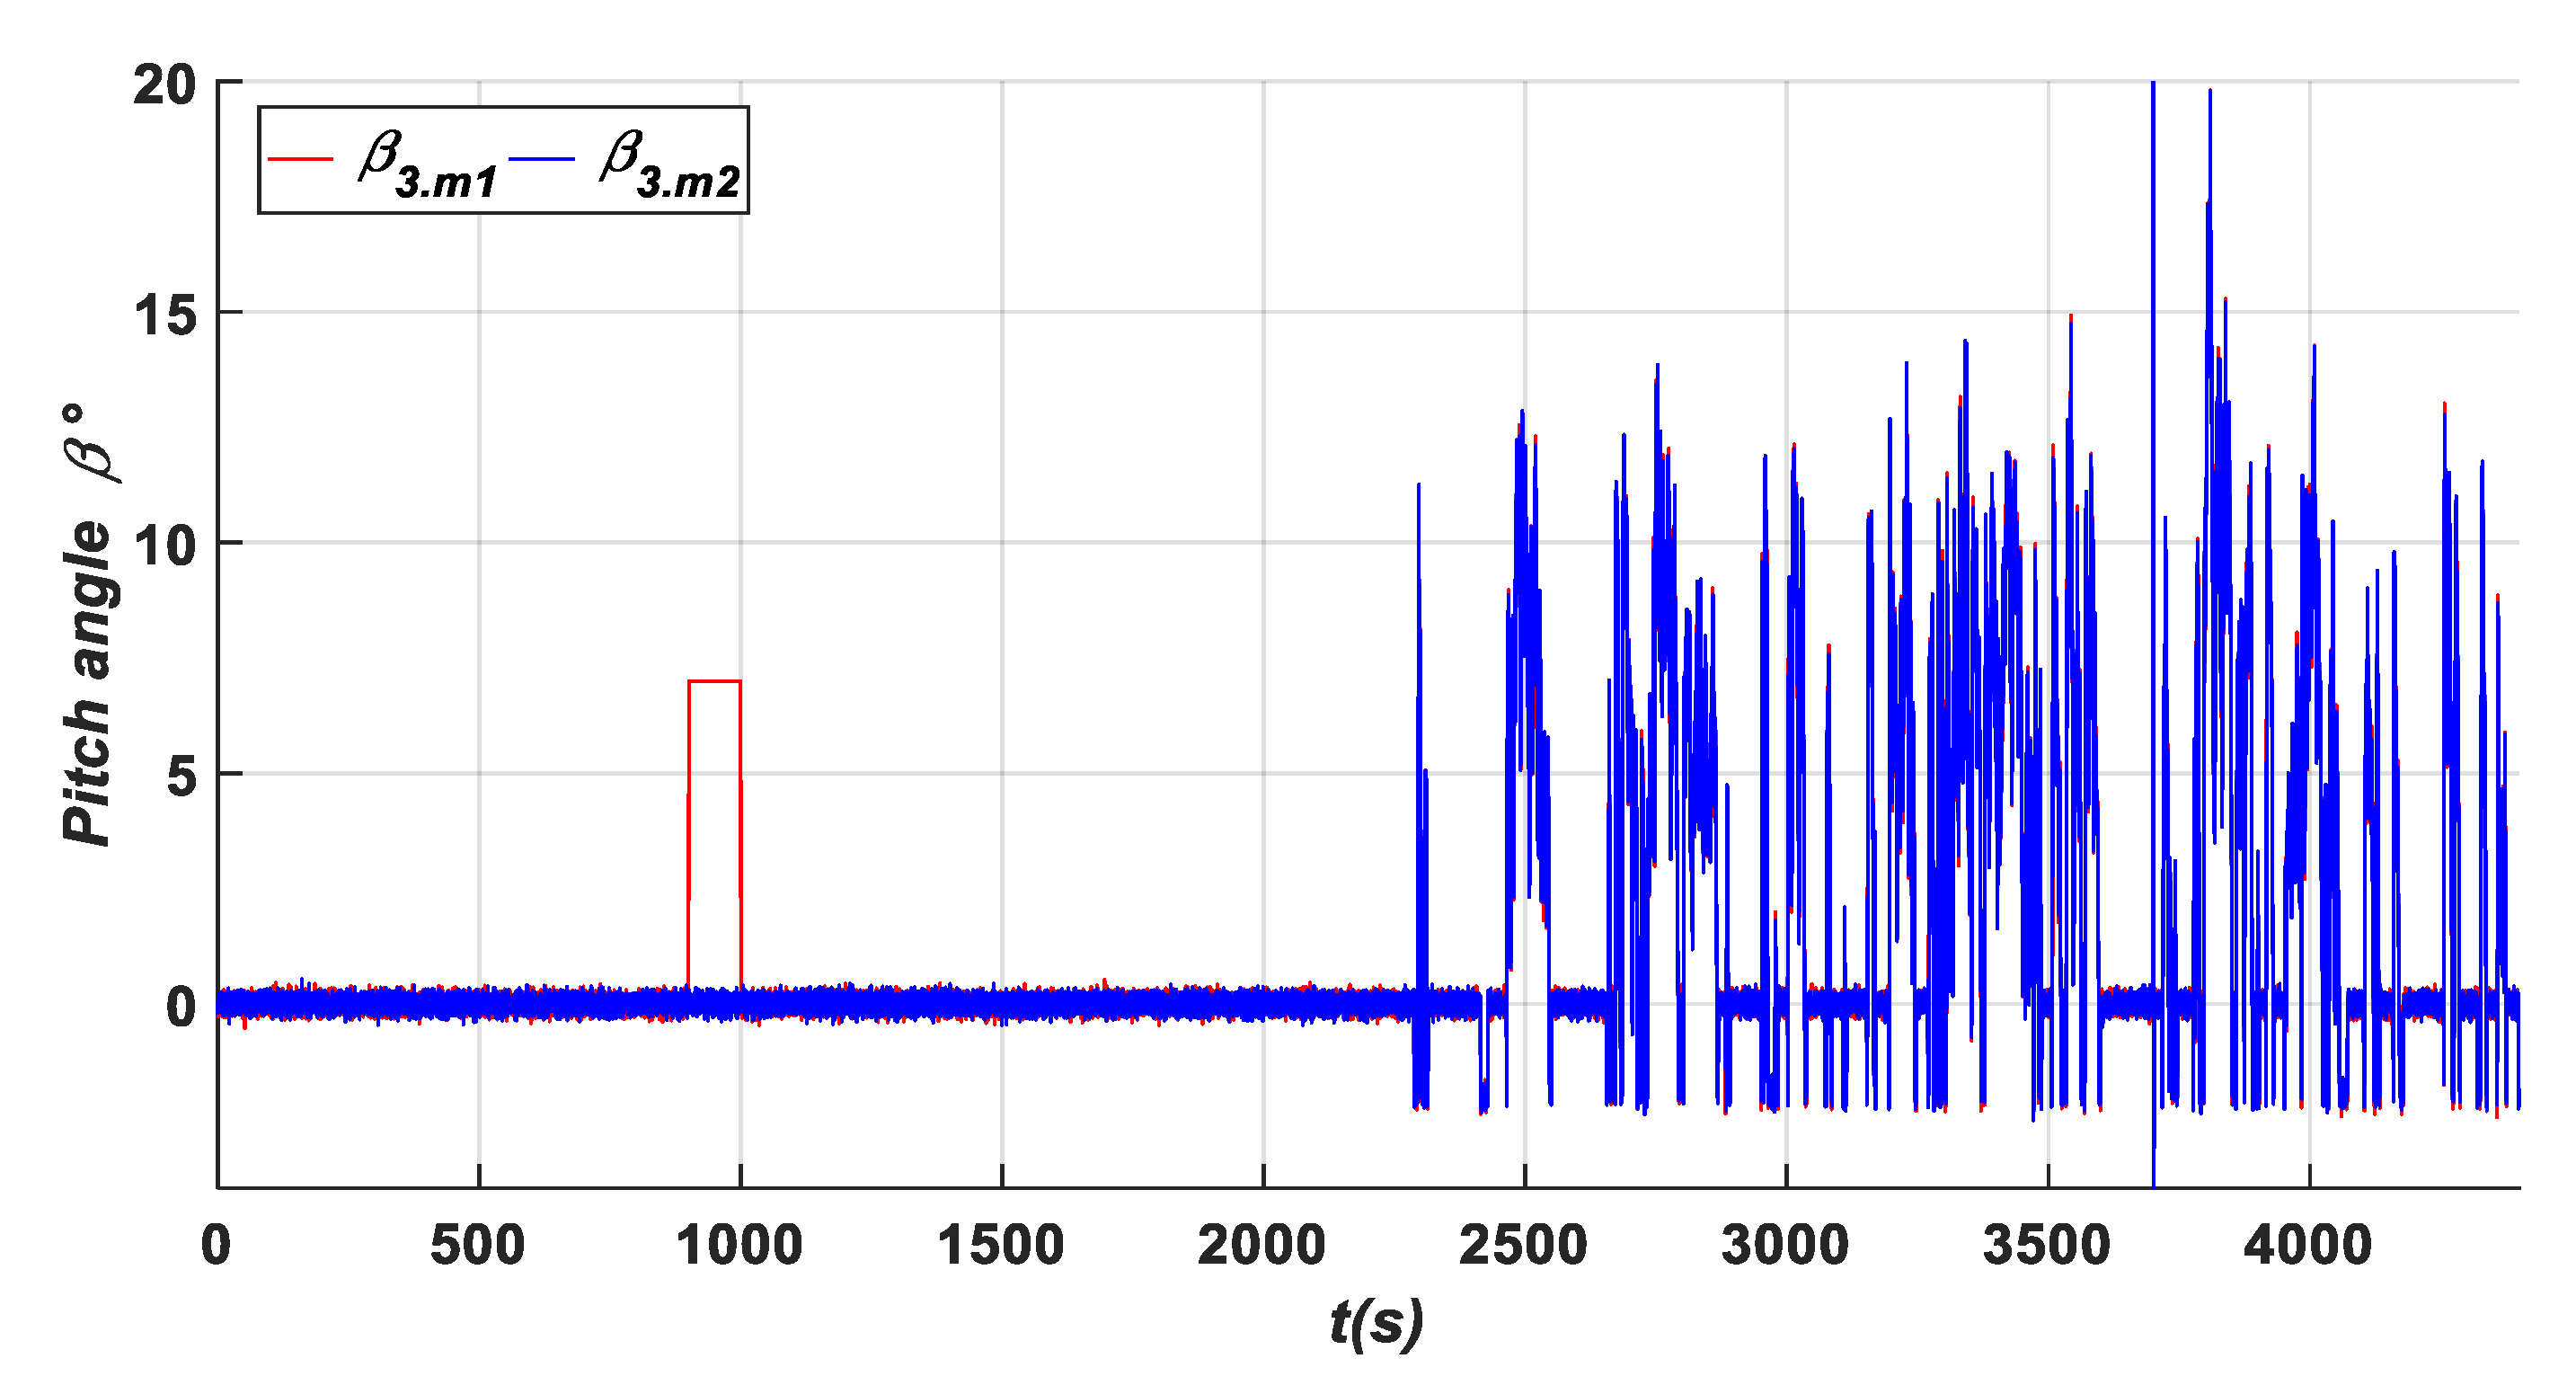
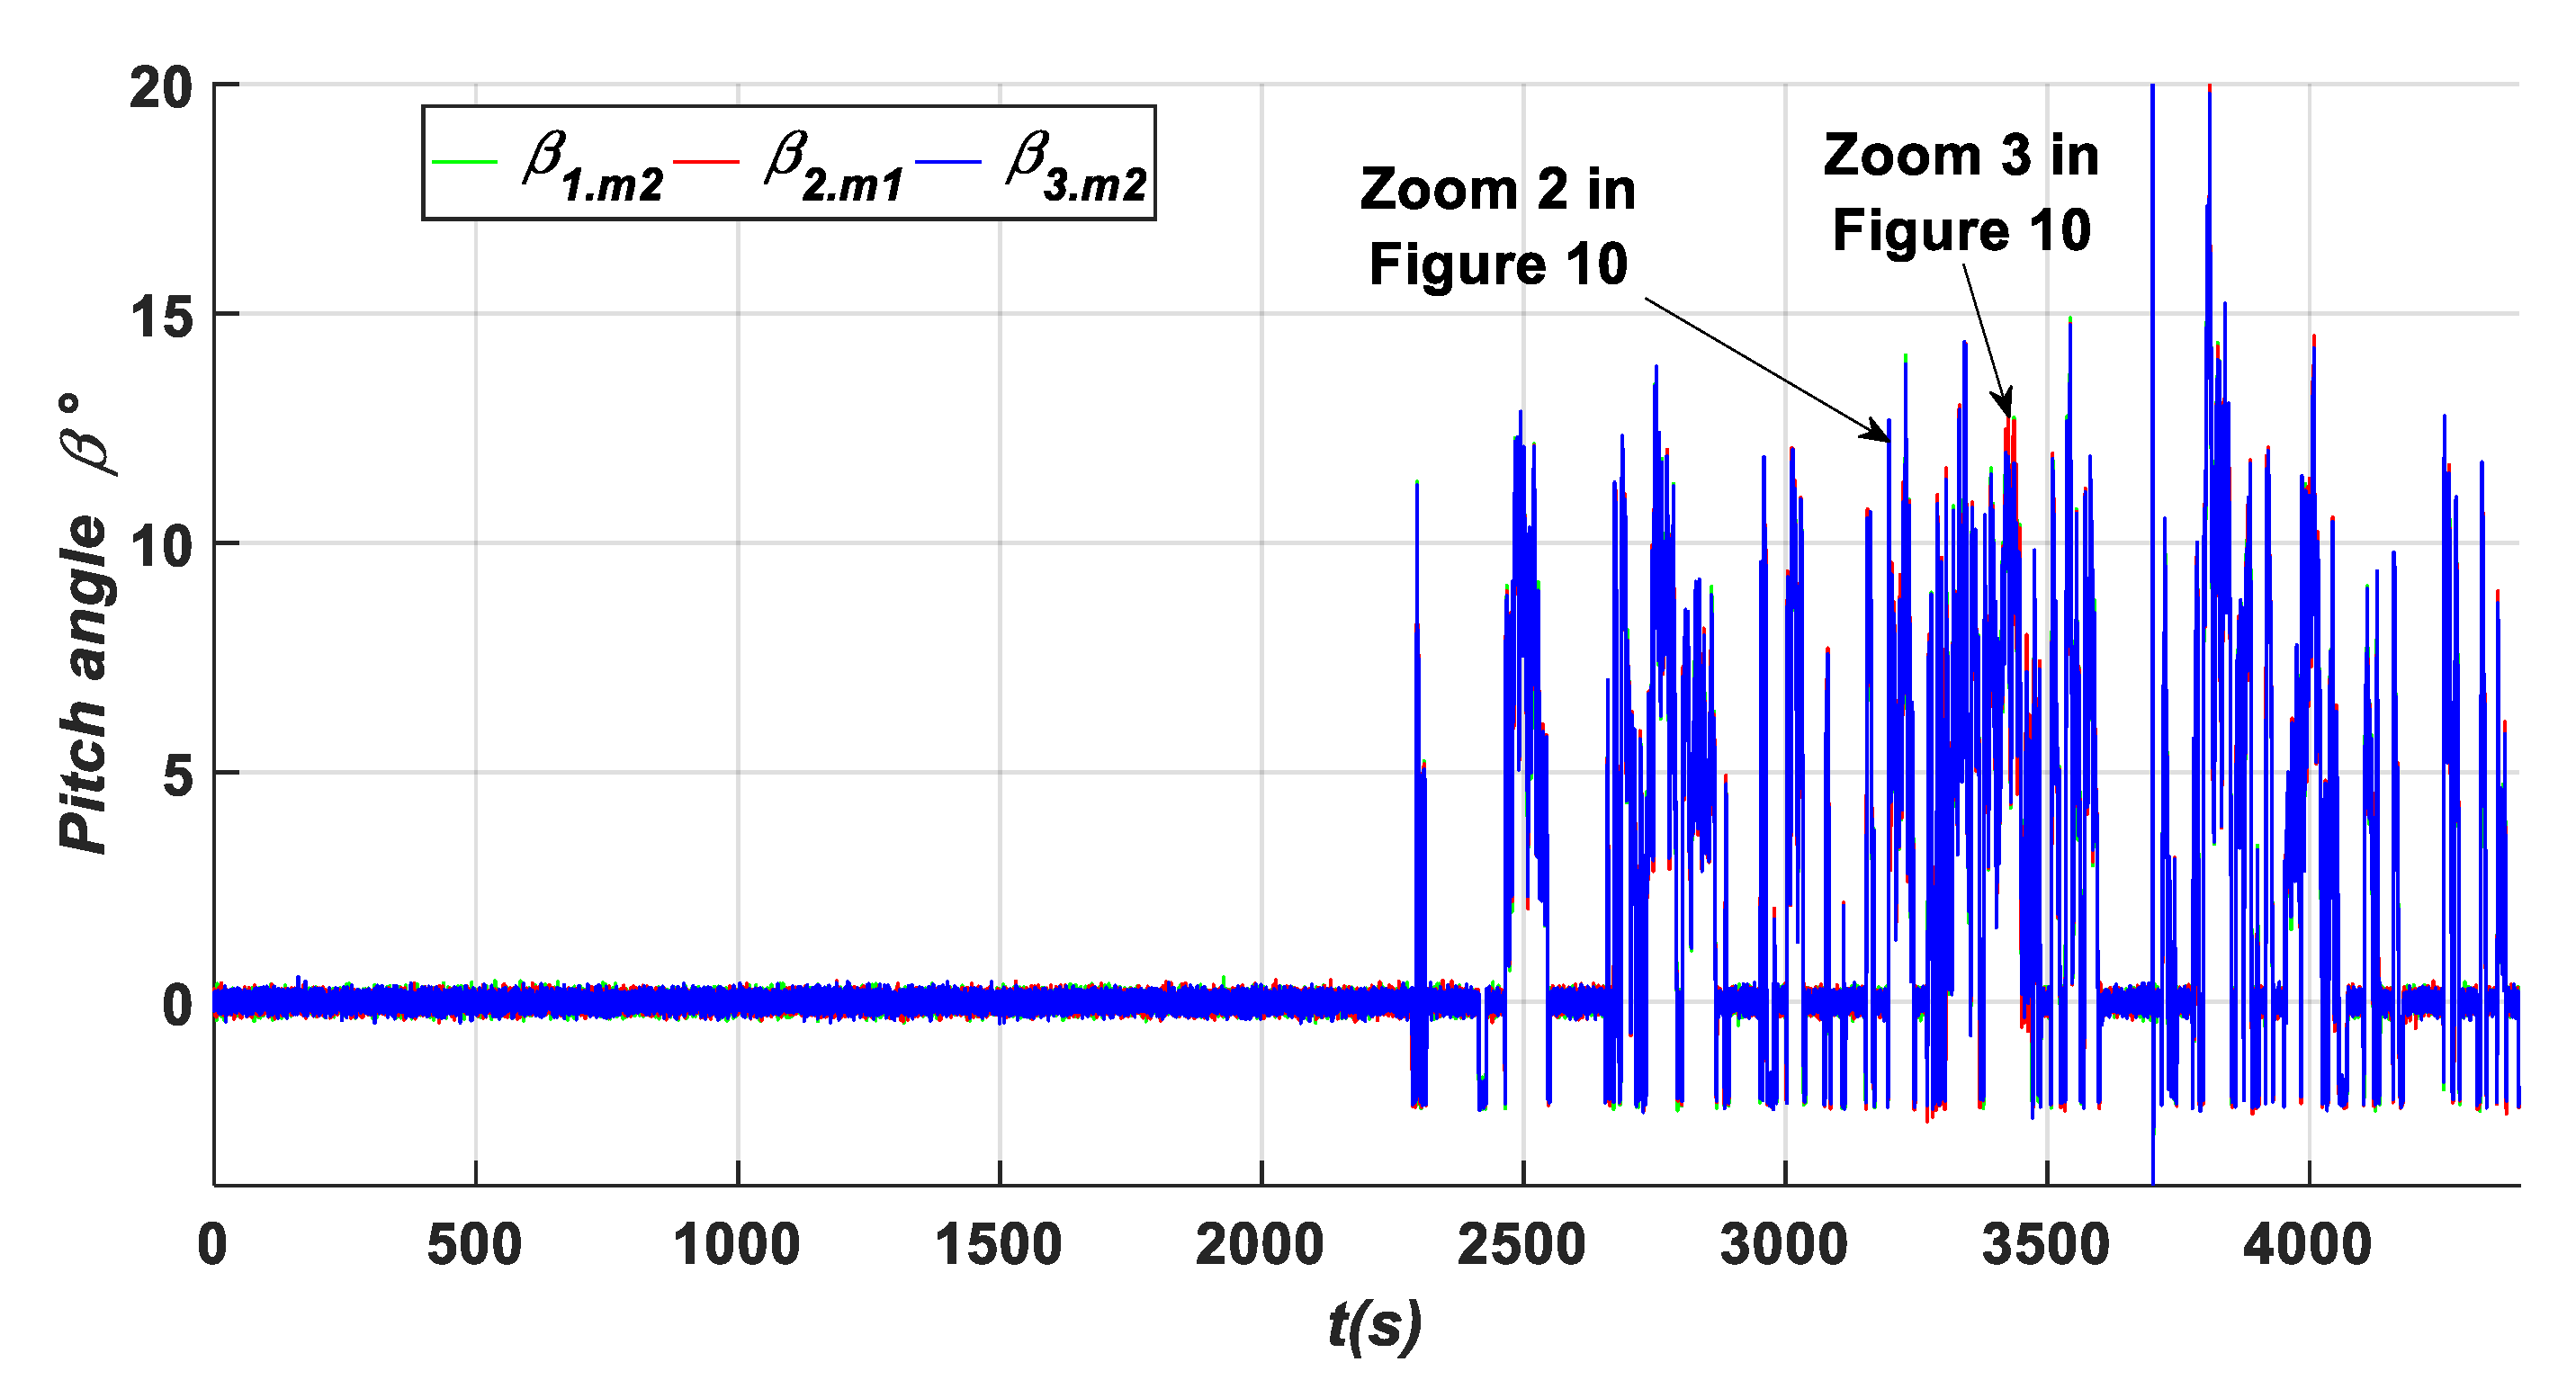
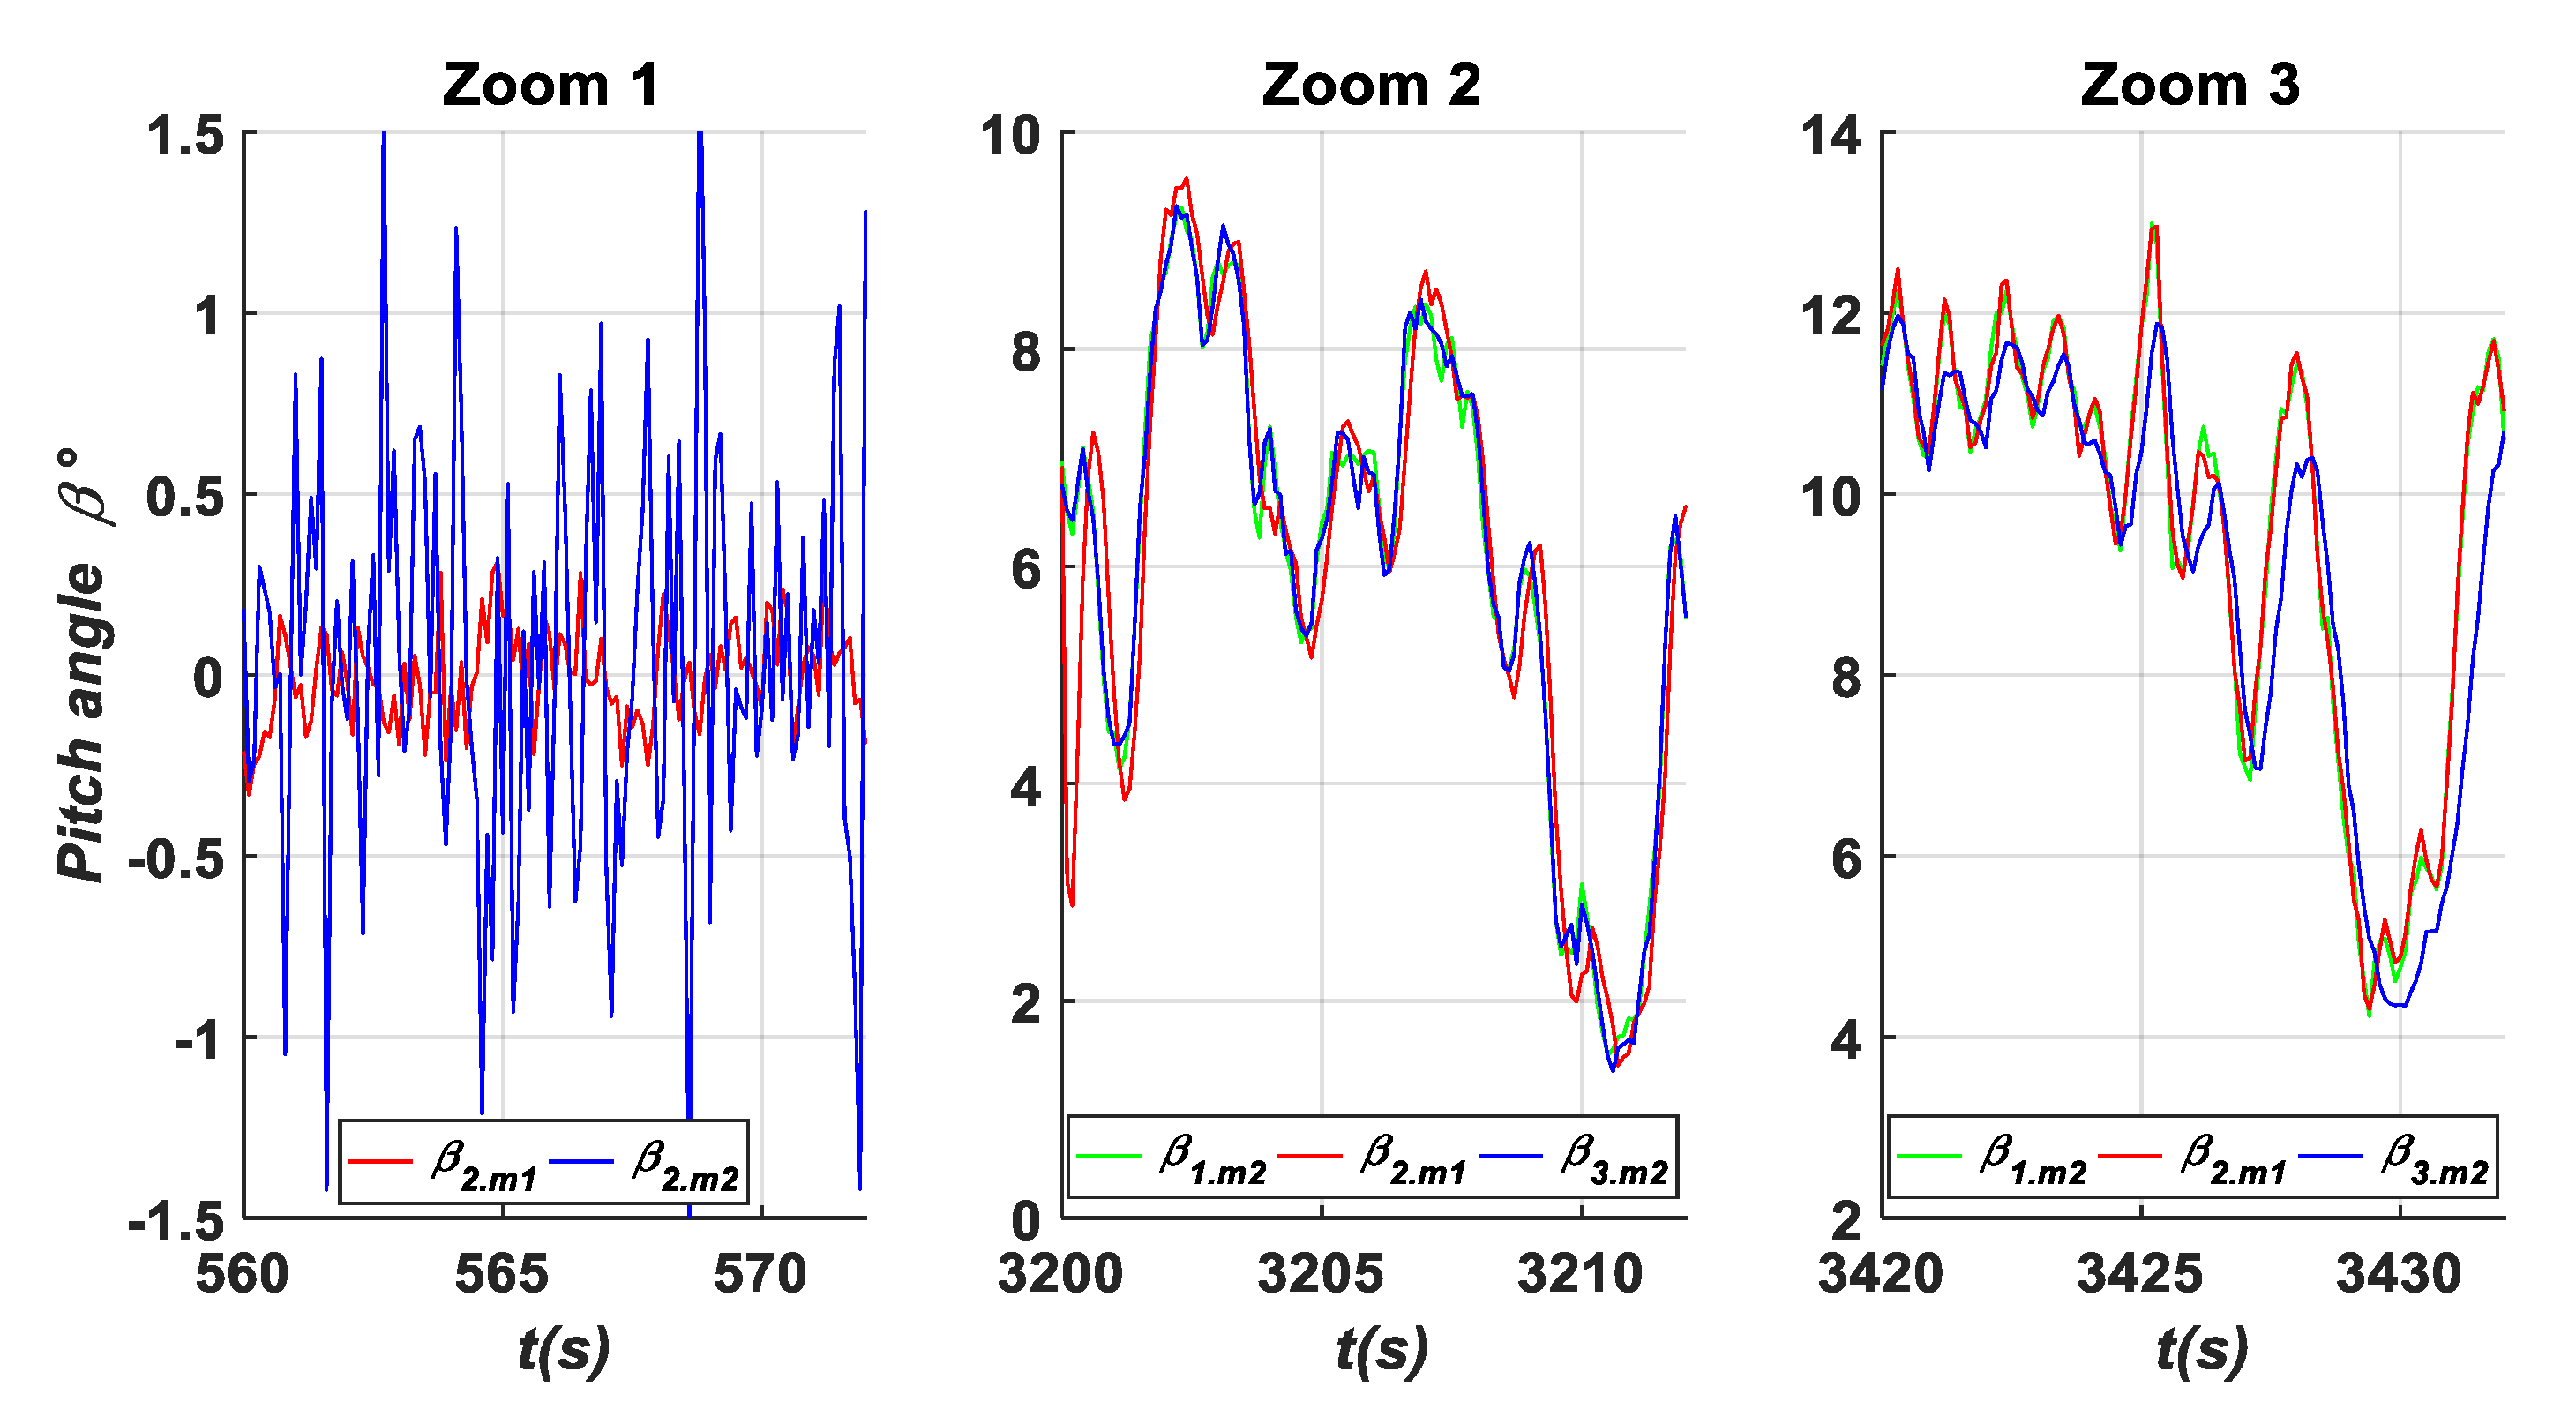
The proposed approach is applied to the benchmark model and is tested for the detection of faults in the sensors and actuators of the pitch angle wind turbine sub-systems. The fault scenarios used in this paper are based on the faults presented in Table 3, which are tested within the interval [0 to 4400 s], where the resulting output variables of the WT β1.m1, β2.m2, and β3.m1 are shown in Figure 6, Figure 7 and Figure 8, respectively. Figure 6 shows the measurements from the two sensors {β1.m1 and β1.m2} in the first actuator, Figure 7 shows the measurements from the two sensors {β2.m1 and β2.m2} in the second actuator, and Figure 8 shows the measurements from the sensors {β3.m1 and β3.m2} in the third actuator, and Figure 9 shows the measurements of {β1.m2, β2.m1, and β3.m2} in the three actuators. In addition, Figure 10 shows three zooms such as Zoom 1 which is related to Figure 7, and Zoom 2 and Zoom 3 which are related to Figure 9.
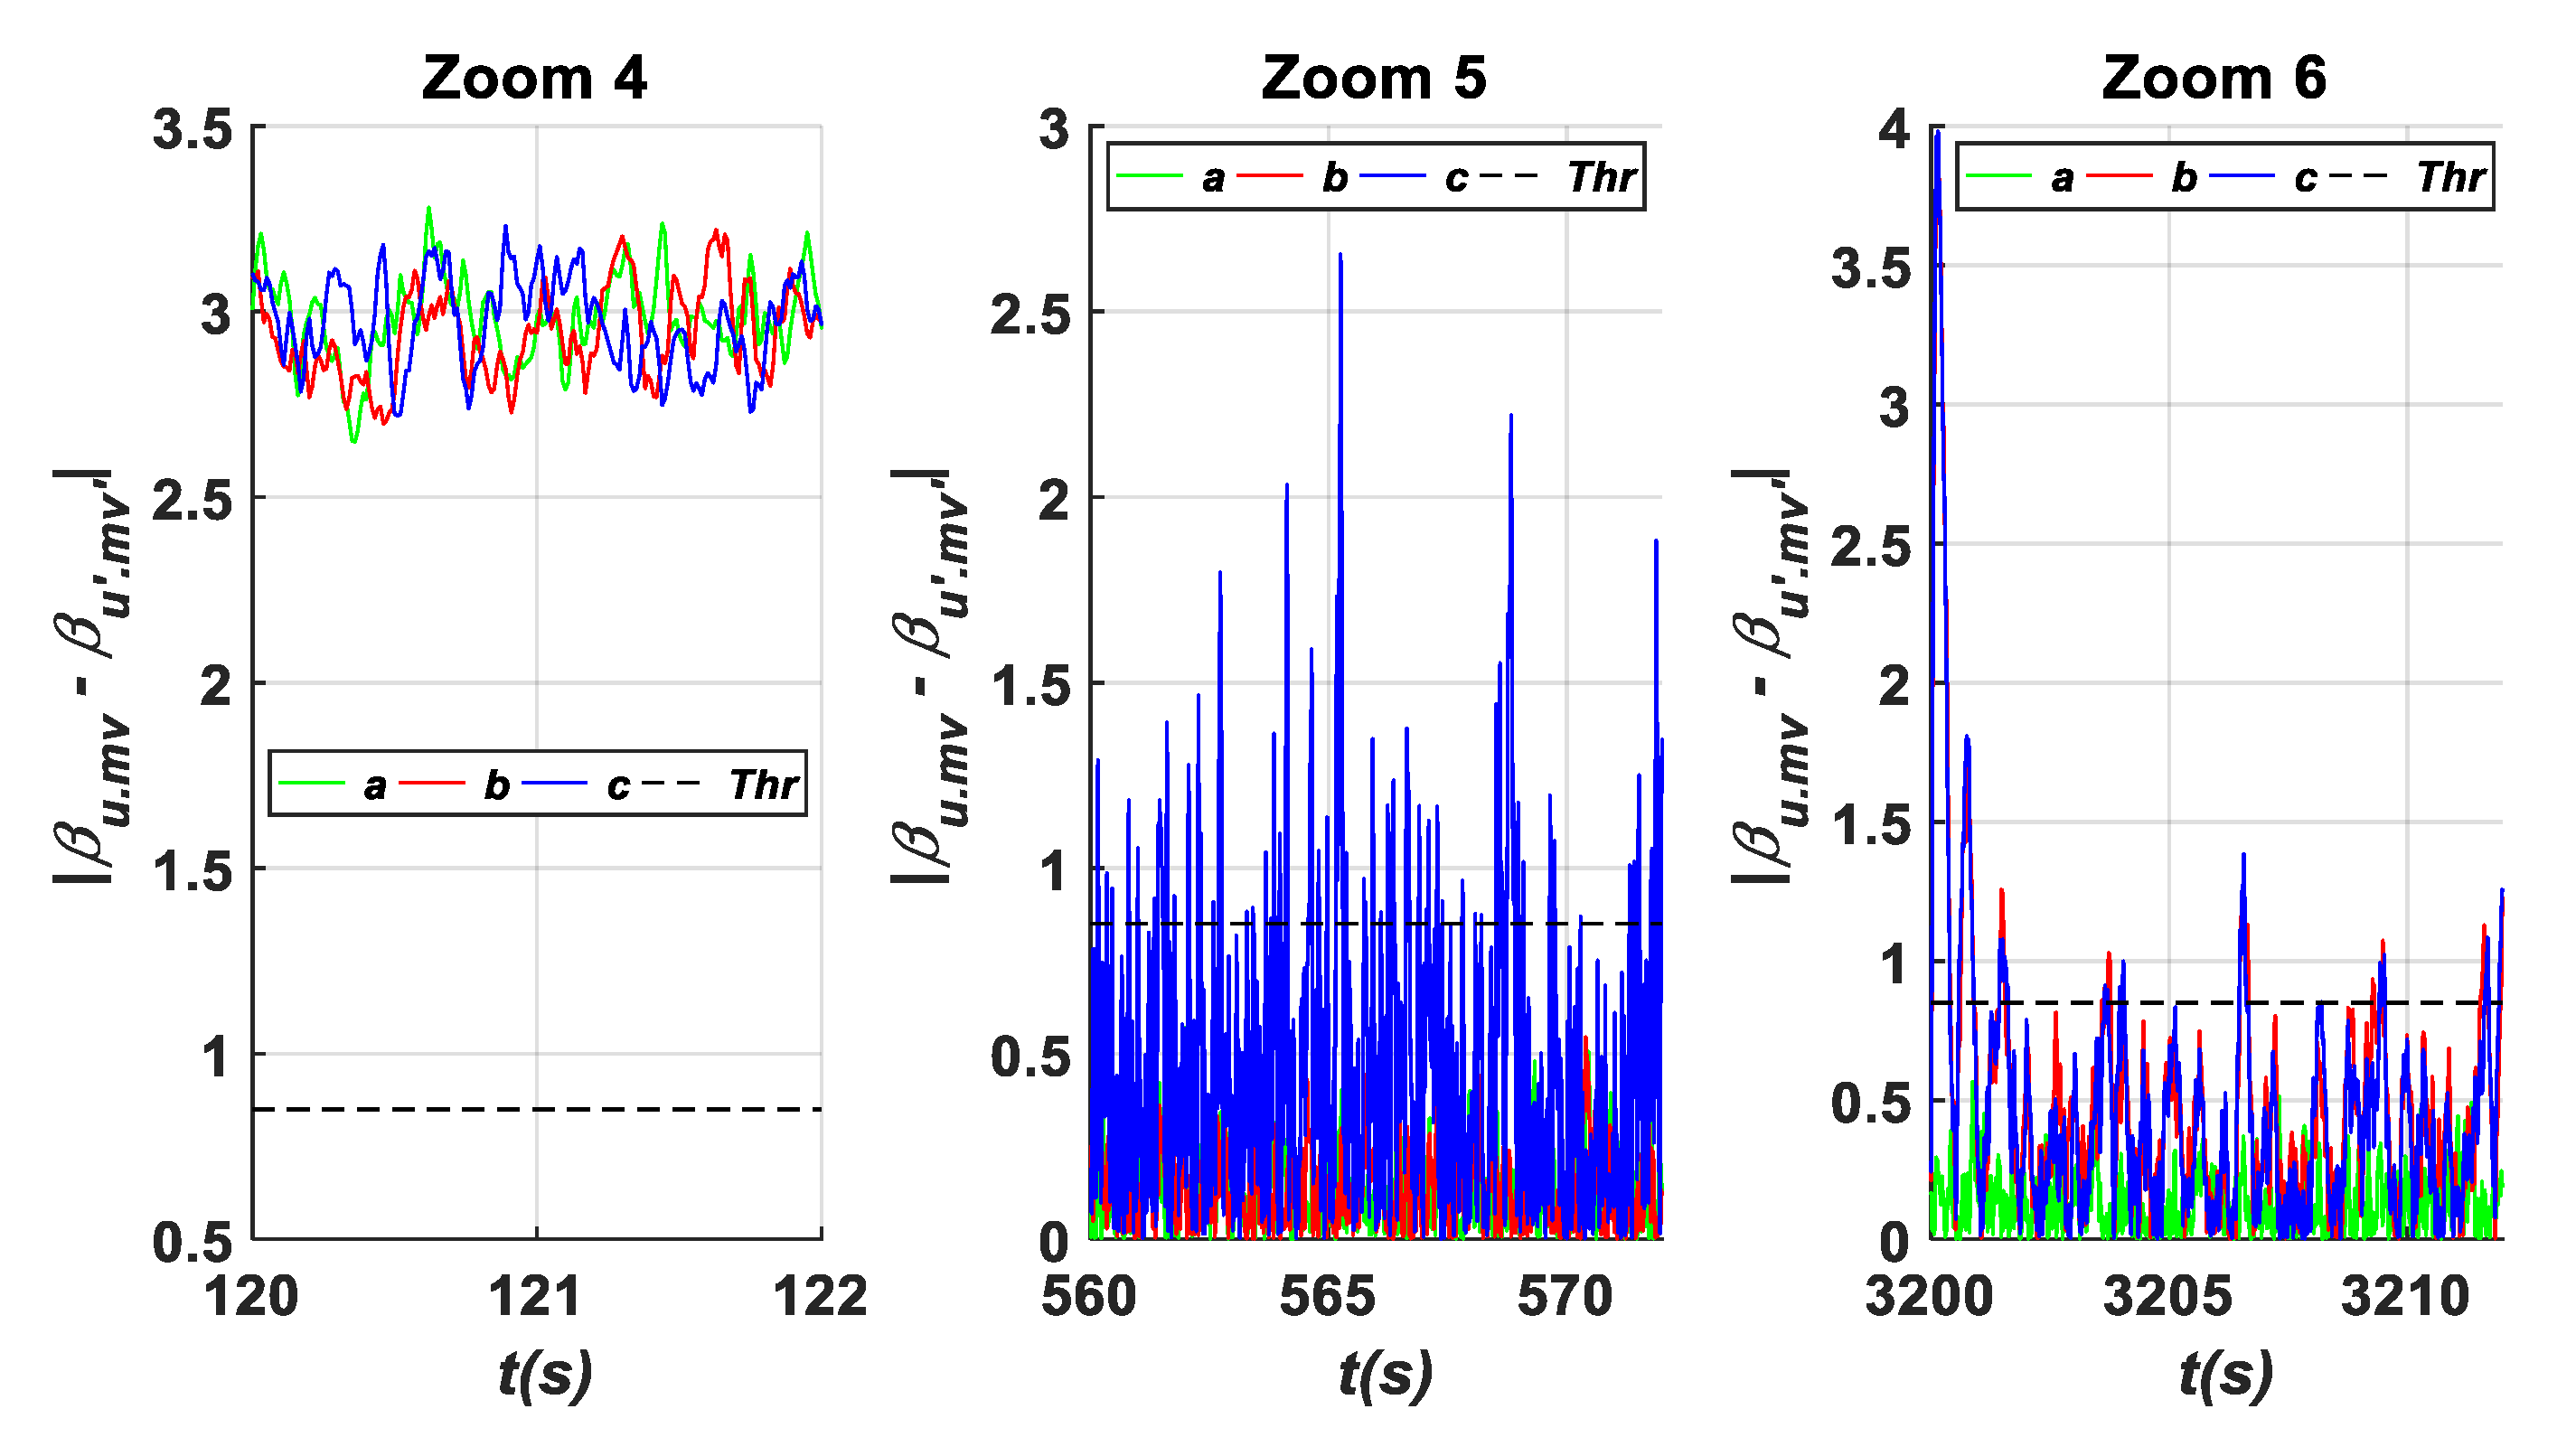
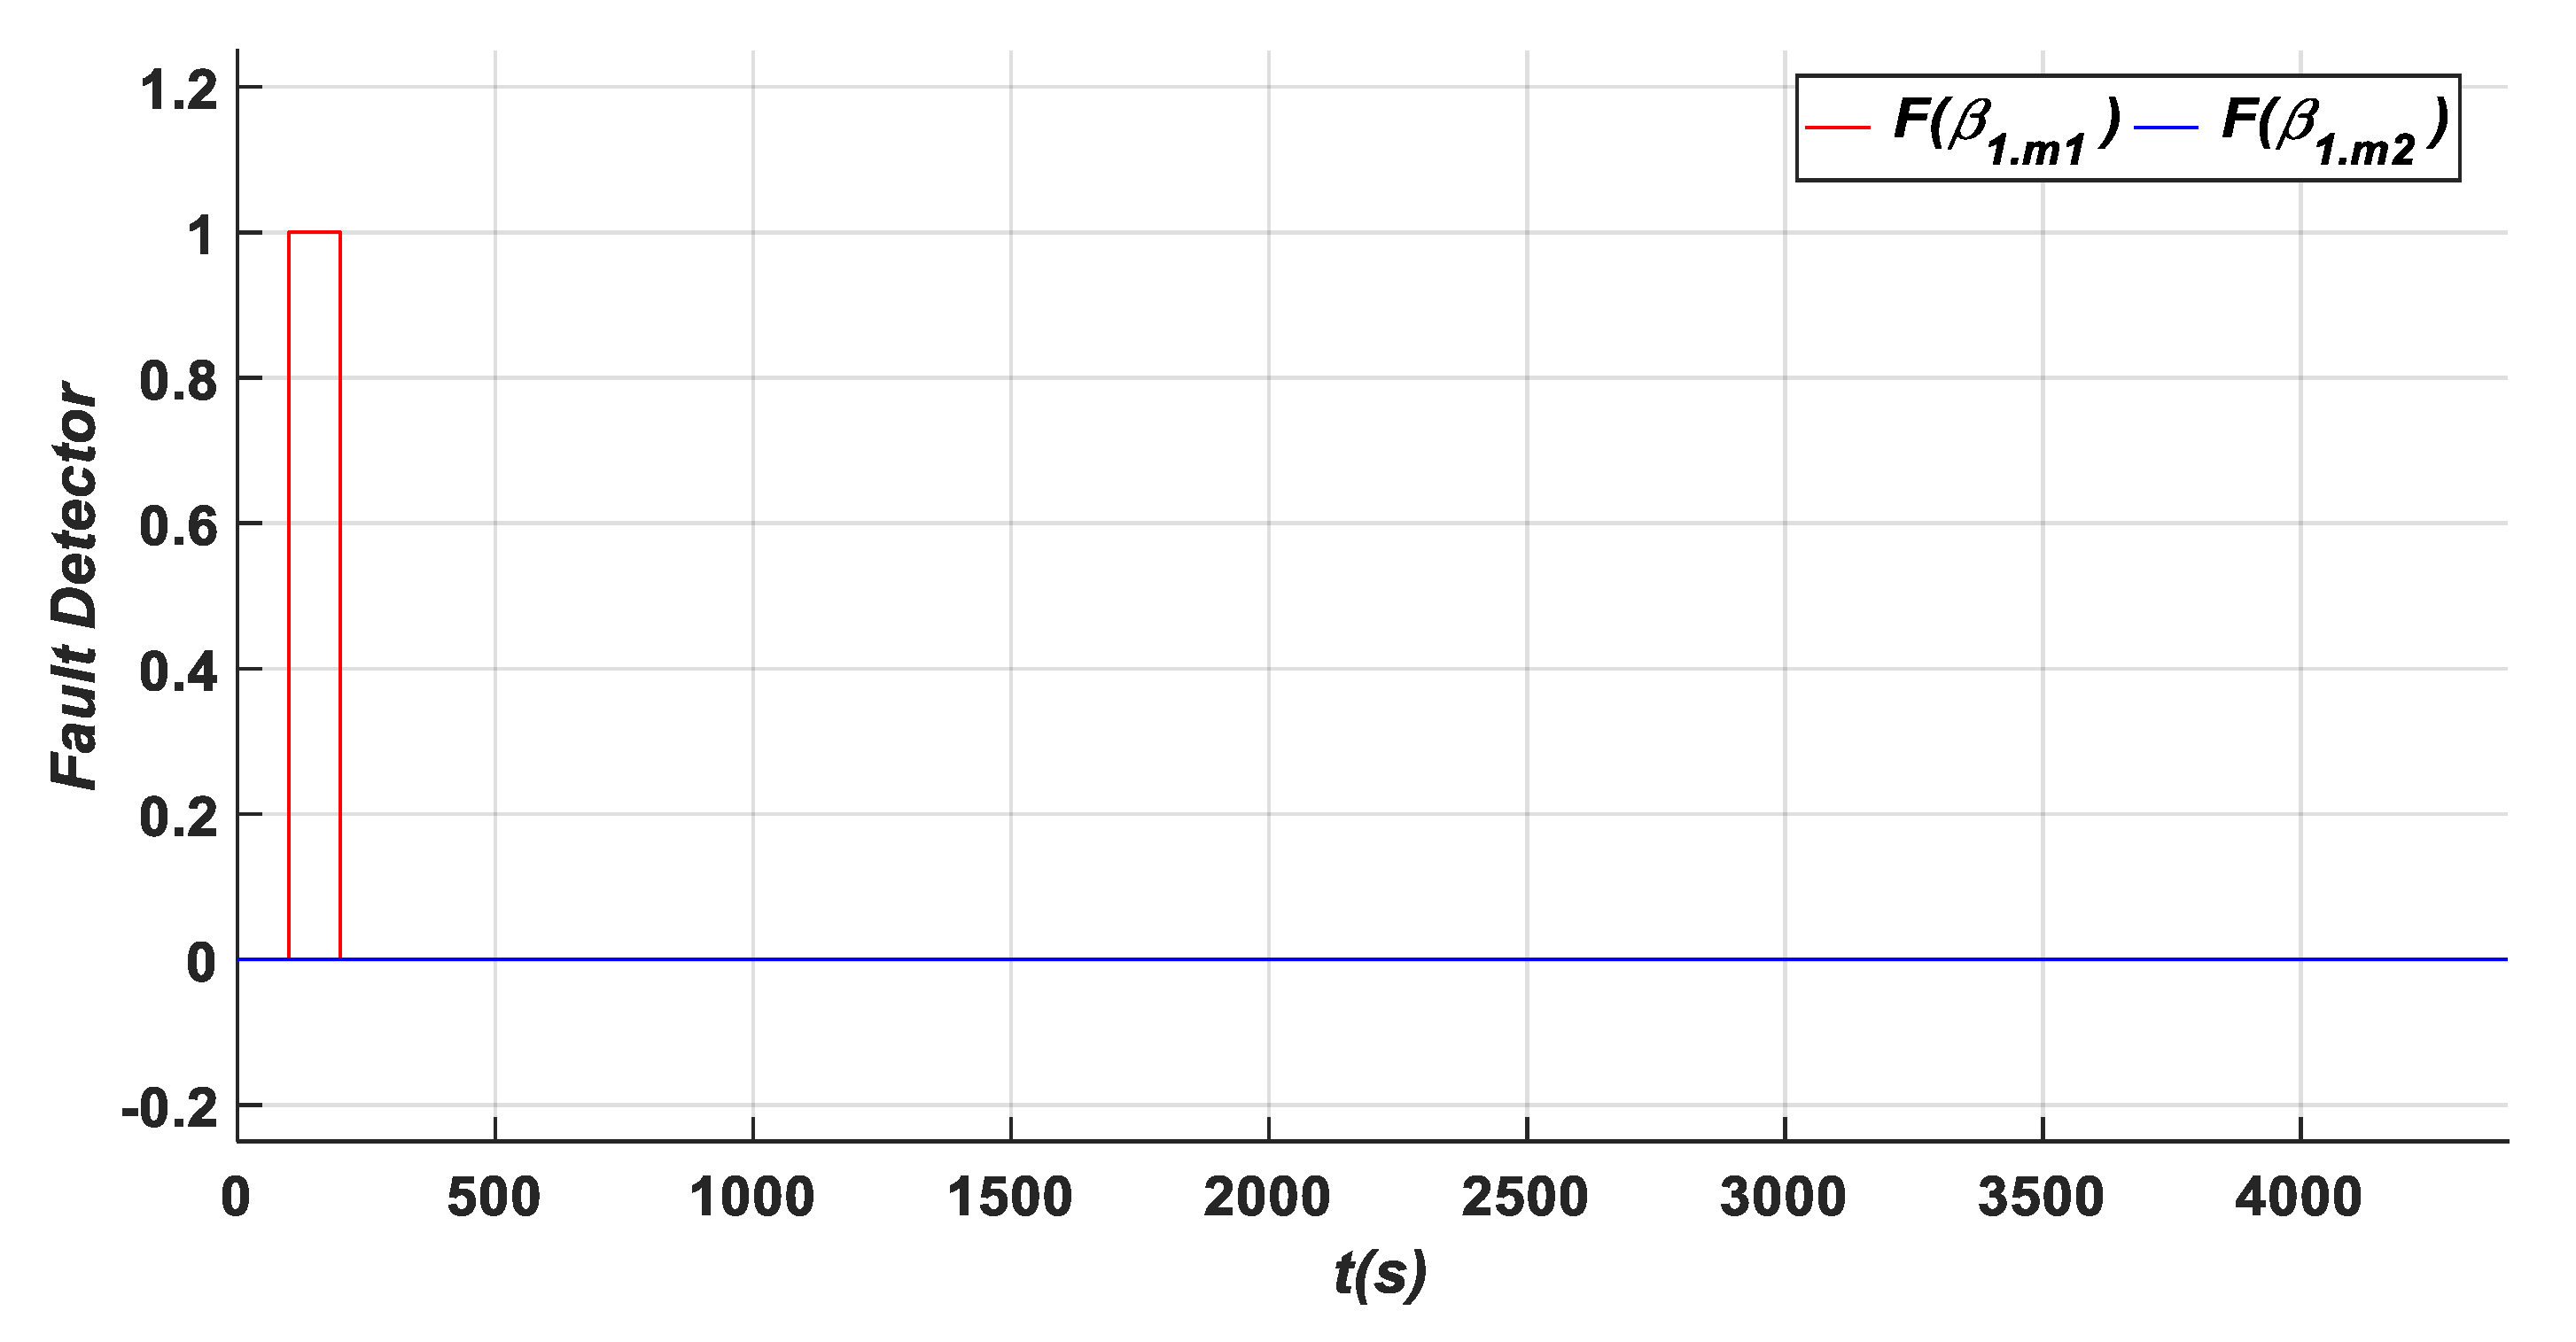
Figure 11 shows the residuals {a, b, and c} within the test range of time [0 to 4400 s], with the occurrence of the three fault types; fixed value (A1), gain factor (A2), and a hydraulic pressure drop (B3) within the intervals [100 s to 200 s], [500 s to 600 s], and [3200 s to 3300 s], respectively. It is clear that the magnitudes of the three residuals are affected by these three faults but with different levels. Indeed, to have a deep investigation, Figure 12 illustrates the different zooms related to the three residuals {a, b, and c}, Zoom 4 shows the variation in the residuals {a, b, and c} under the occurrence of the fixed value fault type (A1) in the first sensors of the first pitch angle sub-system β1.m1 which has a magnitude of (−3°), and Zoom 5 shows the variation in the residuals {a, b, and c} under the occurrence of the gain factor fault type (A2) in the second sensor of the second pitch angle sub-system β2.m2, where it can be seen clearly that the residual {c} is the highest reaching the value of 2.3, and which exceeds the predefined fixed detection threshold. Zoom 6 shows the variation in the residuals {a, b and c} under the occurrence of the hydraulic pressure drop fault type (B3) related to the actuator of the second pitch angle sub-system β2 over the time interval of [3200 s, 3300 s]. It can be seen clearly in this zoom area that the two residuals {a, and b} reach the value of 3.9 that exceeds predefined the detection threshold. Furthermore, Figure 13 illustrates the fault detection signals of the sensors of the first pitch angle sub-system F(β1.m1) and F(β1.m2), where it can be noted that F(β1.m1) has a value of one during the fault occurrence, indicating that the first sensors of the first pitch angle sub-system is faulty, whereas the second sensor is healthy as its corresponding fault detection signal F(β1.m2) remains equal to zero. Besides this, a closer observation of the appearance of the fault detection signal relative to the instant of fault occurrence allows for extracting the time detection which is TD = 0.02 s, indicating the effectiveness of the proposed approach in this paper in detecting the faults within a very short detection time.
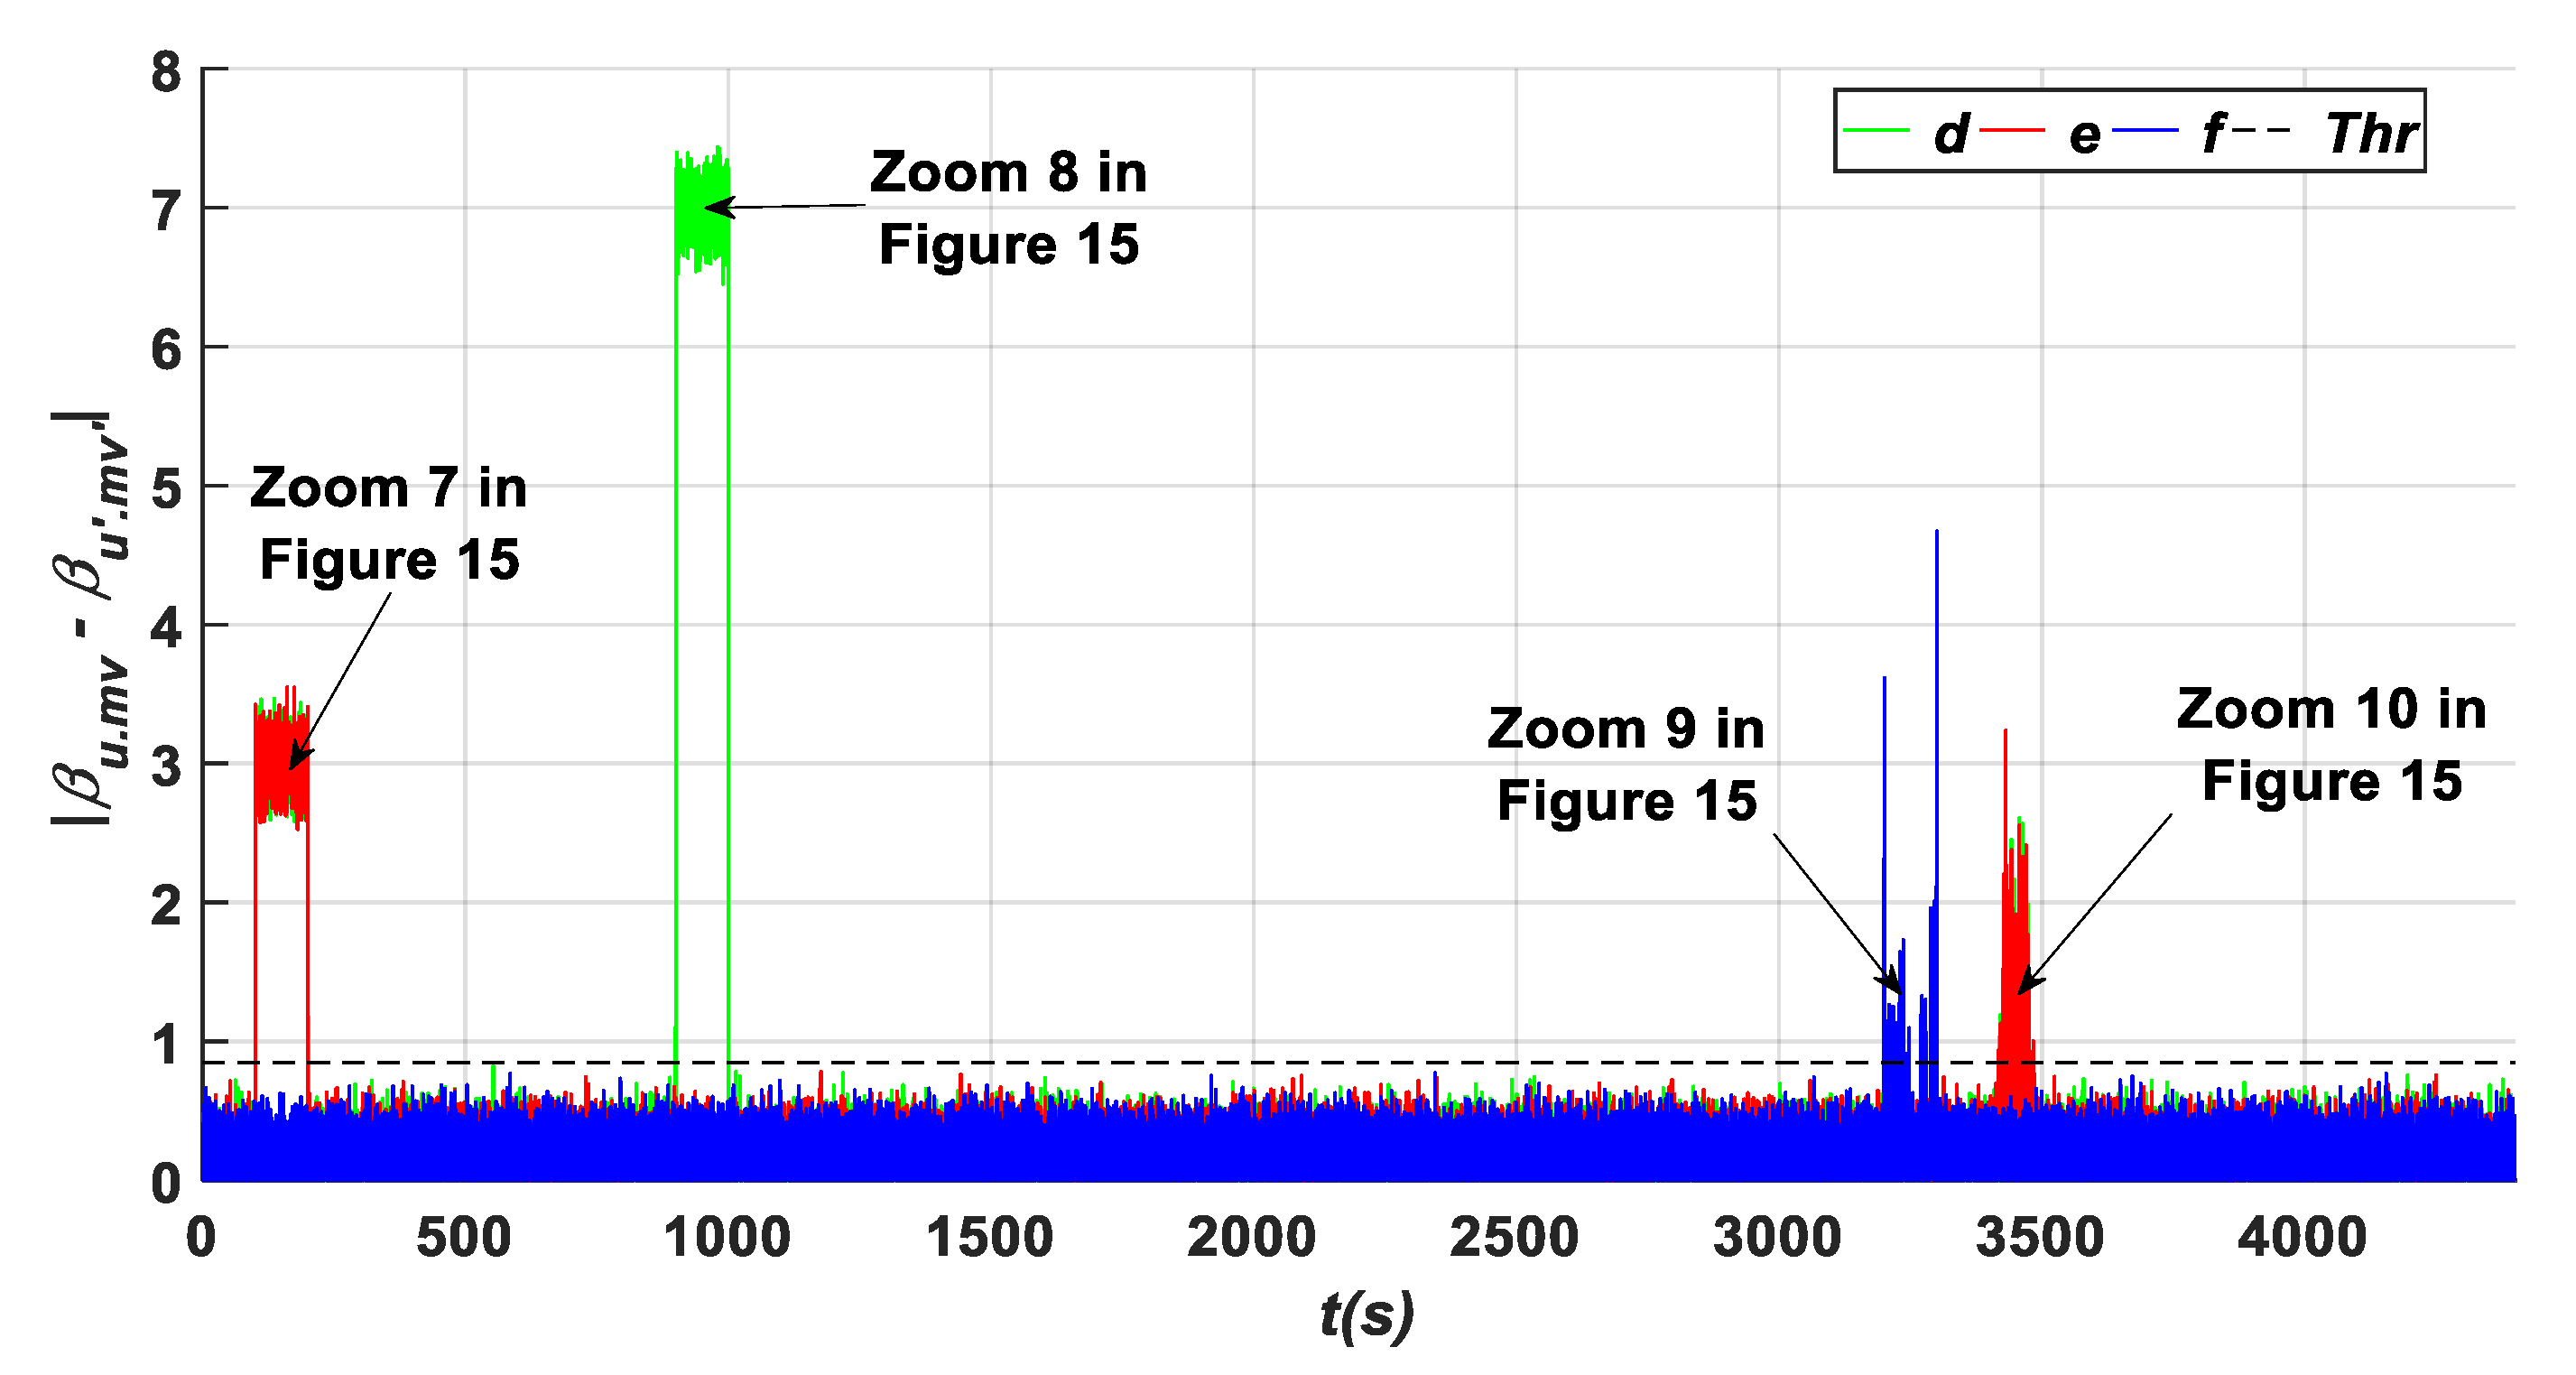
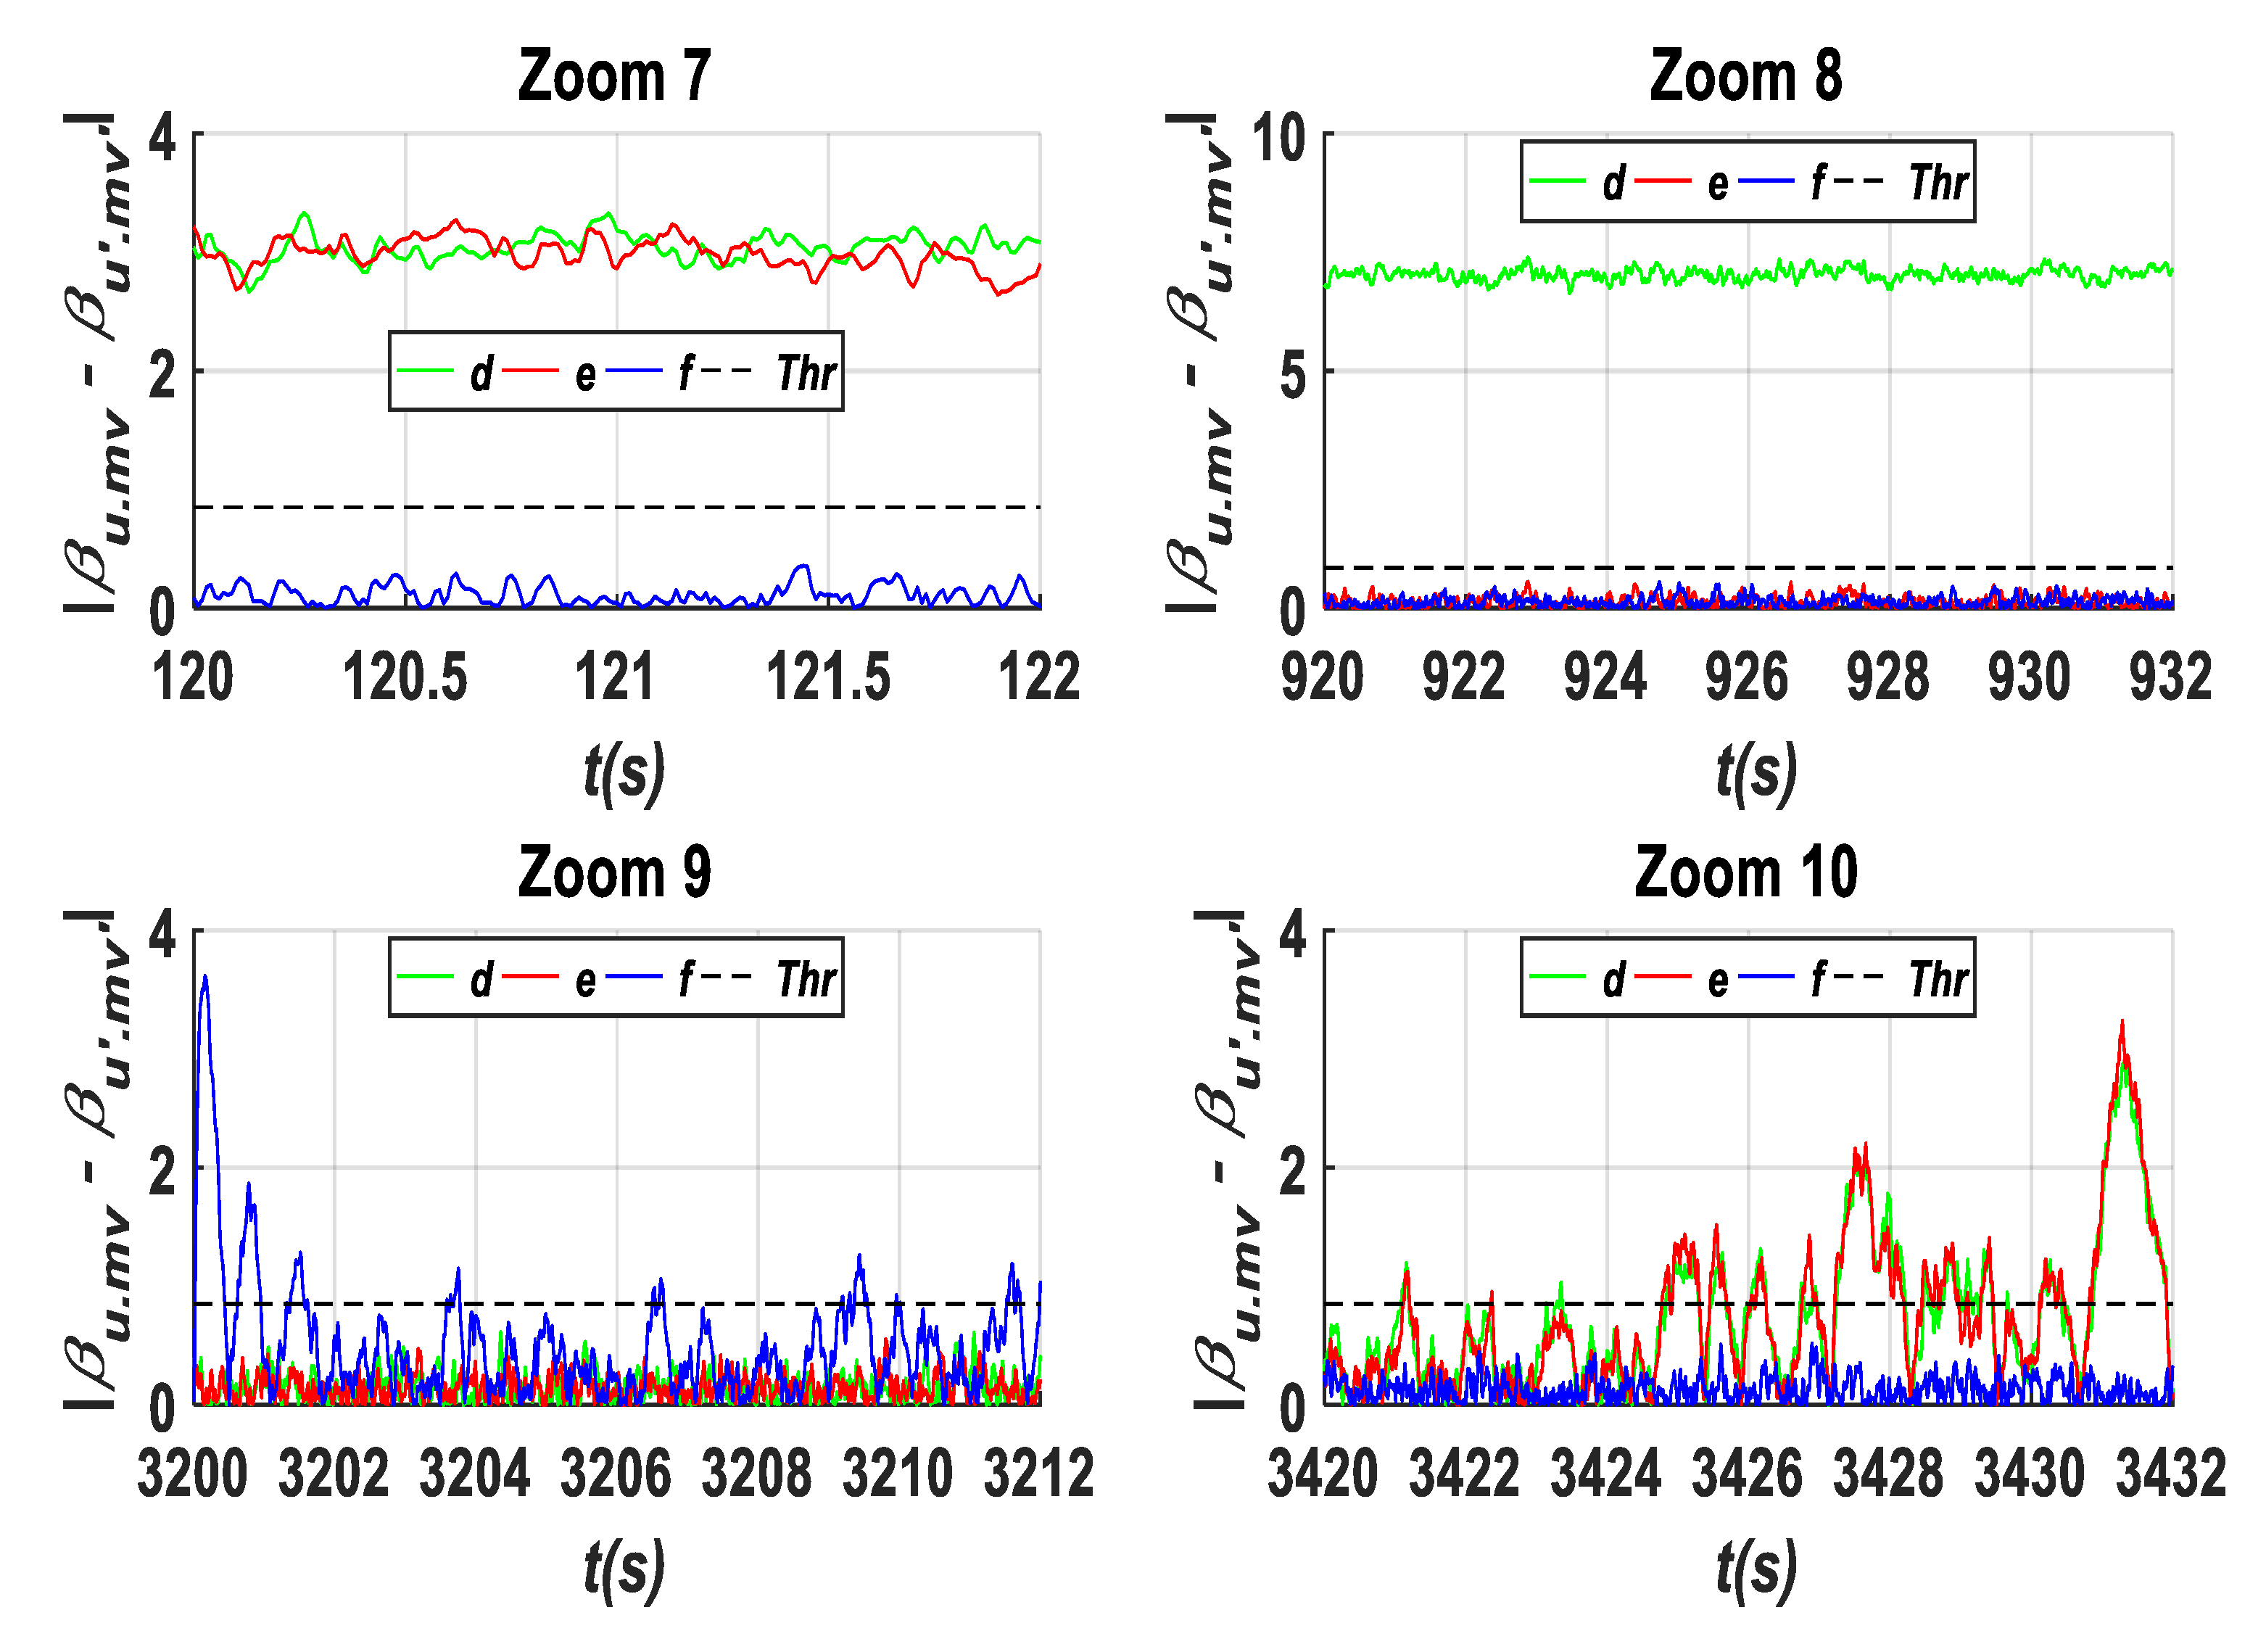
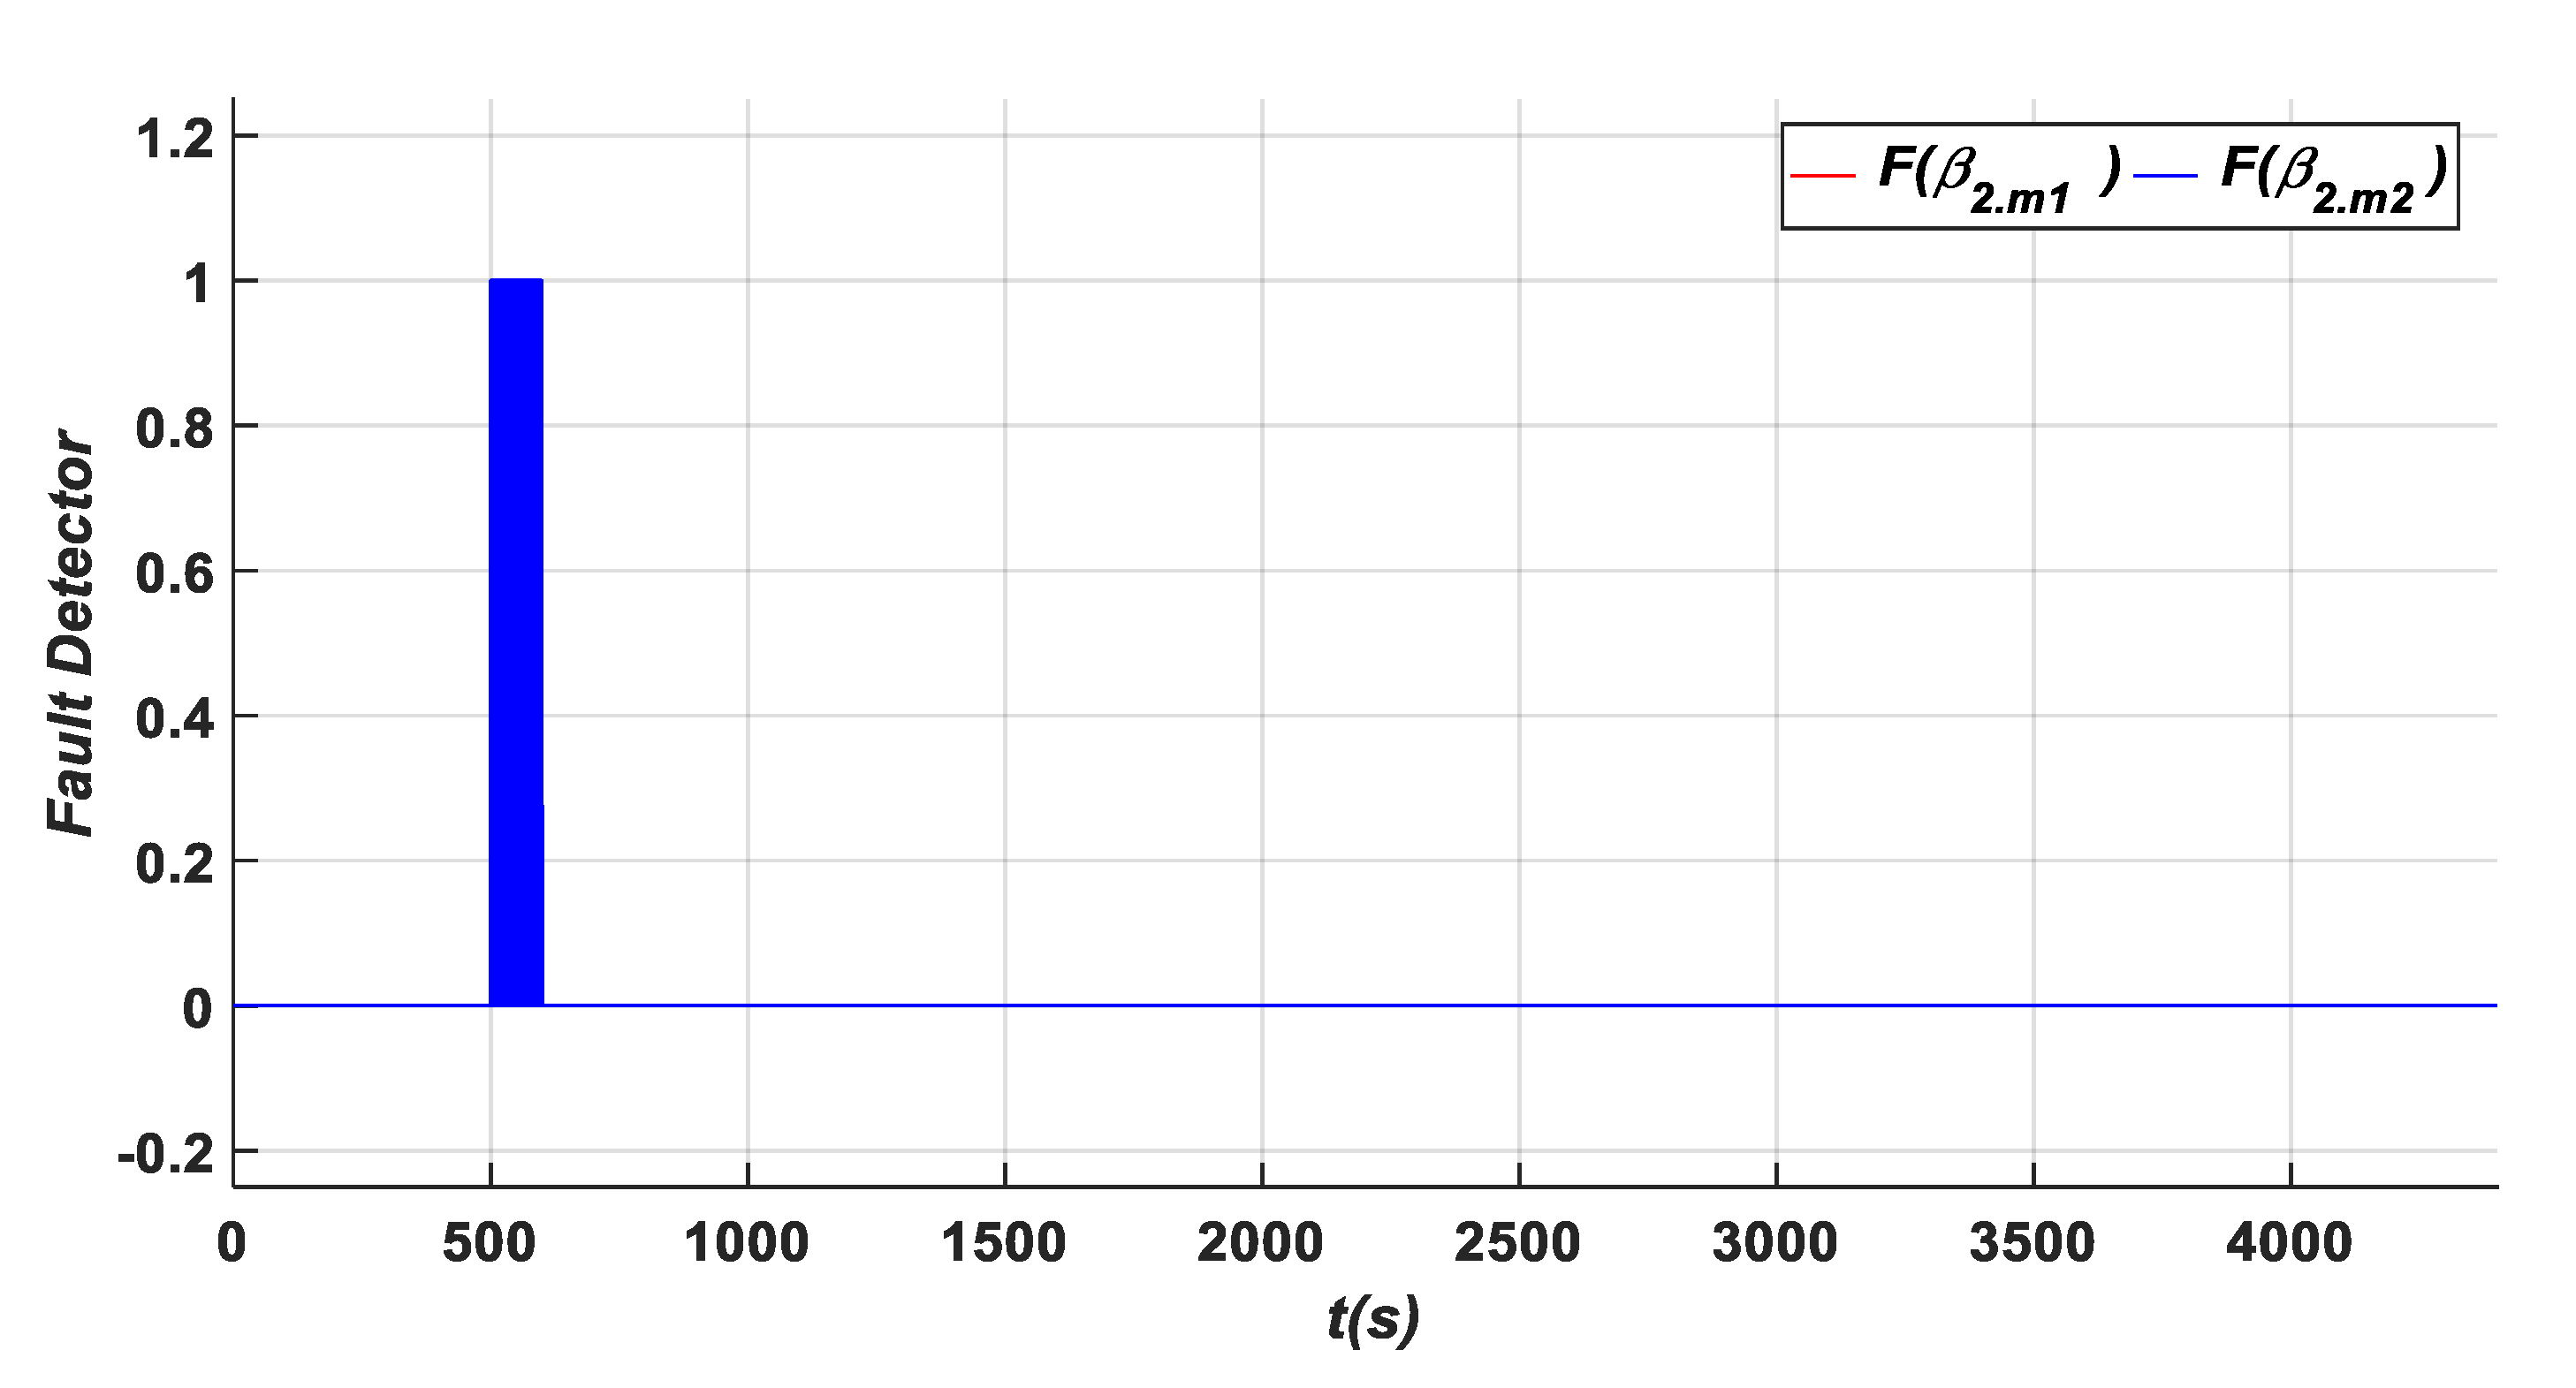
Figure 14 shows the variation in the residues {d, e, and f} used for the detection and location of the four types of faults such as fixed value (A1), gain factor (A2), the appearance of a hydraulic pressure drop (B3), and the increase in the air content in the oil (B4) in the second pitch angle sub-system sensor. Zoom 7 of Figure 15 shows the variation in these residuals {d, e, and f} under the occurrence of the fixed value fault type (A1) in the first sensor of the first pitch angle sub-system (β1.m1) with a value equal to (−3°). Zoom 8 elucidates the variation in the residues {d, e, and f} under the occurrence of the fixed value fault type (A1) in the first sensor of the third pitch angle sub-system (β3.m1) with a value equal to (7°). Zoom 9 presents the variation in the residuals {d, e, and f} under the occurrence of the hydraulic pressure drop which presents a changed dynamics fault type (B3) in the actuator of the second pitch angle sub-system (β2). Zoom 10 illustrates the variation in the residuals {d, e, and f} under the occurrence of an increase in the air content in the oil which presents a changed dynamics fault type (B4) in the actuator of the third pitch angle sub-system (β3). Moreover, Figure 16 shows the fault detection signals of the sensors of the second pitch angle actuator, with the fault detection signal F (β2.m2) and a detection time of TD = 0.08 s.
Moreover, Figure 16 shows the fault detection signals of the sensors of the second pitch angle sub-system F(β2.m1) and F(β2.m2), where it can be noted that F(β2.m2) has a value of one during the fault occurrence indicating that the second sensor of the second pitch angle sub-system is faulty, whereas the first sensor is healthy as its corresponding fault detection signal F(β2.m1) remains equal to zero. Indeed, a deep observation of the appearance of the fault detection signal relative to the instant of the fault occurrence allows for extracting the time of detection which is TD = 0.08 s, indicating once more the effectiveness of the proposed approach in this paper in detecting the faults within a very short detection time.
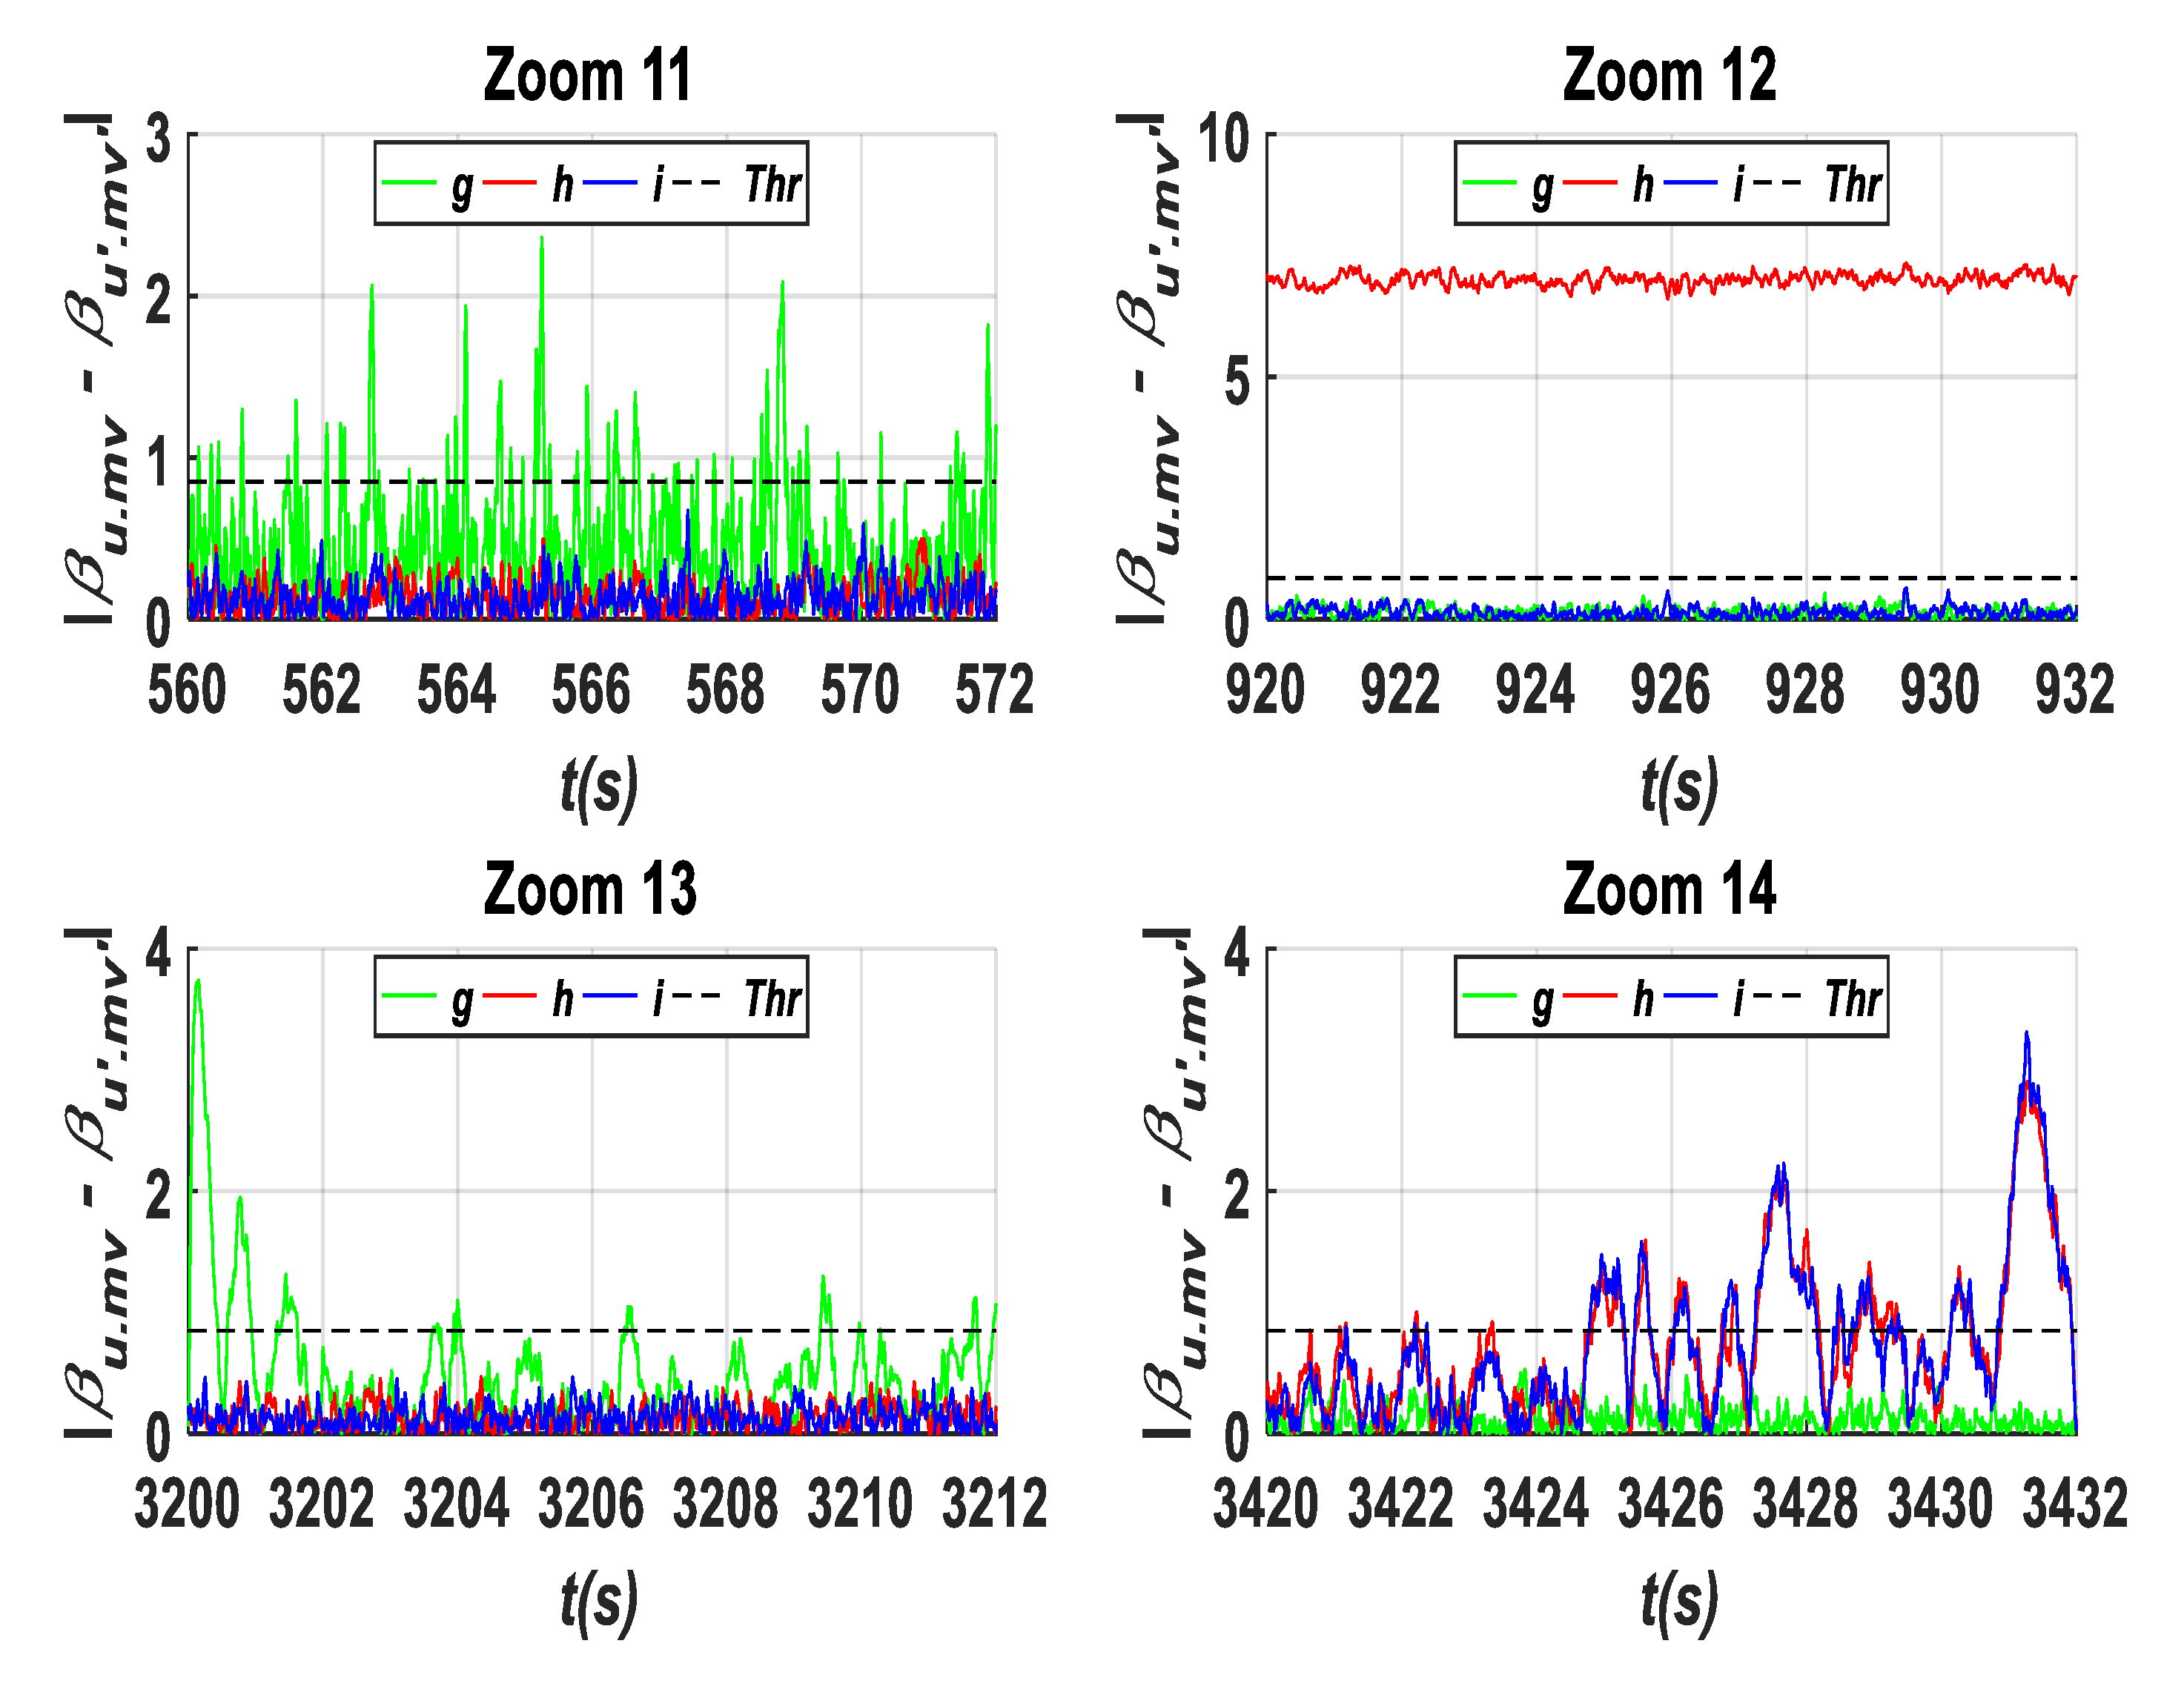
The results presented in Figure 17 show the variation in the residuals {g, h, and i} obtained under the effects of the four fault types such as gain factor (A2), fixed value (A1), the appearance of a hydraulic pressure drop (B3), and the increase in the air content in the oil (B4) in the actuator of the third pitch angle sub-system (β3). To ensure accurate investigations of these results, a zoom is taken at each fault occurrence time interval. Zoom 11 of Figure 18 shows clearly the residuals {g, h, and i} under the presence of a gain factor fault type (A2) in the second sensor of the second pitch angle sub-system (β2.m2) within the time interval [500 s to 600 s], where it can be observed that the residual {g} exceeds the predefined threshold due to the presence of this fault type in the sensor. Zoom 12 of Figure 18 presents {g, h, and i} under the presence of a fixed value fault type (A1) in the first sensor of the third pitch angle sub-system (β3.m1) within the time interval [900 s to 1000 s], where it can be noted that the residual {h} exceeds the predefined threshold due to the presence of this fault type in the sensor with an average value of 7°. Zoom 13 of Figure 18 illustrates the residuals {g, h, and i} under the presence of a hydraulic pressure drop fault type (B3) in the actuator of the second pitch angle sub-system (β2) within the time interval [900 s to 1000 s], where it can be observed that the residual {g} exceeds the predefined threshold due to the presence of this fault type in the actuator; this exceedance is notable at the beginning of the fault’s appearance; however, it is less remarkable throughout the remainder of the fault’s duration. Zoom 14 of Figure 18 presents the residuals {g, h, and i} under a fault type of an increase in the air content in the oil (B4) in the 3rd actuator (β3) within the time interval [3400 s to 3500 s], where it can be observed that the residuals {h, and i} exceeds the predefined threshold due to the presence of this fault type in the actuator; this overtaking of these residuals increase with the lasting of the fault time which means that this type should be removed immediately to prevent its amplification along the fault time increase. Finally, Figure 19 shows the fault detection signals of the sensors of the third pitch angle actuator, with the verification of criterion F (β3.m1) and the detection time of TD = 0.01 s.
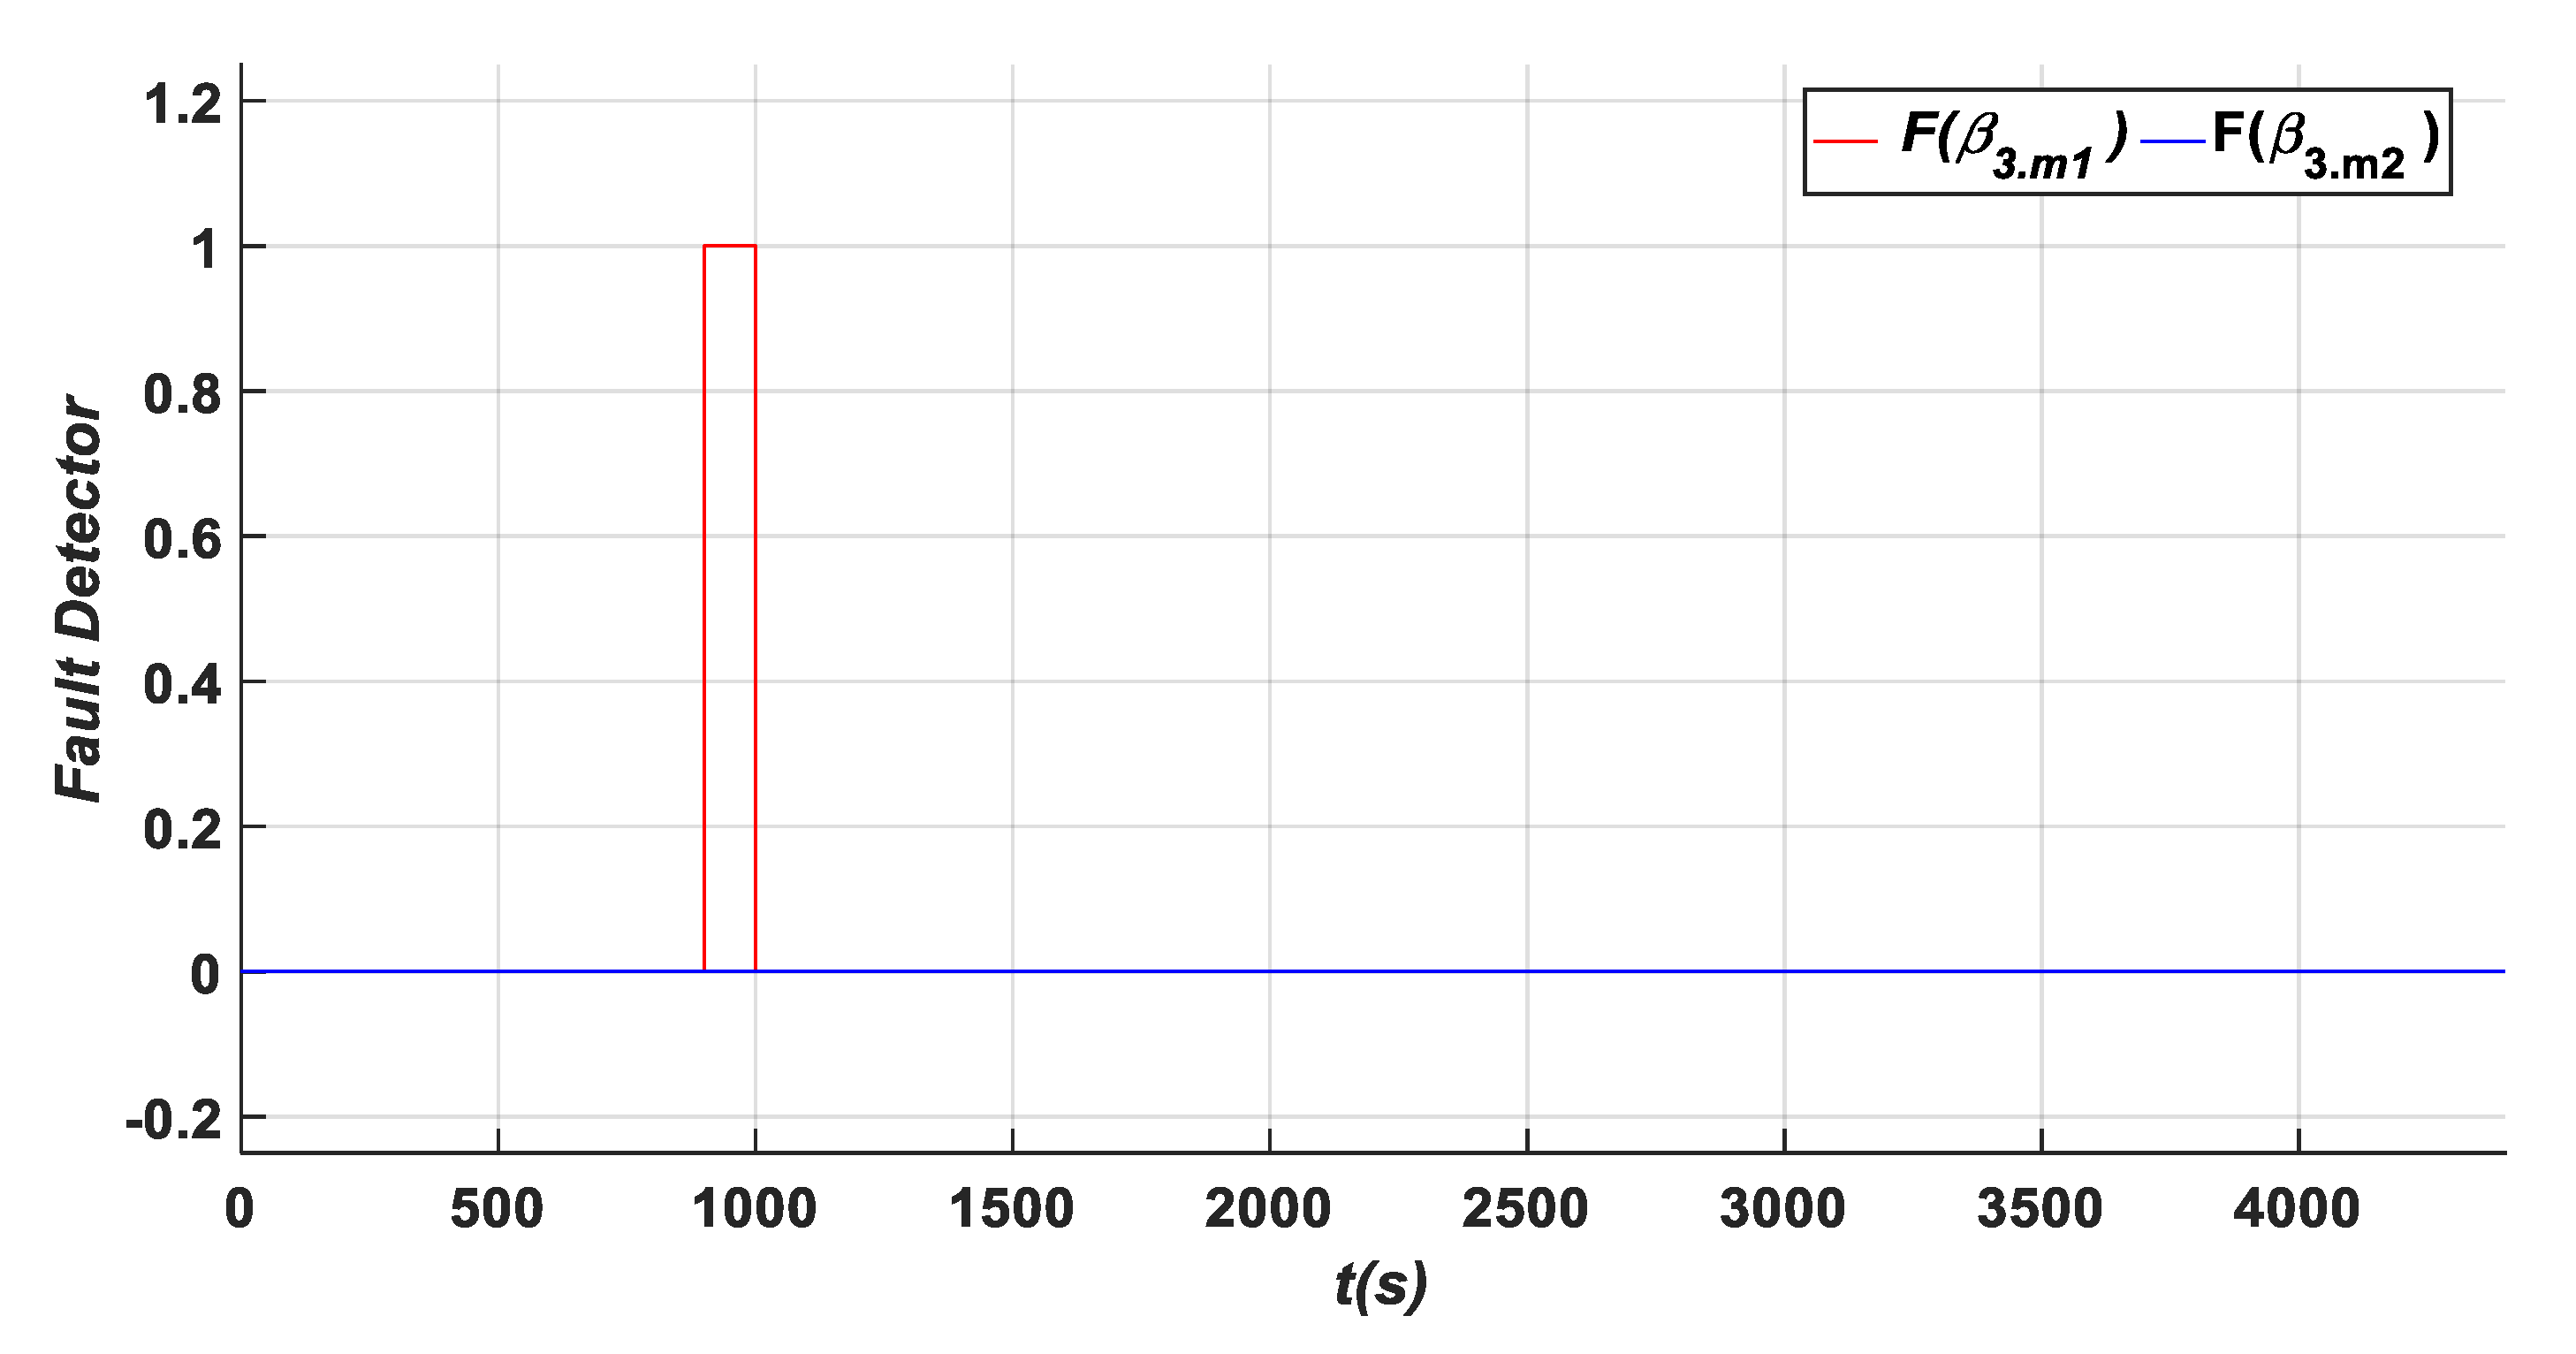
Figure 19 shows the fault detection signals resulting from the sensors in the third pitch angle sub-system F(β3.m1) and F(β3.m2) where it can be confirmed that F(β3.m1) has a value of 1 during the fault occurrence, indicating that the first sensor of the third pitch angle sub-system is faulty, whereas the second sensor is healthy as its corresponding fault detection signal F(β3.m2) remains equal to zero. Indeed, a deep observation of the appearance of the fault detection signal relative to the instant of fault occurrence allows the determination of the time of detection which is TD = 0.01 s, indicating once more the effectiveness of the proposed approach in this paper in detecting different faults within a very short detection time.
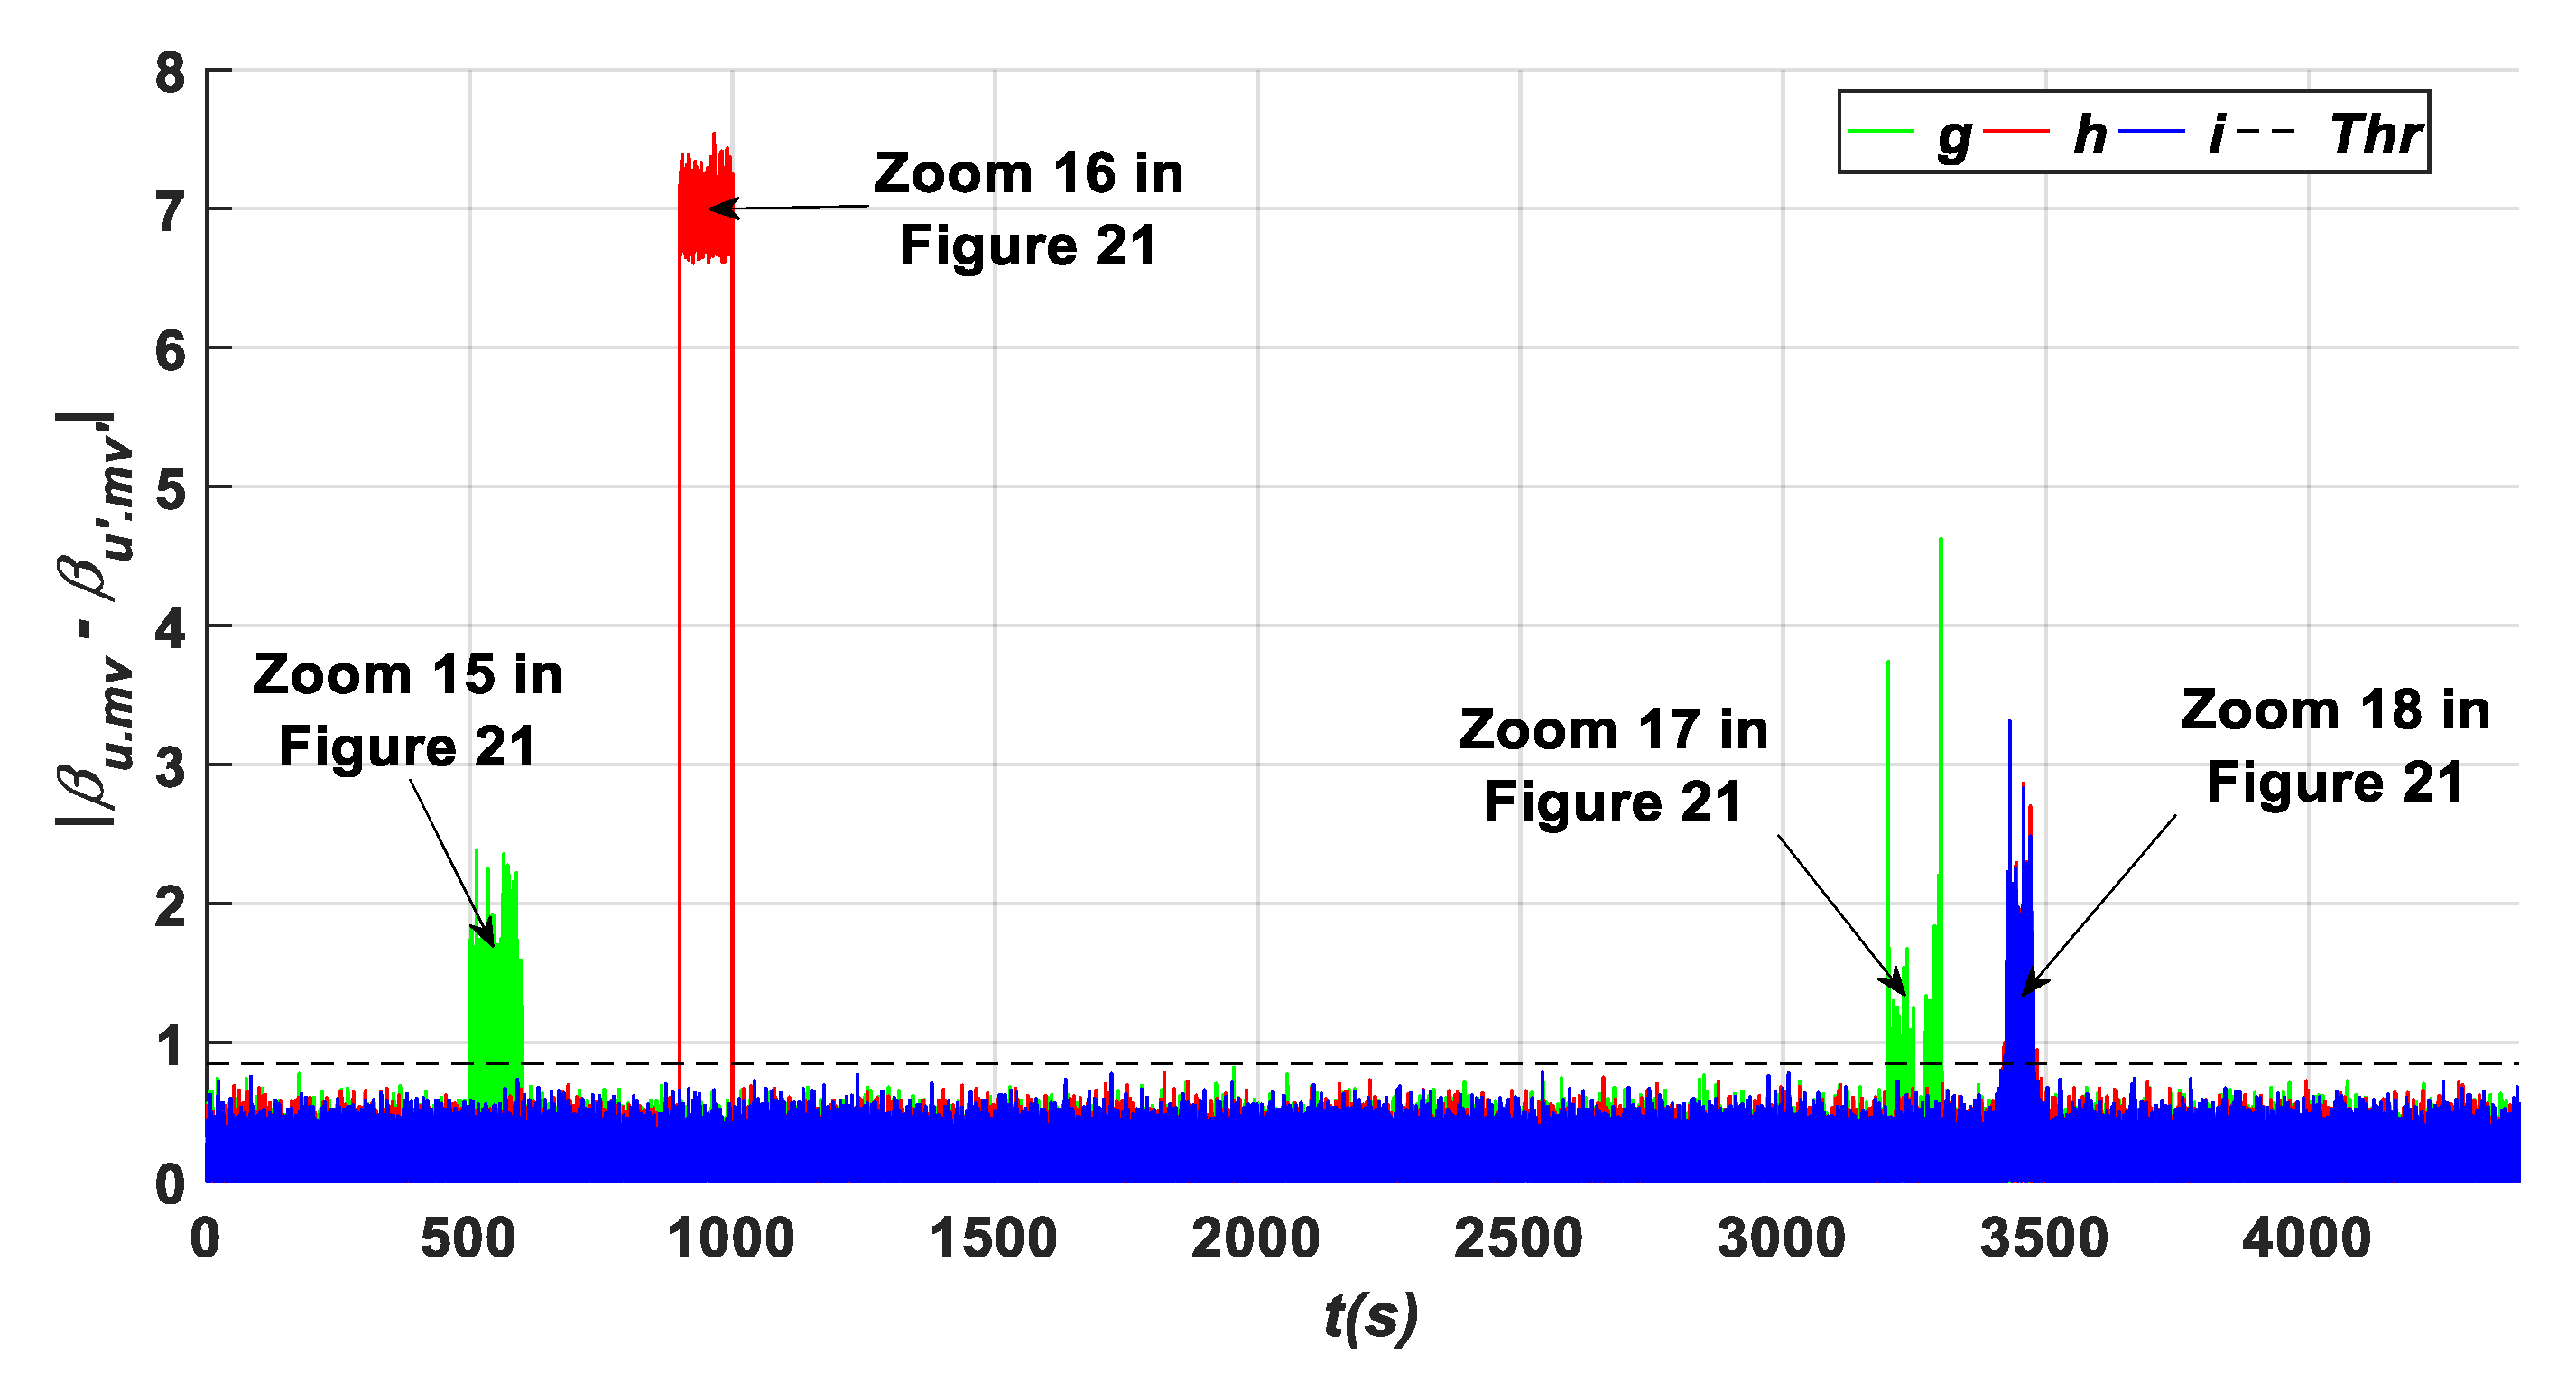
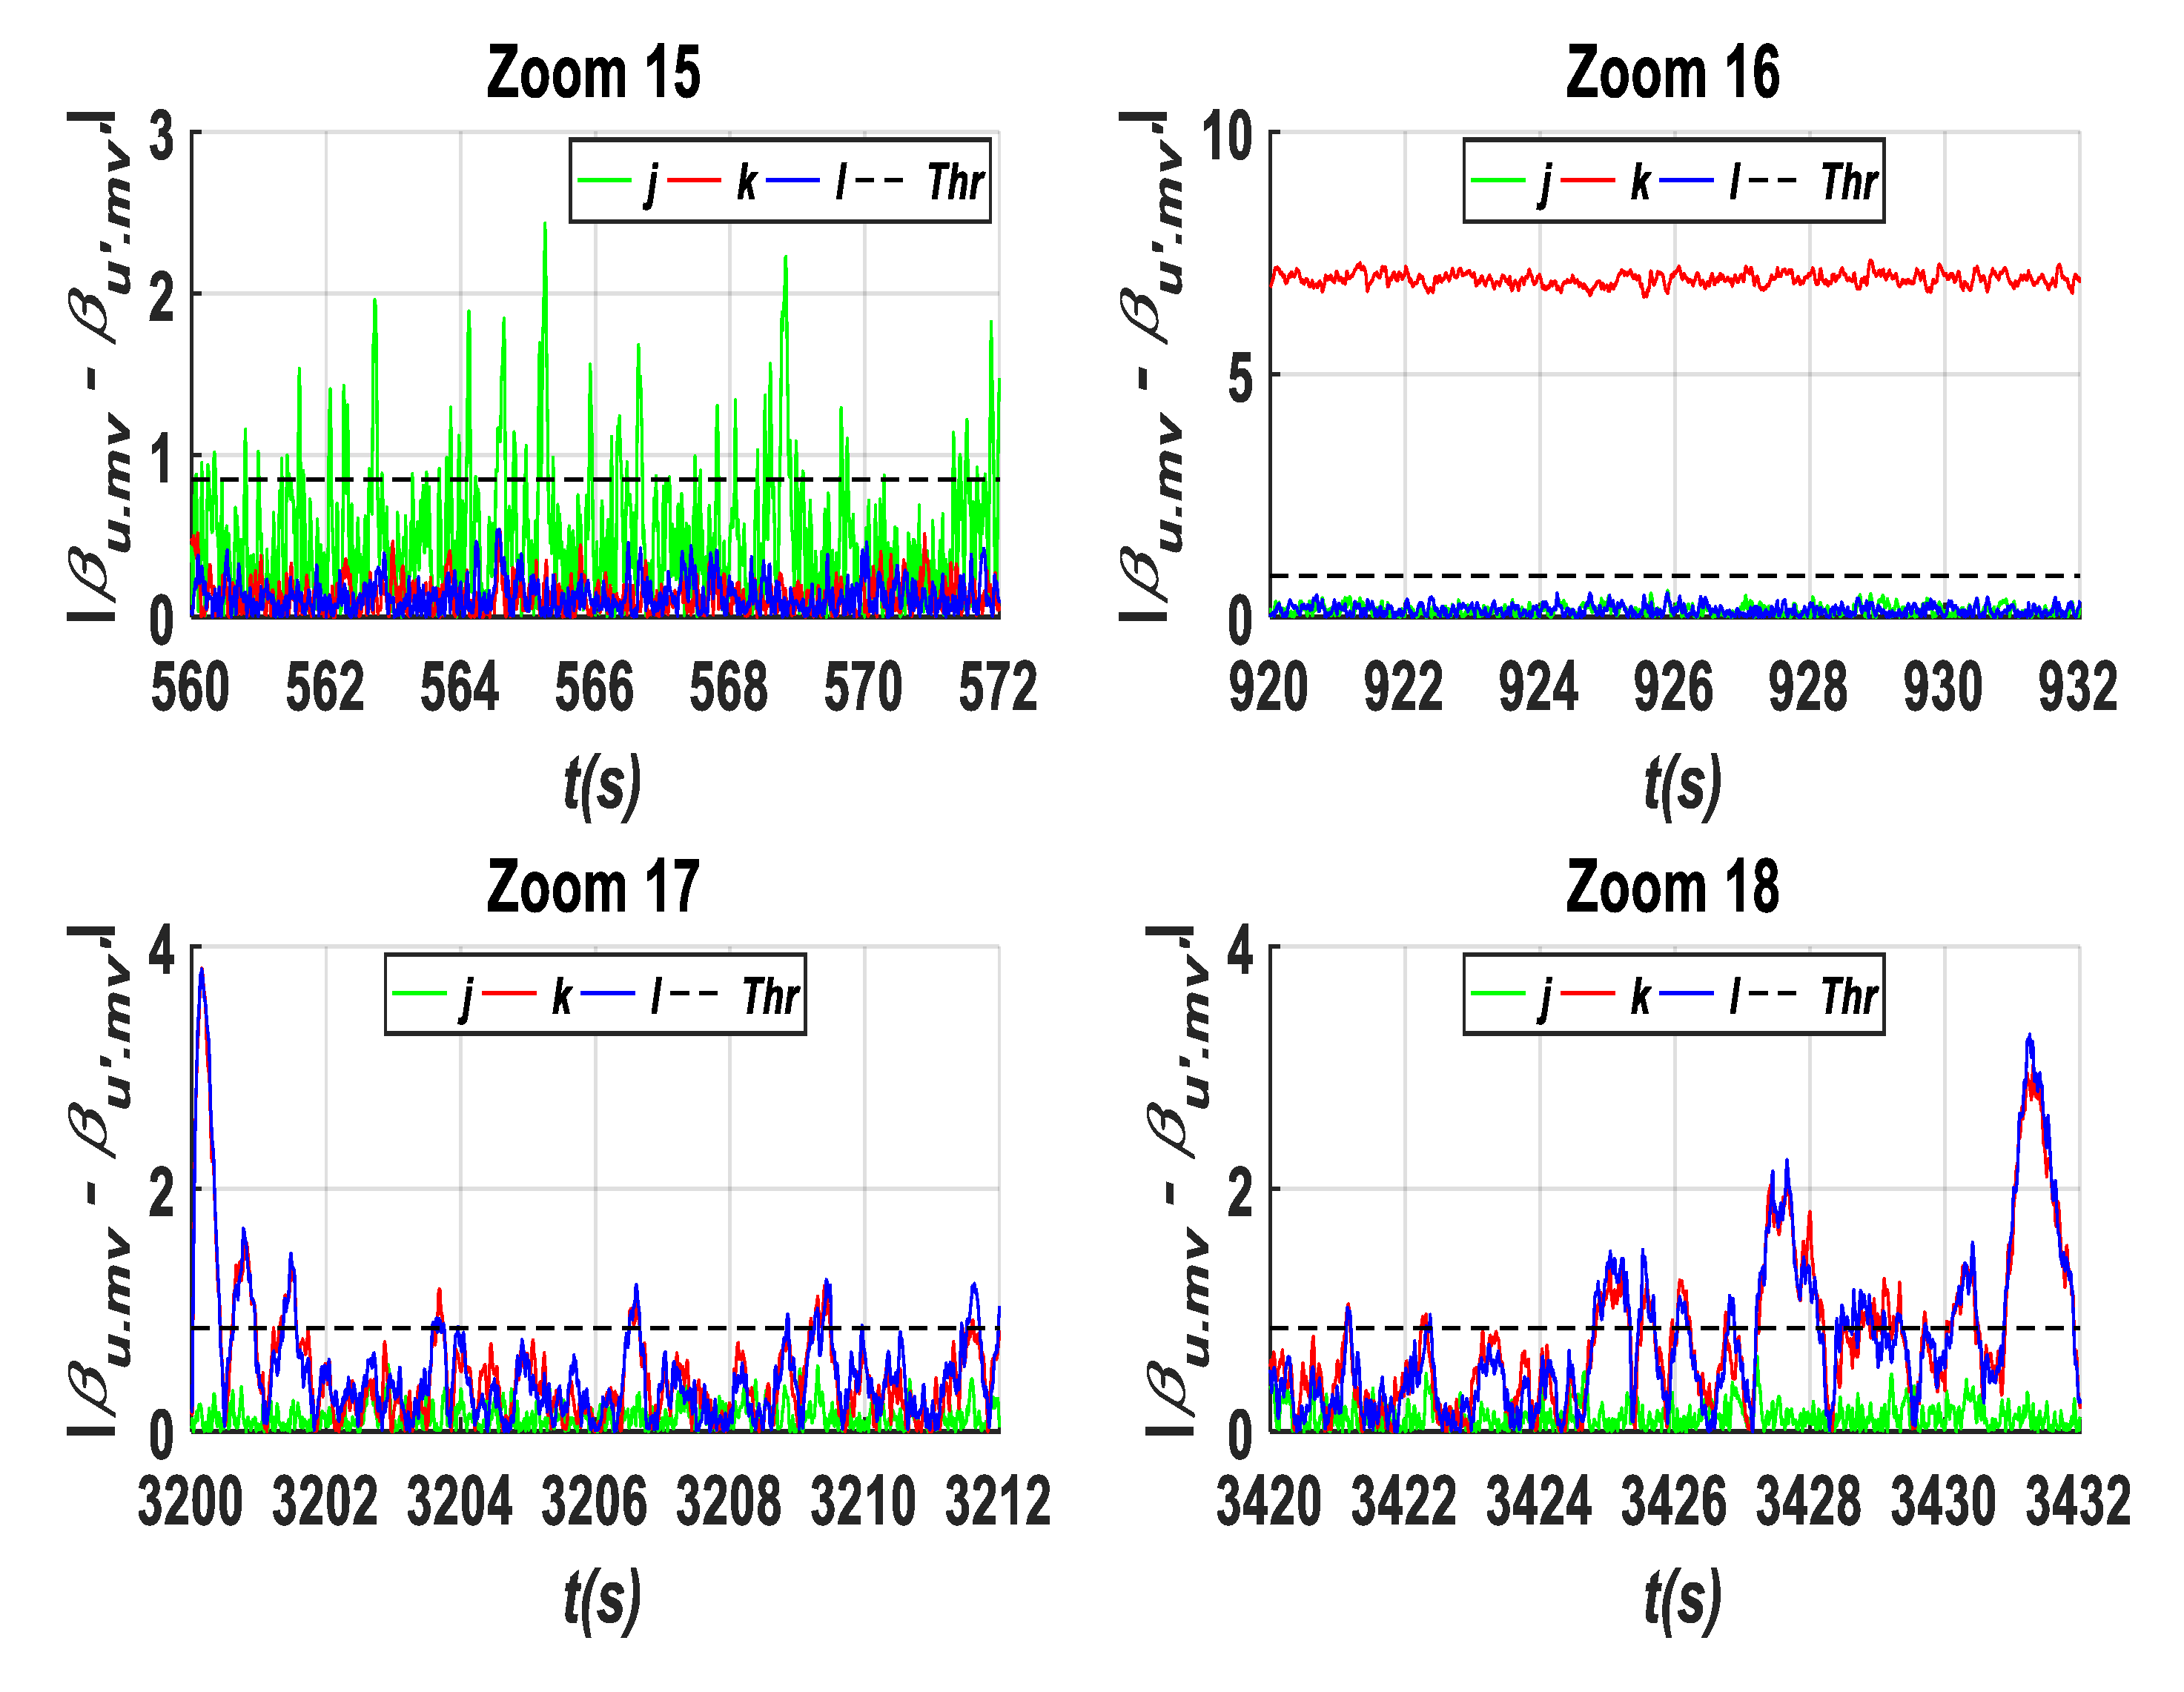
Figure 20 shows the residuals {j, k, and l} obtained within the time interval of [0 to 4400 s] under the four faults, whereas Figure 21 represents more details at each fault occurrence such as the gain factor fault type (A2) within the time interval of [500 s to 600 s] as represented in Zoom 15 of Figure 21, fixed value fault type (A1) within the time interval of [900 s to 1000 s] as shown in Zoom 16 of Figure 21, hydraulic pressure drop fault type (B3) within the time interval of [3200 s to 3300 s] as shown in Zoom 17 of Figure 21, where an increase in air content in the oil fault type (B4) within the time interval of [3400 s to 3500 s] is remarkable with the increase of time as shown in Zoom 18 in the third actuator (β3).
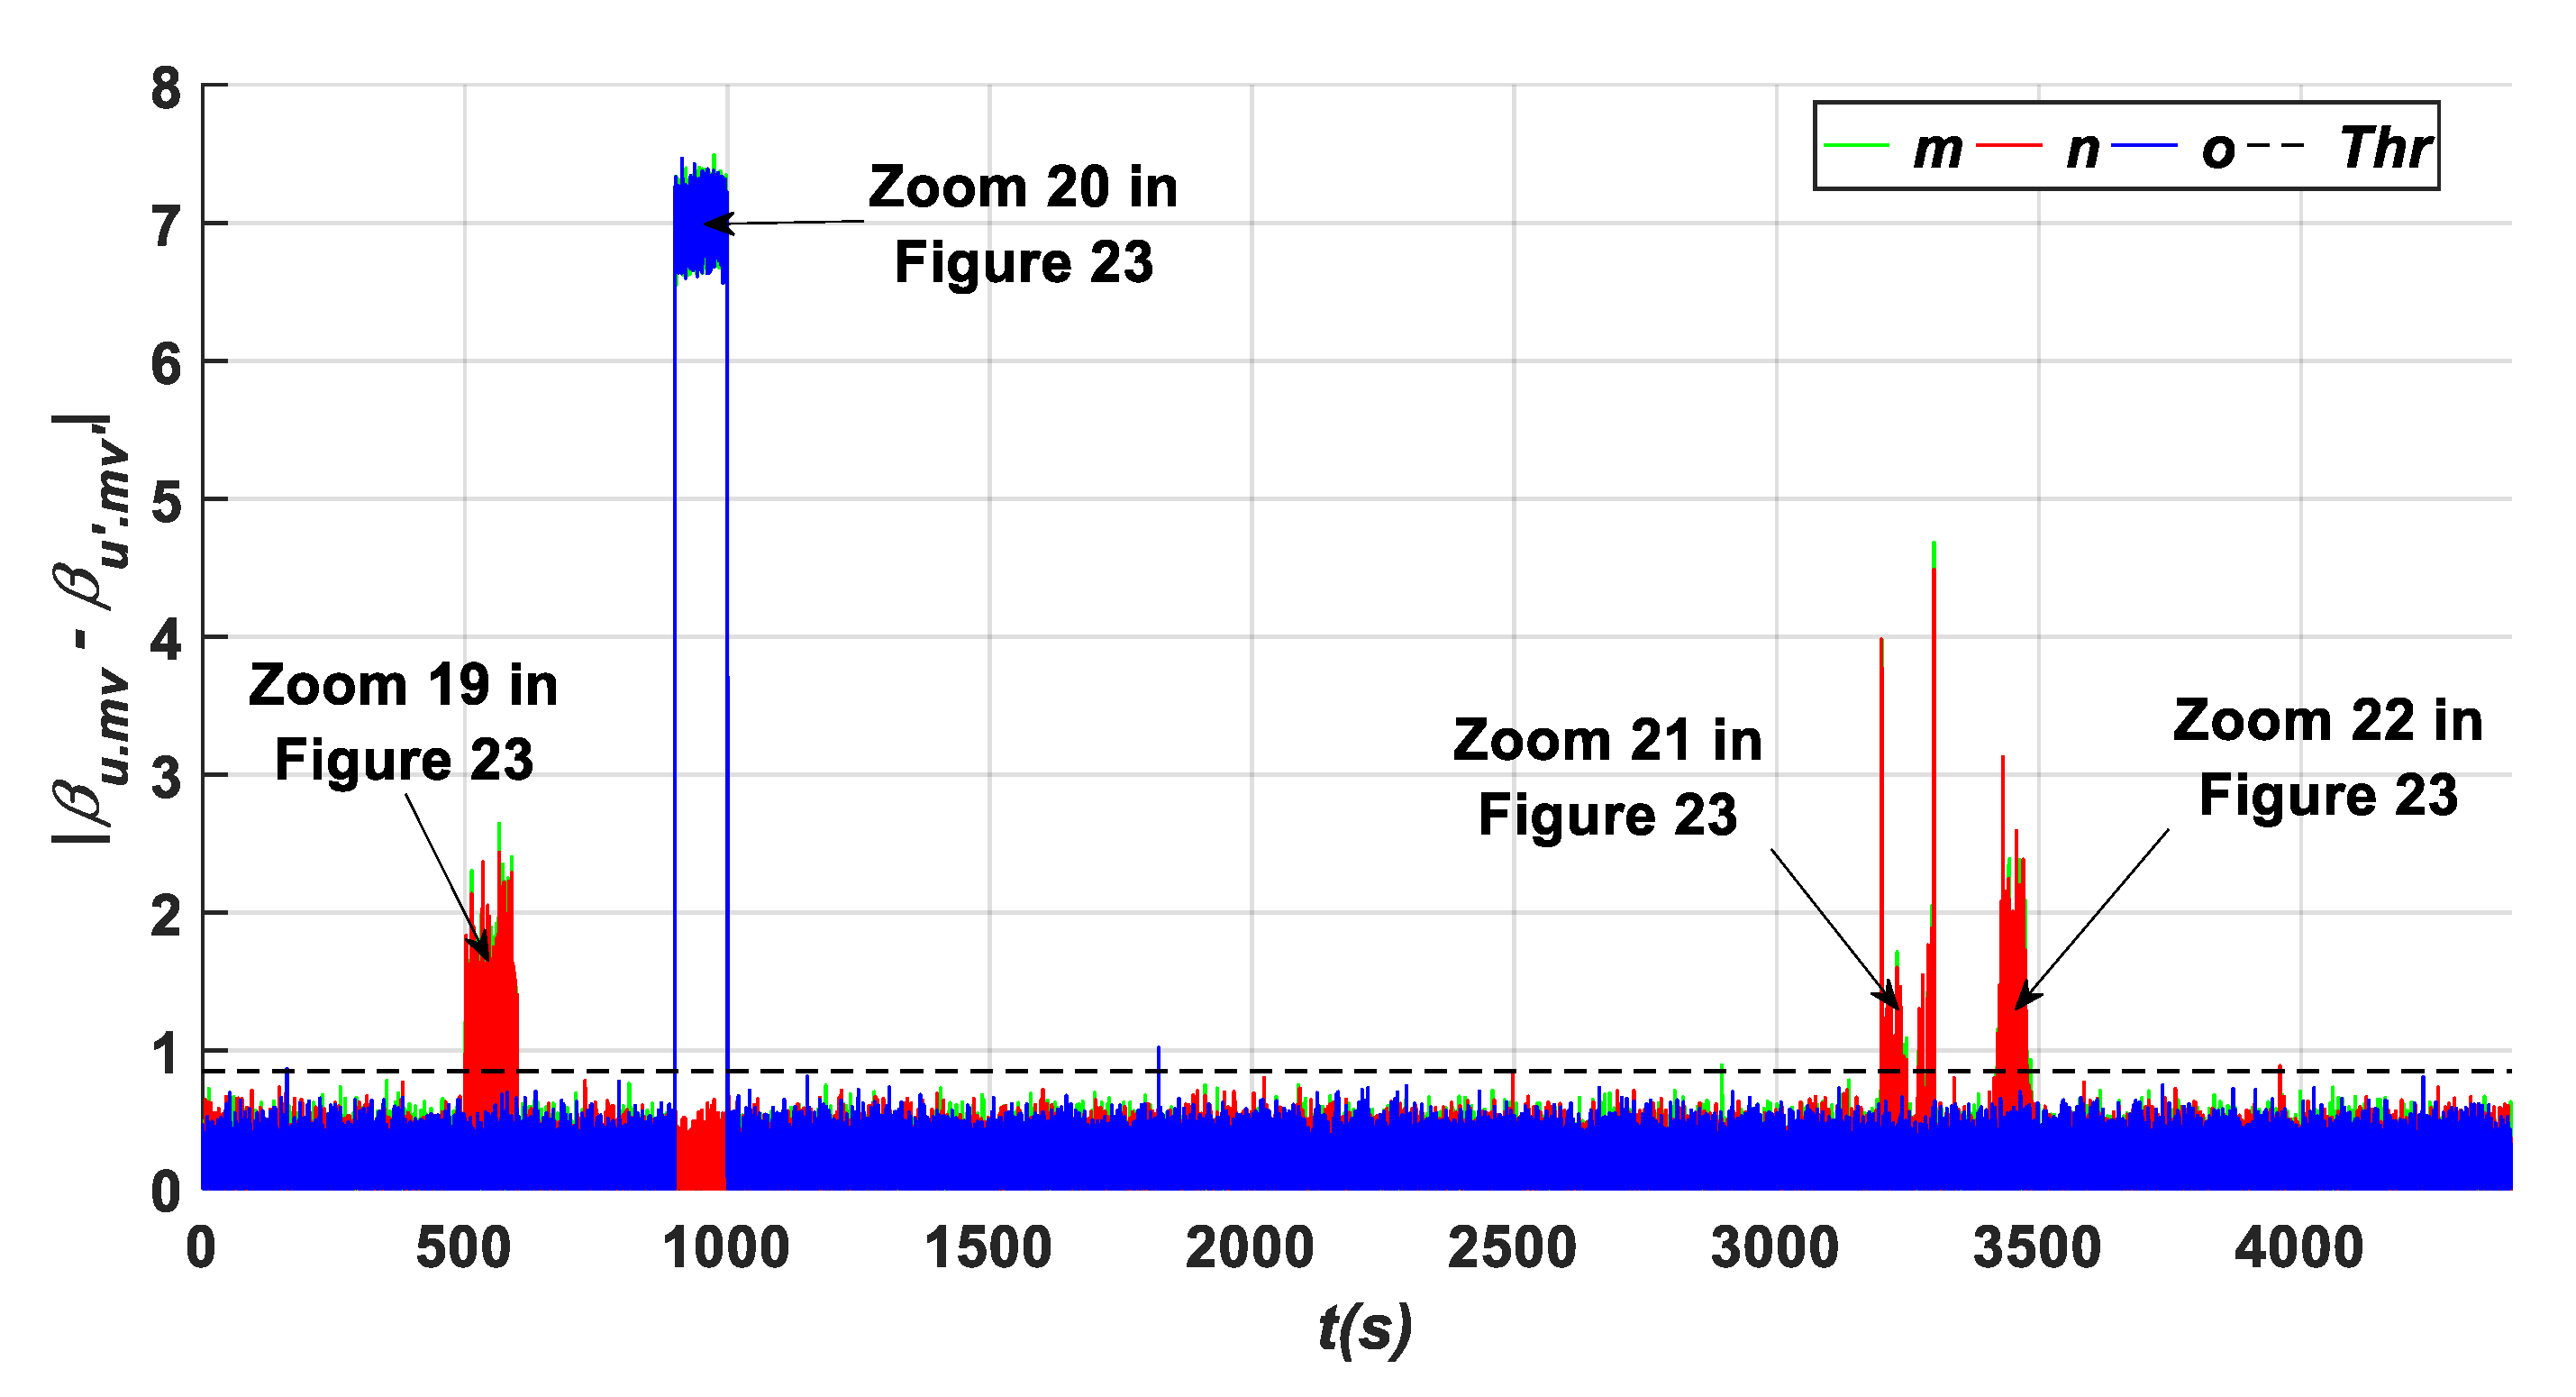
Figure 22 shows the residuals {m, n, and o} obtained under the four fault types within the same time interval as in the previous tests such as the gain factor fault type (A2), fixed value fault type (A1) with a value of 7°, hydraulic pressure drop fault type (B3) in the actuator of the third pitch angle sub-system, and an increase in the air content in the oil fault type (B4) in the third actuator (β3), whereas within the zooms represented in Figure 23 that are related to each fault occurrence, the three residuals are presented in more detail such as Zoom 19 which shows that the two residuals {m and n} exceed the predefined threshold under the presence of a gain factor fault type (A2), Zoom 20 shows that the two residuals {m and o} exceed the predefined threshold with nearly the same average value of seven under the fixed value fault type (A1), and Zoom 21 shows that the two residuals {m and o} exceed the predefined threshold under hydraulic pressure drop fault type (B3); this exceedance for both residuals is notable at the beginning of the fault’s appearance; however, it is less remarkable throughout the remainder of the fault’s duration. Zoom 22 shows that the two residuals {m and o} exceed the predefined threshold under an increase in the air content in the oil fault type (B4) in the third actuator (β3). This overtaking of these residuals increases with the increase in the time of fault occurrence which means that this type should be removed immediately to prevent its amplification along the fault time increase.
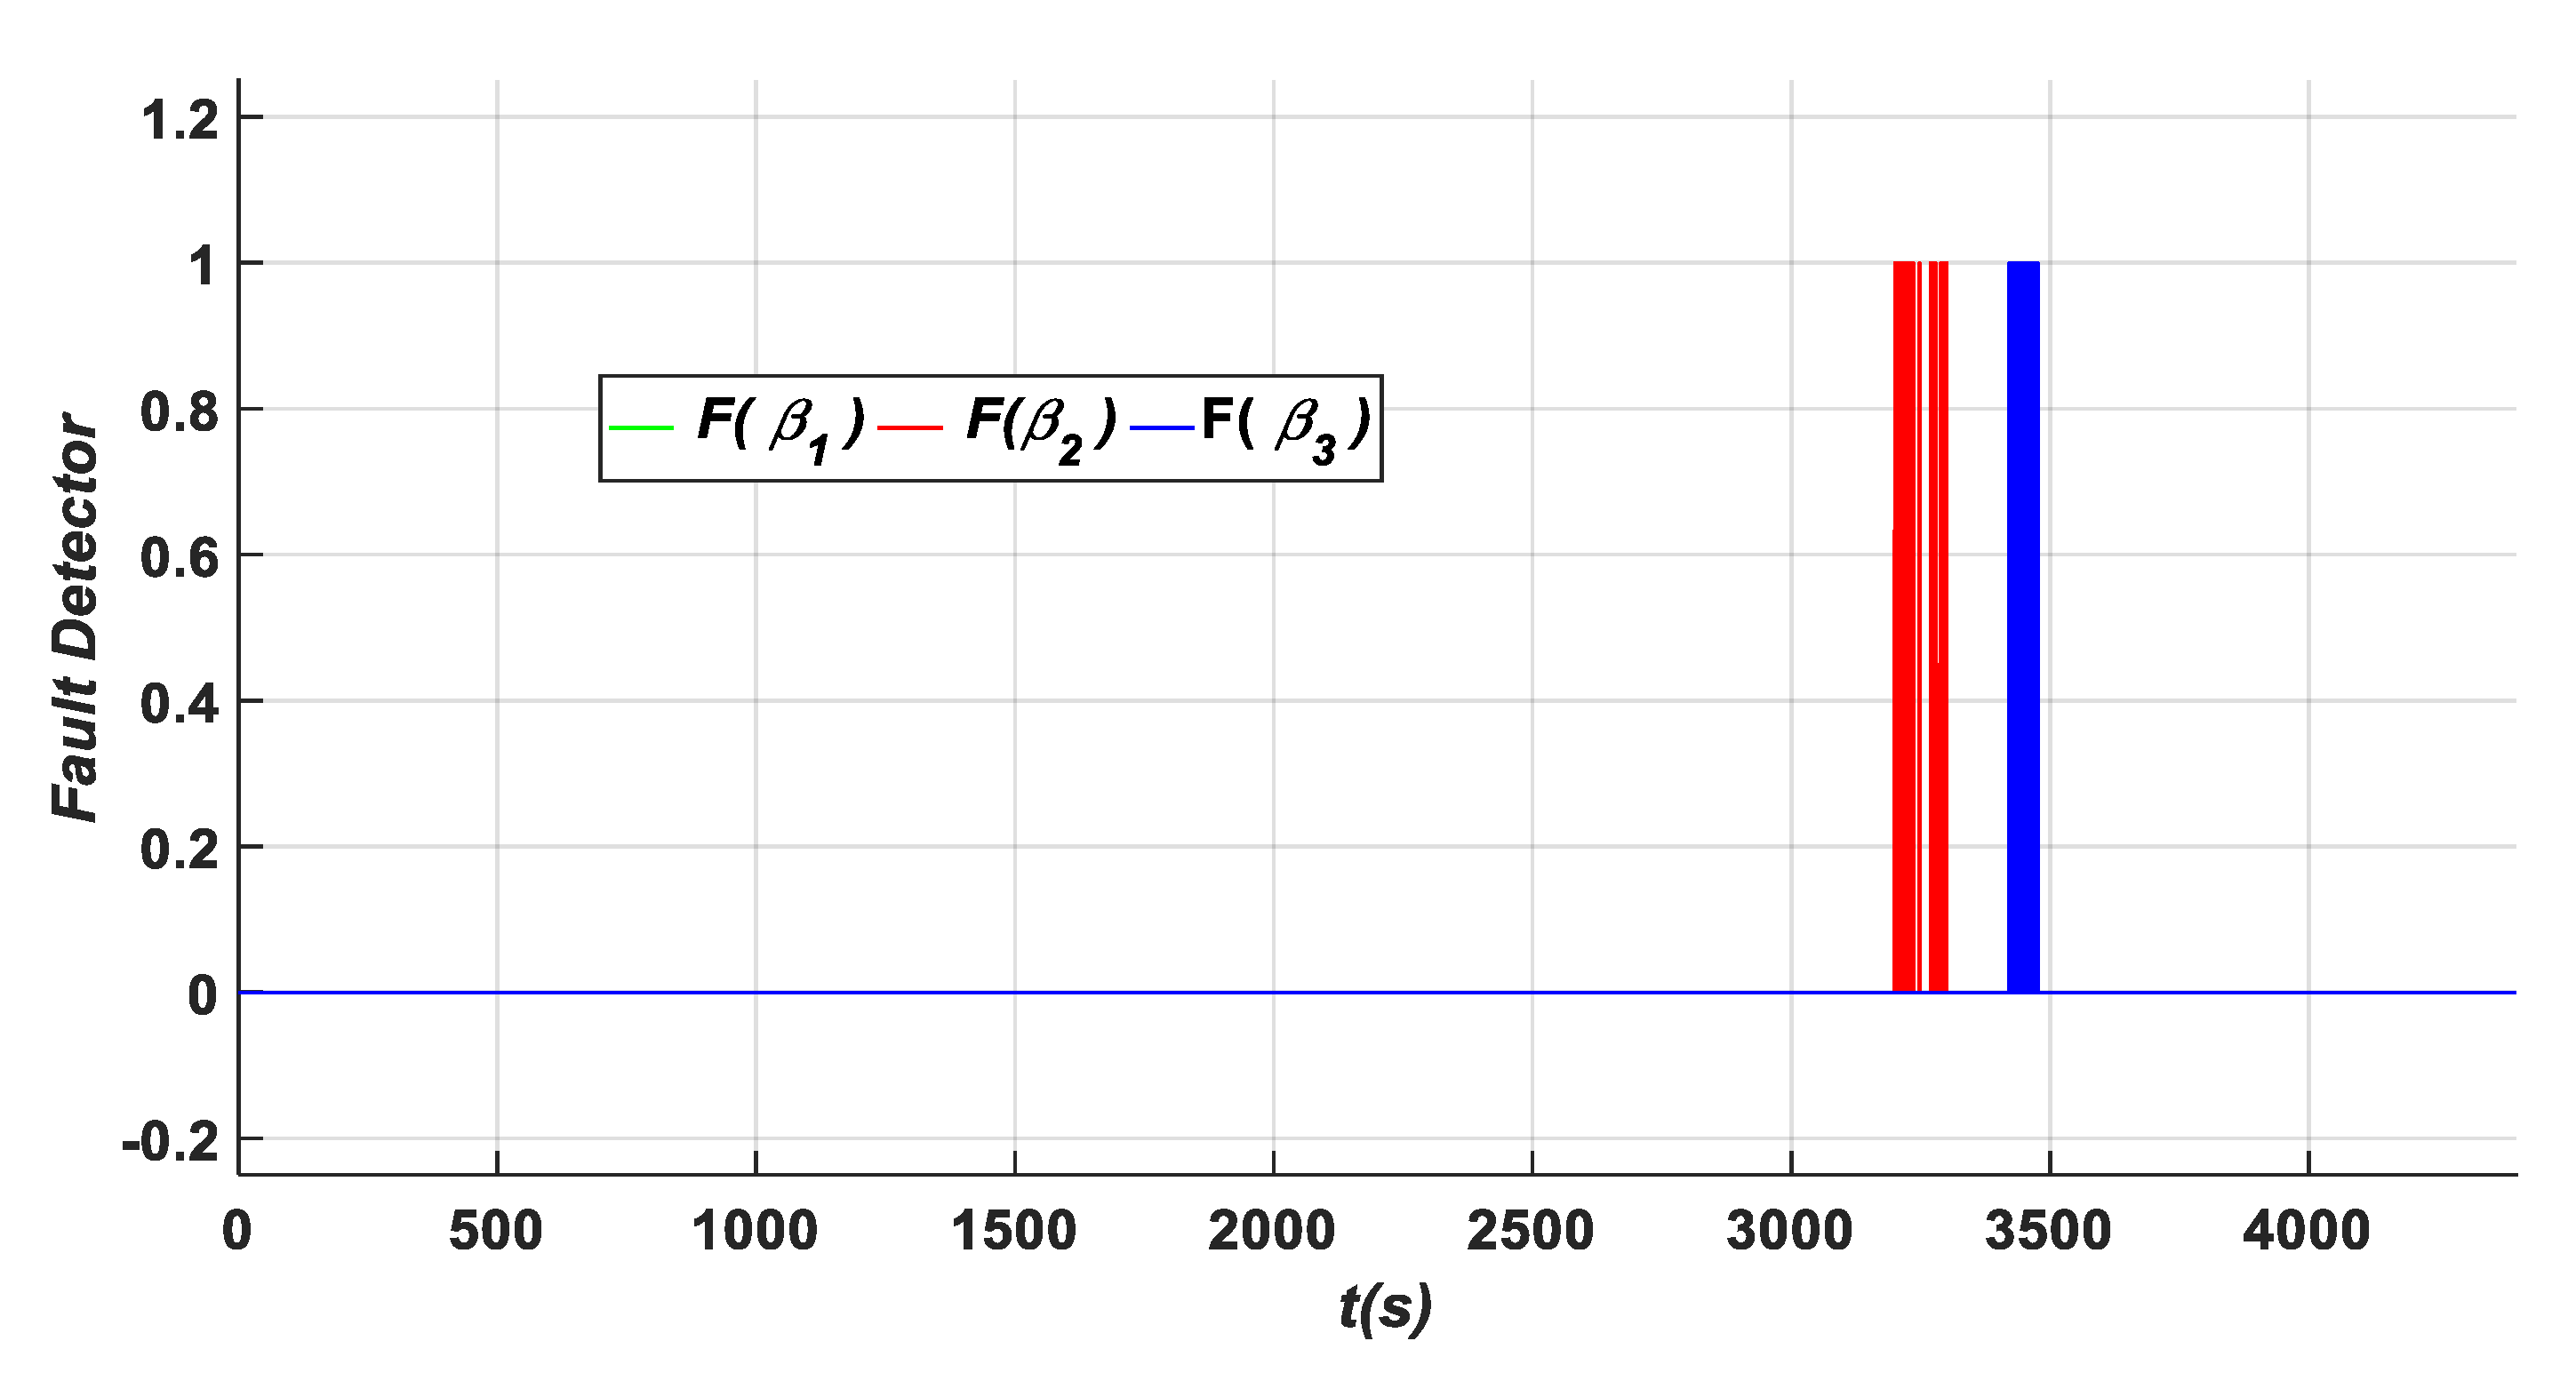
Figure 24 shows the fault detection signals resulting from the sensors in the three actuators of the three pitch angle sub-systems F(β1), F(β2), and F(β3), where it can be confirmed that F(β2) has a value of one during the fault occurrence with the time interval [3200 s to 3300 s] indicating there is a fault in the actuator of the second pitch angle sub-system. On the other side, it can also be confirmed that F(β3) has a value of one during the fault occurrence with the time interval [3400 s to 3500 s] indicating there is a fault in the actuator of the third pitch angle sub-system, whereas the actuator in the first pitch angle sub-system is healthy as its corresponding fault detection signal F(β1) remains equal to zero. Indeed, a careful observation of the appearance of the fault detection signal F(β3) relative to the instant of the fault occurrence allows the determination of the time of detection which is TD = 22.01 s which is practically a short time for the changed dynamics fault type, indicating once more the effectiveness of the proposed approach in this paper in detecting different faults within a very short detection time.
Based on the obtained results from the benchmark model of the studied wind turbine (WT) pitch angle sub-systems, the proposed fault diagnosis approach offers an effective solution for the overall WT system monitoring. This ensures safety, reliability, and continuous operation under various fault types that may occur in the pitch angle sub-systems of the WT. Indeed, wind turbine power plant installations are affected by challenging operating conditions and constraints, as demonstrated in this paper within the presented investigated simulations tests under various fault types. These faults are characterized by high severity and can increase the damage rate of the WT plant, particularly in the pitch angle sub-systems. Therefore, an effective diagnosis approach system which can help avoid such failures and reduce maintenance costs is a major requirement for the sustainability of wind turbine power plants.
Furthermore, these obtained simulation results demonstrate the effectiveness of the proposed diagnosis approach, where the most relevant possible faults that can affect the sensors and actuators of the pitch angle sub-system are detected, isolated, and classified correctly based on a fixed threshold detection value. Indeed, sensor faults such as F (β1.m1), F(β2.m2), and F(β3.m1), and actuator faults such as F(β2) and F(β3) are tested with their types of fixed value, gain factor, and dynamics changes. The obtained results confirm the capability of the developed diagnostic approach and its effectiveness as a powerful fault detection tool for wind turbine systems, whereas the generated internal and external residuals are used to infer decisions about the occurrence of faults in each part of the system based on the predefined thresholds and the acquired measurements. The proposed detection approach is sensitive to measurement noises due to the proposed residual types. Furthermore, multiple fault occurrences can be automatically detected as depicted in Figure 24. This method allows the development of a practical monitoring system of wind turbine pitch angle sub-systems that can ensure clear indications of the degradation behavior of their components. This approach can also enable the operator of these wind turbines to make maintenance decisions at the right time.
The investigated faults in this study are summarized as follows:
  • A fixed value (A1) in β1.m1 (−3°) within an interval time: [100–200 s]: This fault influences the residuals {a, b, and c} as shown in Figure 11 and Zoom 4 of Figure 12, and the residuals {d and e} as shown in Figure 14 and Zoom 7 of Figure 15. These residuals exceed the predefined threshold, while the residual {f} presented in Figure 14 and Zoom7 of Figure 15 is less than the predefined threshold due to no influence of this fault type on these residuals. In this case, the fault detection signals are determined based on F (β1.m1) as shown in Figure 13, where the detection time in this case is TD = 0.02 s.
  • A gain factor (A2) in β2.m2 is equal to (5.β2.m2) within an interval time of [500 s–600 s]. As it can be observed from Figure 11, Figure 17, Figure 20 and Figure 22, it is obvious that the residuals {c, g, j, m, and n} have been influenced by this fault type, where they exceed the predefined threshold. To show their high exceedance of the predefined threshold during each time interval of the fault occurrence, specific zooms are elaborated as shown in Zooms 5, 11, 15, and 19 of Figure 12, Figure 18, Figure 21 and Figure 23, respectively, whereas the residuals {a, and o} have been detected to be less than the predefined threshold as shown in Zoom. 5 of Figure 11 and Zoom 19 of Figure 23. In this case, the fault detection signal is determined by F (β2.m2) as shown in Figure 16 with a detection time TD = 0.08 s.
  • A fixed value (A1) in β3.m1 with a value of (7°) within an interval time of [900 s–1000 s]. Based on the results shown in Figure 14, Figure 17, Figure 20 and Figure 22, it is clear that this fault type has influences on the residuals {d, h, k, m, and o}, where their values exceed the predefined threshold. Specifically captured zooms within the mentioned time interval are shown in Zooms 8, 12, 18, and 20 in Figure 15, Figure 18, Figure 21 and Figure 23, respectively. However, the residuals {a and j} remain less than the predefined threshold value as presented in Figure 11 and Zoom 16 of Figure 21. In this case, the fault detection signal is determined by F (β3.m1) as shown in Figure 19 with a time of detection (TD = 0.01 s).
  • Hydraulic pressure drops (B3) is an actuator fault that occurs in the second actuator β2 within the time interval of [3200 s–3300 s]. As shown in Figure 11, Figure 14, Figure 17, Figure 20 and Figure 22, this fault type influences the residuals {b, c, f, g, k l, m, and n}. The zooms carried out at each fault occurrence within the specified duration show that the measured values of these signals infer the decision related to the occurring fault as the aforementioned residuals exceed the predefined threshold as shown in Zooms 6, 9, 13, 17, and 21 of Figure 12, Figure 15, Figure 18, Figure 21 and Figure 23, respectively, while the residuals {a, e, d, j, and o} have their values less than the predefined threshold during the mentioned duration [3200 s to 3300 s] as depicted in Zoom 6 of Figure 12, Zoom 9 of Figure 15, Zoom 13 of Figure 18, Zoom 17 of Figure 21, and Zoom 21 of Figure 23. In this case, the fault detection signal is determined by F (β2) as shown in Figure 24 with a time of detection (TD = 0.01 s).
  • Increasing air content (B4) in the third actuator (β3) within the time interval [3400 s–3500 s]. This fault type influences the residuals {d, e, h, i, k, l, m, and n} as shown in Figure 14, Figure 17, Figure 20 and Figure 22, leading to exceeding the predefined threshold value as it can be seen clearly in the captured zooms within the defined time interval [3400 s to 3500 s] such as Zooms 10, 14, 18, and 22 of Figure 15, Figure 18, Figure 21 and Figure 23, respectively, whereas the signals {f, g, j, and o} remain less than the predefined threshold within the specified duration as shown in Zoom 10 of Figure 15, Zoom 14 of Figure 18, Zoom 18 of Figure 21, and Zoom 22 of Figure 23. In this case, the fault detection signal is determined by F (β3) as shown in Figure 24 with a time of detection (TD = 22.01 s).
Table 4 summarizes the simulated sensor and actuator faults in the pitch angle sub-systems of the WT. In this table, the fault types, classes, values, and their periods of occurrence have been illustrated, whereas for each fault, the extracted influenced residuals, max values, the fault detection signal, and the time of detection are presented.

5. Conclusions

The detection of faults in wind turbine systems is a challenge that needs to be overcome in order to guarantee the enhanced operation performances of these renewable energy sources. For this purpose, a fault diagnosis approach is proposed in the present paper for the WT pitch angle sub-systems based on a selected benchmark model. The proposed approach presents essentially a reliable practical methodology based on the integration of a digital detection algorithm to ensure the WT’s normal operation mode. This proposal can provide an innovative and digitalized solution for WT fault detection that can allow for minimizing the operation risks under various eventual faults in the pitch angle sub-systems by ensuring the detection of the occurrence of faults at the right time. The obtained results confirm that the proposed digital algorithm is a powerful and reliable tool for fault detection and its effectiveness is demonstrated through the presented simulations based on the defined performances and indices. In this developed approach, multiple faults can be automatically detected based on the accurate and better estimations of the influenced residuals. Furthermore, the proposed approach allows for overcoming the limitations of the conventional monitoring methods for this type of system. It identifies the stages of degradation, normal operation mode, faulty operation mode, and complete failure mode (stop mode). This feature allows for ensuring the enhancement of the availability and reliability of the various sensors and actuators of the studied WT by detecting and locating the appearance of faults in the pitch system based on the determination of the difference between the observed system behavior and the reference model behaviors. This structure provides a useful evaluation of performance indices for the correct operation mode of the WT and allows the WT to continue to operate with high efficiency.
As an extension to the present study, a nonlinear estimator such as the extended Kalman filter can be used in order to measure the different system variables that allow generating the correct and appropriate residuals to accomplish precisely the task of fault detection. Furthermore, the employment of an intelligent and equivalent model of the WT machine like fuzzy systems and neuro-fuzzy techniques can improve effectively the quality of the decisions of the fault detection, localization, and isolation of any faulty part of the WT such as the pitch angle system, drive chain, and generator–converter [62].

Author Contributions

Conceptualization, A.S., M.N., L.C. and A.H.; methodology, A.S., M.N., L.C., A.H. and A.K., M.A.; software, A.S., M.N., L.C. and A.H.; validation, A.S., M.N., L.C., A.H., A.K. and M.A.; formal analysis, A.S., M.N., L.C., A.H., A.K. and M.A.; investigation, A.S. and M.N.; resources, A.S., M.N., L.C., A.H., A.K. and M.A.; data curation, A.S. and M.N.; writing—original draft preparation, A.S., M.N., L.C., A.H., A.K., J.R. and M.A.; writing—review and editing, A.S., M.N., L.C., A.H., A.K., J.R. and M.A.; visualization, A.S., M.N., L.C., A.H. and A.K.; supervision, A.K. and J.R. All authors have read and agreed to the published version of the manuscript.

Funding

This research received no external funding.

Data Availability Statement

The original contributions presented in the study are included in the article, further inquiries can be directed to the corresponding author.

Acknowledgments

J. Rodriguez acknowledges the support of ANID through projects FB0008, 1210208, and 1221293.

Conflicts of Interest

The authors declare no conflicts of interest.

Abbreviations

WTWind turbine
PVPhotovoltaic
FTCFault-tolerant control approach
FDIFault detection and identification
FFTFast Fourier transform
FSK-MBCNNFast spectral kurtosis multi-branch convolutional neural network method
PIProportional-Integrator controllers
WPTWireless Power Transfer
MEPTMaximum Efficiency Point Tracking control
VwindWind speed
β1, β2, β3 The real values of the pitch angle of the first, second, and third wind turbine blades
βmPitch angle signal measurements
βrPitch angle signal reference
τrRotor torque
ωrRotor speed (turbine speed)
τg Generator torque
τg.rReference of generator torque
ωgGenerator speed
ωnThe pulsation frequency factor of second-order transfer function
ξThe damping factor of the second-order transfer function
TDThe time of Detection
ThrThreshold value
x = {a, b, c, d, e, f, g, h, i, j, k, l, m, n, o}Internal and external residual signals obtained in Residual Generation.
X = {A, B, C, D, E, F, G, H, I, J, K, L, M, N, and O}Binary states of internal and external residuals obtained in the pre-treatment stage
{nbr: blade}Blade number (uth = {1st, 2nd, or 3rd})
{nbr: sensor}Sensor number (vth = {1st, or 2nd}) in the uth blade
βu.mvMeasurements of the vth sensor on the uth pitch angle sub-system.
F(βu.mv)Sensor fault in vth sensor of uth actuator
F(βu)Actuator fault in the uth actuator.
“A”An indication for sensor faults in different parts of the proposed model of the WT system.
“A1”The first sensor fault class: “fixed value” in a sensor in the pitch angle system into the aerodynamic part.
“A2”The second sensor fault class: “gain factor” in a sensor in the pitch angle system into the aerodynamic part.
“B”An indication for actuator faults in different parts of the proposed model of the WT system.
“B3”The third actuator fault class: “changed dynamics” as a hydraulic head in a hydraulic pitch angle sub-system into the aerodynamic part.
“B4”The fourth actuator fault class: “changed dynamics” as an increasing air in a hydraulic pitch angle sub-system into the aerodynamic part.

References

  1. Gao, Z.; Liu, X. An overview on fault diagnosis, prognosis and resilient control for wind turbine systems. Processes 2021, 9, 300. [Google Scholar] [CrossRef]
  2. Odgaard, P.F.; Stoustrup, J.; Kinnaert, M. Fault Tolerant Control of Wind Turbines—A benchmark model. IFAC Proc. Vol. 2009, 42, 155–160. [Google Scholar] [CrossRef]
  3. Odgaard, P.F.; Stoustrup, J. A Benchmark evaluation of fault tolerant wind turbine control concepts. IEEE Trans. Control Syst. Technol. 2015, 23, 1221–1228. [Google Scholar] [CrossRef]
  4. Odgaard, P.F.; Stoustrup, J.; Kinnaert, M. Fault-tolerant control of wind turbines: A benchmark model. IEEE Trans. Control Syst. Technol. 2013, 21, 1168–1182. [Google Scholar] [CrossRef]
  5. Kusiak, A.; Verma, A. A Data-Driven approach for monitoring blade pitch faults in wind turbines. IEEE Trans. Sustain. Energy 2011, 2, 87–96. [Google Scholar] [CrossRef]
  6. Fernandez-Canti, R.M.; Blesa, J.; Tornil-Sin, S.; Puig, V. Fault detection and isolation for a wind turbine benchmark using a mixed Bayesian/Set-membership approach. Annu. Rev. Control 2015, 40, 59–69. [Google Scholar] [CrossRef]
  7. Azizi, A.; Nourisola, H.; Shoja-Majidabad, S. Fault tolerant control of wind turbines with an adaptive output feedback sliding mode controller. Renew. Energy 2019, 135, 55–65. [Google Scholar] [CrossRef]
  8. Colombo, L.; Corradini, M.L.; Ippoliti, G.; Orlando, G. Pitch angle control of a wind turbine operating above the rated wind speed: A sliding mode control approach. ISA Trans. 2020, 96, 95–102. [Google Scholar] [CrossRef]
  9. Sanchez, H.; Escobet, T.; Puig, V.; Odgaard, P.F. Fault diagnosis of an advanced wind turbine benchmark using interval-based ARRs and observers. IEEE Trans. Ind. Electron. 2015, 62, 3783–3793. [Google Scholar] [CrossRef]
  10. Blesa, J.; Rotondo, D.; Puig, V.; Nejjari, F. FDI and FTC of wind turbines using the interval observer approach and virtual actuators/sensors. Control Eng. Pract. 2014, 24, 138–155. [Google Scholar] [CrossRef]
  11. Astolfi, D.; Castellani, F.; Natili, F. Wind turbine generator slip ring damage detection through temperature data analysis. Diagnostyka 2019, 20, 3–9. [Google Scholar] [CrossRef]
  12. Simani, S.; Farsoni, S.; Castaldi, P. Fault diagnosis of a wind turbine benchmark via identified fuzzy models. IEEE Trans. Ind. Electron. 2015, 62, 3775–3782. [Google Scholar] [CrossRef]
  13. Simani, S.; Farsoni, S.; Castaldi, P. Residual generator fuzzy identification for wind turbine Benchmark fault diagnosis. Machines 2014, 2, 275–298. [Google Scholar] [CrossRef]
  14. Liu, X.; Gao, Z.; Chen, M.Z.Q. Takagi–Sugeno Fuzzy Model Based Fault Estimation and Signal Compensation with Application to Wind Turbines. IEEE Trans. Ind. Electron. 2017, 64, 5678–5689. [Google Scholar] [CrossRef]
  15. Civelek, Z. Optimization of fuzzy logic (Takagi-Sugeno) blade pitch angle controller in wind turbines by genetic algorithm. Eng. Sci. Technol. Int. J. 2020, 23, 1–9. [Google Scholar] [CrossRef]
  16. Stetco, A.; Dinmohammadi, F.; Zhao, X.; Robu, V.; Flynn, D.; Barnes, M.; Keane, J.; Nenadic, G. Machine learning methods for wind turbine condition monitoring: A review. Renew. Energy 2019, 133, 620–635. [Google Scholar] [CrossRef]
  17. Stetco, A.; Ramirez, J.M.; Mohammed, A.; Djurović, S.; Nenadic, G.; Keane, J. An End-to-End, Real-Time Solution for Condition Monitoring of Wind Turbine Generators. Energies 2020, 13, 1825–1840. [Google Scholar] [CrossRef]
  18. Habib Chaouki Ben Djoudi, Ahmed Hafaifa, Dalila Djoudi and Mouloud Guemana, Fault tolerant control of wind turbine via identified fuzzy models prototypes. Diagnostyka 2020, 21, 3–13. [CrossRef]
  19. Zhang, K.; Tang, B.; Deng, L.; Tan, Q.; Yu, H. A fault diagnosis method for wind turbines gearbox based on adaptive loss weighted meta-ResNet under noisy labels. Mech. Syst. Signal Process. 2021, 161, 107963. [Google Scholar] [CrossRef]
  20. Zhang, J.; Xu, B.; Wang, Z.; Zhang, J. An FSK-MBCNN based method for compound fault diagnosis in wind turbine gearboxes. Measurement 2021, 172, 108933. [Google Scholar] [CrossRef]
  21. Jiang, N.; Li, N. A wind turbine frequent principal fault detection and localization approach with imbalanced data using an improved synthetic oversampling technique. Int. J. Electr. Power Energy Syst. 2021, 126 Pt A, 106595. [Google Scholar] [CrossRef]
  22. Sellami, T.; Berriri, H.; Jelassi, S.; Darcherif, A.M.; Mimouni, M.F. Performance analysis of grid-connected wind turbine system under inter-turn-short-circuit fault conditions. Int. J. Renew. Energy Res. 2018, 8, 374–383. [Google Scholar]
  23. Sahoo, S.; Subudhi, B.; Panda, G. Comparison of output power control performance of wind turbine using PI, fuzzy logic and model predictive controllers. Int. J. Renew. Energy Res. 2018, 8, 1062–1070. [Google Scholar]
  24. Zeng, H.; Chen, D. A voltage fed single stage multi-input inverter for hybrid wind/photovoltaic power generation system. J. Power Electron. 2022, 22, 593–602. [Google Scholar] [CrossRef]
  25. Gao, W.; Fan, Y.; Wang, C.; Wang, K.; Li, H. Operating area analysis and design of WPT systems with MEPT control. J. Power Electron. 2022, 22, 702–710. [Google Scholar] [CrossRef]
  26. Saci, A.; Cherroun, L.; Hafaifa, A.; Mansour, O. Effective fault diagnosis method for the pitch system, the drive train, and the generator with converter in a wind turbine system. Electr. Eng. 2022, 104, 1967–1983. [Google Scholar] [CrossRef]
  27. Zemali, Z.; Cherroun, L.; Hadroug, N.; Hafaifa, A.; Iratni, A.; Alshammari, O.S.; Colak, I. Robust intelligent fault diagnosis strategy using Kalman observers and neuro-fuzzy systems for a wind turbine benchmark. Renew. Energy 2023, 205, 873–898. [Google Scholar] [CrossRef]
  28. Mazzeo, F.; Micheletto, D.; Talamelli, A.; Segalini, A. An Experimental Study on a Wind Turbine Rotor Affected by Pitch Imbalance. Energies 2022, 15, 8665. [Google Scholar] [CrossRef]
  29. Li, Y.; Jiang, W.; Zhang, G.; Shu, L. Wind turbine fault diagnosis based on transfer learning and convolutional autoencoder with small-scale data. Renew. Energy 2021, 171, 103–115. [Google Scholar] [CrossRef]
  30. Liu, Y.; Ferrari, R.; Wu, P.; Jiang, X.; Li, S.; van Wingerden, J.-W. Fault diagnosis of the 10MW Floating Offshore Wind Turbine Benchmark: A mixed model and signal-based approach. Renew. Energy 2021, 164, 391–406. [Google Scholar] [CrossRef]
  31. Pang, Y.; Jia, L.; Zhang, X.; Liu, Z.; Li, D. Design and implementation of automatic fault diagnosis system for wind turbine. Comput. Electr. Eng. 2020, 87, 106754. [Google Scholar] [CrossRef]
  32. Kong, Y.; Qin, Z.; Wang, T.; Han, Q.; Chu, F. An enhanced sparse representation-based intelligent recognition method for planet bearing fault diagnosis in wind turbines. Renew. Energy 2021, 173, 987–1004. [Google Scholar] [CrossRef]
  33. Wang, Z.; Li, G.S.; Yao, L.; Qi, X.; Zhang, J. Data-driven fault diagnosis for wind turbines using modified multiscale fluctuation dispersion entropy and cosine pairwise-constrained supervised manifold mapping. Knowl.-Based Syst. 2021, 228, 107276. [Google Scholar] [CrossRef]
  34. Jaramillo, F.; Gutiérrez, J.M.; Orchard, M.; Guarini, M.; Astroza, R. A Bayesian approach for fatigue damage diagnosis and prognosis of wind turbine blades. Mech. Syst. Signal Process. 2022, 174, 109067. [Google Scholar] [CrossRef]
  35. Guang, W.; Huang, Z. Data-driven fault-tolerant control design for wind turbines with robust residual generator. IET Control Theory Appl. 2015, 9, 1173–1179. [Google Scholar]
  36. Vidal, Y.; Tutivén, C.; Rodellar, J.; Acho, L. Fault diagnosis and fault-tolerant control of wind turbines via a discrete time controller with a disturbance compensator. Energies 2015, 8, 4300–4316. [Google Scholar] [CrossRef]
  37. Alexandre Magno Ferreira Diniz, Cristiano Hora de Oliveira Fontes, Caiuby Alves Da Costa, Gloria Meyberg Nunes Costa, Dynamic modeling and simulation of a water supply system with applications for improving energy efficiency. Energy Effic. 2015, 8, 417–432. [CrossRef]
  38. Arif, A.; Javed, F.; Arshad, N. Integrating renewables economic dispatch with demand side management in micro-grids: A genetic algorithm-based approach. Energy Effic. 2014, 7, 271–284. [Google Scholar] [CrossRef]
  39. Zemali, Z.; Cherroun, L.; Hadroug, N.; Nadour, M.; Hafaifa, A. Fault Diagnosis-Based Observers using Kalman Filters and Luenberger Estimators: Application to the Pitch System Fault Actuators. Diagn. J. 2023, 24, 2022110. [Google Scholar] [CrossRef]
  40. Laouti, N.; Othman, S.; Alamir, M.; Sheibat-Othman, N. Combination of model-based observer and support vector machines for fault detection of wind turbines. Int. J. Autom. Comput. 2014, 11, 274–287. [Google Scholar] [CrossRef]
  41. Gao, R.; Gao, Z. Pitch control for wind turbine systems using optimization, estimation and compensation. Renew. Energy 2016, 91, 501–515. [Google Scholar] [CrossRef]
  42. Esfahani, P.S.; Pieper, J.K. Machine learning based model linearization of a wind turbine for power regulation. Int. J. Green Energy 2021, 18, 1565–1583. [Google Scholar] [CrossRef]
  43. Laouti, N.; Sheibat-Othman, N.; Othman, S. Support vector machines for fault detection in wind turbines. In Proceedings of the 18th IFAC World Congress, IFAC, Universit´a Cattolica del Sacro Cuore, Milan, Italy, 28 August–2 September 2011; pp. 7067–7072. [Google Scholar]
  44. Zare, S.; Ayati, M. Simultaneous fault diagnosis of wind turbine using multichannel convolutional neural networks. ISA Trans. 2021, 108, 230–239. [Google Scholar] [CrossRef] [PubMed]
  45. Kandukuri, S.T.; Klausen, A.; Karimi, H.R.; Robbersmyrc, K.G. A review of diagnostics and prognostics of low-speed machinery towards wind turbine farm-level health management. Renew. Sustain. Energy Rev. 2016, 53, 697–708. [Google Scholar] [CrossRef]
  46. Yu, W.X.; Lu, Y.; Wang, J.N. Application of small sample virtual expansion and spherical mapping model in wind turbine fault diagnosis. Expert Syst. Appl. 2021, 183, 115397. [Google Scholar] [CrossRef]
  47. Lan, J.; Patton, R.J.; Zhu, X. Fault-tolerant wind turbine pitch control using adaptive sliding mode estimation. Renewable Energy 2018, 116, 219–231. [Google Scholar] [CrossRef]
  48. Tchakoua, P.; Wamkeue, R.; Ouhrouche, M.; Slaoui-Hasnaoui, F. Tommy Andy Tameghe and Gabriel Ekemb, Wind turbine condition monitoring: State-of-the-art review, new trends, and future challenges. Energies 2014, 7, 2595–2630. [Google Scholar] [CrossRef]
  49. Gao, S.; Liu, J. Adaptive fault-tolerant vibration control of a wind turbine blade with actuator stuck. Int. J. Control 2020, 93, 713–724. [Google Scholar] [CrossRef]
  50. Qiao, W.; Lu, D. A Survey on wind turbine condition monitoring and fault diagnosis. Part I: Components and subsystems. IEEE Trans. Ind. Electron. 2015, 62, 6536–6545. [Google Scholar] [CrossRef]
  51. Yang, S.; Wang, R.; Zhou, J.; Chen, B. Intermediate-Variable-Based Distributed Fusion Estimation for Wind Turbine Systems. Actuators 2022, 11, 15. [Google Scholar] [CrossRef]
  52. Fu, Y.; Gao, Z.; Liu, Y.; Zhang, A.; Yin, X. Actuator and sensor fault classification for wind turbine systems based on fast fourier transform and uncorrelated multi-linear principal component analysis techniques. Processes 2020, 8, 1066. [Google Scholar] [CrossRef]
  53. Park, J.; Kim, C.; Dinh, M.-C.; Park, M. Design of a Condition Monitoring System for Wind Turbines. Energies 2022, 15, 464. [Google Scholar] [CrossRef]
  54. Meyer, A. Vibration Fault Diagnosis in Wind Turbines based on Automated Feature Learning. Energies 2022, 15, 1514. [Google Scholar] [CrossRef]
  55. Howard, H.H.; Simani, S. Wind Turbine Pitch Actuator Regulation for Efficient and Reliable Energy Conversion: A Fault-Tolerant Constrained Control Solution. Actuators 2022, 11, 102. [Google Scholar] [CrossRef]
  56. Jing, X.; Wu, Z.; Zhang, L.; Li, Z.; Mu, D. Electrical Fault Diagnosis From Text Data: A Supervised Sentence Embedding Combined With Imbalanced Classification. IEEE Trans. Ind. Electron. 2024, 71, 3064–3073. [Google Scholar] [CrossRef]
  57. Zhi, S.; Shen, H.; Wang, T. Gearbox localized fault detection based on meshing frequency modulation analysis. Appl. Acoust. 2024, 219, 109943. [Google Scholar] [CrossRef]
  58. Zhu, D.; Wang, Z.; Hu, J.; Zou, X.; Kang, Y.; Guerrero, J.M. Rethinking Fault Ride-Through Control of DFIG-Based Wind Turbines From New Perspective of Rotor-Port Impedance Characteristics. IEEE Trans. Sustain. Energy 2024, 15, 2050–2062. [Google Scholar] [CrossRef]
  59. Zhao, D.; Cui, L.; Liu, D. Bearing Weak Fault Feature Extraction Under Time-Varying Speed Conditions Based on Frequency Matching Demodulation Transform. IEEE/ASME Trans. Mechatron. 2023, 28, 1627–1637. [Google Scholar] [CrossRef]
  60. Hu, X.; Tang, T.; Tan, L.; Zhang, H. Fault Detection for Point Machines: A Review, Challenges, and Perspectives. Actuators 2023, 12, 391. [Google Scholar] [CrossRef]
  61. Liu, K.; Nie, G.; Jiao, S.; Gao, B.; Ma, H.; Fu, J.; Mu, J.; Wu, G. Research on fault diagnosis method of vehicle cable terminal based on time series segmentation for graph neural network model. Measurement 2024, 237, 114999. [Google Scholar] [CrossRef]
  62. Yang, J.; Yang, F.; Zhou, Y.; Wang, D.; Li, R.; Wang, G.; Chen, W. A data-driven structural damage detection framework based on parallel convolutional neural network and bidirectional gated recurrent unit. Inf. Sci. 2021, 566, 103–117. [Google Scholar] [CrossRef]
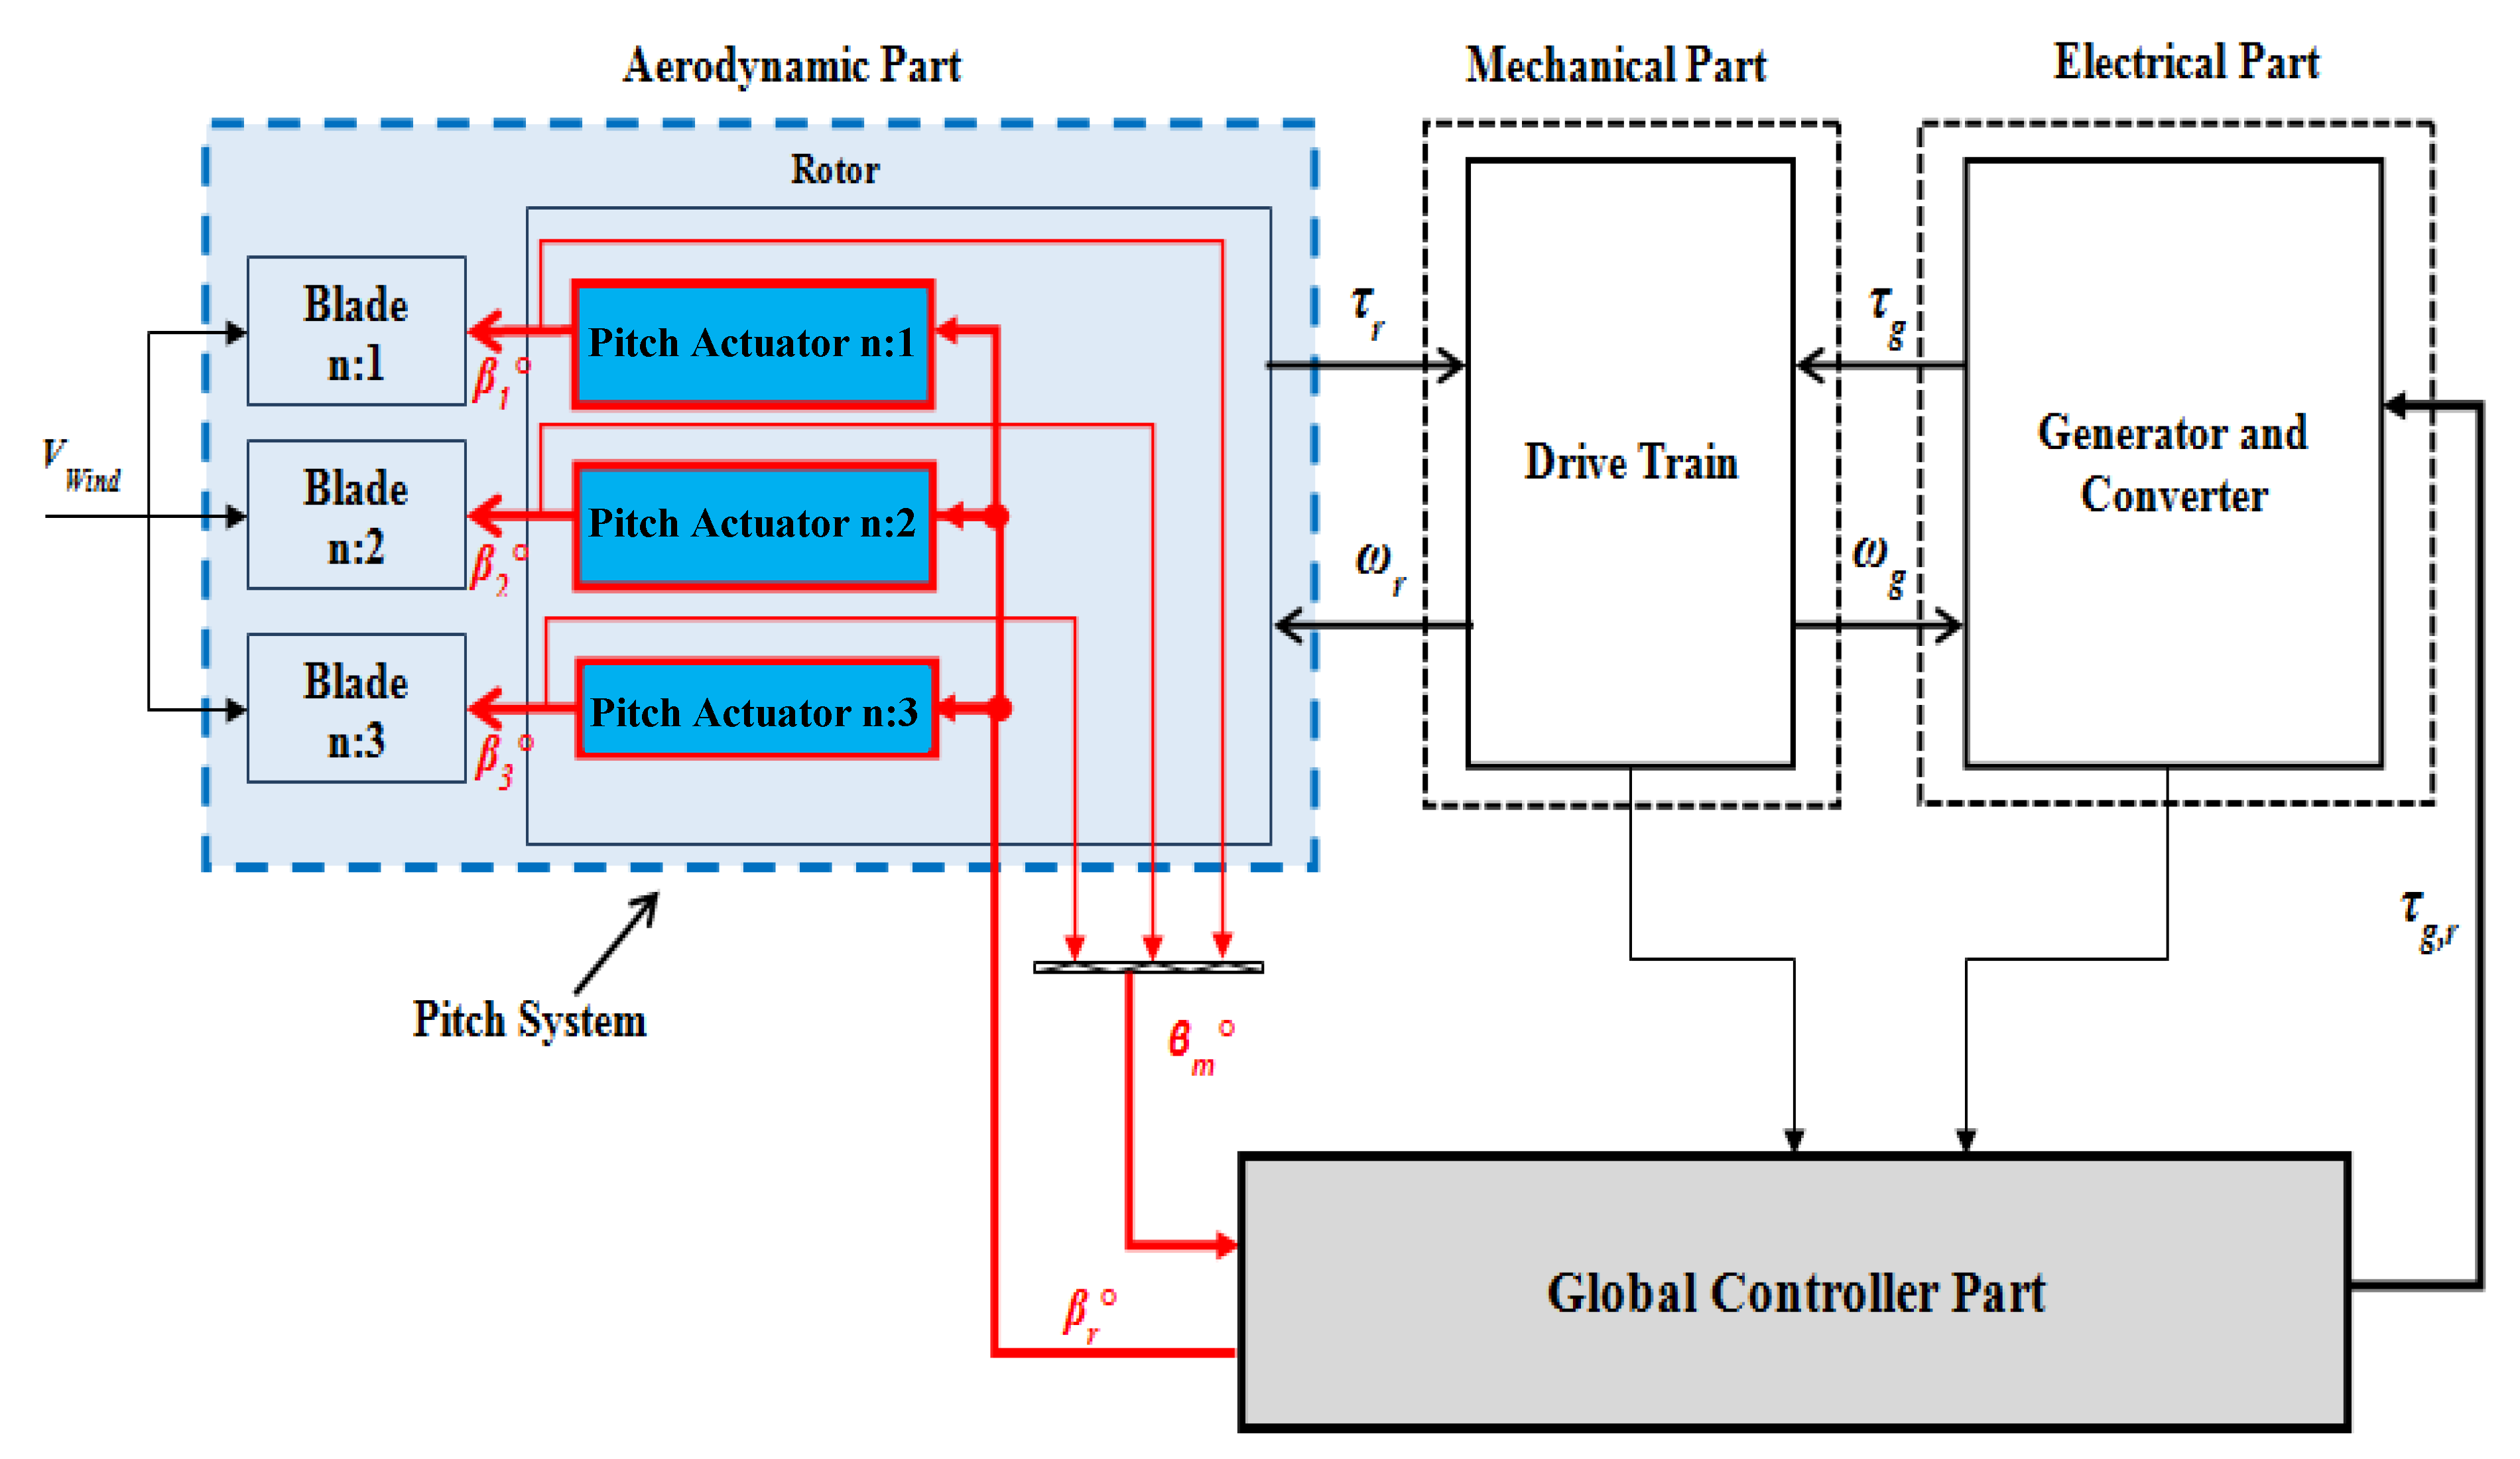
Figure 1. Functional diagram of the wind power system.
Energies 17 04016 g001
Figure 2. (a). Representation of the hydraulic pitch angle system of the three-blade horizontal variable speed wind turbine. (b). Block diagram of the pitch angle system.
Energies 17 04016 g002
Figure 3. Fault detection, localization, and identification diagram for the 1st sub-system.
Energies 17 04016 g003
Figure 4. (a). Electronic logical scheme for sensor fault criteria. (b). Electronic logical scheme for actuator fault criteria.
Energies 17 04016 g004
Figure 5. (a) Global structure of the proposed diagnosis system. (b) Block diagram illustrating the fault diagnosis steps. (c) Overall formulation of the proposed diagnosis approach.
Energies 17 04016 g005aEnergies 17 04016 g005bEnergies 17 04016 g005c
Figure 6. Measurement of {β1.m1 and β1.m2} in the 1st actuator.
Energies 17 04016 g006
Figure 7. Measurement of {β2.m1 and β2.m2} in the 2nd actuator.
Energies 17 04016 g007
Figure 8. Measurement of {β3.m1 and β3.m2} in the 3rd actuator.
Energies 17 04016 g008
Figure 9. Measurement of {β1.m2, β2.m1, and β3.m2} in the used three actuators.
Energies 17 04016 g009
Figure 10. Zoom of measurement signals in the used three actuators.
Energies 17 04016 g010
Figure 11. Variation in the residues {a, b, and c} of the sensors of the first pitch angle actuator.
Energies 17 04016 g011
Figure 12. Zooms on the variations in the residuals {a, b, and c}.
Energies 17 04016 g012
Figure 13. Sensor fault detector signals for the 1st actuator.
Energies 17 04016 g013
Figure 14. Residual signals {d, e, and f} in residual generator.
Energies 17 04016 g014
Figure 15. Zooms of the residual signals {d, e, and f}.
Energies 17 04016 g015
Figure 16. Sensor fault detector signals for the 2nd actuator.
Energies 17 04016 g016
Figure 17. Residual signals {g, h, and i} in the residual generator.
Energies 17 04016 g017
Figure 18. Zooms of the residual signals {g, h, and i}.
Energies 17 04016 g018
Figure 19. Sensor fault detector signals for the 3rd actuator.
Energies 17 04016 g019
Figure 20. Residual signals {j, k, and l} in the residual generator.
Energies 17 04016 g020
Figure 21. Zooms of the residual signals {j, k, and l}.
Energies 17 04016 g021
Figure 22. Residual signals {m, n, and o} in the residual generator.
Energies 17 04016 g022
Figure 23. Zooms of the residual signals {m, n, and o}.
Energies 17 04016 g023
Figure 24. Actuator fault detector signals for the actuators.
Energies 17 04016 g024
Table 1. Defects in the pitch system.
FaultsFault ClassFault TypeFault’s LocationTD(s)
Sensor faults:
F β 1 , m 1 , F β 1 , m 2
F β 2 , m 1 , F β 2 , m 2
F β 3 , m 1 , F β 3 , m 2
A1Fixed
Value
Pitch
Position
Sensors
TD < 10 s
A2Gain
Factor
Actuator faults’:
  F β 1 , F β 2 , F β 3
B3Changed
Dynamics
Pitch
Actuators
TD < 8 s
B4Changed
Dynamics
TD < 100 s
Table 2. The definition of the different generated residuals.
a = β 1 , m 1 β 2 , m 1 b = β 1 , m 1 β 2 , m 1 c = β 1 , m 1 β 2 , m 2
d = β 1 , m 1 β 3 , m 1 e = β 1 , m 1 β 3 , m 2 f = β 1 , m 2 β 2 , m 1
g = β 1 , m 2 β 2 , m 2 h = β 1 , m 2 β 3 , m 1 i = β 1 , m 2 β 3 , m 2
j = β 2 , m 1 β 2 , m 2 k = β 2 , m 1 β 3 , m 1 l = β 2 , m 1 β 3 , m 2
m = β 2 , m 2 β 3 , m 1 n = β 2 , m 2 β 3 , m 2 o = β 3 , m 1 β 3 , m 2
Table 3. Studied selected faults in the pitch system.
FaultFault Type ClassSiteFault Time
F (β1.m1)Fixed valueA1β1.m1[100 s: 200 s]
F (β2.m2)Gain factorA2β2.m2[500 s: 600 s]
F (β3.m1)Fixed valueA1β3.m1[900 s: 1000 s]
F(β2)Changed dynamicsB3β2[3200 s: 3300 s]
F(β3)Changed dynamicsB4β3[3400 s: 3500 s]
Table 4. Summary of the obtained results for the fault detection.
Pitch Sensor and Actuator Faults
FaultDetection Values
SiteTypeClassValuePeriodInfluenced ResidualsResidual Max ValueCriterion
Detector
TD (s)
β1.m1Fixed valueA1−3[100–200 s]a, b, c, d, e3.4469F(β1.m1)0.02
β2.m2Gain factorA25 × β2.m2[500–600 s]c, g, j, m, n2.4911F(β2.m2)0.08
β3.m1Fixed valueA17[900–1000 s]d, h, k, m, o7.4727F(β3.m1)0.01
β2Increase in air content changesB3ζ3 = 0.9
ωn3 = 3.42
[3200–3300 s]b, c, f, g,
k, l, m, n
4.2610F(β2)0.01
β3Hydraulic head loss changesB4ζ3 = 0.45
ωn3 = 5.73
[3400–3500 s]d, e, h, i,
k, l, m, n
3.1461F(β3)22.01
Disclaimer/Publisher’s Note: The statements, opinions and data contained in all publications are solely those of the individual author(s) and contributor(s) and not of MDPI and/or the editor(s). MDPI and/or the editor(s) disclaim responsibility for any injury to people or property resulting from any ideas, methods, instructions or products referred to in the content.