Article

Characteristics and Simulation of Icing Thickness of Overhead Transmission Lines across Various Micro-Terrains

1
School of Electrical Engineering, Beijing Jiaotong University, Beijing 100091, China
2
China Railway Construction Electrification Bureau Group Co., Ltd., Beijing 100043, China
3
China (Beijing) Railway Construction Electrification Design & Research Institute Co., Ltd., Beijing 100043, China
4
Hunan Disaster Prevention Technology Co., Ltd., Changsha 410129, China
5
State Key Laboratory of Disaster Prevention and Reduction for Power Grid, Changsha 410129, China
6
Key Laboratory of Arid Climatic Change and Reducing Disaster of Gansu Province, Lanzhou 730020, China
*
Authors to whom correspondence should be addressed.
Energies 2024, 17(16), 4024; https://doi.org/10.3390/en17164024
Submission received: 16 July 2024 / Revised: 5 August 2024 / Accepted: 9 August 2024 / Published: 14 August 2024

Abstract

:
The hazard of ice accretion on overhead power circuits is significant, yet predicting it is very difficult. The key reason lies in the shortage of sufficient observational data on ice thickness, and previous studies have also rarely taken into account micro-terrain and micro-meteorological conditions. In response to the challenge of simulating overhead line icing, this study introduces a new icing simulation technique that fully considers the effects of micro-terrain and micro-meteorology. For this technique, typical micro-terrains of overhead line areas are first identified by using high-resolution elevation data, and the icing thickness characteristics in different micro-terrains are analyzed. Subsequently, icing thickness simulations for different micro-terrains are conducted. The results indicate that during the icing process, the icing thickness ranges from 5 mm to 8 mm under three types of micro-terrain, namely, “uplift type”, “alpine drainage divide type” and “canyon wind channel type”, whereas the icing thickness is less than 5 mm in the “flat type” of micro-terrain. This finding suggests that the first three micro-terrain types facilitate icing on overhead transmission lines due to the condensation and uplifting effects of water vapor caused by terrain. However, flat terrain lacks the conditions necessary for water vapor accumulation and thus is not easy to form icing. The results are advantageous for the deployment of overhead power lines in intricate terrain. It is advisable to steer clear of regions susceptible to icing, and endeavor to install circuits in level territories whenever feasible. In addition, the simulated icing thickness under different terrains is in good agreement with the observations. Specifically, the correlation coefficient between simulated and observed icing thickness is significant at the 0.99 confidence level, and the deviations between them are within 0.5 mm. This signifies that the forecasting methodologies employed are dependable and possess significant implications as a reference for disaster prevention and mitigation efforts.

1. Introduction

The icing of overhead transmission lines has always been a scientific challenge for power grids and railway overhead catenary systems due to the complexity of meteorological conditions, large geographic and topographic spatial differences and monitoring difficulties [1,2,3,4,5,6]. Investigating the characteristics of overhead transmission line icing and its simulation has great practical significance for deicing overhead transmission lines and ensuring the security of the power grids [7].
The geography and topography of regions where overhead transmission lines are located are vital factors affecting icing [8]. For instance, in terms of mountain orientation, east–west mountain ranges, especially their north slopes, are subject to cold air currents in winter, and thus icing is more severe. In drainage divide and wind gap areas, icing is also more severe since airflows change due to the unique terrain. Additionally, the relationship between the alignment of the overhead transmission lines and the wind direction affects the severity of icing. For example, in the case of an east–west oriented conductor at a 90° angle to the prevailing winter wind direction, icing is more severe. Regions with large relief, such as mountainous areas, are more prone to icing, while terrain with a large slope variability in specific parts is less conducive to icing. Moreover, higher elevations, such as mountainous areas, are more prone to icing since the temperature decreases with altitude and freezing conditions are more likely to be reached. Additionally, other factors such as micro-meteorological conditions, the presence of water bodies and the suspension height of overhead transmission lines also tend to affect icing [9].
Therefore, there is an urgent need to research icing characteristics under different microtopographic conditions to determine the different impacts of terrain on icing. In addition, it is also necessary to conduct studies on icing simulation technology based on micro-meteorology [10,11]. Currently, the simulation techniques for overhead transmission line icing mainly include the integration simulation technique considering multiple parameters and the simulatio technique based on gray system theory [12], providing theoretical support for the simulation of overhead transmission line icing. However, due to the inaccuracy of icing observations and the complexity of micro-terrains, there are still considerable challenges in icing simulation.
Given the above, we first identify the micro-terrains where the overhead transmission lines are located and categorize several typical micro-terrains in this study. Then, we analyze the differences and similarities of overhead transmission line icing under these micro-terrain types to determine the specific effects of terrain. Finally, a micrometeorological-based simulation technique of icing thickness is proposed to investigate the icing prediction ability. This study is expected to further the understanding of regional differences in overhead transmission line icing and provide a new approach for icing simulation.

2. Data and Methods

2.1. Data

Digital elevation model (DEM) data with a spatial resolution of 30 m × 30 m are used in this study, provided by the Computer Network Information Center, Chinese Academy of Sciences (https://www.gscloud.cn, accessed on 10 August 2024). The data have three dimensions (x, y, z), where x, y and z represent longitude, latitude and elevation, respectively. Observation data of icing thickness on overhead transmission lines are also used, which are obtained from a state-owned electric power company. The icing thickness data cover a cooling and icing process during the period 8–11 January 2021. In order to minimize observation uncertainty and guarantee the integrity of observation data, quality control measures were implemented at each station in advance. This involved the removal of outliers that exceeded three times the standard deviation, thereby ensuring the accuracy and reliability of the data.

2.2. Methods

2.2.1. A Micro-Terrain Identification Method

In this study, a new micro-terrain identification method based on high-resolution DEM data is used [13]. In this method, the region involving overhead transmission lines is spatially segmented (Figure 1a) in advance to create several sub-regions. Subsequently, the K-means clustering method is adopted to identify typical microtopographic types and to further determine the characteristics of the micro-terrain in any given region. The steps are briefly described as follows:
  • Data Collection and Data Reconstruction: This is the starting point of the entire classification process, involving the terrain data (grid points). The collected terrain data are cleaned and transformed into sub regions with the same shape and same size.
  • Labeling Samples and Random Sampling: The subregions are labeled as different samples. A few of the labeled samples are selected as initial values (Figure 1a).
  • Clustering: The spatial distance between any arbitrary sample and a randomly selected sample is calculated. The sample with the smallest distance is grouped into the same category, and the center value is re-determined. By repeatedly calculating and re-determining the category to which each sample belongs, the process continues until the classification of the samples no longer changes.

2.2.2. Simulation Approach Based on Historical Data

In the past, the Makkonen model was commonly used to predict overhead transmission line icing, which provides valuable insights into determining the key meteorological factors. Zhou et al. [14] proposed a new approach for overhead transmission line icing prediction, and their simulations were found to be quite close to the observations. In this approach, meteorological factors such as wind speed, humidity and temperature are fully considered, and different types of terrain are also taken into account. In other words, icing thickness simulation is conducted by modeling for different micro-terrains individually. Moreover, their method [15,16,17,18] fully utilizes historical observation data by determining error parameters based on historical data and iteratively applying these parameters to future predictions, thereby enabling short-term icing simulations (Figure 1b).

3. Results

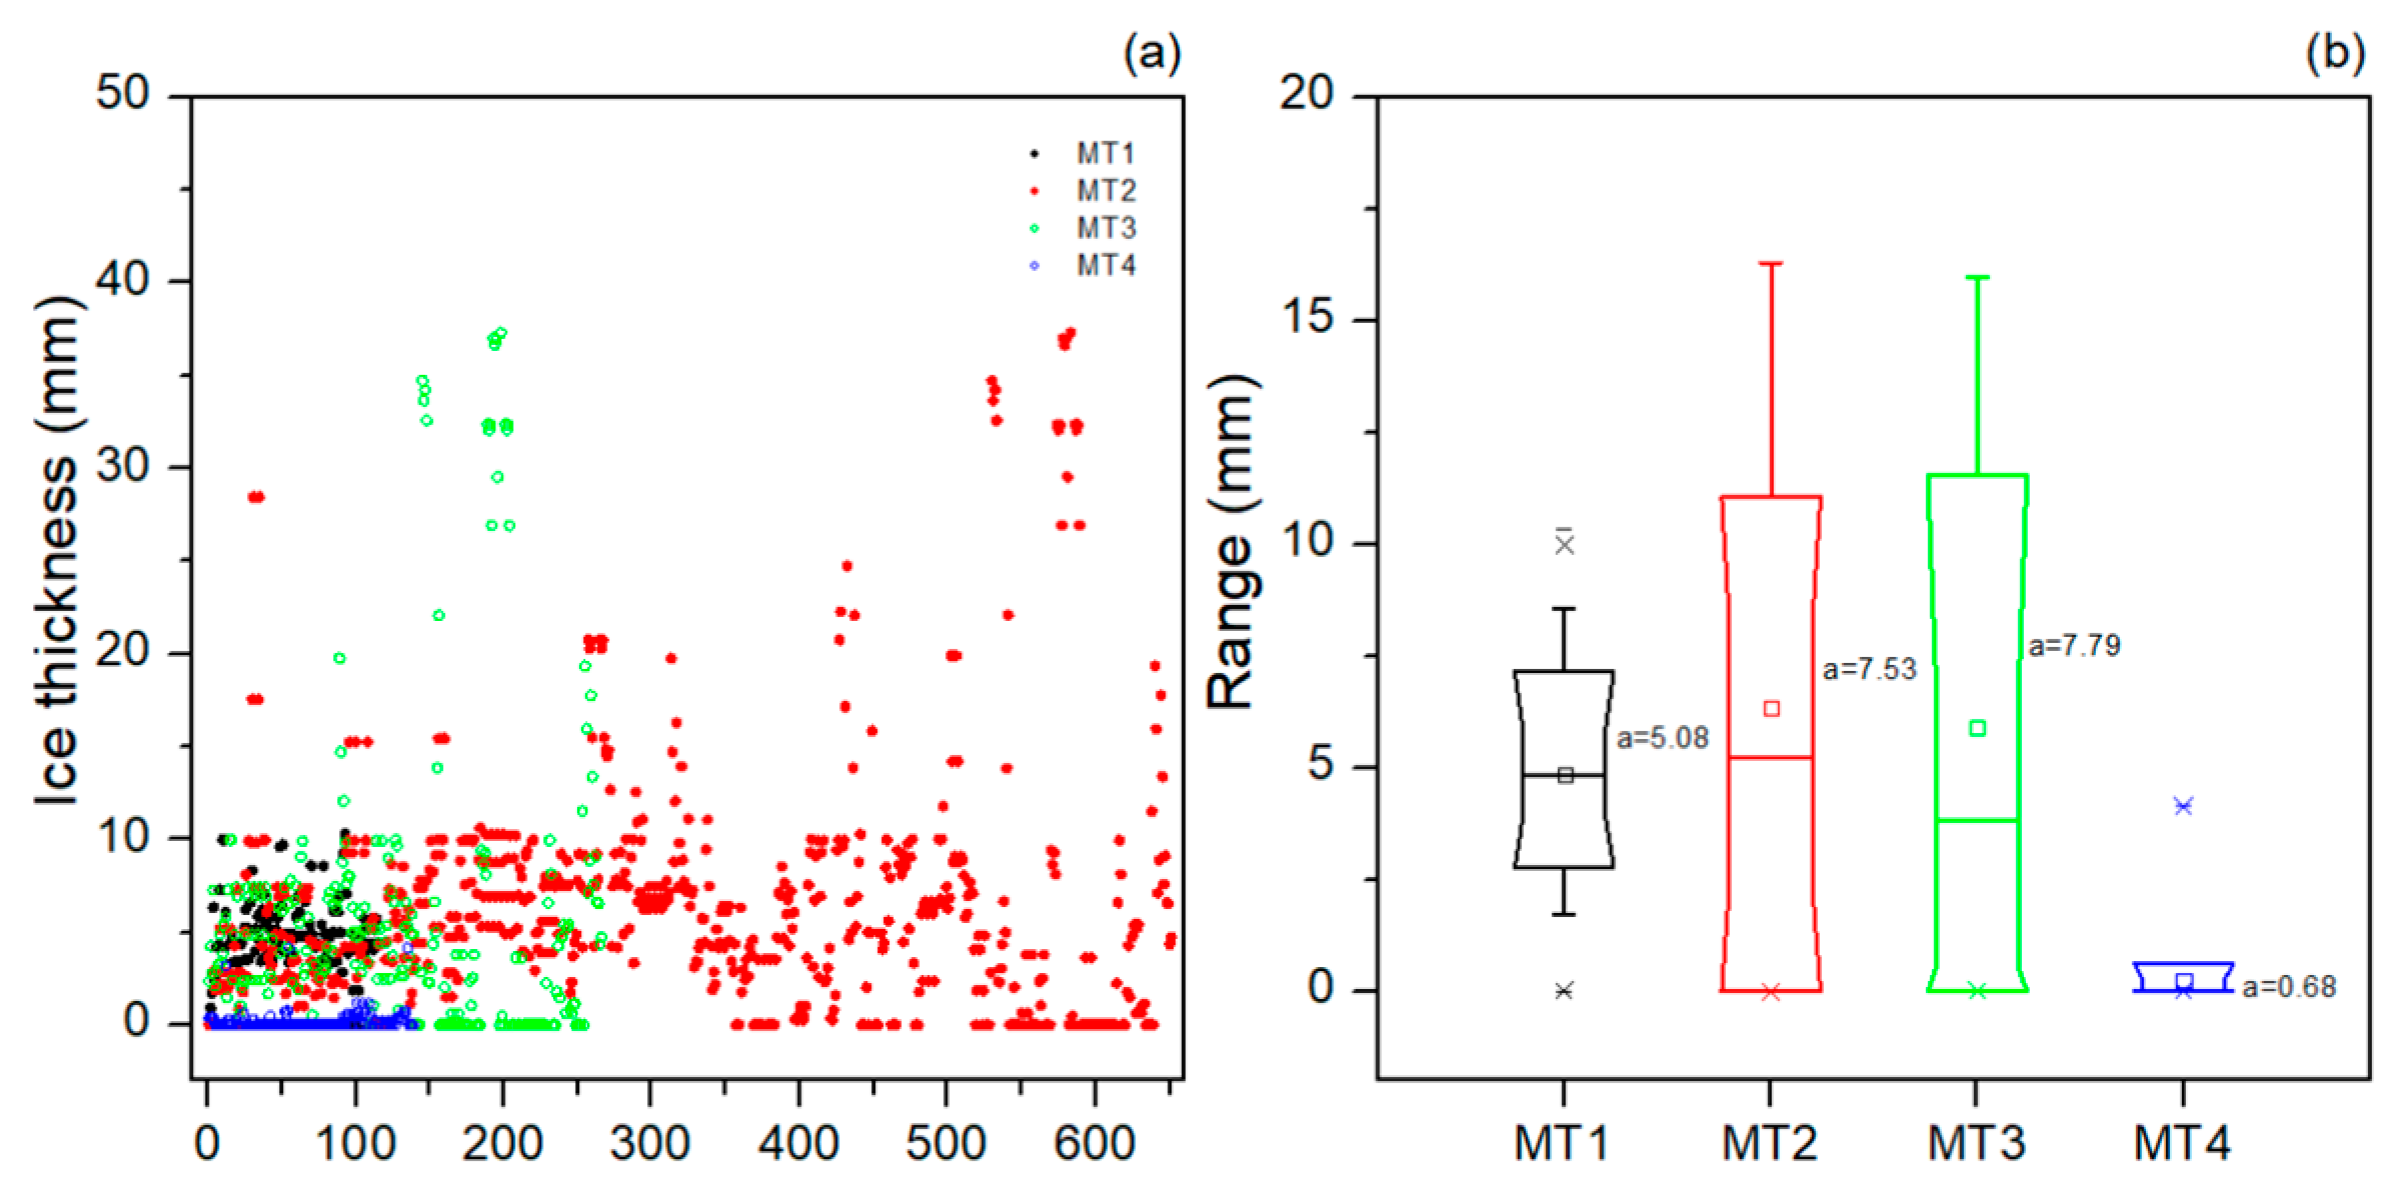
3.1. Typical Microtopographic Types and Icing Characteristics

Based on the K-means method mentioned in Section 2.2.1, there are four typical micro-terrains within the study area: “uplifting type”, “alpine drainage divide type”, “canyon wind channel type” and “flat type”. Specifically, the “uplifting type”, marked as micro-terrain 1 (MT1), features a large topographic relief, elevating from one side to the other. Under the effect of wind (circulation), moist air masses are uplifted and cooled, leading to precipitation or icing on overhead transmission lines (Figure 2a). The “alpine drainage divide type” (MT2), formed by a patchwork of the “uplifting type” on both sides, gradually converges the terrain from both sides to form a ridge (Figure 2b). Air masses climb along the uplifted terrain on both sides, leading to icing on the overhead transmission lines along both slopes (hilltops). The “canyon wind channel type”, marked as MT3, creates a forcing effect on air masses due to the canyon effect (Figure 2c), intensifying wind speed and bringing more moisture and thus resulting in icing on overhead transmission lines together with the temperature decline. Consequently, these three special micro-terrains represent the predominant terrains in the study area that are conducive to icing. Conversely, it is difficult for the “flat type”, marked as MT4, characterized by reduced uplift and flatter topography, to converge moisture (Figure 2d), and thus this type is less prone to icing formation.
The icing thicknesses are separately counted for the four distinct micro-terrains during the icing process. The data consider only instances where icing was observed during the icing process, and days without ice accretion were excluded from the analysis. For MT1, this icing process has 110 records at all stations (Figure 3a). The icing thicknesses of different stations are mainly in the range of 2.50–7.50 mm, with an average thickness of 5.08 mm (Figure 3b). For MT2, there are 549 records of icing at all stations. The icing thicknesses are concentrated in the range of 0–10 mm, with an average icing thickness of 7.53 mm. For MT3, 201 records of icing can be found. Similar to MT2, the icing thicknesses also fall in the range of 0–10 mm, with an average thickness of 7.79 mm. In contrast, in terms of MT4, only 48 icing records are found at all stations, and the icing thickness is almost 0, with an average of only 0.68 mm. This result highlights notable differences in icing thickness on overhead transmission lines under different micro-terrains. For the three types of micro-terrain conducive to water vapor concentration, icing tends to be thicker. However, on flat terrain, it is difficult for water vapor to accumulate, and there is almost no icing.

3.2. Observed and Simulated Icing Thickness under Different Typical Micro-Terrains

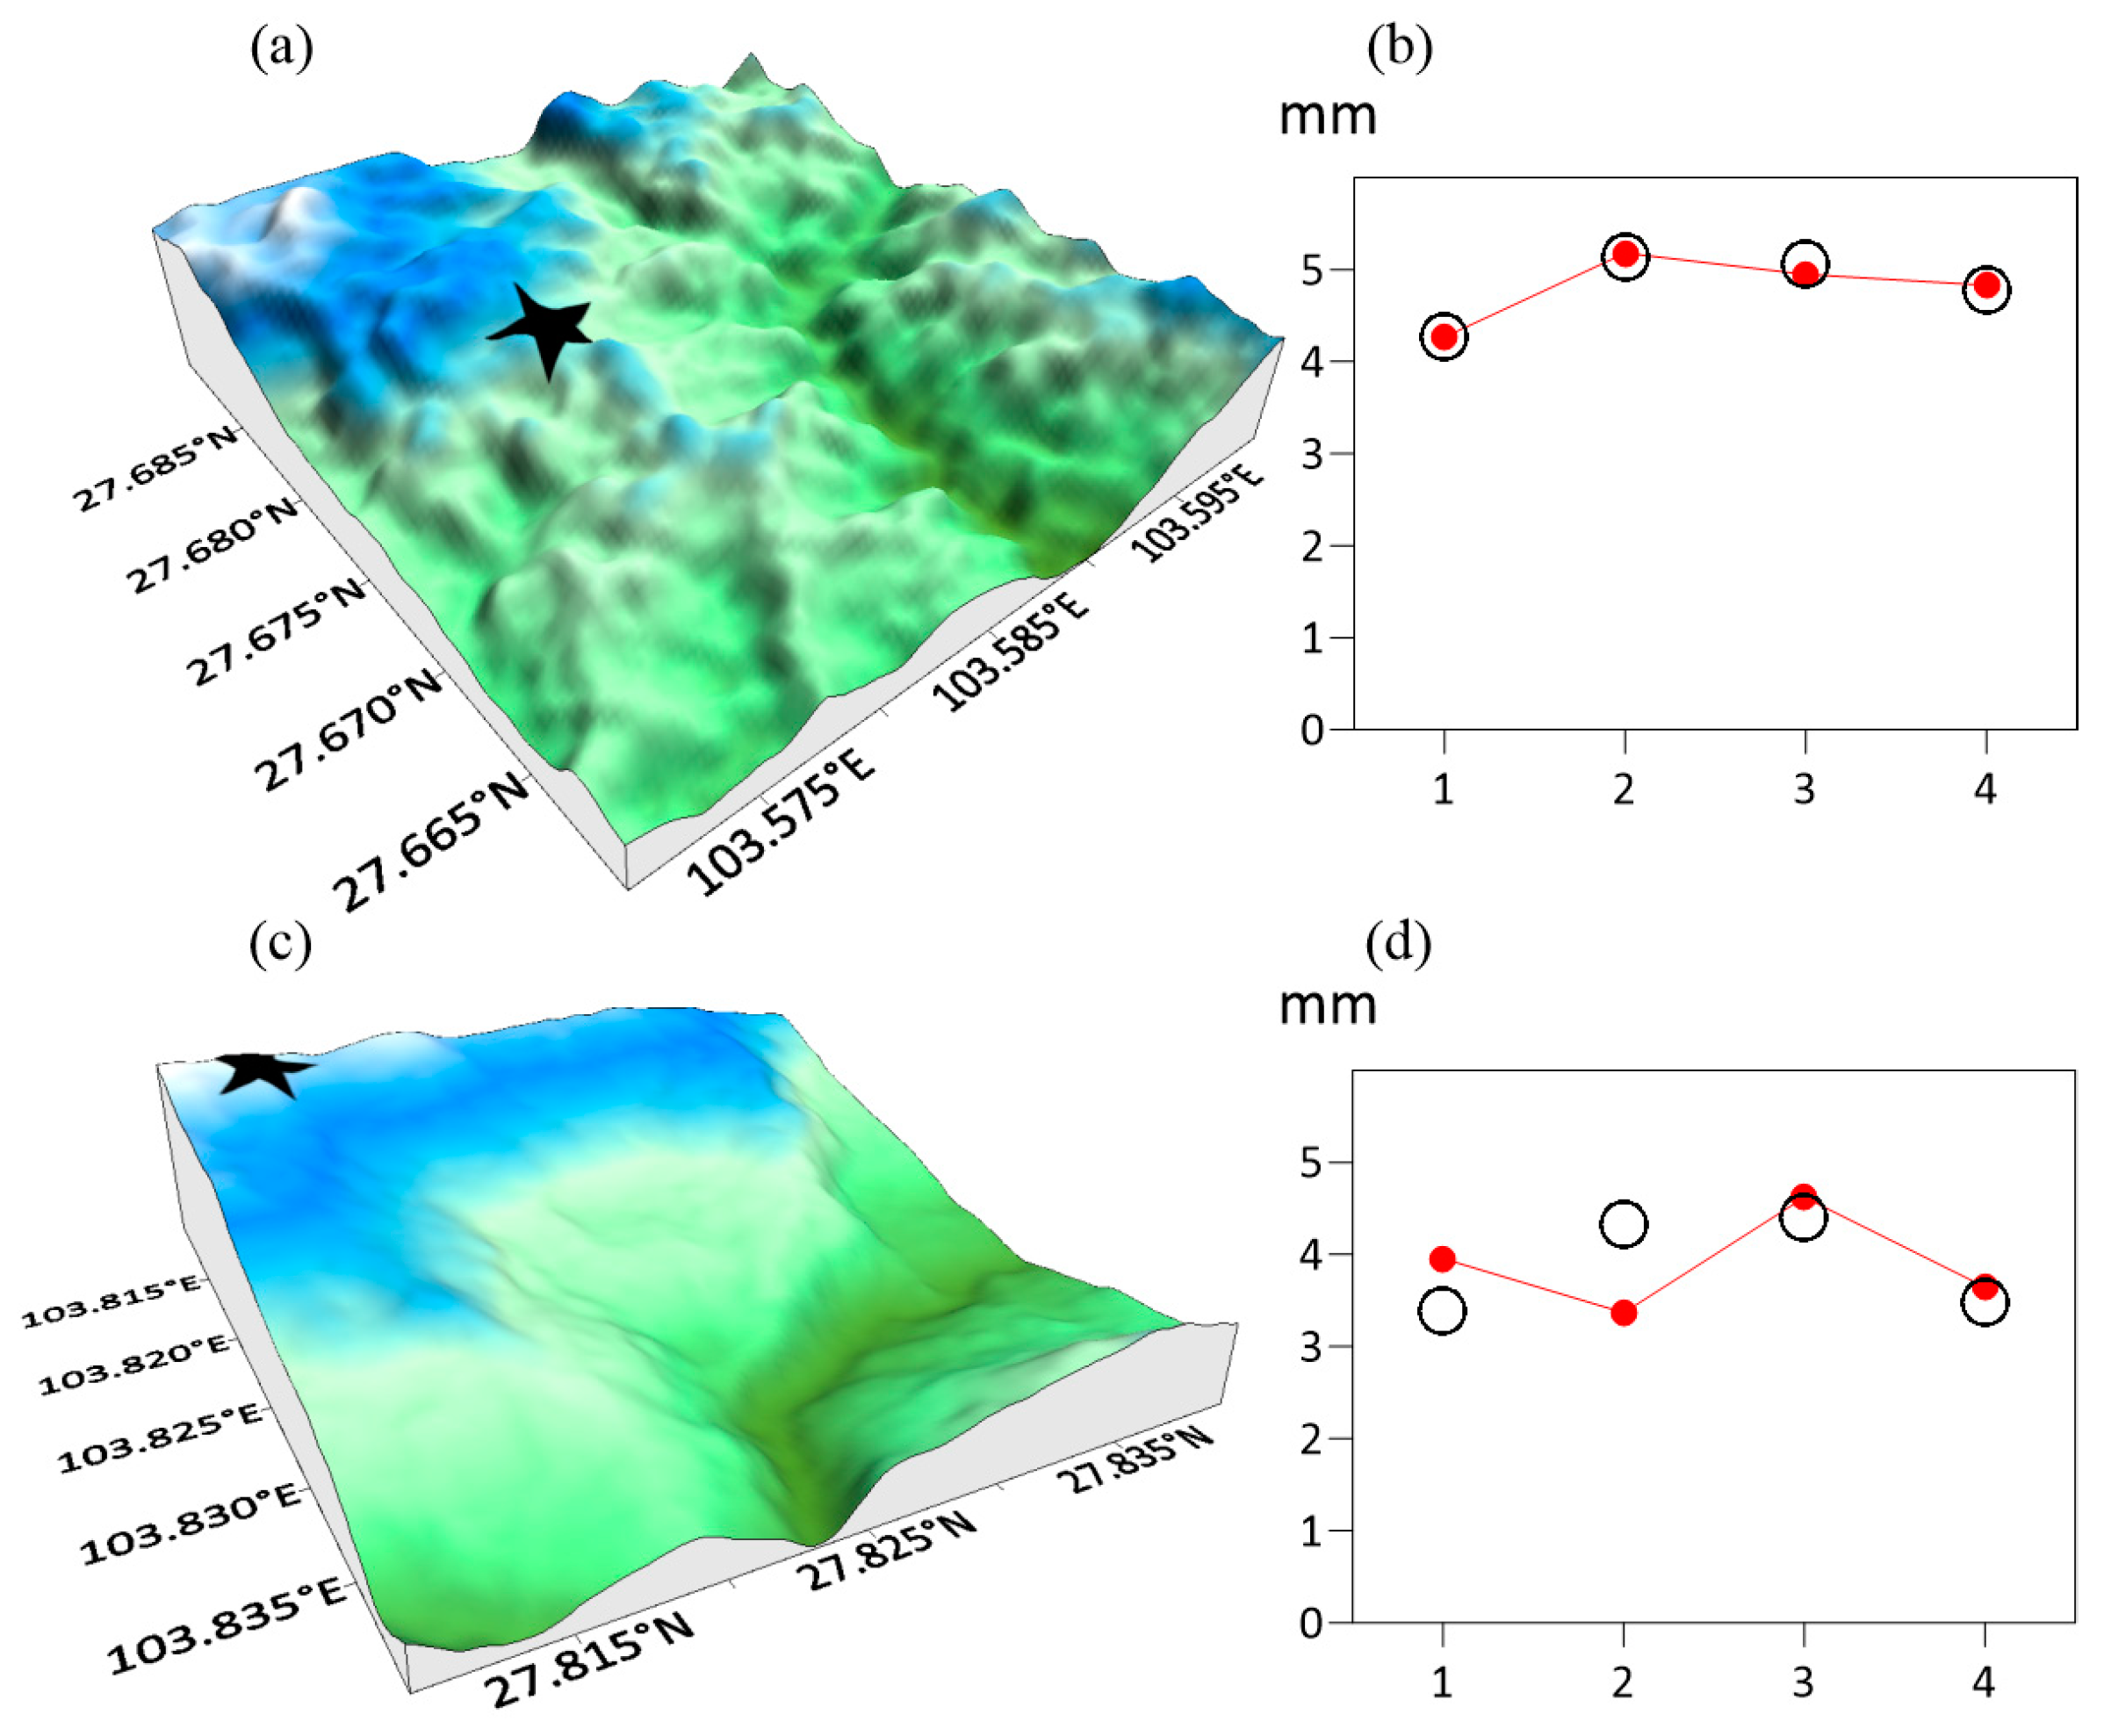
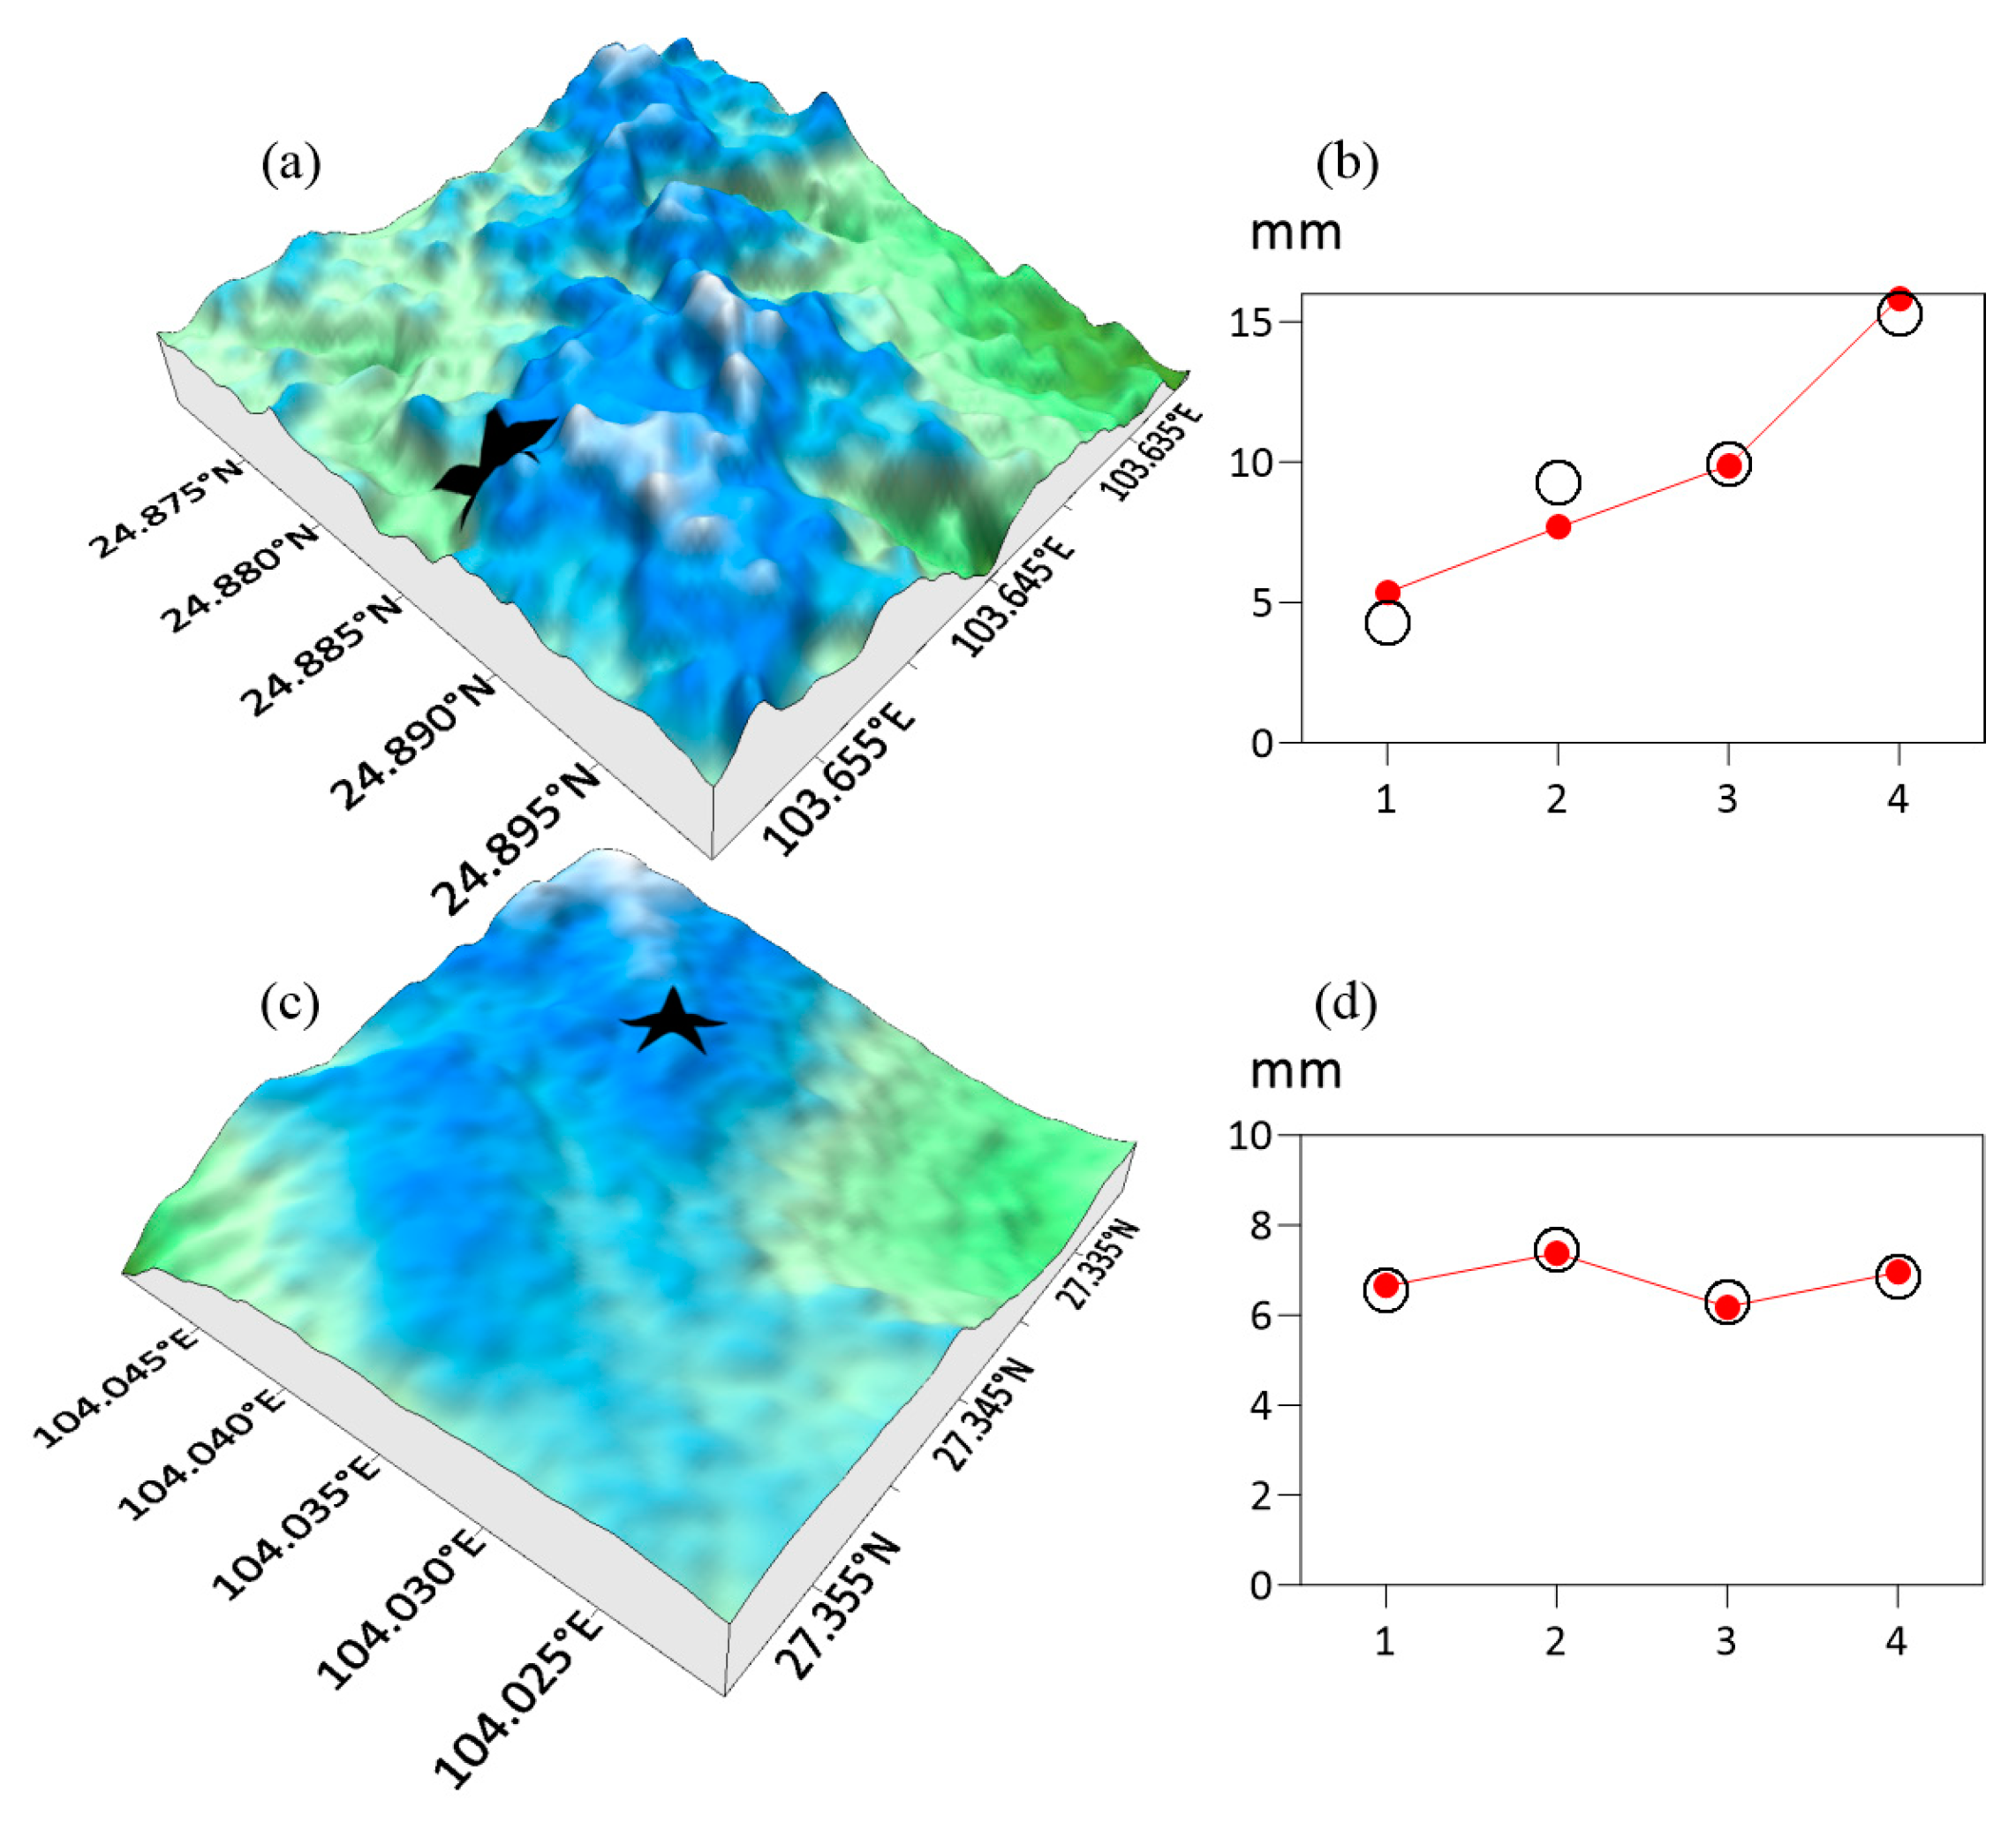
3.2.1. Case Analysis

In this section, we further analyze the observed and simulated icing thickness at different observation stations in the typical micro-terrains (Figure 4, Figure 5, Figure 6 and Figure 7). In Figure 4a, the observation station (103.580° E, 27.678° N) represents MT1, situated on the mid-slope of the “uplifting type”. Its terrain is conducive to the uplift and condensation of water vapor. Therefore, overhead transmission line icing occurred, with observed icing thicknesses of 4.2689 mm, 5.1248 mm, 5.0498 mm and 4.7804 mm during the four days of this icing process (Figure 4b). The icing thickness simulations were 4.2670 mm, 5.1789 mm, 4.9474 mm and 4.8306 mm on these days, close to the observations, with an average deviation of only 0.0522 mm relative to the observations. The other observation station (103.811° E, 27.814° N), as shown in Figure 4c, is located at the top of the slope. The observations indicate that the icing thickness at this station is about 4 mm, as depicted in Figure 4d. The detailed icing thicknesses during the four days of this icing process were 3.3930 mm, 4.3195 mm, 4.4043 mm and 3.4724 mm. The simulated icing thicknesses were 3.9552 mm, 3.3680 mm, 4.6206 mm and 3.6453 mm, with an average deviation of 0.4757 mm relative to the observations.
The pentagram in this figure represents the specific position of the observation point in the microtopography, the black circle represents the observed ice cover thickness, and the red solid line represents the simulated ice cover thickness.
For MT2, two observation stations (103.6301° E, 24.8999° N) and (104.0201° E, 27.3599° E) are also selected. The former observation station is located on the mid-slope of the drainage divide (Figure 5a). During the icing process, the icing thickness gradually increased, with observed values of 4.2560 mm, 9.2897 mm, 9.9516 mm and 15.2538 mm (Figure 5b). The simulation results follow a similar trend, with simulated thicknesses of 5.3600 mm, 7.6701 mm, 9.8790 mm and 15.8420 mm, and an average deviation of 0.8462 mm relative to the observations. The latter observation station is located at the top of the slope (Figure 5c). At this station, air masses from both sides moved towards the middle, uplifted and condensed, resulting in icing with thicknesses of 6.5569 mm, 7.4527 mm, 6.2844 mm and 6.8519 mm. The simulation results (6.6444 mm, 7.3722 mm, 6.1830 mm and 6.9463 mm) are almost the same as the observations, with an average deviation of only 0.0910 mm (Figure 5d).
In terms of MT3, wind channels created by canyons are clearly observed on the micro-terrain where the two observation stations are located. Both observation stations are situated on both sides of the “canyon” (Figure 6a,c). The icing thicknesses of one station (103.950° E, 27.986° N) were 4.7077 mm, 6.0445 mm, 4.8260 mm and 2.8318 mm on the four days of this icing process, showing a decreasing trend. The simulated icing thicknesses were 4.7207 mm, 5.9834 mm, 4.9092 mm and 2.7967 mm, with an average deviation of only 0.0481 mm (Figure 6b). Similarly, for the other station (103.649° E, 24.680° N), also located on the slope, both observed and simulated icing thicknesses show increasing trends. The simulated results were 3.1571 mm, 3.7382 mm, 7.4723 mm and 7.2924 mm, and the observed results were 2.4184 mm, 4.8692 mm, 7.4263 mm and 6.9461 mm, demonstrating good consistency (Figure 6d). The average deviation between them is 0.5655 mm.
Regarding MT4 (Figure 7), the terrain has less undulation, and one observation station (98.672° E, 25.977° N) is located on a low slope (Figure 7a). The observed icing thicknesses were only 0.4010 mm, 0.3731 mm, 0.4286 mm and 0.3452 mm (Figure 7b), while the simulation results were 0.3813 mm, 0.4064 mm, 0.4211 mm and 0.3391 mm, with an average deviation of 0.0166 mm. At the other observation station located on the flat area (Figure 7c), the observations of the icing thickness were 0.4267 mm, 1.1659 mm, 0.7120 mm and 0.0000 mm, and the simulations were 0.4277, 1.1595 mm, 0.7217 mm and 0.0000 mm, with an average deviation of 0.0043 mm. These results on MT4 (“flat” type) further confirm that icing is more likely to occur on MT1–MT3, while it is relatively less likely to occur on the MT4 terrain. Overall, the simulations of icing thickness are quite close to the observations, with an average deviation of less than 0.5 mm.
In summary, under different terrain conditions, especially for those terrains conducive to water vapor convergence, icing is prone to occur on overhead transmission lines. Under different terrains, the icing simulations show a high coincidence with the observations, which implies that the simulation technique used in this study can effectively simulate icing thickness under different terrain conditions.

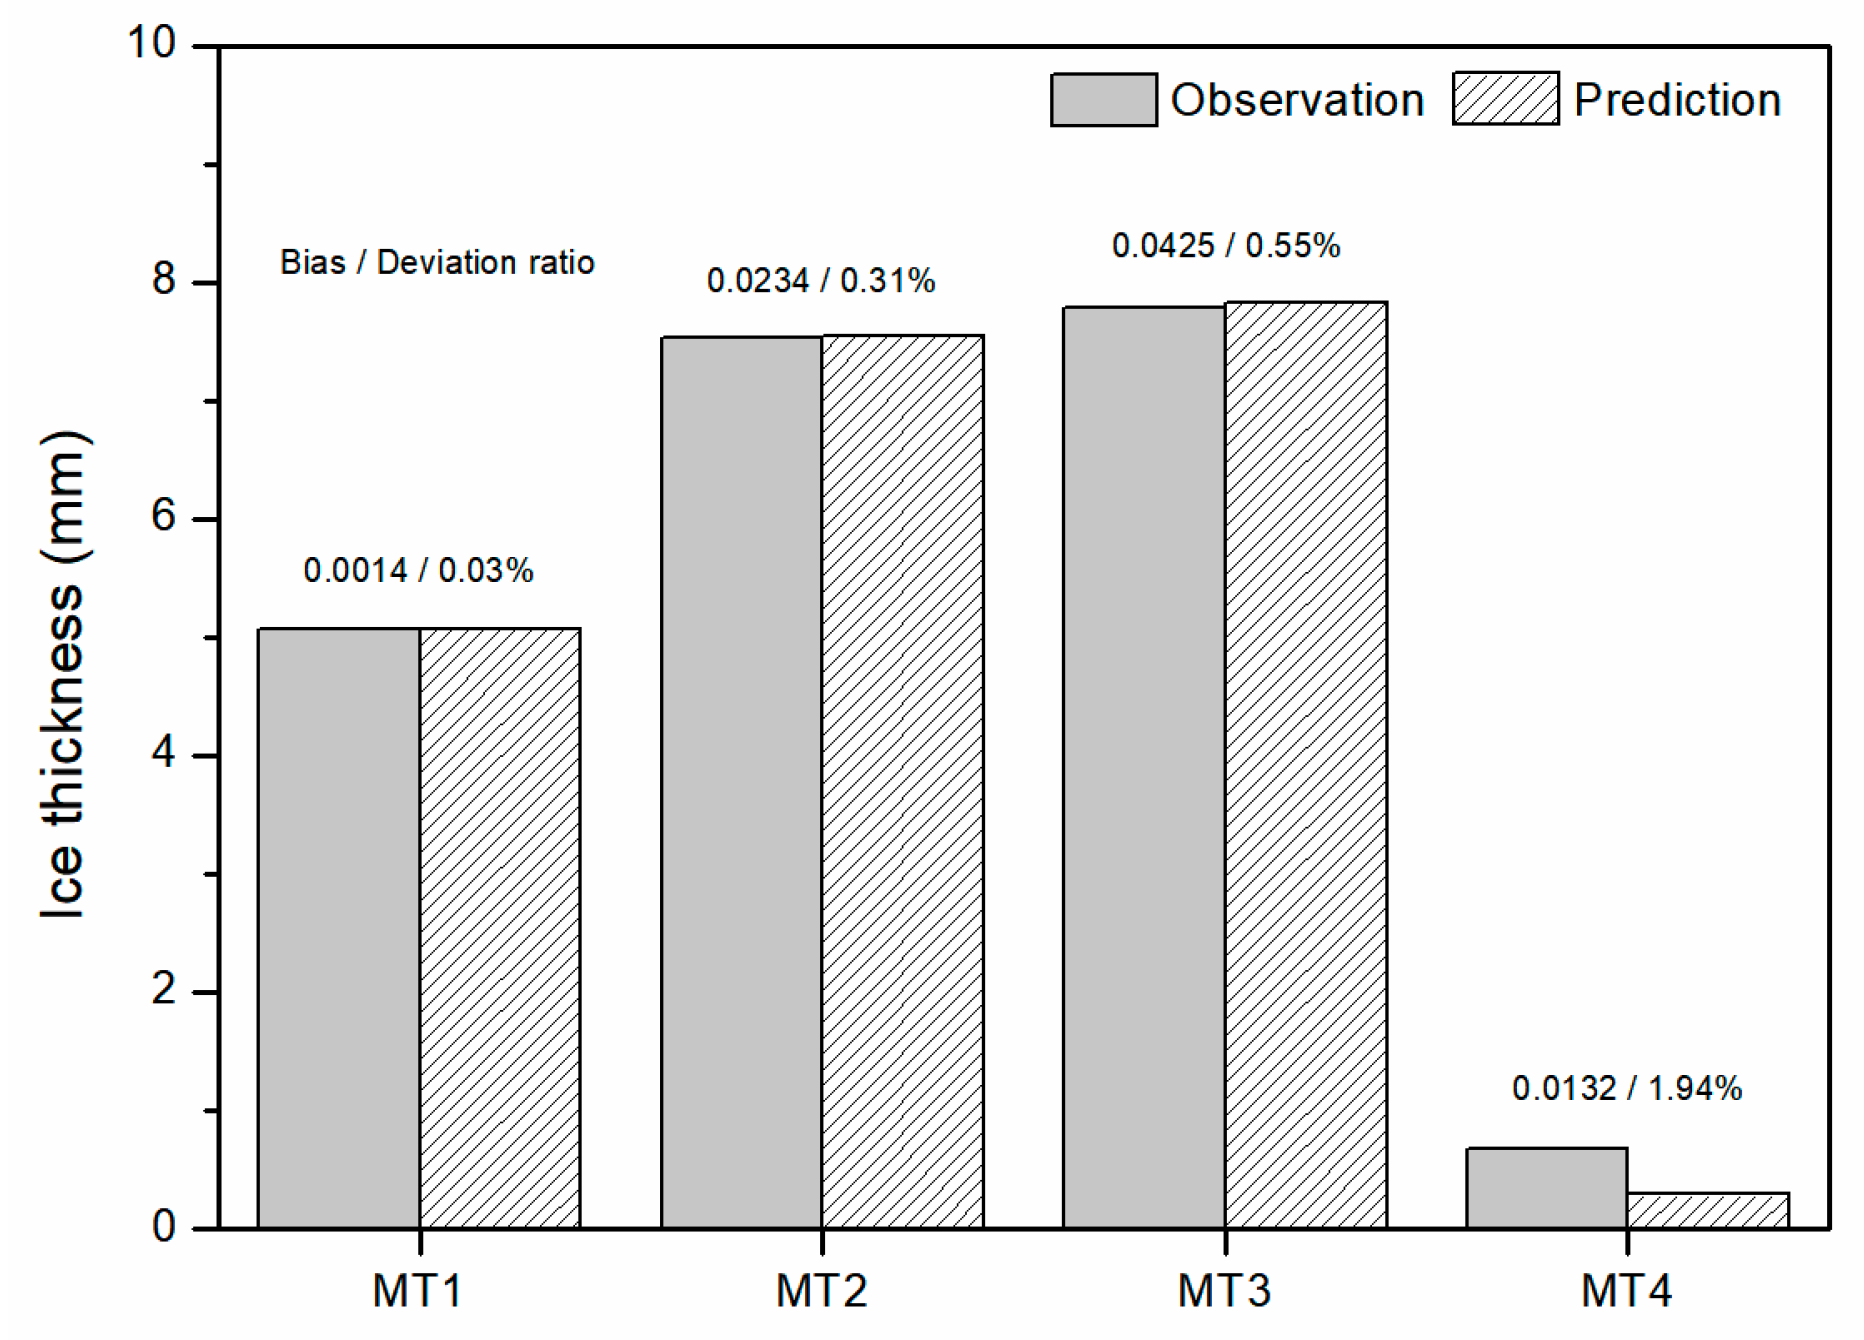
3.2.2. Comprehensive Analysis

The simulations and observations of icing thicknesses under four different terrain conditions are counted to analyze the simulation performance of the technique proposed in this study, as presented in Figure 8. The observed and simulated icing thicknesses were 5.0754 mm and 5.0740 mm in MT1, 7.5324 mm and 7.5558 mm in MT2, and 7.7936 mm and 7.8361 mm in MT3, respectively. The simulation deviations are 0.0015 mm, 0.0235 mm and 0.0425 mm, and the deviation ratios are 0.03%, 0.31% and 0.55%. For MT4, the observed mean icing thickness was 0.6812 mm, and the simulated icing thickness was 0.6680 mm, with an absolute deviation 0.0131mm and a deviation ratio 1.94%.
For the correlation between observations and simulations of icing thickness (Figure 9), the correlation coefficient is the highest in MT4, 0.9959 (with a goodness of fit reaching 0.9917). The second highest correlation coefficient is for MT3, 0.9792 (with a goodness of fit up to 0.9586). The correlation coefficients for MT2 and MT1 are 0.9557 and 0.9436, respectively, with a goodness of fit of 0.9132 and 0.8893, respectively. The correlation between the simulations and observations of icing thickness is high for these four types of terrain, and it is significant at the 0.99 confidence level. This result suggests that the icing thickness simulation method used in this study can effectively reproduce the actual observations. Furthermore, the deviation distribution of the icing thickness simulations for different micro-terrains (Figure 10) indicates that the deviations of icing thickness simulations are symmetrically distributed around 0.0 mm, and they are mainly in the range of ±0.5 mm. Among them, the simulation deviations are the most concentrated in MT4 (with the largest probability), followed by MT1. The deviation distributions of icing thickness simulations in MT2 and MT3 are nearly the same.
Overall, the simulation method for icing thickness proposed in this study is effective in simulating icing thickness in different types of micro-terrain. Specifically, the correlation coefficients are all around 0.95 (significant at the 0.99 confidence level), and the simulation deviations are all less than 0.5 mm.

4. Conclusions and Discussion

The study of the characteristics of overhead transmission line icing and its simulation methods has long been constrained by the development of microtopography and micro-meteorology theories and technologies, as well as the lack of high-quality observation data. This research aims to address these challenges by utilizing high-resolution DEM data to classify the topography of overhead line regions, extract typical micro-terrains and analyze icing thickness characteristics of the overhead transmission lines under different micro-terrains. Subsequently, a novel simulation method is employed to simulate icing thickness under varying micro-terrain conditions, providing new technological perspectives for predicting the icing thickness of overhead transmission lines.
For the three micro-terrain types, namely, “uplifting type”, “alpine drainage divide type” and “canyon wind channel type”, icing thickness is relatively thick, reaching 5–8 mm during the icing process. Conversely, for the micro-terrain of the “flat type”, transmission line icing thickness is generally less than 5 mm. This suggests that the first three types of micro-terrain are more prone to icing on overhead transmission lines by the condensation and uplifting effects of water vapor. In contrast, the flat terrain poses challenges in water vapor accumulation, making it less conducive to icing.
The direction and intensity of air currents are significantly impacted by microtopographic forcing. The findings suggest that valleys and wind gap regions, particularly those exhibiting a “canyon wind channel type” configuration, may experience an increase in air current velocity due to the “wind channel effect”. This acceleration can result in a reduction in temperature, thereby creating optimal conditions for the formation of ice. Additionally, areas adjacent to water bodies, such as lakes and rivers, that possess an ample supply of water vapor, are more susceptible to icing occurrences when the terrain exhibits an upward slope. Similarly, the “alpine drainage divide type” of terrain, due to its unique morphological features, also facilitates the condensation and subsequent icing of water vapor. Conversely, “flat type” terrains do not favor the accumulation of water vapor, thereby diminishing the likelihood of icing.
In addition, the icing simulations under different terrain conditions in this study align closely with the icing observations. The correlation coefficient between simulated and observed icing thickness is about 0.95 (significant at the 0.99 confidence level), and the simulation deviations are less than 0.5 mm, which suggests that the simulation method considering terrain can effectively simulate the icing thickness under different terrain conditions.
It is worth noting that this study only focuses on a single icing event. With sufficient observation data, it is essential to analyze ice thickness characteristics under various terrains as comprehensively as possible to yield more abundant and universal conclusions. Moreover, the icing thickness simulation method used in this study is a preliminary theoretical attempt. It requires further validation and testing for long-term applicability to ensure that this technique can be effectively implemented in practical operations.

Author Contributions

Methodology, G.H. and X.H.; validation, M.W.; data curation, Z.Q.; writing—review and editing, P.Y., X.H. and S.F.; visualization, Q.L.; supervision, G.H. and M.W.; funding acquisition, G.H. All authors have read and agreed to the published version of the manuscript.

Funding

This research is funded by the Science and Technology Research and Development Project (2021-C44) of China Railway Construction Corporation Limited.

Data Availability Statement

Data inquiries can be directed to the corresponding authors.

Conflicts of Interest

Guosheng Huang and Songping Fu was employed by the China Railway Construction Electrification Bureau Group Co., Ltd. Zhen Qiao was employed by the company China (Beijing) Railway Construction Electrification Design & Research Institute Co., Ltd. Xiaowei Huai and Pengcheng Yan was employed by the Hunan Disaster Prevention Technology Co., Ltd. The remaining authors declare that the research was conducted in the absence of any commercial or financial relationships that could be construed as a potential conflict of interest. The funders had no role in the design of the study; in the collection, analyses, or interpretation of data; in the writing of the manuscript, or in the decision to publish the results. This paper represents the opinions of the authors and does not mean to represent the position or opinions of the Beijing Jiaotong University.

References

  1. Zhang, R.Z.; Zhou, K.; Zhao, L.X.; Tan, L.; Li, H.D.; Wang, Y.N.; Cai, Y.S.; Li, C.S.; Chen, S. Research on Prediction Technology of Power Transmission Line Icing Based on Micrometeorological and Microtopography in Beijing Area. Sci. Technol. Eng. 2022, 22, 14744–14751. [Google Scholar]
  2. Yang, L.; Chen, J.; Hao, Y.P.; Li, L.C.; Lin, X.H.; Yu, L.; Li, Y.; Yuan, Z.Y. Experimental Study on Ultrasonic Detection Method of Ice Thickness for 10 kV Overhead Transmission Lines. IEEE Trans. Instrum. Meas. 2023, 72, 9001110. [Google Scholar] [CrossRef]
  3. Hao, Y.P.; Wang, X.Y.; Liang, W.; Zhang, W.X.; He, J.Q.; Wang, J.X.; Li, H.; Wen, Y.; Mao, X.Y. Ice Types Identification and Prediction of Overhead Transmission Lines Driven by Micro-Meteorological Data of Three Consecutive Days Icing. South. Power Syst. Technol. 2023, 17, 107–116. [Google Scholar]
  4. Zhang, Z.J.; Zhang, H.; Yue, S.; Zeng, W.H. A Review of Icing and Anti-Icing Technology for Transmission Lines. Energies 2023, 16, 601. [Google Scholar] [CrossRef]
  5. Wang, Y.; Du, Z.Y.; Ruan, J.J. Reliability risk evaluation for the high voltage overhead transmission line under icing condition. Power Syst. Prot. Control 2016, 44, 84–90. [Google Scholar]
  6. Huai, X.W.; Yan, P.C.; Li, L.; Cai, Z.L.; Xu, X.J.; Hu, X.H. Study on the Complexity Reduction of Observed Sequences Based on Different Sampling Methods: A Case of Wind Speed Data. Atmosphere 2022, 13, 1746. [Google Scholar] [CrossRef]
  7. Li, H.K.; Chen, F.F.; Gao, X. An Overview of the Research Situation on the Covering Ice of Overhead Lines. Electr. Eng. 2017, 10, 13–15. [Google Scholar]
  8. Zhou, S.Y.; Wei, W.J.; Li, W.J.; Li, M.M.; Chen, T.; Dai, J.L.; Yi, J.H. Research on Ice-Covered Growth Model of Transmission Line Based on Multi-Parameter Fusion and Risk Warning. Smart Grid 2019, 9, 236–243. [Google Scholar] [CrossRef]
  9. Yan, J.F.; Chen, S.P.; Geng, Y.Y.; Yang, L.Z.; Shen, Y.B. Study on the Correlation between Typical Microtopography and Icing on Overhead Transmission Lines and Its Prediction Technology. Electr. Eng. 2023, 12, 55–56. [Google Scholar]
  10. Ding, Z.; Zhang, X.; Zou, N.; Xiong, F.; Zhang, Y. Phi-OTDR Based On-line Monitoring of Overhead Power Transmission Line. J. Light. Technol. 2021, 39, 5163–5169. [Google Scholar] [CrossRef]
  11. Huang, X.Y.; Yao, Y.; Qi, L.Q. Prediction Method of Ice Thickness for Transmission Lines under Micro-Meteorological Conditions. J. Electr. Eng. 2018, 6, 22–27. [Google Scholar]
  12. Mo, S.; Liu, T.Q.; Zeng, Q. Research on Accurate Prediction Model for Icing Thickness of Transmission Lines in Ultra—Short Period. Sichuan Electr. Power Technol. 2018, 41, 32–37. [Google Scholar]
  13. Zhou, F.R.; Huai, X.W.; Yan, P.C.; Zhao, C.L.; Jiang, X.L.; Pan, H.; Ma, Y.T.; Geng, H. Research on the Identification of Typical Terrain Patterns in Yunnan Province Based on the K-Means Technology. Atmosphere 2024, 15, 244. [Google Scholar] [CrossRef]
  14. Zhou, F.R.; Huai, X.W.; Yan, P.C.; Jiang, X.L.; Pan, H.; Ma, Y.T.; Geng, H. Research on Wire Icing Simulation Technology Considering the Weights of Meteorological Elements. Front. Energy Res. 2024, 12, 1346480. [Google Scholar] [CrossRef]
  15. Zhang, T.J.; Yan, P.C.; Li, Z.R.; Wang, Y.S.; Li, Y.H. Bias-correction method for wind-speed forecasting. Meteorol. Z. 2019, 28, 293–304. [Google Scholar] [CrossRef]
  16. Zhang, T.J.; Yan, P.C.; Li, Z.R.; Wang, Y.S.; Li, Y.H. A new cycle correction method for wind speed error in wind energy forecast based on short-term historical data. J. Arid. Meteorol. 2017, 35, 1042–1052. [Google Scholar] [CrossRef]
  17. Zhang, T.J.; Yan, P.C.; Zhang, Z.Y.; Duan, H.X.; Wang, Y.S.; Li, Y.H. Application of various technologies in modification of wind speed forecast in wind farms. J. Arid. Meteorol. 2018, 36, 835–844. [Google Scholar] [CrossRef]
  18. Han, Z.F.; Yan, P.C.; Li, Y.; Lv, Q.Q.; Zhang, T.J.; Bian, H.W.; Wang, Y.Z.; Zhang, L. Study on correction of solar radiation forecast in He xi region of Gansu Province based on short-term historical data. J. Arid. Meteorol. 2022, 40, 125–134. [Google Scholar] [CrossRef]
Figure 1. Schematic diagram of micro-terrain recognition technology, with red lines representing line distribution and boxes representing segmented micro terrain (a) and schematic diagram of ice cover simulation method (b).
Energies 17 04024 g001
Figure 2. Schematic diagram of four typical terrains and water vapor paths. (a) The “uplifting type”, MT1; (b) The “alpine drainage divide type”, MT2; (c) The “canyon wind channel type”, MT3; (d) The “flat type”, MT4.
Energies 17 04024 g002
Figure 3. Characteristics of ice cover thickness under different terrains: (a) distribution with station numbers, and (b) box plot, where blocks and ‘a’ represent the mean and asterisks represent the extreme values.
Energies 17 04024 g003
Figure 4. Microtopography “uplift type” in two different locations (a,c), with the pentagram representing the specific position of the observation point in the microtopography. Observed (black circle) and simulation (red solid line) ice cover thickness of the observation point (b,d).
Energies 17 04024 g004
Figure 5. Microtopography “high mountain watershed type” in two different locations (a,c), with the pentagram representing the specific position of the observation point in the microtopography. Observed (black circle) and simulation (red solid line) ice cover thickness of the observation point (b,d).
Energies 17 04024 g005
Figure 6. Microtopography “canyon wind channel type” in two different locations (a,c), with the pentagram representing the specific position of the observation point in the microtopography. Observed (black circle) and simulation (red solid line) ice cover thickness of the observation point (b,d).
Energies 17 04024 g006
Figure 7. Microtopography “flat” in two different locations (a,c), with the pentagram representing the specific position of the observation point in the microtopography. Observed (black circle) and simulation (red solid line) ice cover thickness of the observation point (b,d).
Energies 17 04024 g007
Figure 8. Observation and prediction of ice thickness under different terrains.
Energies 17 04024 g008
Figure 9. Correlation between observation and simulation of ice thickness under different terrains. (a) MT1, (b) MT2, (c) MT3, (d) MT4.
Energies 17 04024 g009
Figure 10. Simulated deviation statistics of ice thickness under different terrains (b), and the subgraph (a) is an enlarged version of the original image within the range of (−2, 2). The y-axis is the frequency, which indicates the number of simulation times of ice thickness under this microtopography.
Energies 17 04024 g010
Disclaimer/Publisher’s Note: The statements, opinions and data contained in all publications are solely those of the individual author(s) and contributor(s) and not of MDPI and/or the editor(s). MDPI and/or the editor(s) disclaim responsibility for any injury to people or property resulting from any ideas, methods, instructions or products referred to in the content.

