Article

Comparison of Pore Structure Characteristics of Shale-Oil and Tight-Oil Reservoirs in the Fengcheng Formation in Mahu Sag

1
PetroChina Qinghai Oilfield Company, Dunhuang 736200, China
2
Research Institute of Exploration and Development, PetroChina Xinjiang Oilfield Company, Karamay 834000, China
3
Institute of Energy, Peking University, Beijing 100871, China
4
Research Institute of BGP Inc., China National Petroleum Corporation, Zhuozhou 072751, China
5
Xinjiang Research Institute of Huairou Laboratory, Urumqi 830000, China
*
Author to whom correspondence should be addressed.
Energies 2024, 17(16), 4027; https://doi.org/10.3390/en17164027
Submission received: 12 July 2024 / Revised: 3 August 2024 / Accepted: 5 August 2024 / Published: 14 August 2024
(This article belongs to the Special Issue Advanced Technologies in Oil Shale Conversion)

Abstract

:
Despite the abundance of shale-oil and tight-oil reserves in the Fengcheng Formation within the Mahu Sag, exploration and development efforts for both types of reservoir are still in their early stages. A comprehensive examination and comparison of the pore structures of these reservoirs can establish rational classification and evaluation criteria. However, there is a dearth of comparative analyses focusing on the pore structures of shale-oil and tight-oil reservoirs within the Fengcheng Formation. This study addresses this gap by systematically analyzing and comparing the pore structures of these reservoirs using various techniques such as X-ray diffraction (XRD), scanning electron microscopy (SEM), low-temperature nitrogen adsorption, and mercury intrusion capillary pressure experiments (MICP). The results show that the shale oil within the Fengcheng Formation exhibits a higher content of carbonic acid compared to the tight-oil samples. Furthermore, it demonstrates smaller displacement pressure and median pressure, a larger sorting coefficient, and superior permeability in contrast to tight oil. Notably, the shale oil within the Fengcheng Formation is characterized by abundant striated layer structures and micro-fractures, which significantly contribute to the microstructural disparities between shale-oil and tight-oil reservoirs. These differences in microstructures between shale oil and tight oil within the Fengcheng Formation in the Mahu Sag region delineate distinct criteria for evaluating sweet spots in shale-oil and tight-oil reservoirs.

1. Introduction

China has abundant unconventional oil and gas resources [1,2,3], primarily located in the Ordos Basin [4,5,6], Songliao Basin [7,8,9], and Junggar Basin [10,11,12]. Compared to conventional reservoirs, unconventional oil and gas reservoirs show strong heterogeneity and intricate pore structures with tight pore throat sizes, resulting in significant geological differences in terms of oil and gas molecular aggregation units, migration modes, etc. Therefore, pore structure plays a crucial role in understanding and describing the geological characteristics [13,14,15,16], migration modes [17,18,19,20], and occurrence states of unconventional oil and gas [21,22,23,24,25].
The characterization of pore structure has always been a major focus and challenge in the research of unconventional oil and gas reservoirs. Many researchers have utilized a combination of nitrogen adsorption, mercury intrusion capillary pressure (MICP), and scanning electron microscopy (SEM) to characterize the pore structure of unconventional oil and gas reservoirs. Numerous studies reveal that shales are abundant in nanopores, with their sizes typically ranging from 5 to 100 nanometers, as observed through scanning electron microscopy (SEM) [26,27,28,29]. MICP can characterize the pore size ranging from the nanoscale to the microscale [30,31]. However, a pore size below 3.6 nm is difficult to measure by MICP methods, but the practical limit may be higher [32,33]. The N2 adsorption method has been widely conducted in previous studies [34,35,36,37]. It can characterize a pore size ranging from 2 to 200 nm [38]. In N2 adsorption experiments, models such as Brunauer–Emmett–Teller (BET), Barrett–Joyner–Halenda (BJH), Horvath–Kavazoe (HK), and density functional theory (DFT) are used to analyze the experimental data and derive pore structure parameters [37]. In practice, MICP is usually used in conjunction with N2 adsorption to provide a comprehensive range of pore sizes [39,40].
Sun et al. [41] used nitrogen adsorption, mercury intrusion, nuclear magnetic resonance (NMR), small-angle X-ray scattering (SAXS), and other methods to characterize the pores of mudstone samples, thus quantitatively studying the pore structure of shale-oil reservoirs and obtaining relevant parameters through calculations. Fu et al. [42] and Yang et al. [43], through scanning electron microscopy and other methods, found that residual intergranular pores, dissolution pores, illite intergranular pores, and organic matter pores developed in the Triassic Chang 7 shale-oil reservoirs in the Ordos Basin. Organic matter pores are isolated and distributed, with reservoir pores and throats at the nanometer scale, featuring cluster-like complex pore–throat units. In the Songliao Basin, the Lower Cretaceous Qingshankou Formation shale oil mainly develops in the lower parts of the Q1 and Q2 members. Studies have found that its matrix pore network consists of pores ranging from the nanometer to the micrometer scale. Pore types mainly include intergranular pores, intragranular pores, intercrystalline pores, and organic matter pores [44,45], while the presence of microfractures helps improve reservoir permeability [46]. Shale-oil resources in the Junggar Basin are mainly distributed in the Fengcheng Formation of the Permian Mahu Sag and the Lulehe Formation of the Permian Jimusaer Depression. Zhi et al. [47] and others, through core, thin section, and SEM analysis, found that the Lulehe Formation shale-oil reservoir in the Jimusaer Depression has low porosity and permeability. The types of pore mainly include intergranular dissolution pores formed by volcanic ash dissolution, intragranular dissolution pores, intercrystalline pores, and microfractures formed by feldspar dissolution, as well as a small amount of intergranular dissolution pores and intragranular pores within biogenic frameworks. The reservoir rocks mainly consist of sheet-like, curved sheet-like, and tubular-shaped throats, with developed nanoscale throats [48].
For tight-oil reservoirs, Zhu et al. [49] summarized the characterization methods of pore structure into two categories: qualitative characterization methods, including two-dimensional optical microscopy and field emission scanning electron microscopy (FIB-SEM), as well as three-dimensional CT scanning, focused ion beam scanning electron microscopy (FIB-SEM), and synchrotron scanning, and the quantitative characterization methods, includes high-pressure mercury intrusion, gas adsorption, helium porosity, and small-angle scattering. The Ordos Basin is the most abundant area of tight oil in China, with the main development layers being the Chang 6, Chang 7, and Chang 8 oil layers [50,51]. Studies have shown that the Chang 6–Chang 8 oil layers are characterized by extremely low porosity and ultra-low permeability [51], with the pore types mainly consisting of intragranular dissolution pores, intergranular pores, cement dissolution pores, and filling micro-pores in the Chang 6 and Chang 7 tight-oil reservoirs [6,51,52]. The Chang 8 tight-oil reservoir primarily features intercrystalline pores, intergranular pores, and microfractures [50,53], with porosity ranging from 9% to 15%. The reservoir space of the Qingshankou Formation 2nd and 3rd members in the Songliao Basin mainly consists of intergranular pores and intragranular micropores [54], with a small amount of developed dissolution pores and microfractures [55], and porosity distributed between 2% and 15%. The 3rd and 4th members of the Quantou Formation develop intergranular pores, dissolution pores, and intercrystalline pores, with porosity mainly distributed between 4% and 14% [56]. In the Junggar Basin, the Lulehe Formation of the Jimusaer Depression develops tight-oil reservoirs, characterized by large effective thickness, extensive distribution area, and low porosity and ultra-low permeability [57]. The reservoir space of the Lulehe Formation is mainly composed of dissolution pores [58,59], with a small amount of microfractures developed, and porosity mainly distributed between 1% and 20% [60], but with poor porosity–permeability correlation [61].
The Fengcheng Formation in the Mahu Sag of the Junggar Basin harbors abundant reserves of shale oil and tight oil, presenting significant exploration potential. However, current exploration and development efforts in the Fengcheng Formation are still in their early stages. Research indicates that the tight-oil reservoirs in the Mahu Sag primarily develop fractures and dissolution pores, with a small amount of intercrystalline pores and primary pores, and porosity ranging from 1% to 10% [62]. Meanwhile, the matrix porosity of shale-oil reservoirs in the Fengcheng Formation is low, with significant variation in permeability. These reservoirs belong to the category of micropores, narrow throats, low porosity, and low to ultra-low permeability. Fractures and dissolution pores serve as the main reservoir spaces, while residual intergranular pores and intercrystalline pores have small diameters and poor permeability [63,64]. Although there is an initial understanding of the shale-oil and tight-oil reservoirs in the Fengcheng Formation of the Mahu Sag, there is relatively little comparative analysis focusing on the pore structures of these reservoirs. Understanding the difference between the shale oil and tight oil can give suggestions on the hydraulic fracturing design for the formations [65]. This study conducts pore structure analysis using samples from two typical wells, followed by a detailed comparative analysis of the pore structures and their differences between shale-oil and tight-oil reservoirs in the Mahu Sag. This provides data and theoretical support for the subsequent exploration and development as well as the evaluation of “sweet spots” in the Fengcheng Formation of the Mahu Sag.

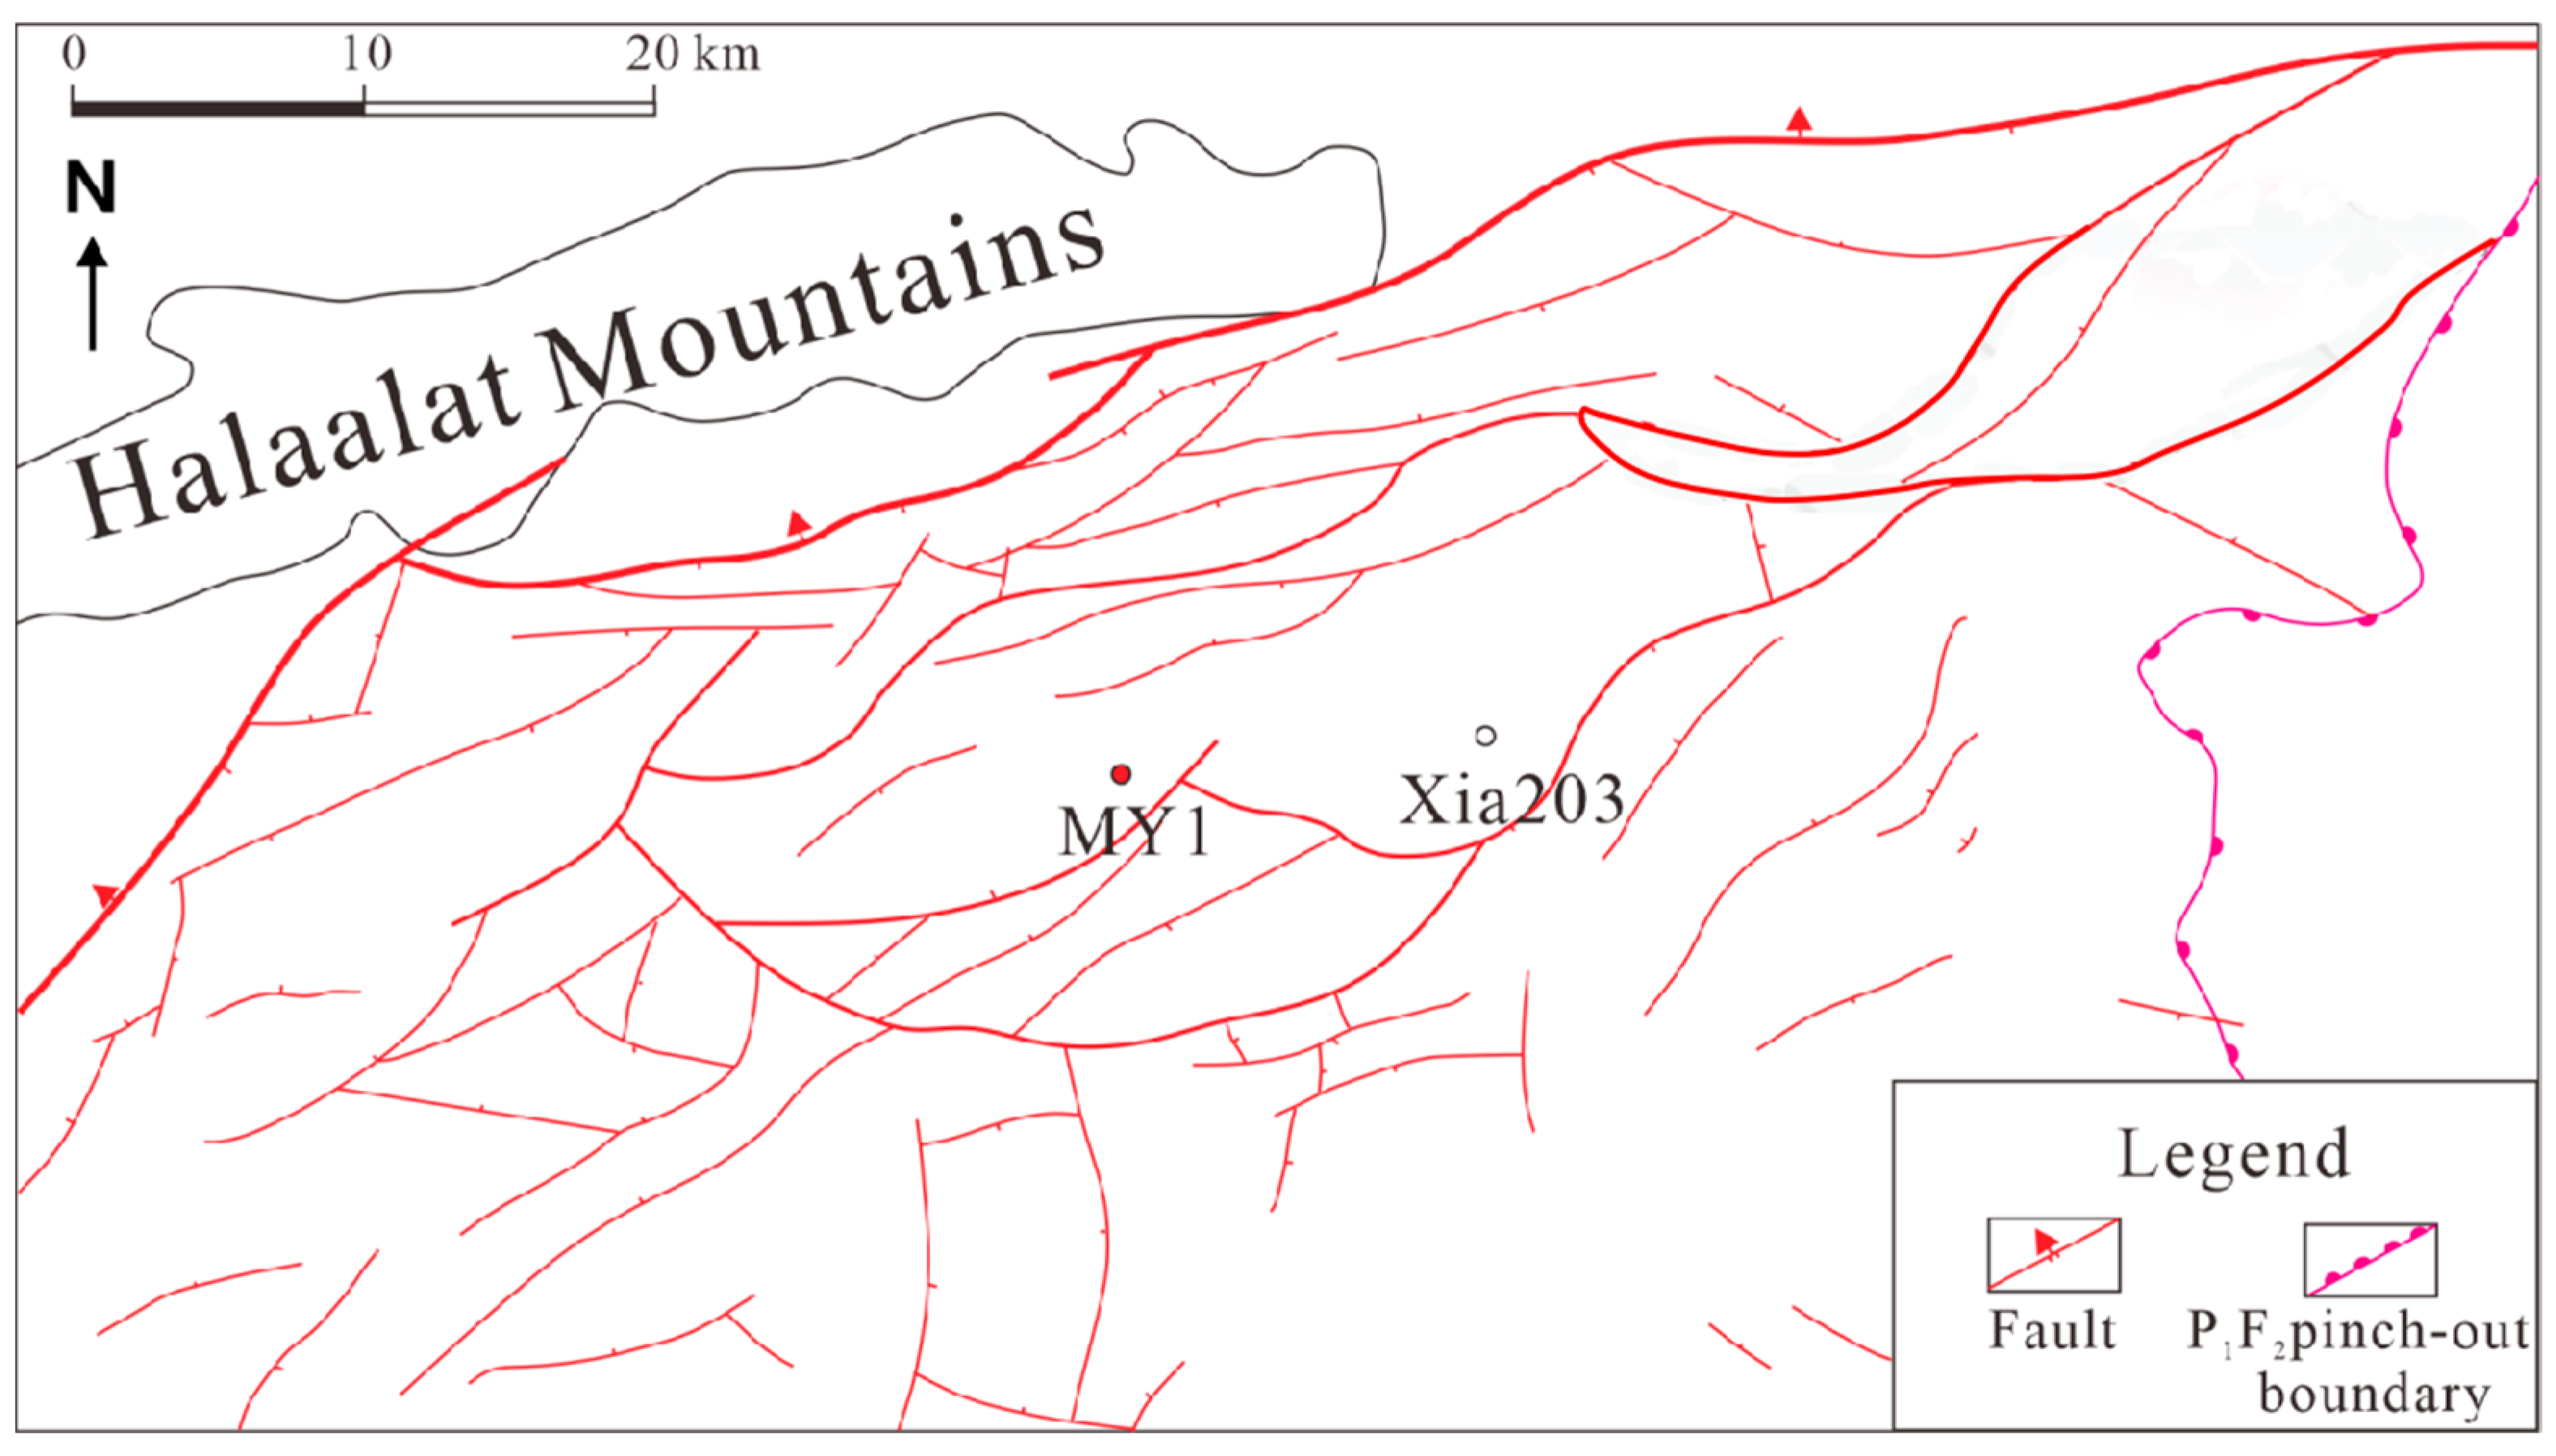
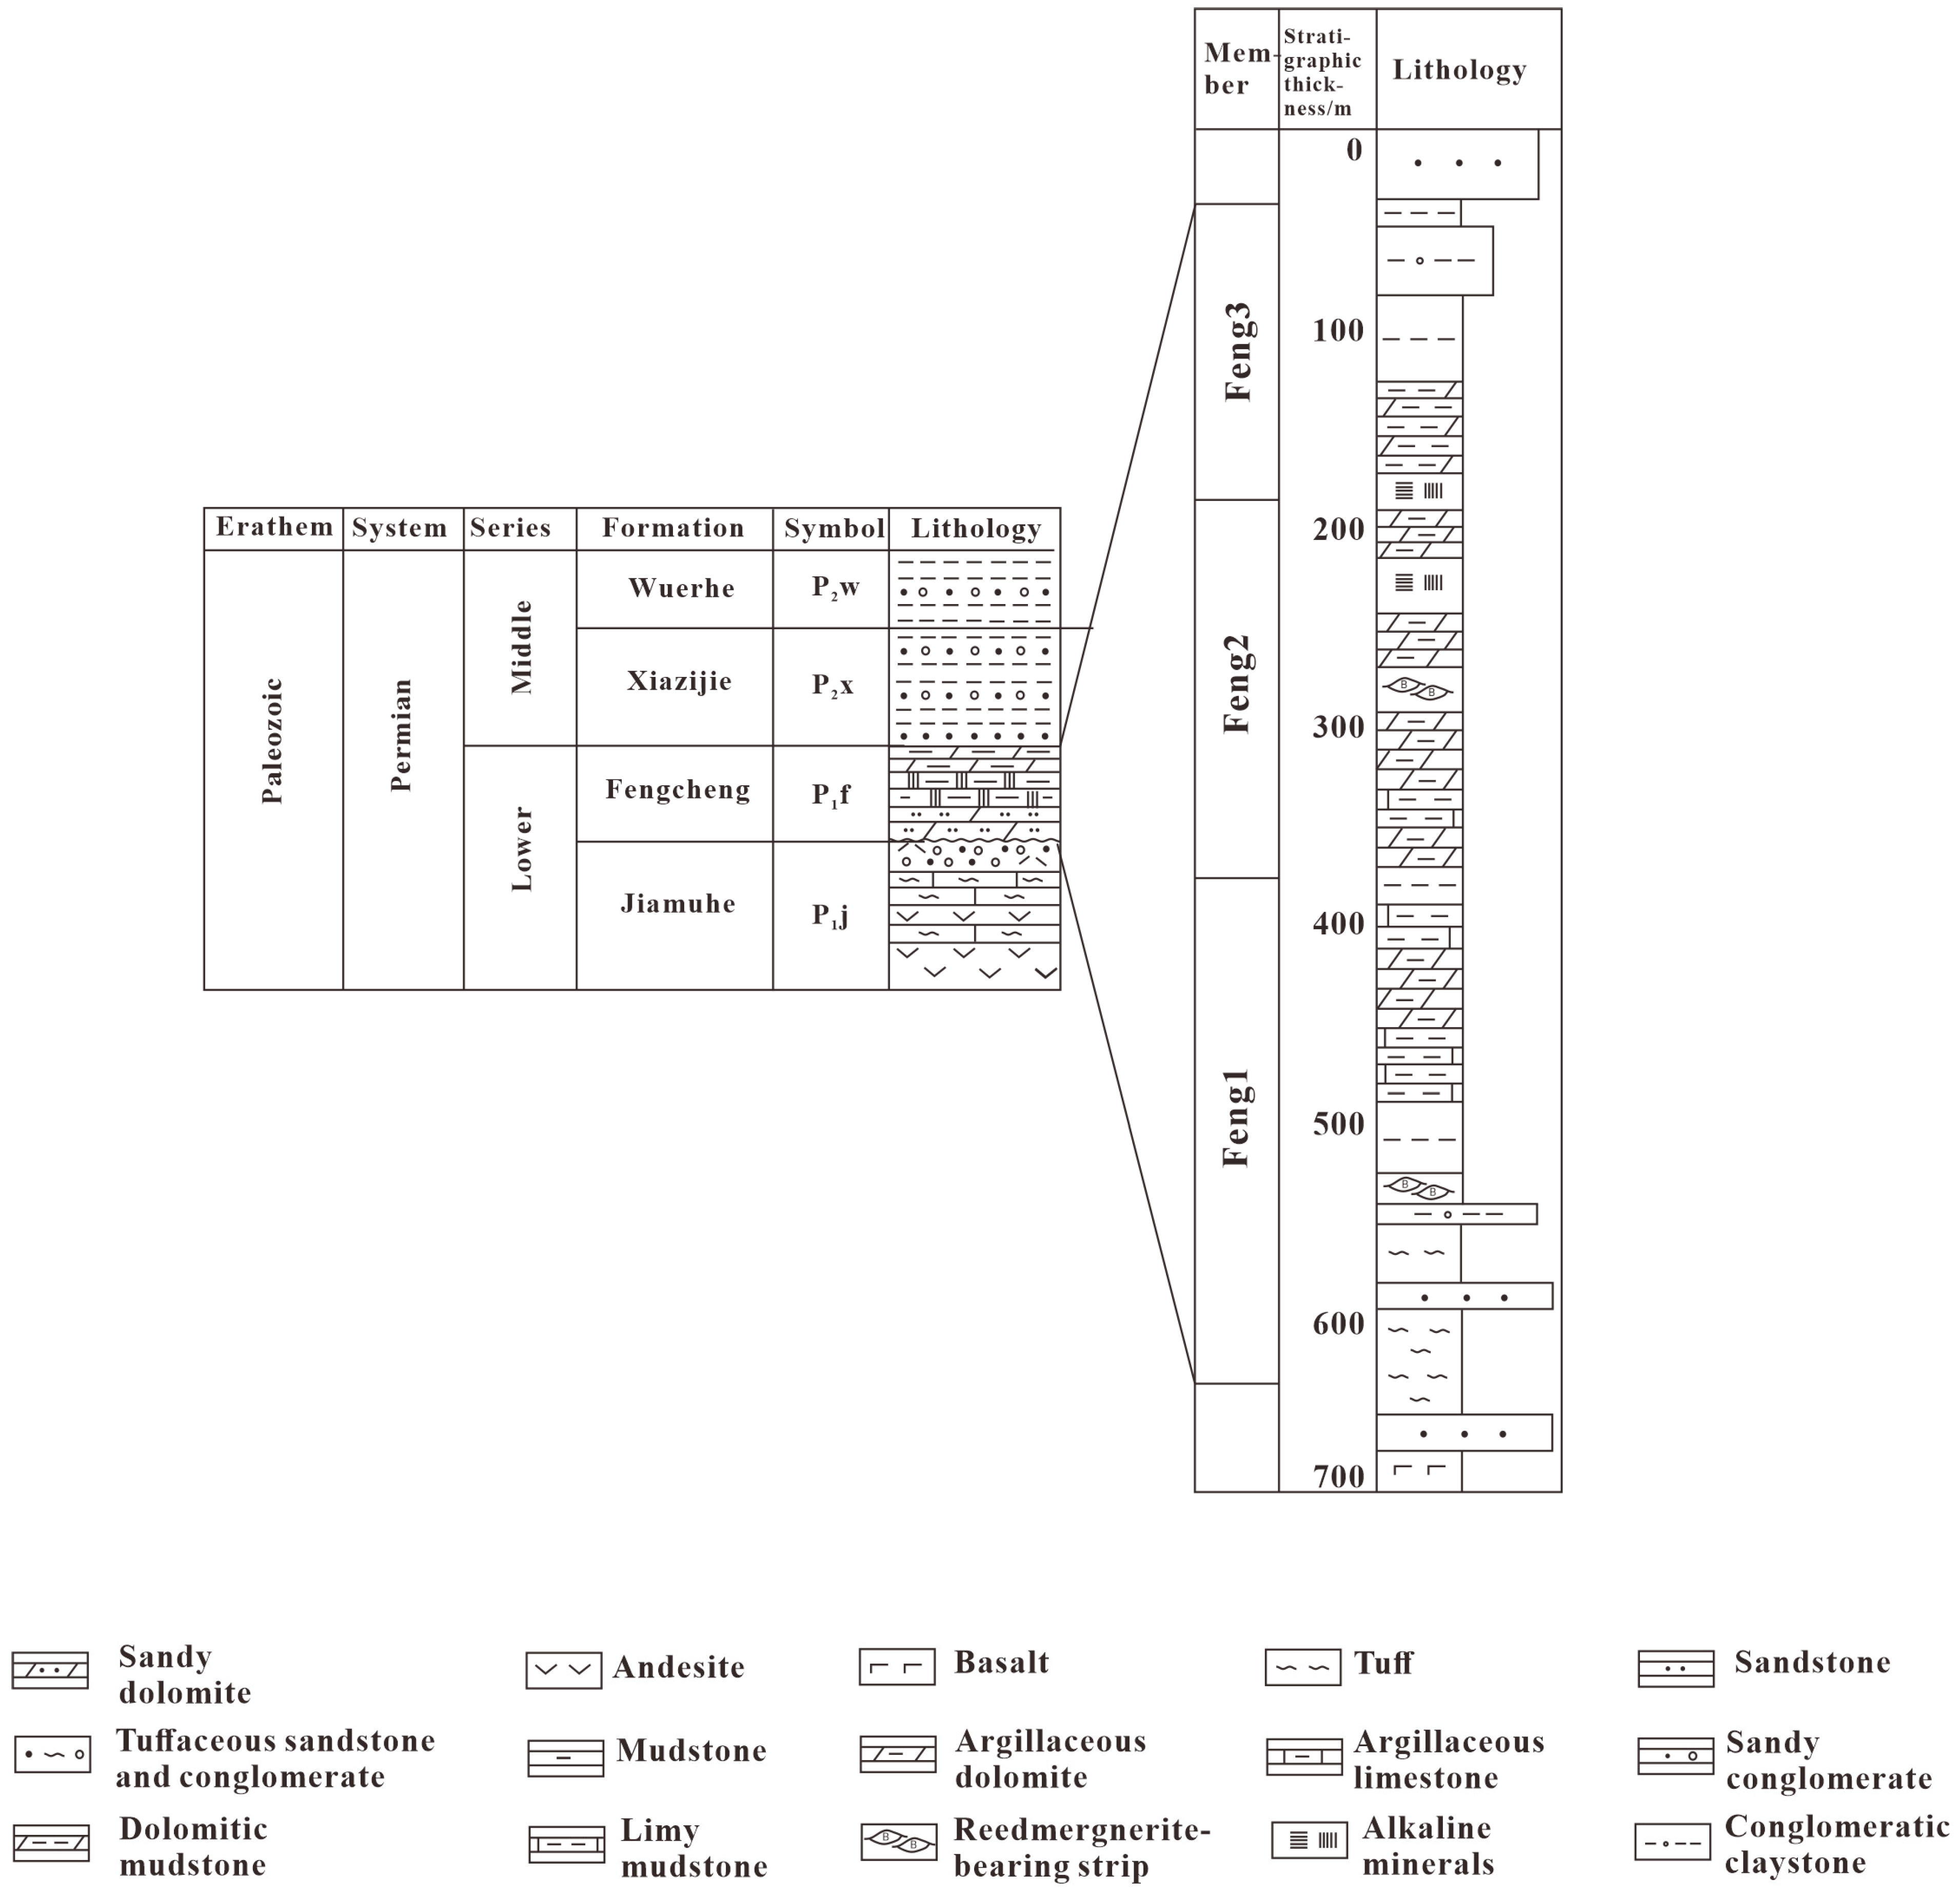
2. Geological Background

The Mahu Sag is located in the northwest region of the Junggar Basin (Figure 1). The western part of the depression is bounded by the Wuxia–Ke Bai Fault Zone, the southwestern part by the Zhongguai Uplift, the southern part by the Dabasong Uplift, the eastern part by the Xiayan and Sangquan Uplifts, and the northeastern part by the Yingxi Depression and Shiyingtan Uplift [66,67,68]. With an area of approximately 5000 km2, the Mahu Sag is the most prolific oil and gas-bearing depression in the Junggar Basin. Influenced by strong collision and compression between the West Junggar Ocean and the Kazakhstan Plate, especially during the late Carboniferous to early Permian collision, large-scale thrust structures were formed in the northwest part of the basin, creating depressions in the Mahu to Pen 1 wells [69,70]. Basin development is typically associated with the deposition of high-quality source rocks [6]. In particular, during the Lower Permian Fengcheng Formation, the western basin experienced its most intense period of development, resulting in the creation of the most significant source rocks in the Junggar Basin [71,72]. The Fengcheng Formation overlies the Jiamuhe Formation and is overlain by the Xiazi Street Formation (Figure 2). It is divided into three units from bottom to top, Feng 1 member (P1f1), Feng 2 member (P1f2), and Feng 3 member (P1f3), with significant lithofacies variations. During the early stage of the P1f1, volcanic activity was frequent, with volcanic breccias and sedimentary volcanic breccias being predominant in the northeastern region of the Mahu Sag. Subsequently, organic-rich mudstones, limestones, and dolomites were developed. As the salinity of the basin water continued to rise during the deposition of the P1f2, a large amount of alkaline minerals such as sodium, plagioclase, and biotite were deposited in the central depression. During the deposition of the P1f3, the salinity of the basin water decreased, and dolomites predominated in the depression. At the top of the P1f3, terrestrial clastic rocks were developed; closer to the foot of the Zayir Mountains, the content of clastic rocks increased, and the grain size became larger. Vertically, reed-bearing conglomerates were developed near major faults in the deep part of the depression [73,74].

3. Samples and Experimental Methods

(1)
Samples
In order to analyze and compare the differences in pore structures between shale oil and tight oil, samples from Well Xia 203 (tight oil) and Well Maye 1 (shale oil) of the Fengcheng Formation were selected as the subjects of analysis. Both two wells are vertical wells and experienced casing completion. During well tests, the average oil production of Well MY 1 and Well Xia 203 is 20.78 m3/day and 2.98 m3/day, respectively. Fifty samples were collected from each of these two wells, with a total number of 100 samples being analyzed. The average porosity of samples from Well Maye 1 ranges from 0.17% to 9.5%, with an average of 2.33%, and the average porosity of samples from Well Xia 203 ranges from 0.18% to 10.94%, with an average of 2.96%.
(2)
X-ray Diffraction
XRD analyses were performed using the RINT-TTR3 X-ray diffractometer, which is produced by Rigaku (Tokyo, Japan). The samples were powdered into a particle size exceeding 200 mesh. CuKα radiation was used with a scanning speed of 2°/min and a sampling step width of 0.02°. The scanning range was set from 5° to 45° to obtain X-ray diffraction patterns. Subsequently, the mineral composition was semi-quantitatively calculated based on the peak areas of various minerals in the X-ray spectra.
(3)
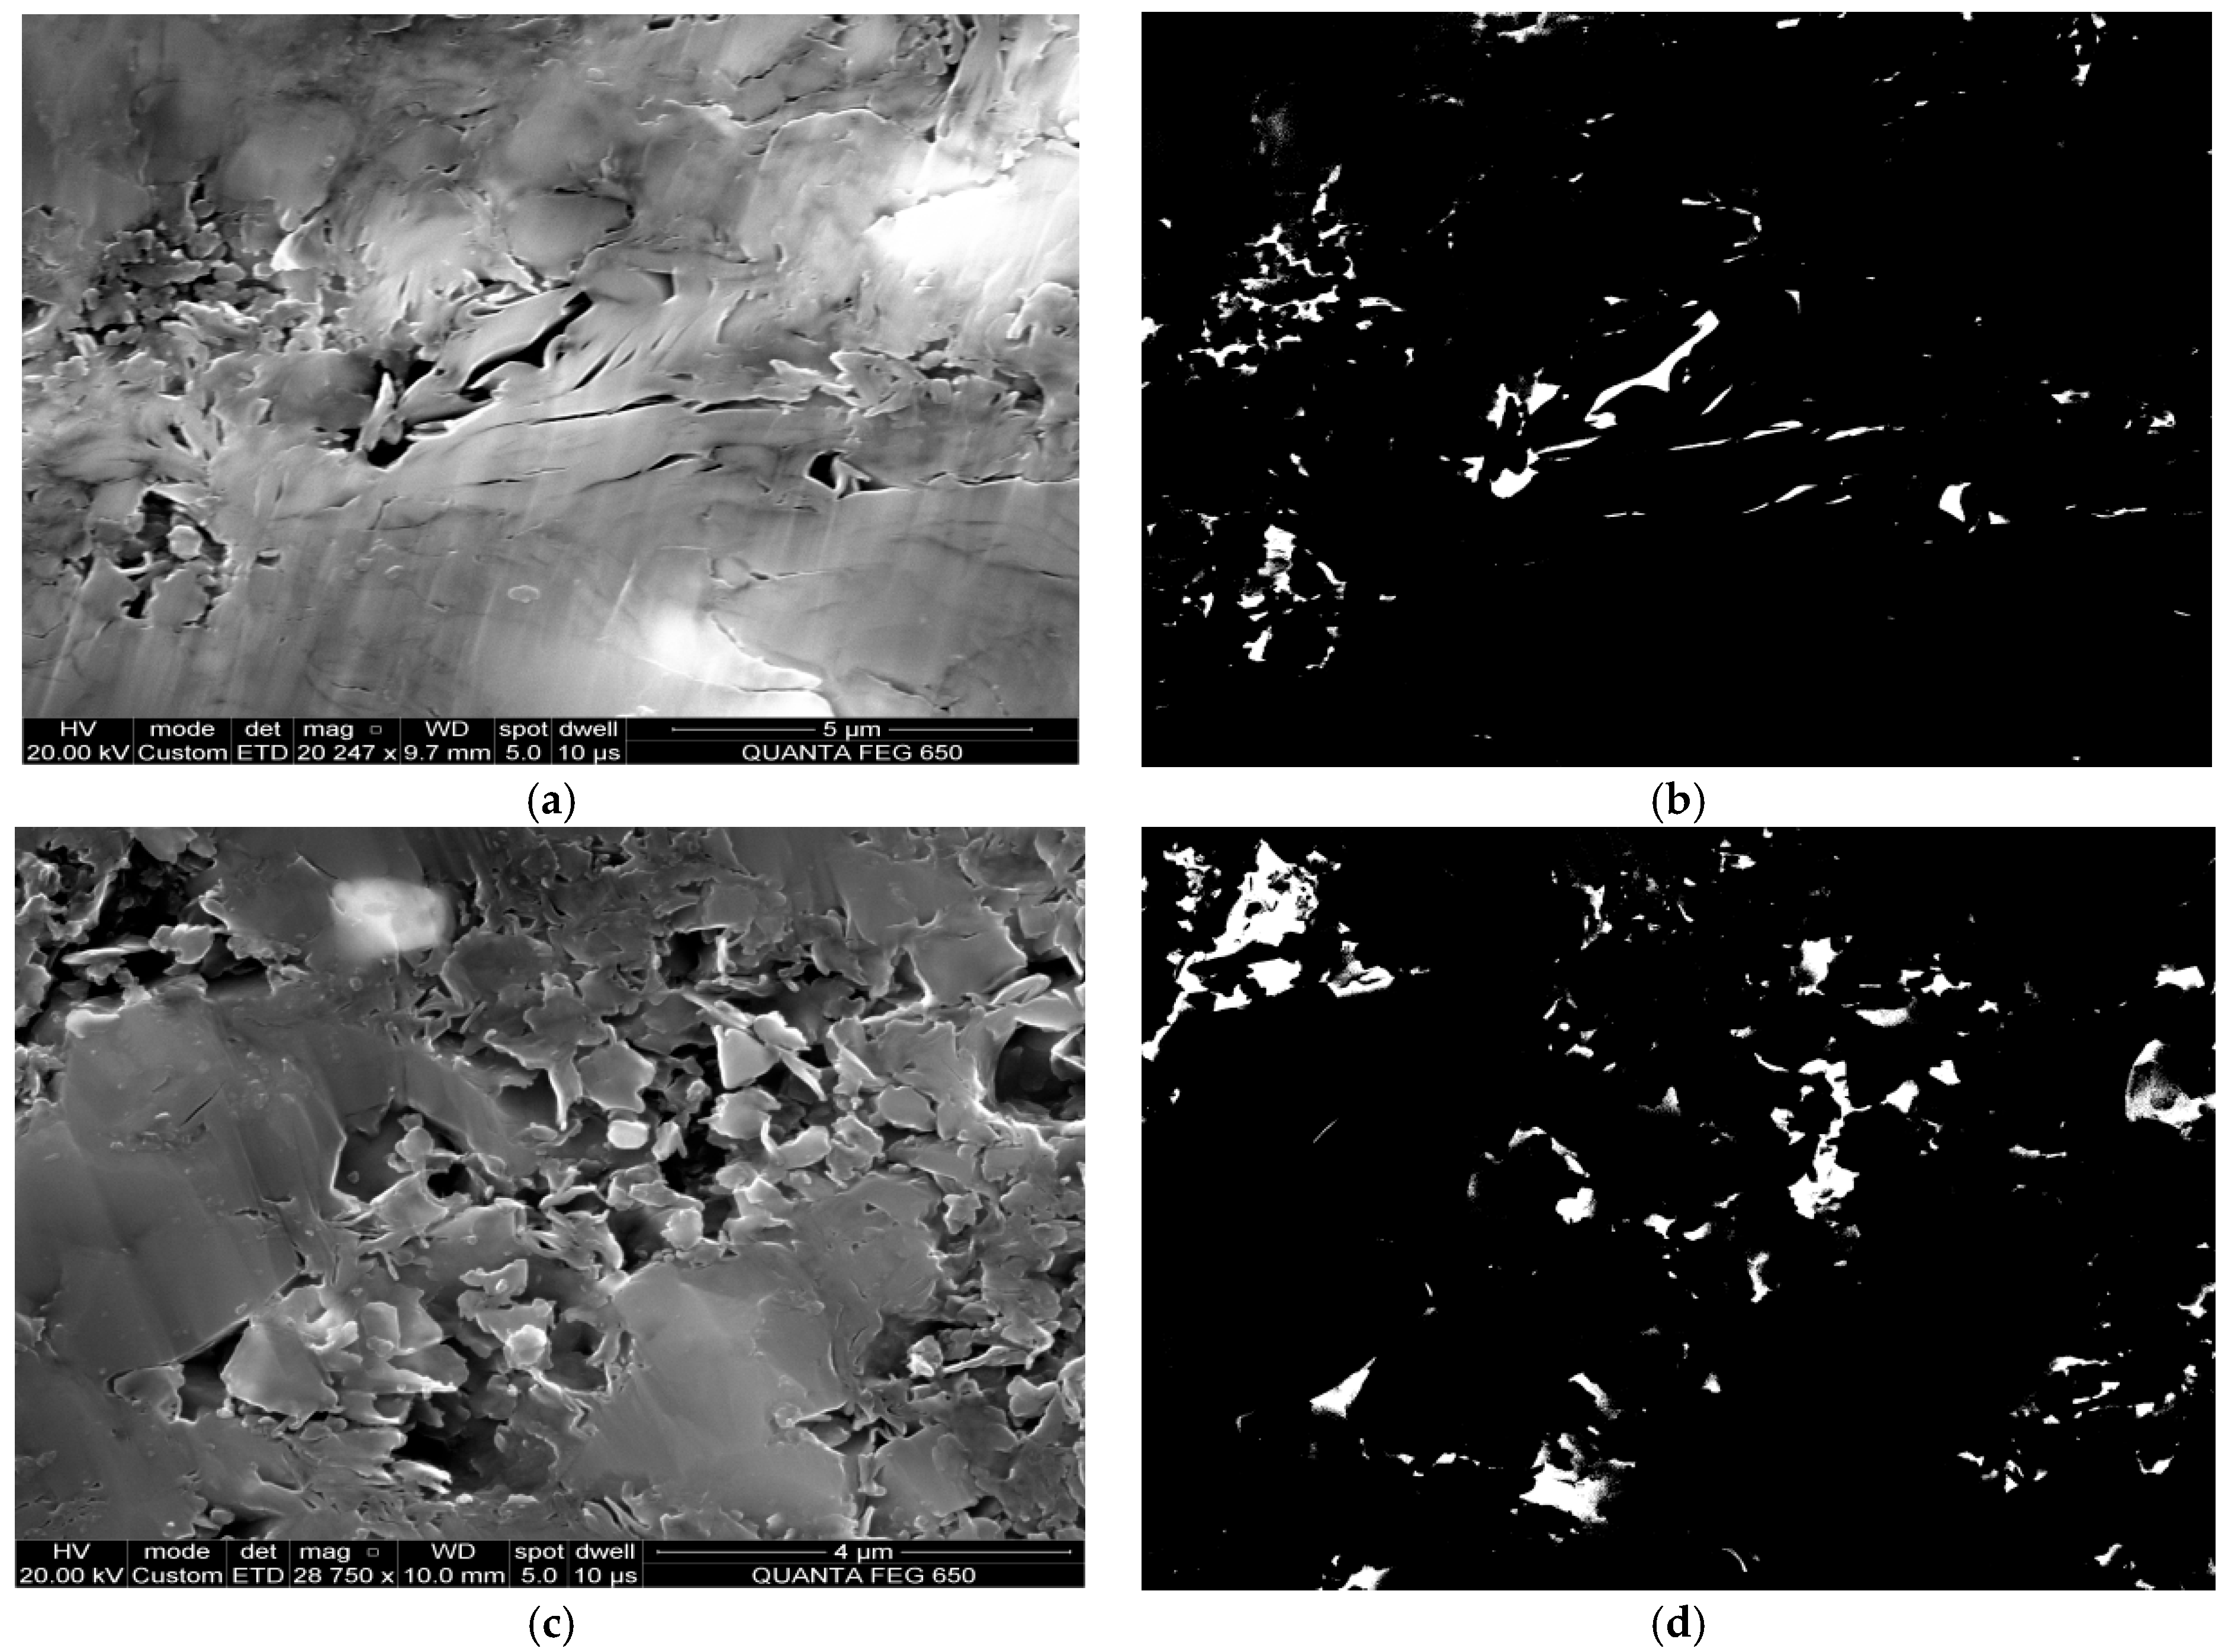
Scanning Electron Microscopy
First, the samples are cut to expose the surfaces of interest, and then argon ion polishing is employed to ensure the smoothness of the sample surface. Subsequently, the samples are tested using a scanning electron microscope (SEM). In this experiment, a Carl Zeiss AG Gemini 300 scanning electron microscope produced by Carl Zeiss (Oberkochen, Germany) is used, equipped with a conventional Everhardt–Thornley detector, with a working distance of 8.4 mm, operating in secondary electron imaging mode, and a beam aperture size of 60 μm. Imaging is primarily conducted under conditions of an accelerating voltage of 2 kV and a probe current of 30 pA.
(4)
Low Temperature N2 Adsorption
The samples are crushed into powder with particle sizes larger than 60 mesh, and then degassed at 110 °C for 12 h in a Micromeritics Smart Vacprep degasser. Subsequently, nitrogen adsorption experiments are conducted at 77K using a Micromeritics TriStar II Plus 3030 instrument which is produced by Micromeritics (Norcross, GA, USA). Based on the Brunauer–Emmett–Teller (BET) method [75], the specific surface area can be calculated. Furthermore, pore volume and pore size distribution can be determined using density functional theory models [76].
In this study, the FHH fractal model is employed to calculate the fractal dimensions of nitrogen adsorption [77,78,79,80,81,82]. In the low-pressure range (p/p0 < 0.5, D1), the adsorption is mainly controlled by van der Waals forces, primarily characterizing the features of pore surfaces. A larger D1 signifies a more irregular shape and lower smoothness of the pore interior surface, with D1 having a greater impact on adsorption performance, primarily governed by micropores. In the high-pressure range (p/p0 > 0.5, D2), which is mainly controlled by interfacial tension, D2 mainly reflects the characteristics of pore structure, including pore size distribution and size. A larger D2 signifies a more dispersed pore size distribution and smaller pore sizes, with D2 having a greater impact on permeability and specific pore volume, primarily controlled by thermal maturity and clay mineral content [83,84]. The equation for calculating the fractal dimension using the FHH method is as follows:
ln V = K ln [ ln ( p 0 p ) ] + C ,
D = K + 3
In the equation, p0 represents the saturation vapor pressure in Pa, p represents the equilibrium pressure in Pa, V denotes the adsorption of nitrogen at pressure P, corresponding to the pore volume in m3, D stands for the fractal dimension, and K and C are constants. The value of D generally falls into ranges from 2 to 3. When approaching 2, it indicates smooth pore surfaces and good pore connectivity. When approaching 3, it indicates rough pore surfaces, strong heterogeneity, and extremely poor pore connectivity. When D is larger than 3 or less than 2, it generally indicates poor fractal characteristics within that pore size range and may even lack fractal regularity.
For pore size classification, the current commonly used scheme is based on IUPAC [85,86], which divides pores into macropores, mesopores, and micropores. Macropores are larger than 50 nm in size, mesopores range from 2 to 50 nm, and micropores are less than 2 nm in size.
(5)
Mercury Intrusion Capillary Pressure
The mercury intrusion porosimetry (MIP) instrument used in this study is the AutoPore IV 9500 mercury porosimeter which is produced by Micromeritics (Norcross, GA, USA). Prior to sample testing, the samples are dried at 105 °C until constant weight is achieved. The maximum experimental pressure for mercury intrusion is 200 MPa. Parameters such as porosity and permeability are obtained through MIP experiments.

4. Results and Discussion

4.1. Mineral Compositions

The main mineral components of the samples from Well Maye 1 consist of feldspar minerals ranging from 29.3% to 98.1%, with an average of 53%. Carbonate minerals constitute between 1.9% and 64.6%, with an average of 38%. Clay minerals are present in relatively low quantities, in the range of 1.2~13.7%, with an average of 4.7%. The clay minerals are primarily composed of the illite and illite-montmorillonite mix layer. Additionally, the samples from Well Maye 1 contain a certain amount of pyrite (1~10%). Samples from Well Xia 203 are primarily composed of feldspar minerals in the range of 27.1~78.6%, with an average of 52.1%. Carbonate minerals are in the range of 12.8~69.6%, with an average of 34.9%. Clay minerals are present in relatively low quantities, ranging from 0.4% to 19.4%, with an average of 4.3%. Furthermore, these samples contain a specific amount of pyrite, accounting for 0.9% to 9.1% of the total sample amount.
Due to the overall deposition of the Fengcheng Formation in the Mahu Sag being a suite of semi-deep lake to deep lake alkaline lake sediments, this study classifies the samples based on the ternary elements of quartz + feldspar content, carbonate mineral content, and clay mineral content (Figure 3). According to the classification, samples from Well Maye 1 are primarily siliceous shale and calcareous shale, with a few samples being calcareous-siliceous mixed shale or siliceous rocks. On the other hand, most of the samples from Well Xia 203 are siliceous shale, with some samples being calcareous shale and calcareous-siliceous mixed shale, and fewer samples being siliceous rocks.

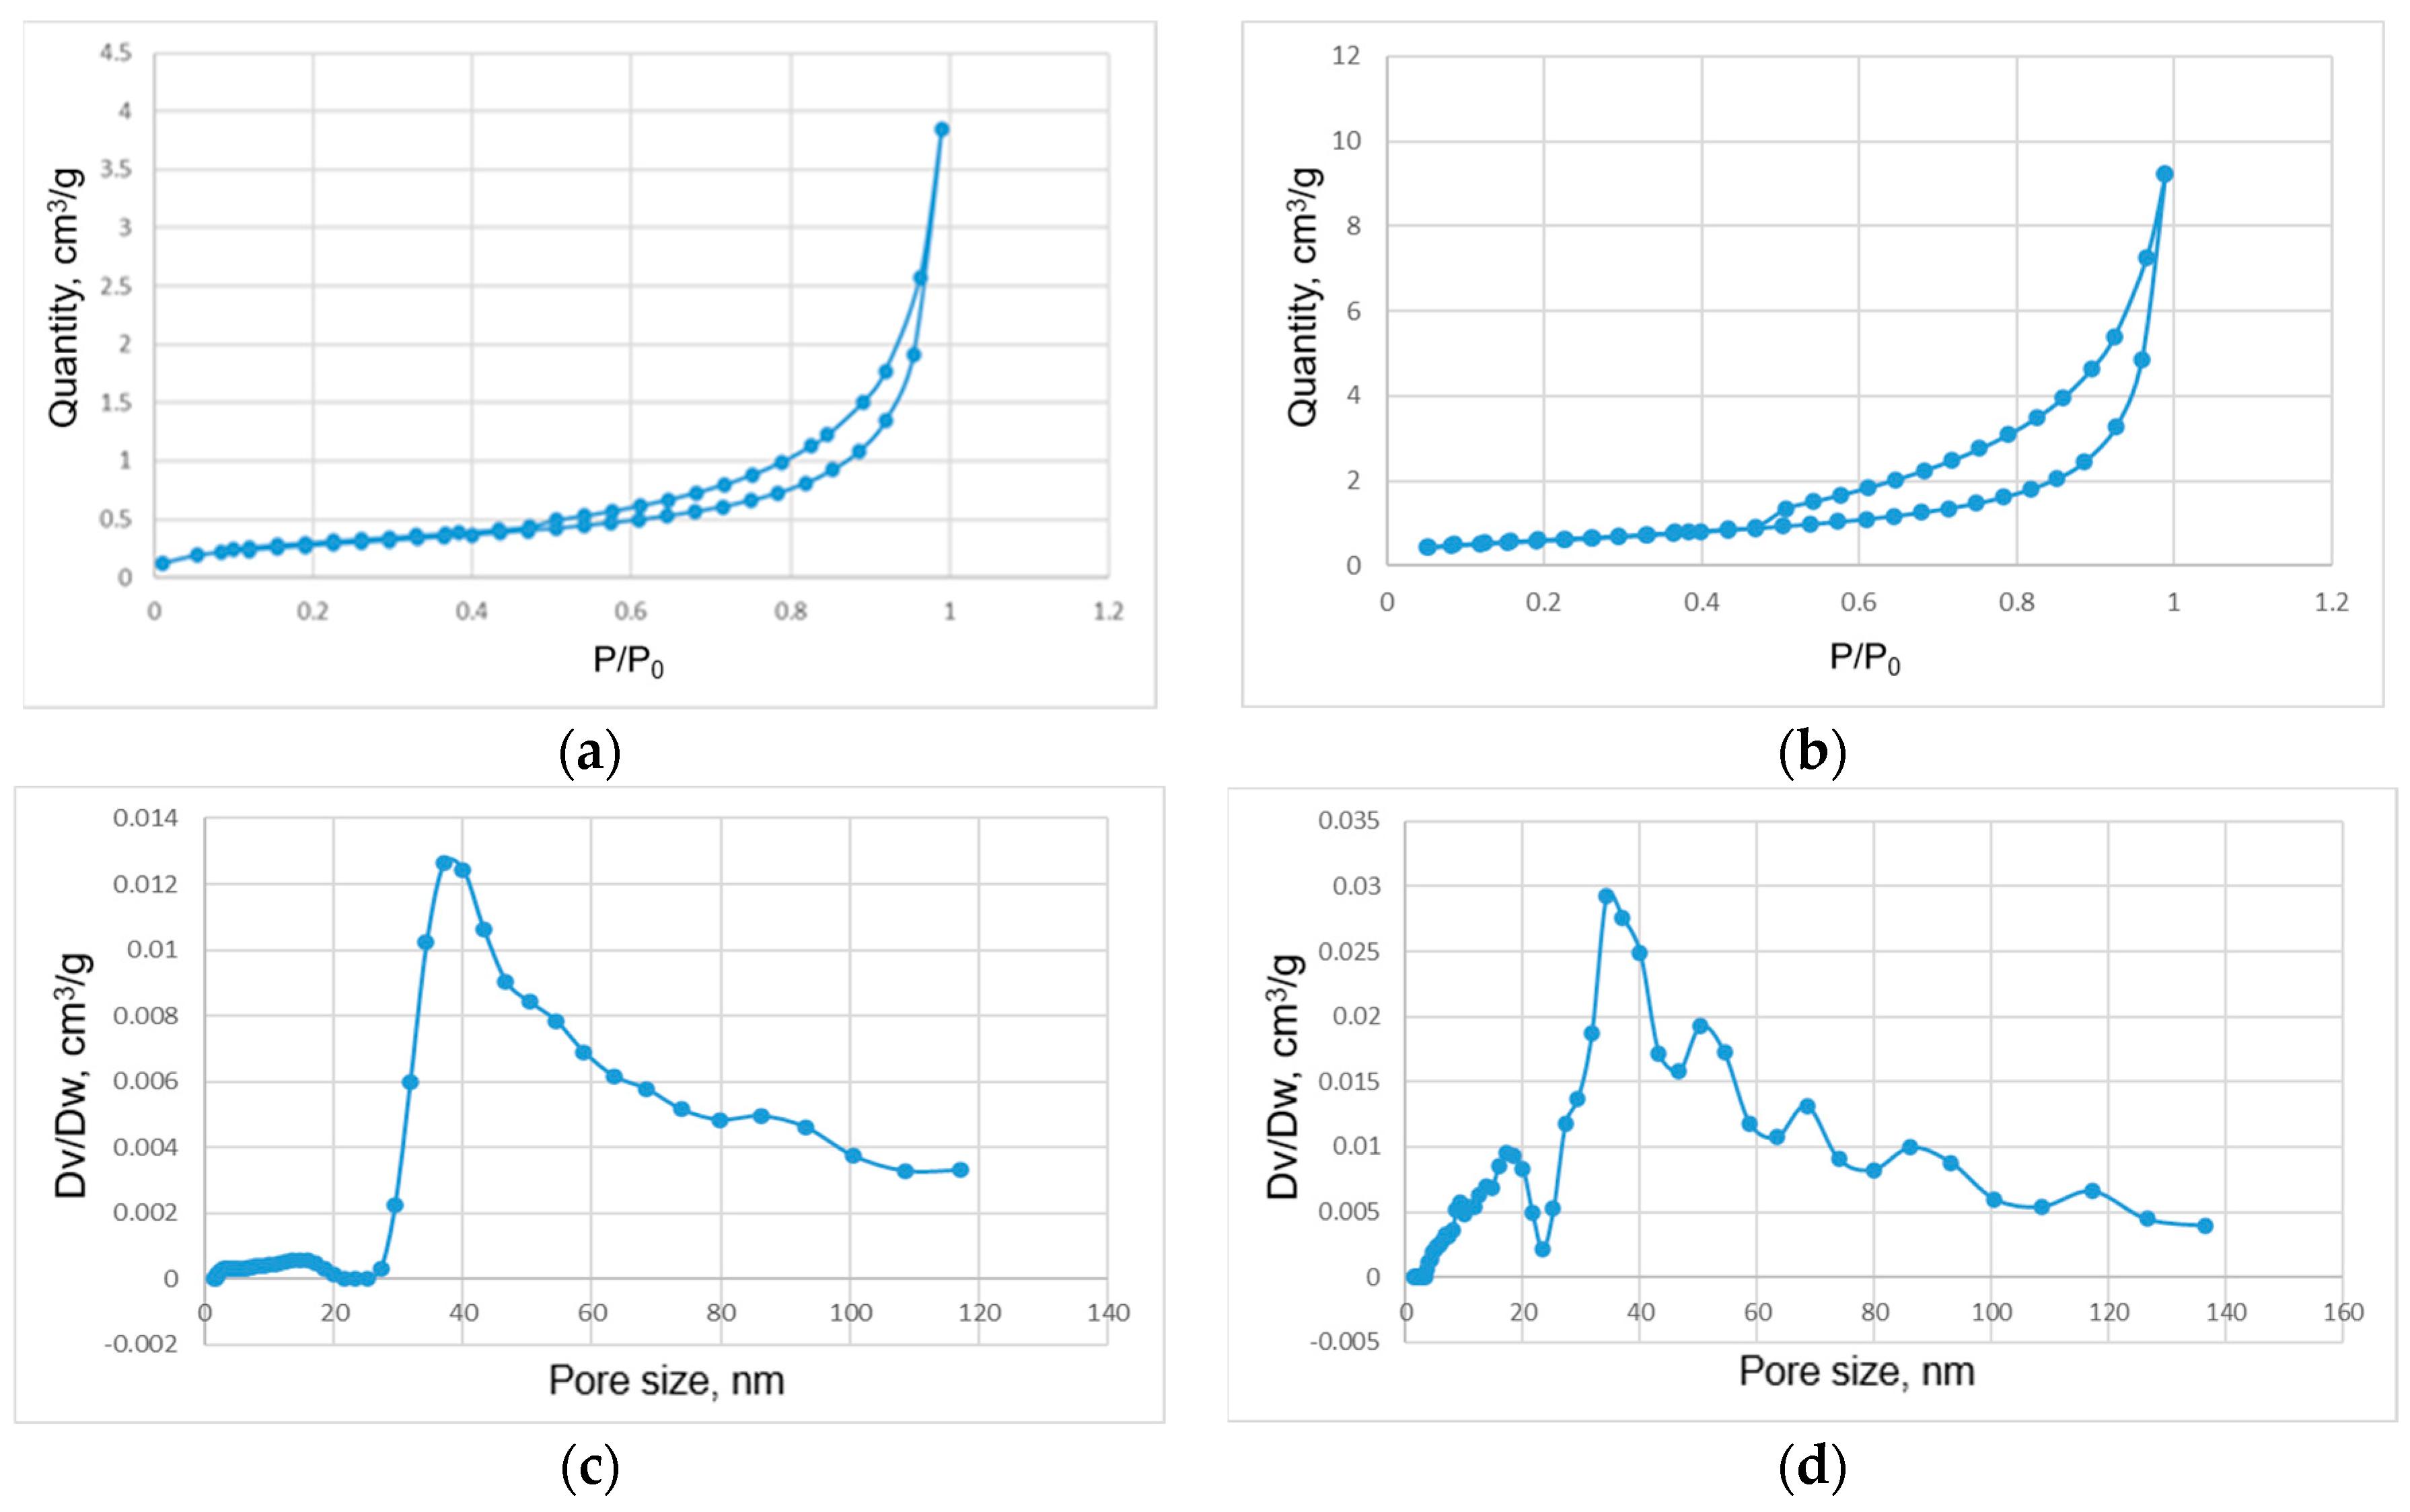
4.2. Pore Structure Comparison from N2 Adsorption Experiment

We conducted low-temperature nitrogen adsorption experiments on all selected samples. Figure 4 illustrates the nitrogen adsorption isotherms of typical samples from two wells. In terms of shape, the nitrogen adsorption capacity of samples from both wells increases with increasing relative pressure. When the relative pressure reaches approximately 1, the adsorption isotherm does not exhibit a plateau, indicating the presence of many macropores beyond the nitrogen adsorption test range. The shape of hysteresis loops between adsorption and desorption curves can be used to indicate the pore shape of the samples [62]. In Figure 4, the pores of samples from Wells Maye 1 and Xia 203 are mainly a mixture of slit pores and ink-bottle pores. Through DFT theory, we calculated the pore size distribution of the samples, and Figure 4c,d show that the pore size distributions of Wells Maye 1 and Xia 203 exhibit multi-peak distributions. Further analysis of the pore size distribution reveals that the peaks of the two samples’ multi-peak distributions correspond to similar pore sizes. For example, there is a peak in the range of less than 20 nm and a maximum peak around 35 nm. These conclusions exhibit certain similarities with the pore sizes of samples from other basins we studied.
After argon ion polishing, our samples were observed by applying SEM analysis. As shown in Figure 5, the samples contain abundant ink-bottle and slit-like pores. The slit-like pores are mainly located between grains, while the ink-bottle pores are mainly present in dissolution pores and interstitial pores of clay minerals. The observation of slit-like pores and ink-bottle pores under SEM images further corroborates the conclusions drawn from nitrogen adsorption. Further analysis of the images reveals pore size information, as depicted in Figure 5, indicating that pore sizes in the samples are predominantly in the nanoscale range, with many pores less than 100 nm, consistent with the results achieved from nitrogen adsorption.
To analyze and compare the pore structure of shale-oil and tight-oil samples, we collected pore structure parameters of Well Xia 203 (tight oil) and Well Maye 1 (shale oil). The statistical data from the two wells were then compared. As shown in Figure 6, the hysteresis loop area, specific surface area, pore volume, average pore size, and D1 of Well Xia 203 (tight oil) are higher than those of Well Maye 1 (shale oil). In terms of nitrogen adsorption pore structure, the tight-oil samples from the Fengcheng Formation have a higher specific surface area, pore volume, and average pore size compared to the shale-oil samples from the same formation.
We conducted a further analysis of the relationship between the content of quartz + feldspar, carbonate minerals, clay minerals, and different pore structure parameters in Well Xia 203 and Well Maye 1. Figure 7 shows that there is no significant relationship between the content of quartz + feldspar and carbonate minerals in Well Xia 203 and any pore structure parameters. Clay minerals are positively correlated with other parameters, except the negative correlation with the average pore diameter. Figure 8 shows that there is no significant correlation between the content of quartz + feldspar and carbonate minerals in Well Maye 1 and any pore structure parameters. Clay minerals are positively correlated with hysteresis loop area, specific surface area, D1, and D2, and negatively correlated with average pore size. Both wells exhibit similar trends, indicating that although clay minerals account for only approximately 10% of the samples in the Fengcheng Formation in the Mahu Sag, their impact on pore structure cannot be ignored.

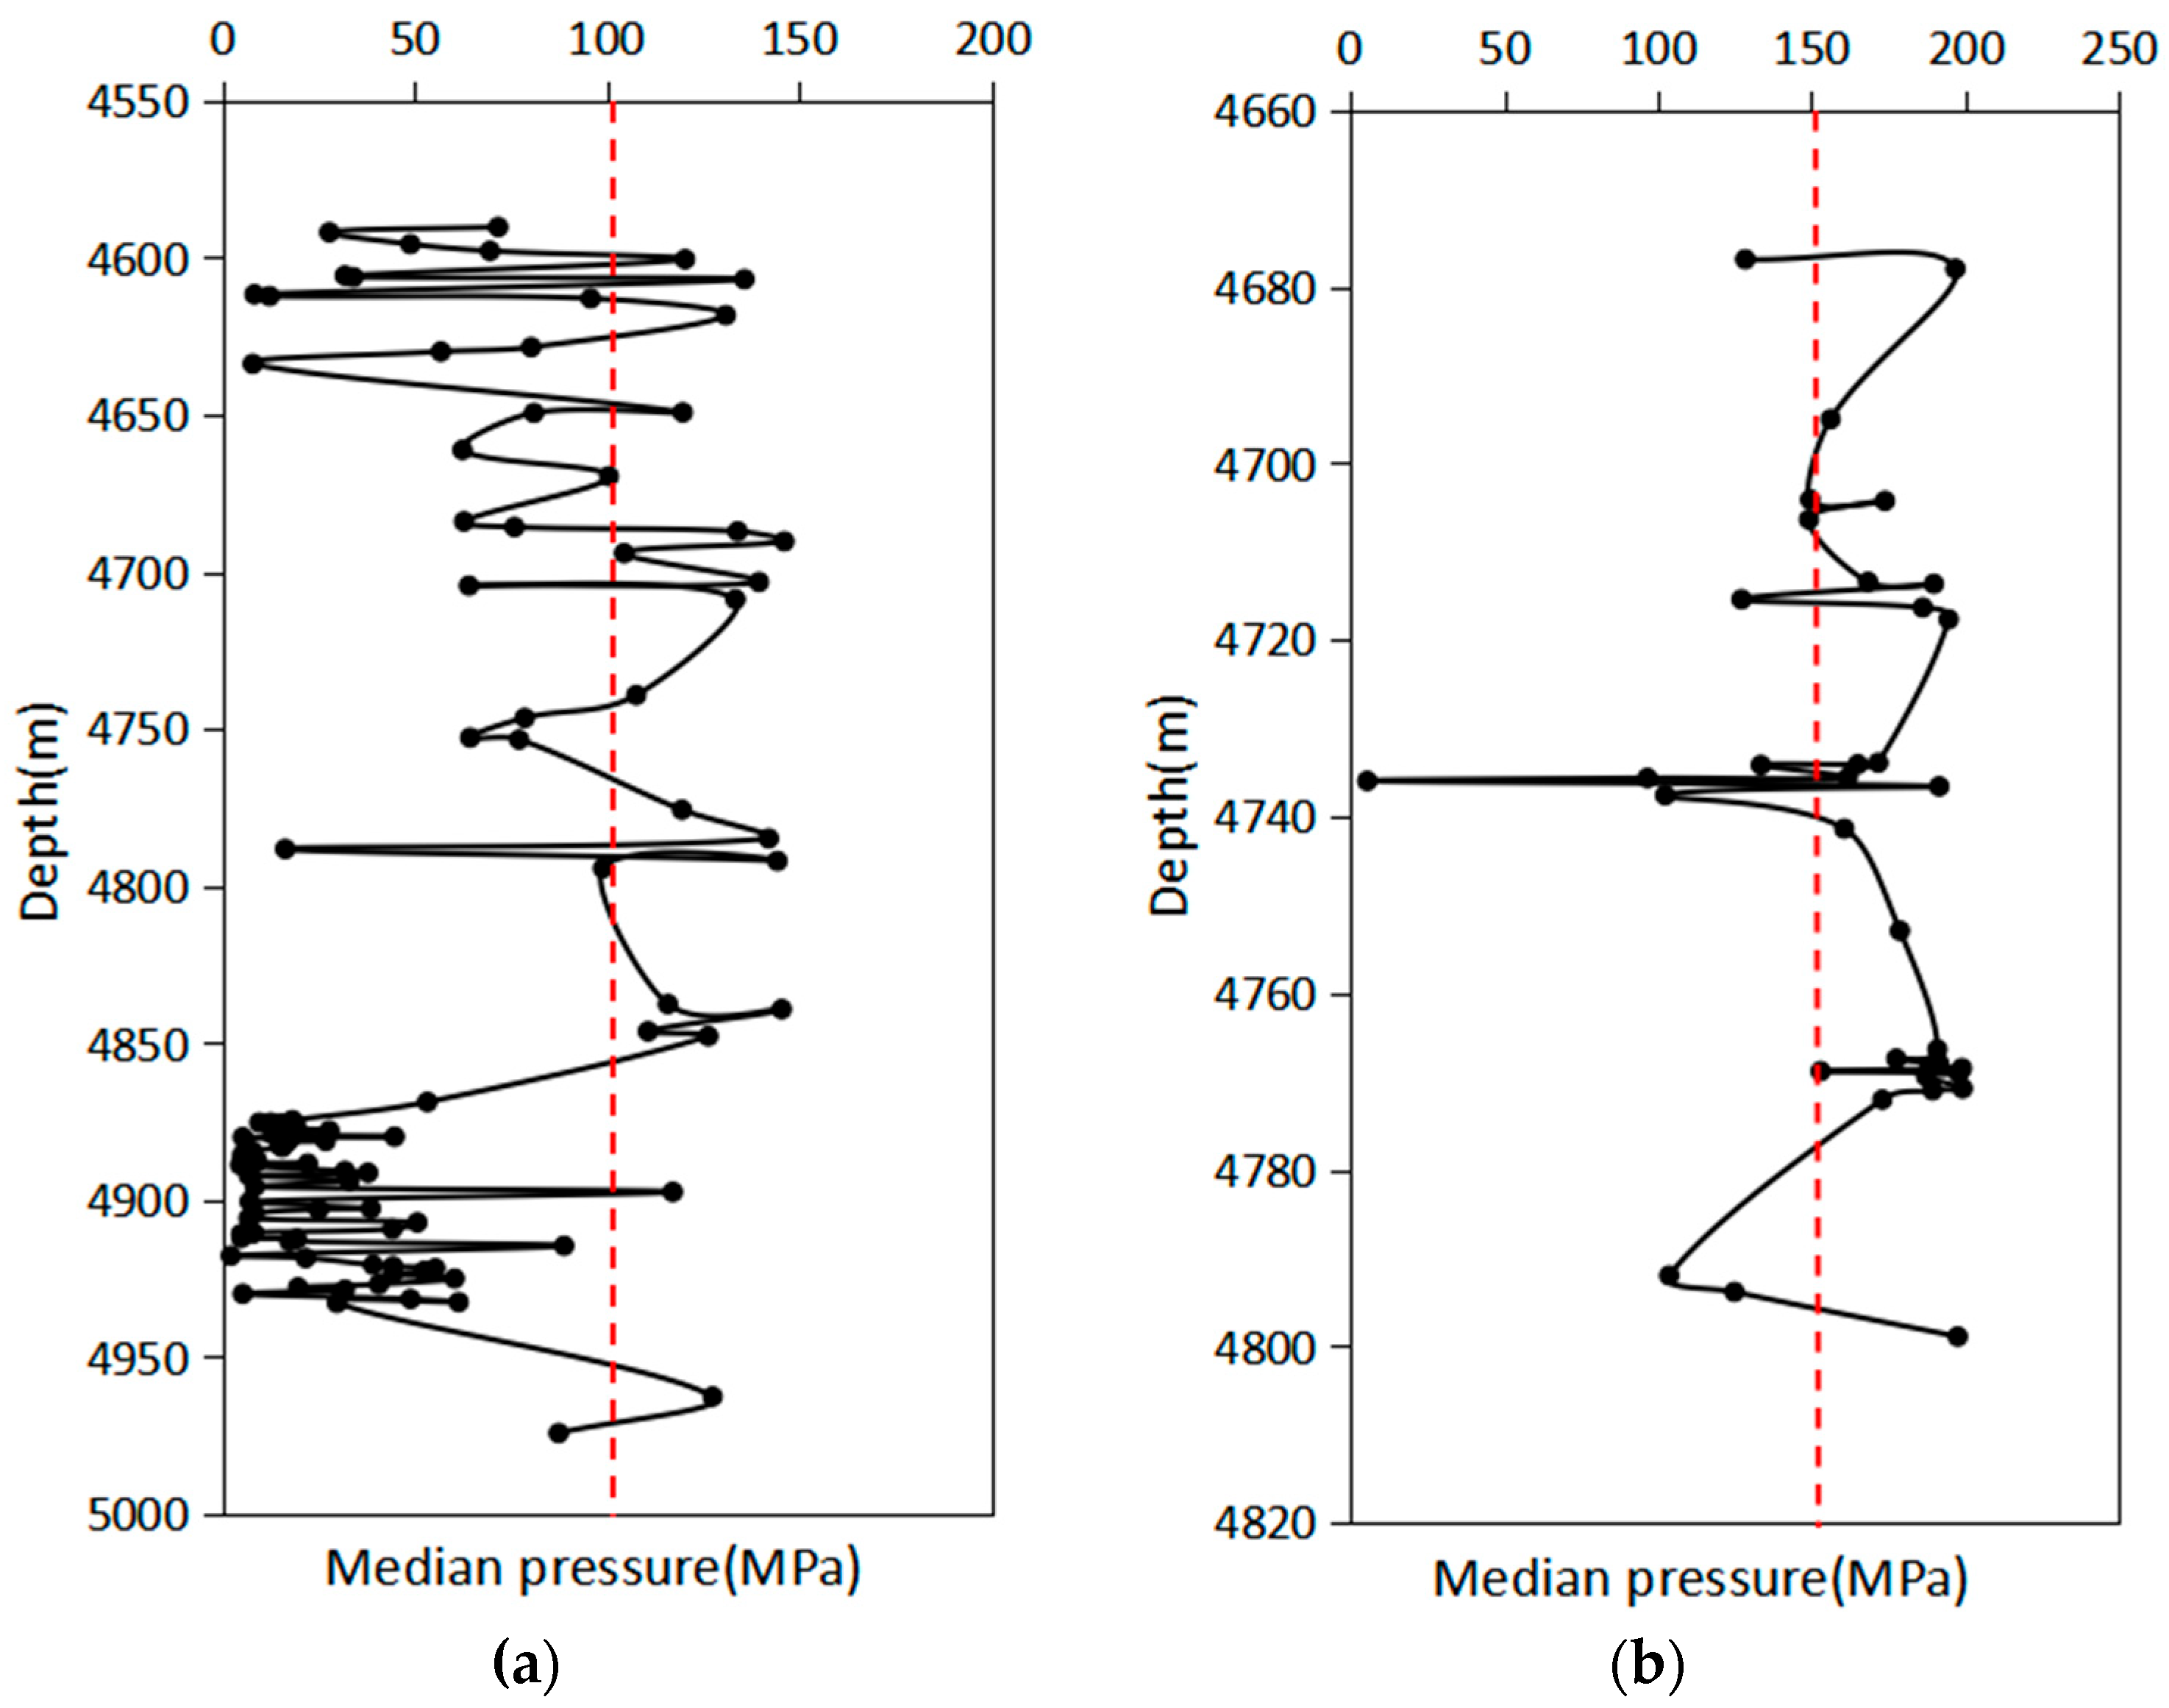
4.3. Pore Structure Comparison from MICP

Figure 9 illustrates the comparison between the mercury injection porosity and gas permeability of Well Xia 203 and Well Maye 1. It can be observed that both the porosity and permeability of Well Xia 203 are lower than those of Well Maye 1, indicating that the pore–permeability conditions of Well Maye 1 are superior to those of Well Xia 203.
We further conducted a comparative analysis of the mercury injection parameters for samples from Well Maye 1 (shale oil) and Well Xia 203 (tight oil). In this study, we mainly selected the drainage pressure, median pressure, and sorting coefficient for analysis and comparison. The drainage pressure, median pressure, and sorting coefficient are key indicators for assessing the reservoir performance of rocks. They reflect not only the concentration of pore throats but also the size of these concentrated pore throats, which are closely related to the porosity and permeability of rocks. As shown in Figure 10, the average drainage pressure of Well Maye 1 is approximately 8 MPa, which is lower than that of the samples from Well Xia 203 (20 MPa), indicating that the permeability of Well Maye 1 is larger than that of Well Xia 203. This conclusion aligns with the findings from gas permeability measurements (Figure 9).
The median pressure is the capillary pressure at which 50% of the non-wetting phase is present in the injection curve, reflecting the size of oil productivity when both oil and water phases coexist in the pore space. A larger median pressure indicates denser rock and lower oil production capacity, while a smaller median pressure indicates better oil filtration capability of the rock and higher production capacity. Figure 11 shows that the mean median pressure of Well Maye 1 is approximately 100 MPa, which is lower than that of Well Xia 203 at 150 MPa, further indicating better permeability for Well Maye 1.
The sorting coefficient quantifies the standard deviation of pore throat sizes in the sample, directly reflecting the concentration level of the pore throat distribution. A smaller sorting coefficient signifies a more uniform pore distribution, whereas a larger sorting coefficient denotes a more uneven pore distribution. Figure 12 shows that the average sorting coefficient of Well Maye 1 is approximately 2.5, which is greater than the average sorting coefficient of Well Xia 203 (1.5). This conclusion indicates that the pore distribution of Well Maye 1 is relatively more uneven compared to the samples from Well Xia 203.
To understand the differences in permeability between Well Maye 1 and Well Xia 203 samples, we conducted an in-depth analysis of the samples. Figure 13 indicates that Well Maye 1 exhibits abundant bedding structures, including alkaline mineral laminations, dolomite laminations, and feldspar laminations, while the bedding structure of the Xia 203 samples is relatively weak. According to the analysis of the average proportion of pores occupied by various bedding structures, it is observed that laminated shales contain a large number of microfractures, and the proportion of microfractures in laminated shales is much larger than that in thin-bedded and thick-bedded shales (Figure 14). Due to the presence of a large number of microfractures in samples from Well Maye 1, its permeability is better, with lower displacement pressure, lower median pressure, and higher sorting coefficient.
This study compares and analyzes the differences in pore structures between shale-oil and tight-oil reservoirs in the Fengcheng Formation in the Mahu Sag, using Well Maye 1 and Well Xia 203 as examples. According to nitrogen adsorption results, there are differences in pore structure parameters between shale-oil and tight-oil reservoirs. However, mercury injection test results concluded that the permeability of shale-oil reservoirs is better than that of tight-oil reservoirs, mainly due to the presence of abundant microfractures in shale-oil reservoirs. Microfractures are the main reason for the differences in permeability. The presence of microfractures affects both reservoir properties and mechanical properties. For example, when microfractures are well developed, the permeability of the reservoir is enhanced, facilitating the exploitation and migration of shale oil. However, when microfractures are too dense or poorly connected, fluid migration may be impeded, reducing the efficiency of reservoir exploitation. Additionally, organic matter in shale-oil reservoirs has a strong adsorption effect on shale oil. The development of microfractures improves the pore structure of the reservoir and increases the exposed surface area of organic matter, thereby enhancing adsorption and contributing to the stable storage and migration of shale oil in the reservoir. In terms of mechanics, as the number of microfractures increases, the elastic modulus of the reservoir decreases, making the reservoir softer. Furthermore, the increase in microfractures may increase the Poisson’s ratio of the reservoir, indicating a more pronounced lateral deformation of the reservoir under pressure. Moreover, the development of microfractures has a significant impact on the compressive strength of shale-oil reservoirs. On the one hand, the presence of microfractures may reduce the overall strength of the reservoir, making it more susceptible to damage under external forces. On the other hand, the connectivity and distribution of microfractures also affect the compressive performance of the reservoir. When the connectivity of microfractures is good, the reservoir can transmit and disperse stress through fractures when subjected to pressure, thereby increasing its compressive strength. Currently, we have conducted various experimental studies on samples from Well Maye 1 and Well Xia 203. However, there are still some limitations that future studies could incorporate modeling and machine-learning methods to validate the experimental results and enhance the analysis.
In summary, microfractures not only provide space for the storage of shale oil but also influence the migration, aggregation, and exploitation methods of shale oil. Due to the significant differences in the microstructure of tight-oil and shale-oil reservoirs in the Fengcheng Formation in the Mahu Sag, separate evaluation criteria for shale-oil and tight-oil reservoirs should be established in sweet spot evaluation and other aspects.

5. Conclusions

This study mainly combines XRD, nitrogen adsorption, scanning electron microscopy, mercury injection, and other methods to examine and compare the differences in pore structures between shale-oil and tight-oil reservoirs using Well Maye 1 and Well Xia 203 as research objects. The following conclusions can be drawn:
(1)
Well Xia 203 and Well Maye 1 in the Fengcheng Formation are primarily composed of quartz, carbonate minerals, and clay minerals. Compared to tight-oil reservoirs, shale-oil reservoirs contain a higher proportion of carbonate minerals.
(2)
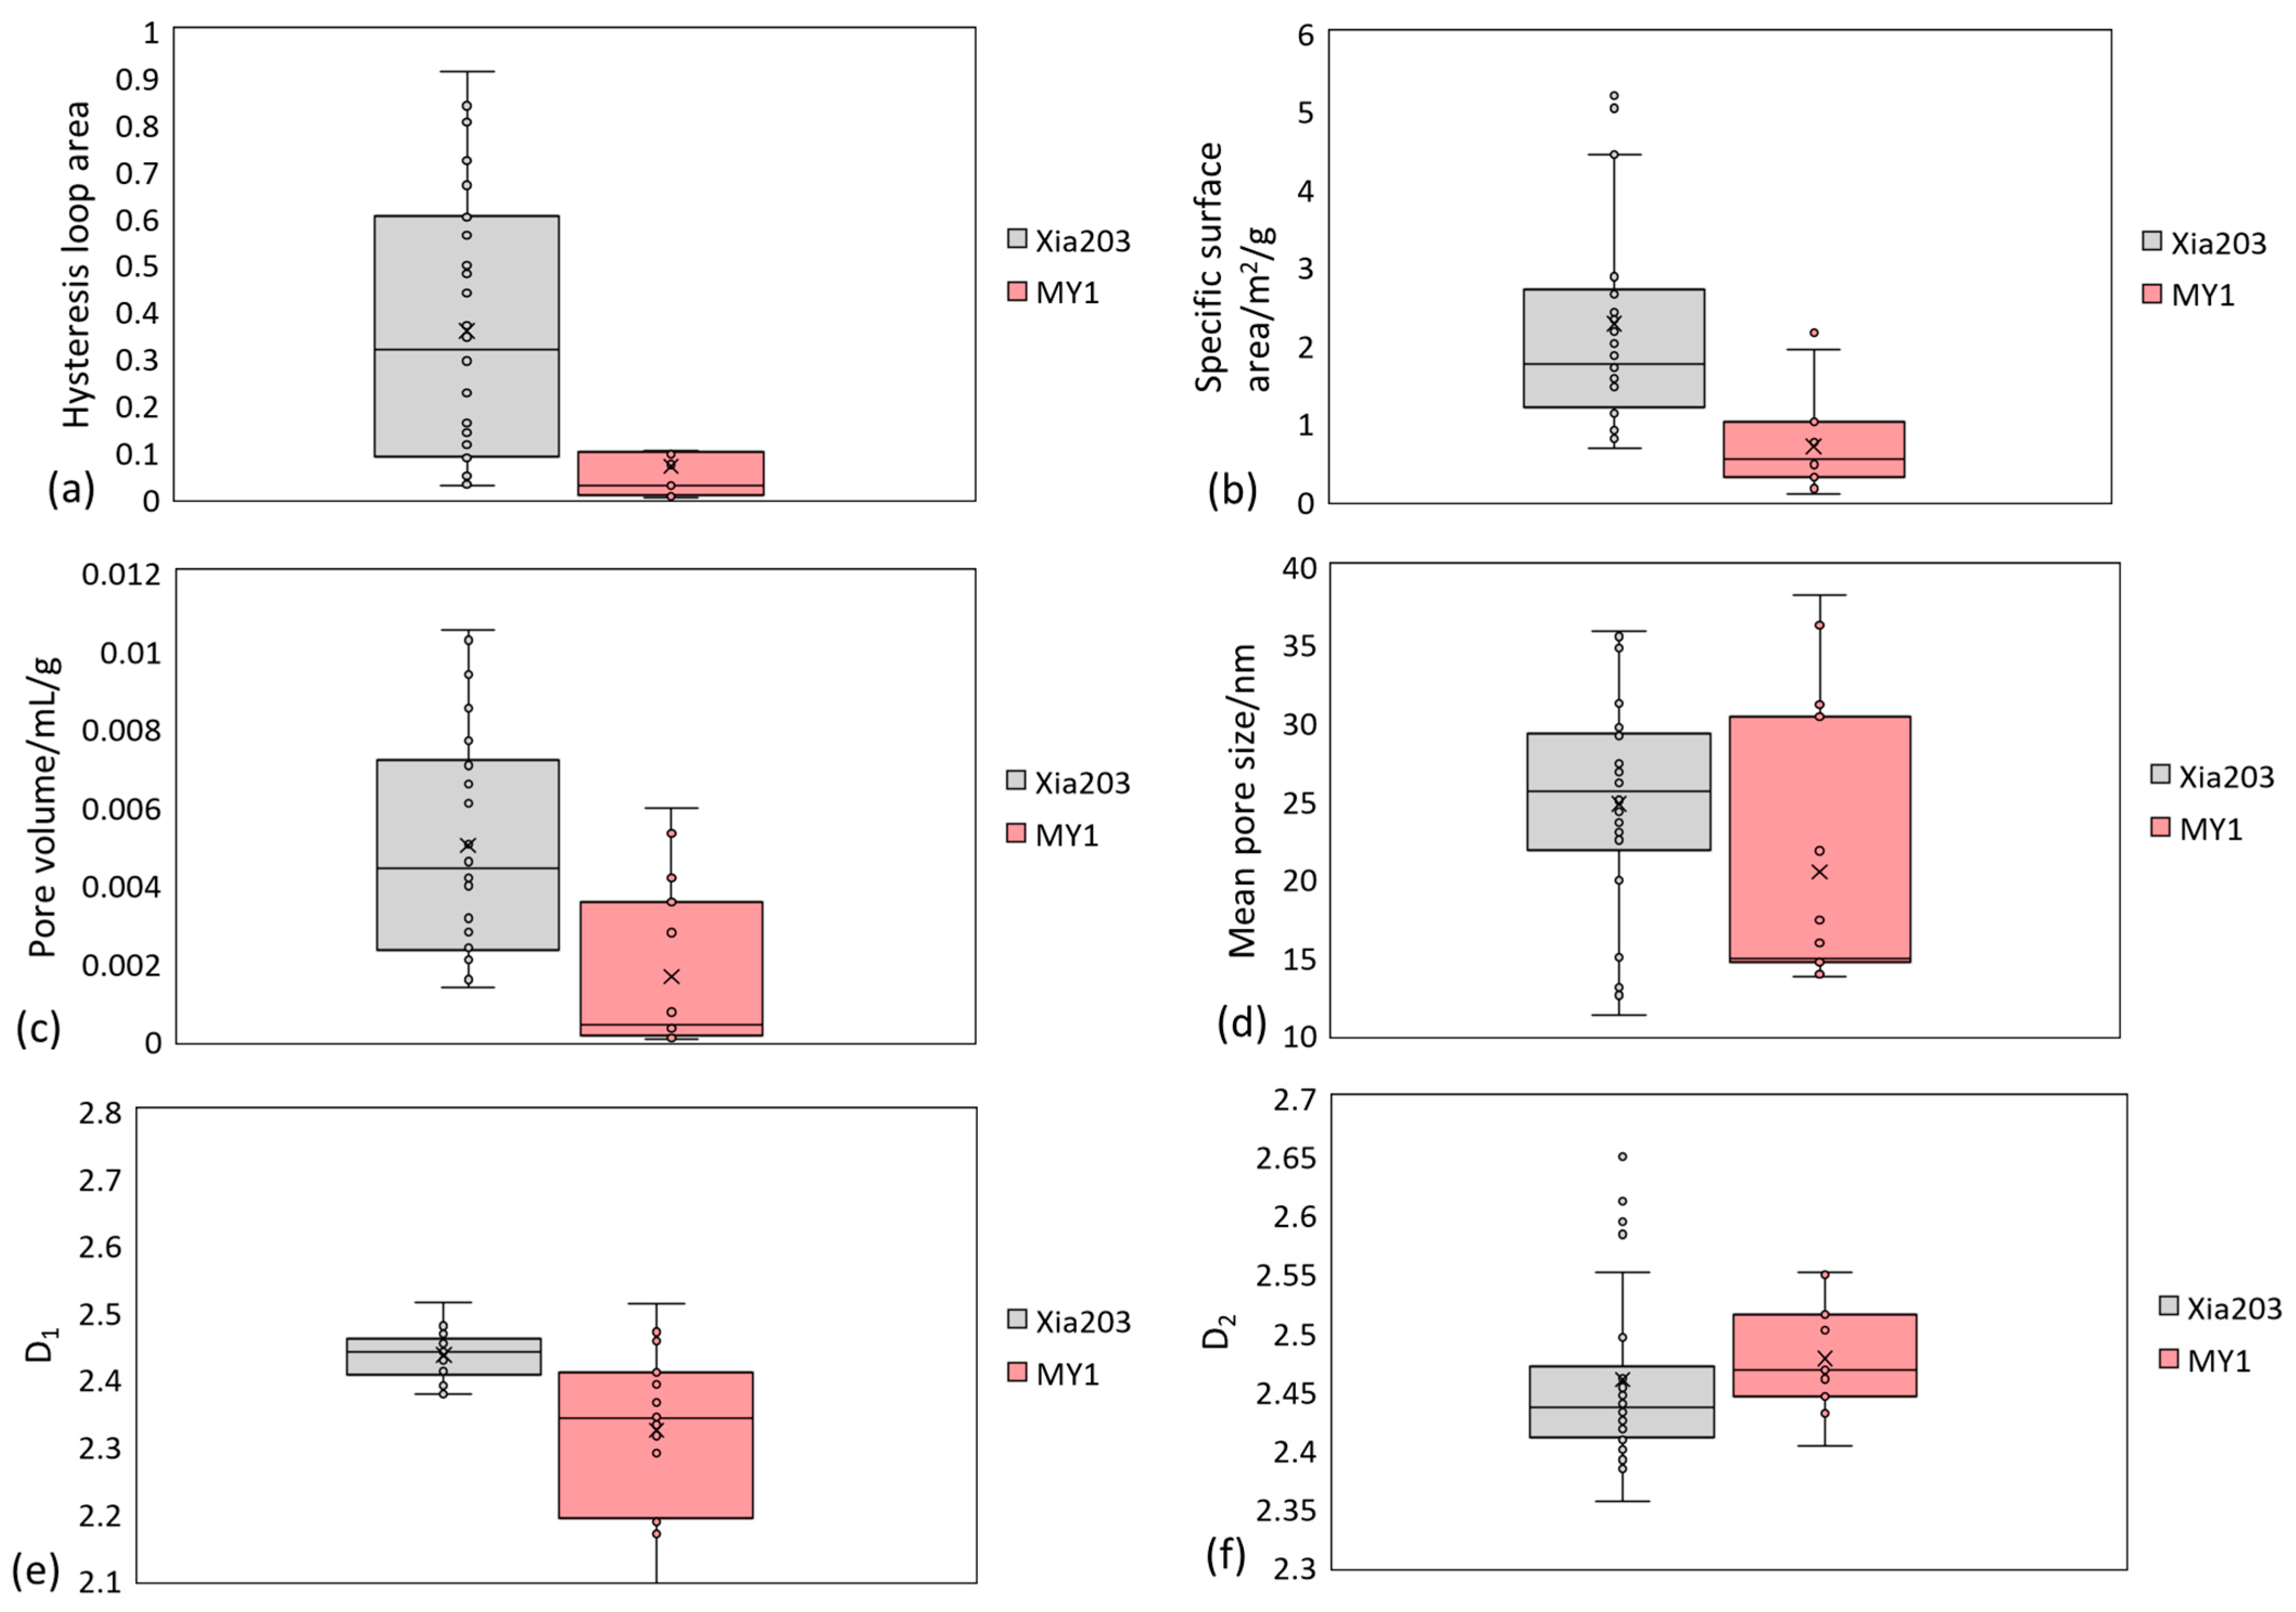
Regardless of whether it is a tight-oil or shale-oil reservoir, the reservoir samples contain a large number of flat fissures and ink-bottle-shaped pores. The hysteresis loop area, specific surface area, pore volume, average pore diameter, and D1 of Well Xia 203 (tight oil) are higher than those of Well Maye 1 (shale oil).
(3)
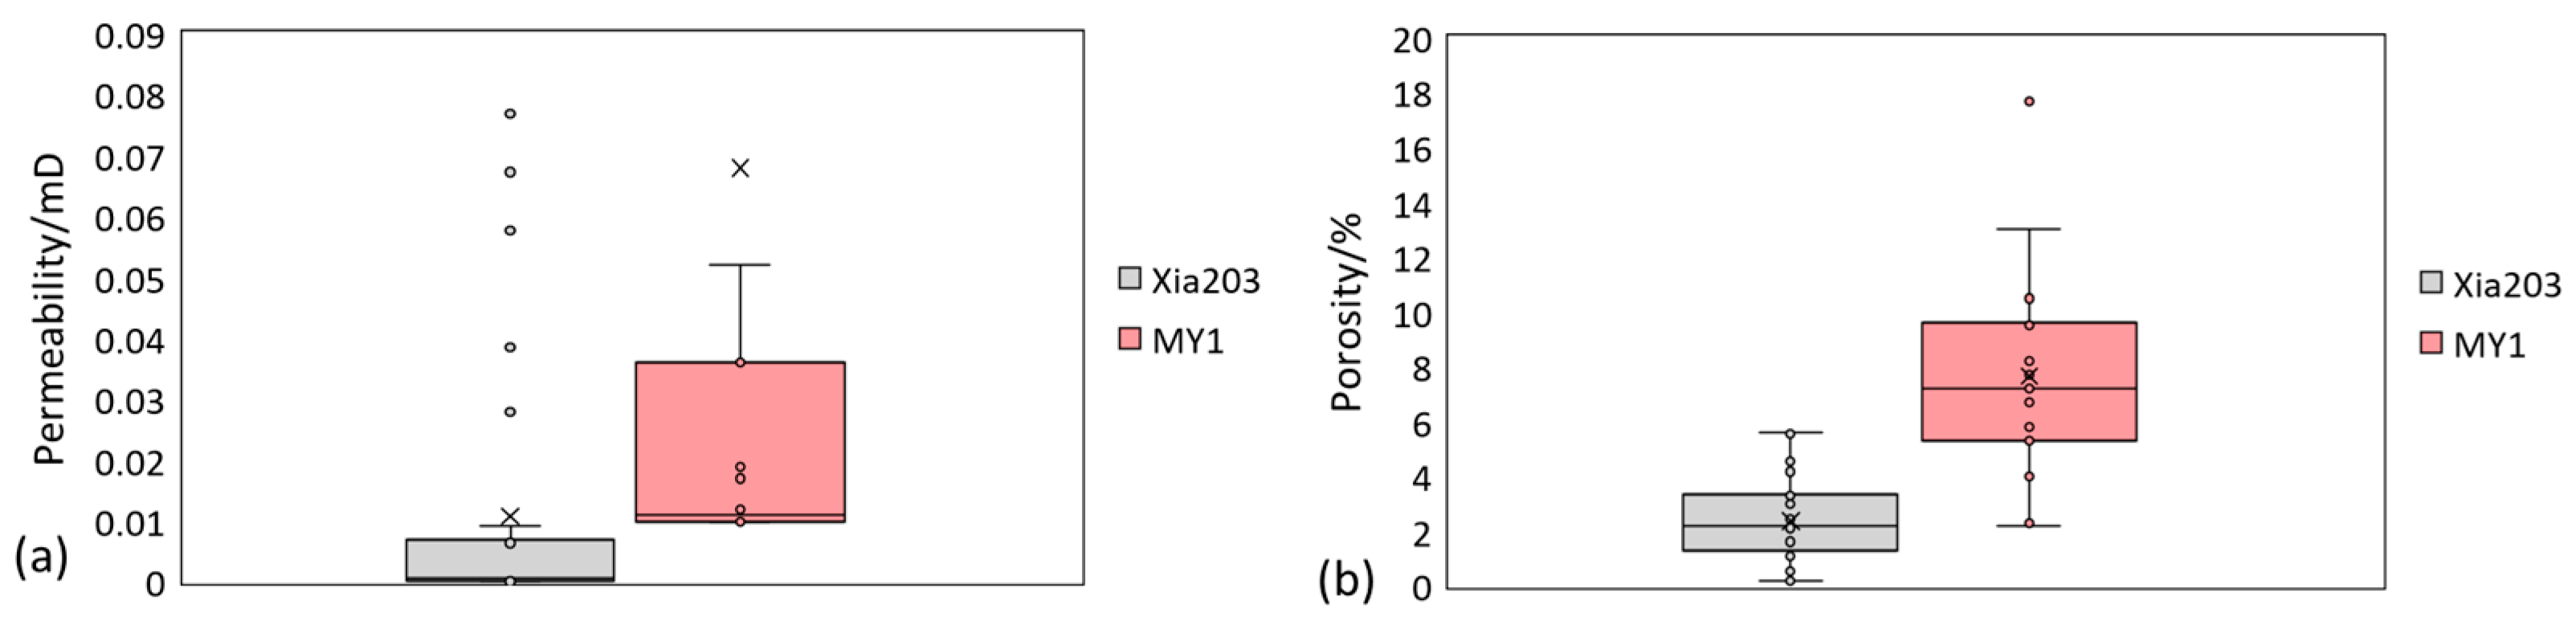
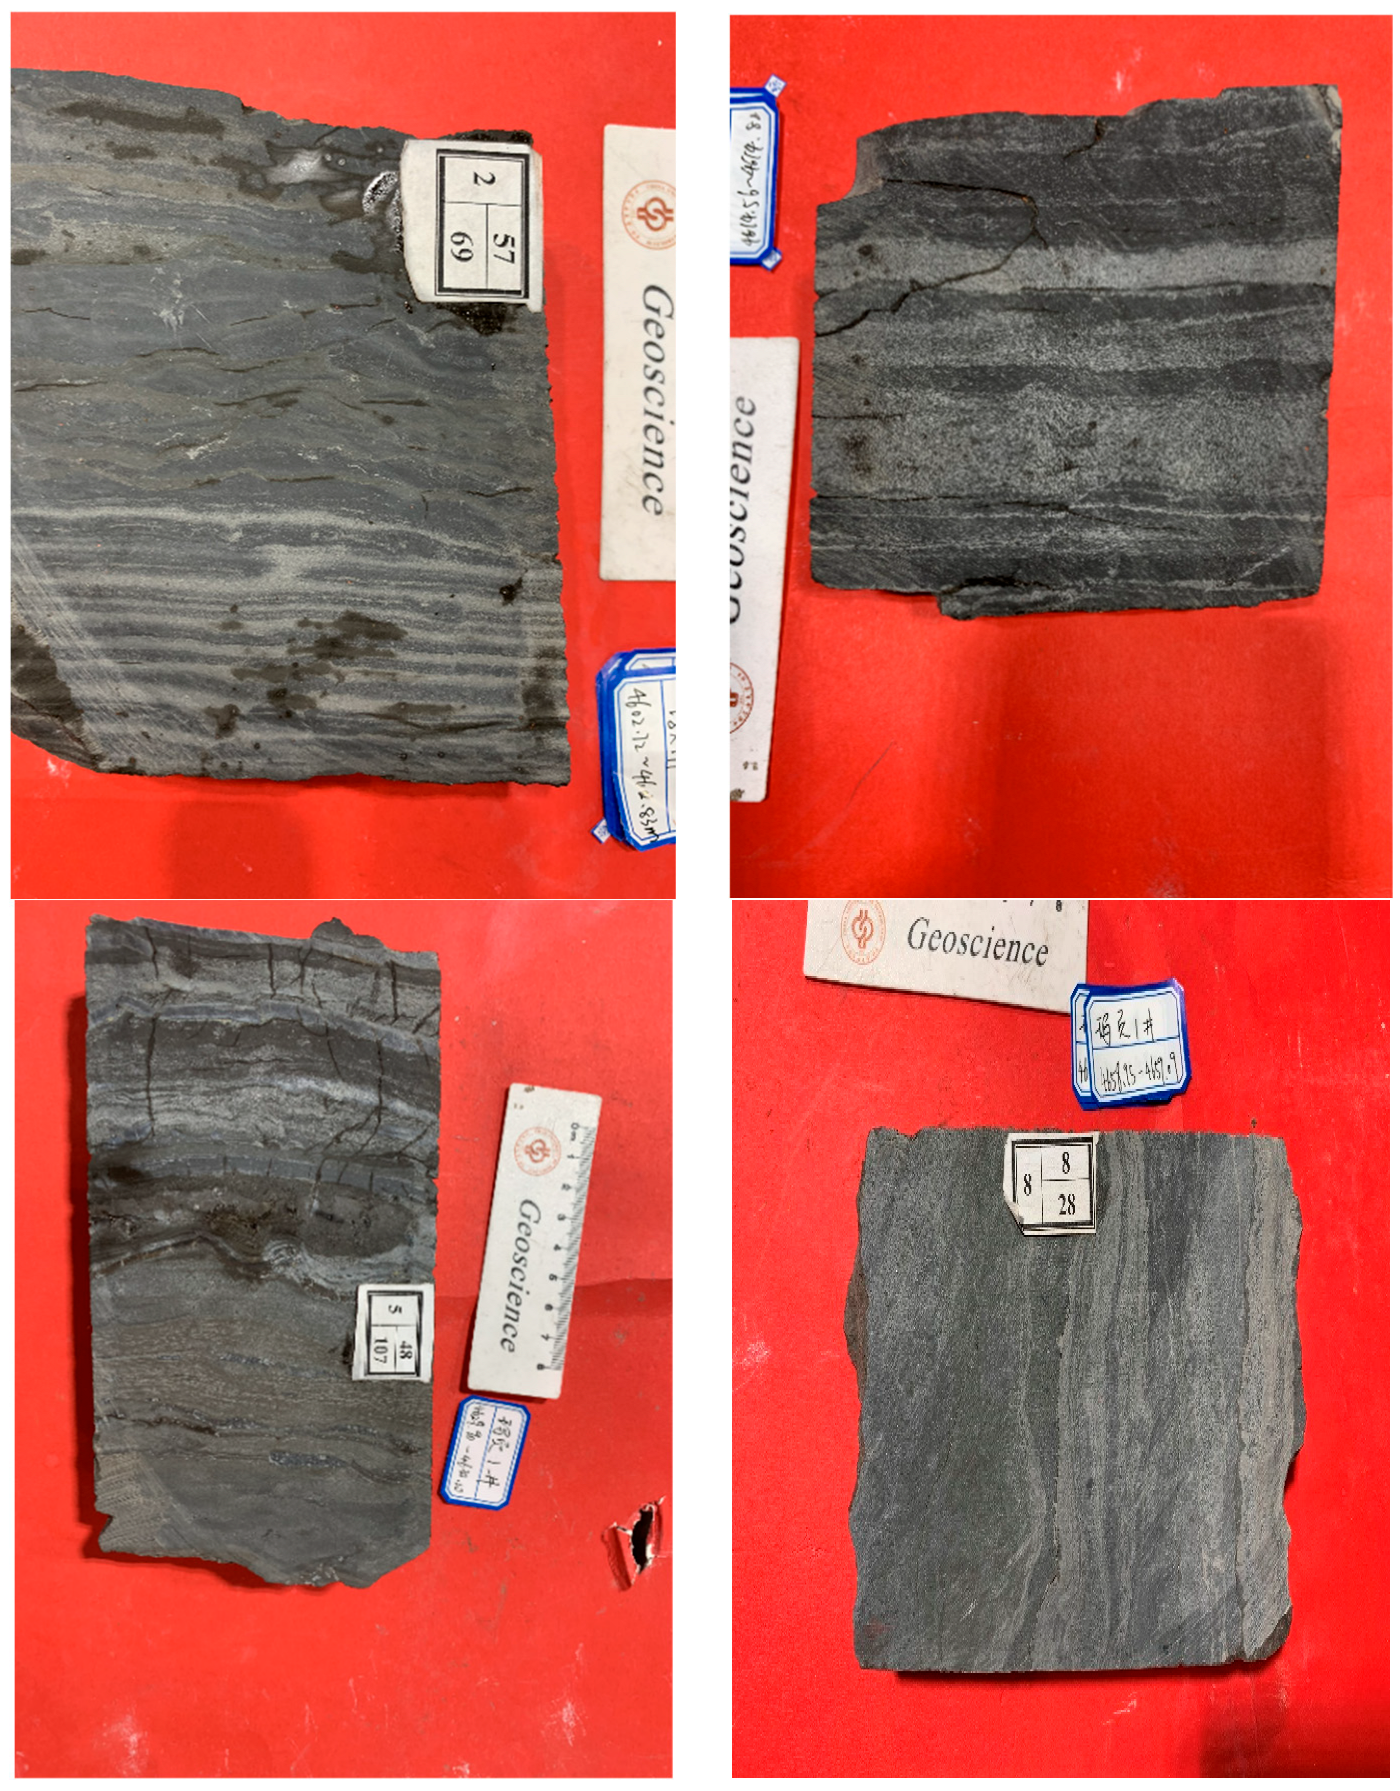
The permeability of Fengcheng Formation samples of Well Maye 1 is higher than that of Well Xia 203’s samples, with lower displacement pressure, lower median pressure, and higher selectivity coefficient. The superior permeability of shale-oil reservoirs in the Mahu Sag’s Fengcheng Formation compared to tight-oil reservoirs is mainly due to its rich laminated structure. There are significant differences in the storage space between shale-oil reservoirs and tight-oil reservoirs in the Mahu Sag’s Fengcheng Formation. Separate evaluation criteria should be established for shale-oil reservoirs and tight-oil reservoirs in sweet-spot evaluation and other aspects.

Author Contributions

Conceptualization, G.L. and Y.T.; methodology, K.L., X.L. and Y.Z.; validation, T.Z., A.X., G.L. and Z.L.; formal analysis, Z.L., Y.Z., X.L., S.Y. and A.X.; resources, Y.T. and T.Z.; data curation, Z.L., T.Z., Y.Z., S.Y. and A.X.; writing—original draft preparation, G.L. and K.L.; writing—review and editing, Y.T.; supervision, Y.T. All authors have read and agreed to the published version of the manuscript.

Funding

This research received no external funding.

Data Availability Statement

The original contributions presented in the study are included in the article; further inquiries can be directed to the corresponding author.

Conflicts of Interest

Author Guoyong Liu was employed by the PetroChina Qinghai Oilfield Company. Authors Yong Tang, Tao Zhu, Yang Zou, Xinlong Liu and Sen Yang were employed by the PetroChina Xinjiang Oilfield Company. Author Zuoqiang Liu was employed by the Research Institute of BGP Inc., China National Petroleum Corporation. The remaining authors declare that the research was conducted in the absence of any commercial or financial relationships that could be construed as a potential conflict of interest.

References

  1. Jia, C.; Zou, C.; Li, J.; Li, D. Assessment criteria, main types, basic features and resource prospects of the tight oil in China. Shiyou Xuebao/Acta Pet. Sin. 2012, 33, 343–350. [Google Scholar]
  2. Sun, L.; Zou, C.; Jia, A.; Wei, Y.; Zhu, R.; Wu, S.; Guo, Z. Development characteristics and orientation of tight oil and gas in China. Pet. Explor. Dev. 2019, 46, 1073–1087. [Google Scholar] [CrossRef]
  3. Zhao, W.; Hu, S.; Hou, L.; Yang, T. Types and resource potential of continental shale oil in China and its boundary with tight oil. Pet. Explor. Dev. 2020, 47, 1–11. [Google Scholar] [CrossRef]
  4. Yang, H.; Li, S.; Liu, X. Characteristics and resource prospects of tight oil in Ordos Basin, China. Pet. Res. 2016, 1, 27–38. [Google Scholar] [CrossRef]
  5. Fu, J.; Yu, J.; Xu, L.; Niu, X.; Feng, S.; Wang, X.; You, Y.; Li, T. New Progress in Exploration and Development of Tight Oil in Ordos Basin and Main Controlling Factors of Largescale Enrichment and Exploitable Capacity. China Pet. Explor. 2015, 20, 9–19. [Google Scholar]
  6. Yao, J.; Deng, X.; Zhao, Y.; Han, T.; Chu, M.; Pang, J. Characteristics of tight oil in Triassic Yanchang Formation, Ordos Basin. Pet. Explor. Dev. 2013, 40, 161–169. [Google Scholar] [CrossRef]
  7. Bai, X.; Liang, J.; Meng, Q.A.; Peng, J.; Wang, J.; Wang, Y.; Xue, T. Tight Oil Exploration in Northern Songliao Basin. China Pet. Explor. 2015, 20, 44–53. [Google Scholar]
  8. Huang, W.; Liang, J.; Zhao, B.; Sun, G.; Yang, Q. Main controlling factors of tight oil accumulations in the Fuyu Layer of Cretaceous Quantou Formation in northern Songliao Basin. J. Palaeogeogr. 2013, 15, 635–644. [Google Scholar]
  9. Lin, T.; Kang, D.; Jiang, L. Geological characteristics and exploration potential of the tight oil in Fuyu oil reservoirs of North Songliao Basin. Pet. Geol. Oilfield Dev. Daqing 2019, 38, 94–100. [Google Scholar]
  10. Kuang, L.; Yong, T.; Dewen, L.; Chang, Q.; Ouyang, M.; Lianhua, H.; Deguang, L. Formation conditions and exploration potential of tight oil in the Permian saline lacustrine dolomitic rock, Junggar Basin, NW China. Pet. Explor. Dev. 2012, 39, 700–711. [Google Scholar] [CrossRef]
  11. Kuang, L.; Wang, X.; Guo, X.; Chang, Q.; Jia, X. Geological characteristics and exploration practice of tight oil of Lucaogou Formation in Jimsar Sag. Xinjiang Pet. Geol. 2015, 36, 1. [Google Scholar]
  12. Pang, H.; You, X.; Hu, T.; Bai, H. Forming conditions and distribution prediction of deep tight reservoir in Junggar Basin: A case study from tight reservoir of Fengcheng Formation in the west slope of Mahu sag. Acta Pet. Sin. 2015, 36, 176. [Google Scholar]
  13. Li, Q.; Cheng, Y.; Li, Q.; Zhang, C.; Ansari, U.; Song, B. Establishment and evaluation of strength criterion for clayey silt hydrate-bearing sediments. Energy Sources Part A Recovery Util. Environ. Eff. 2018, 40, 742–750. [Google Scholar] [CrossRef]
  14. Li, Q.; Wang, Y.; Wang, F.; Wu, J.; Usman Tahir, M.; Li, Q.; Yuan, L.; Liu, Z. Effect of thickener and reservoir parameters on the filtration property of CO2 fracturing fluid. Energy Sources Part A Recovery Util. Environ. Eff. 2020, 42, 1705–1715. [Google Scholar] [CrossRef]
  15. Ji, W.; Song, Y.; Jiang, Z.; Wang, X.; Bai, Y.; Xing, J. Geological controls and estimation algorithms of lacustrine shale gas adsorption capacity: A case study of the Triassic strata in the southeastern Ordos Basin, China. Int. J. Coal Geol. 2014, 134–135, 61–73. [Google Scholar] [CrossRef]
  16. Li, X.; Zhu, H.; Zhang, K.; Li, Z.; Yu, Y.; Feng, X.; Wang, Z. Pore characteristics and pore structure deformation evolution of ductile deformed shales in the Wufeng-Longmaxi Formation, southern China. Mar. Pet. Geol. 2021, 127, 104992. [Google Scholar] [CrossRef]
  17. Wu, J.; Wu, Q.; Xu, L.; Yang, Y.; Liu, J.; Yin, Y.; Jiang, Z.; Tang, X.; Miao, H. Pore Structure and Migration Ability of Deep Shale Reservoirs in the Southern Sichuan Basin. Minerals 2024, 14, 100. [Google Scholar] [CrossRef]
  18. Zhou, J.; Yin, C.; Zeng, L.; Hu, C.; Wu, D.; Yu, Z.; Li, W.; Tang, J.; Liu, Y.; Jia, J. Development characteristics of grain shoals and favorable gas exploration areas in the 4th Member of Ordovician Majiagou Formation in the Ordos Basin. Nat. Gas Ind. 2022, 42, 17–30. [Google Scholar] [CrossRef]
  19. Liu, D.; Guo, J.; Pan, Z.; Du, W.; Zhao, F.; Chen, Y.; Shi, F.; Song, Y.; Jiang, Z. Overpressure evolution process in shale gas reservoir: Evidence from the fluid inclusions in the fractures of Wufeng Formation-Longmaxi Formation in the southern Sichuan Basin. Nat. Gas Ind. 2021, 41, 12–22. [Google Scholar] [CrossRef]
  20. Zhang, Z.; Liu, K.; Wang, Z.; Luo, F.; Zhang, H. Detailed Characterization of Pore Results of Continental Shale Reservoir in Fengcheng Formation, Mahu Sag. ACS Omega 2024, 9, 22923–22940. [Google Scholar] [CrossRef] [PubMed]
  21. Zhang, P.; Yin, Y.; Lu, S.; Li, J.; Chang, X.; Zhang, J.; Pang, Y.; Chen, G.; Liu, Y.; Li, Z. Insights into Pore Structures and Multifractal Characteristics of Shale Oil Reservoirs: A Case Study from Dongying Sag, Bohai Bay Basin, China. Energy Fuels 2022, 36, 8224–8237. [Google Scholar] [CrossRef]
  22. Xu, Y.; Lun, Z.; Pan, Z.; Wang, H.; Zhou, X.; Zhao, C.; Zhang, D. Occurrence space and state of shale oil: A review. J. Pet. Sci. Eng. 2022, 211, 110183. [Google Scholar] [CrossRef]
  23. Guo, X.; Hu, D.; Li, Y.; Wei, Z.; Wei, X.; Liu, Z. Geological factors controlling shale gas enrichment and high production in Fuling shale gas field. Pet. Explor. Dev. 2017, 44, 513–523. [Google Scholar] [CrossRef]
  24. Ailin, J.; Junlei, W.; Yunsheng, W.; Wenzhi, Z.; Hanqing, Z. Progress in shale gas exploration in China and Prospects for future development. China Pet. Explor. 2020, 25, 31–44. [Google Scholar] [CrossRef]
  25. Guo, T. Key geological issues and main controls on accumulation and enrichment of Chinese shale gas. Pet. Explor. Dev. 2016, 43, 349–359. [Google Scholar] [CrossRef]
  26. Ambrose, R.J.; Hartman, R.C.; Diaz-Campos, M.; Akkutlu, I.Y.; Sondergeld, C.H. New Pore-scale Considerations for Shale Gas in Place Calculations. In Proceedings of the SPE Unconventional Gas Conference, Pittsburgh, PA, USA, 23–25 February 2010. [Google Scholar]
  27. Jiao, K.; Yao, S.; Liu, C.; Gao, Y.; Wu, H.; Li, M.; Tang, Z. The characterization and quantitative analysis of nanopores in unconventional gas reservoirs utilizing FESEM–FIB and image processing: An example from the lower Silurian Longmaxi Shale, upper Yangtze region, China. Int. J. Coal Geol. 2014, 128–129, 1–11. [Google Scholar] [CrossRef]
  28. Loucks, R.G.; Reed, R.M.; Ruppel, S.C.; Jarvie, D.M. Morphology, Genesis, and Distribution of Nanometer-Scale Pores in Siliceous Mudstones of the Mississippian Barnett Shale. J. Sediment. Res. 2009, 79, 848–861. [Google Scholar] [CrossRef]
  29. Curtis, M.E.; Sondergeld, C.H.; Ambrose, R.J.; Rai, C.S. Microstructural investigation of gas shales in two and three dimensions using nanometer-scale resolution imaging. AAPG Bull. 2012, 96, 665–677. [Google Scholar] [CrossRef]
  30. Gao, H.; Li, H.A. Pore structure characterization, permeability evaluation and enhanced gas recovery techniques of tight gas sandstones. J. Nat. Gas Sci. Eng. 2016, 28, 536–547. [Google Scholar] [CrossRef]
  31. Hu, Q.; Zhang, Y.; Meng, X.; Li, Z.; Xie, Z.; Li, M. Characterization of micro-nano pore networks in shale oil reservoirs of Paleogene Shahejie Formation in Dongying Sag of Bohai Bay Basin, East China. Pet. Explor. Dev. 2017, 44, 720–730. [Google Scholar] [CrossRef]
  32. Liu, K.; Ostadhassan, M.; Zhou, J.; Gentzis, T.; Rezaee, R. Nanoscale pore structure characterization of the Bakken shale in the USA. Fuel 2017, 209, 567–578. [Google Scholar] [CrossRef]
  33. Kuila, U.; Prasad, M. Specific surface area and pore-size distribution in clays and shales. Geophys. Prospect. 2013, 61, 341–362. [Google Scholar] [CrossRef]
  34. Shan, C.; Zhao, W.; Wang, F.; Zhang, K.; Feng, Z.; Guo, L.; Ma, X.; Liao, T. Nanoscale pore structure heterogeneity and its quantitative characterization in Chang7 lacustrine shale of the southeastern Ordos Basin, China. J. Pet. Sci. Eng. 2020, 187, 106754. [Google Scholar] [CrossRef]
  35. Chen, Y.; Wei, L.; Mastalerz, M.; Schimmelmann, A. The effect of analytical particle size on gas adsorption porosimetry of shale. Int. J. Coal Geol. 2015, 138, 103–112. [Google Scholar] [CrossRef]
  36. Hazra, B.; Wood, D.A.; Vishal, V.; Singh, A.K. Pore Characteristics of Distinct Thermally Mature Shales: Influence of Particle Size on Low-Pressure CO2 and N2 Adsorption. Energy Fuels 2018, 32, 8175–8186. [Google Scholar] [CrossRef]
  37. Liang, F.; Zhang, Q.; Lu, B.; Chen, P.; Su, C.; Zhang, Y.; Liu, Y. Pore Structure in Shale Tested by Low Pressure N2 Adsorption Experiments: Mechanism, Geological Control and Application. Energies 2022, 15, 4875. [Google Scholar] [CrossRef]
  38. Zheng, H.; Yang, F.; Guo, Q.; Pan, S.; Jiang, S.; Wang, H. Multi-scale pore structure, pore network and pore connectivity of tight shale oil reservoir from Triassic Yanchang Formation, Ordos Basin. J. Pet. Sci. Eng. 2022, 212, 110283. [Google Scholar] [CrossRef]
  39. Labani, M.M.; Rezaee, R.; Saeedi, A.; Hinai, A.A. Evaluation of pore size spectrum of gas shale reservoirs using low pressure nitrogen adsorption, gas expansion and mercury porosimetry: A case study from the Perth and Canning Basins, Western Australia. J. Pet. Sci. Eng. 2013, 112, 7–16. [Google Scholar] [CrossRef]
  40. Lin, B.; Chen, M.; Jin, Y.; Pang, H. Modeling pore size distribution of southern Sichuan shale gas reservoirs. J. Nat. Gas Sci. Eng. 2015, 26, 883–894. [Google Scholar] [CrossRef]
  41. Sun, C.; Yao, S. Pore structure and characterization methods of shale oil reservoir. Pet. Geol. Recovery Effic. 2019, 26, 153–164. [Google Scholar]
  42. Fu, J.; Niu, X.; Dan, W.; Feng, S.; Liang, X.; Xin, H.; You, Y. The geological characteristics and the progress on exploration and development of shale oil in Chang7 Member of Mesozoic Yanchang Formation, Ordos Basin. China Pet. Explor. 2019, 24, 601. [Google Scholar]
  43. Yang, H.; Niu, X.; Xu, L.; Feng, S.; You, Y.; Liang, X.; Wang, F.; Zhang, D. Exploration potential of shale oil in Chang7 member, upper Triassic Yanchang formation, Ordos Basin, NW China. Pet. Explor. Dev. 2016, 43, 560–569. [Google Scholar] [CrossRef]
  44. Wang, Y.; Liang, J.; Zhang, J.; Zhao, B.; Zhao, Y.; Liu, X.; Xia, D. Resource potential and exploration direction of Gulong shale oil in Songliao Basin. Pet. Geol. Oilfield Dev. Daqing 2020, 39, 20–34. [Google Scholar]
  45. Feng, Z.; Liu, B.; Shao, H.; Wang, C.; Hong, S.; Wang, J.; Pan, H.; Wang, Y.; Zhang, A.; Tian, S. The diagenesis evolution and accumulating performance of the mud shale in Qingshankou Formation in Gulong area, Songliao Basin. Pet. Geol. Oilfield Dev. Daqing 2020, 39, 72–85. [Google Scholar]
  46. Li, S.; Zhang, J.; Gong, F.; Zhu, H.; Bai, Y. The characteristics of mudstones of Upper Cretaceous Qingshankou Formation and favorable area optimization of shale oil in the north of Songliao Basin. Geol. Bull. China 2017, 36, 654–663. [Google Scholar]
  47. Zhi, D.; Tang, Y.; Yang, Z.; Guo, X.; Zheng, M.; Wan, M.; Huang, L. Geological characteristics and accumulation mechanism of continental shale oil in Jimusaer sag, Junggar Basin. Oil Gas Geol. 2019, 40, 524–534. [Google Scholar]
  48. Huo, J.; He, J.; Gao, Y.; Dong, Y.; Xu, D.; Li, Y. Difficulties and countermeasures of shale oil development in Lucaogou Formation of Jimsar Sag. Xinjiang Pet. Geol. 2019, 40, 379. [Google Scholar]
  49. Zhu, R.; Wu, S.; Su, L.; Cui, J.; Mao, Z.; Zhang, X. Problems and future works of porous texture characterization of tight reservoirs in China. Acta Pet. Sin. 2016, 37, 1323. [Google Scholar]
  50. Lu, S. The Main Control Factor for Oil Rich Integration in Yanchang Oil Field in the Ordos Basin. Master Thesis, China University of Petroleum, Beijing, China, 2017. [Google Scholar]
  51. Meng, X.; Meng, W.; Chen, L.; Wang, C.; Leng, D.; Wang, D. The Reservoir Characteristics of Chang 6 and Chang 9 Reservoirs in the Fuxian-Ganquan Area of Ordos Basin. J. Chang. Univ. (Nat. Sci. Eds.) 2018, 15, 17–20+15. [Google Scholar]
  52. Wang, X.; Wang, M.; Zhao, A. Microscopic characteristics of Chang 7 tight sandstone reservoir in Ordos Basin. Lithol. Reserv. 2014, 26, 79–83. [Google Scholar]
  53. Wang, X.; Guo, Y.; Fu, J.; Liu, H.; Chen, Q.; Li, T.; Liao, J.; Zhang, C. Control factors for forming higher porosity and permeability sandstone reservoirs in Chang 8 member of Yanchang Formation, Ordos Basin. Pet. Explor. Dev. 2005, 32, 35–38. [Google Scholar]
  54. Zhu, X.; Zeng, H.; Li, S.; Dong, Y.; Zhu, S.; Zhao, D.; Huang, W. Sedimentary characteristics and seismic geomorphologic responses of a shallow-water delta in the Qingshankou Formation from the Songliao Basin, China. Mar. Pet. Geol. 2017, 79, 131–148. [Google Scholar] [CrossRef]
  55. Shi, L.; Wang, Z.; Zhang, G.; Zhang, Y.; Xing, E. Distribution and formation of tight oil in Qijia area, Songliao Basin, NE China. Pet. Explor. Dev. 2015, 42, 48–55. [Google Scholar] [CrossRef]
  56. Wang, S. Formation and Distribution Rule of Tight Oil in Fuyu Oil Layer of the Sanzhao Area. J. Petrochem. Univ. 2018, 31, 46. [Google Scholar]
  57. Cao, Y.; Zhu, N.; Zhang, S.; Xi, K.; Xue, X. Diagenesis and reserving space characteristics of tight oil reservoirs of Permian Lucaogou Formation in Jimusar Sag of Junggar Basin. J. Earth Sci. Environ. 2019, 41, 253–266. [Google Scholar]
  58. Kuang, L.; Hu, W.; Wang, X.; Tun, H.; Wang, X. Research of the tight oil reservoir in the Lucaogou Formation in Jimusar Sag: Analysis of lithology and porosity characteristics. Geol. J. China Univ. 2013, 19, 529. [Google Scholar]
  59. Zhang, T.; Fan, G.; Li, Y.-W.; Yu, C. Pore-throat characterization of tight oil reservoir in the Lucaogou formation, Jimusar sag. CT Theory Appl. 2016, 25, 425–434. [Google Scholar]
  60. Ma, Q.; Yang, S.; Yang, L. Characteristics of the micro-pore in Lucaogou-Formation tight reservoir of Jimsar Sag, Junggar Basin. Pet. Geol. Oilfield Dev. Daqing 2020, 39, 13–20. [Google Scholar]
  61. Li, H.; Mao, X.; Hu, G.; Chen, C.; Feng, M.; Wang, Q. Characteristics and productivity prediction of tight reservoirs in Lucaogou Formation of Jimusa’er Sag in Junggar Basin. J. Oil Gas Technol. 2014, 36, 40–44. [Google Scholar]
  62. Liu, Y.; Zhu, X.; Zhu, M.; Liao, Z.; Wang, X.; Wang, J. Characteristics of tight oil reservoirs of the Permian Fengcheng Formation in Wu-Xia area, Junggar Basin. Lithol. Reserv. 2014, 26, 66–72. [Google Scholar]
  63. Xu, L.; Chang, Q.; Feng, L.; Zhang, N.; Liu, H. The reservoir characteristics and control factors of shale oil in Permian Fengcheng Formation of Mahu Sag, Junggar Basin. China Pet. Explor. 2019, 24, 649. [Google Scholar]
  64. Yang, F.; Meng, X.; Wang, X.; Yu, P.; Shao, G.; Chen, H. Micro-Pore characteristics and influencing factors of Fengcheng Formation shale in well Maye-1. Xinjiang Pet. Geol. 2022, 43, 1–10. [Google Scholar]
  65. Dumitrache, L.; Roy, A.; Bird, A.; Goktas, B.; Sorgi, C.; Stanley, R.; De Gennaro, V.; Eswein, E.; Abbott, J. A Multidisciplinary Approach to Production Optimization through Hydraulic Fracturing Stimulation and Geomechanical Modelling in Clair Field. In Proceedings of the International Petroleum Technology Conference, Riyadh, Saudi Arabia, 21–23 February 2022. [Google Scholar]
  66. Zhi, D.; Cao, J.; Xiang, B.; Qin, Z.; Wang, T. Fengcheng alkaline lacustrine source rocks of Lower Permian in Mahu Sag in Junggar Basin: Hydrocarbon generation mechanism and petroleum resources reestimation. Xinjiang Pet. Geol. 2016, 37, 1. [Google Scholar]
  67. Zhang, Y.; Li, W.; Tang, W. Tectonic setting and environment of alkaline lacustrine source rocks in the Lower Permian Fengcheng Formation of Mahu Sag. Xinjiang Pet. Geol. 2018, 39, 48–54. [Google Scholar]
  68. Jiang, F.; Meiling, H.; Tao, H.; Jiahao, L.; Huang, L.; Chenglin, L.; Jiang, Z.; Huang, R.; Zhang, C.; Guanyun, W. Controlling factors and models of shale oil enrichment in Lower Permian Fengcheng Formation, Mahu Sag, Junggar Basin, NW China. Pet. Explor. Dev. 2023, 50, 812–825. [Google Scholar] [CrossRef]
  69. Lei, D.; Chen, G.; Liu, H.; Li, X.; Abulimit, T.; Cao, J. Study on the forming conditions and exploration fields of the Mahu giant oil (gas) province, Junggar Basin. Acta Geol. Sin. 2017, 91, 1604–1619. [Google Scholar]
  70. Zhi, D.; Tang, Y.; He, W.; Guo, X.; Zheng, M.; Huang, L. Orderly coexistence and accumulation models of conventional and unconventional hydrocarbons in Lower Permian Fengcheng Formation, Mahu Sag, Junggar Basin. Pet. Explor. Dev. 2021, 48, 43–59. [Google Scholar] [CrossRef]
  71. Xia, L.; Cao, J.; Stüeken, E.E.; Zhi, D.; Wang, T.; Li, W. Unsynchronized evolution of salinity and pH of a Permian alkaline lake influenced by hydrothermal fluids: A multi-proxy geochemical study. Chem. Geol. 2020, 541, 119581. [Google Scholar] [CrossRef]
  72. Zhang, Z.; Yuan, X.; Wang, M.; Zhou, C.; Tang, Y.; Chen, X.; Lin, M.; Cheng, D. Alkaline-lacustrine deposition and paleoenvironmental evolution in Permian Fengcheng Formation at the Mahu sag, Junggar Basin, NW China. Pet. Explor. Dev. 2018, 45, 1036–1049. [Google Scholar] [CrossRef]
  73. Wang, M.; Zhang, Z.; Zhou, C.; Yuan, X.; Lin, M.; Liu, Y.; Cheng, D. Lithological characteristics and origin of alkaline lacustrine of the Lower Permian Fengcheng Formation in Mahu Sag, Junggar Basin. J. Palaeogeogr. 2018, 20, 147–162. [Google Scholar]
  74. Cao, J.; Zhang, Y.; Hu, W.; Yao, S.; Wang, X.; Zhang, Y.; Tang, Y. The Permian hybrid petroleum system in the northwest margin of the Junggar Basin, northwest China. Mar. Pet. Geol. 2005, 22, 331–349. [Google Scholar] [CrossRef]
  75. Barrett, E.P.; Joyner, L.G.; Halenda, P.P. The Determination of Pore Volume and Area Distributions in Porous Substances. I. Computations from Nitrogen Isotherms. J. Am. Chem. Soc. 1951, 73, 373–380. [Google Scholar] [CrossRef]
  76. Pfeifer, P.; Avnir, D. Chemistry in noninteger dimensions between two and three. I. Fractal theory of heterogeneous surfaces. J. Chem. Phys. 1983, 79, 3558–3565. [Google Scholar] [CrossRef]
  77. Avnir, D.; Jaroniec, M. An isotherm equation for adsorption on fractal surfaces of heterogeneous porous materials. Langmuir 1989, 5, 1431–1433. [Google Scholar] [CrossRef]
  78. Chen, Y.; Wu, Q.; Pan, D.; Pan, N. Fractal Aperture Distribution of Activated Carbon Fiber and Adsorption Behavior to Low-Density Benzene Steam. J. Dispers. Sci. Technol. 2006, 27, 1157–1160. [Google Scholar] [CrossRef]
  79. Yao, Y.; Liu, D.; Tang, D.; Tang, S.; Huang, W. Fractal characterization of adsorption-pores of coals from North China: An investigation on CH4 adsorption capacity of coals. Int. J. Coal Geol. 2008, 73, 27–42. [Google Scholar] [CrossRef]
  80. Yang, F.; Ning, Z.; Liu, H. Fractal characteristics of shales from a shale gas reservoir in the Sichuan Basin, China. Fuel 2014, 115, 378–384. [Google Scholar] [CrossRef]
  81. Mendhe, V.A.; Bannerjee, M.; Varma, A.K.; Kamble, A.D.; Mishra, S.; Singh, B.D. Fractal and pore dispositions of coal seams with significance to coalbed methane plays of East Bokaro, Jharkhand, India. J. Nat. Gas Sci. Eng. 2017, 38, 412–433. [Google Scholar] [CrossRef]
  82. Xiong, J.; Liu, X.; Liang, L. An investigation of fractal characteristics of marine shales in the Southern China from nitrogen adsorption data. J. Chem. 2015, 2015, 303164. [Google Scholar] [CrossRef]
  83. Hazra, B.; Wood, D.A.; Vishal, V.; Varma, A.K.; Sakha, D.; Singh, A.K. Porosity controls and fractal disposition of organic-rich Permian shales using low-pressure adsorption techniques. Fuel 2018, 220, 837–848. [Google Scholar] [CrossRef]
  84. Rouquerol, J.; Avnir, D.; Fairbridge, C.W.; Everett, D.H.; Haynes, J.; Pernicone, N.; Ramsay, J.D.; Sing, K.S.W.; Unger, K.K. Recommendations for the characterization of porous solids (Technical Report). Pure Appl. Chem. 1994, 66, 1739–1758. [Google Scholar] [CrossRef]
  85. Sing, K.S. Reporting physisorption data for gas/solid systems with special reference to the determination of surface area and porosity (Recommendations 1984). Pure Appl. Chem. 1985, 57, 603–619. [Google Scholar] [CrossRef]
  86. Thommes, M.; Kaneko, K.; Neimark, A.V.; Olivier, J.P.; Rodriguez-Reinoso, F.; Rouquerol, J.; Sing, K.S. Physisorption of gases, with special reference to the evaluation of surface area and pore size distribution (IUPAC Technical Report). Pure Appl. Chem. 2015, 87, 1051–1069. [Google Scholar] [CrossRef]
Figure 1. Structural contour diagram of Mahu Sag.
Energies 17 04027 g001
Figure 2. Stratigraphic column diagram of Junggar Basin.
Energies 17 04027 g002
Figure 3. Mineral composition triangle diagram: (a) Well Maye 1; (b) Well Xia 203.
Energies 17 04027 g003
Figure 4. Nitrogen adsorption analysis curve and pore size distribution of the sample: (a,c) Well Maye 1; (b,d) Well Xia 203.
Energies 17 04027 g004
Figure 5. Porosity conditions observed under a scanning electron microscope: (a,c) are the original images, while (b,d) are the binary images after the segmentation.
Energies 17 04027 g005
Figure 6. Comparison of pore structure parameters between Xia 203 and Maye 1 wells: (a) hysteresis loop area; (b) specific surface area; (c) pore volume; (d) average pore diameter; (e) comparison of D1; (f) comparison of D2.
Energies 17 04027 g006
Figure 7. Correlation between pore structure parameters and various mineral compositions in Well Xia 203: (af) correlation between pore structure parameters and the content of quartz + feldspar; (gl) correlation between pore structure parameters and the content of clay minerals; (mr) correlation between pore structure parameters and the content of carbonate minerals.
Energies 17 04027 g007
Figure 8. Correlation between nitrogen adsorption parameters and various mineral compositions in Well Maye 1; (af) correlation between pore structure parameters and the content of quartz + feldspar; (gl) correlation between pore structure parameters and the content of clay minerals; (mr) correlation between pore structure parameters and the content of carbonate minerals.
Energies 17 04027 g008
Figure 9. Comparison of mercury-pressed porosity and permeability in wells Xia 203 and Maye 1: (a) comparison chart of permeability; (b) comparison chart of porosity.
Energies 17 04027 g009
Figure 10. Comparison of displacement pressure: (a) Well Maye 1; (b) Well Xia 203.
Energies 17 04027 g010
Figure 11. Median pressure comparison: (a) Well Maye 1; (b) Well Xia 203.
Energies 17 04027 g011
Figure 12. Comparison of sorting coefficients: (a) Well Maye 1; (b) Well Xia 203.
Energies 17 04027 g012
Figure 13. Lamellar Structure of Well Maye 1.
Energies 17 04027 g013
Figure 14. Analysis chart of average values of different pore proportions in different bedding structures.
Energies 17 04027 g014
Disclaimer/Publisher’s Note: The statements, opinions and data contained in all publications are solely those of the individual author(s) and contributor(s) and not of MDPI and/or the editor(s). MDPI and/or the editor(s) disclaim responsibility for any injury to people or property resulting from any ideas, methods, instructions or products referred to in the content.

