Article

A Thermo-Hydro-Mechanical Damage Coupling Model for Stability Analysis During the In Situ Conversion Process

1
Drilling & Production Technology Research Institute, PetroChina Qinghai Oilfield Company, Dunhuang 736202, China
2
Key Laboratory of Oil & Gas Production, CNPC, Beijing 100083, China
3
Research Institute of Petroleum Exploration & Development, PetroChina, Beijing 100083, China
4
Engineering and Technology Department, PetroChina Qinghai Oilfield Company, Dunhuang 736202, China
5
Research Institute of Oil and Gas Technology, PetroChina Qinghai Oilfield Company, Dunhuang 736202, China
*
Author to whom correspondence should be addressed.
Energies 2025, 18(6), 1424; https://doi.org/10.3390/en18061424
Submission received: 2 November 2024 / Revised: 22 November 2024 / Accepted: 24 February 2025 / Published: 13 March 2025
(This article belongs to the Special Issue Advanced Technologies in Oil Shale Conversion)

Abstract

:
This study addresses stability challenges in oil shale reservoirs during the in situ conversion process by developing a thermo-hydro-mechanical damage (THMD) coupling model. The THMD model integrates thermo-poroelasticity theory with a localized gradient damage approach, accounting for thermal expansion and pore pressure effects on stress evolution and avoiding mesh dependency issues present in conventional local damage models. To capture tensile–compressive asymmetry in geotechnical materials, an equivalent strain based on strain energy density is introduced, which regularizes the tensile component of the elastic strain energy density. Additionally, the model simulates the multi-layer wellbore structure and the dynamic heating and extraction processes, recreating the in situ environment. Validation through a comparison of numerical solutions with both experimental and analytical results confirms the accuracy and reliability of the proposed model. Wellbore stability analysis reveals that damage tends to propagate in the horizontal direction due to the disparity between horizontal and vertical in situ stresses, and the damaged area at a heating temperature of 600 °C is nearly three times that at a heating temperature of 400 °C. In addition, a cement sheath thickness of approximately 50 mm is recommended to optimize heat transfer efficiency and wellbore integrity to improve economic returns. Our study shows that high extraction pressure (−4 MPa) nearly doubles the reservoir’s damage area and increases subsidence from −3.6 cm to −6.5 cm within six months. These results demonstrate the model’s ability to guide improved extraction efficiency and mitigate environmental risks, offering valuable insights for optimizing in situ conversion strategies.

1. Introduction

Energy is a fundamental resource for the survival and advancement of human society. In recent years, global energy consumption has continued to rise, accompanied by a steady increase in oil prices, raising concerns about the sustainability of the world’s energy supplies. Due to their vast potential, unconventional oil and gas resources have become a key focus for many nations and energy companies [1,2,3]. Among them, oil shale, which is a kind of sedimentary rock enriched with solid organic matter, is believed to be the most promising unconventional energy resource. Oil shale resources are particularly abundant, with hundreds of deposits identified across 33 countries, containing an estimated 70 to 80 billion tons of resources. The “shale revolution” has enabled the United States to achieve energy independence, significantly reshaping the global energy landscape. However, extracting oil shale resources, especially low-maturity deposits with abundant macromolecular solid organic matter but little movable oil, poses significant challenges. To reduce extraction costs and enhance efficiency, in situ conversion technology is frequently employed for low-maturity oil shale deposits [4,5,6,7]. This technique employs methods such as electric heating to heat organic-rich shale formations at depths ranging from 300 to 3000 m. This heating process facilitates the physical and chemical reactions that pyrolyze organic matter into lighter hydrocarbons, making extraction more feasible and economically viable [8,9,10,11,12]. This study seeks to provide an in-depth examination of these challenges and propose effective strategies to enhance the extraction process. Figure 1 illustrates the schematic of the in situ conversion process in a horizontal well extraction system.
During the in situ conversion process, the heating operations inevitably raise the temperature of the rock surrounding the wellbore, leading to thermal expansion. This results in stress concentration within the rock, and if the induced stress exceeds the rock’s strength threshold, crack propagation and rock failure are likely to occur. Such failures can compromise the structural integrity of the wellbore and, in severe cases, may cause wellbore collapse [13,14,15,16], presenting significant risks to the safety and efficiency of oil and gas extraction. Simultaneously, in situ heating initiates the pyrolysis of solid organic matter, which contributes to rock damage and increases both porosity and permeability [17,18,19]. These changes can reduce the reservoir’s load-bearing capacity and enhance the extraction of fluid products. As extraction proceeds, the decline in pore pressure leads to an increase in the rock’s effective stress, which can result in reservoir compaction. This compaction can destabilize the geological structure and potentially cause surface subsidence, affecting the long-term sustainability of the extraction process. Therefore, a detailed investigation into the mechanisms of thermally induced damage during shale oil extraction, as well as its effects on the integrity and stability of both the wellbore and the reservoir, is essential for optimizing in situ conversion technology and enhancing extraction efficiency.
The analysis of thermal–hydraulic–mechanical (THM) coupling models and wellbore damage has been widely studied. Meier et al. [20] conducted a series of hydrostatic pressure loading experiments on a shale drilling model, identifying the formation of spiral shear cracks during the drilling process. Nguyen et al. [21] developed a method for stability analysis of fractured shale wellbores by integrating changes in pore pressure within both fractures and the surrounding matrix into the governing equations. Dokhani et al. [13] explored the effects of weak planes and clay mineral interactions on formation stability, using an improved Jaeger criterion to assess wellbore stability. Guo et al. [22] enhanced the THM coupling model by introducing a framework designed to optimize well placement for geothermal energy extraction. Li et al. [23] developed a fully coupled THM model for three-dimensional hydraulic fracturing simulations, providing a more accurate representation of fracture behavior. Wang et al. [24] constructed a THM coupling model based on variational phase-field theory and proposed a stable and efficient iterative solution algorithm. Additionally, Li et al. [25] established a thermal–hydraulic–mechanical damage (THMD) coupling model that accounts for the micro-scale heterogeneity of rock, allowing for a detailed analysis of rock column stability. Wei et al. [26] provided valuable insights into the evaluation and prediction of underground nuclear waste repositories under coupled THM conditions. Phan et al. [27] proposed a general framework for describing the behavior of concrete under extreme loading conditions, such as those encountered during tunnel fires.
To effectively address the stability challenges of the wellbore and surrounding formations during the in situ conversion process, it is crucial to account for the complexity of THMD coupling effects. The THMD coupling model enables a comprehensive and dynamic simulation of the behavior and evolution of the rock around the wellbore under the influence of multiple interacting fields. This method offers a precise depiction of the intricate processes involved, allowing for a detailed analysis of the interactions between heat transfer, fluid flow, reservoir deformation, and damage evolution. Furthermore, research on THMD coupling not only deepens our understanding of geomechanical behavior but also offers a theoretical foundation for optimizing the design parameters during the extraction process. This insight is critical for minimizing the risk of wellbore instability and enhancing the overall safety and efficiency of shale oil extraction.
This work is devoted to optimizing the exploitation strategy to ensure stability during the in situ conversion process of oil shale reservoirs. To this end, contributions have been made in three key aspects: first, the development of a comprehensive THMD model that builds upon traditional THM models by integrating a damage component to account for material degradation under operational stresses; second, the consideration of horizontal and vertical in situ stresses, as well as the multi-layer structure of the wellbore and dynamic heating-extraction processes, to simulate real-world operational complexities; and third, the adoption of a gradient damage model, which eliminates grid dependency issues commonly found in conventional damage modeling approaches. This study investigates the stability of both the wellbore and the reservoir, utilizing numerical simulations to propose optimized stability solutions specifically tailored to in situ conversion technology. These advancements aim to enhance the safety and efficiency of the in situ conversion process, providing targeted solutions that are well suited to the complexities of shale oil recovery.
The structure of this paper is organized as follows: Section 2 provides a comprehensive introduction to the THMD coupling model and the nonlocal damage theory in the context of the in situ conversion process. This chapter emphasizes the interrelationships among the thermal, hydraulic, mechanical, and damage fields and introduces the nonlocal strain formulation based on strain energy, along with the corresponding solution algorithms. Section 3 focuses on model validation, comparing the predictions of the constructed model with theoretical solutions and experimental results to demonstrate its effectiveness in predicting THM coupling and thermally induced damage. Section 4 analyzes the damage evolution characteristics of the wellbore and surrounding formation under both single-well and well-network conditions, investigating the effects of various heating methods and well spacing designs on the stability of the wellbore and formation. Finally, Section 5 summarizes the key findings of this paper and outlines potential directions for future research.

2. Methods

2.1. THMD Coupling Model

To accurately describe the complex coupling effects during in situ conversion processes, we develop a THMD coupling model by integrating thermo-poroelastic mechanics with nonlocal damage theory. First, we establish a displacement field equation for the rock matrix during in situ conversion based on the differential equations of solid mechanic equilibrium and displacement relations, incorporating the effects of effective stress and thermal stress. Second, we derive a temperature field governing equation that accounts for deformation energy based on the law of energy conservation as outlined by Forest [28]. Further, a fluid flow equation is formulated based on mass conservation and Darcy’s law following the framework proposed by Zhou et al. [29]. Finally, a rock damage mechanics model with tension–compression asymmetry is obtained based on nonlocal damage theory and strain energy decomposition based on the work of Miehe et al. [30].

2.1.1. The Stress Equilibrium Equation

The classical mechanic equilibrium equation is stated as:
· σ + ρ b f b = 0
where σ is the total Cauchy stress tensor; f b is the gravitational vector; ρ b = ϕ ρ f + ( 1 ϕ ) ρ s is the bulk density; ρ f is the fluid density; ρ s is the solid density; and ϕ is the porosity, which is defined as the ratio of the current pore volume to the bulk volume. The effective stress relationship is:
σ = σ b p δ
According to the constitutive relation of solid rock:
σ = C dr : ε 3 α K θ δ
Substituting into Equation (1) yields:
· C dr : ε b p δ 3 α K θ δ + ρ b f b = 0
where σ is the effective stress tensor; C dr represents the fourth-order elasticity tensor; p denotes the pore pressure; θ = T T 0 is the temperature change; T and T 0 are the current and reference temperatures, respectively; b is the Biot coefficient; α represents the linear thermal expansion coefficient of the solid; K is the bulk modulus; δ is the second-order identity tensor; and ε is the linear strain tensor in the case of small deformations.
ε = s u = 1 2 ( u + ( u ) T )

2.1.2. The Hydraulic Pressure Equation

In a quasi-static situation, Darcy’s law can be expressed as [31]:
V = w ρ f 0 = k ( p + ρ f 0 f g )
where w is the mass of fluid passing through a unit area per unit time from the Eulerian perspective, V s is the solid skeleton velocity, V f is the fluid velocity, k is the fluid permeability, and f g is gravitational acceleration. Through the Gibbs free energy and the pressure–temperature relationship, the following equations are derived:
d ρ f ρ f = d p K f 3 α f d T
d ϕ = b d ε + d p M 3 α s d T
By taking the derivative of m f = ρ f ϕ on both sides and substituting into the above two equations, we obtain:
d m f ρ f = b d ε + d p M 3 α s d T
The above equation indicates that the effects of temperature and pressure on the solid will lead to changes in porosity, while the effects on the fluid will result in density changes. Both factors jointly influence the equivalent fluid density of the porous medium. Here, M is the Biot modulus, b is the Biot coefficient, and α m is the overall thermal expansion coefficient:
1 M = ϕ K f + 1 K S
b = 1 K K S
α m = ϕ α f + α s
where K f and K S are the moduli of the fluid and solid, respectively, and α f and α s are the thermal expansion coefficients of the fluid and solid, respectively. Substituting Equations (6) and (9) into the continuity equation d m f d t + X · M = 0 results in the pressure equation:
b ε t + 1 M p t 3 α m T t = k 2 p

2.1.3. The Energy Conservation Equation

Based on the second law of thermodynamics, the equation can be expressed as:
T ( d S d t + X · ( s f M ) ) = X · Q + Φ M
Substituting Fourier’s law Q = κ X T Q = κ X T into the equation yields:
T ( d S d t s f m f t ) = κ 2 T + m f s f t + Φ M
The last two terms on the right side can be neglected compared to the left side. Thus, the equation simplifies to:
T ( d S d t s f m f t ) = κ 2 T
For a linearly isotropic porous medium, the entropy change dS can be expressed as:
d S = s f d m f + 3 α K d ε 3 α m d p + C d d T T
Substituting Equation (17) into Equation (16) gives the temperature equation:
3 α T 0 K ε t 3 α m T 0 p t C d T t = κ 2 T
The coupling relation of the proposed model is shown in Figure 2.

2.2. Nonlocal Damage Model

2.2.1. Localizing Gradient Damage Theory

The localizing gradient damage model is established within a generalized micromechanics thermodynamic framework [32,33], where an equivalent strain e is defined to represent the swiftly varying deformations of micro-continua within the domain from a macroscopic viewpoint. Additionally, a scalar damage variable D is employed to characterize the degradation of isotropic materials [28,34,35]. The expression for the interaction function g is defined as [36]:
g = ( 1 R ) exp ( η D ) + R exp ( η ) 1 exp ( η )
where η is the interaction decay rate parameter and R is the residual interaction parameter. In this study, η = 5 and R = 0.05 are adopted.
From the free energy density, the following constitutive relationship can be derived:
σ = ( 1 D ) C : ε + h ( e e ˜ ) e ε
Combining Equations (3) and (20), we obtain
σ = ( 1 D ) C dr : ε + h ( e e ˜ ) e ε 3 α K θ δ
The macroscopic–microscopic interaction control equation is:
e ˜ e = · ( g l 2 e ˜ )
where e and e ˜ represent the equivalent strain at the macroscopic and microscopic scales, respectively. The length scale parameter is l. The damage evolution process is described using the most widely used exponential damage law [37]:
f ( x ) = 0 , i f κ < κ 0 1 κ 0 κ { 1 α + α exp [ β ( κ κ 0 ) ] } , O T H E R W I S E
where α and β are material parameters, κ 0 is the initial damage strain, and κ represents the historical maximum value of equivalent strain:
κ ( t ) = max { e ˜ ( τ ) | 0 τ t }
where t indicates the current loading time step.

2.2.2. Spectral Decomposition of Elastic Strain Energy Density

Geotechnical materials, as quasi-brittle materials, exhibit tensile–compressive asymmetry, characterized by a significantly higher compressive strength compared to tensile strength. The density of elastic strain energy is analyzed in a decomposed form as follows:
Ψ e ± = 1 2 λ t r ( ε e ± ) 2 + μ t r ( ε e ± 2 )
where λ and μ are the Lame constants, denotes the Macaulay bracket, ε e is elastic strain, which equals total strain minus thermal strain ε e = ε ε th , and ε ± = i = 1 n ε i ± n i n i represents the positive and negative components of the strain tensor. Here, ε i and n i refer to the magnitudes and directions of the principal strains, respectively. Ψ e + and Ψ e represent the tensile and compressive components of the elastic strain energy density, respectively.
For quasi-brittle materials such as geotechnical materials, to consider the asymmetry of tensile and compressive force, we use the equivalent strain to be expressed using the regularized tensile component of the elastic strain energy density:
e = 1 E λ t r ( ε e + ) 2 + μ t r ( ε e + 2 )

2.2.3. Finite Element Solution Algorithm

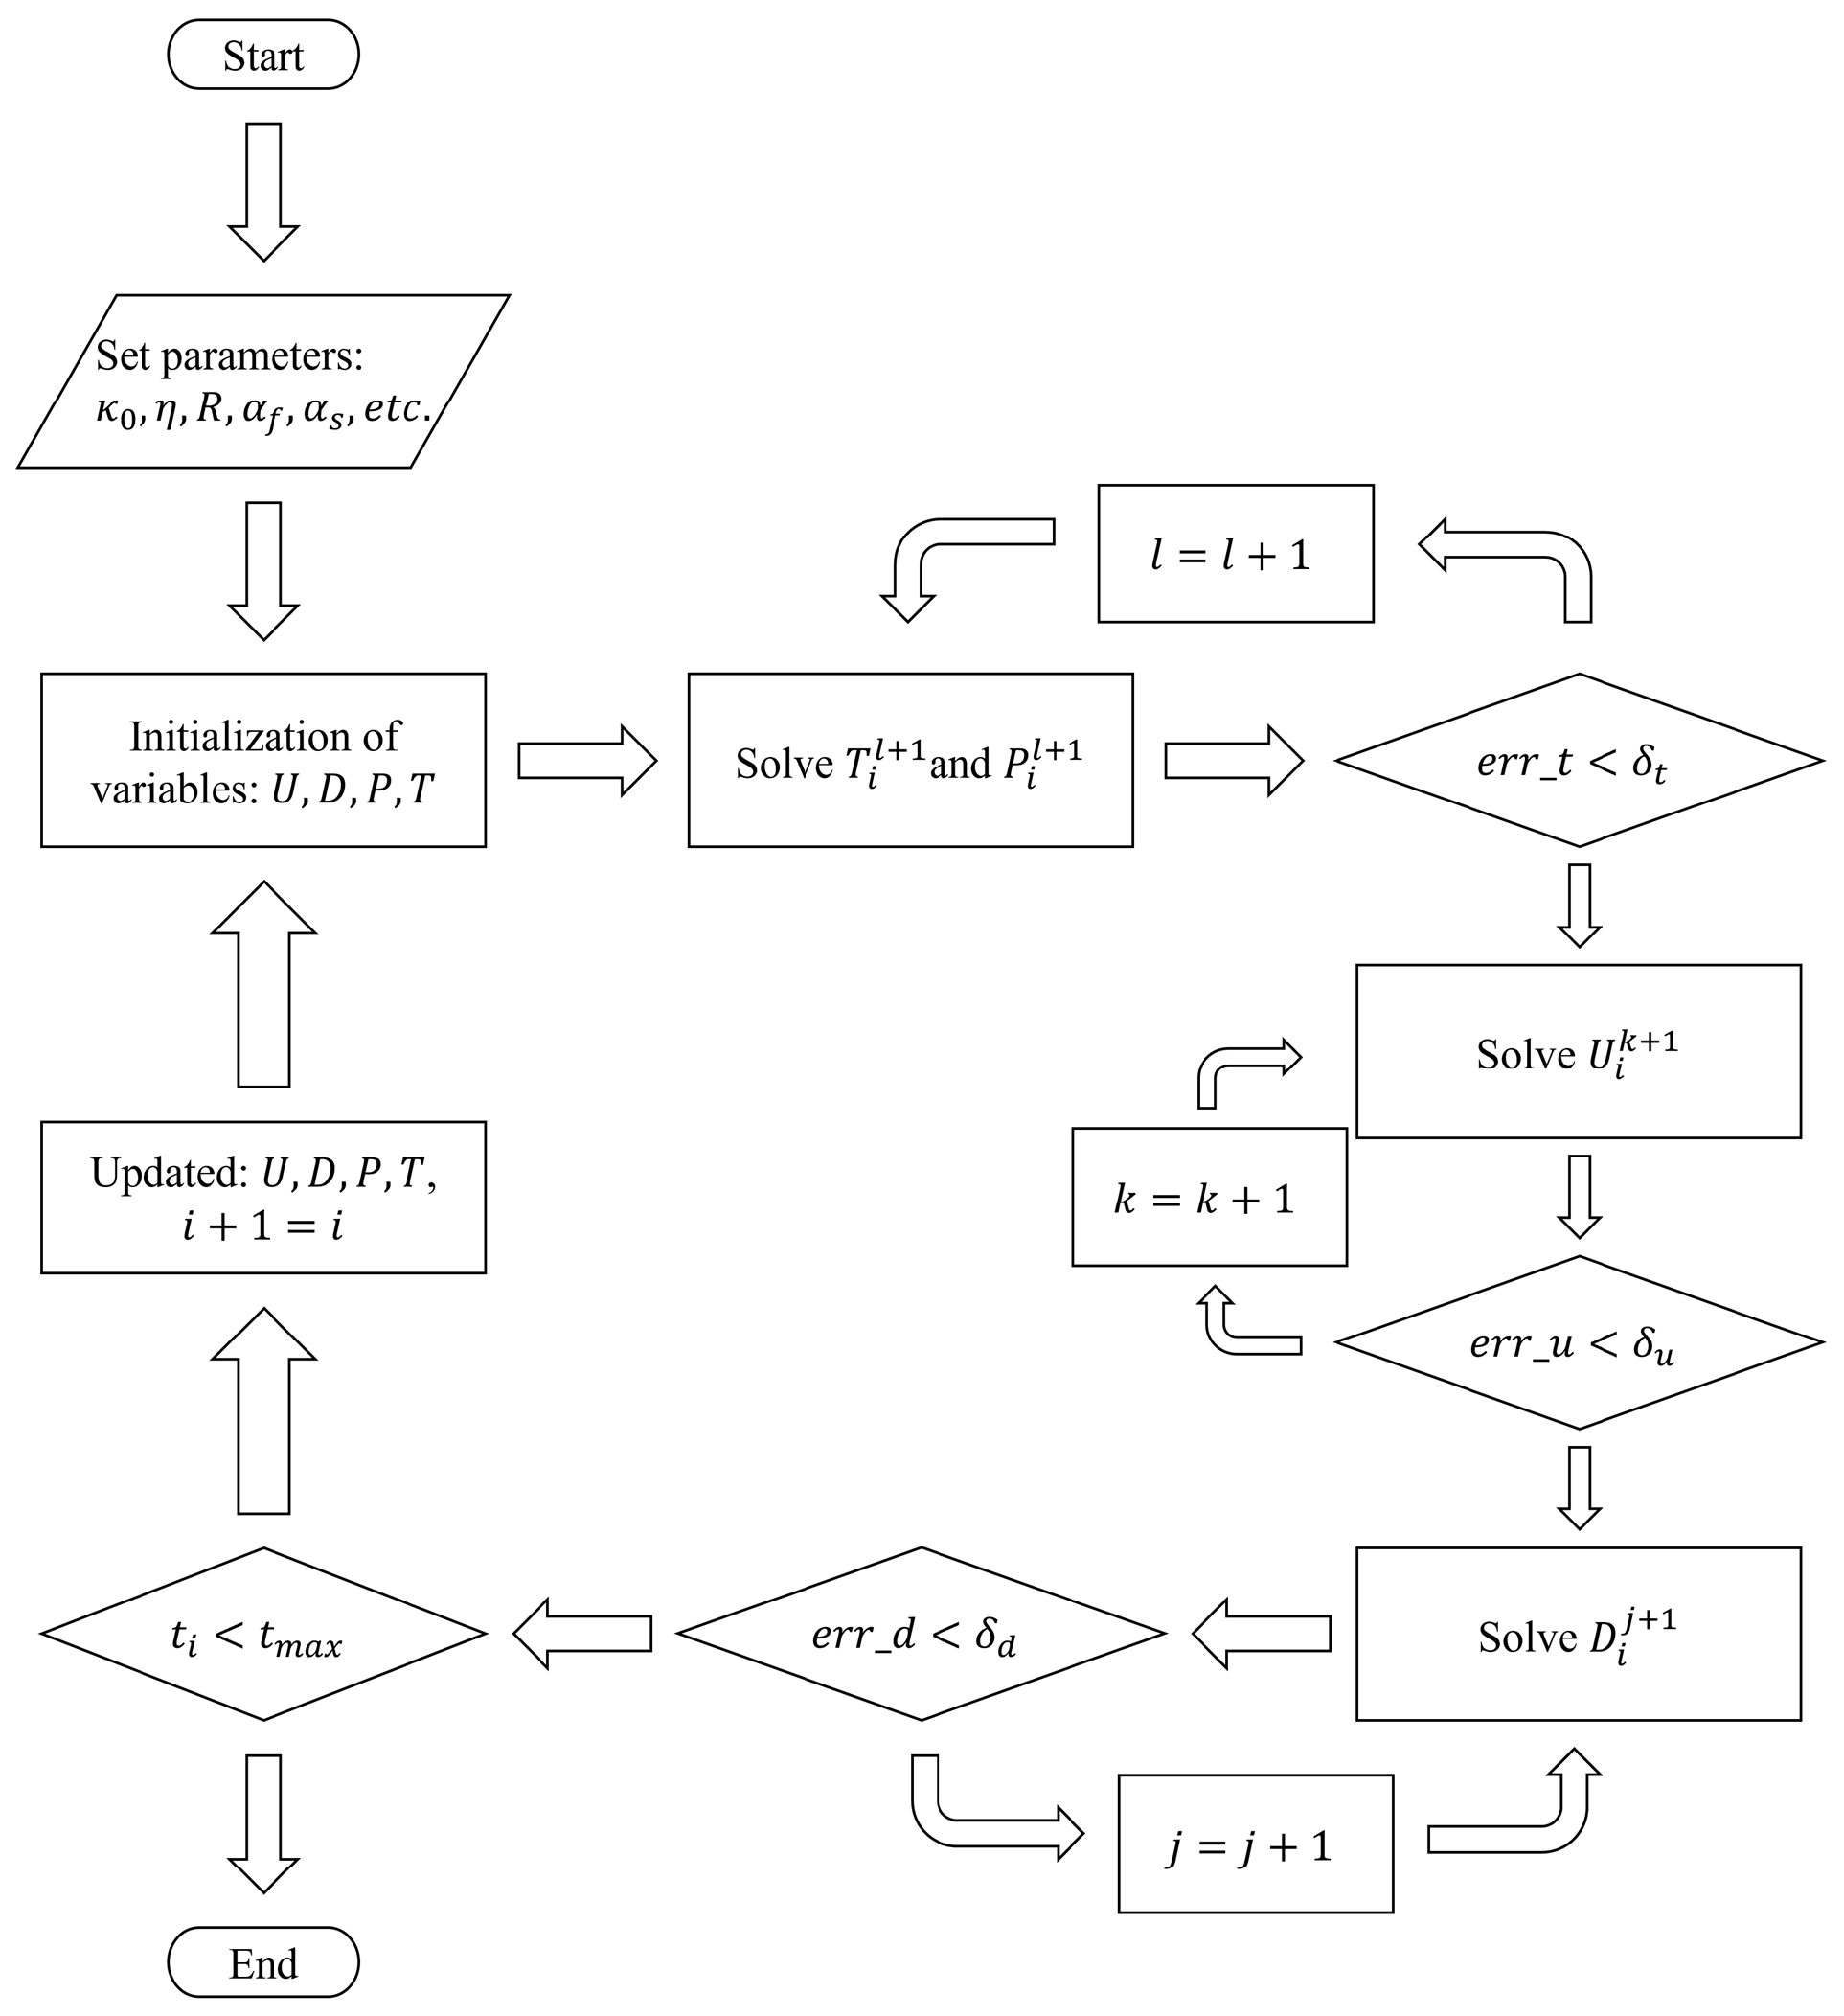
The finite element method is used to solve the established THMD model. To improve convergence, a segregated iterative scheme is utilized. Algorithm 1 presents the solution process of the segregated scheme for the in situ conversion process of the THMD model, where a second-order backward differentiation formula (BDF) and automatic time stepping are utilized. Figure 3 provides a flowchart illustrating the algorithm’s structure, offering a visual representation of the iterative solution process. We implemented the above algorithms in COMSOL.
Algorithm 1 The algorithm for TM coupling
Require: 
Damage threshold κ 0 , the interaction decay rate η , the residual interaction parameter R, the thermal expansion coefficients of the fluid and solid α f and α s , etc.
Ensure: 
U, D, P, T correspond to displacement, damage variable, pressure, and temperature.
1:
/* Initialization U i = 0 j = 0 , D i = 0 j = 0 , P i = 0 j = 0 , T i = 0 j = 0 */
2:
while  t i < t m a x   do
3:
    /* Minimization algorithm */
4:
    while  e r r _ d δ d and j m a x _ i t e r  do
5:
        /* Solve Newton–Raphson segregated step */
6:
        while  e r r _ u δ u and k m a x _ i t e r  do
7:
           /* Solve Newton–Raphson segregated step */
8:
           while  e r r _ t δ t and l m a x _ i t e r  do
9:
               /* Solve Newton–Raphson segregated step */
10:
                T i l + 1 = S t e p _ T ( U i l , D i l , P i l , T i l )
11:
                P i l + 1 = S t e p _ P ( U i l , D i l , P i l , T i l + 1 )
12:
                e r r _ t G e t _ e r r _ t ( U i l , D i l , P i l + 1 , T i l + 1 , U i l , D i l + 1 , P i l , T i l + 1 )
13:
                l : = l + 1
14:
           end while
15:
            T i k + 1 T i l + 1 , P i k + 1 P i l + 1
16:
            U i k + 1 = S t e p _ T ( U i k , D i k , P i k + 1 , T i k + 1 )
17:
            e r r _ u G e t _ e r r _ u ( U i k + 1 , D i k , P i k + 1 , T i k + 1 , U i k , D i k + 1 , P i k , T i k + 1 )
18:
            k = k + 1
19:
        end while
20:
         U i j + 1 U i k + 1 , T i j + 1 T i k + 1 , P i j + 1 P i k + 1 ,
21:
         D i j + 1 = S t e p _ T ( U i j + 1 , D i j , P i j + 1 , T i j + 1 )
22:
         e r r _ d G e t _ e r r _ d ( U i j + 1 , D i j + 1 , P i j + 1 , T i j + 1 , U i j , D i j + 1 , P i j , T i j + 1 )
23:
         j = j + 1
24:
    end while
25:
    SaveAllFields( t i );
26:
     i : = i + 1
27:
end while
28:
return Outputs

3. Validation

3.1. THM Coupled Model Validation

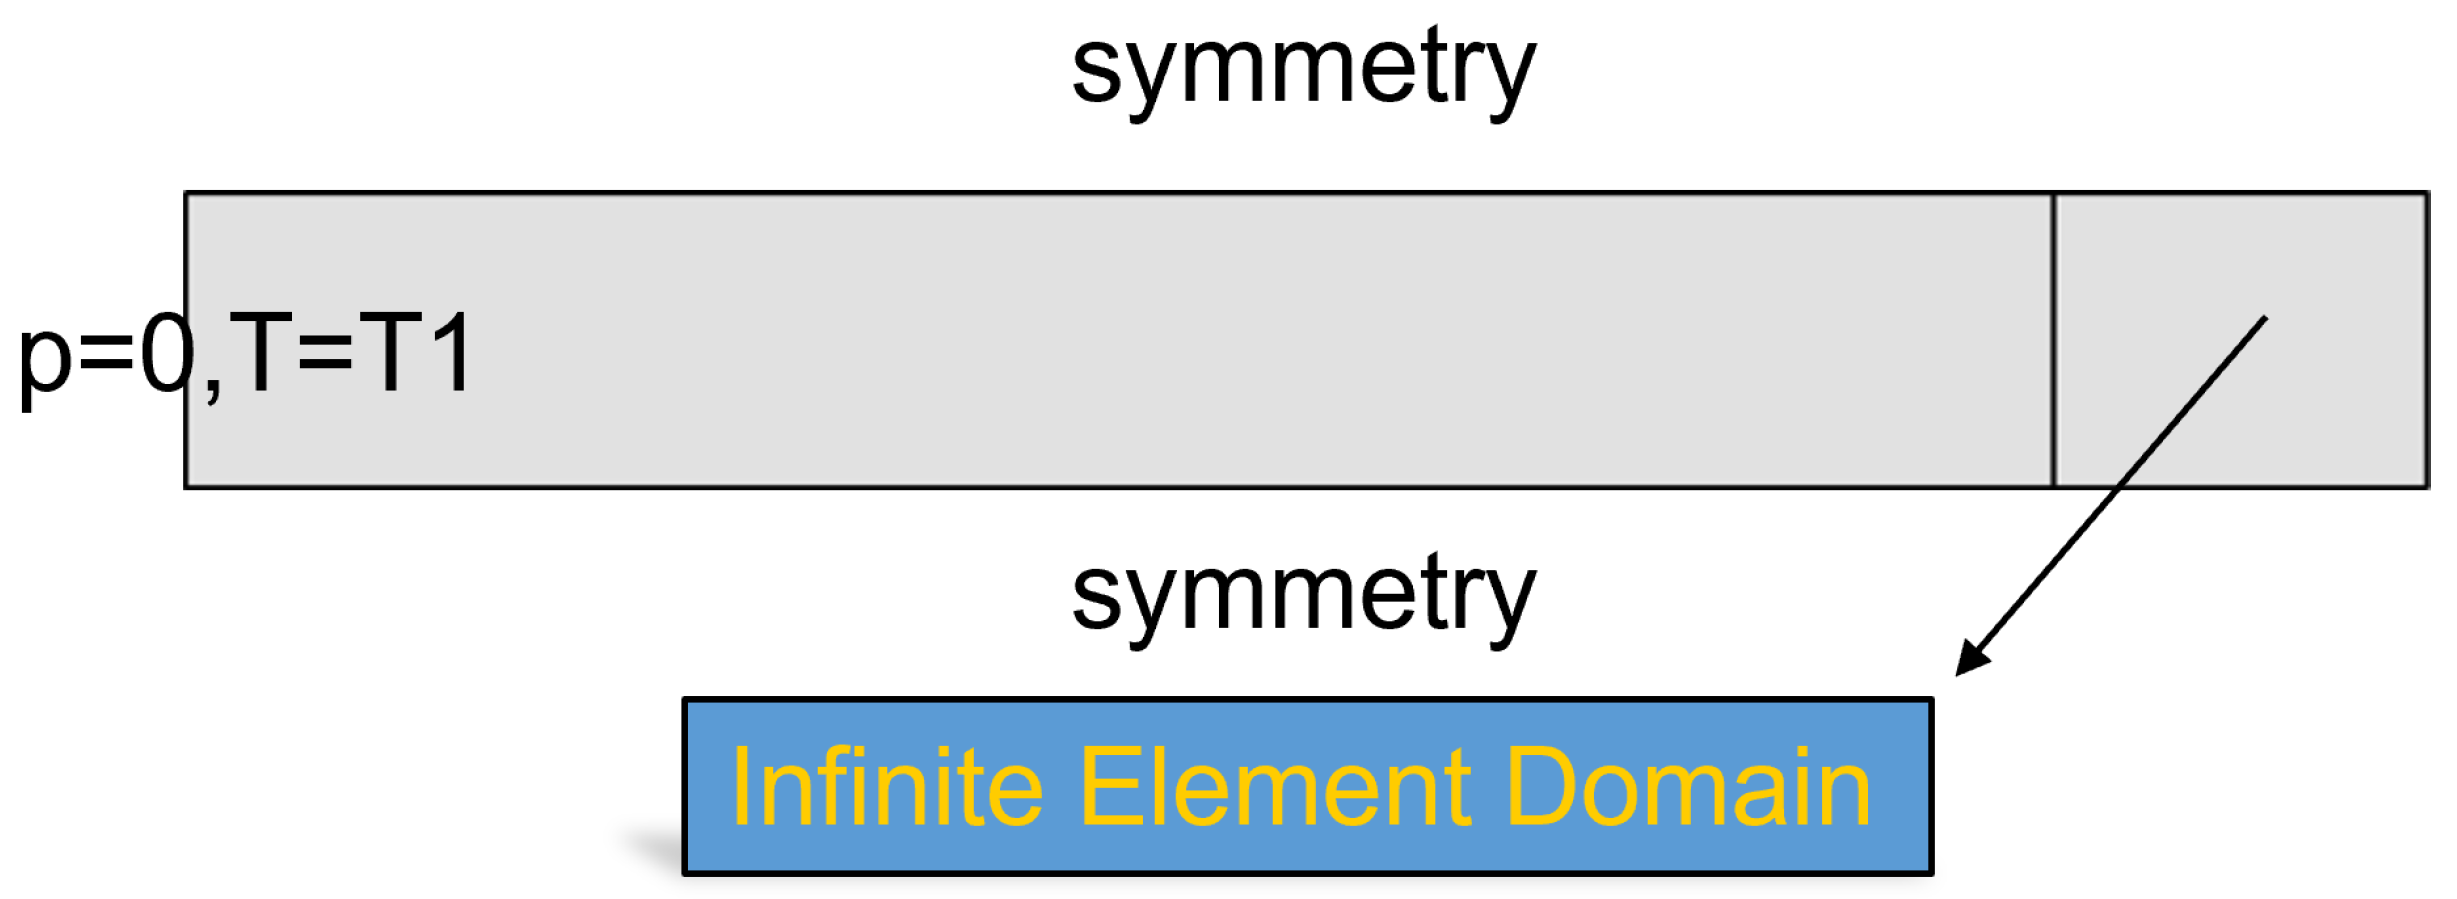
To validate the reliability of the thermo-hydro-mechanical coupled numerical model, a comparison between the simulation results and the analytical solution for Mandel’s problem is presented in this section. In Mandel’s problem, as shown in Figure 4, a prescribed temperature T 1 is suddenly applied on the top boundary of the semi-infinite domain at t = 0 , and the bottom is set as the infinite boundary condition, which involves mapping a finite region during modeling to a much larger area to meet the infinite boundary condition requirements. The top, left, and right sides of the semi-infinite domain remain drained and free of normal stress. The initial and boundary conditions for this problem are expressed as:
T = 0 , σ x x = p = 0 for t = 0 T = T 1 , σ x x = p = 0 for x = 0
The analytical solutions for dimensionless temperature T ¯ and pressure p ¯ obtained from Coussy’s work are as follows:
T ¯ = 1 erf x 2 c θ t p ¯ = 1 c f c θ 1 erf x 2 c f t erf x 2 c θ t
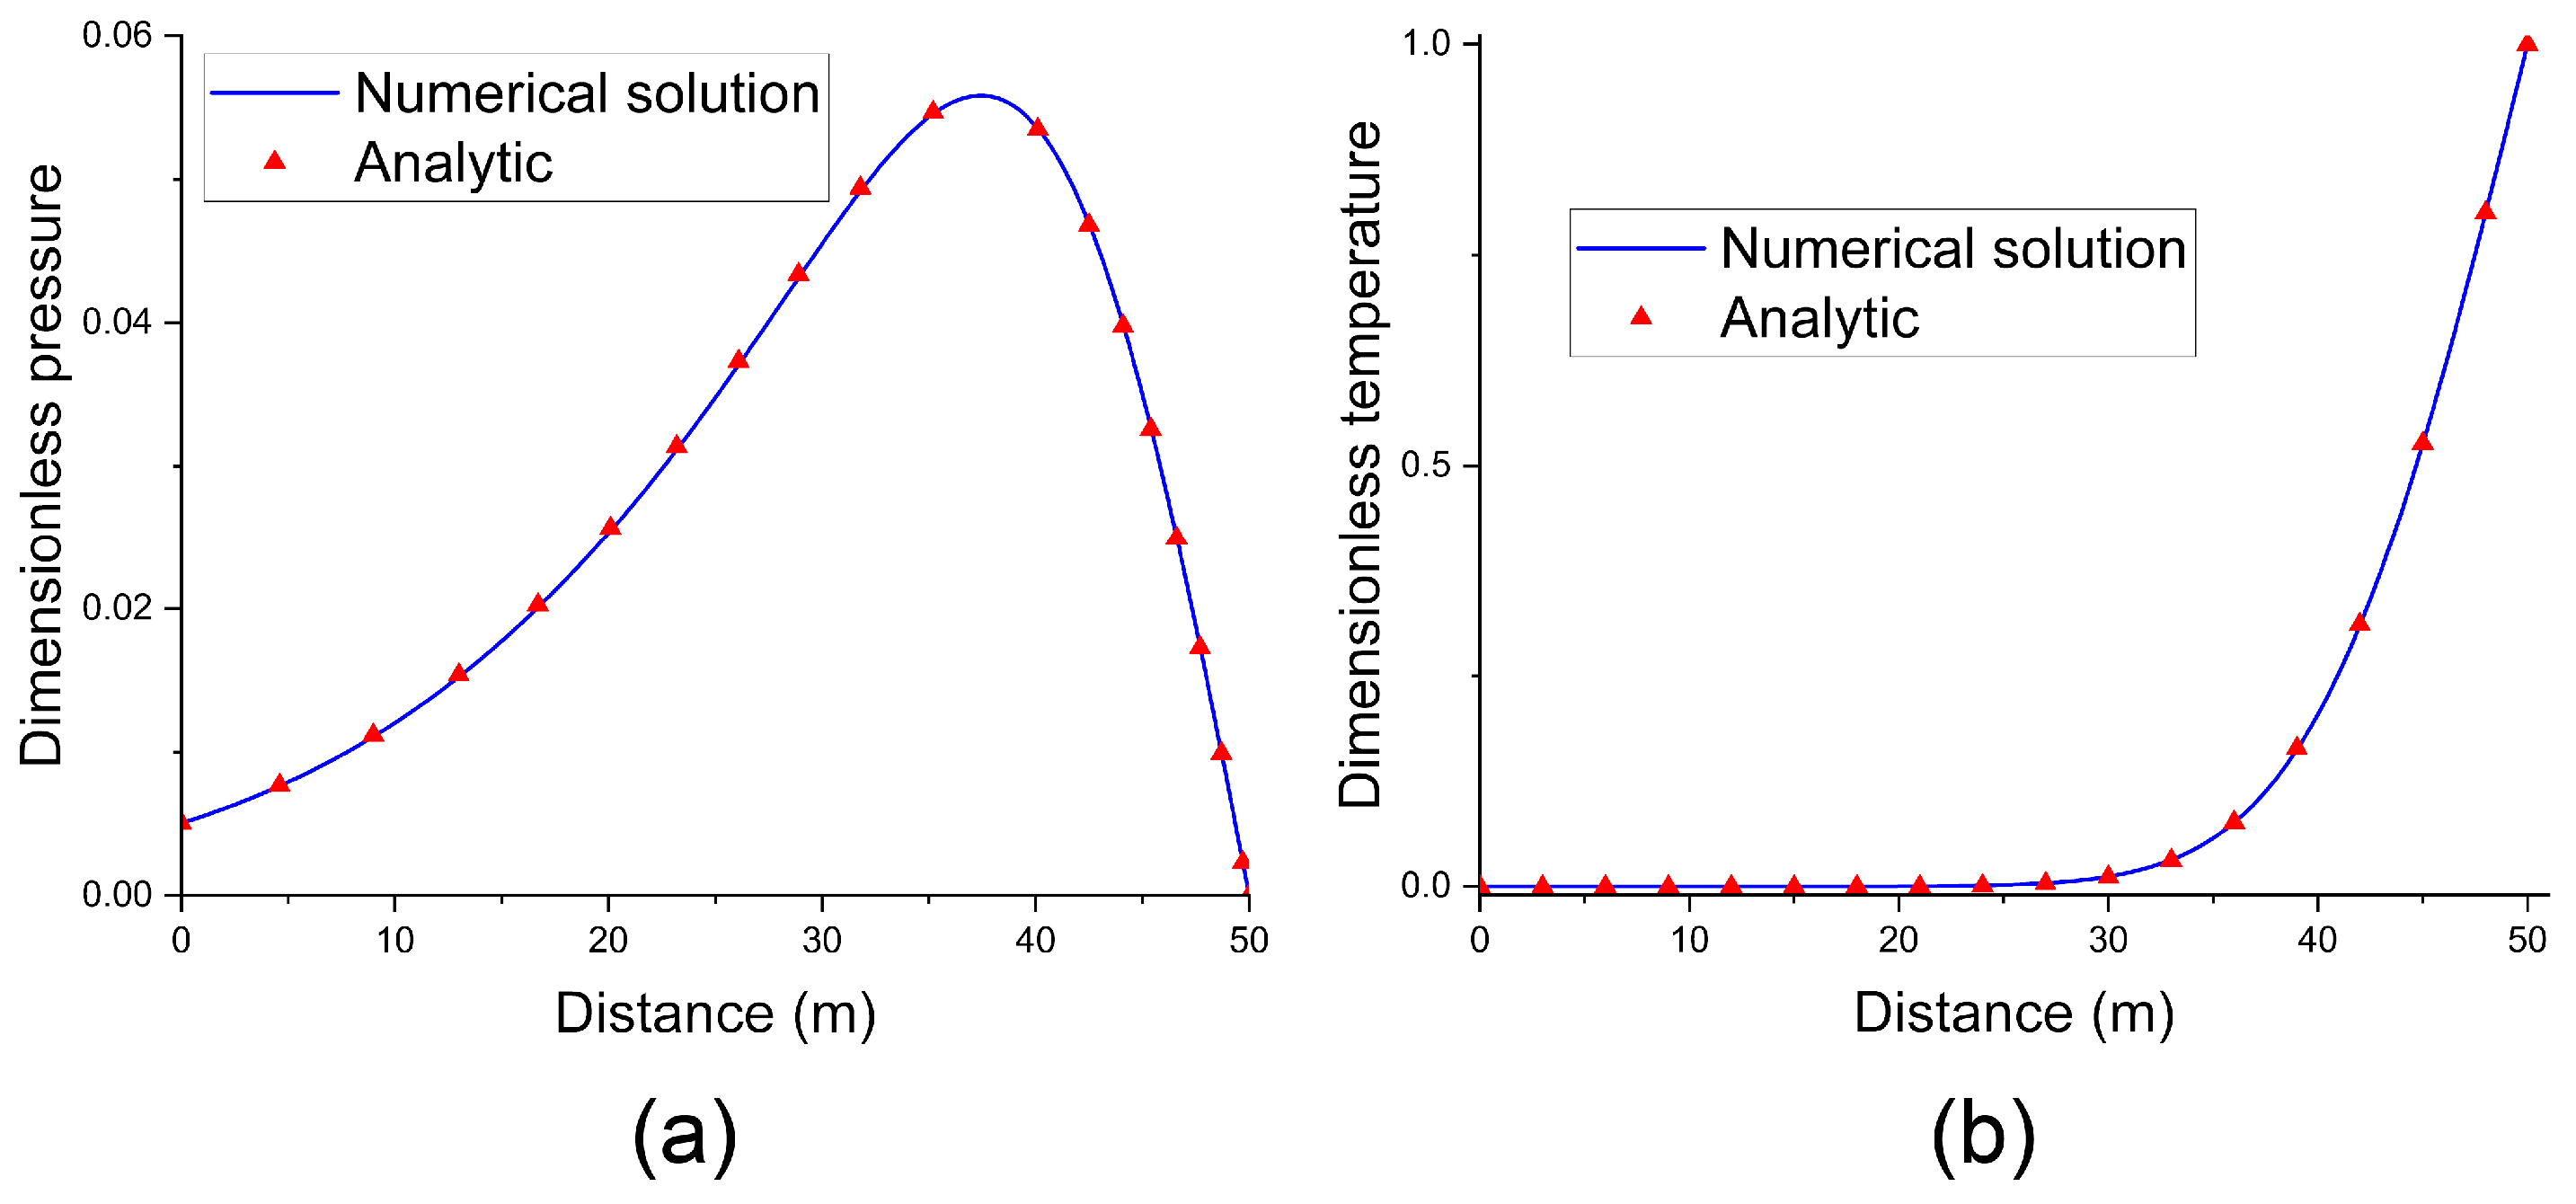
The numerical results of T ¯ and p ¯ show good consistency with the analytical solution as shown in Figure 5a,b, which illustrates the high accuracy of the established model for thermo-hydro-mechanical coupled problems.

3.2. Thermal-Induced Damage Validation

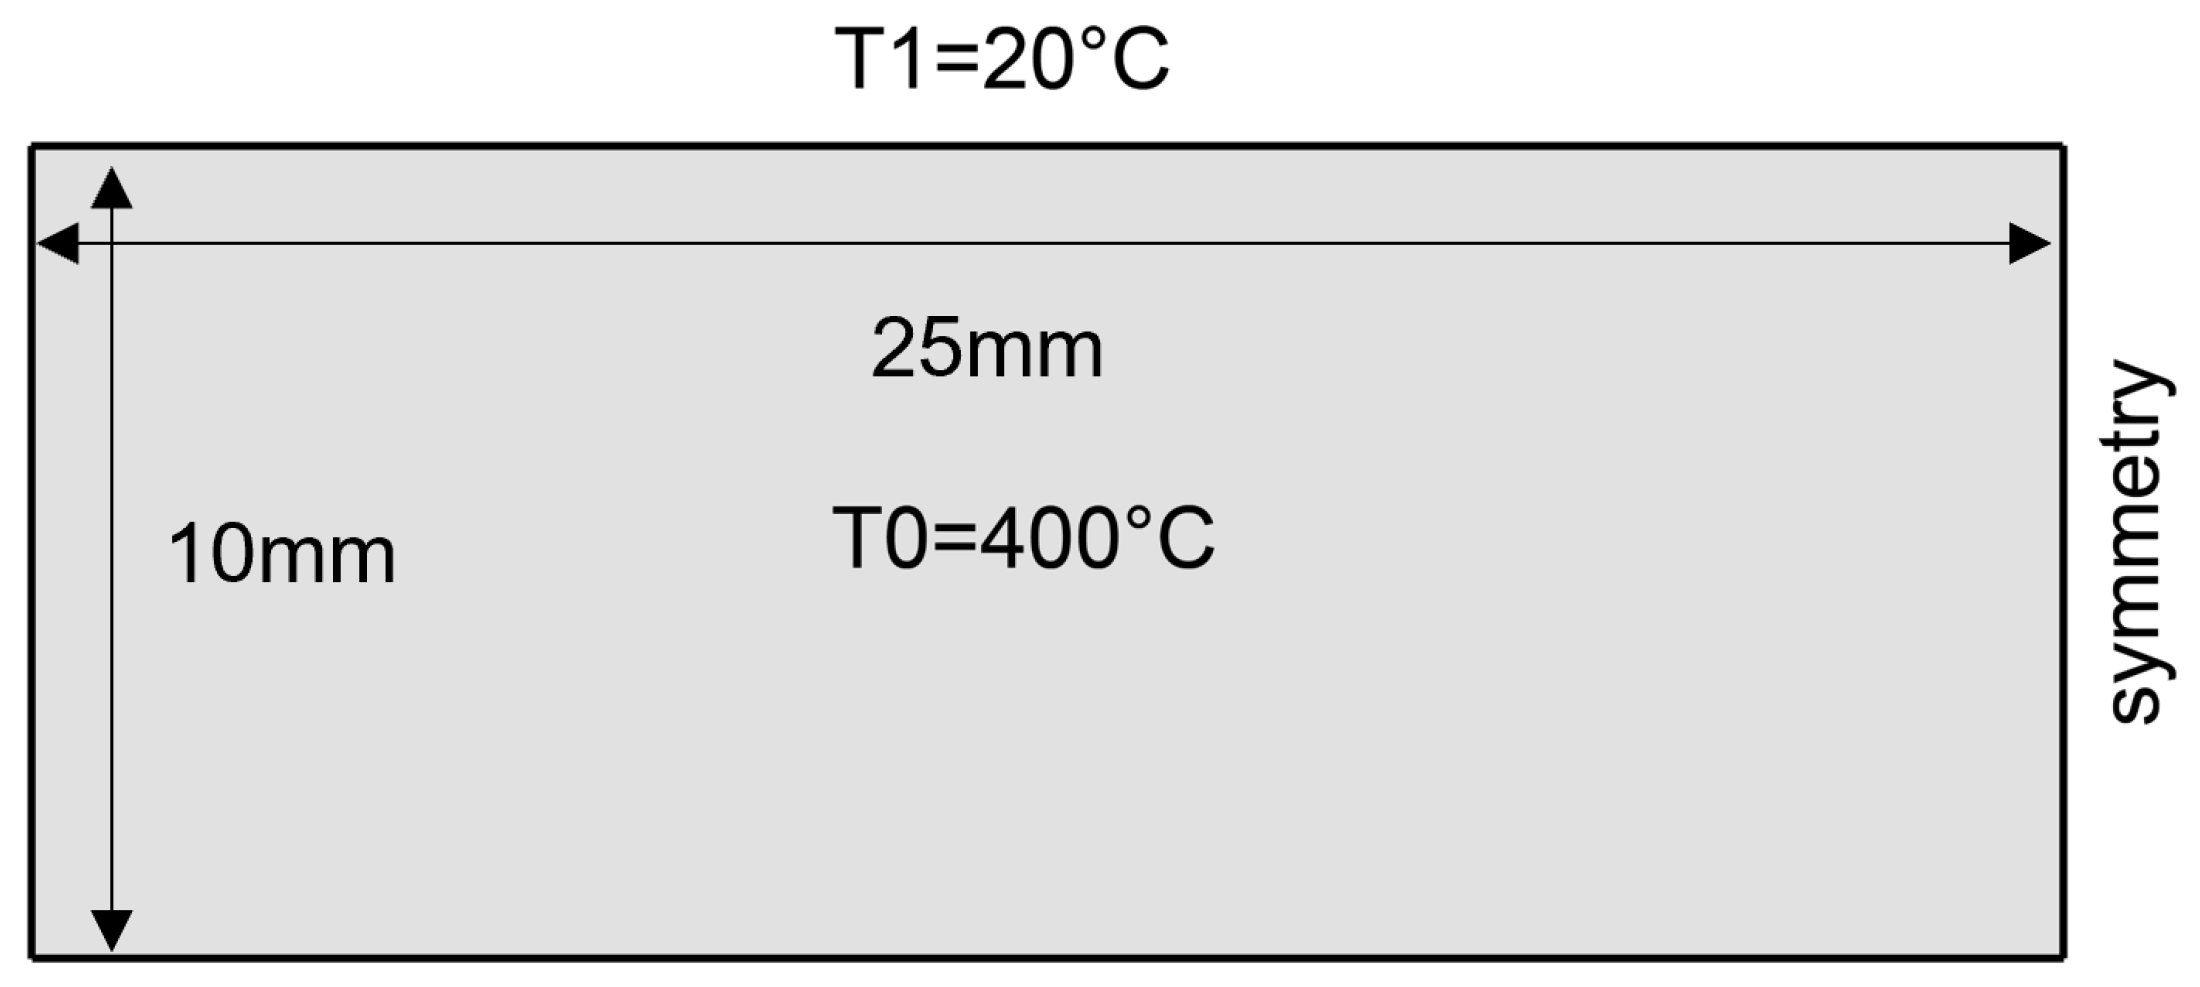
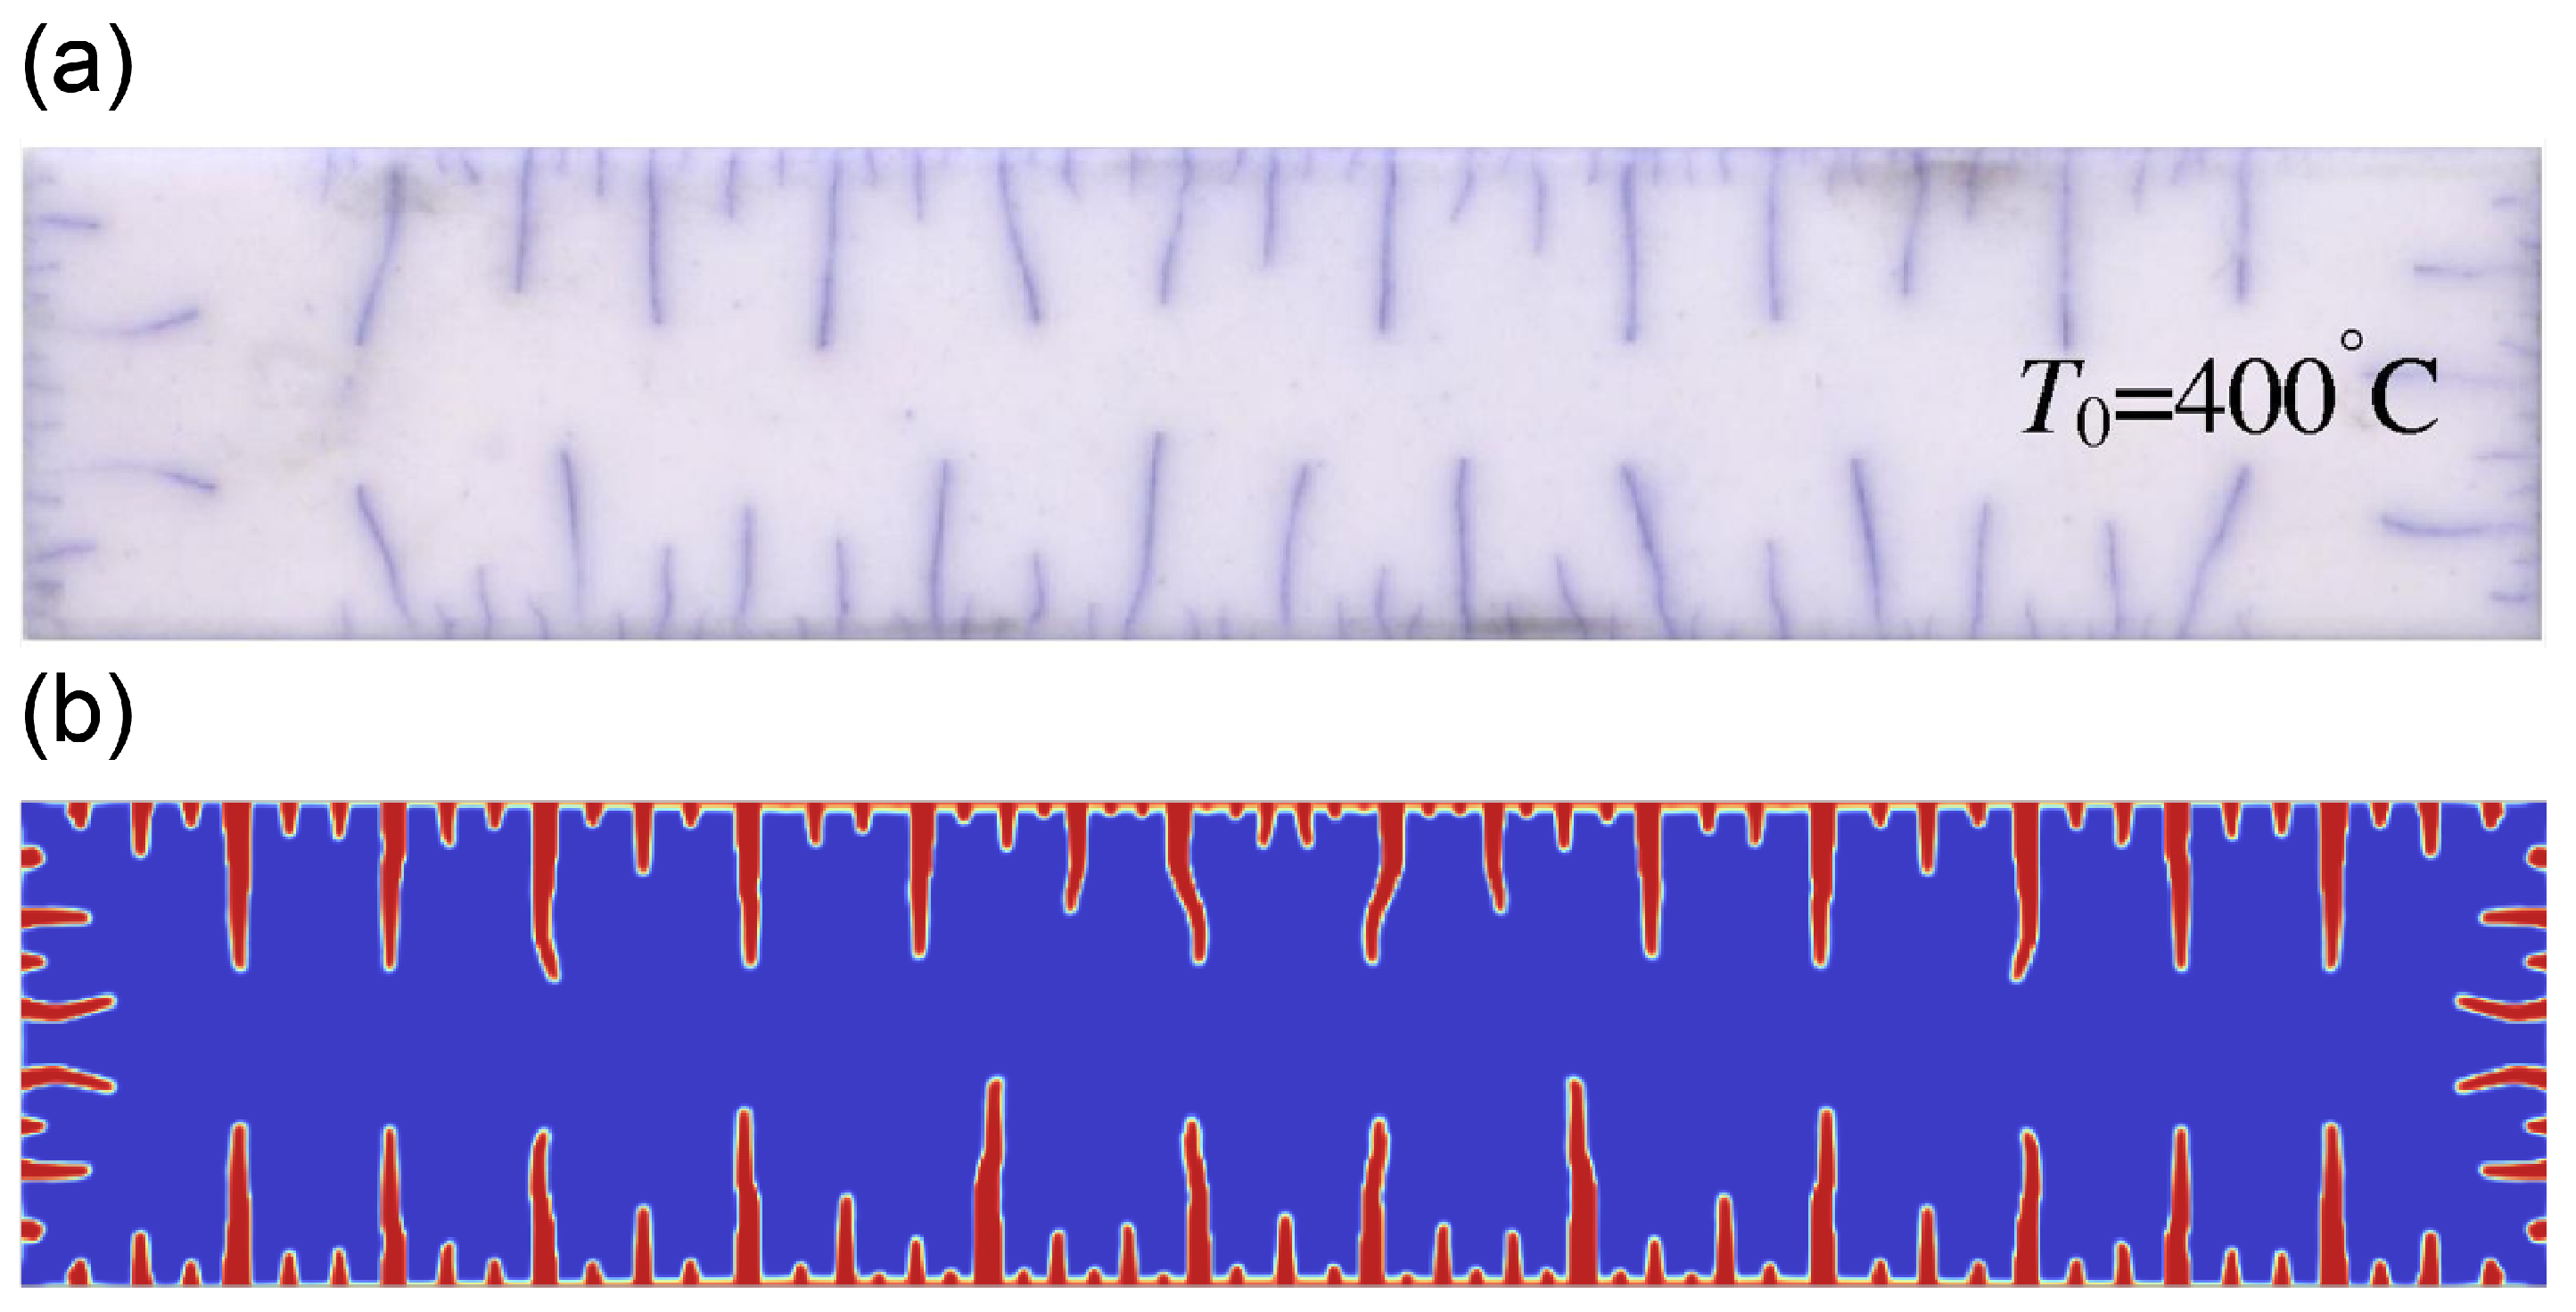
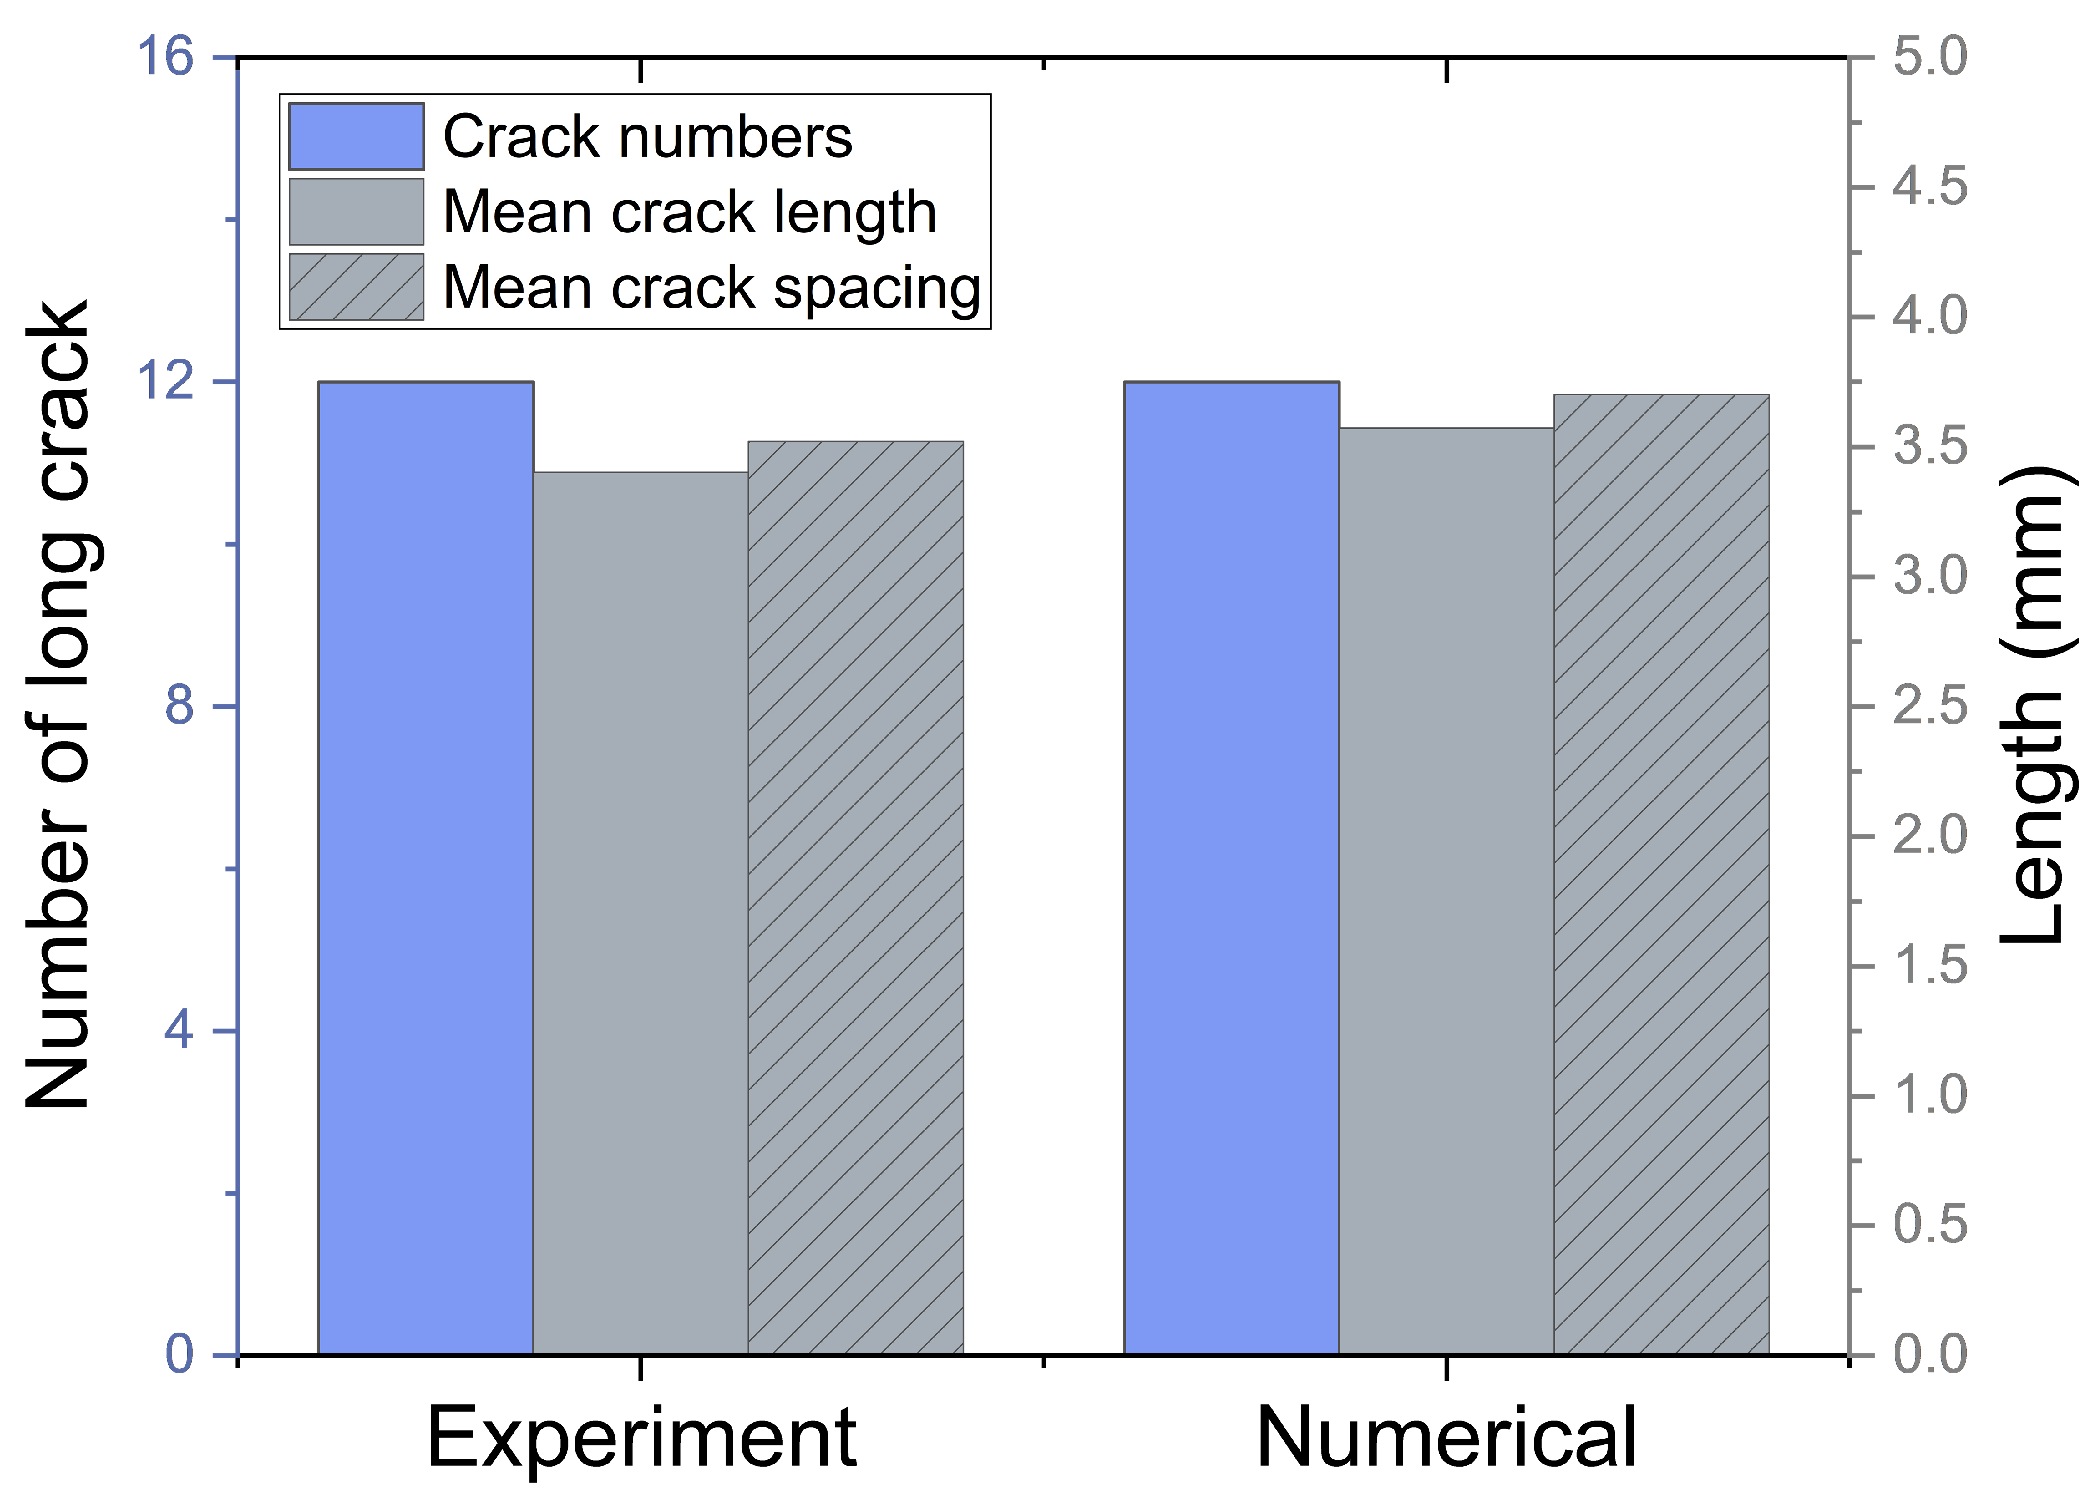
This section validates the model in accurately predicting the generation and evolution of thermal damage by comparing the numerical and experimental results of a quenching test of ceramic plates. In Jiang et al.’s experiment [38], ceramic plates with dimensions of 50 mm × 10 mm × 1 mm are heated to high temperatures ranging from 300 °C to 600 °C and quickly placed into water at 20 °C. After the cooling process, the plate is dried and dyed with ink to display the crack morphology. Considering the symmetry of the model, only half of the specimen is modeled, as shown in Figure 6. The size of the half model is 25 mm × 10 mm. The initial temperature is set as T 0 = 400   ° C , and a prescribed temperature T 1 = 20   ° C is applied on the top edge. Other parameters used in this simulation are summarized in Table 1. Figure 7 shows the crack morphology of numerical and experimental results after cooling down from T 0 = 400   ° C . Overall, the crack growth on the boundaries exhibits uneven distribution and is inhibited at the corners. Long cracks that emerge along the longitudinal edges show almost equal spacing, and the long cracks are mainly distributed in the middle of the lateral edges, resulting from the cooling after high-temperature heating. As shown in Figure 7, the crack morphology obtained from the numerical simulation shows amazing similarity with the results observed in the experiment, which indicates the validity of the model in predicting thermal-induced damage evolution. Additionally, Figure 8 provides a bar chart comparing key parameters—crack numbers, crack length, and crack spacing—between the experimental and numerical simulation results, further reinforcing the model’s reliability in capturing detailed damage characteristics.

4. Results and Discussion

4.1. Analysis of Thermal Damage Around a Single Heating Well

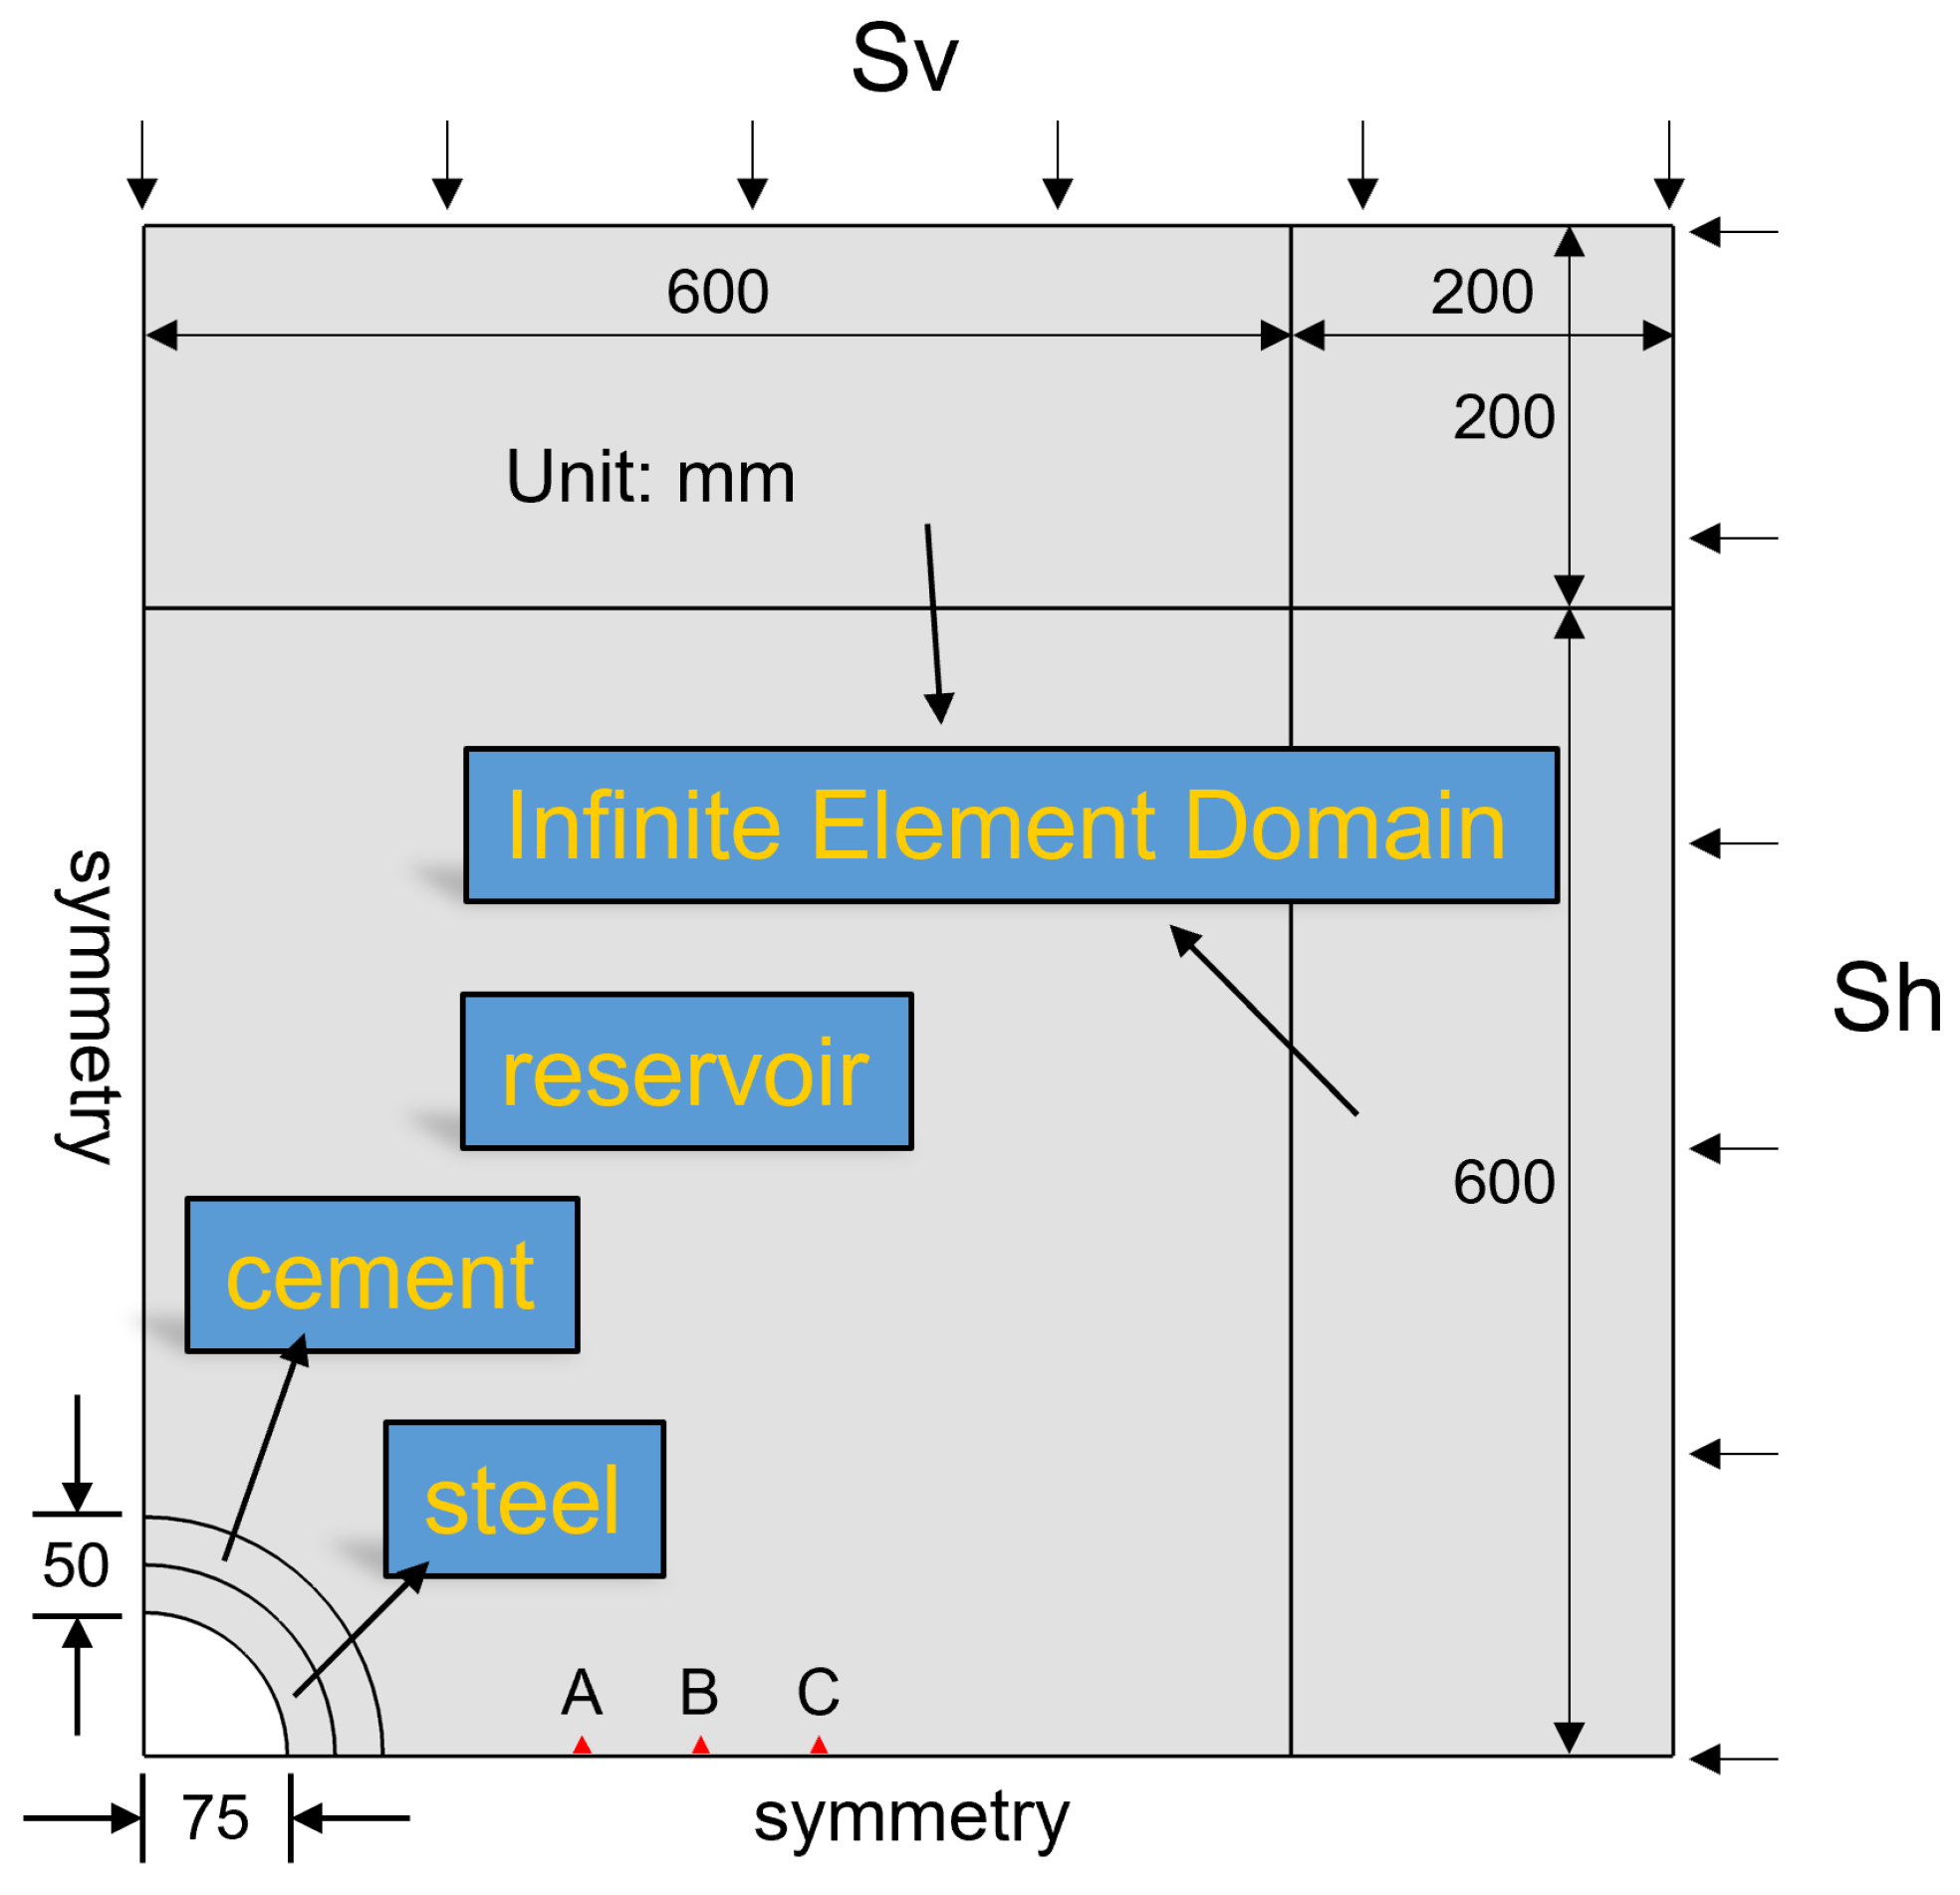
This section studies the influence of long-term thermal loading on the stability of the wellbore during the in situ conversion process. Due to symmetry, only one-fourth of the model is simulated when analyzing the heating process of a single well, as shown in Figure 9. The structure in Figure 9 consists of, from the inside out, a steel casing with an inner diameter of 150 mm and a thickness of 50 mm, followed by a cement sheath with a thickness of 50 mm, and then the oil shale reservoir. The outer layer is set to an infinite element domain to simulate the infinite boundary conditions. The model takes into account the influence of the initial reservoir pressure, with S h representing the horizontal in situ stress and S v representing the vertical in situ stress. Other parameters of the model are listed in Table 2.

4.1.1. The Influence of In Situ Stress on Damage

For reservoirs in different locations, in situ stresses may vary greatly, so it is important to analyze the influence of different in situ stresses on damage. In this section, the effects of the difference and magnitude of horizontal and vertical in situ stresses on thermal damage patterns are analyzed. It takes 3600 s for the temperature of the inner surface of the wellbore to rise from the initial to the final value. As shown in Figure 10, the horizontally arranged panels illustrate the influence of differences between horizontal and vertical in situ stresses on damage morphology while maintaining a constant vertical in situ stress. The vertically arranged panels demonstrate the impact of in situ stress magnitude on damage morphology while keeping the stress difference constant. S h is the horizontal in situ stress and S v is the vertical in situ stress. In this paper, two parameters, ξ and η , are used to characterize the effect of in situ stress on damage morphology. ξ is defined as:
ξ = t a n 1 ( M A X [ i f ( D > 0.5 , y , 0 ) ] M A X [ i f ( D > 0.5 , x , 0 ) ] )
It represents the orientation of damage evolution. The smaller the value of ξ , the more the damage tends to develop in the horizontal direction. η is defined as:
η = Ω i f ( D > 0.8 , 1 , 0 ) d S Ω i f ( D > 0.2 , 1 , 0 ) d S
It represents the ratio of the area with damage greater than 0.8 to the area with damage greater than 0.2.
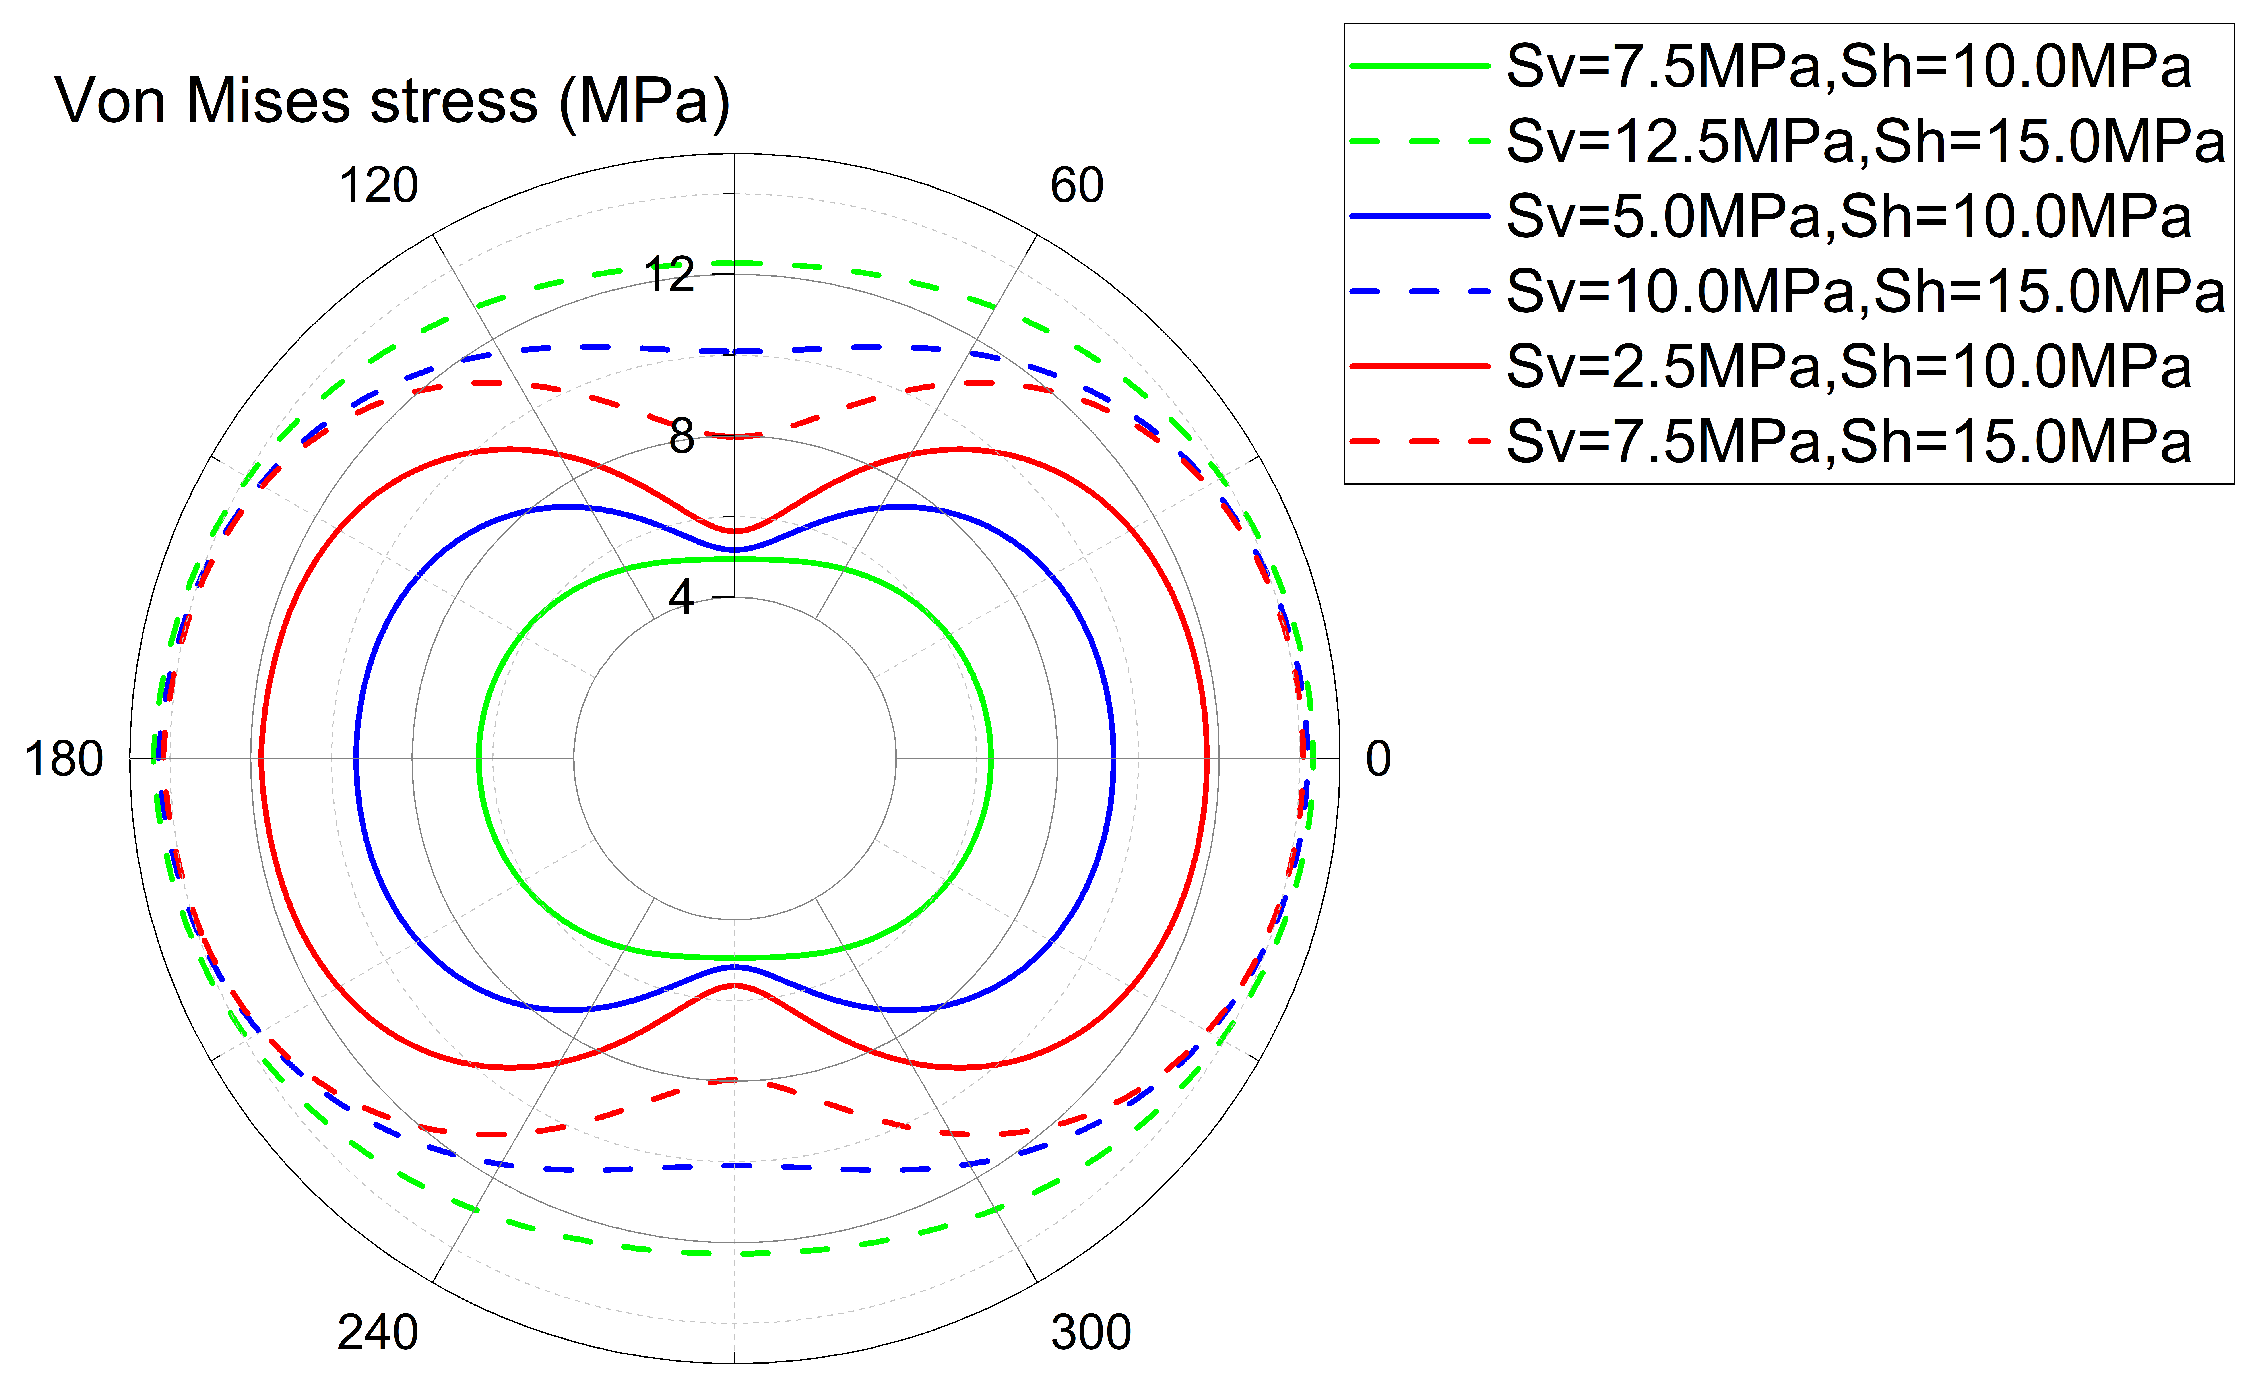
It can be seen in Figure 10 that as the difference between the horizontal and vertical in situ stress increases, the value of ξ decreases, indicating that thermal damage tends to develop in the horizontal direction. When the in situ stress difference is the same, a higher in situ stress value corresponds to a greater degree of damage. As illustrated in Figure 11, an increase in the difference in stress results in a larger initial stress difference near the wellbore between the horizontal and vertical directions. Since shear failure is primarily caused by compressive stress, damage tends to propagate more horizontally. Higher in situ stress values lead to increased initial stresses in both directions, resulting in a more significant degree of damage and a more pronounced orientation.

4.1.2. The Impact of Temperature on Damage

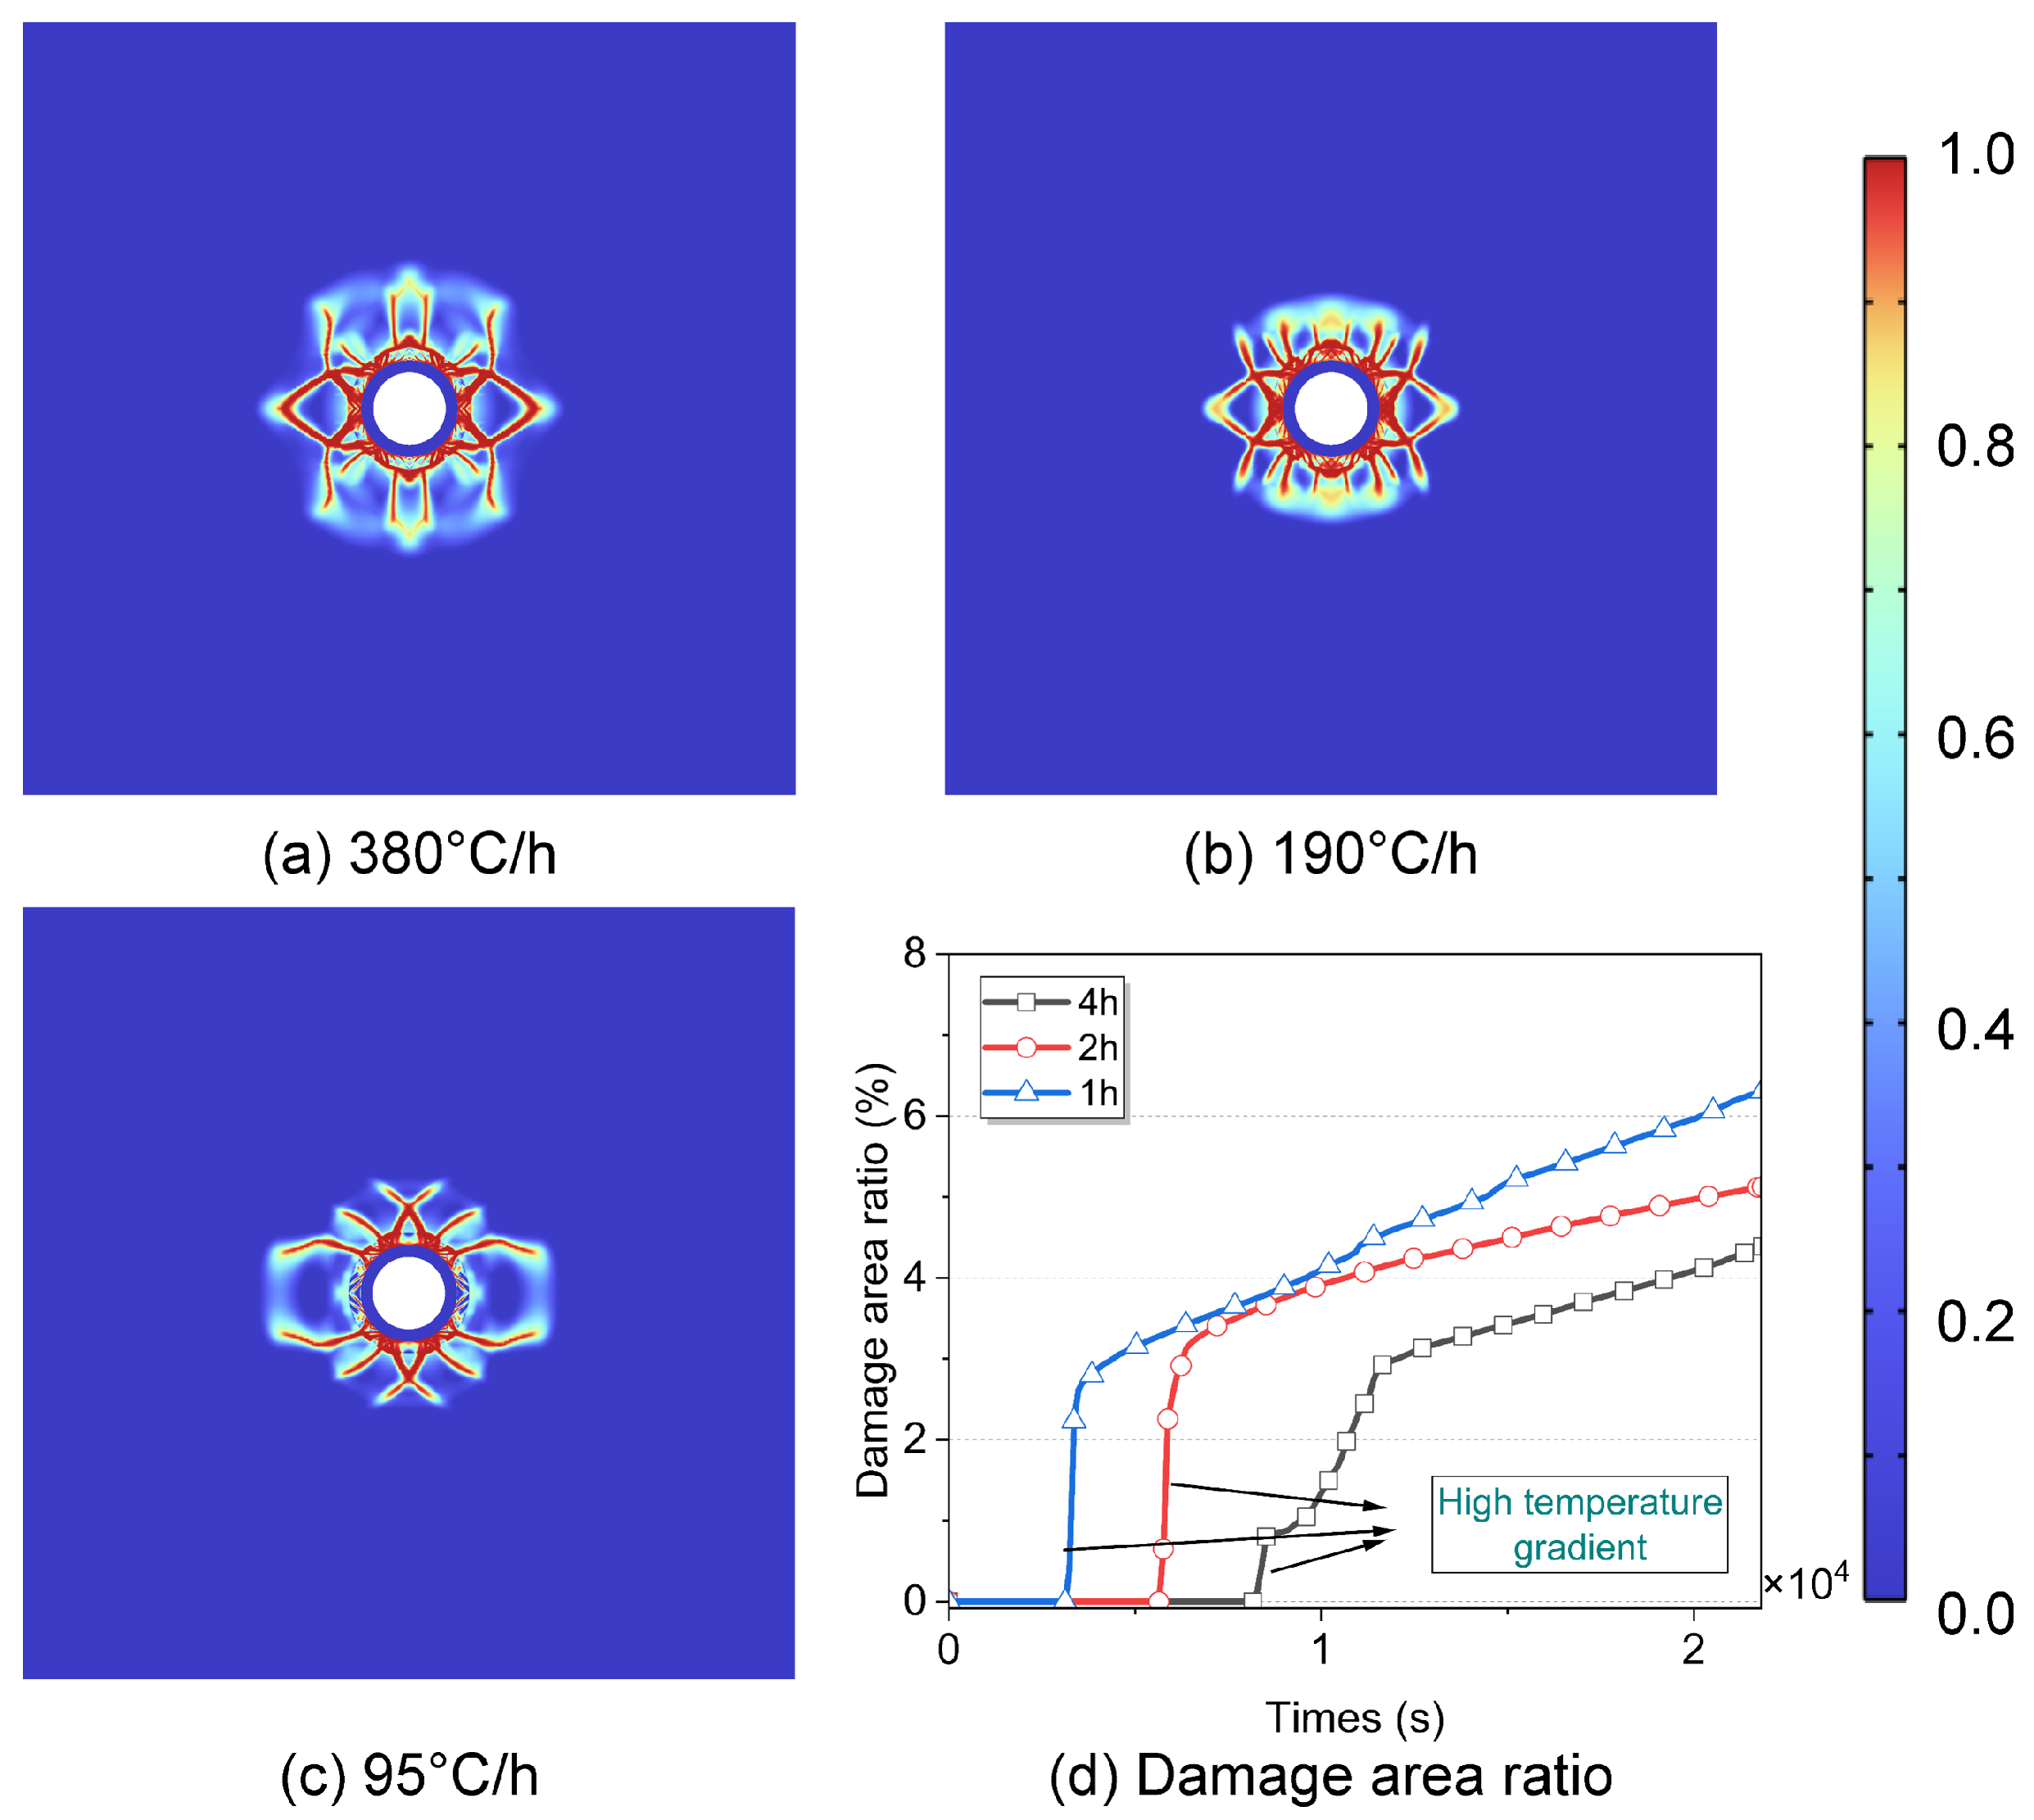
In this section, the damage evolution under different heating rates is studied. The heating rate refers to how quickly the temperature of the inner surface of the wellbore reaches the target heating temperature. Due to the existence of the casing and cement sheath, the temperature of the reservoir will lag significantly, and the final temperature of the reservoir will be much lower than that of the inner surface. The temperature in Figure 12 rises from 20   ° C to 400   ° C after 1 h, 2 h, and 4 h, respectively. The damage area ratio (DAR) is adopted here to assess the severity of damage, defined as the area where the damage parameter exceeds 0.2 relative to the total simulated area:
D A R = Ω i f ( D > 0.2 , 1 , 0 ) d S Ω d S
It can be seen in Figure 12d that the DAR presents a stepped profile under different heating rates, indicating a large temperature gradient in the reservoir. After the stepped section, the evolution of the damage region becomes gradually stable, where the higher heating rate results in a larger damage area.
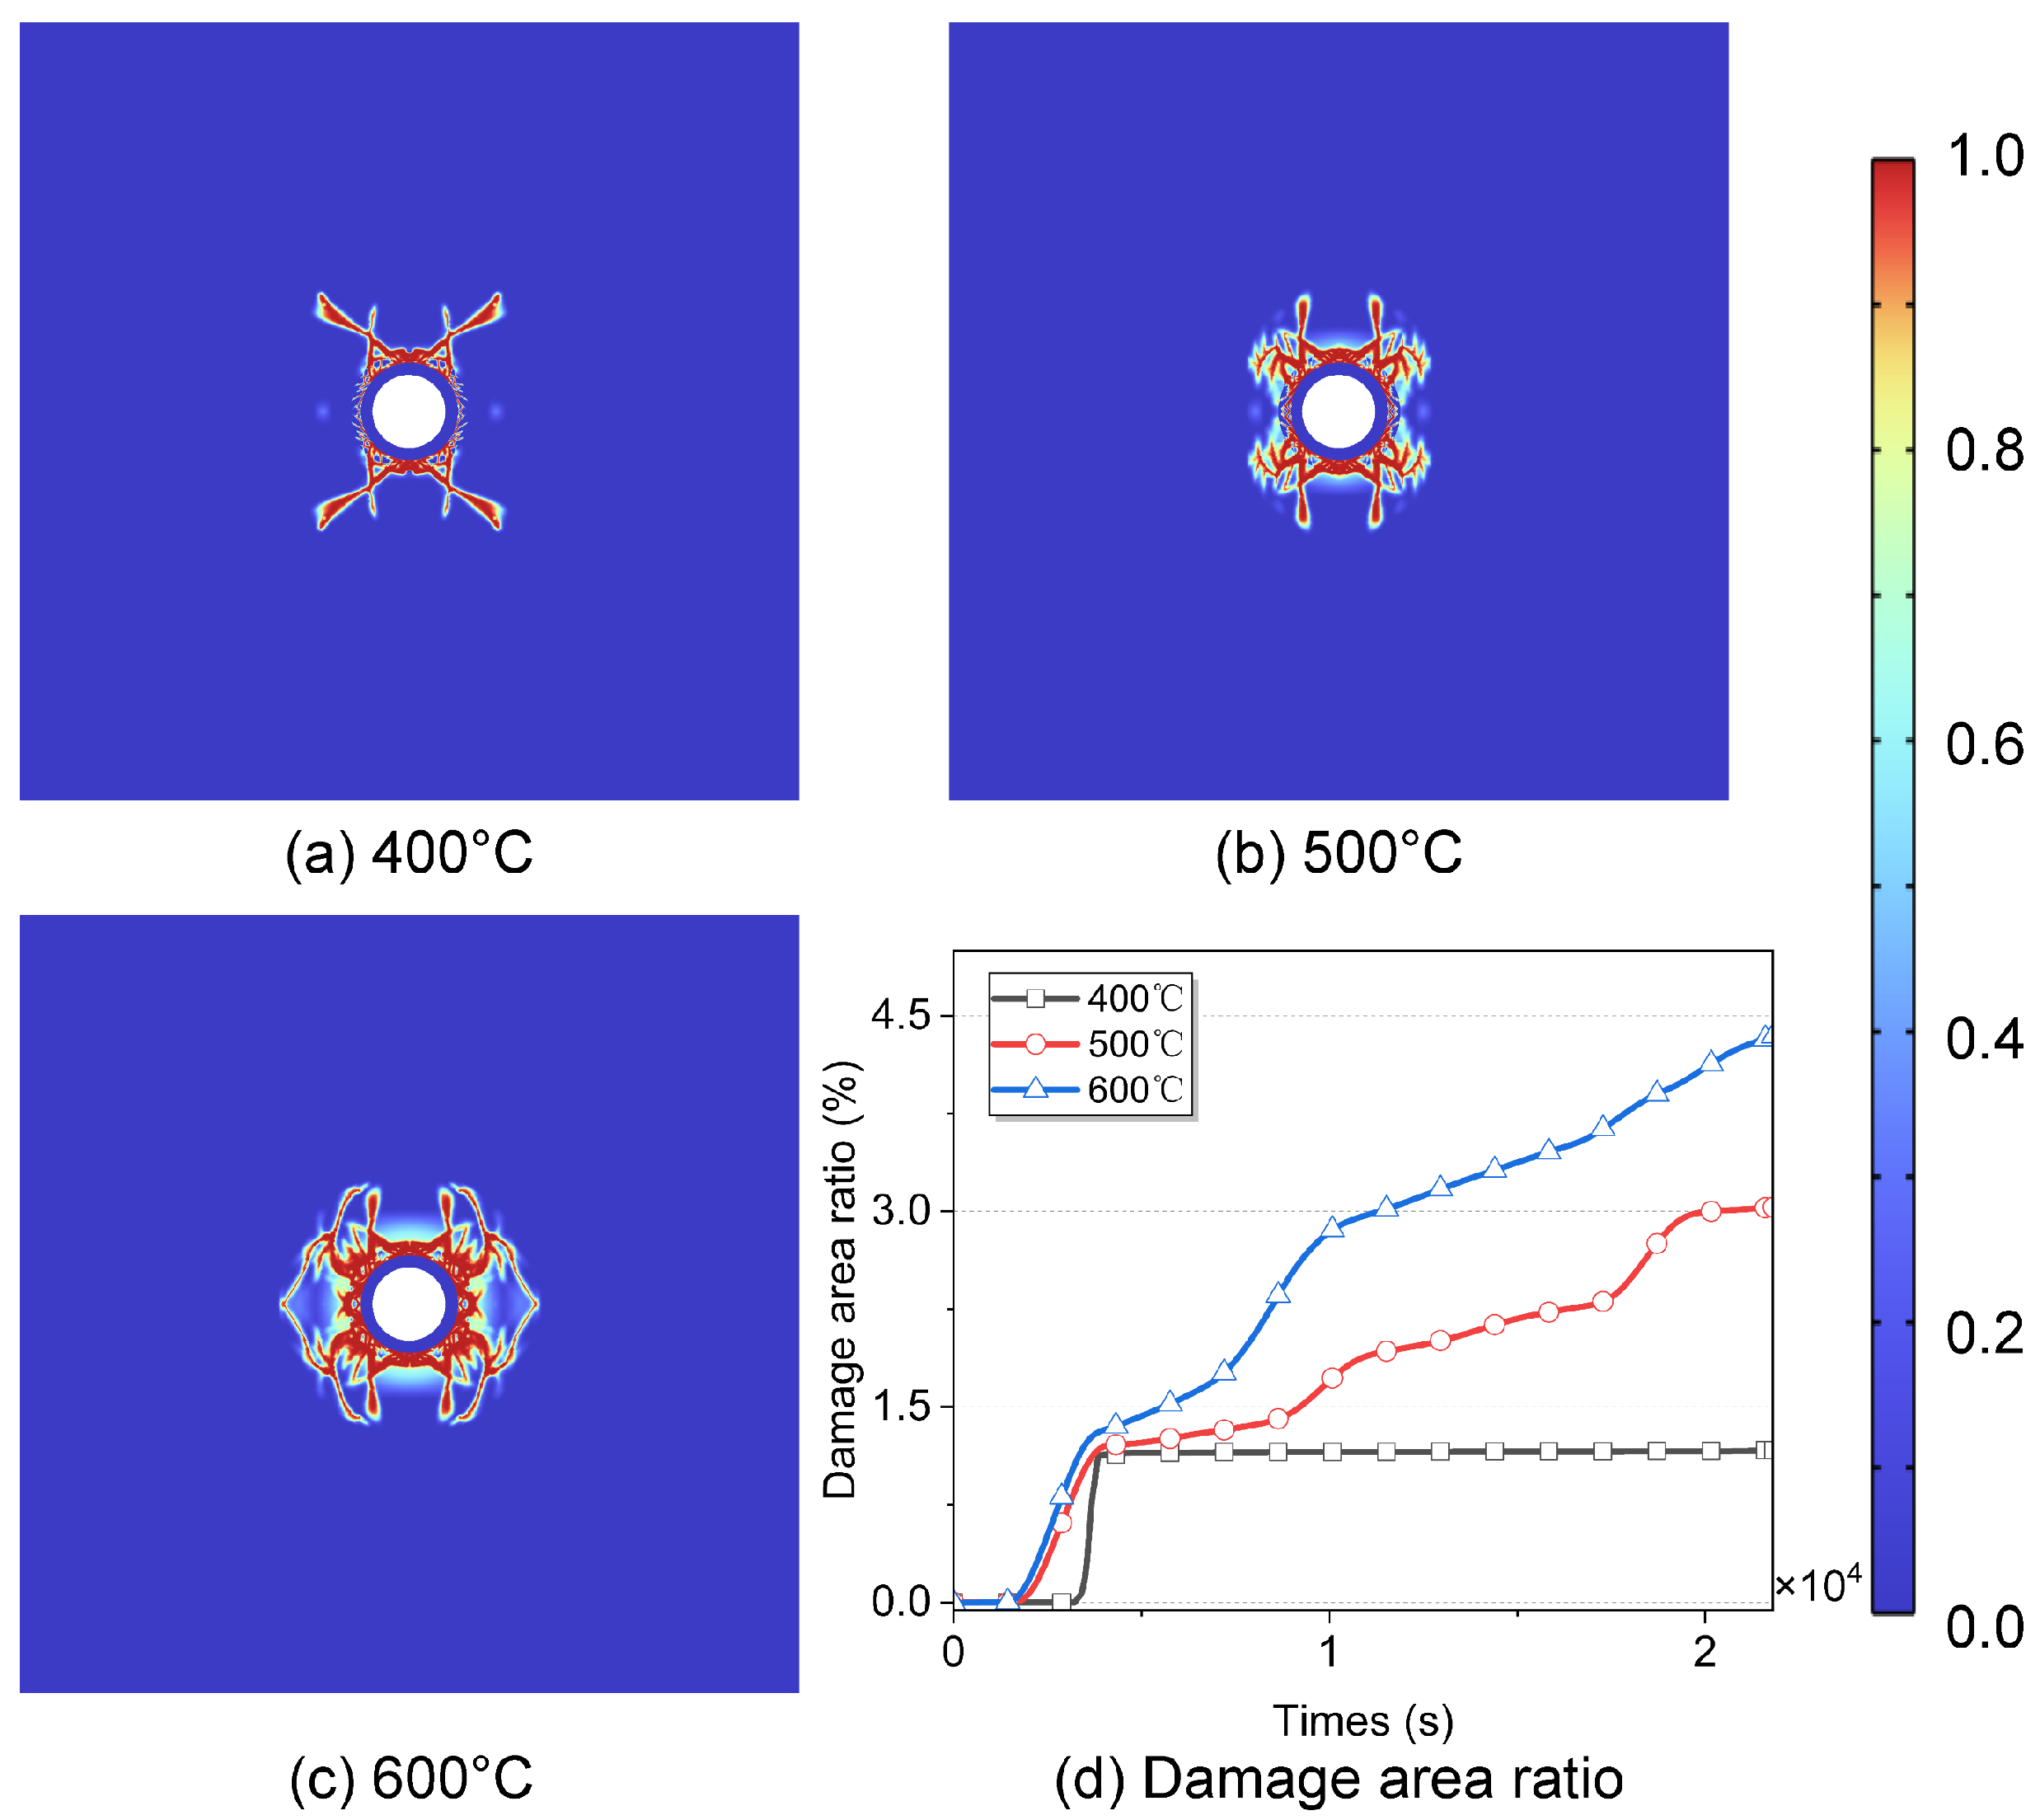
The influence of heating temperature is also studied in this section. It can be seen from Figure 13 that under the same heating rate, the stepped section ends at almost the same time, while for the case with the lowest heating temperature, the damage evolution stops after the step section ends. Higher temperatures result in larger temperature gradients, leading to greater thermal stress and more severe damage progression. In conclusion, the higher the heating temperature, the faster the damage evolution rate and the larger the damaged area.

4.1.3. Effect of Wellbore Material on Damage

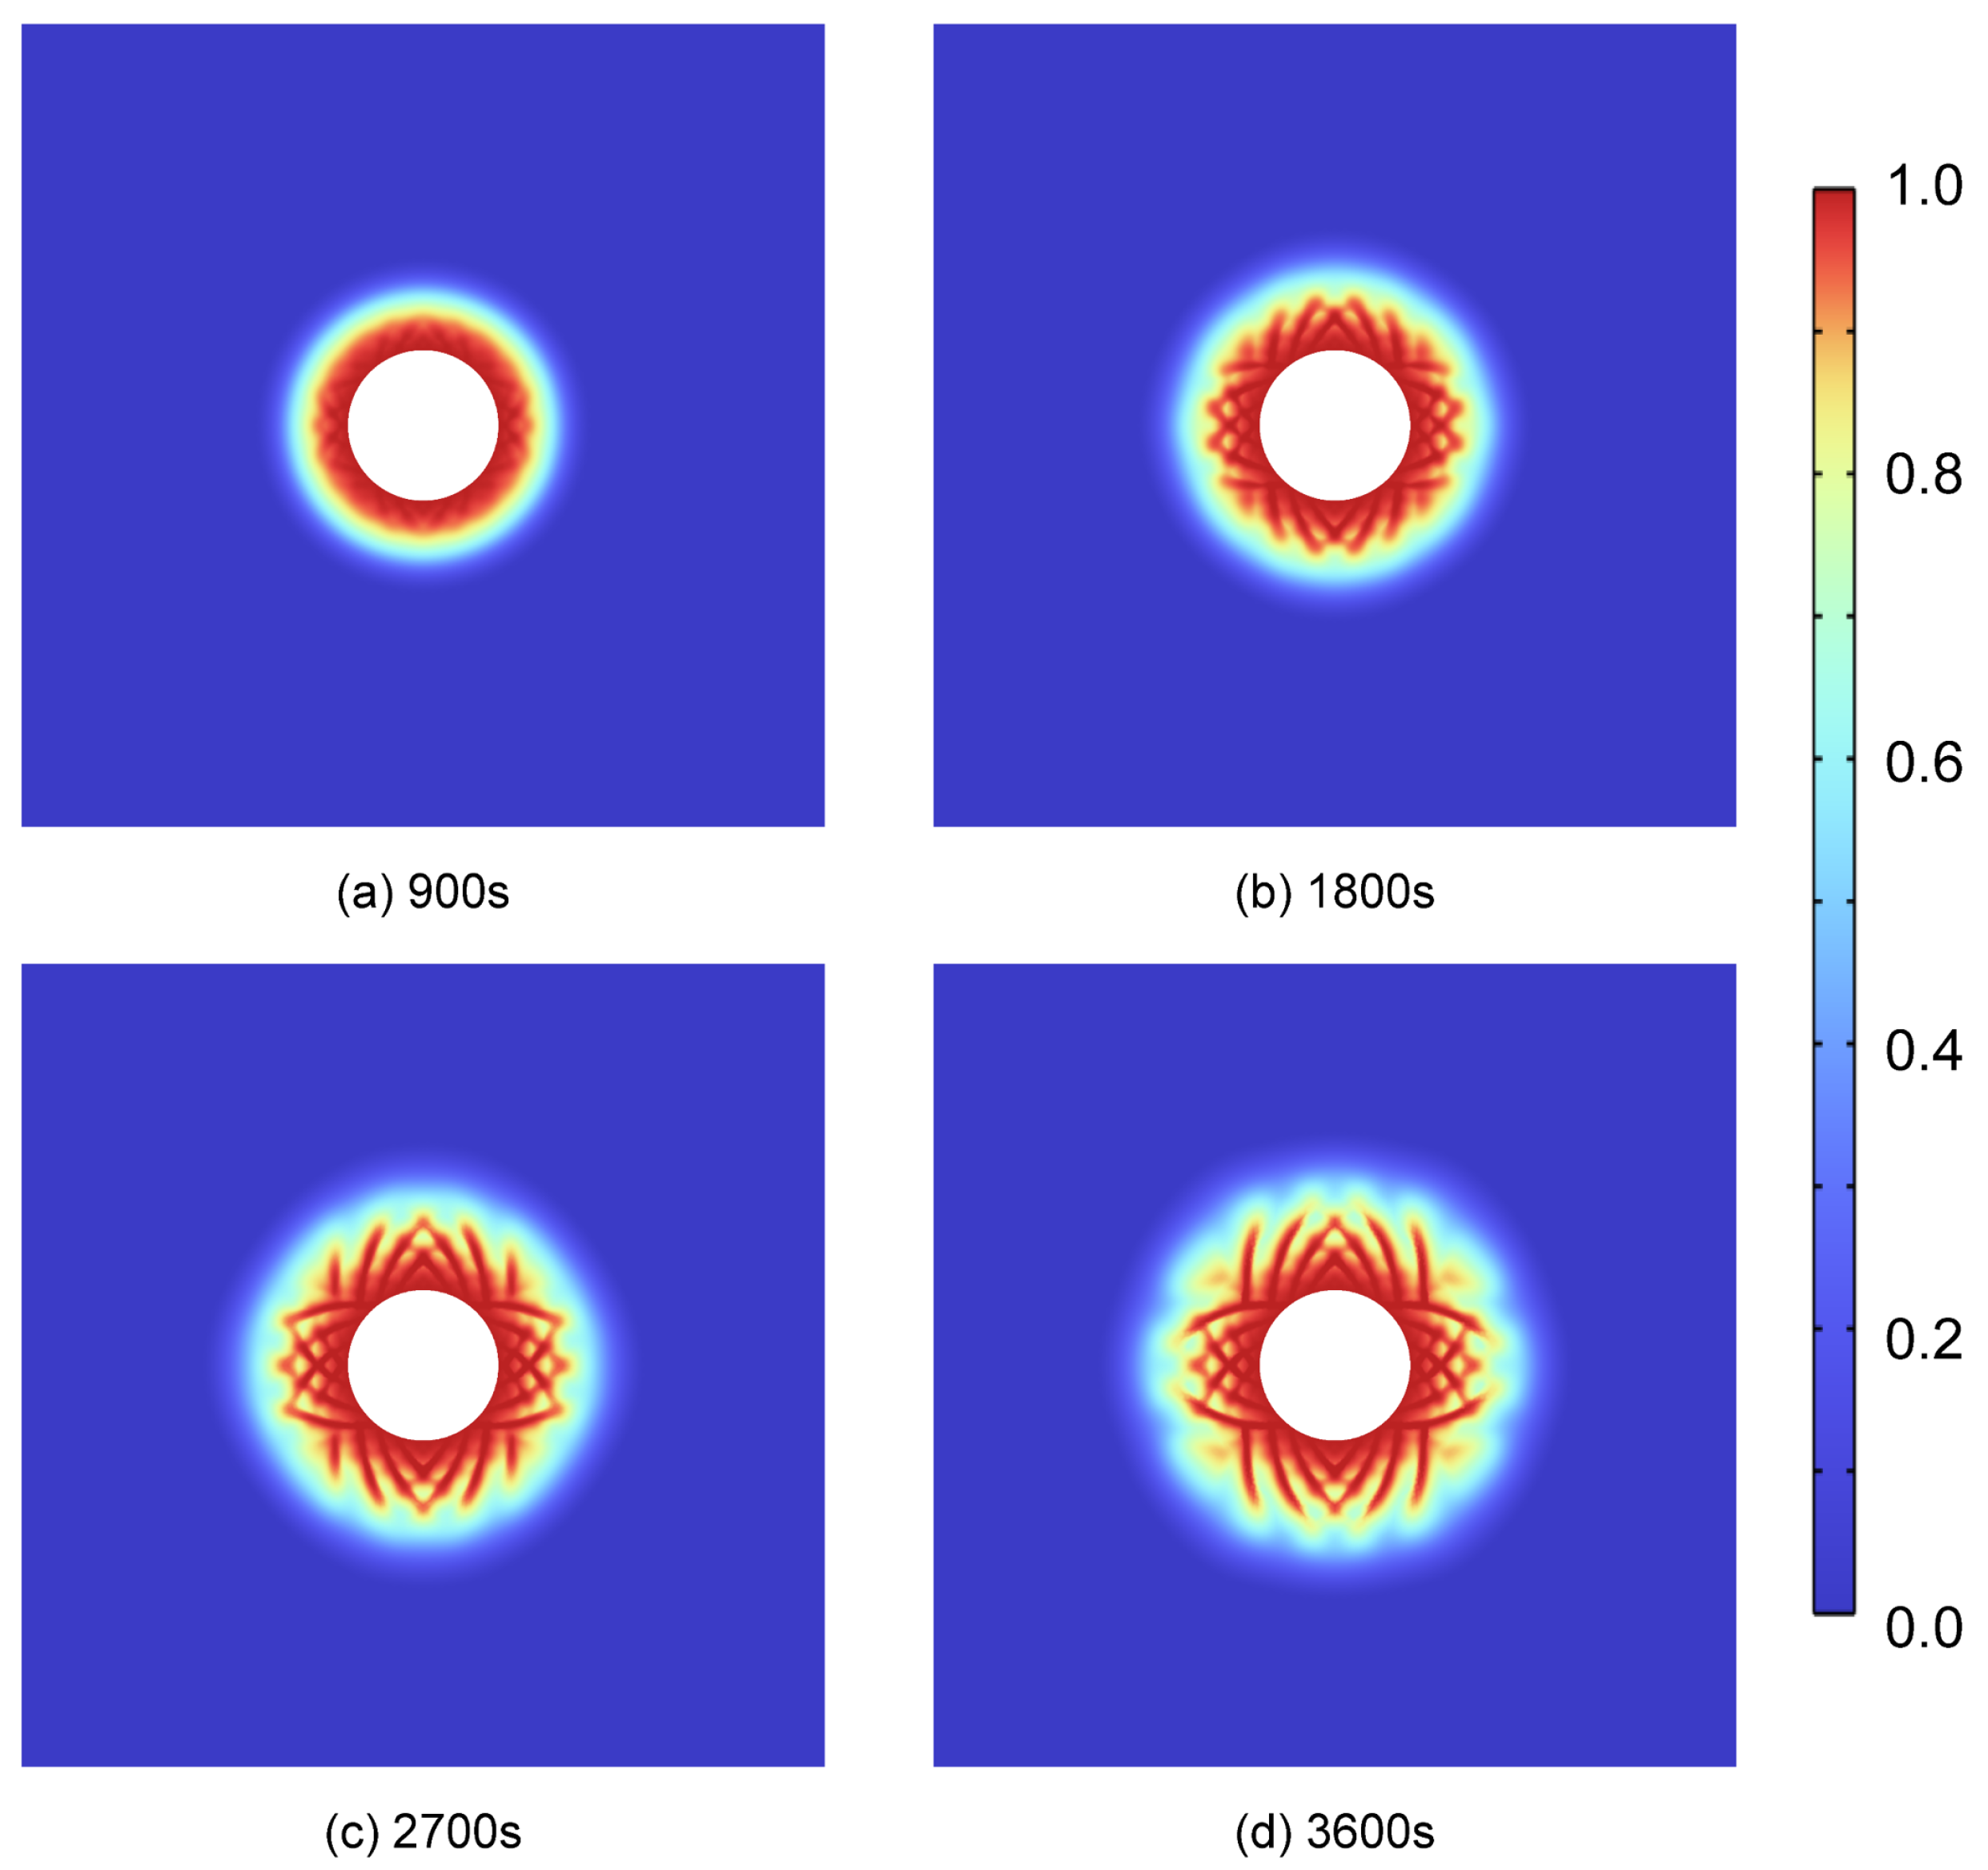
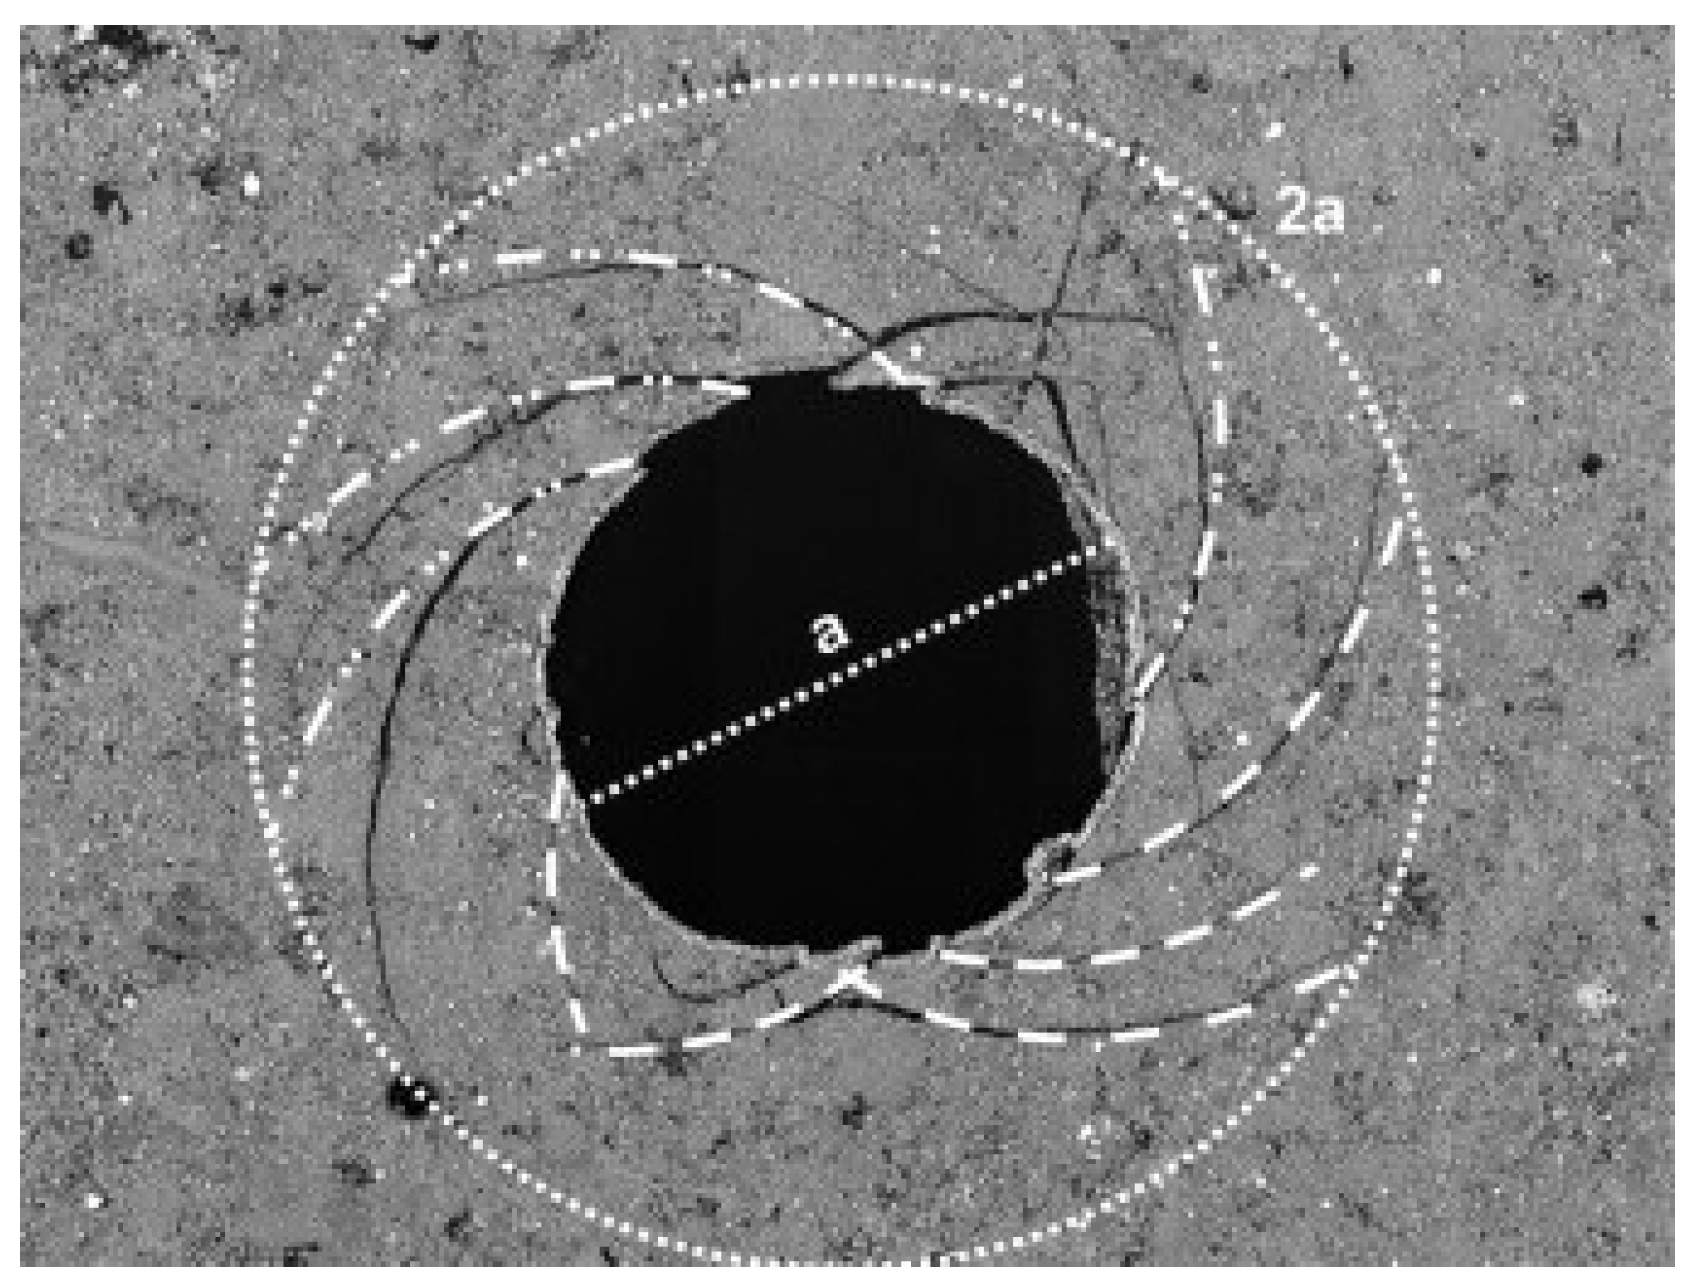
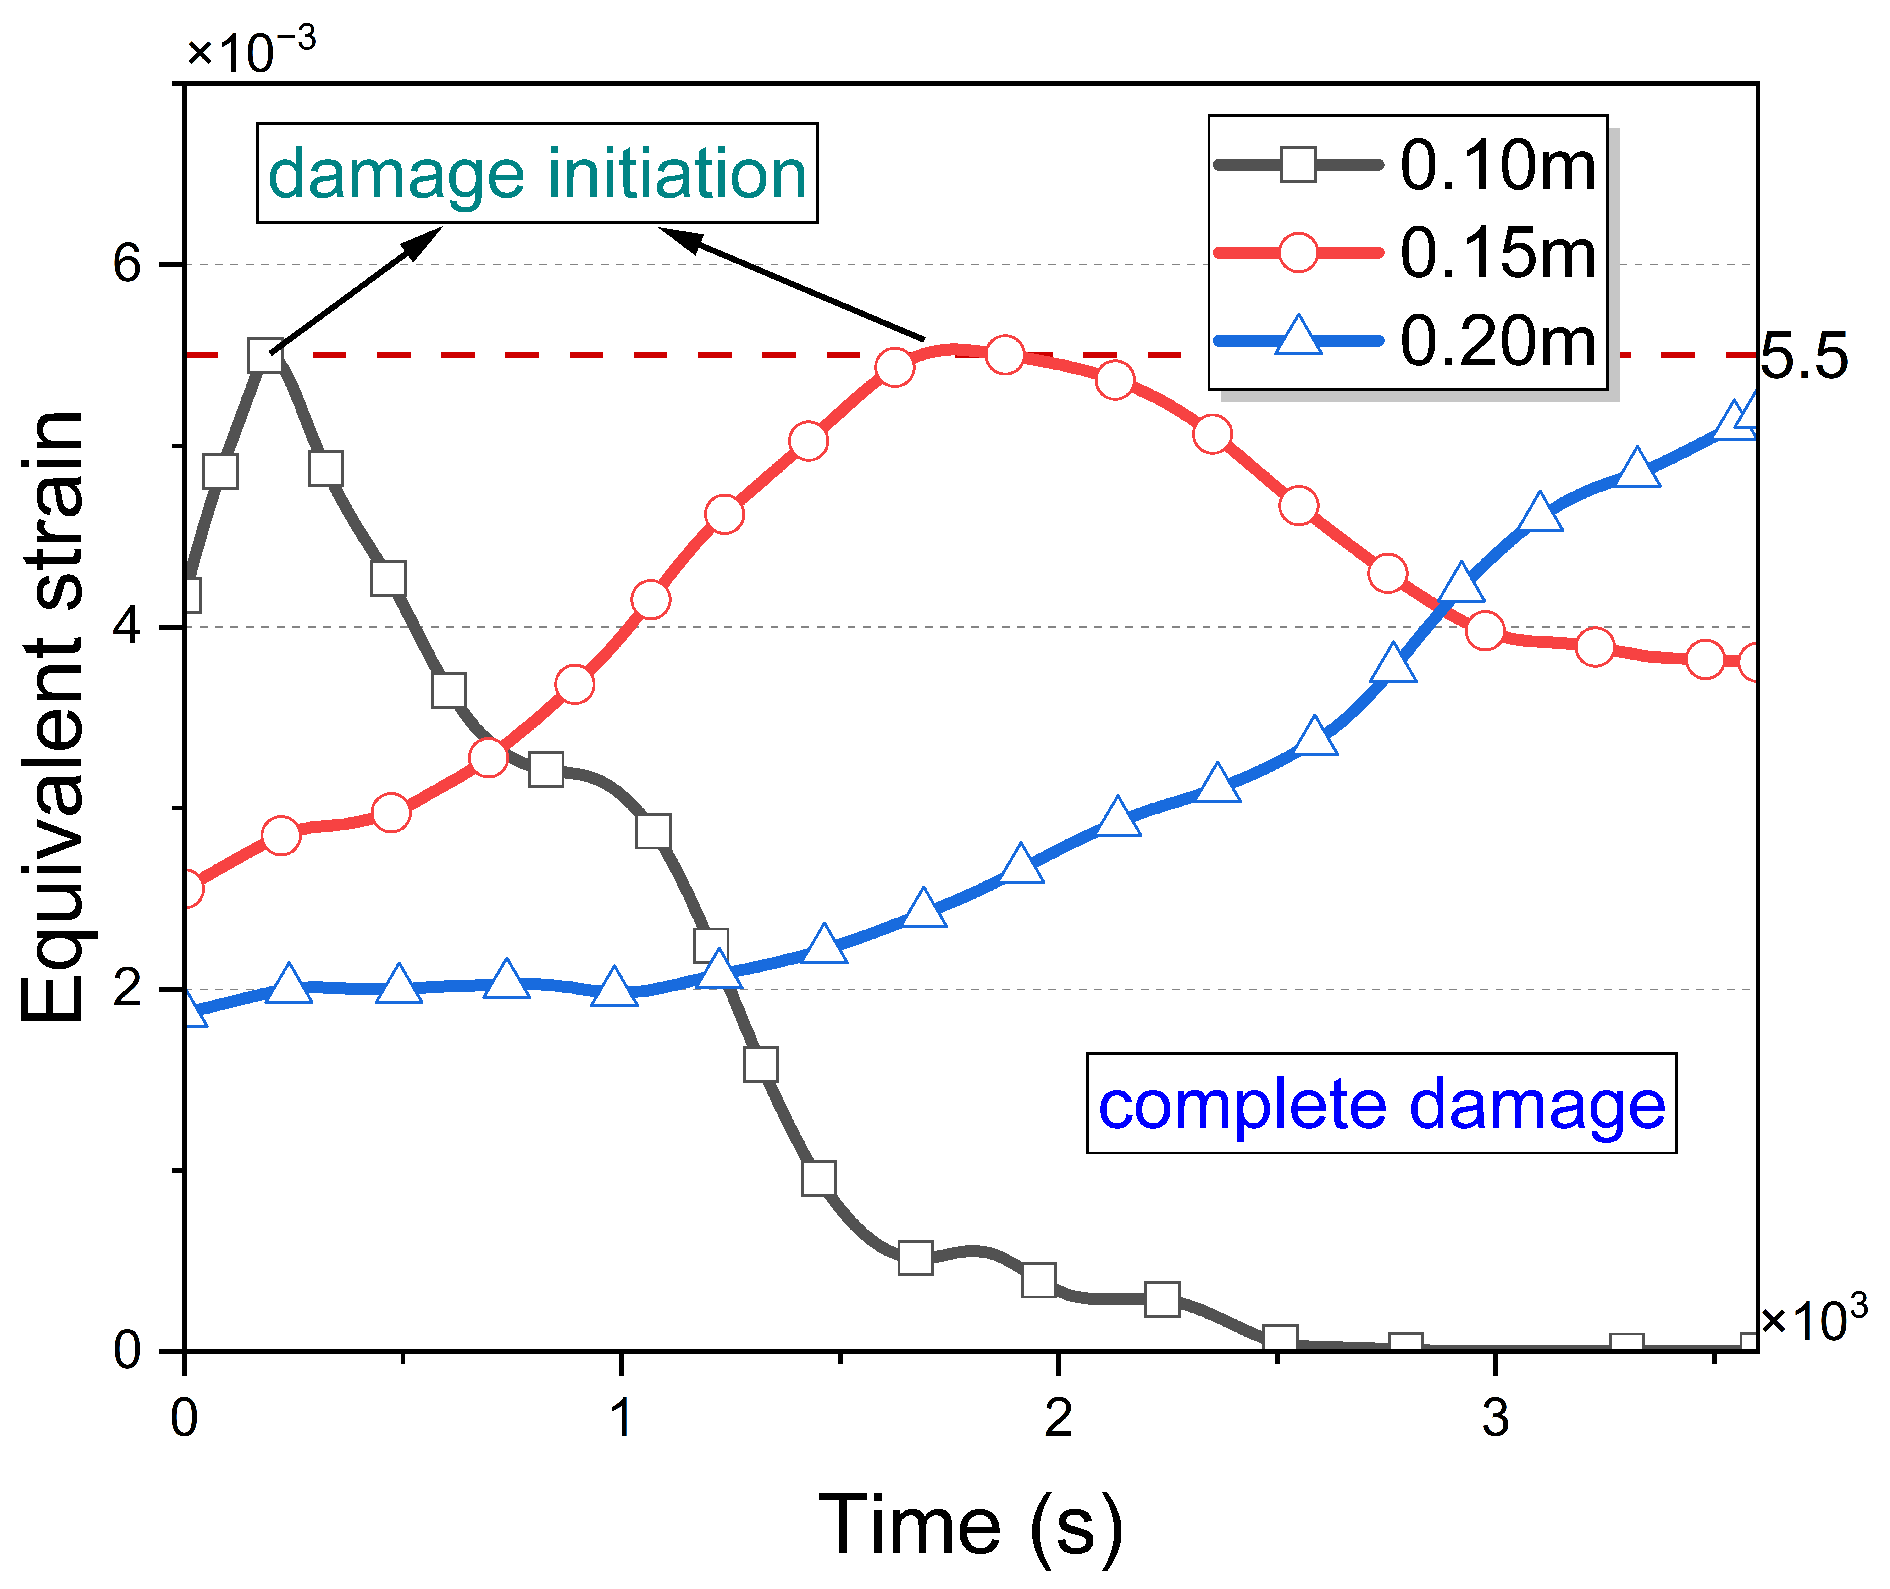
To clearly show the influence of the cement sheath and the steel casing on thermal damage, the ideal situation of directly heating the reservoir is first analyzed, where the cement sheath and the steel casing are not modeled. The temperature of the inner surface of the wellbore is ideally set to the final heating temperature ( T = 400   ° C ), without a gradual ramp-up period. When the in situ stress is equal in the horizontal direction and vertical direction, S v = S h = 10 MPa , the damage evolution is shown in Figure 14. It can be seen that the damage morphology has clear symmetry, which is consistent with the experimental results [20,39,40], and clear spiral cracks are observed in Figure 15. Meanwhile, the damage morphology almost remains the same after t = 2700 s. To accurately obtain the damage condition of the reservoir, three points were selected at 0.10 m, 0.15 m, and 0.20 m away from the wellbore in the horizontal direction, which are shown by A, B, and C in Figure 9, to observe the stress variation with time. It can be observed from Figure 16 that there are obvious peaks in the stress curves of the two points near the wellbore, which is the initiation of damage. For the point 0.1 m away from the well, complete damage is achieved around 2500 s. The point far from the wellbore does not reach the damage threshold, thus maintaining load-bearing capacity.
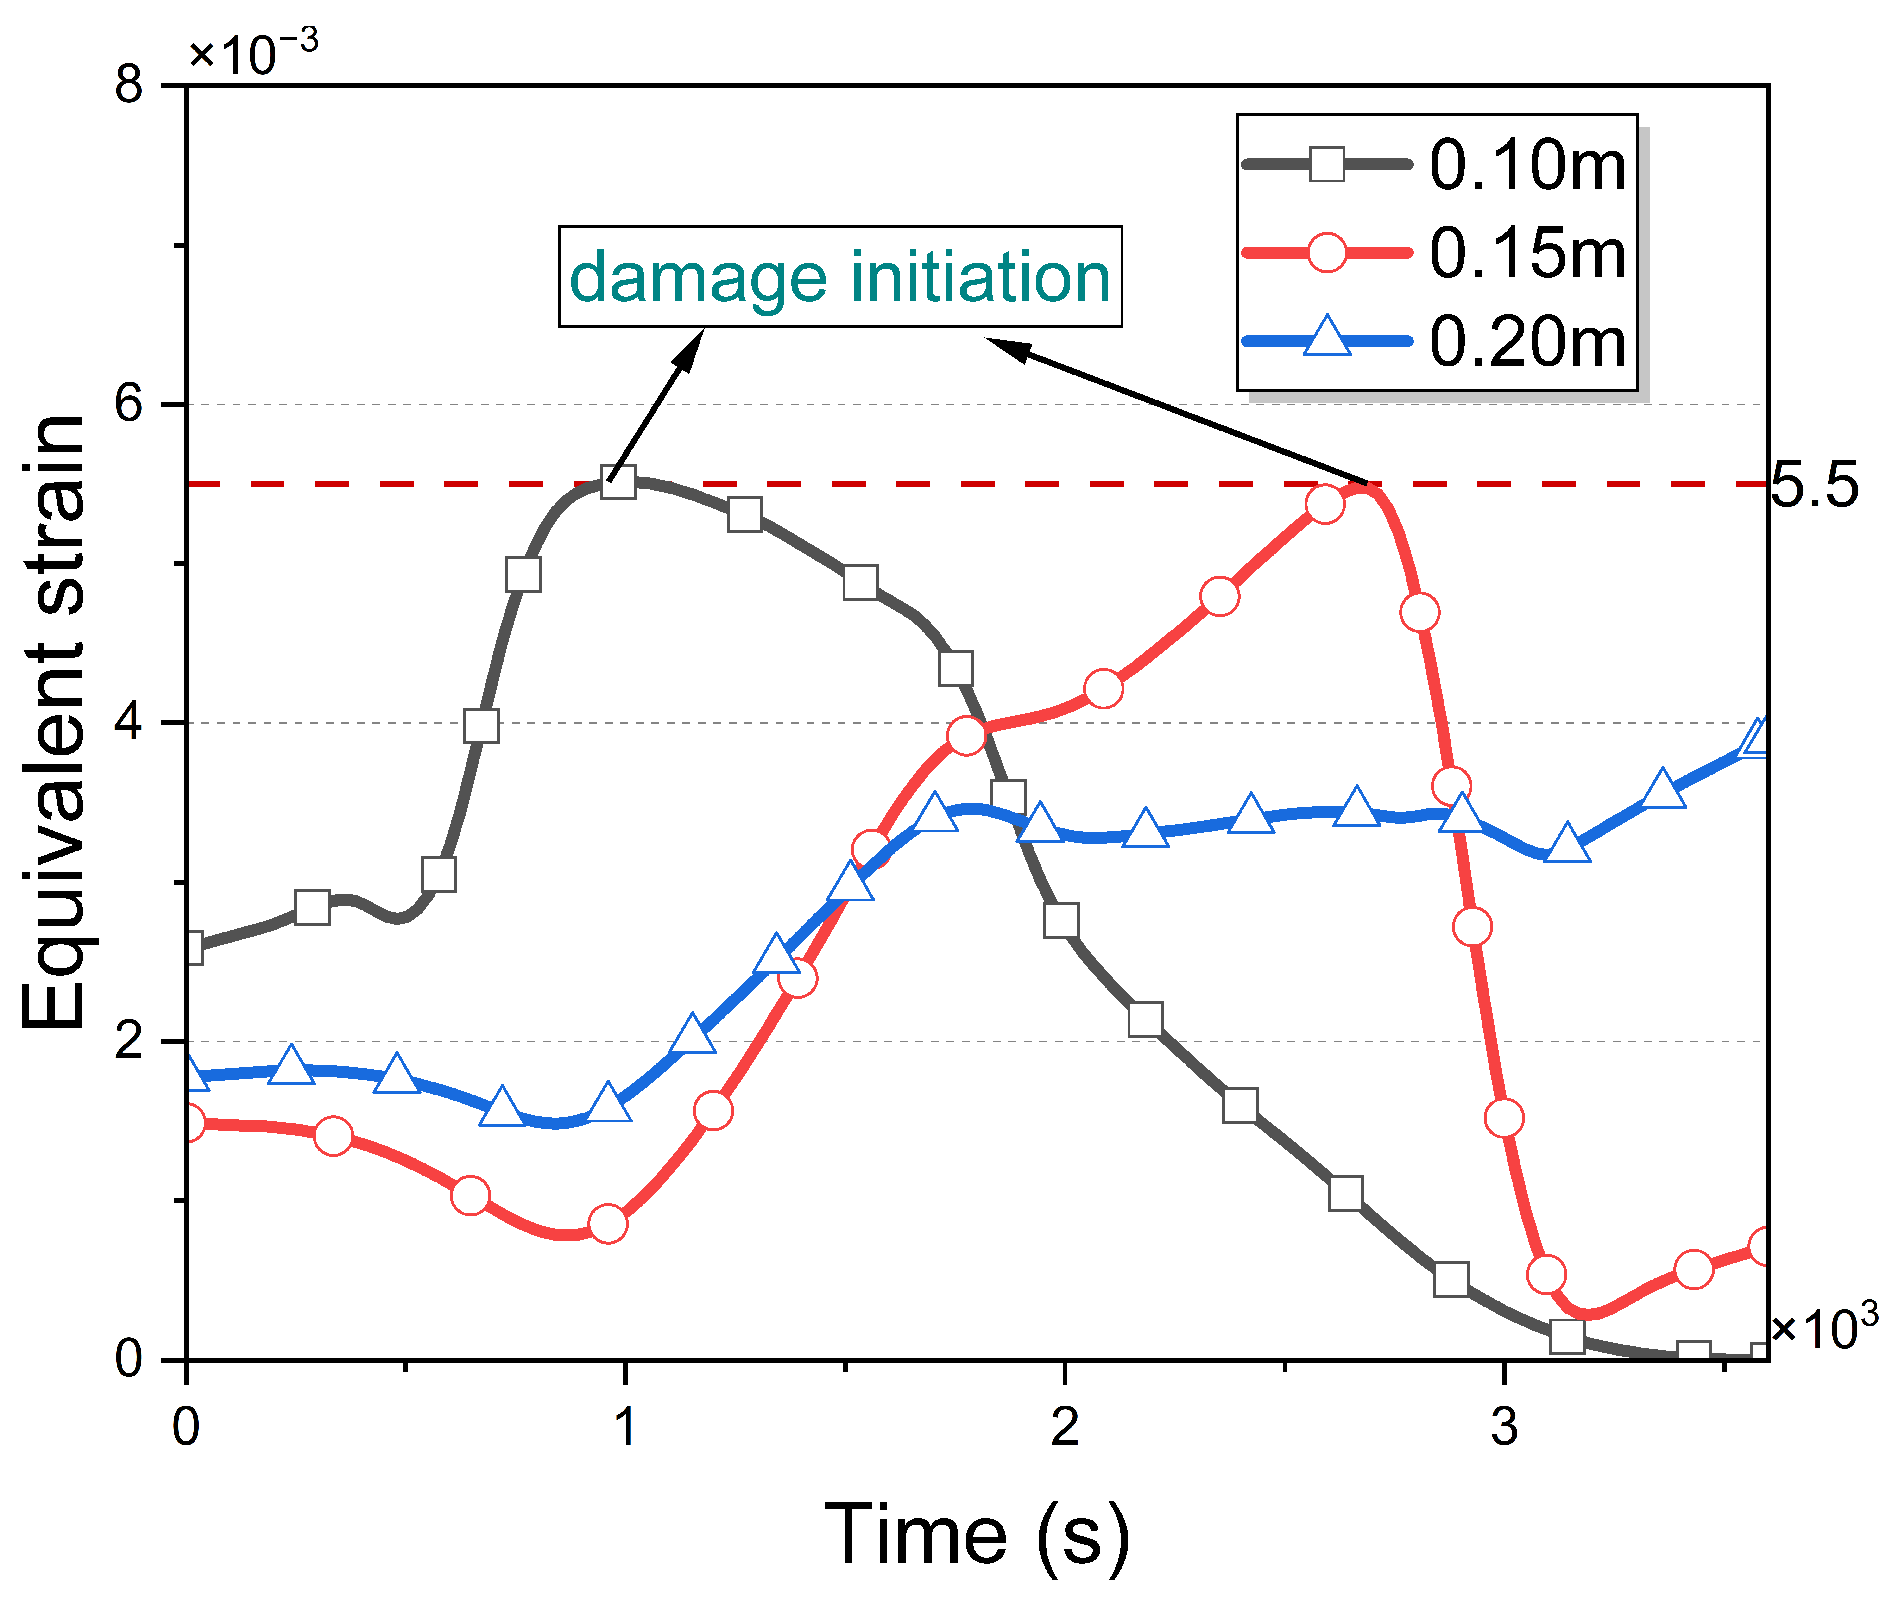
The damage caused by indirect heating is shown in Figure 17. Indirect heating means that the heating source does not directly act on the reservoir and the heat is transmitted to the reservoir through the steel layer and the cement layer. Compared with direct heating, the damage initiation time of indirect heating is longer, and the range of the damage area is significantly reduced. As shown in Figure 18, the damage point did not appear until 1800 s and the damage rate was still high after 2700 s. It can be seen that the selected points begin to be damaged only after 2700 s in Figure 18, and the damage is not complete until 3600 s. It can be seen that the symmetry, range, and rate of damage morphology are significantly affected by the wall material. A thicker cement sheath delays the onset of damage in the rock and reduces the overall extent of damage.
The effect of cement sheath thickness on damage morphology is also studied. As can be seen from Figure 19, when the cement layer thickness reaches 75 mm, the reservoir hardly suffers from damage and the stepped section disappears. The damage will be significant if the cement layer is insufficiently thick, whereas an excessively thick cement layer will result in lower temperatures and a smaller area of damage. Therefore, the thickness of the cement layer should be controlled within 50 mm to achieve a balance between heat transfer efficiency and wellbore strength.

4.2. Damage Analysis of the Well Network

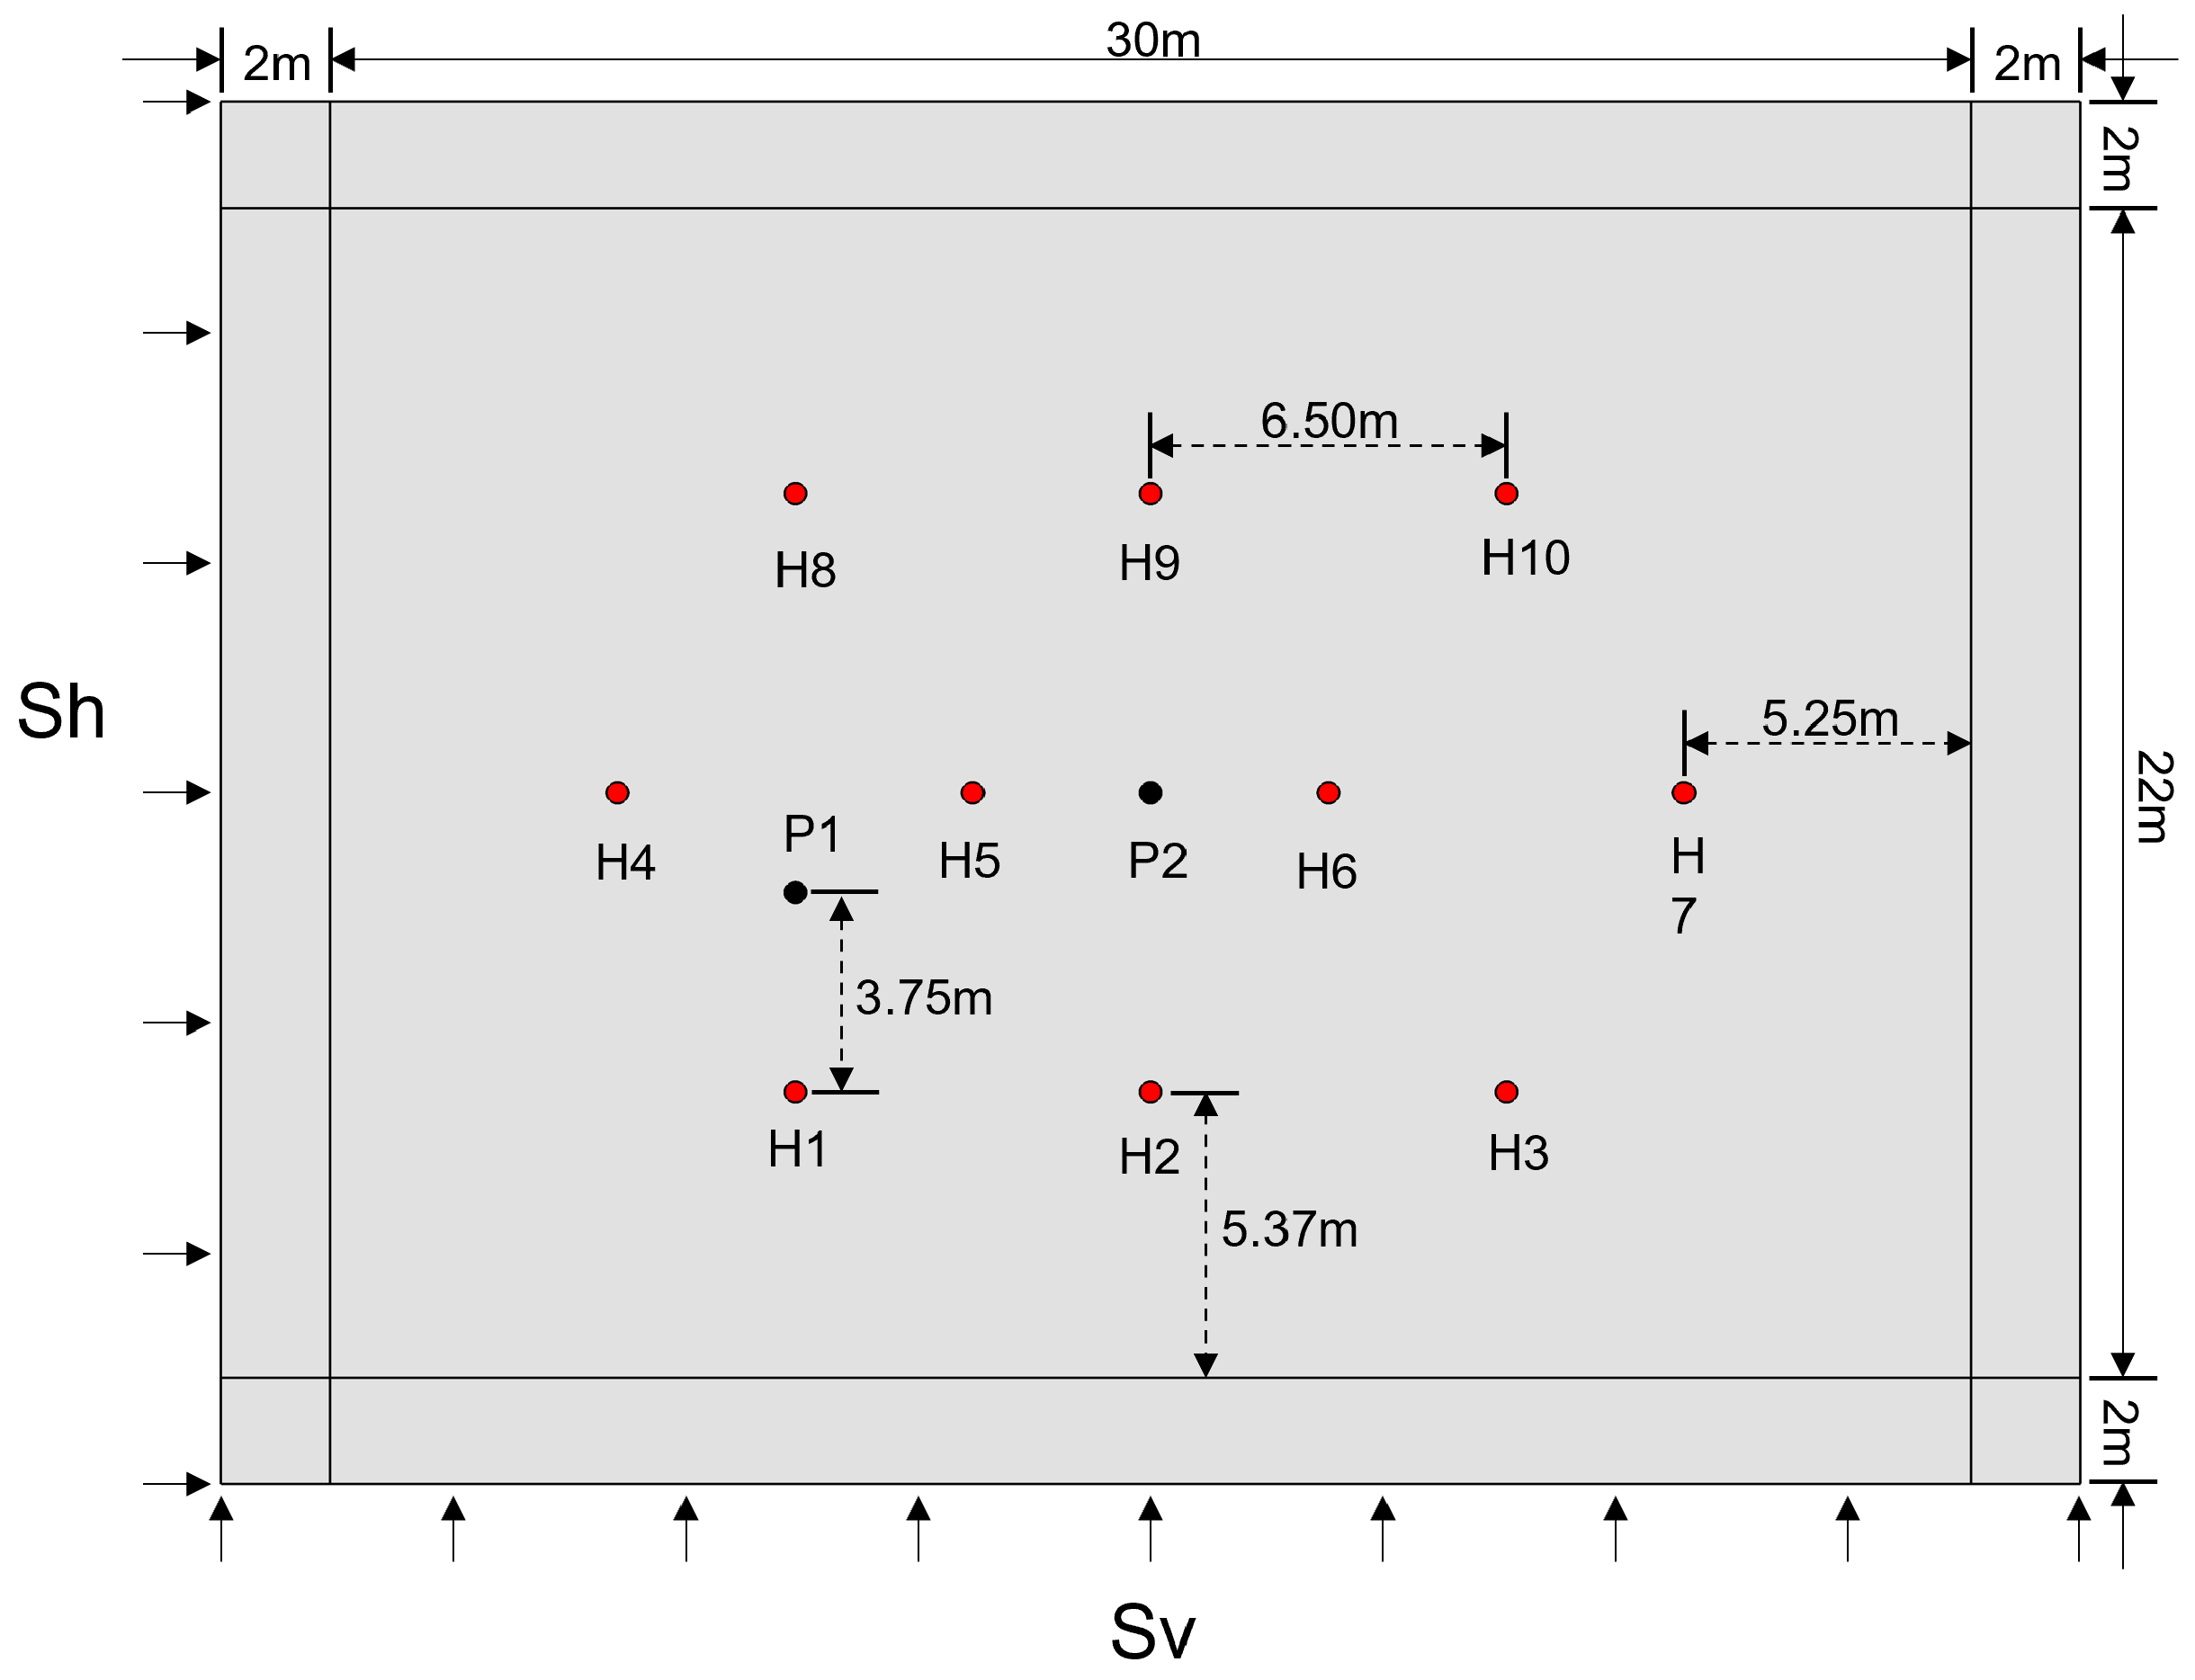
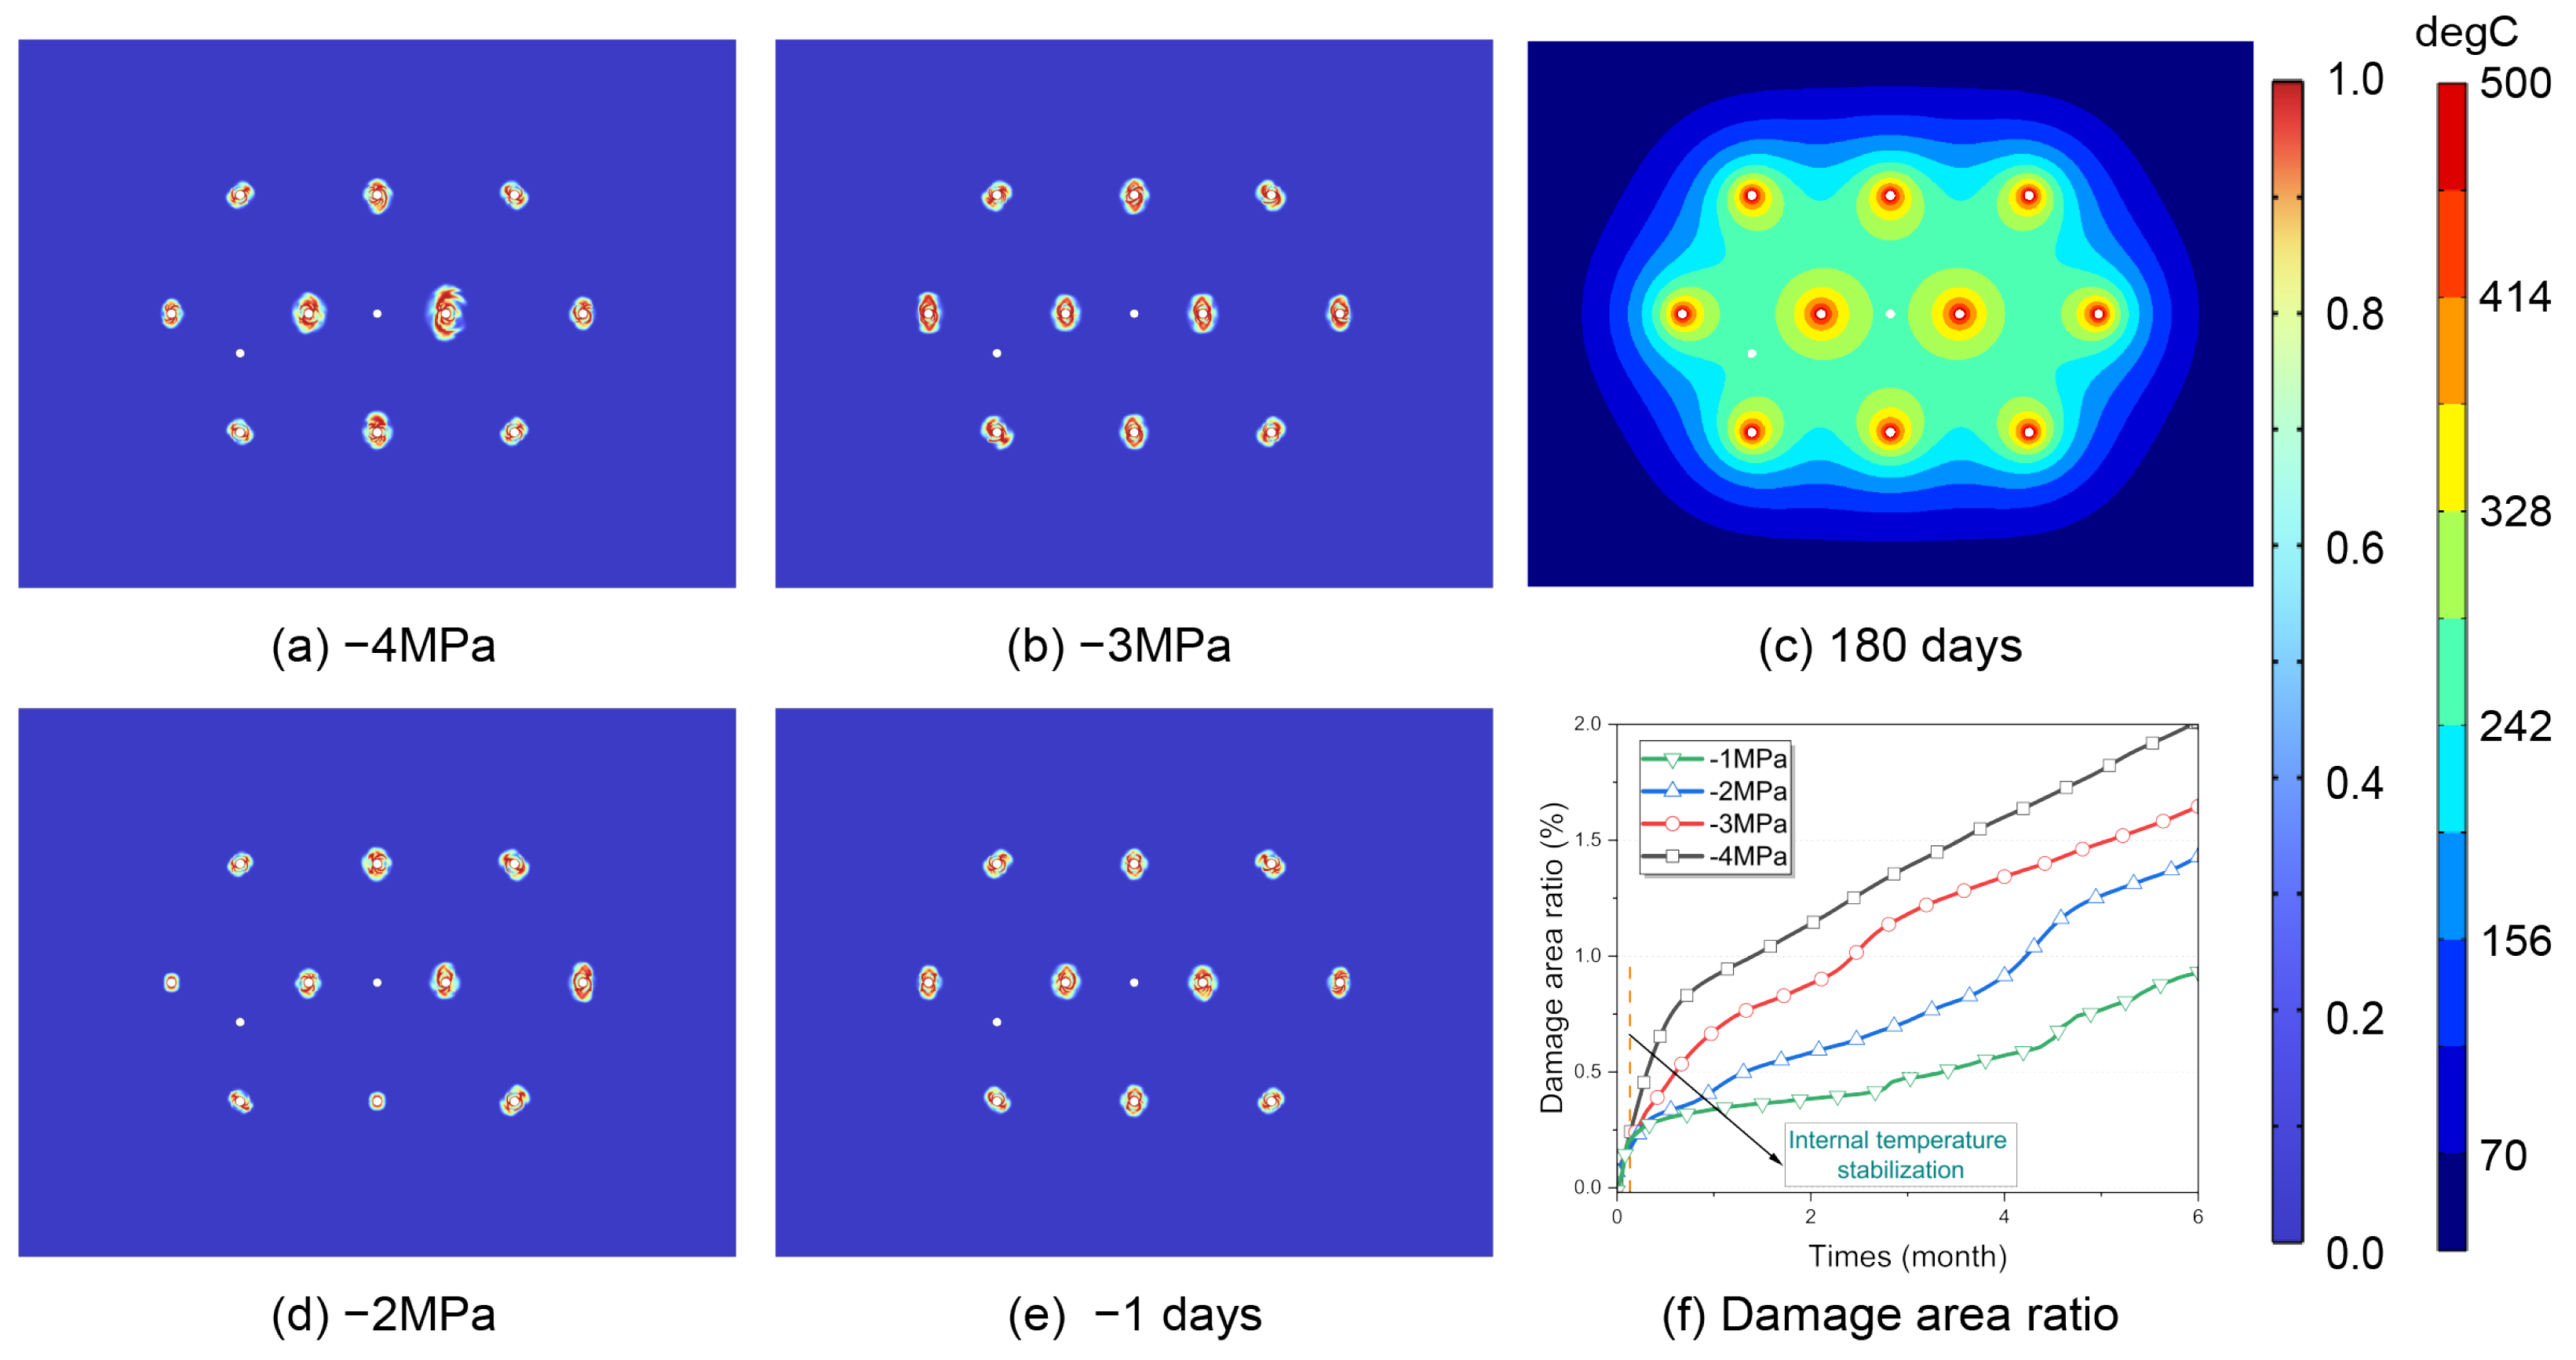
To analyze the in situ conversion process in a horizontal well extraction system, in this section, a complete well network model is established, and a simulation over 180 days is conducted. The geometry and boundary conditions of the well network model are provided in Figure 20, where an infinite element domain is used here to simulate the boundary conditions at an infinite distance. In Figure 20, H denotes the heating well, and P represents the production well. Due to the size of the model, the multi-layer structure of wells is not included in the well network model. The in situ stress is set as S v = 10 MPa and S h = 5 MPa , with the heating well temperature increasing from 20   ° C to 500   ° C over 48 days. Figure 21e illustrates that the temperature distribution in the reservoir at the conclusion of the simulation suggests the production well has a negligible impact on the temperature profile. In Figure 21f, the dashed line on the left indicates the heating well temperature reaching 500   ° C , and there is also a stepped region in the network indicating zones of material damage. However, due to the timescale, this stepped progression is not prominent throughout the entire figure. After the stepped region, the damage rate tends to stabilize. As extraction pressure increases, the damaged region gradually expands. By day 180, the damage area ratio (DAR) at an extraction pressure of −4 MPa exceeds twice that of a pressure of −1 MPa, indicating a significant impact of extraction pressure on the extent of the damage.
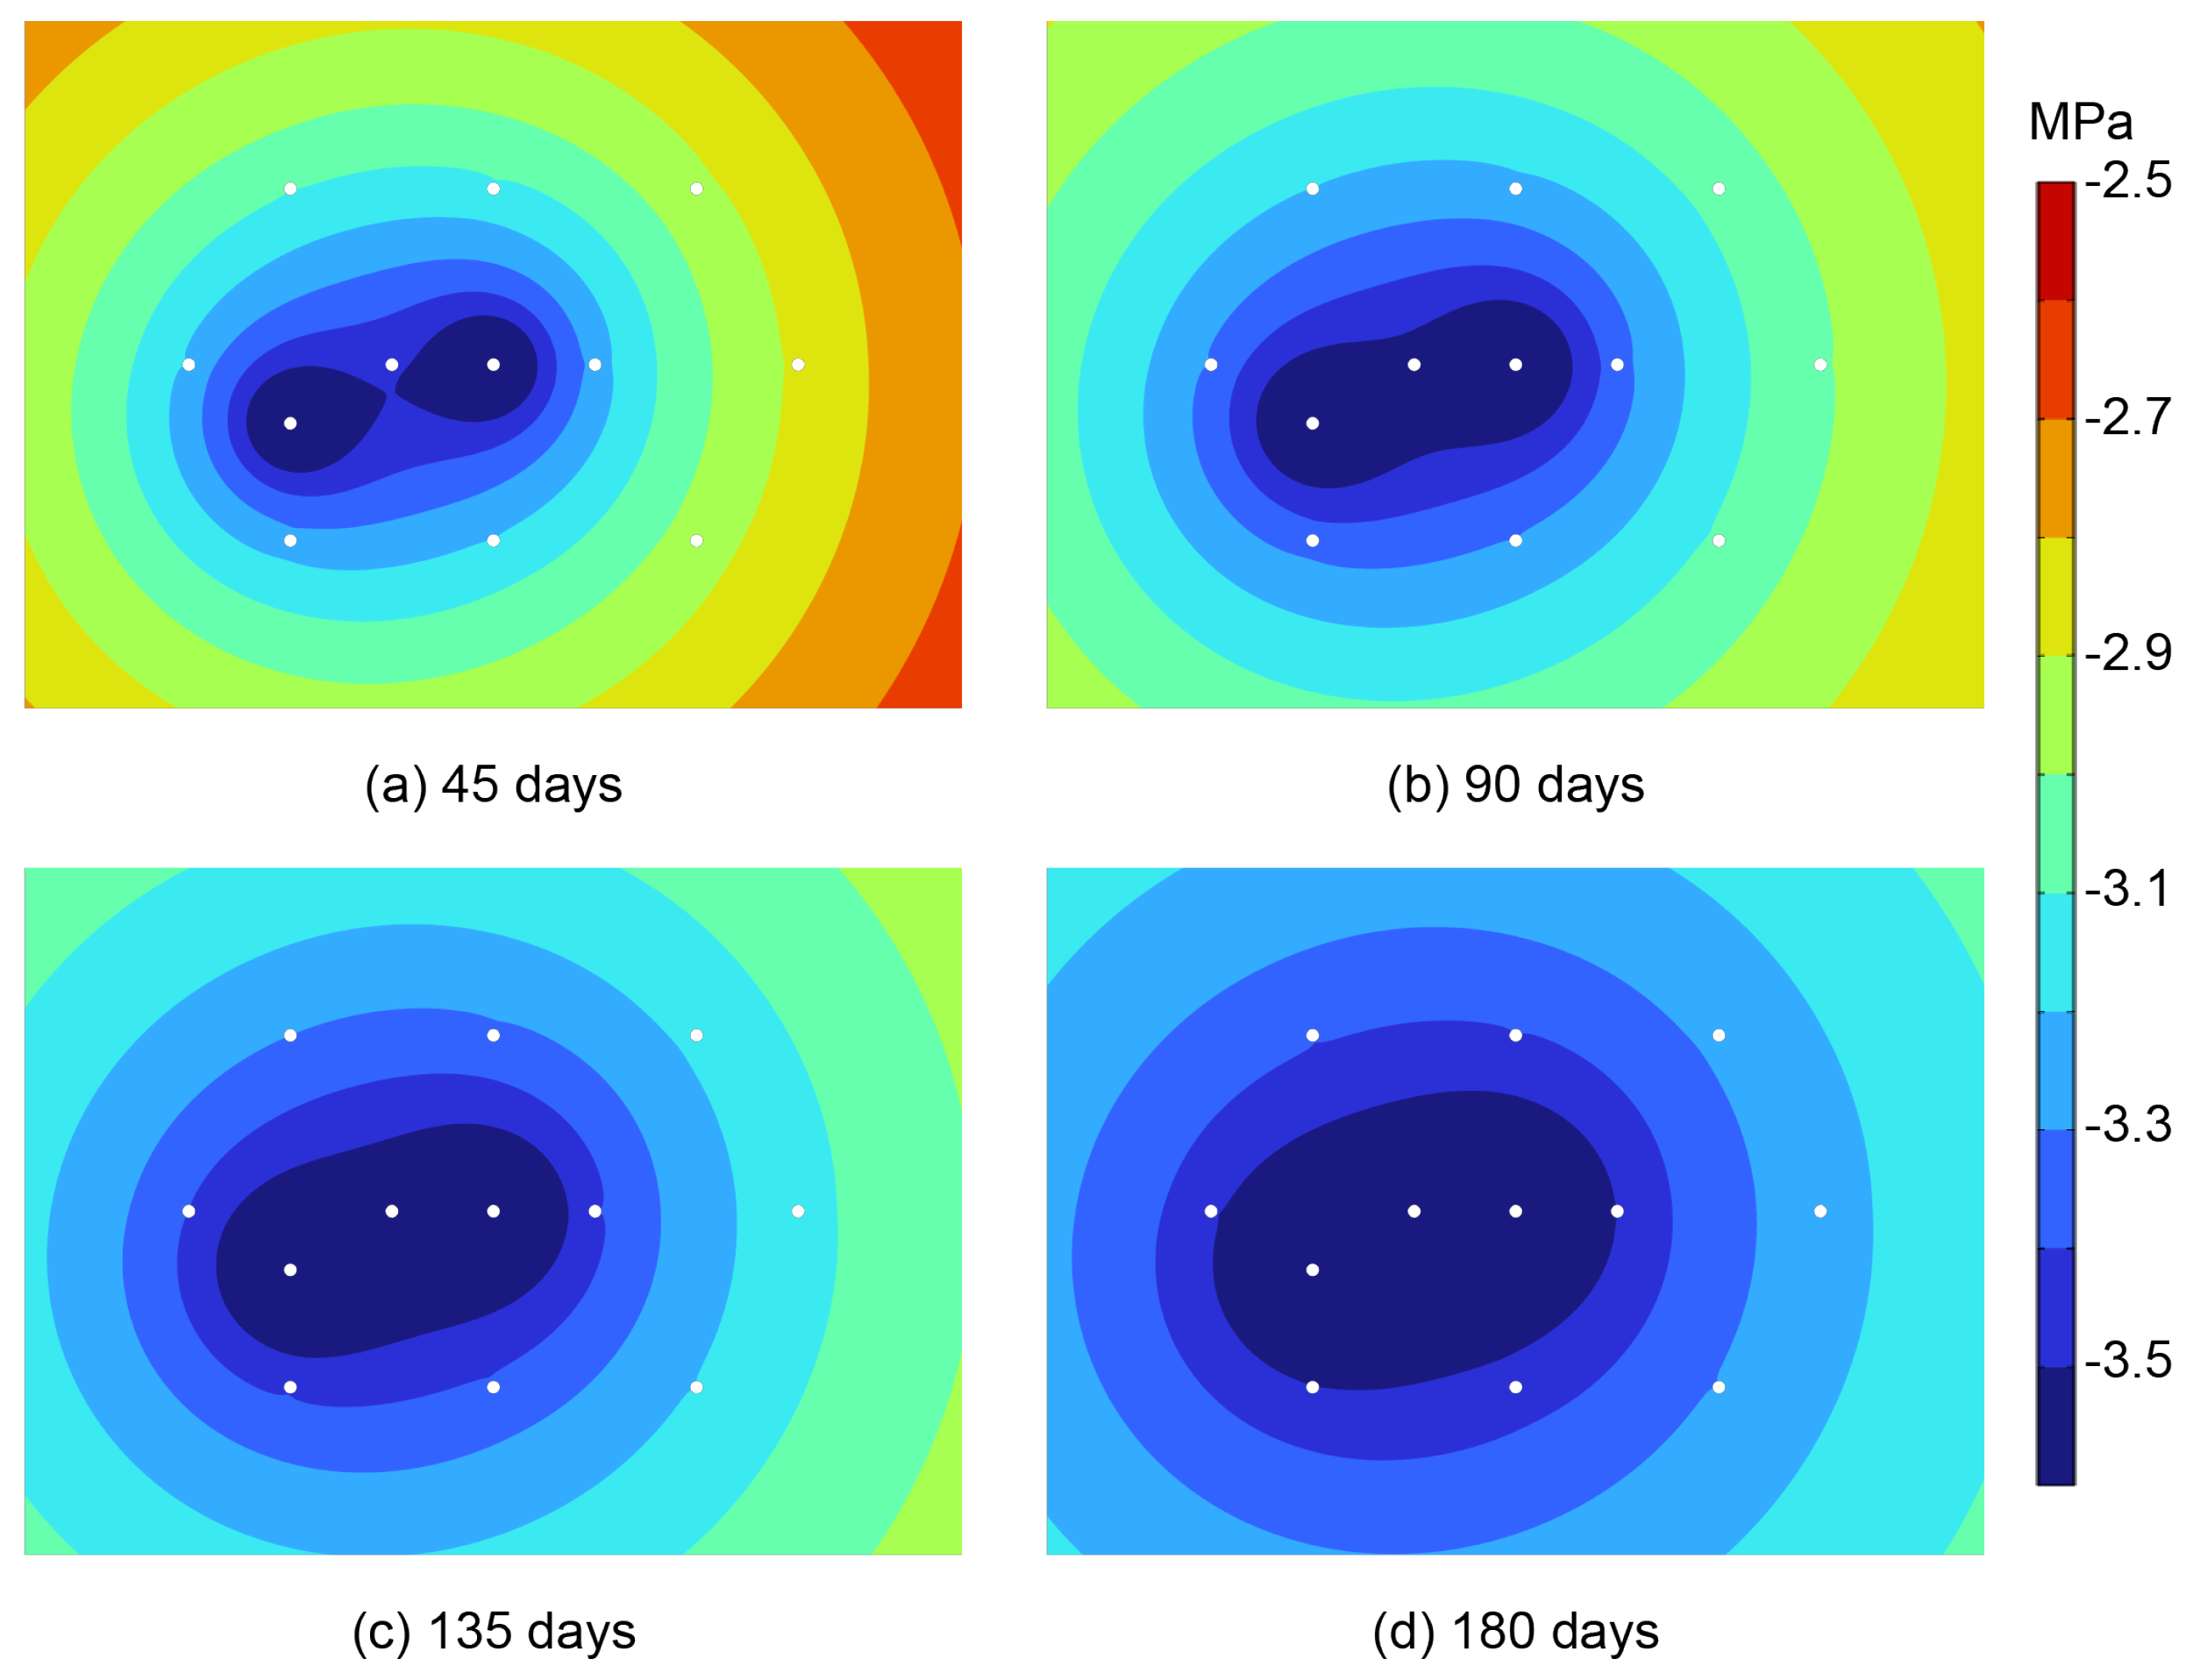
Figure 22 shows the evolution of reservoir pressure over time. As extraction continues, there is no replenishment of crude oil in the reservoir, and a low-pressure zone gradually expands near the extraction well, where the pressure tends to align with the extraction pressure.
In recent years, there has been increasing attention on environmental protection, particularly regarding subsidence caused by the decrease in reservoir bearing capacity and pore pressure during the extraction process. Figure 23 presents the subsidence levels under different extraction pressures. After 6 months of drilling without extraction, the maximum subsidence recorded was 2.79 cm, which was due to damage in the reservoir. When the extraction pressure was set at −4 MPa, the maximum subsidence reached 6.35 cm after 6 months. The extraction process typically lasts for several years, during which the surface experiences continuous subsidence. This indicates that extraction pressure has a significant impact on surface subsidence.

5. Conclusions

This paper establishes a coupled THMD model for the in situ conversion process, simulating fluid flow using the continuity equation and Darcy’s law and heat transfer through Fourier’s law and the energy conservation equation. Employing a gradient damage model based on strain energy decomposition, the model captures damage caused by tensile–compressive asymmetry, aligning closely with real-world scenarios. Numerical examples validate the model’s accuracy in predicting temperature, pressure, and damage distribution, including comparisons with experimental results for the rapid cooling of hot ceramic plates.
The study also analyzes a single-well model with a multi-layer wellbore to evaluate the effects of heating rates, heating temperature amplitudes, and in situ stresses on damage. Results show that heating temperature amplitude and cement sheath thickness significantly influence the damaged area, with optimal thickness balancing heat transfer efficiency and wellbore integrity. Extraction pressure strongly impacts both the damaged area and reservoir subsidence, making it a key factor for stability in the well network model. We quantified the relationship between subsidence and extraction pressure, and the analysis results show that extraction pressure not only significantly impacts the damaged area but is also a primary factor contributing to subsidence. The proposed THMD model improves shale oil recovery operations by accurately predicting damage and wellbore stability, providing guidance on strategies such as lower heating temperatures, slower heating rates, thicker cement sheaths, and higher extraction pressures to ensure operational safety. This underscores its potential as a valuable tool for promoting safer, more efficient, and sustainable extraction processes. Future work will extend the model to three-dimensional cases and incorporate the effects of kerogen pyrolysis.

Author Contributions

Conceptualization, J.J.; methodology, G.L., W.C. and J.J.; validation, G.L., W.C. and M.Z.; formal analysis, J.L., B.F. and T.Y.; investigation, T.Y.; resources, J.L.; data curation, B.F.; writing—original draft preparation, G.L.; writing—review and editing, J.J.; visualization, M.Z.; supervision, W.C.; project administration, W.C. and J.J.; funding acquisition, J.J. All authors have read and agreed to the published version of the manuscript.

Funding

This research was jointly funded by China National Petroleum Corporation Science and Technology Project 2021DJ5203: Safe and Environmentally Friendly In Situ Conversion and Implementation Technology Research for Middle-Low-Maturity Shale Oil, and the Open Project Funds of RIPED: 2024-KFKT-32.

Data Availability Statement

Available on demand.

Conflicts of Interest

Authors Guoping Li, Weixi Chen, Minghui Zhao, Jiandong Liu, Bo Fang and Tingfu Ye were employed by the company PetroChina Qinghai Oilfield Company. Authors Juan Jin and Jiandong Liu were employed by the company CNPC and PetroChina. The authors declare that the research was conducted in the absence of any commercial or financial relationships that could be construed as a potential conflict of interest.

References

  1. Wang, J.; Feng, L.; Steve, M.; Tang, X.; Gail, T.E.; Mikael, H. China’s unconventional oil: A review of its resources and outlook for long-term production. Energy 2015, 82, 31–42. [Google Scholar] [CrossRef]
  2. Council, W.E. World Energy Resources 2016; World Energy Council: London, UK, 2016. [Google Scholar]
  3. Yu, H.; Zhu, Y.; Jin, X.; Liu, H.; Wu, H. Multiscale simulations of shale gas transport in micro/nano-porous shale matrix considering pore structure influence. J. Nat. Gas Sci. Eng. 2019, 64, 28–40. [Google Scholar] [CrossRef]
  4. Li, X.; Zhou, H.; Wang, Y.; Qian, Y.; Yang, S. Thermoeconomic analysis of oil shale retorting processes with gas or solid heat carrier. Energy 2015, 87, 605–614. [Google Scholar] [CrossRef]
  5. Gavrilova, O.; Vilu, R.; Vallner, L. A life cycle environmental impact assessment of oil shale produced and consumed in Estonia. Resour. Conserv. Recycl. 2010, 55, 232–245. [Google Scholar] [CrossRef]
  6. Kang, Z.; Zhao, Y.; Yang, D.; Tian, L.; Li, X. A pilot investigation of pyrolysis from oil and gas extraction from oil shale by In-Situ Superheated Steam Inject. J. Pet. Sci. Eng. 2020, 186, 106785. [Google Scholar] [CrossRef]
  7. Lyu, C.; Yu, H.; Jin, J.; Xu, W.; Huang, H.; Zhang, J.; Wang, Q.; Liu, J.; Jiang, W.; Liu, H.; et al. Multiphysics phase-field modeling for thermal cracking and permeability evolution in oil shale matrix during in-situ conversion process. Int. J. Rock Mech. Min. Sci. 2024, 176, 105720. [Google Scholar] [CrossRef]
  8. Han, X.; Kulaots, I.; Jiang, X.; Suuberg, E.M. Review of oil shale semicoke and its combustion utilization. Fuel 2014, 126, 143–161. [Google Scholar] [CrossRef]
  9. Wang, S.; Jiang, X.; Han, X.; Tong, J. Investigation of Chinese oil shale resources comprehensive utilization performance. Energy 2012, 42, 224–232. [Google Scholar] [CrossRef]
  10. Lai, D.; Zhan, J.H.; Tian, Y.; Gao, S.; Xu, G. Mechanism of kerogen pyrolysis in terms of chemical structure transformation. Fuel 2017, 199, 504–511. [Google Scholar] [CrossRef]
  11. Yu, H.; Chen, J.; Zhu, Y.; Wang, F.; Wu, H. Multiscale transport mechanism of shale gas in micro/nano-pores. Int. J. Heat Mass Transf. 2017, 111, 1172–1180. [Google Scholar] [CrossRef]
  12. Huang, H.; Yu, H.; Xu, W.; Lyu, C.; Micheal, M.; Xu, H.; Liu, H.; Wu, H. A coupled thermo-hydro-mechanical-chemical model for production performance of oil shale reservoirs during in-situ conversion process. Energy 2023, 268, 126700. [Google Scholar] [CrossRef]
  13. Dokhani, V.; Yu, M.; Bloys, B. A wellbore stability model for shale formations: Accounting for strength anisotropy and fluid induced instability. J. Nat. Gas Sci. Eng. 2016, 32, 174–184. [Google Scholar] [CrossRef]
  14. Kibodeaux, K.R. Evolution of porosity, permeability, and fluid saturations during thermal conversion of oil shale. In Proceedings of the SPE Annual Technical Conference and Exhibition, Amsterdam, The Netherlands, 27–29 October 2014; SPE: Richardson, TX, USA, 2014; p. SPE-170733. [Google Scholar]
  15. Okland, D.; Cook, J. Bedding-related borehole instability in high-angle wells. In Proceedings of the SPE/ISRM Rock Mechanics in Petroleum Engineering, Trondheim, Norway, 8–10 July 1998; SPE: Richardson, TX, USA, 1998; p. SPE-47285. [Google Scholar]
  16. Willson, S.; Last, N.; Zoback, M.; Moos, D. Drilling in South America: A wellbore stability approach for complex geologic conditions. In Proceedings of the SPE Latin America and Caribbean Petroleum Engineering Conference, Caracas, Venezuela, 21–23 April 1999; SPE: Richardson, TX, USA, 1999; p. SPE-53940. [Google Scholar]
  17. Wang, L.; Zhao, Y.; Yang, D.; Kang, Z.; Zhao, J. Effect of pyrolysis on oil shale using superheated steam: A case study on the Fushun oil shale, China. Fuel 2019, 253, 1490–1498. [Google Scholar] [CrossRef]
  18. Yu, H.; Fan, J.; Chen, J.; Zhu, Y.; Wu, H. Pressure-dependent transport characteristic of methane gas in slit nanopores. Int. J. Heat Mass Transf. 2018, 123, 657–667. [Google Scholar] [CrossRef]
  19. He, L.; Ma, Y.; Yue, C.; Li, S.; Tang, X. The heating performance and kinetic behaviour of oil shale during microwave pyrolysis. Energy 2022, 244, 123021. [Google Scholar] [CrossRef]
  20. Meier, T.; Rybacki, E.; Reinicke, A.; Dresen, G. Influence of borehole diameter on the formation of borehole breakouts in black shale. Int. J. Rock Mech. Min. Sci. 2013, 62, 74–85. [Google Scholar] [CrossRef]
  21. Nguyen, V.; Abousleiman, Y.; Hoang, S.; Inst, P. Analyses of Wellbore Instability in Drilling Through Chemically Active Fractured Rock Formations: Nahr Umr Shale. In Proceedings of the SPE Middle East Oil and Gas Show and Conference, Sanabis, Bahrain, 11–14 March 2007. [Google Scholar]
  22. Guo, T.; Tang, S.; Sun, J.; Gong, F.; Liu, X.; Qu, Z.; Zhang, W. A coupled thermal-hydraulic-mechanical modeling and evaluation of geothermal extraction in the enhanced geothermal system based on analytic hierarchy process and fuzzy comprehensive evaluation. Appl. Energy 2020, 258, 113981. [Google Scholar] [CrossRef]
  23. Li, S.; Li, X.; Zhang, D. A fully coupled thermo-hydro-mechanical, three-dimensional model for hydraulic stimulation treatments. J. Nat. Gas Sci. Eng. 2016, 34, 64–84. [Google Scholar] [CrossRef]
  24. Wang, X.; Li, P.; Qi, T.; Li, L.; Li, T.; Jin, J.; Lu, D. A framework to model the hydraulic fracturing with thermo-hydro-mechanical coupling based on the variational phase-field approach. Comput. Methods Appl. Mech. Eng. 2023, 417, 116406. [Google Scholar] [CrossRef]
  25. Li, L.C.; Tang, C.A.; Wang, S.Y.; Yu, J. A coupled thermo-hydrologic-mechanical damage model and associated application in a stability analysis on a rock pillar. Tunn. Undergr. Space Technol. 2013, 34, 38–53. [Google Scholar] [CrossRef]
  26. Wei, C.; Zhu, W.; Chen, S.; Ranjith, P.G. A Coupled Thermal–Hydrological–Mechanical Damage Model and Its Numerical Simulations of Damage Evolution in APSE. Materials 2016, 9, 841. [Google Scholar] [CrossRef] [PubMed]
  27. Phan, M.; Meftah, F.; Rigobert, S.; Autuori, P.; Lenglet, C.; Dal Pont, S. A finite element modeling of thermo-hydro-mechanical behavior and numerical simulations of progressing spalling front. Procedia Eng. 2011, 10, 3128–3133. [Google Scholar] [CrossRef]
  28. Forest, S. Micromorphic Approach for Gradient Elasticity, Viscoplasticity, and Damage. J. Eng. Mech. 2009, 135, 117–131. [Google Scholar] [CrossRef]
  29. Zhou, Y.; Rajapakse, R.; Graham, J. A coupled thermoporoelastic model with thermo-osmosis and thermal-filtration. Int. J. Solids Struct. 1998, 35, 4659–4683. [Google Scholar] [CrossRef]
  30. Miehe, C.; Welschinger, F.; Hofacker, M. Thermodynamically consistent phase-field models of fracture: Variational principles and multi-field FE implementations. Int. J. Numer. Methods Eng. 2010, 83, 1273–1311. [Google Scholar] [CrossRef]
  31. Coussy, O. Poromechanics, 2nd ed.; OCLC: Ocm52992889; Wiley: Chichester, UK; Hoboken, NJ, USA, 2004. [Google Scholar]
  32. Peerlings, R.H.J.; De Borst, R.; Brekelmans, W.A.M.; De Vree, J.H.P. Gradient Enhanced Damage for Quasi-Brittle Materials. Int. J. Numer. Methods Eng. 1996, 39, 3391–3403. [Google Scholar] [CrossRef]
  33. de Borst, R.; Verhoosel, C.V. Gradient damage Vs Phase-Field Approaches Fract. Similarities Differ. Comput. Methods Appl. Mech. Eng. 2016, 312, 78–94. [Google Scholar] [CrossRef]
  34. Peerlings, R.H.J.; Massart, T.J.; Geers, M.G.D. A thermodynamically motivated implicit gradient damage framework and its application to brick masonry cracking. Comput. Methods Appl. Mech. Eng. 2004, 193, 3403–3417. [Google Scholar] [CrossRef]
  35. De Vree, J.H.P.; Brekelmans, W.A.M.; van Gils, M. Comparison of nonlocal approaches in continuum damage mechanics. Comput. Struct. 1995, 55, 581–588. [Google Scholar] [CrossRef]
  36. Poh, L.H.; Sun, G. Localizing gradient damage model with decreasing interactions. Int. J. Numer. Methods Eng. 2017, 110, 503–522. [Google Scholar] [CrossRef]
  37. Sarkar, S.; Singh, I.V.; Mishra, B.K. A Thermo-mechanical gradient enhanced damage method for fracture. Comput. Mech. 2020, 66, 1399–1426. [Google Scholar] [CrossRef]
  38. Jiang, C.; Wu, X.; Li, J.; Song, F.; Shao, Y.; Xu, X.; Yan, P. A study of the mechanism of formation and numerical simulations of crack patterns in ceramics subjected to thermal shock. Acta Mater. 2012, 60, 4540–4550. [Google Scholar] [CrossRef]
  39. Gao, Y.; Detournay, E. Contraction and expansion of a cylindrical cavity in an elastoplastic medium: A dislocation-based approach. Int. J. Numer. Anal. Methods Geomech. 2024, 48, 4014–4034. [Google Scholar] [CrossRef]
  40. van den Hoek, P. Prediction of different types of cavity failure using bifurcation theory. In ARMA US Rock Mechanics/Geomechanics Symposium; ARMA: Washington, DC, USA, 2001; p. ARMA-01. Available online: https://onepetro.org/ARMAUSRMS/proceedings-pdf/ARMA01/All-ARMA01/ARMA-01-0045/1889461/arma-01-0045.pdf (accessed on 7 July 2001).
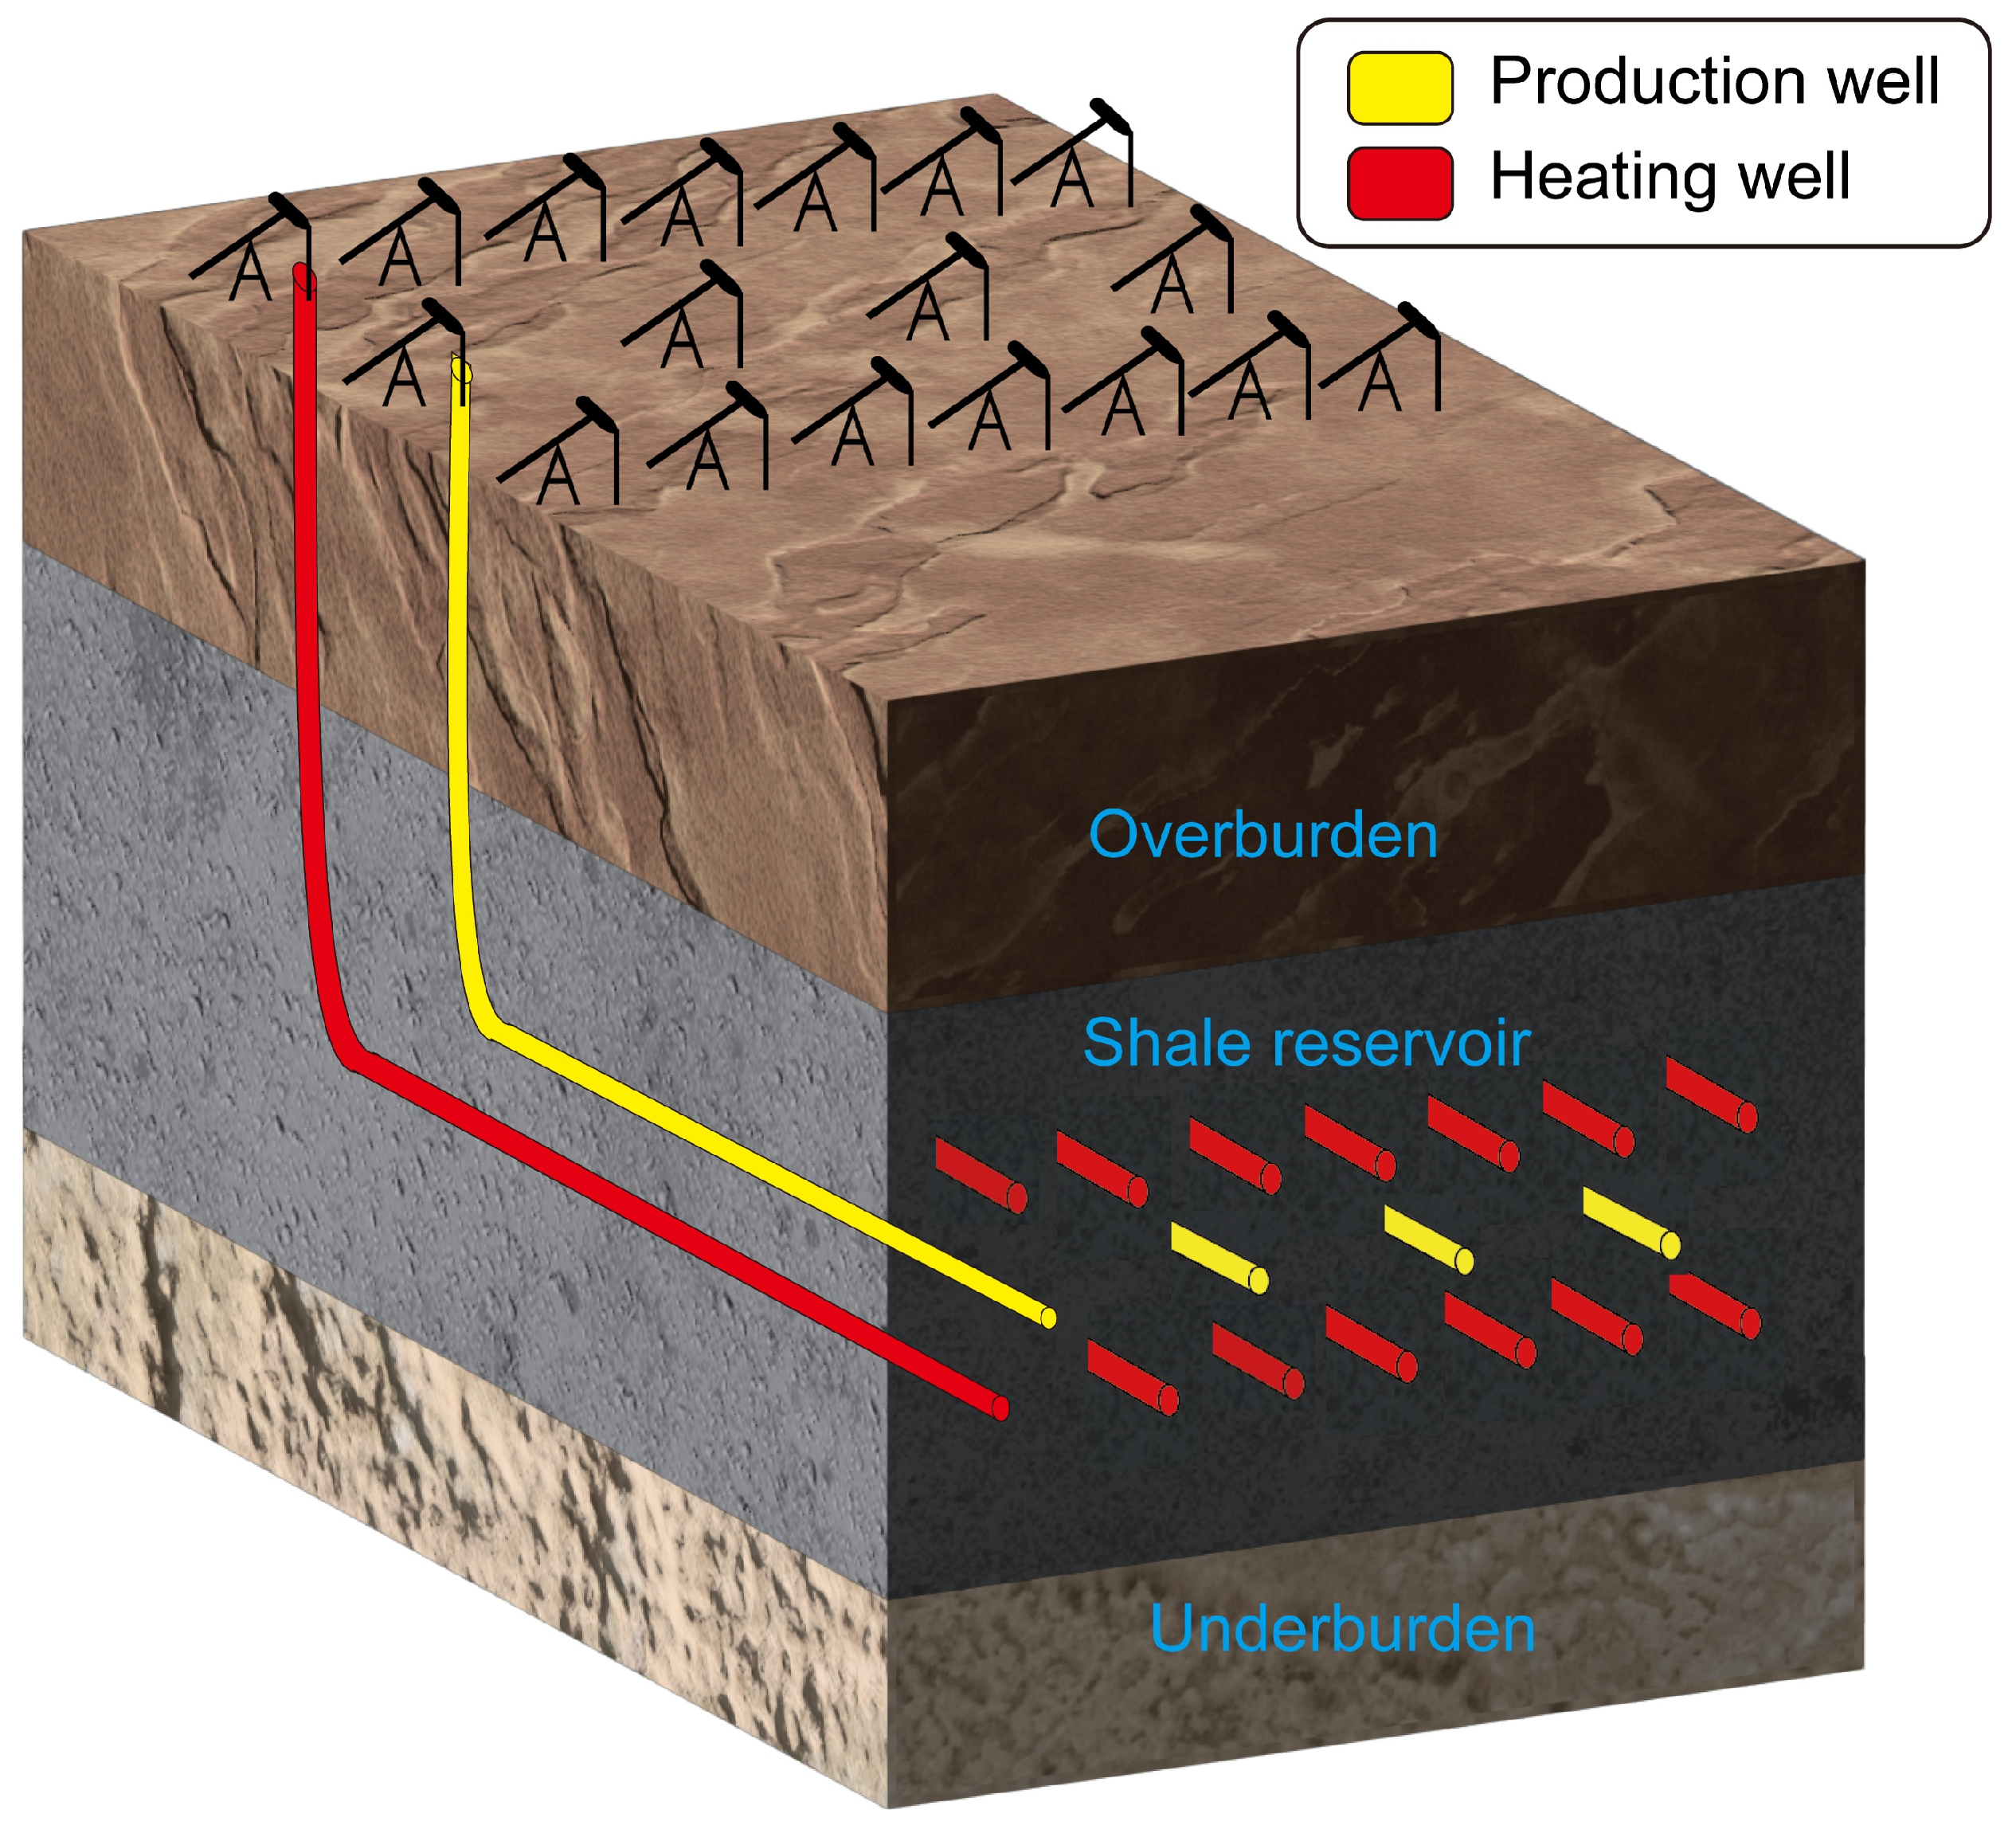
Figure 1. Schematic diagram of well network extraction.
Energies 18 01424 g001
Figure 2. Schematic diagram of in situ conversion.
Energies 18 01424 g002
Figure 3. Flowchart of iteration process.
Energies 18 01424 g003
Figure 4. The geometry and boundary condition of the numerical model for Mandel’s problem.
Energies 18 01424 g004
Figure 5. A comparison between numerical results and analytical results: (a) the dimensionless temperature T ¯ ( ° C ) varying with the longitudinal distance x (m); (b) the dimensionless pressure p ¯ (Pa) varying with the longitudinal distance x (m).
Energies 18 01424 g005
Figure 6. The geometry and boundary condition of the numerical model for the thermal-induced damage of the ceramics plate.
Energies 18 01424 g006
Figure 7. The crack morphology for the thermal-induced damage of the ceramics plate: (a) the experimental results from Jiang et al. [38]; (b) the simulation results obtained from the model.
Energies 18 01424 g007
Figure 8. A comparison of the numerical results and experimental results in crack numbers, crack length, and crack spacing.
Energies 18 01424 g008
Figure 9. The model of a single well.
Energies 18 01424 g009
Figure 10. The damage morphology under different in situ stresses. (a) S v = 10 MPa ,   S h = 10 MPa . (b) S v = 10 MPa ,   S h = 7.5 MPa . (c) S v = 10 MPa ,   S h = 5 MPa . (d) S v = 10 MPa ,   S h = 2.5 MPa . (e) S v = 15 MPa ,   S h = 15 MPa . (f) S v = 15 MPa ,   S h = 12.5 MPa . (g) S v = 15 MPa ,   S h = 10 MPa . (h) S v = 15 MPa ,   S h = 7.5 MPa .
Energies 18 01424 g010
Figure 11. Polar coordinate diagram of von Mises stress around single well under different in situ stresses.
Energies 18 01424 g011
Figure 12. The damage morphology under different heating rates: (a) 380   ° C / h . (b) 190   ° C / h . (c) 95   ° C / h . (d) Damage area ratio.
Energies 18 01424 g012
Figure 13. The damage morphology under different heating temperatures: (a) 400   ° C . (b) 500   ° C . (c) 600   ° C . (d) Damage area ratio.
Energies 18 01424 g013
Figure 14. Damage evolution around single heating well without casing and cement sheath: (a) 900 s. (b) 1800 s. (c) 2700 s. (d) 3600 s.
Energies 18 01424 g014
Figure 15. Experimental results of damage caused by hydrostatic pressure from Meier et al. [20].
Energies 18 01424 g015
Figure 16. The von Mises stress variation of the selected points.
Energies 18 01424 g016
Figure 17. Damage evolution around single heating well: (a) 1800 s. (b) 2250 s. (c) 2700 s. (d) 3600 s.
Energies 18 01424 g017
Figure 18. The von Mises stress variation of the selected points.
Energies 18 01424 g018
Figure 19. The damage morphology around a single heating well with different cement sheath thicknesses: (a) 25 mm. (b) 50 mm. (c) 75 mm. (d) Damage area ratio.
Energies 18 01424 g019
Figure 20. Schematic diagram of well network model.
Energies 18 01424 g020
Figure 21. Damage area of well network model with different extraction pressures: (a) −4 MPa. (b) −3 MPa. (c) Reservoir temperature distribution in 180 days. (d) −2 MPa. (e) −1 MPa. (f) Damage area ratio.
Energies 18 01424 g021
Figure 22. Pressure evolution of reservoir: (a) 45 days. (b) 90 days. (c) 135 days. (d) 180 days.
Energies 18 01424 g022
Figure 23. Analysis of reservoir subsidence: (a) 0 MPa. (b) −1 MPa. (c) −2 MPa. (d) −4 MPa.
Energies 18 01424 g023
Table 1. Parameters used in simulation of thermal-induced damage.
ParameterSymbolUnitValue
Young’s modulusEGPa370
Poisson’s rate ν - 0.3
Uniaxial tensile strength f t MPa180
Thermal expansion coefficient α K 1 7.5 × 10 6
Density ρ kg / m 3 3980
Specific heatC J / ( kg · K ) 880
Thermal conductivityk W / ( m · K ) 31
Table 2. Parameters used in simulations of single-well model.
ParameterSymbolUnitValue
Initial temperature T 0 GPa20
Young’s modulus of shale E r GPa30
Young’s modulus of cement E c GPa 12.5
Young’s modulus of steel E s GPa205
Poisson ratio of shale ν r - 0.3
Poisson ratio of cement ν c - 0.2
Poisson ratio of steel ν s - 0.28
Shale density ρ r kg / m 3 2450
Cement density ρ c kg / m 3 2300
Steel density ρ s kg / m 3 7850
Heat capacity of shale k r J / ( kg · K ) 880
Heat capacity of cement k c J / ( kg · K ) 880
Heat capacity of steel k s J / ( kg · K ) 475
Disclaimer/Publisher’s Note: The statements, opinions and data contained in all publications are solely those of the individual author(s) and contributor(s) and not of MDPI and/or the editor(s). MDPI and/or the editor(s) disclaim responsibility for any injury to people or property resulting from any ideas, methods, instructions or products referred to in the content.