Abstract
Permanent storage in suitable geological sites and/or deep aquifers is emerging as the most concrete and effective solution to mitigate its increasing concentration in the atmosphere. This article experimentally investigated its storage in deep marine environments in the form of hydrates. Gas hydrates were formed into a small-scale reactor, designed to reproduce marine seafloors. Hydrates were formed with pure carbon dioxide and with CO2-based gaseous mixture containing nitrogen at different concentrations, equal, respectively, to 30, 50 and 60 vol%. The results obtained for each mixture were then compared to each other. In particular, the quantity of hydrates formed was evaluated as a function of the thermodynamic conditions selected for the experiments. The energy spent for the process, calculated by considering the cooling and compression phases, was calculated for the unit quantity of hydrates formed and for the unit quantity of carbon dioxide stored. Finally, the energy requirements for gas cooling and for gas compression were calculated separately in order to comprehend the contribution of the single process for each mixture.
1. Introduction
The climate change is likely the most serious issue to solve due to its huge impact on the Earth’s ecosystems. The recent alarming increase in its rise depends on the human emissions of greenhouse gases (GHGs). Based on their origin, GHG emissions are classified in scope from one to three [1]. Scope 1 is referred to as “Direct emissions” and includes the emissions produced during the hydrocarbon’s extraction/fuel and chemical production activities [2]. Scope 2 means “Indirect emissions”; similarly to Scope 1, it encompasses the production process but refers to the emissions related to the supplementary elements, such us the producers of electricity then used in oil plants [3]. Finally, Scope 3 groups the emission-derived activities linked to the fuel/chemical producers [4].
In order to counteract climate change, the usage of energy sources, the intensification of processes and the improvement of process efficiency are key factors. However, by themselves, these strategies are not enough to reach the fixed containment of GHG emissions [5]. Therefore, the adoption of carbon capture, utilization and storage technologies is gaining growing interest as climate change mitigation strategy [6]. It is likely that the most promising and viable option for CCUS consists in the geological storage of carbon dioxide in suitable sites, where its long-period disposal is ensured [7]. Based on the typology of area selected for the geological storage of carbon dioxide, three different solutions are possible: onshore, offshore and oceanic [8]. Suitable sites for CO2 geo-storage are deep saline aquifers, exhausted oil and gas reservoirs, unmineable coal seams and basaltic formations [9]. Saline aquifers, depleted oil and gas reservoirs and unmineable coal seams are commonly referred to as underground CO2 storage options [10]. Carbon dioxide (or directly CO2-based mixtures) is first converted from gas to liquid and then injected into these geological formations [11].
The term “saline aquifers” refers to porous and permeable rocks, filled with saline fluids capable to fit the free space within pores and fractures [12]. These geological sites are normally 800–3000 m deep to ensure the permanence of carbon dioxide in its supercritical state [13], thus optimizing storage efficiency. With time, carbon dioxide molecules react with the surrounding minerals and with water, producing new solid materials, which further reduce the risk of failures [14].
The main advantage of exploiting exhausted oil and gas reservoirs is that their suitability for the scope has been already widely tested and proven due to their capability of previously hosting hydrocarbon mixtures for thousands of years [15]. The storage of carbon dioxide in this type of reservoir is particularly attractive since it could help to extend their oil/gas producing life, with consequent lower operative overall costs.
Similarly, unmineable coal reservoirs have suitable characteristics to host and trap, for relatively long periods, carbon dioxide [16]. These sediments are often rich in methane; since carbon dioxide has a stronger adsorption affinity for coal, its capture allows for partially recovering the amount of methane contained in them (the so-called CO2-enhanced coalbed methane production process) [17].
Basaltic formations are extremely attractive for the geological storage of carbon dioxide: when carbon dioxide molecules enter in contact with this typology of igneous rock, they react with the present elements to form minerals such as calcite, siderite and magnesite [18]. The process is known as “mineral carbonation” and allows for permanent storage of carbon dioxide in solid form.
The oceanic storage of carbon dioxide is based on the natural cycle of carbon and the role of sink which oceans naturally assume [19]. Water is capable to adsorb relatively high quantity of carbon dioxide per unit of mass; the main limiting factors are the risk of causing excessive localized acidification of water and the release of CO2 from water to the atmosphere [20,21].
However, the storage of carbon dioxide in the oceanic environment can be advantageously carried out via production of gas hydrates [22]. Such solution could help in both reducing the localized acidification of water and avoiding the partial escaping of the injected carbon dioxide.
Gas hydrates consist of non-stoichiometric and ice-like structures, where gas molecules are trapped within crystalline cages formed by hydrogen-bonded water molecules [23]. Several gaseous species can form hydrates; among them are carbon dioxide and nitrogen [24,25]. Within these structures, the gas species establishes van Der Waals bonds with water molecules. The energy required to break van Der Waals bonds is equal to 0.3 kcal/mol, a negligible quantity if compared with the energy required to break hydrogen bonds, equal to 5 kcal/mol [26].
The capture and storage of carbon dioxide in the form of hydrates in deep oceans is considered to be one of the most promising options in the field of CCUS. Deep oceans present suitable thermodynamic conditions for the production of hydrates; moreover, these structures have self-protective properties which make the CO2 storage process safer than that used for inland aquifers [27]. In fact, possible CO2 failures would be almost completely adsorbed by the surrounding seawater and the accidental emissions in the atmosphere would be negligible [28]. Based on their own depth, the sites suitable for CO2-hydrate storage are classified into three groups: shallow seafloor (less than 300 m), deep seafloor (300–700 m) and ultra-deep seafloor (over 700 m) [29]. Greater depths enhance storage efficiency but also lead to higher processing costs.
This study examines the storage of carbon dioxide in a marine reservoir which, for the scope, is reproduced into a lab-scale reactor. The storage capacity is defined by considering the quantity of carbon dioxide stored per unit of gas injected. To define the process efficiency, the energy spent per molar unit of CO2 stored is calculated. The same considerations are made and proposed for CO2/N2 mixtures, with concentrations equal to 70/30, 50/50 and 40/60 vol%. These mixtures are used to approximate flue gas mixtures [30,31,32]. Despite the lower CO2 content, the usage of these mixtures allows avoiding pretreatments aimed for CO2 purification and their related costs. Moreover, the presence of N2 in the hydrate lattice could help in improving overall structural stability.
2. Role of Porous Sediments and Process Kinetics
The present study is focused on the thermodynamics of the process, with particular attention on the quantity of energy required for the production of hydrates and mostly per mass unit of CO2 captured. However, to globally define the feasibility of the process, further aspects need to be investigated. In particular, the properties of sediments (size, permeability, porosity and composition) and the kinetics of hydrate formation must be considered. While the experimental investigation of those variables is demanded of future studies, here, a brief description of the state of the art is provided.
According to the most accredited theories explaining the hydrate nucleation process (or the Labile Cluster Theory [33] and the Local Structuring Theory [34]), the time required for the production of hydrate nuclei is strongly dependent on the probability that labile clusters have to form and grow (this latter probability is connected to the collision between adjacent hydrate nuclei diffused in the aqueous phase). The diffusion of gas molecules within the hosting sediment is therefore crucial for the process. In this regard, the sediment ensures the existence of numerous gas–liquid interfaces where the intimate contact between water and gas molecules is possible; moreover, it represents a source of “nucleation sites”, mainly due to the roughness of surfaces and to the presence of impurities [35,36]. A great number of experimental and simulation studies were produced in the recent years to accurately define the role of sediment on the production of gas hydrates [37,38,39]; according to these research works, the main properties of sediments affecting the diffusion of gas molecules are permeability and porosity, while the promotion/inhibition of the formation process is mainly dominated by the morphology and chemical composition of grains.
Also, the typology of the gas source intervenes with the morphology of the hydrate core: segregated gas sources lead to the formation of hydrates in massive, nodular, vein and bedded morphologies [40,41,42], while diffused and limited quantities of gas allow for the production of grain-enveloping, pore-spacing, cementing and frame-supporting morphologies [43,44,45].
The production of gas hydrates can be carried out with four possible strategies [40]:
- (1)
- mixed sample preparation;
- (2)
- excess gas;
- (3)
- excess water;
- (4)
- dissolved gas method.
The mixed sample preparation consists in producing the hydrates in a pressurized tank and then mixing them with the sediment, thus obtaining the hydrate-bearing sediment [46]. The excess gas method is the injection of gas into a preexisting mixture of water/ice and sediments [47]. The excess water method is similar to the excess gas one, but pore gas is replaced with pore water [48,49]. The dissolved gas method is based on injecting the gas species within the pore spaces of a fully saturated sediment [50,51].
Excess gas and excess water methods lead to the production of grain-enveloping morphologies [52], while the mixed sample preparation and the dissolved gas methods result in the production of pore-spacing and frame-supporting morphologies [53], even if higher saturation levels are required for this second kind of morphology [54].
Naturally occurring hydrate deposits are discovered in a broad range of different sediments: medium, fine and very fine sand, coarse silt and gravel [55]. The hydrate saturation level is commonly higher in coarser sediments than in fine sand [56]. Similarly, the saturation level is found to be higher in sandy layers than in the muddy layers [57].
The grain size and surface area of sediments are the main elements affecting the saturation level [58]. Moreover, the efficiency of hydrate formation is proportional to the gas saturation degree [58]. For that reason, at least 90% of naturally occurring hydrate reservoirs are discovered in fine-grained sediments, currently referred to as the most viable option for the new production of gas hydrates [58].
In addition to the hosting sediments and their physical and chemical properties, the kinetics of carbon dioxide hydrate formation and dissociation is crucial for the definition of injectivity of CO2 injection wells [59]. Regions showing faster growth rate of hydrates may hinder the injectivity of CO2 in the more in-depth layers of the sediment. To correctly establish the growth rate, the induction period must be carefully considered.
The initial nucleation phase consists of the random and spontaneous formation of primordial nuclei of hydrates. These clusters are not stable and their presence in the aqueous phase is thermodynamically unfavored, undergoing inevitable dissociation. However, the collisions with surrounding nuclei lead to the growth of these nuclei. The process is obviously highly stochastic and continues until some of these nuclei reach the so-called “critical size”, after that the growing process does not need collision with other entities and is thermodynamically favored (Gibbs free energy lower than zero) [60,61]. The time required for this process is known as induction time, or the time elapsed until the production of a detectable quantity of hydrates [61]. In the literature, induction time is also indicated as the time needed to overcome the metastable region [62]. Wang and colleagues affirmed that induction time ends when a visible (or quantifiable) amount of hydrates is produced [63]. More in general, induction time can vary significantly from experiment to experiment, even if the same procedure is used for the production of hydrates [64].
3. Materials and Methods
3.1. Experimental Apparatus
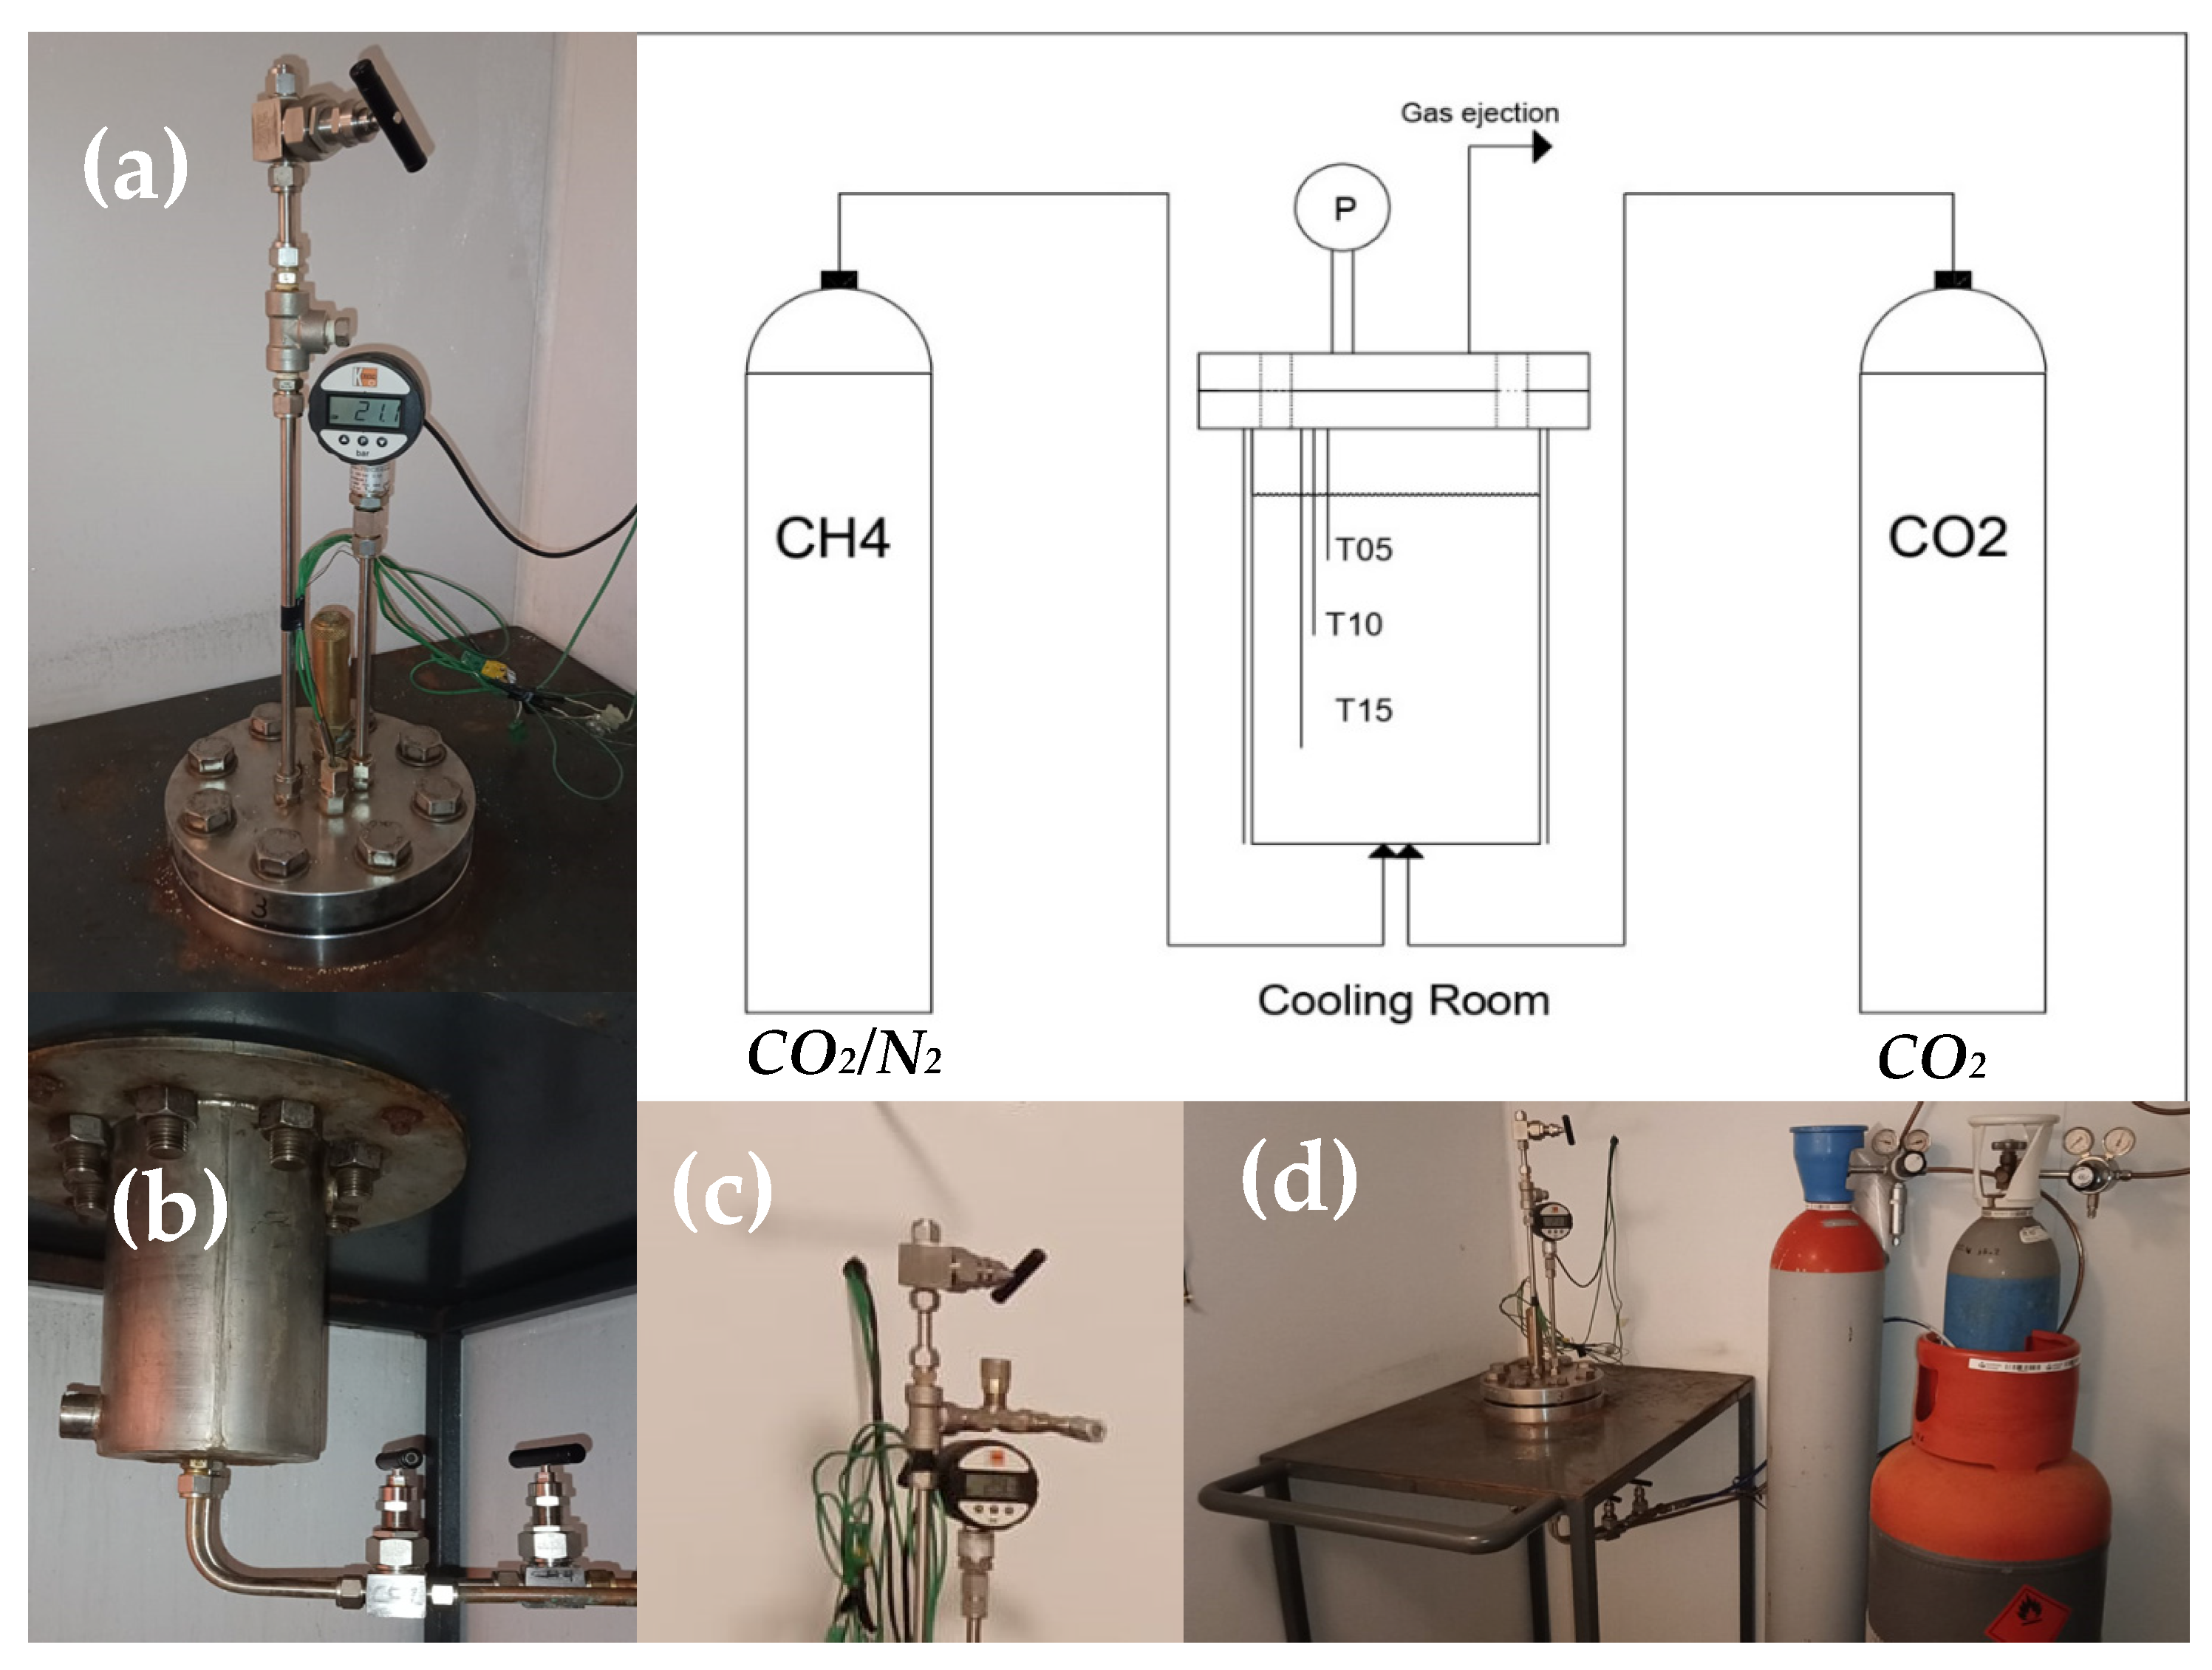
The experiments were conducted in a lab-scale apparatus, appositely designed to reproduce marine seafloors and deep oceanic sediments. It is entirely made in 316SS and has internal volume equal to 1000 cm3. The reactor is directly connected with the pure CO2 and CO2/N2 cylinders. Both reactor and cylinders are positioned within a cooling room. The whole apparatus is described in the scheme of Figure 1.
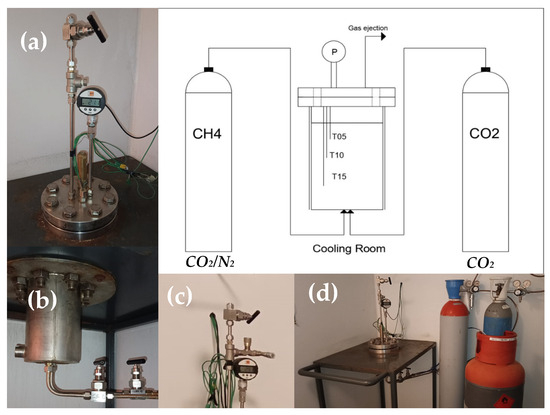
Figure 1.
Scheme of the lab-scale apparatus and its main details: (a) superior flange equipped with temperature and pressor sensors; (b) connection between reactor and cylinders (sited on the bottom); (c) channel used for gas ejection and for taking samples; (d) acquisition system.
The flange allows the fast and easy extraction of solid hydrate samples when necessary. Its tightness depends on a spiro-metallic gasket (DN8U PN10/40 316-FG C8 OR), positioned between the two plates. The pressure is monitored with a digital manometer, model MAN-SD (by Kobold), with class accuracy equal to ±0.5% of full scale. The measures of temperature are carried out with three Type K thermocouples (class accuracy 1, by TC Direct), positioned at different depths in the reactor (respectively, at 5, 10 and 15 cm from the upper flange). The gas ejection channel is designed for both the complete ejection of the gaseous phase present within the reactor and the extraction of small gas samples. For this latter scope, a pressure reducer allows for a small quantity of gas to flow in a secondary tiny volume, at pressure slightly higher than the room value. This secondary volume ends with a porous septum. The present apparatus was already used in previous experimentations; therefore, more technical and geometrical details of it can be found elsewhere in the literature [65,66].
3.2. Materials
In order to reproduce marine sediments, the reactor was filled with porous quartz sand and demineralized water. In detail, 744 cm3 of sand and 236 cm3 of water were inserted within the reactor. The specific weight of sand is equal to 2.45–2.5 kg/dm3, while the average porosity of sand was measured with a porosimeter (model Thermo Scientific Pascal 140, by Thermo Fisher Scientific, Milan, Italy) and was equal to 34%. Pure carbon dioxide and CO2/N2 mixtures were used for the experimentation. The gas cylinders (provided by Air Liquide, Milan, Italy) had a purity degree equal to 99.97%. For the mixtures, three different concentrations were tested: CO2/N2 (40/60) vol%; CO2/N2 (50/50) vol% and CO2/N2 (70/30) vol%.
3.3. Experimental Procedure
The experimental section of this work consists of sixteen experiments, equally divided between the four different gas mixtures considered (pure CO2 and the three CO2/N2 concentrations). The formation of hydrates was carried out according to previous and validated research works [67]. In order to maximize the production of hydrates and to better simulate the field conditions, the experiments were carried out in excess of water. The guest species was injected within the reactor at temperatures elevated enough to avoid the production of hydrates during such a phase. After injection, the cooling room was activated and the temperature was gradually lowered, until approaching the freezing point of water. However, it was always kept slightly above such a condition, to avoid the internal competition between ice and hydrates [68]. Temperature and pressure were constantly monitored during each test. Once the formation process was completed and measured, hydrates were completely melted and the gas phase was ejected. The dissociation of hydrates was performed to cancel out the capability of the system to retain the memory of previous formations of hydrates [69,70,71]. The moles of hydrates formed during experiments were calculated using Equation (1):
where
- -
- VPORE [cm3]: internal volume available for the production of hydrates;
- -
- Z: compressibility factor, calculated with the Peng–Robinson Equation;
- -
- ρHYD: ideal molar density of hydrates; equal to 0.91 g/cm3 [72,73].
Pressure and temperature were indicated with “P” [MPa] and “T” [K], while the beginning and ending of hydrate formation were indicated with subscripts “i” and “f”.
The composition of the gaseous phase captured into hydrates was detected via gas-chromatographic analyses. For the scope, a gas-chromatograph, model VARIAN CP 4900 Micro-GC, was used. In detail, the content in carbon dioxide was measured with the column Poraplot PPU, where He was used as carrier gas.
The energy required for cooling the system was calculated by considering the following aspects:
- -
- specific heat equal to 0.83 kJ/kgK for the porous quartz sediment;
- -
- specific heat equal to 0.86 kJ/kgK for pure carbon dioxide;
- -
- for the binary CO2/N2 mixtures, the following values were considered: 0.98 kJ/kgK for (70/30) vol%, 1.00 kJ/kgK for (50/50) vol% and 1.01 kJ/kgK for (40/60) vol%.
The energy spent on gas pressurization was calculated by considering three-stage adiabatic compression with intercooling.
4. Results
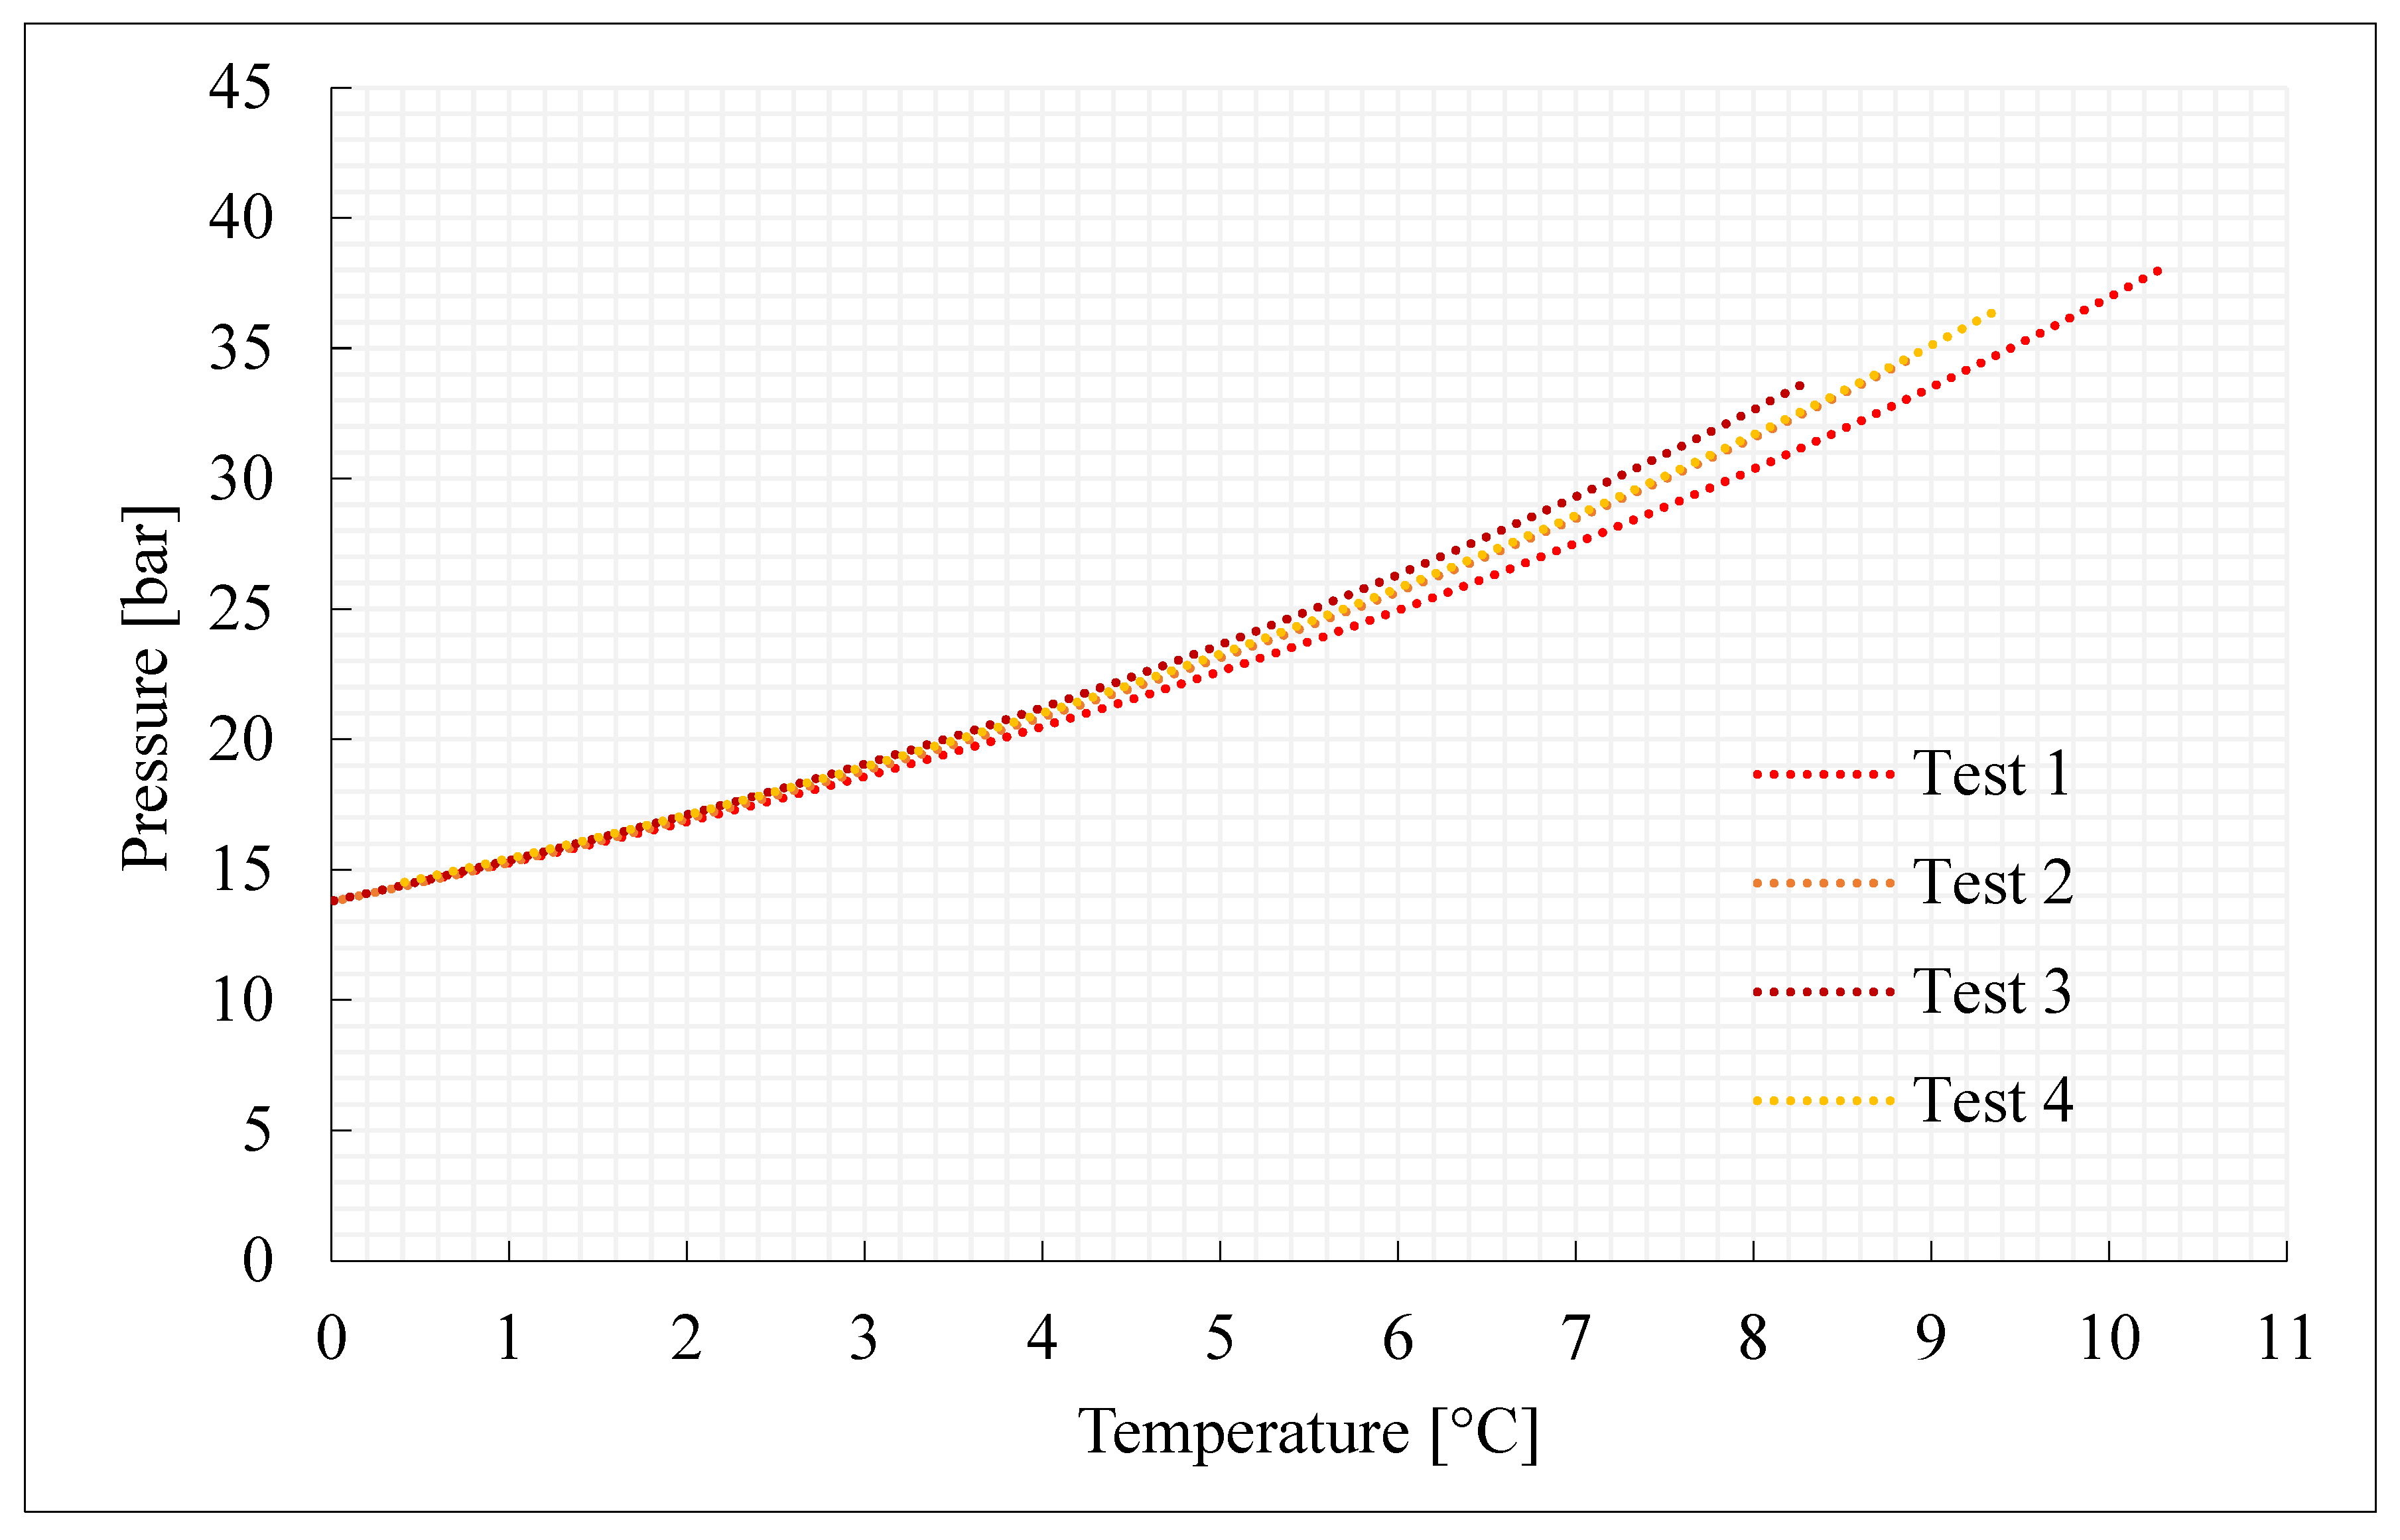
This section characterizes the production of pure CO2 and CO2/N2 hydrates, with the concentrations indicated in Section 3.2 and further shown in Table 1. For each mixture considered, four experiments were carried out. Figure 2, Figure 3, Figure 4 and Figure 5 describe the pressure–temperature evolution of each test. In particular, each figure refers to a specific mixture. Table 1 resumes, for all the experiments, the moles of gas injected within the reactor, the moles of hydrates formed and the time required to complete the experiment.

Table 1.
The table indicates, for each test, the moles of gas injected within the reactor (nCO2inj or nCO2/N2inj), the moles of hydrates produced (nHYD) and the time required to complete the experiment.
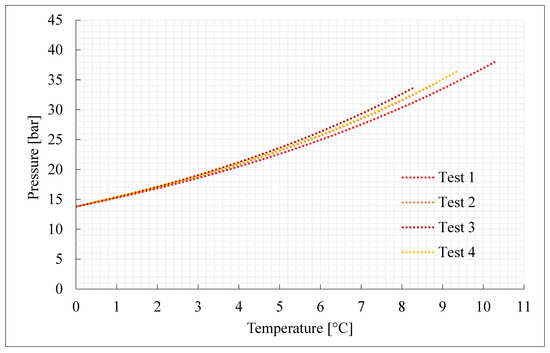
Figure 2.
Thermodynamic evolution of Tests 1–4, carried out with pure carbon dioxide.

Figure 3.
Thermodynamic evolution of Tests 5–8, carried out with the CO2/N2 (70/30) vol% mixture.

Figure 4.
Thermodynamic evolution of Tests 9–12, carried out with the CO2/N2 (50/50) vol% mixture.
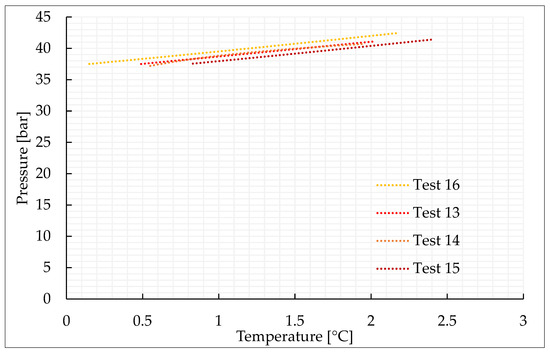
Figure 5.
Thermodynamic evolution of Tests 13–16, carried out with the CO2/N2 (40/60) vol% mixture.
As expected, the addition of nitrogen made the thermodynamic conditions required for the formation process more severe and led to a lower production of hydrates. The conditions are characterized by the greater difficulties in capturing nitrogen molecules into water cages [74,75,76]. Due to its relatively small size, the molecule of nitrogen preferentially occupies the small cavity of Structure II, or the pentagonal dodecahedron. This type of cavity is present also in sI; however, in this latter cavity, its mean diameter is equal to 3.95 Å, while in sII it is 3.91 Å. Consequently, when pure nitrogen is occupied, the cage occupancy is higher in sII than in sI. Conversely, carbon dioxide molecules naturally form sI. In this type of structure, they preferentially occupy the large tetrakaidekahedral cages, where the cage occupancy is the highest possible for this kind of molecule, or 0.834 [77]. However, CO2 molecules can easily fit the larger hexakaidecahedral cavities of sII. Therefore, in presence of a certain concentration of nitrogen, the mixture can lead to production of sII hydrates, containing at the same time nitrogen molecules in the small 512 cavities and carbon dioxide molecules in the large 51264 cavities. Moreover, the simultaneous capture of both the species allows achieving higher cage filling ratios, with the consequent higher stability of the whole hydrate lattice. In the unit cell of sII, the number of small-size cavities equals the number of large-size cavities. Such condition explains why, even if the pressure–temperature conditions gradually became more severe with the increasing concentration of nitrogen in the gaseous mixture, there is no substantial difference, in terms of forming conditions, between tests carried out with 70/30 vol% and 50/50 vol% CO2/N2 binary mixtures, while those required for the 40/60 vol% mixtures significantly differ.
Figure 6 shows the moles of hydrates formed for each mixture tested, while Figure 7 illustrates the connection between moles of the mixture injected in the reactor and the moles of hydrates formed.
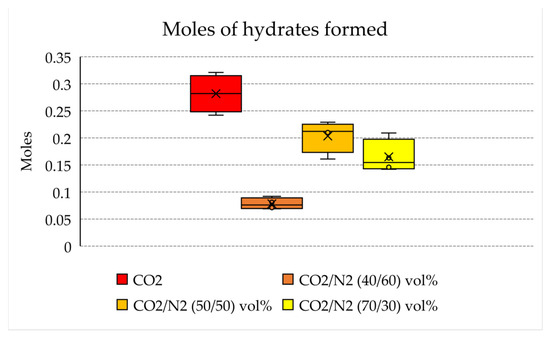
Figure 6.
Moles of hydrates formed in each test.
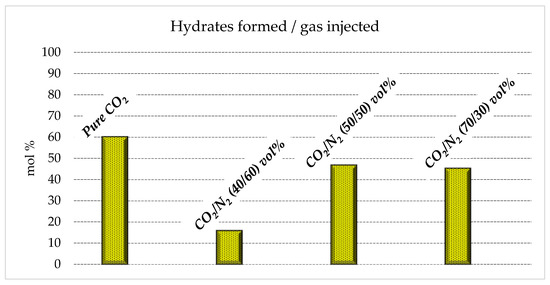
Figure 7.
Moles of hydrates formed as a function of the quantity of gas initially injected in the reactor.
With the aim of storing as much carbon dioxide as possible, producing an abundant quantity of hydrates is crucial. The results shown in Table 1 confirm that the quantity of hydrates produced with the 70/30 and 50/50 vol% mixtures (0.14–021 and 0.16–0.23 moles, respectively) is not excessively far from that obtained with pure carbon dioxide (0.24–0.32 moles). Conversely, with the 40/60 vol% mixture, only 0.07–0.10 moles of hydrates were produced. This means that this latter mixture cannot be considered for effective CO2 storage, while the other mixture, with a higher content in carbon dioxide, is a possible candidate.
4.1. Energy Spent per Unit of Hydrate Formed
The quantity of energy spent during the formation of hydrates was calculated according to Section 2: for each material present within the reactor, the corresponding quantity and specific heat were considered. To calculate the energy spent for cooling the system and for pressurizing the gas phase, the pressure increase and the temperature drop were measured.
The energy spent per unit of hydrate formed is indicated in Table 2 and plotted in Figure 8, where the variability in values measured for each group of tests is shown.
Table 2.
Energy spent for the production of hydrates with the different mixtures tested. From left to right: tests 1–4 for pure CO2, tests 5–8 for CO2/N2 (70/30) vol%, tests 9–12 for CO2/N2 (50/50) vol% and tests 13–16 for CO2/N2 (40/60) vol%.

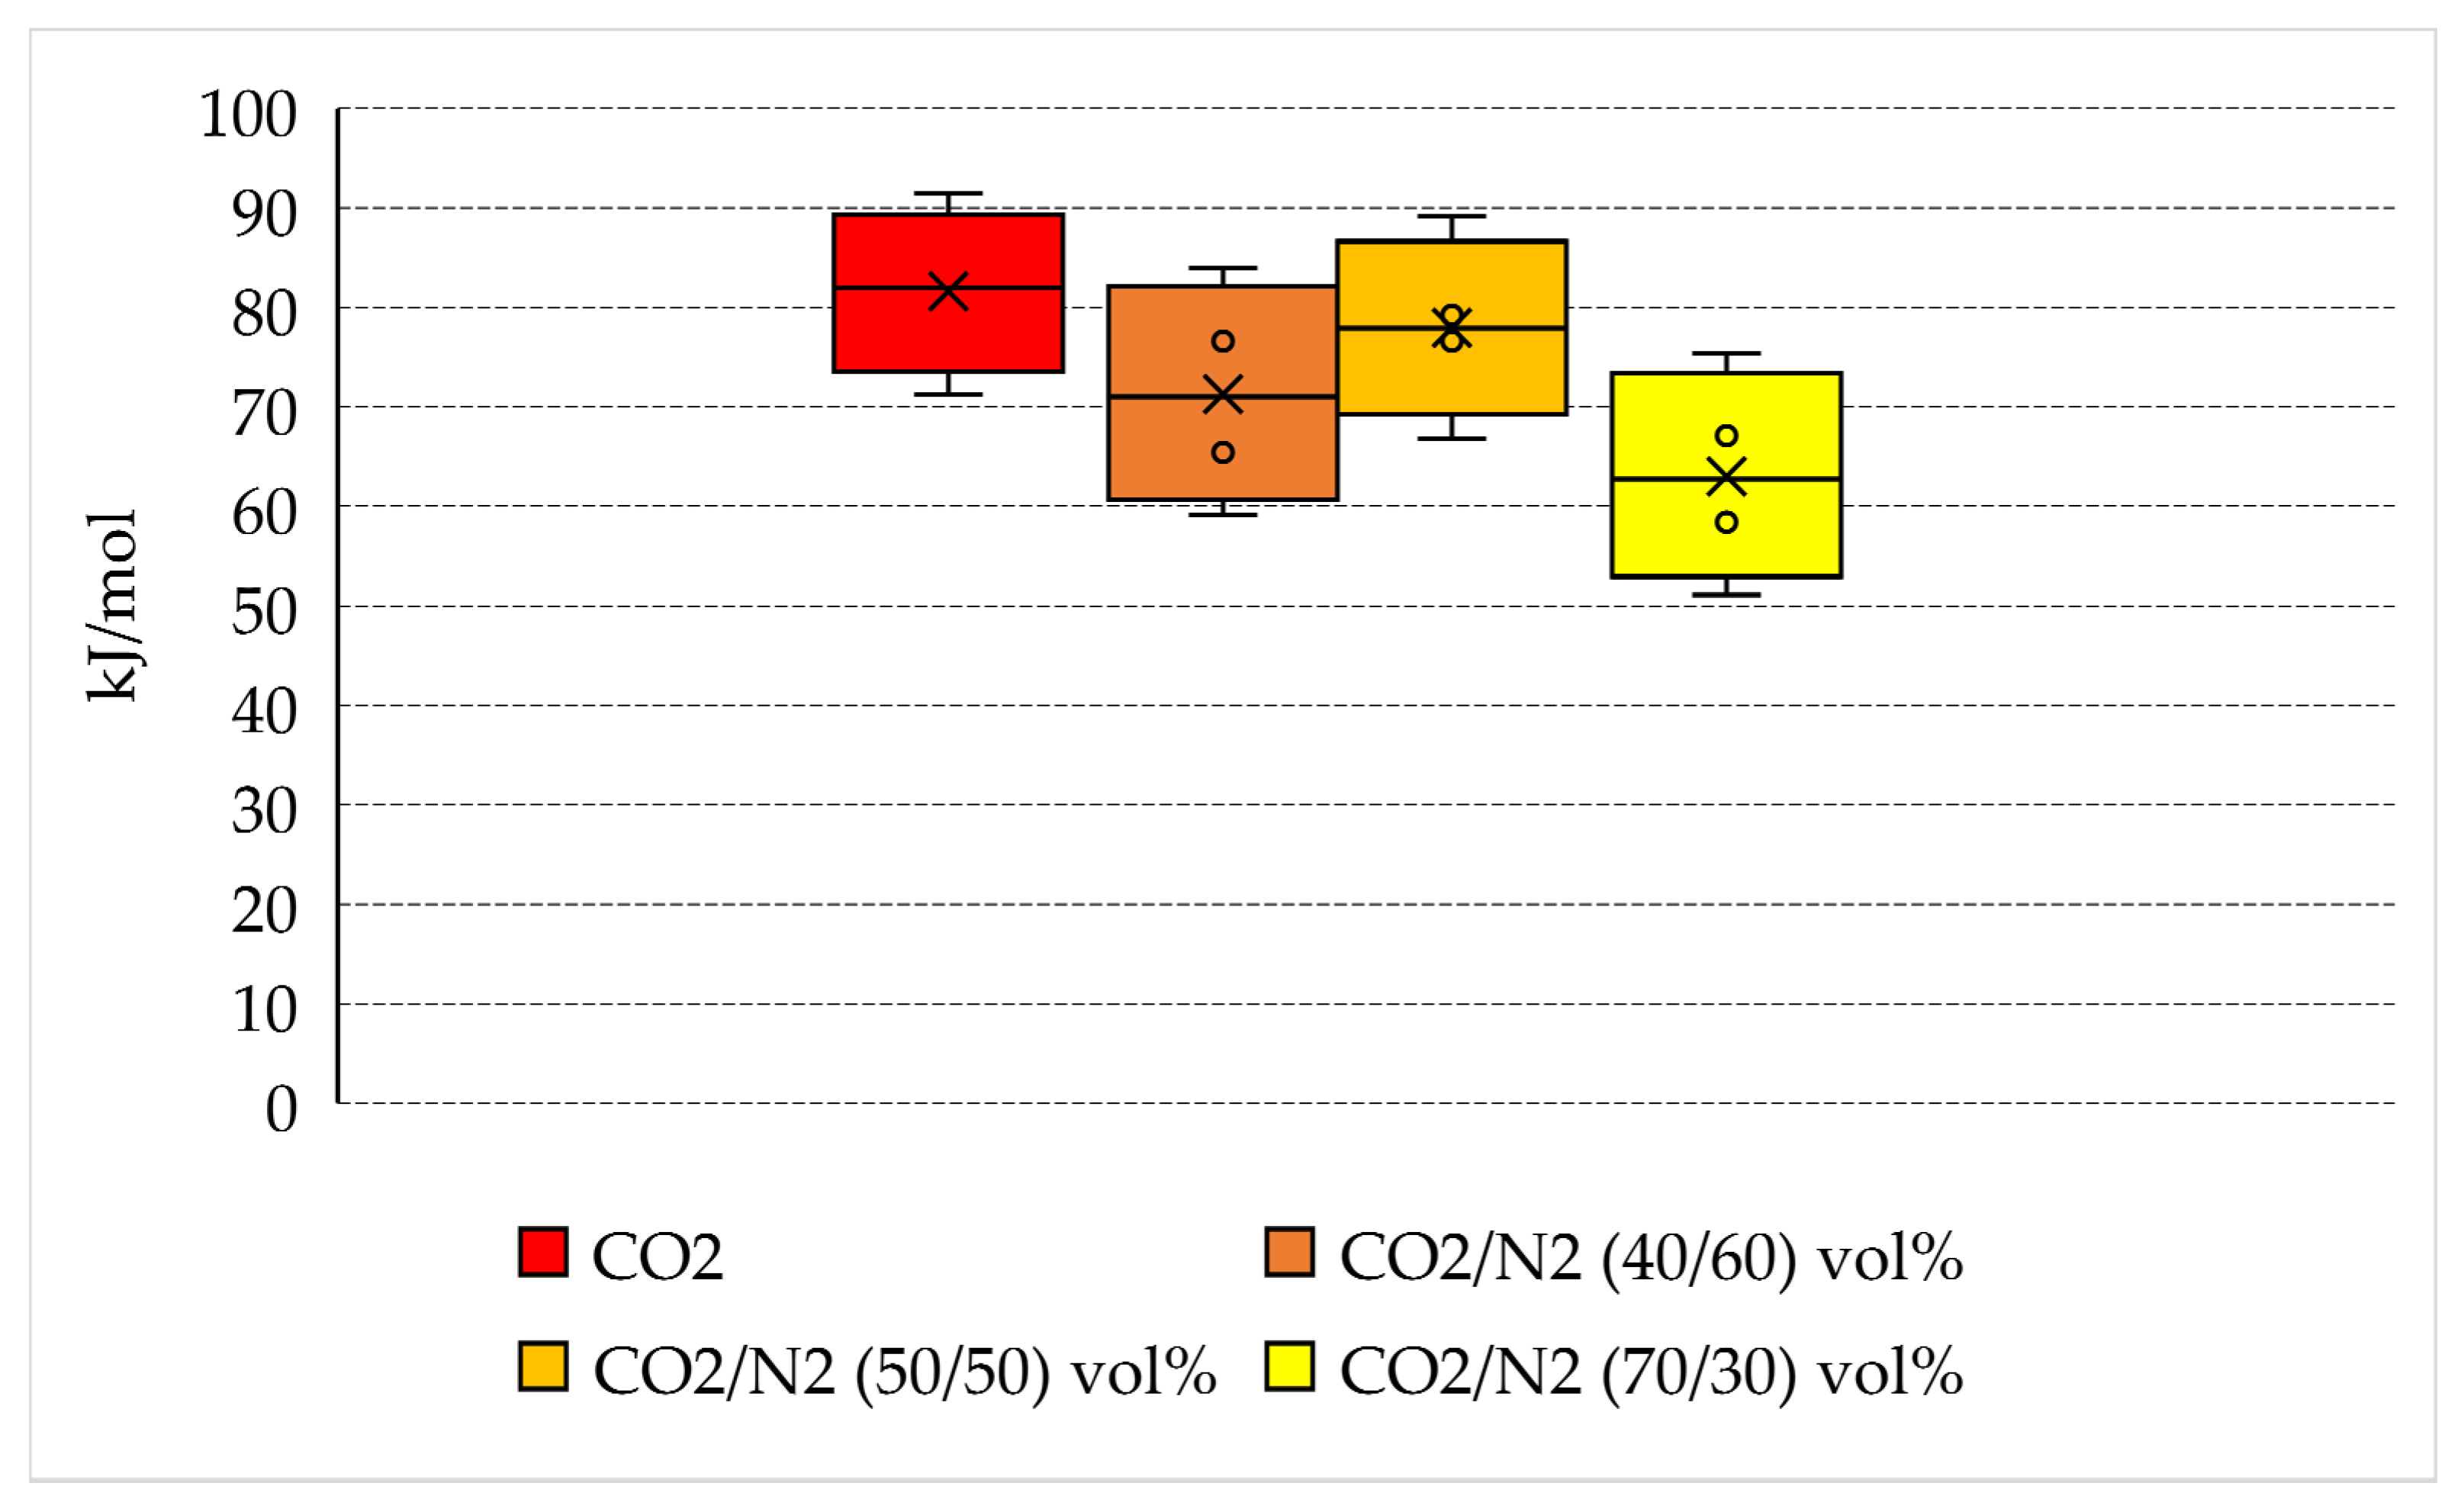
Figure 8.
Energy spent per unit of hydrate formed and variability of quantities measured for each group of tests.
Pure carbon dioxide requires more energy to form hydrates than N2-containing mixtures: 71.2–91.4 kJ/mol, with a mean quantity equal to 81.6 kJ/mol. However, there are no marked differences between pure CO2 and the 50/50 vol% and 40/60 vol% mixtures, whose corresponding mean energy spent per mole of hydrate formed is equal to 77.9 and 71.3 kJ/mol, respectively. The only relevant difference is observed for the 70/30 vol% mixture, which requires a lower amount of energy to form hydrates: from 51.1 to 75.4 kJ/mol, with a mean value equal to 63 kJ/mol.
Based on the results collected in this section and considering the further purification step required for the production of pure carbon dioxide, the N2-containing mixtures represents a preferable option to minimize the costs related to the production of hydrates.
4.2. Energy Spent per Unit of CO2 Captured into Hydrates
The main aim of the present research is to define whether the usage of N2-containing mixture allows minimization of the consumption of energy needed for the capture and permanent storage of carbon dioxide. Therefore, in this section, the quantity of energy spent per unit of CO2 captured into hydrates was quantified. The calculated values are shown in Table 3 and plotted in Figure 9, where the variability in values measured for each group of tests is shown.
Table 3.
Energy spent per unit of CO2 stored in form of hydrates. From left to right: tests 1–4 for pure CO2, tests 5–8 for CO2/N2 (70/30) vol%, tests 9–12 for CO2/N2 (50/50) vol% and tests 13–16 for CO2/N2 (40/60) vol%.

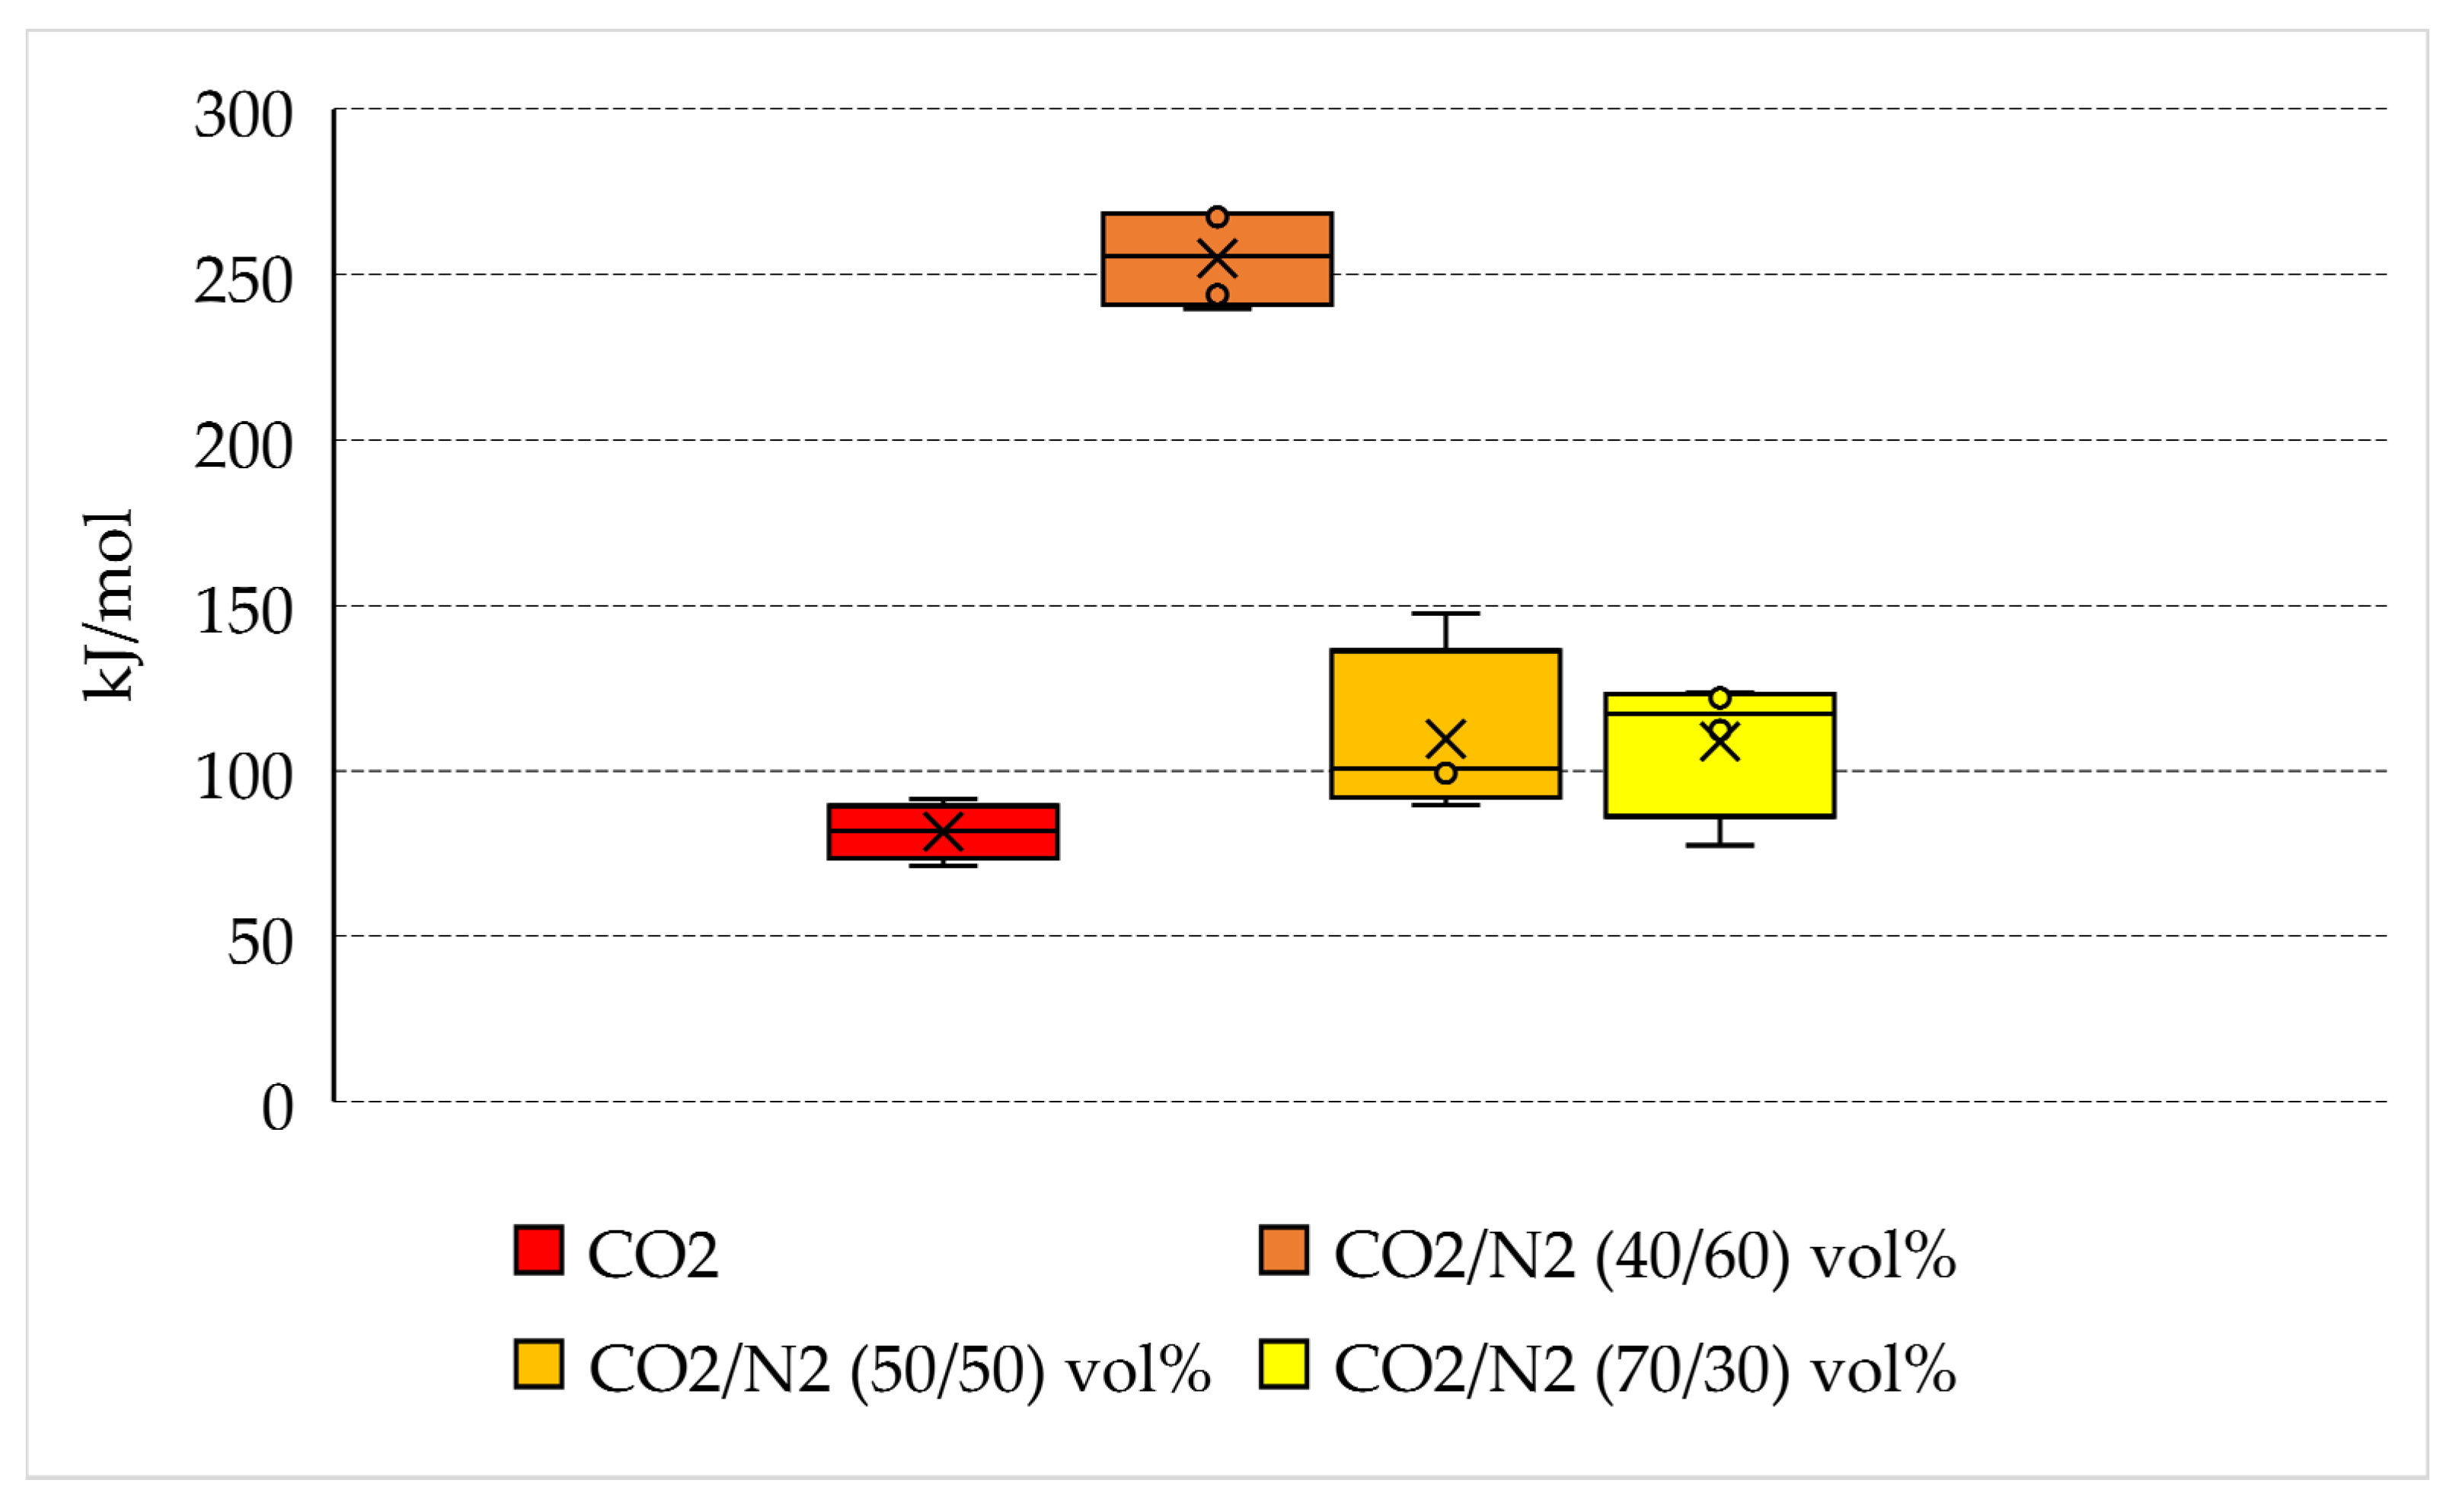
Figure 9.
Energy spent per unit of CO2 stored in form of hydrate and variability of quantities measured for each group of tests.
If the quantity of energy spent is normalized as a function of the quantity of carbon dioxide stored into hydrates, the positioning of the different species becomes completely reversed from the one denoted in the previous section. The lowest quantity of energy spent is related to the production of hydrates with pure carbon dioxide, where, on average, approximately 81.6 kJ/mol is required. The usage of pure CO2 obviously leads, if considering equal thermodynamic conditions, to the highest hydrates production possible, as visible from the data of Table 1 and the diagrams of Figure 2.
However, the mixtures containing 30 vol% and 50 vol% N2 do not show significant differences with the result obtained with pure CO2. The binary CO2/N2 (70/30) vol% has an average energy consumption equal to 108.8 kJ/mol, while the same parameter is equal to 109.7 kJ/mol for the CO2/N2 (50/50) vol% mixture. This latter result proves that, even if the second mixture has a nitrogen content widely higher than the first mixture, it allows the storage of carbon dioxide without additional costs. However, based on the results shown in Table 1, the quantity of carbon dioxide stored per unit of starting gaseous mixture used is lower. Conversely, the binary CO2/N2 (40/60) vol% leads to unacceptable results if compared with previous ones. The average quantity of energy spent per unit of carbon dioxide stored is equal to 254.9 kJ/mol.
The results discussed in this section still confirm that the binary mixtures containing 30 and 50 vol% N2 can be considered for high-efficiency carbon dioxide storage into hydrates, especially if considering the additional costs required for the production of pure carbon dioxide, mandatory for achieving the capture efficiency found in Tests 1–4 [78]. Moreover, the low variability between the two binary mixtures having 30 and 50 vol% N2 allows to widen the range of flue gas mixture suitable for the scope.
4.3. Possible Variations in Energy Spent
Depending on the geological site selected for CO2 storage into hydrates, the energy consumption associated to the cooling and compression of the gas mixture may change significantly. In deep ocean regions, the pressurization could be less intensive and exclusively related to the gas transportation step. Conversely, the cooling phase remains mandatory since, in order to have the immediate production of hydrates and minimize the leaks of gas species, the mixture should be brought in advance at the same temperature of the external hosting environment.
However, changes in target pressure and/or temperature may lead to different changes in energy spent as a function of the mixture selected and in particular of its nitrogen content.
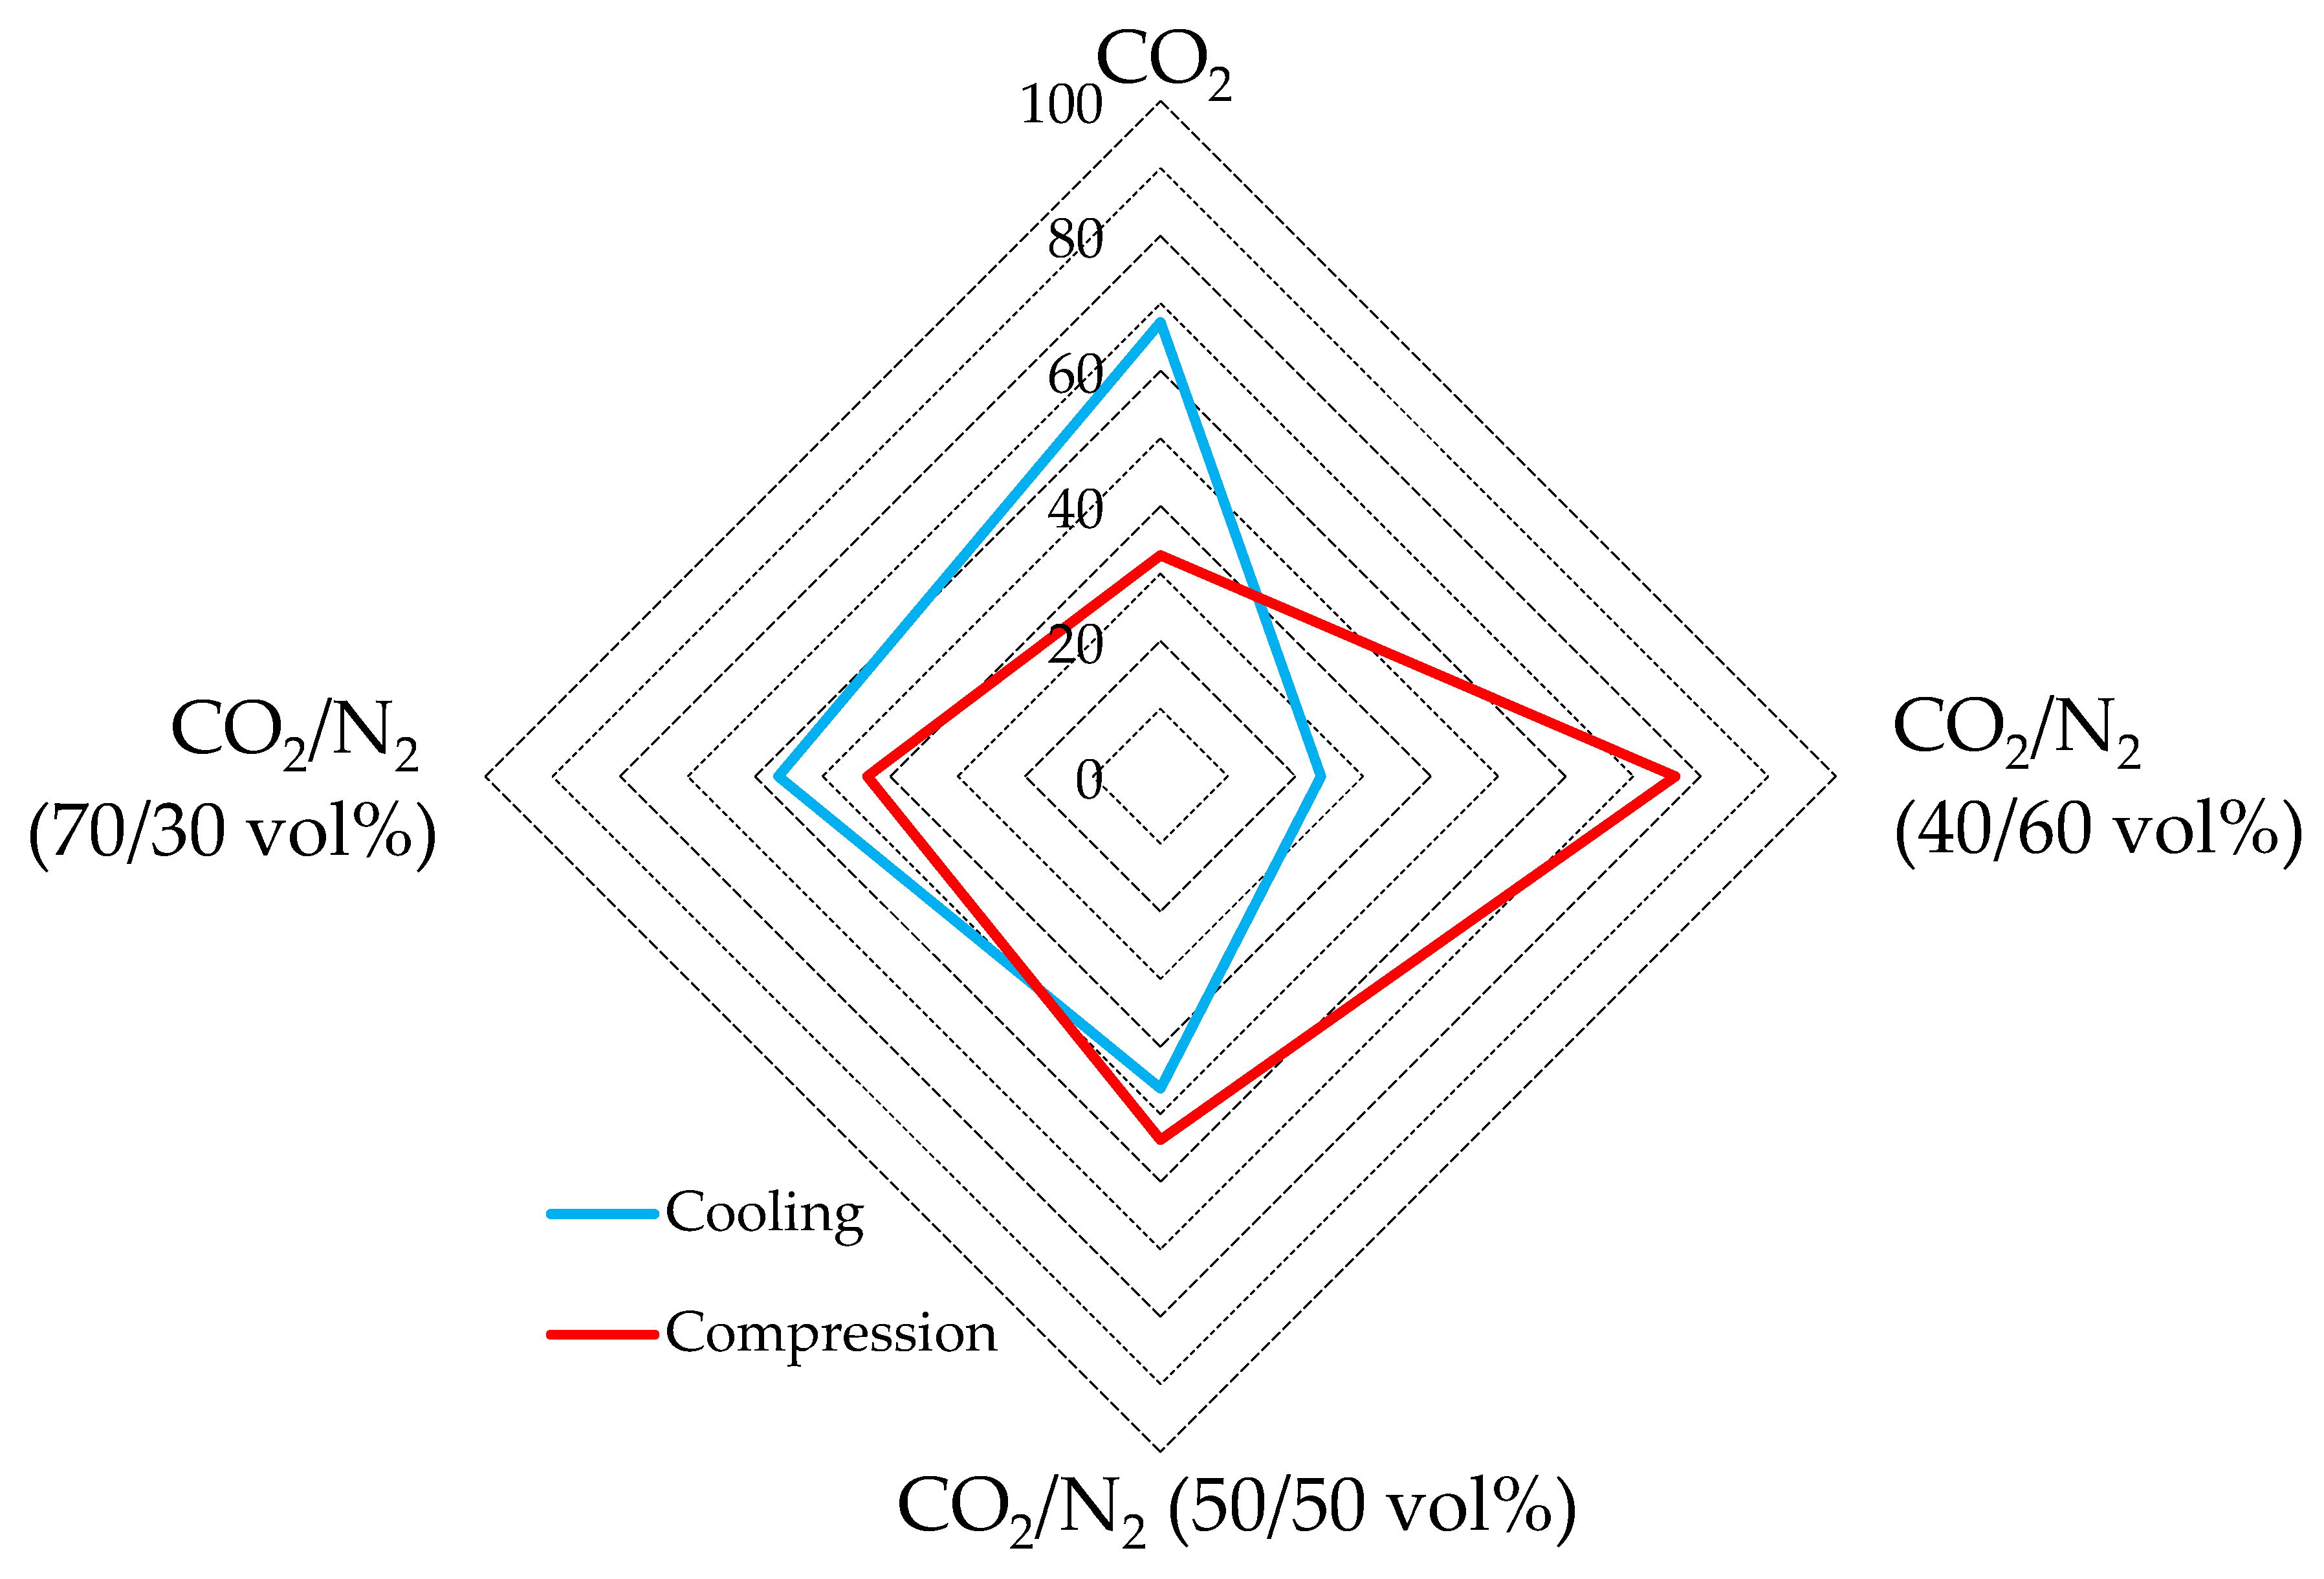
The diagram of Figure 10 shows, for each mixture, the energy spent for cooling and for compression, expressed as a percentage. The values used in the diagram of Figure 10 represent, for each mixture, the average of values calculated in all the related tests, expressed as percentage of the total energy spent. For completeness, these values are indicated in Table 4.
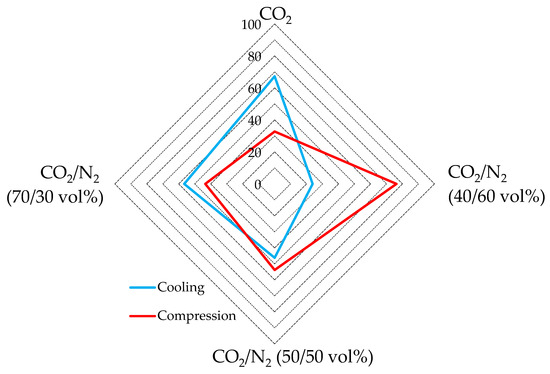
Figure 10.
Respective percentages of energy spent for gas cooling and for its pressurization.
Table 4.
Energy spent for gas cooling and compression in each experiment.
As visible in Figure 10, the energy spent for gas cooling and gas compression assumed widely different trends. In detail, the energy consumed for gas cooling increased with the growing concentration of carbon dioxide, while the energy spent for gas compression decreased with the growing concentration.
Considering only the energy related to the cooling step, using pure carbon dioxide emerges as the worst option, with an energy consumption within 13.6–17.3 kJ/mol. Conversely, the mixture containing 60 vol% N2 showed the best performance, with only 2.6–5.0 kJ/mol spent.
Conversely, the tests carried out with pure carbon dioxide had the lowest energy consumption for the compression phase, ranging between 6.5 and 8.3 kJ/mol. The highest consumption was measured for the CO2/N2 (40/60) vol% mixture, where it ranged from 10.7 to 11.2 kJ/mol.
According to assertions in the previous section, the energy consumption for the compression phase could be partially avoided when the local pressure can be exploited. Therefore, the usage of CO2-mixtures containing nitrogen is still more attractive than what emerged in the aforementioned sections. Indeed, if the energy contribution for gas cooling becomes predominant, the energy spent per unit of carbon dioxide stored becomes lower for the nitrogen-containing mixture than for pure carbon dioxide.
However, due to the extremely low production of hydrates, within the thermodynamic region explored in this work, the CO2/N2 (40/60) vol% mixture cannot be considered feasible for high-efficiency CO2 storage.
5. Conclusions
The present research deals with carbon dioxide storage in deep oceans in the form of clathrate hydrate. For the scope, pure carbon dioxide and CO2-based gaseous mixtures containing nitrogen at different concentrations were tested and the results compared.
The usage of pure carbon dioxide allows production of a higher quantity of hydrates and at milder thermodynamic conditions; however, flue gases often contain minor quantities of such a species, which requires further treatments and costs for purity. Moreover, due to the capability of nitrogen molecules to fit the small cages of sI hydrates, in presence of appropriate conditions, the resulting lattice would show higher stability.
Pure CO2 and three mixtures containing 30, 50 and 60 vol% in nitrogen were considered and four experiments for each of them were carried out.
- (1)
- With pure CO2, 0.24–0.32 moles of hydrates were produced, while 0.14–0.21 and 0.16–0.23 moles were produced, respectively, with 70/30 and 50/50 vol% mixtures. Conversely, the production obtained with the CO2/N2 40/60 vol% mixture was not meaningful (0.07–0.10 moles).
- (2)
- The production of hydrates with pure carbon dioxide required more energy than N2-containing mixtures (71.2–91.4 kJ/mol). No marked differences were noticed between pure CO2 and 50/50 vol% and 40/60 vol% mixtures, whose corresponding mean energy spent per mole of hydrate formed was equal, respectively, to 77.9 and to 71.3 kJ/mol, while the 70/30 vol% mixture required a significantly lower amount of energy: 51.1–75.4 kJ/mol, with a mean value equal to 63 kJ/mol.
- (3)
- The opposite trend was observed when the energy consumption was normalized as a function of the quantity of CO2 stored. With pure carbon dioxide, a mean of 81.6 kJ/mol was required. The mixtures containing 30 vol% and 50 vol% N2, led to similar results, with a mean consumption equal to 108.8 kJ/mol and 109.7 kJ/mol. Conversely, the CO2/N2 40/60 vol% mixture required 254.9 kJ/mol.
Finally, the energy required for gas compression and gas cooling was discussed separately for each mixture. Pure CO2 was found to be the worst option in terms of gas cooling, with an energy consumption within 13.6–17.3 kJ/mol. The best results were observed for the mixture containing 60 vol% N2, with only 2.6–5.0 kJ/mol spent.
For gas compression, the opposite trend was observed: the tests carried out with only CO2 led to the lowest energy consumption, within 6.5–8.3 kJ/mol, while the highest consumption was measured for the CO2/N2 (40/60) vol% mixture, where it ranged from 10.7 to 11.2 kJ/mol.
Author Contributions
Conceptualization, A.M.G.; methodology, A.D.G.; validation, A.M.G. and A.D.G.; formal analysis, A.M.G.; investigation, A.D.G.; data curation, A.M.G.; writing—original draft preparation, A.D.G. and A.M.G. All authors have read and agreed to the published version of the manuscript.
Funding
The authors gratefully acknowledge financial support derived by the PNRR project entitled: “High Efficiency Hydrogen Storage (HEHS)”, ID: RSH2B_000052. The authors also acknowledge the technical and material contribution of AiZoOn Technology Consulting and Nippon Gases Industrial Srl.
Data Availability Statement
Data will be available on request.
Conflicts of Interest
The authors declare no conflicts of interest.
References
- Hansen, A.D.; Kuramochi, T.; Wicke, B. The status of corporate greenhouse gas emissions reporting in the food sector: An evaluation of food and beverage manufactures. J. Clean. Prod. 2022, 361, 132279. [Google Scholar] [CrossRef]
- Vasquez, L.; Iriarte, A.; Almeida, M.; Villalobos, P. Evaluation of greenhouse gas emissions and proposals for their reduction at a university campus in Chile. J. Clean. Prod. 2015, 108, 924–930. [Google Scholar] [CrossRef]
- Bello, A.; Ivanova, A.; Cheremisin, A. A comprehensive review of the role of CO2 foam EOR in the reduction of carbon footprint in the petroleum industry. Energies 2023, 16, 1167. [Google Scholar] [CrossRef]
- Kim, D.; Kim, K.T.; Park, Y.K. A comparative study on the reduction effect in greenhouse gas emissions between the combined heat and power plant and boiler. Sustainability 2020, 12, 5144. [Google Scholar] [CrossRef]
- Cozzi, L.; Gould, T.; Bouckart, S.; Crow, D.; Kim, T.Y.; McGlade, C.; Olejarnik, P.; Wanner, B.; Wetzel, D. World Energy Outlook 2020; International Energy Agency: Paris, France, 2020; pp. 1–461. [Google Scholar]
- Boot-Handford, M.E.; Abanades, J.C.; Anthony, E.J.; Blunt, M.J.; Brandani, S.; Mac Dowell, N.; Fernàndez, M.C.; Gross, R.; Hallett, J.P. Carbon capture and storage update. Energy Environ. Sci. 2014, 7, 130–189. [Google Scholar] [CrossRef]
- Benson, S.M.; Cole, D.R. CO2 sequestration in deep sedimentary formations. Elements 2008, 4, 325–331. [Google Scholar] [CrossRef]
- Bachu, S. CO2 storage in geological media: Role, means, status and barriers to deployment. Prog. Energy Combust. Sci. 2008, 34, 254–273. [Google Scholar] [CrossRef]
- Bashir, A.; Ali, M.; Patil, S.; Aljawad, M.S.; Mahmoud, M.; Al-Shehri, D.; Hoteit, H.; Kamal, M.S. Comprehensive review of CO2 geological storage: Exploring principles, mechanisms, and prospects. Earth Sci. Rev. 2024, 249, 104672. [Google Scholar] [CrossRef]
- Cheng, Y.; Liu, W.; Xu, T.; Zhang, Y.; Zhang, X.; Xing, Y.; Feng, B.; Xia, Y. Seismicity induced by geological CO2 storage: A review. Earth Sci. Rev. 2023, 239, 104369. [Google Scholar] [CrossRef]
- Aminu, M.D.; Nabavi, S.A.; Rochelle, C.A.; Manovic, V. A review of developments in carbon dioxide storage. Appl. Energy 2017, 208, 1389–1419. [Google Scholar] [CrossRef]
- De Silva, G.P.D.; Ranjith, P.G.; Perera, M.S.A. Geochemical aspects of CO2 sequestration in deep saline aquifers: A review. Fuel 2015, 155, 128–143. [Google Scholar] [CrossRef]
- Gunter, W.D.; Wiwehar, B.; Perkins, E.H. Aquifer disposal of CO2-rich greenhouse gases: Extension of the time scale of experiments for CO2-sequestering reactions by geochemical modelling. Mineral. Petrol. 1997, 59, 121. [Google Scholar] [CrossRef]
- Le Gallo, Y.; Couillens, P.; Manai, T. CO2 sequestration in depleted oil of gas reservoirs. In Proceedings of the SPE International Conference on Health, Safety and Environment in Oil and Gas Exploration and Production, Kuala Lumpur, Malaysia, 20–22 March 2002; p. 74104. [Google Scholar]
- Agartan, E.; Gaddipati, M.; Yip, Y.; Savage, B.; Oxgen, C. CO2 storage in depleted oil and gas fields in the Gulf of Mexico. Int. J. Greenh. Gas Control 2018, 72, 38–48. [Google Scholar] [CrossRef]
- Talapatra, A. A study on the carbon dioxide injection into coal seam aiming at enhancing coal bed methane (ECBM) recovery. J. Pet. Explor. Prod. Technol. 2020, 10, 1965–1981. [Google Scholar] [CrossRef]
- Shi, J.Q.; Durucan, S. CO2 storage in deep unmineable coal seams. Oil Gas Sci. Technol. 2005, 60, 547–558. [Google Scholar] [CrossRef]
- Gislason, S.R.; Oelkers, E.H. Carbon storage in basalt. Science 2014, 344, 373–374. [Google Scholar] [CrossRef] [PubMed]
- Adams, E.E.; Caldeira, K. Ocean storage of CO2. Elements 2008, 4, 319–324. [Google Scholar] [CrossRef]
- Li, Q.; Wang, Y.; Wang, F.; Ning, X.; Chuanbao, Z.; Zhang, J.; Zhang, C. Factor analysis and mechanism disclosure of supercritical CO2 filtration behavior in tight shale reservoirs. Environ. Sci. Pollut. Res. 2022, 29, 17682–17694. [Google Scholar] [CrossRef]
- Li, C.; Cheng, Y.; Li, Q.; Ansari, U.; Liu, Y.; Yan, C.; Lei, C. Development and verification of the comprehensive model for physical properties of hydrate sediment. Arab. J. Geosci. 2018, 11, 325. [Google Scholar] [CrossRef]
- Giovannetti, R.; Gambelli, A.M.; Castellani, B.; Rossi, A.; Minicucci, M.; Zannotti, M.; Li, Y.; Rossi, F. May sediments affect the inhibiting properties of NaCl on CH4 and CO2 hydrates formation? An experimental report. J. Mol. Liq. 2022, 359, 119300. [Google Scholar] [CrossRef]
- Gambelli, A.M.; Rossi, F. Review on the usage of small-chain hydrocarbons (C2-C4) as aid gases for improving the efficiency of hydrate-based technologies. Energies 2023, 16, 3576. [Google Scholar] [CrossRef]
- Ito, K.; Sawano, Y.; Tada, K.; Sato, T. Numerical simulation of enhanced gas recovery from methane hydrate using the heat of CO2 hydrate formation under specific geological conditions. Gas Sci. Eng. 2024, 126, 205325. [Google Scholar] [CrossRef]
- Gambelli, A.M.; Li, Y.; Rossi, F. Influence of different proportion of CO2/N2 binary gas mixture on methane recovery through replacement processes in natural gas hydrates. Chem. Eng. Process. 2022, 175, 108932. [Google Scholar] [CrossRef]
- Sloan, E.D.; Koh, C.A. Clathrate Hydrates of the Natural Gases, 3rd ed.; CRC Press: Boca Raton, FL, USA, 2008. [Google Scholar]
- Cao, X.; Wang, H.; Yang, K.; Wu, S.; Chen, Q.; Bian, J. Hydrate-based CO2 sequestration technology: Feasibilities, mechanisms, influencing factors, and applications. J. Pet. Sci. Eng. 2022, 219, 111121. [Google Scholar] [CrossRef]
- Li, Y.; Gambelli, A.M.; Rossi, F. Experimental study on the effect of SDS and micron copper particles mixture on carbon dioxide hydrates formation. Energies 2022, 15, 6540. [Google Scholar] [CrossRef]
- Teng, Y.H.; Zhang, D.X. long-term viability of carbon sequestration in deep-sea sediments. Sci. Adv. 2018, 4, 6588. [Google Scholar] [CrossRef]
- Song, C.; Pan, W.; Srimat, T.S.; Zheng, J.; Li, Y.; Wang, Y.H.; Xu, B.Q.; Zhu, Q.M. Trireforming of methane over Ni catalysts for CO2 conversion to syngas with desired H2/CO ratios using flue gas of power plants without CO2 separation. Stud. Surf. Sci. Catal. 2004, 153, 315–322. [Google Scholar]
- Kacem, M.; Pellerano, M.; Delebarre, A. Pressure swing adsorption for CO2/N2 and CO2/CH4 separation: Comparison between activated carbons and zeolites performances. Fuel Process. Technol. 2015, 138, 271–283. [Google Scholar] [CrossRef]
- Zueco, J.; Lòpez-Asensio, D.; Fernàndez, F.J.; Lòpez-Gonzàlez, L.M. Exergy analysis of a steam-turbine power plant using thermocombustion. Appl. Therm. Eng. 2020, 180, 115812. [Google Scholar] [CrossRef]
- Lehmkuhler, F.; Paulus, M.; Sternemann, C.; Lietz, D.; Venturini, F.; Gutt, C.; Tolan, M. The carbon dioxide-water interface at conditions of gas hydrate formation. J. Am. Chem. Soc. 2009, 131, 585–589. [Google Scholar] [CrossRef]
- Radhakrishnan, R.; Trout, B.I. A new approach for studying nucleation phenomena using molecular simulations: Application to CO2 hydrate clathrates. J. Chem. Phys. 2002, 117, 1786–1796. [Google Scholar] [CrossRef]
- Wilder, J.W.; Sheshardi, K.; Smith, D.H. Resolving apparent contradictions in equilibrium measurements for clathrate hydrates in porous media. J. Phys. Chem. B 2001, 105, 9970–9972. [Google Scholar] [CrossRef]
- Anderson, R.; Llamendo, M.; Tohidi, B.; Burgass, R.W. Experimental measurement of methane and carbon dioxide clathrate hydrate equilibria in mesoporous silica. J. Phys. Chem. B 2003, 107, 3507–3514. [Google Scholar] [CrossRef]
- Lee, S.; Seo, Y. Experimental measurement and thermodynamic modelling of the mixed CH4+C3H8 clathrate hydrate equilibria in silica gel pores: Effects of pore size and salinity. Langmuir 2010, 26, 9742–9748. [Google Scholar] [CrossRef]
- Kang, S.P.; Lee, J.W.; Ryu, H.J. Phase behavior of methane and carbon dioxide hydrates in meso- and micro-sized porous media. Fluid Phase Equilib. 2008, 274, 68–72. [Google Scholar] [CrossRef]
- Liu, H.; Zhan, S.; Guo, P.; Fan, S.; Zhang, S. Understanding the characteristic of methane hydrate equilibrium in materials and its potential application. Chem. Eng. J. 2018, 349, 775–781. [Google Scholar] [CrossRef]
- Yu, X.; Wang, J.; Liang, J.; Li, S.; Zeng, X.; Li, W. Depositional characteristics and accumulation model of gas hydrates in northern South China Sea. Mar. Pet. Geol. 2014, 56, 74–86. [Google Scholar] [CrossRef]
- Holland, M.; Schultheiss, P.; Roberts, J.; Druce, M. Observed gas hydrate morphologies in marine sediments. In Proceedings of the International Conference on Gas Hydrates (ICGH) (6th: 2008), Vancouver, BC, Canada, 6–10 July 2008; pp. 6–10. [Google Scholar]
- Kennedy, W.J.; Garrison, R.E. Morphology and genesis of nodular chalks and hardgrounds in the Upper Cretaceous of southern England. Sedimentology 1975, 22, 311–386. [Google Scholar] [CrossRef]
- Qin, X.; Lu, J.; Lu, H.; Qiu, H.; Liang, J.; Kang, D.; Zhan, L.S.; Lu, H.F.; Kuang, Z.G. Co-existence of natural gas hydrate, free gas and water in the gas hydrate system in the Shenhu Area, South China Sea. China Geol. 2020, 3, 210–220. [Google Scholar] [CrossRef]
- Lei, L.; Seol, Y.; Choi, J.H.; Kneafsey, T.J. Pore habit of methane hydrate and its evolution in sediment matrix-laboratory visualization with phase-contrast micro-CT. Mar. Pet. Geol. 2019, 104, 451–467. [Google Scholar] [CrossRef]
- Wu, P.; Li, Y.; Sun, X.; Liu, W.; Song, Y. Mechanical characteristics of hydrate-bearing sediment: A review. Energy Fuel 2021, 35, 1041–1057. [Google Scholar] [CrossRef]
- Hyodo, M.; Nakata, Y.; Yoshimoto, N.; Ebinuma, T. Basic research on the mechanical behavior of methane hydrate-sediments mixture. Soils Found. 2005, 45, 75–85. [Google Scholar]
- Luo, T.; Li, Y.; Madhusudhan, B.N.; Zhao, J.; Song, Y. Comparative analysis of the consolidation and shear behaviors of CH4 and CO2 hydrate-bearing sediments. J. Nat. Gas Sci. Eng. 2020, 75, 103157. [Google Scholar] [CrossRef]
- Luo, T.; Han, T.; Madhusudan, B.N.; Zhao, X.; Zou, D.; Song, Y. Strenght and deformation behaviors of methane hydrate-bearing marine sediments in the South China Sea during depressurization. Energy Fuel 2022, 35, 14569–14579. [Google Scholar] [CrossRef]
- Hyodo, M.; Li, Y.; Yoneda, J.; Nakata, Y.; Yoshimoto, N.; Nishimura, A. Effects of dissociation on the shear strength and deformation behavior of methane hydrate-bearing sediments. Mar. Pet. Geol. 2014, 51, 52–62. [Google Scholar] [CrossRef]
- Zhao, X.; Luo, T.; Zhuang, S.; Lai, Z.; Li, R. AE monitoring–based CO2 hydrate formation and its influence to hydrate-bearing sandy sediments. J. Nat. Gas Sci. Eng. 2021, 96, 104292. [Google Scholar] [CrossRef]
- Waite, W.; Bratton, P.M.; Mason, D.H. Laboratory formation of non-cementing methane hydrate-bearing sands. In Proceedings of the 7th International Conference on Gas Hydrates 2011, Edinburgh, UK, 17–21 July 2011. [Google Scholar]
- Clayton, C.R.I.; Priest, J.A.; Rees, E.V.L. The effect of hydrate cement on the stiffness of some sands. Geotechnique 2010, 60, 435–445. [Google Scholar] [CrossRef]
- Shen, S.; Li, Y.; Sun, X.; Wang, L.; Song, Y. Analysis of the mechanical properties of methane hydrate-bearing sands with various pore pressures and confining. J. Nat. Gas Sci. Eng. 2021, 87, 103786. [Google Scholar] [CrossRef]
- Shen, S.; Sun, X.; Wang, L.; Song, Y.; Li, Y. Effect of temperature on the mechanical properties of hydrate-bearing sand under different confining pressures. Energy Fuels 2021, 35, 4106–4117. [Google Scholar] [CrossRef]
- Winters, W.J.; Waite, W.F.; Mason, D.H.; Gilbert, L.Y.; Pecher, I.A. Methane gas hydrate effect on sediment acoustic and strength properties. J. Pet. Sci. Eng. 2007, 56, 127–135. [Google Scholar] [CrossRef]
- Oshima, M.; Suzuki, K.; Yoneda, J.; Kato, A.; Kida, M.; Konno, Y.; Muraoka, M.; Jin, Y.; Nagao, J.; Tenma, N. Lithological properties of natural gas hydrate-bearing sediments in pressure-cores recovered from the Krishna-Godavari Basin. Mar. Pet. Geol. 2019, 108, 439–470. [Google Scholar] [CrossRef]
- Maiti, M.; Bhaumik, A.K.; Mandal, A. Geological characterization of natural gas hydrate bearing sediments and their influence on hydrate formation and dissociation. J. Nat. Gas Sci. Eng. 2022, 100, 104491. [Google Scholar] [CrossRef]
- Gambelli, A.M.; Castellani, B.; Nicolini, A.; Rossi, F. The effect of grainsize of sediments in the CO2/CH4 replacement process within a hydrate lattice: An experimental report. Chem. Eng. Process. 2022, 181, 109149. [Google Scholar] [CrossRef]
- Gambelli, A.M. Methane replacement into hydrate reservoirs with carbon dioxide: Main limiting factors and influence of the gaseous phase composition, over hydrates, on the process. Chem. Eng. J. 2023, 478, 147247. [Google Scholar] [CrossRef]
- Kashchiev, D.; Verdoes, D.; van Rosmalen, G.M. Induction time and metastability limit in new phase formation. J. Cryst. Growth 1991, 110, 373–380. [Google Scholar] [CrossRef]
- Gambelli, A.M.; Rossi, F. Experimental characterization of the difference in induction period between CH4 and CO2 hydrates: Motivations and possible consequences on the replacement process. J. Nat. Gas Sci. Eng. 2022, 108, 104848. [Google Scholar] [CrossRef]
- Englezos, P.; Kalogerakis, N.; Dholabai, P.D.; Bishnoi, P.R. Kinetics of formation of methane and ethane gas hydrate. Chem. Eng. Sci. 1987, 42, 2647–2658. [Google Scholar] [CrossRef]
- Wang, S.R.; Yang, M.J.; Liu, W.G.; Zhao, J.F.; Song, Y.C. Investigation on the induction time of methane hydrate formation in porous media under quiescent conditions. J. Pet. Sci. Eng. 2016, 145, 565–572. [Google Scholar] [CrossRef]
- Natajaran, V.; Bishnoi, P.R.; Kalogerakis, N. Induction phenomena in gas hydrate nucleation. Chem. Eng. Sci. 1994, 49, 2075–2087. [Google Scholar] [CrossRef]
- Gambelli, A.M.; Rossi, F. Re-definition of the region suitable for CO2/CH4 replacement into hydrates as a function of the thermodynamic difference between CO2 hydrate formation and dissociation. Process Saf. Environ. Prot. 2023, 169, 132–141. [Google Scholar] [CrossRef]
- Giovannetti, R.; Gambelli, A.M.; Rossi, A.; Castellani, B.; Minicucci, M.; Zannotti, M.; Nicolini, A.; Rossi, F. Thermodynamic assessment and microscale Raman spectroscopy of binary CO2/CH4 hydrates produced during replacement applications in natural reservoirs. J. Mol. Liq. 2022, 368, 120739. [Google Scholar] [CrossRef]
- Gambelli, A.M.; Presciutti, A.; Rossi, F. Kinetic considerations and formation rate for carbon dioxide hydrate, formed in presence of a natural silica-based porous medium: How initial thermodynamic conditions may modify the process kinetic. Thermochim. Acta 2021, 705, 179039. [Google Scholar] [CrossRef]
- Li, Y.; Gambelli, A.M.; Chen, J.; Yin, Z.; Rossi, F.; Tronconi, E.; Mei, S. Experimental study on the competition between carbon dioxide hydrate and ice below the freezing point. Chem. Eng. Sci. 2023, 268, 118426. [Google Scholar] [CrossRef]
- Ripmeester, J.A.; Alavi, S. Some current challenges in clathrate hydrate science: Nucleation, decomposition and the memory effect. Curr. Opin. Solid State Mater. Sci. 2016, 20, 344–351. [Google Scholar] [CrossRef]
- Gambelli, A.M. Variations in terms of CO2 capture and CH4 recovery during replacement processes in gas hydrate reservoirs, associated to the “memory effect”. J. Clean. Prod. 2022, 360, 132154. [Google Scholar] [CrossRef]
- Wilson, P.W.; Haymet, A.D.J. Hydrate formation and re-formation in nucleating THF/water mixtures show no evidence to support a “memory” effect. Chem. Eng. J. 2010, 161, 146–150. [Google Scholar] [CrossRef]
- Takeya, S.; Kida, M.; Minami, H.; Sakagami, H.; Hachikubo, A.; Takahashi, N.; Shoji, H.; Soloviev, V.; Wallmann, K.; Biebow, N.; et al. Structure and thermal expansion of natural gas clathrate hydrates. Chem. Eng. Sci. 2006, 61, 2670–2674. [Google Scholar] [CrossRef]
- Aregba, A.G. Gas Hydrate—Properties, Formation and Benefits. Open J. Yangtze Oil Gas 2017, 2, 27–44. [Google Scholar] [CrossRef]
- Cai, J.; Xu, C.G.; Hu, Y.F.; Ding, Y.L.; Li, X.S. Phase equilibrium and Raman spectroscopic studies of semi-clathrate hydrates for methane, nitrogen and tetra-butyl-ammonium fluoride. Fluid Phase Equilib. 2016, 413, 48–52. [Google Scholar] [CrossRef]
- Tohidi, B.; Danesh, A.; Todd, A.C.; Burgass, R.W.; Ostergaard, K.K. Equilibrium data and thermodynamic modelling of cyclopentane and neopentane hydrates. Fluid Phase Equilib. 1997, 138, 241–250. [Google Scholar] [CrossRef]
- Fan, S.; Li, S.; Wang, J.; Lang, X.; Wang, Y. Efficient capture of CO2 from simulated flue gas by formation of TBAB or TBAF semiclathrate hydrates. Energy Fuels 2009, 23, 4202–4208. [Google Scholar] [CrossRef]
- Gambelli, A.M.; Rossi, F. Thermodynamic and kinetic characterization of methane hydrate nucleation, growth and dissociation processes, according to the Labile Cluster Theory. Chem. Eng. J. 2021, 425, 130706. [Google Scholar] [CrossRef]
- Fajrina, N.; Yusof, N.; Ismail, A.F.; Aziz, F.; Bilad, M.R.; Alkahtani, M. A crucial review on the challenges and recent gas membrane development for biogas upgrading. J. Environ. Chem. Eng. 2023, 11, 110235. [Google Scholar] [CrossRef]

Disclaimer/Publisher’s Note: The statements, opinions and data contained in all publications are solely those of the individual author(s) and contributor(s) and not of MDPI and/or the editor(s). MDPI and/or the editor(s) disclaim responsibility for any injury to people or property resulting from any ideas, methods, instructions or products referred to in the content. |
© 2024 by the authors. Licensee MDPI, Basel, Switzerland. This article is an open access article distributed under the terms and conditions of the Creative Commons Attribution (CC BY) license (https://creativecommons.org/licenses/by/4.0/).