
Investigation of the Effects of Energy-Efficient Drying Techniques and Extraction Methods on the Bioactive and Functional Activity of Banana Inflorescence


Abstract
:
1. Introduction
2. Materials and Methods
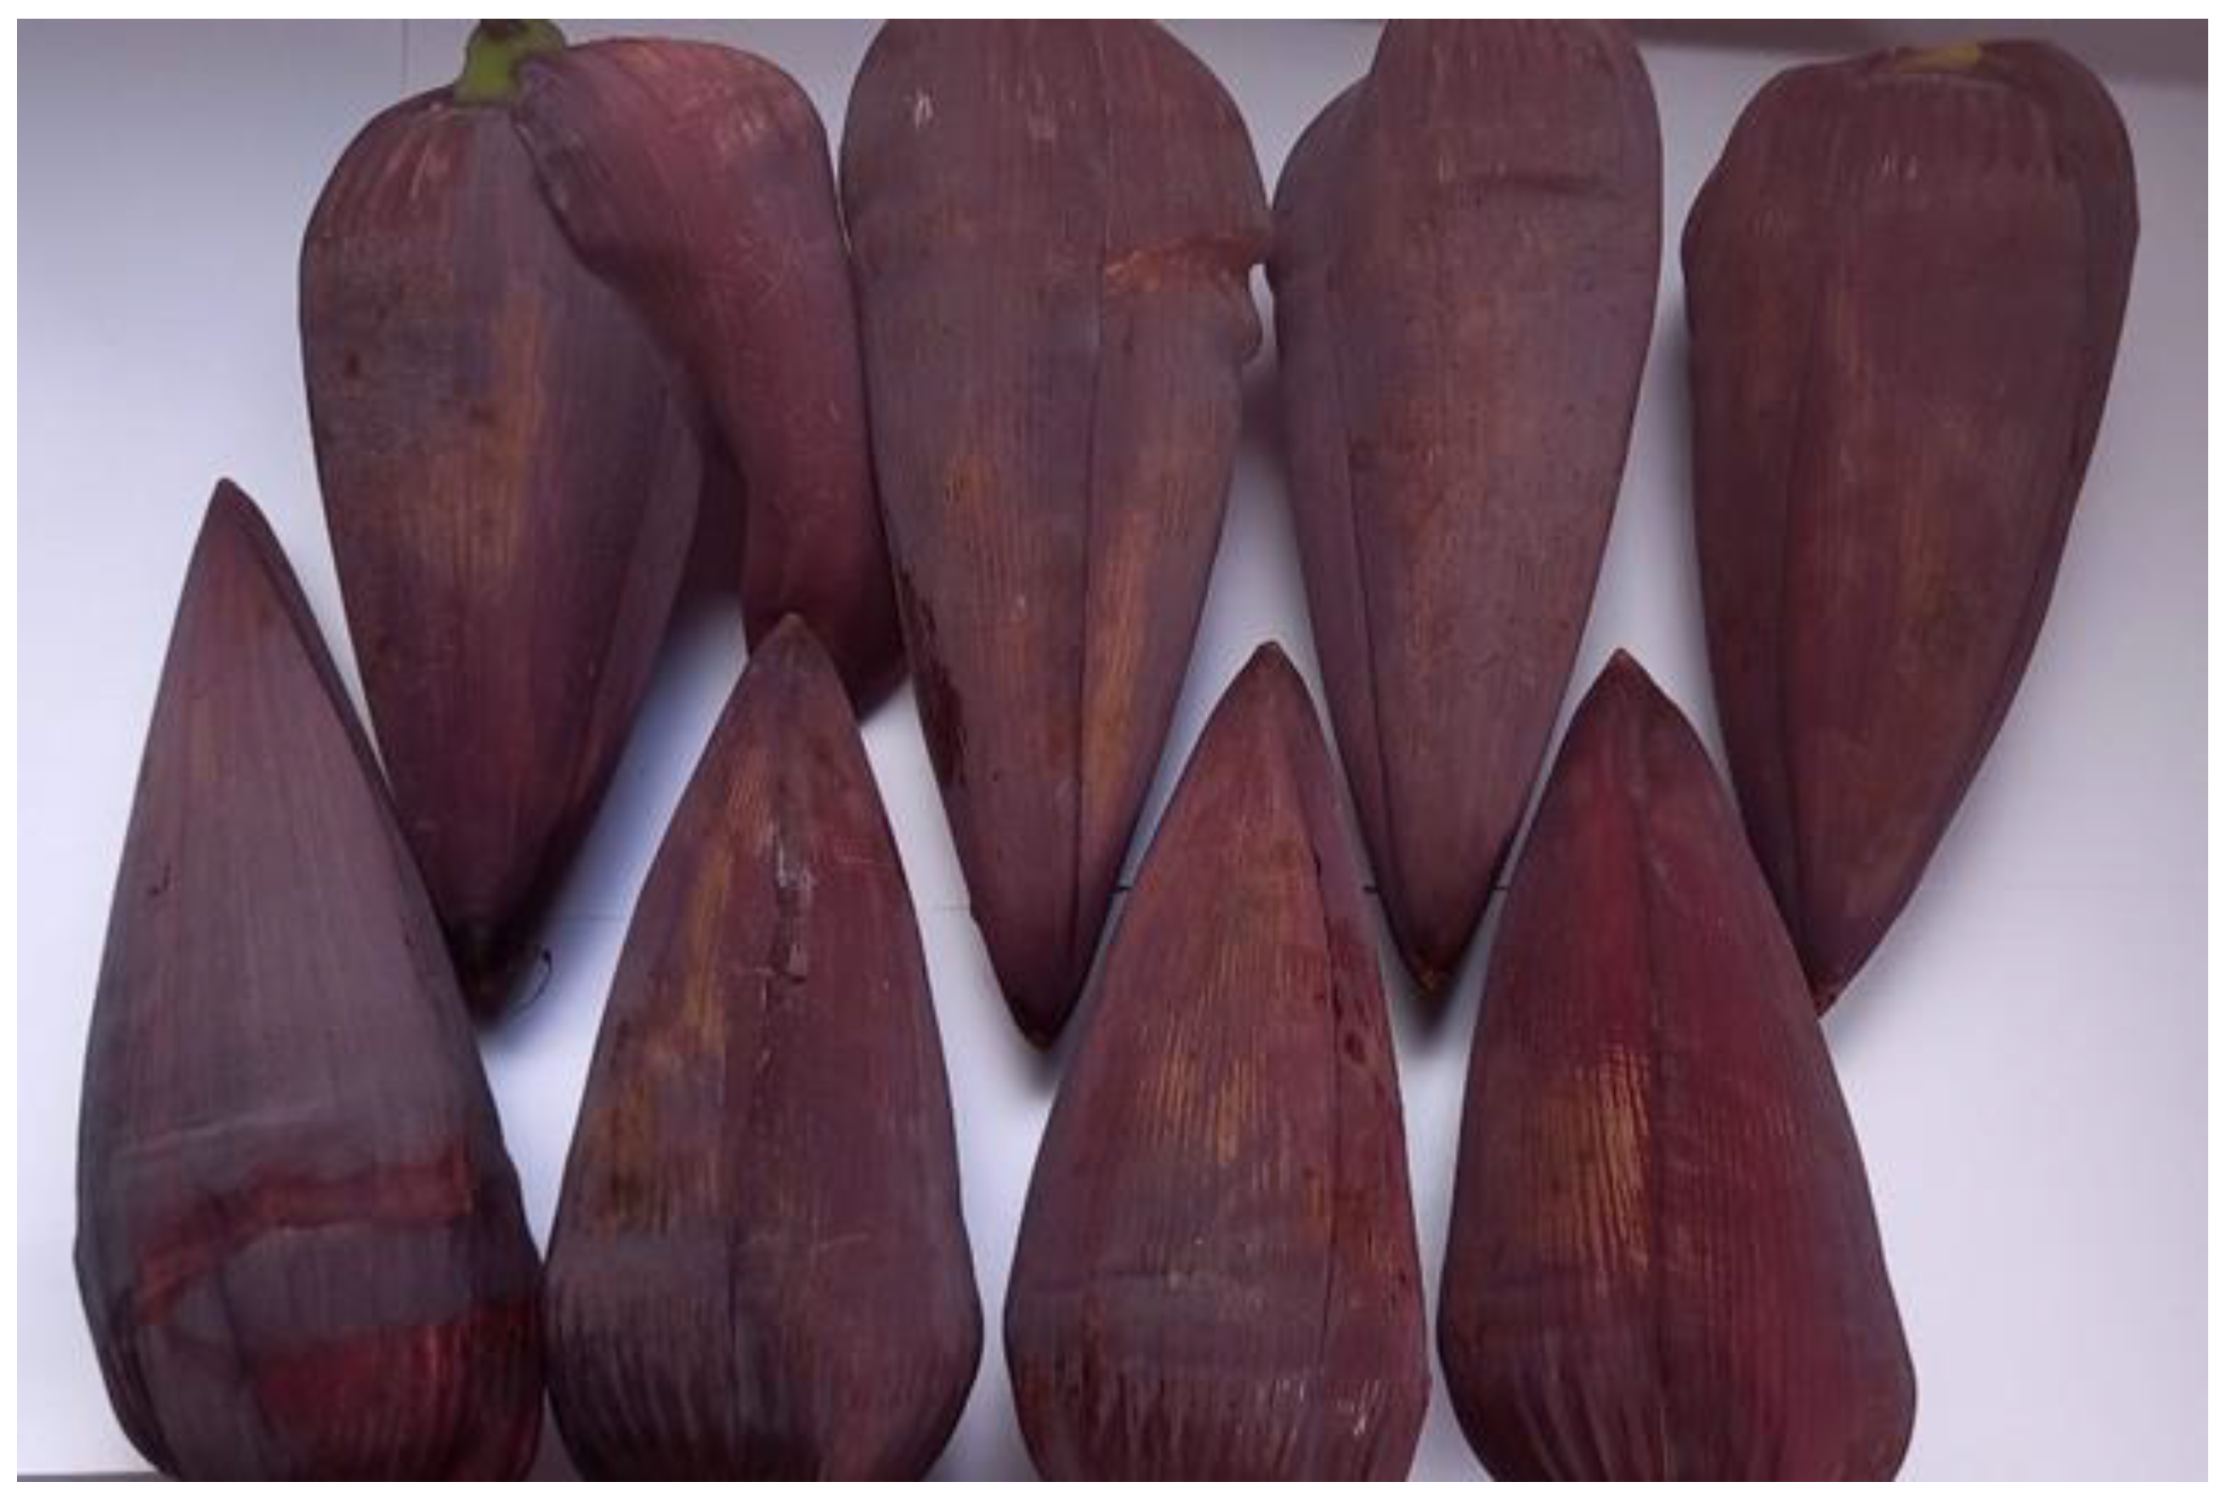
2.1. Raw Materials
2.2. Chemicals and Regents
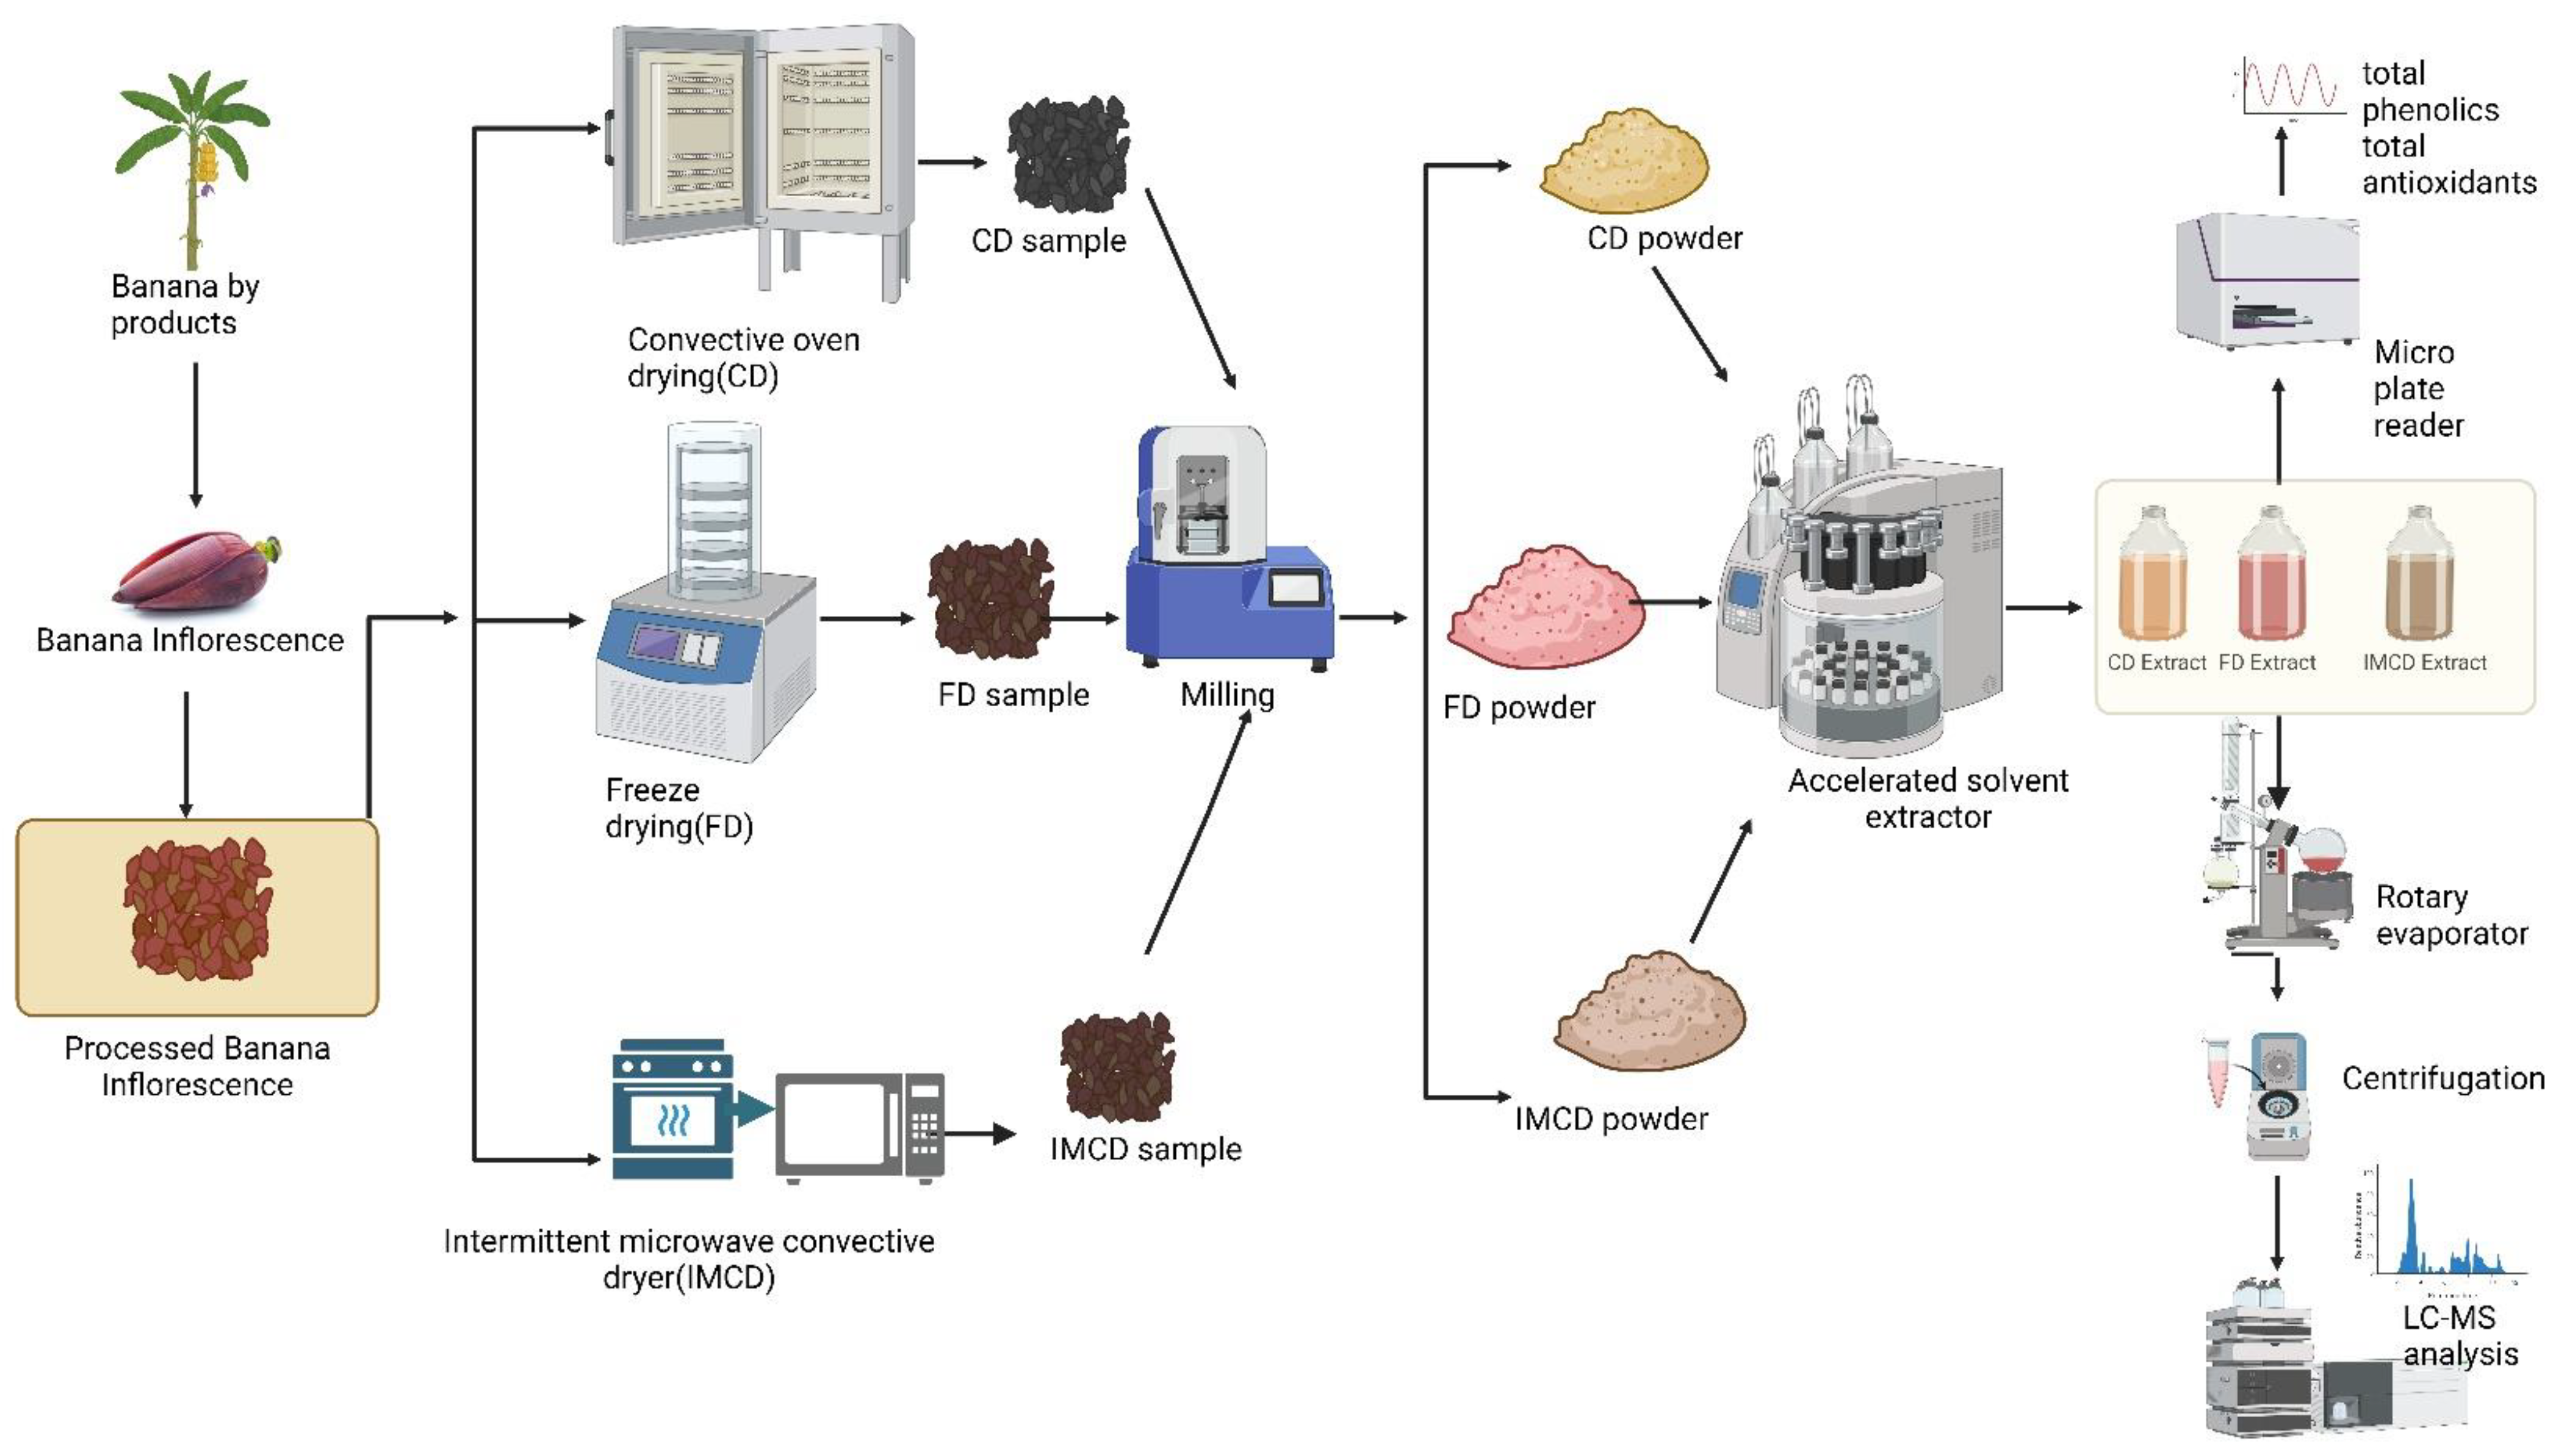
2.3. Drying Experiments
2.3.1. Convective Oven Drying (CD)
2.3.2. Freeze-Drying (FD)
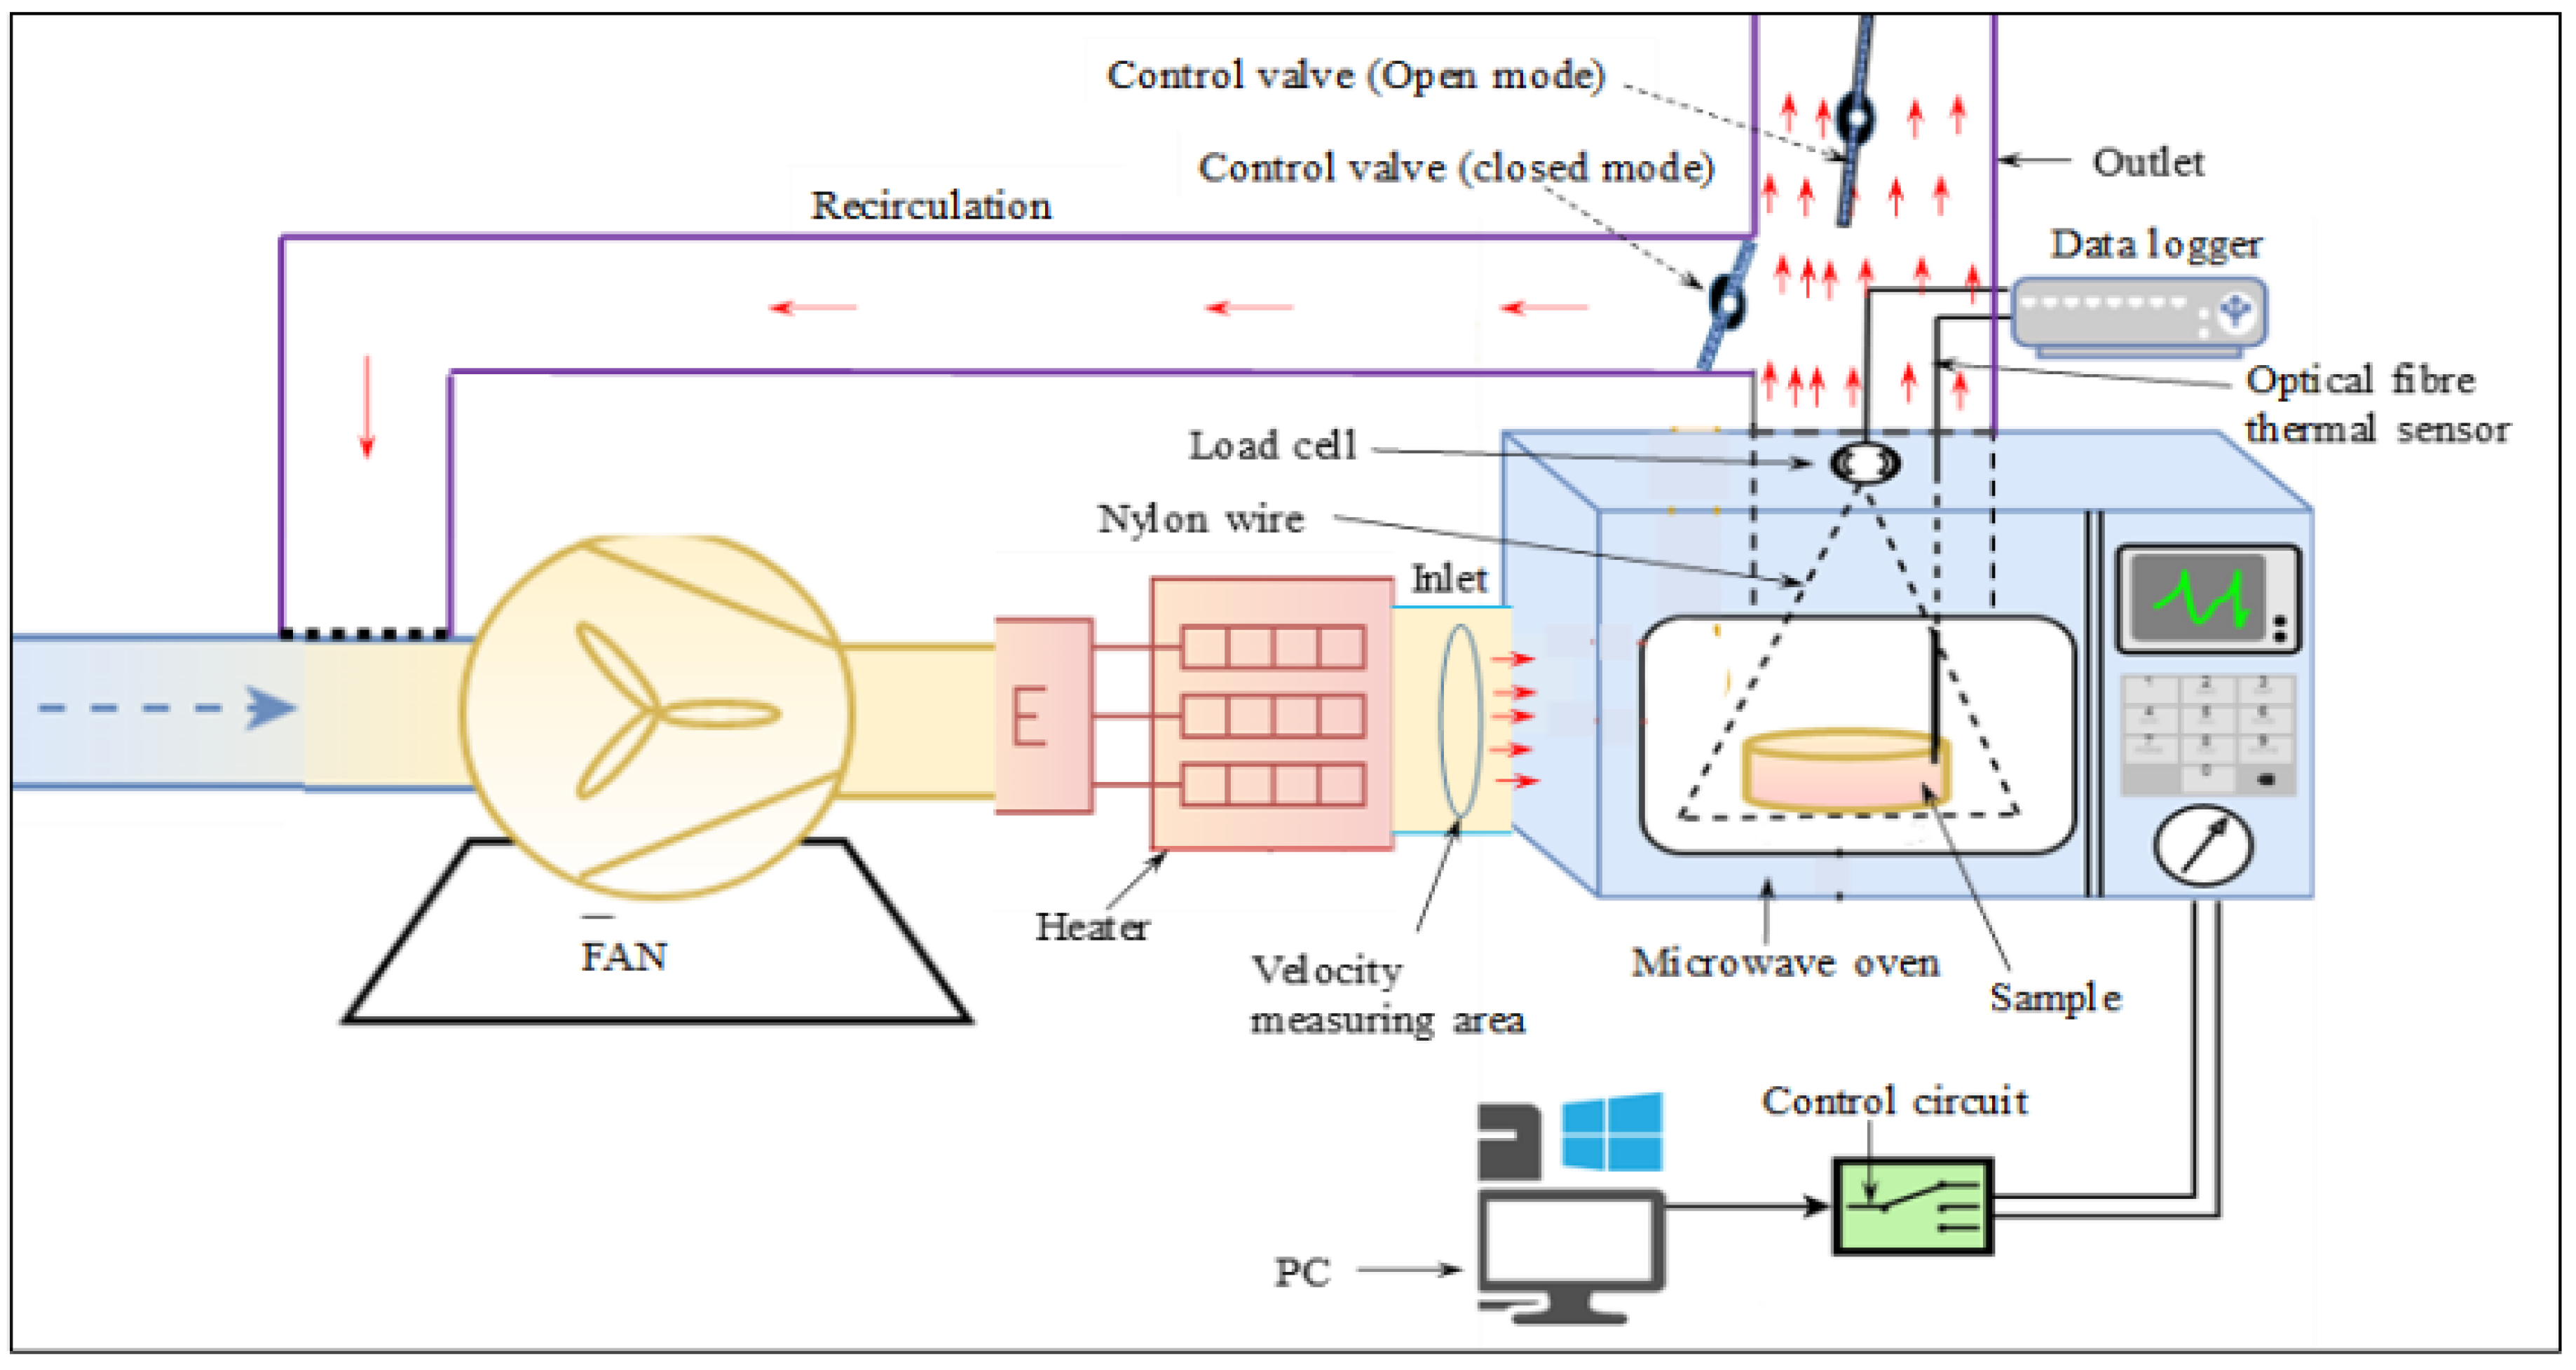
2.3.3. Intermittent Microwave Convective Drying (IMCD)
Milling
2.4. Experimental Design
2.5. Physicochemical Properties of Banana Inflorescence Powder
2.5.1. Colour Parameters
2.5.2. Microstructure
2.5.3. Moisture Content
2.5.4. Ash Content
2.5.5. pH
2.5.6. Total Soluble Solids Content
2.5.7. Drying Yield
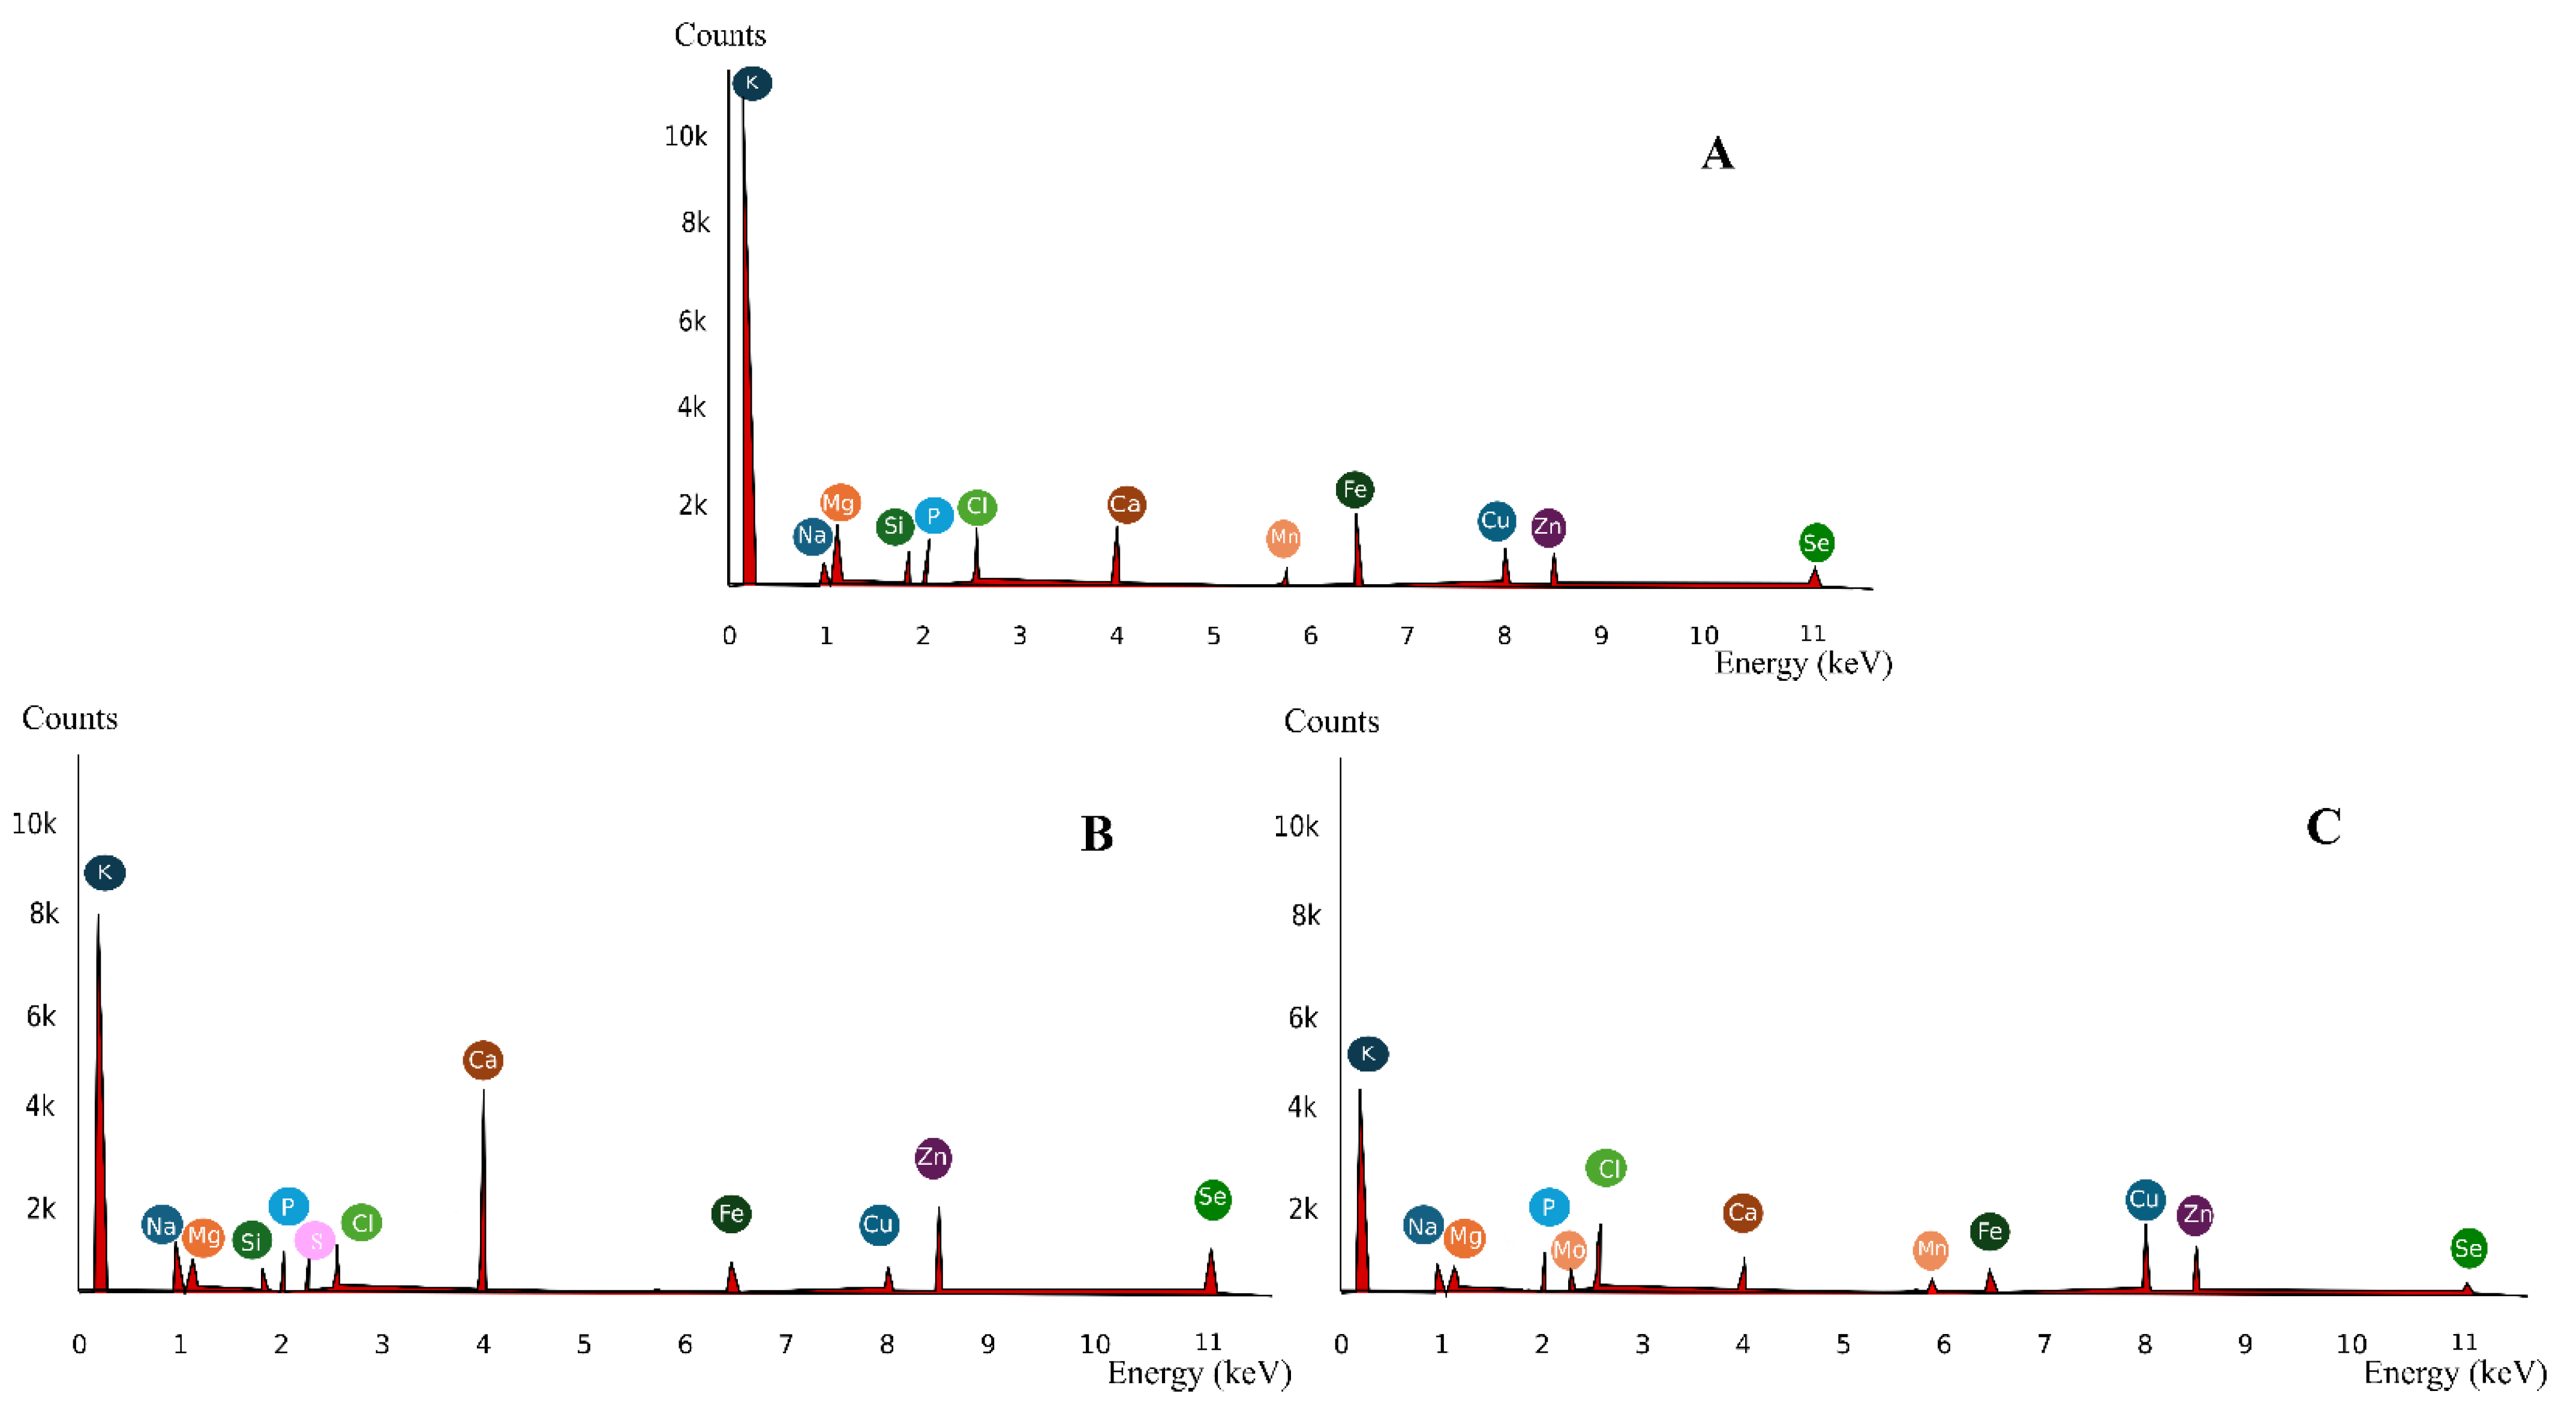
2.5.8. Energy Dispersive X-ray Spectroscopy (EDS)—Mineral Analysis
2.6. Functional Properties
2.6.1. Swelling Capacity
2.6.2. Bulk Density
2.6.3. Tapped Density
2.6.4. Water-Holding Capacity
2.6.5. Oil-Holding Capacity
2.6.6. CHN Analysis
2.6.7. FTIR
2.7. Bioactive Properties of Extracted Banana Inflorescence
2.8. Extraction
2.8.1. Extraction Method
2.8.2. Optimised Extraction Process
| Drying methods | CD, FD, IMCD |
| Extraction solvents | Methanol, Ethanol, Water |
| Extraction solvent concentrations | 50%, 75%, 100% |
| Control | Fresh Banana inflorescence without drying |
2.9. Total Phenolic Content (Folin–Ciocalteu Method)
2.10. Total Scavenging Activity (DPPH Analysis)
2.11. Characterisation of Polyphenols Using LC-MS
2.12. Quantification of Phenolic Compounds Using HPLC-PDA
2.13. Statistical Analysis
3. Results and Discussions
3.1. Physical Properties of Dried Banana Inflorescence
3.1.1. Colour
3.1.2. Microstructure
3.1.3. Moisture Content
3.1.4. Ash Content
3.1.5. pH
3.1.6. Total Soluble Solids (TSS)
3.1.7. Drying Yield
3.1.8. EDS Spectrum
3.2. Functional Properties
3.2.1. Swelling Power
3.2.2. Bulk Density
3.2.3. Tapped Density
3.2.4. Water-Holding Capacity (WHC)
3.2.5. Oil-Holding Capacity
3.2.6. C, H, and N Analysis
3.2.7. FTIR

| Wavenumber (cm−1) | Band Assignment | Contributing Biomolecules | Reference |
|---|---|---|---|
| 3292 | =C-H, OH | Unsaturated lipids | [57] |
| 2924, 2854 | C-H, OH, CH2 | Alkane | [56] |
| 1743 | Amide 1 | Aldehyde, Ketone | [57] |
| 1638 | COO- | Absorbed water | [54] |
| 1440, 1380, 1310 | C-O-H | Starch | [58] |
| 1231 | C-O | Lignin | [54] |
| 1066, 1021, 915 | C-O-C, C-O, C-C,C-O-P, P—O-P | Aromatic, Phenolics, carbohydrate | [39,59] |
3.3. Bioactive Properties of Banana Inflorescence
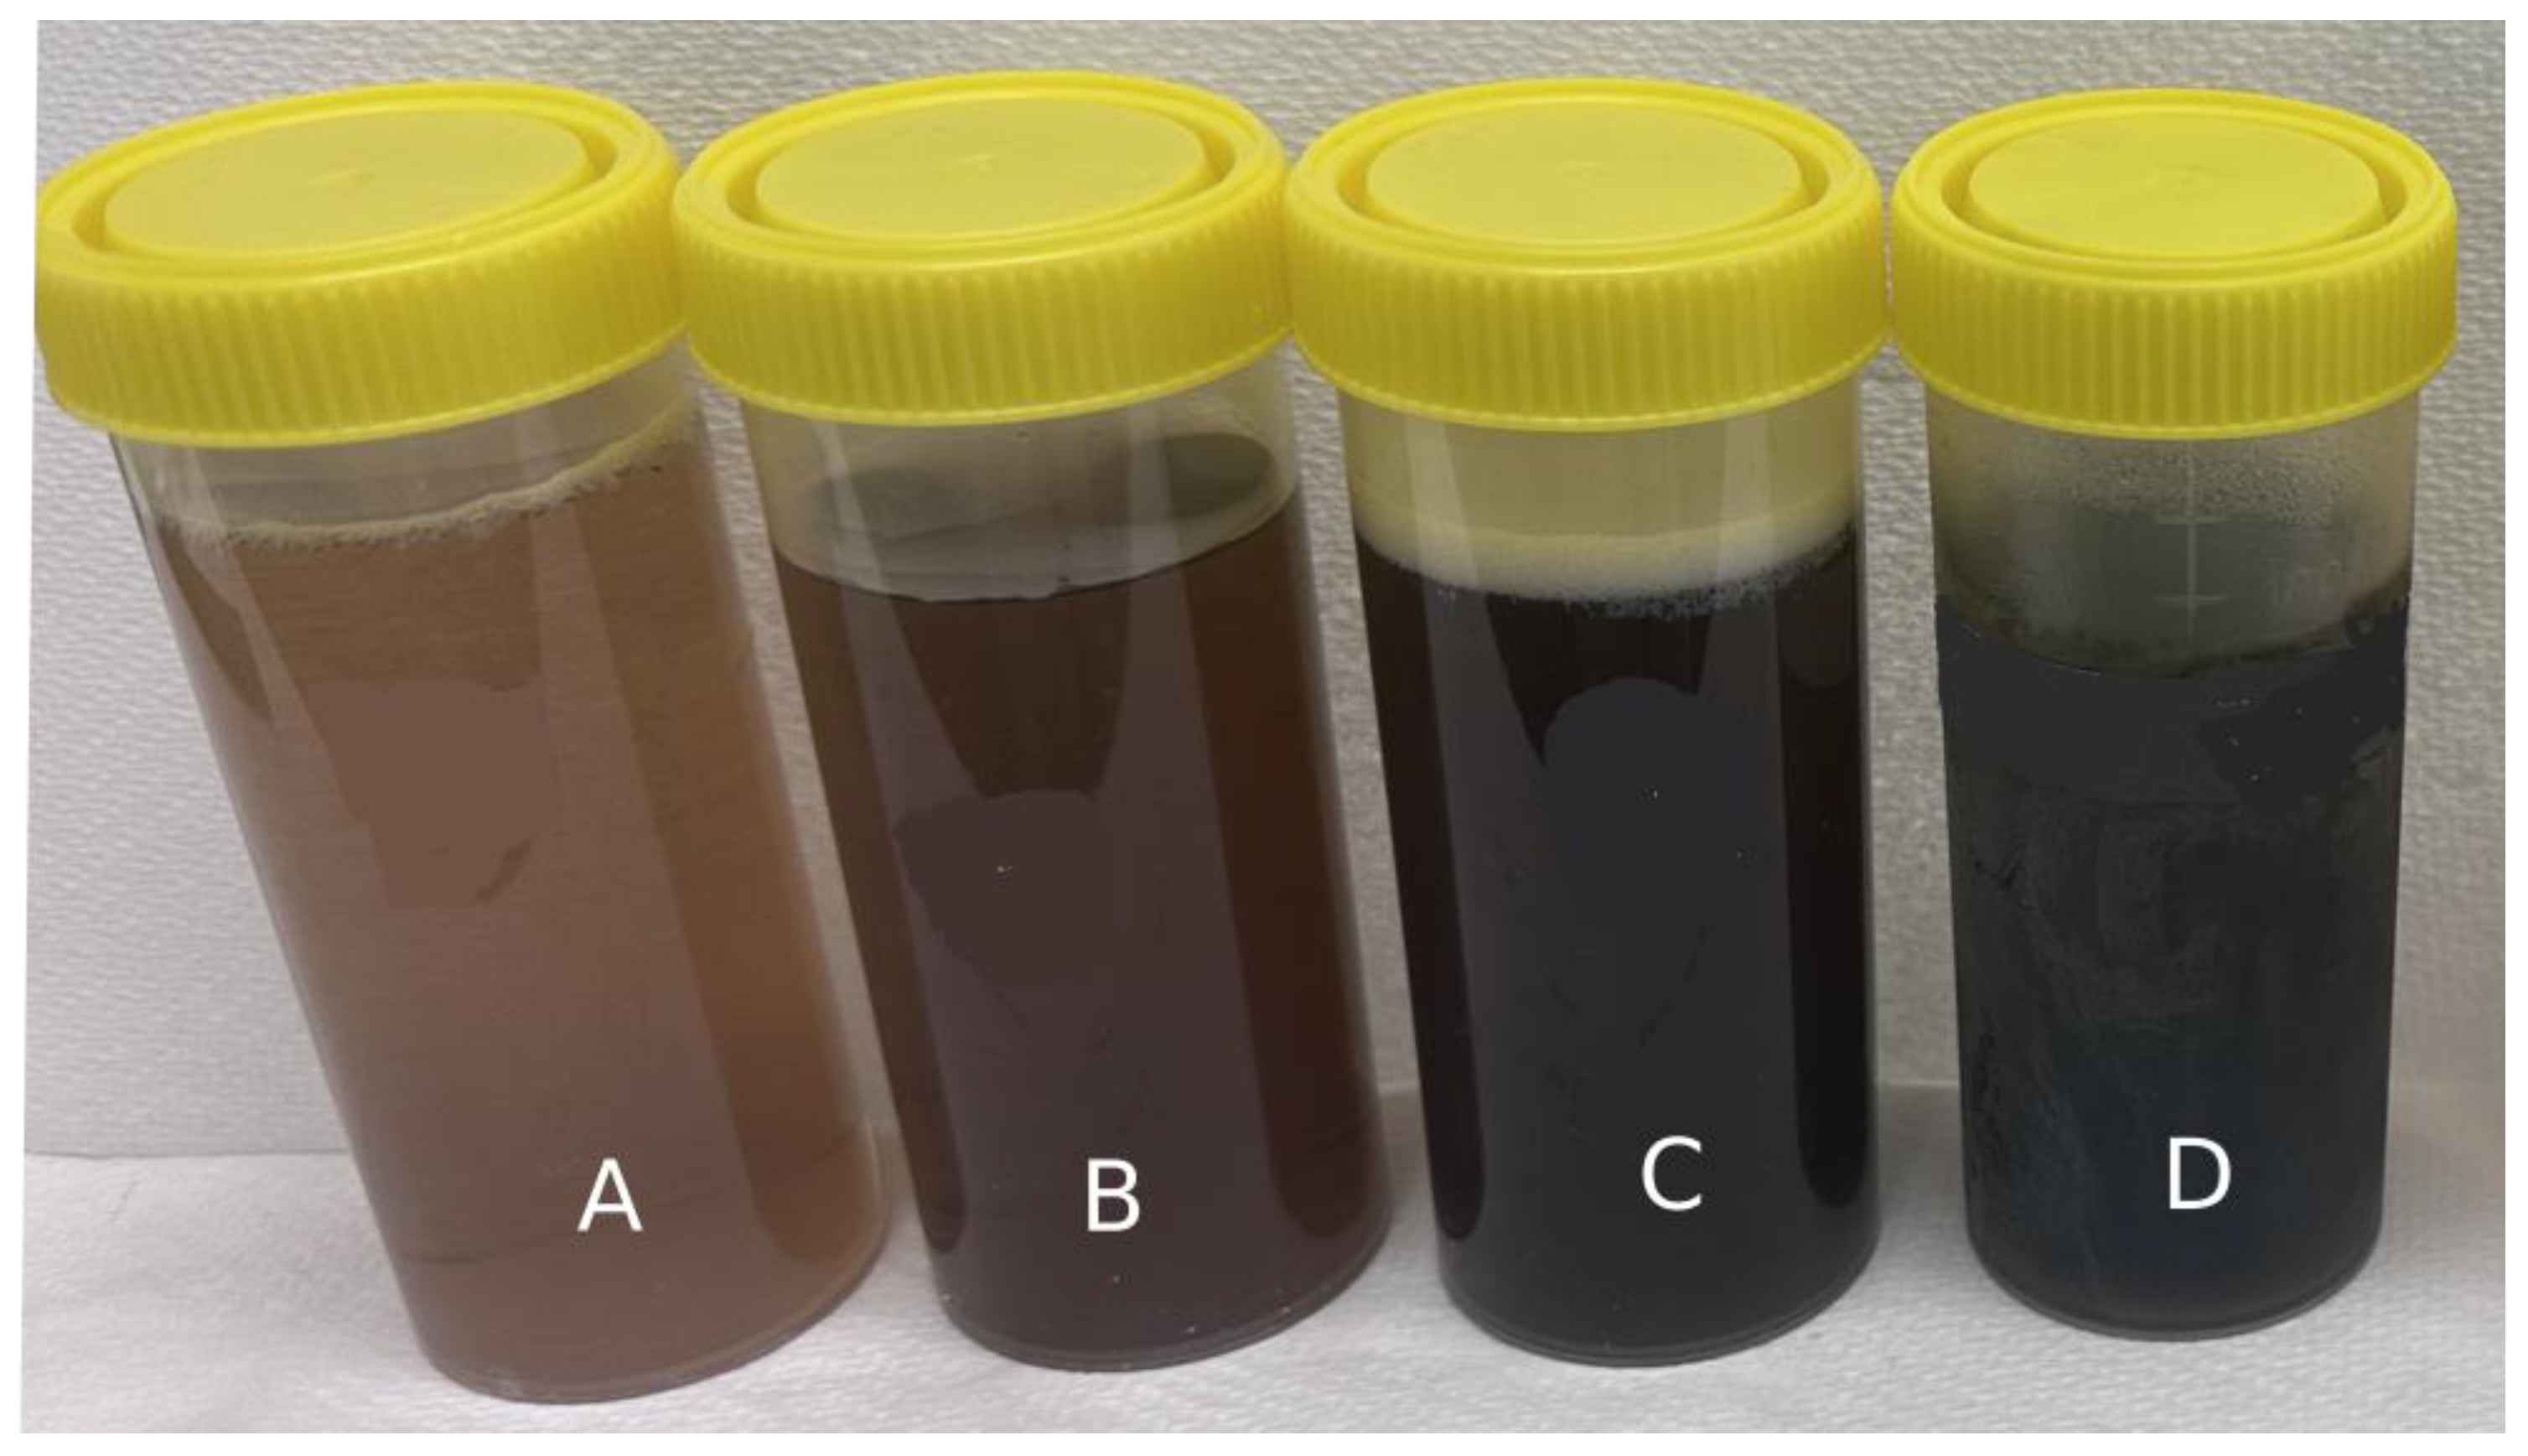
3.3.1. Total Phenolic Content (TPC)
3.3.2. DPPH Scavenging Activity
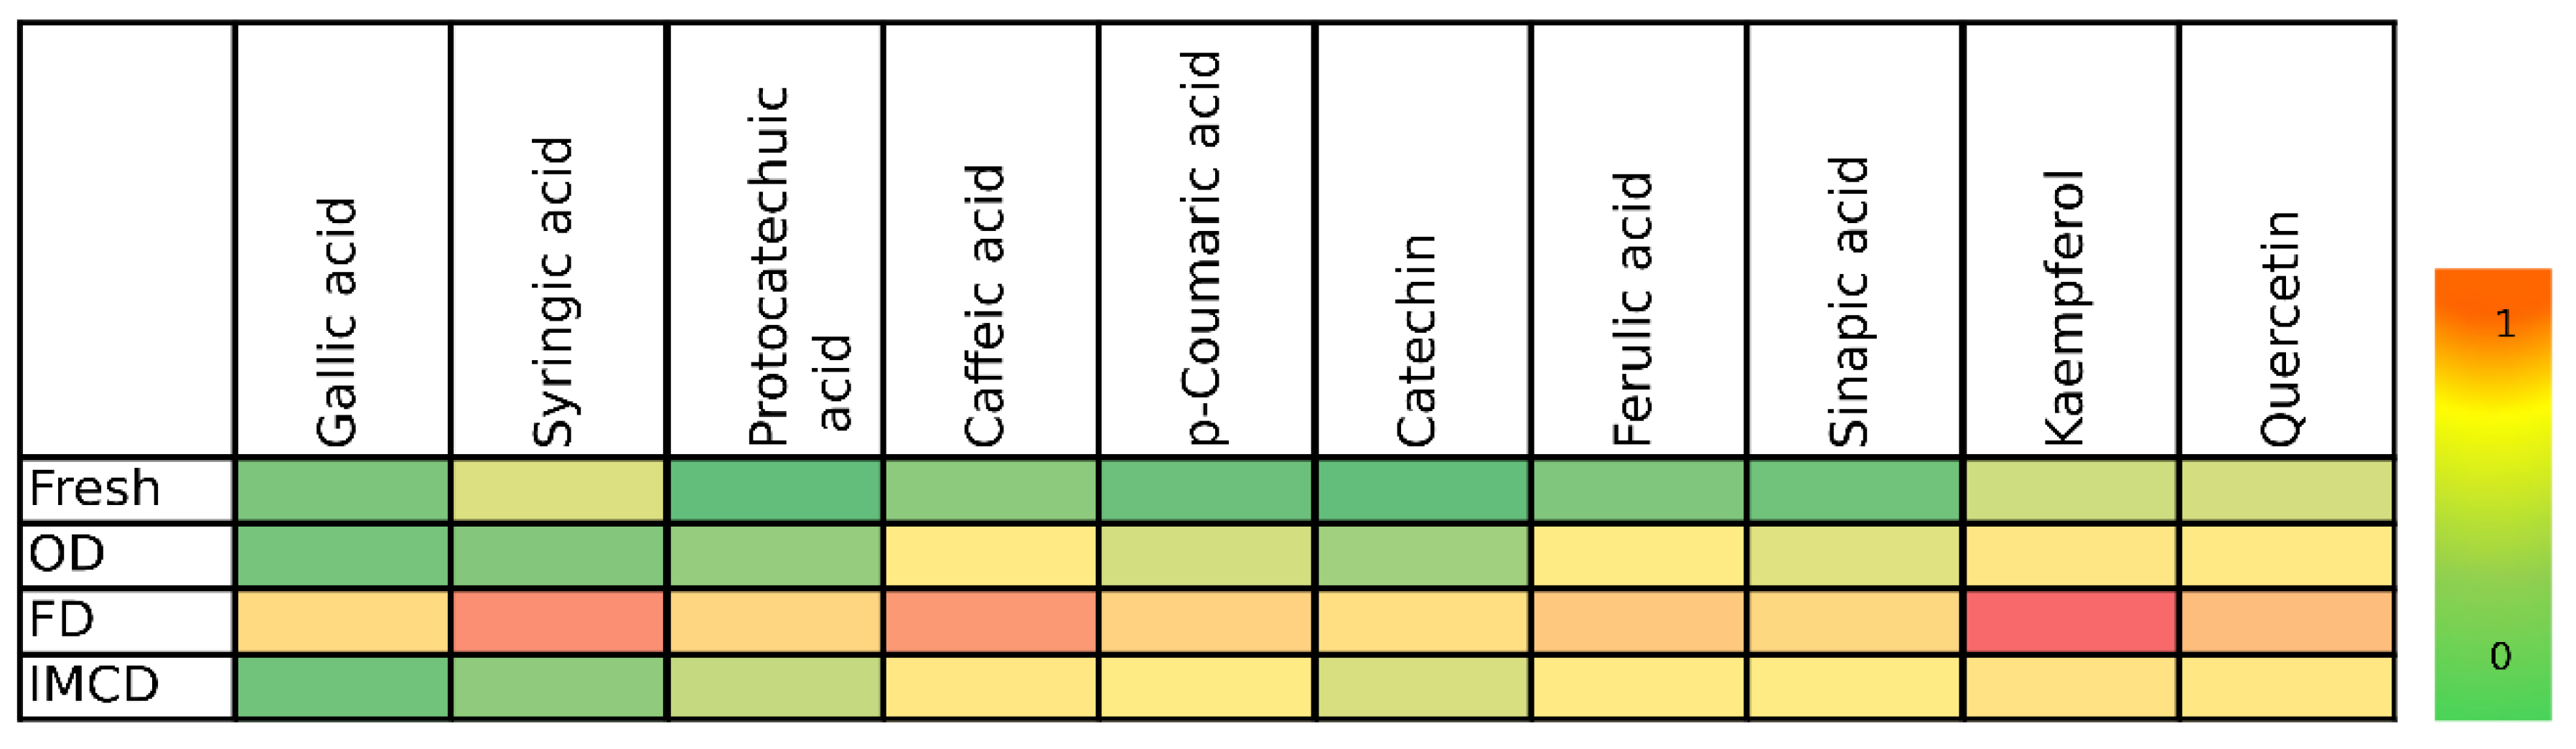
3.3.3. Characterisation of Polyphenols Using LC-MS
4. Conclusions
Author Contributions
Funding
Data Availability Statement
Acknowledgments
Conflicts of Interest
References
- Domínguez Díaz, L.; Fernández-Ruiz, V.; Cámara, M. An international regulatory review of food health-related claims in functional food products labeling. J. Funct. Foods 2020, 68, 103896. [Google Scholar] [CrossRef]
- Alongi, M.; Anese, M. Re-thinking functional food development through a holistic approach. J. Funct. Foods 2021, 81, 104466. [Google Scholar] [CrossRef]
- Yu, M.; Gouvinhas, I.; Rocha, J.; Barros, A.I. Phytochemical and antioxidant analysis of medicinal and food plants towards bioactive food and pharmaceutical resources. Sci. Rep. 2021, 11, 10041. [Google Scholar] [CrossRef] [PubMed]
- El-Shafei, R.; Hegazy, H.; Acharya, B. A review of antiviral and antioxidant activity of bioactive metabolite of macroalgae within an optimized extraction method. Energies 2021, 14, 3092. [Google Scholar] [CrossRef]
- Zou, F.; Tan, C.; Zhang, B.; Wu, W.; Shang, N. The Valorization of Banana By-Products: Nutritional Composition, Bioactivities, Applications, and Future Development. Foods 2022, 11, 3170. [Google Scholar] [CrossRef] [PubMed]
- Panyayong, C.; Srikaeo, K. Effects of hydrocolloids on the qualities of pureed banana inflorescences prepared for individuals with dysphagia. Food Hydrocoll. Health 2023, 3, 100129. [Google Scholar] [CrossRef]
- Wichaphon, J.; Judphol, J.; Tochampa, W.; Singanusong, R. Effect of frying conditions on properties of vacuum fried banana bracts. LWT 2023, 184, 115022. [Google Scholar] [CrossRef]
- Kalwar, P.R.; Kolte, S.S.; Thaker, K. Identification of Progesterone in the Banana Inflorescence of Musa paradisiaca L. Species by Using HPTLC and GC-MS Techniques. Anal. Chem. Lett. 2021, 11, 39–54. [Google Scholar] [CrossRef]
- Pereira, A.; Maraschin, M. Banana (Musa spp.) from peel to pulp: Ethnopharmacology, source of bioactive compounds and its relevance for human health. J. Ethnopharmacol. 2015, 160, 149–163. [Google Scholar] [CrossRef]
- Yimyam, S.; Suppansan, P.; Jankajonchai, K. Effectiveness of banana flower beverage on breast milk production among mothers of preterm neonates. J. Neonatal Nurs. 2023, 29, 755–759. [Google Scholar] [CrossRef]
- Panyayong, C.; Srikaeo, K. Foods from banana inflorescences and their antioxidant properties: An exploratory case in Thailand. Int. J. Gastron. Food Sci. 2022, 28, 100436. [Google Scholar] [CrossRef]
- Rodrigues, A.S.; Kubota, E.H.; da Silva, C.G.; dos Santos Alves, J.; Hautrive, T.P.; Rodrigues, G.S.; Campagnol, P.C.B. Banana inflorescences: A cheap raw material with great potential to be used as a natural antioxidant in meat products. Meat Sci. 2020, 161, 107991. [Google Scholar] [CrossRef] [PubMed]
- Karim, M.A.; Hawlader, M.N.A. Drying characteristics of banana: Theoretical modelling and experimental validation. J. Food Eng. 2005, 70, 35–45. [Google Scholar] [CrossRef]
- Singleton, V.L.; Orthofer, R.; Lamuela-Raventós, R.M. [14] Analysis of total phenols and other oxidation substrates and antioxidants by means of folin-ciocalteu reagent. In Methods in Enzymology; Elsevier: Amsterdam, The Netherlands, 1999; Volume 299, pp. 152–178. [Google Scholar]
- Agcaoili, J. Level of Acceptability of Banana Inflorescence (Musa paradisiaca) Pickle. Herculean J. 2023, 1. [Google Scholar] [CrossRef]
- Ramu, R.; Shirahatti, P.S.; Anilakumar, K.R.; Nayakavadi, S.; Zameer, F.; Dhananjaya, B.L.; Nagendra Prasad, M.N. Assessment of nutritional quality and global antioxidant response of banana (Musa sp. CV. Nanjangud Rasa Bale) pseudostem and flower. Pharmacogn. Res. 2017, 9, S74–S83. [Google Scholar] [CrossRef]
- Lee, H.N.; Jang, Y.; Koh, E. Effect of drying methods on in vitro digestion stability of anthocyanins and polyphenols from omija (Schisandra chinensis Baillon). J. Food Process. Preserv. 2022, 46, e17055. [Google Scholar] [CrossRef]
- Wang, X.; Gao, Y.; Zhao, Y.; Li, X.; Fan, J.; Wang, L. Effect of different drying methods on the quality and microstructure of fresh jujube crisp slices. J. Food Process. Preserv. 2021, 45, e15162. [Google Scholar] [CrossRef]
- Olba-Zięty, E.; Krzyżaniak, M.; Stolarski, M.J. Environmental External Production Costs of Extracts Derived from Poplar-Containing Bioactive Substances. Energies 2023, 16, 7544. [Google Scholar] [CrossRef]
- Ramu, R.; Shirahatti, P.S.; Zameer, F.; Lakkapa, D.B.; Nagendra Prasad, M.N. Evaluation of banana (Musa sp. var. nanjangud rasa bale) flower and pseudostem extracts on antimicrobial, cytotoxicity and thrombolytic activities. Int. J. Pharmcy Pharm. Sci. 2015, 7, 136–140. [Google Scholar]
- Alves-Ferreira, J.; Duarte, L.C.; Fernandes, M.C.; Pereira, H.; Carvalheiro, F. Cistus ladanifer as a potential feedstock for biorefineries: A review. Energies 2022, 16, 391. [Google Scholar] [CrossRef]
- Akcicek, A.; Avci, E.; Tekin-Cakmak, Z.H.; Kasapoglu, M.Z.; Sagdic, O.; Karasu, S. Influence of Different Drying Techniques on the Drying Kinetics, Total Bioactive Compounds, Anthocyanin Profile, Color, and Microstructural Properties of Blueberry Fruit. ACS Omega 2023, 8, 41603–41611. [Google Scholar] [CrossRef] [PubMed]
- Garba, Z.N.; Oviosa, S. The effect of different drying methods on the elemental and nutritional composition of Vernonia amygdalina (bitter leaf). J. Taibah Univ. Sci. 2019, 13, 396–401. [Google Scholar] [CrossRef]
- Garcìa, L.M.; Ceccanti, C.; Negro, C.; De Bellis, L.; Incrocci, L.; Pardossi, A.; Guidi, L. Effect of drying methods on phenolic compounds and antioxidant activity of Urtica dioica L. leaves. Hortic. 2021, 7, 10. [Google Scholar] [CrossRef]
- Hort-Innovation. Australian Horticulture Statistics Handbook 2022/2023; Hort Innovation: Sydney, NSW, Australia, 2023. [Google Scholar]
- Vidinamo, F.; Fawzia, S.; Karim, M.A. Effect of drying methods and storage with agro-ecological conditions on phytochemicals and antioxidant activity of fruits: A review. Crit. Rev. Food Sci. Nutr. 2020, 62, 353–361. [Google Scholar] [CrossRef]
- Pham, N.D.; Karim, M.A. Investigation of nutritional quality evolution of papaya during intermittent microwave convective drying. Dry. Technol. 2022, 40, 3694–3707. [Google Scholar] [CrossRef]
- Kumar, C.; Joardder, M.U.H.; Farrell, T.W.; Karim, M.A. Multiphase porous media model for intermittent microwave convective drying (IMCD) of food. Int. J. Therm. Sci. 2016, 104, 304–314. [Google Scholar] [CrossRef]
- Lien, D.T.P.; Lieu, V.T.T.; Tram, P.T.B.; Toan, H.T. Influence of Different Drying Techniques on Drying Characteristics and Quality Aspects of Pink Lotus (Nelumbo nucifera) Flowers. J. Adv. Res. Food Sci. Nutr. 2020, 3, 16–23. [Google Scholar] [CrossRef]
- Kumar, C.; Karim, M.A. Microwave-convective drying of food materials: A critical review. Crit. Rev. Food Sci. Nutr. 2019, 59, 379–394. [Google Scholar] [CrossRef]
- Mohammed, S.; Edna, M.; Siraj, K. The effect of traditional and improved solar drying methods on the sensory quality and nutritional composition of fruits: A case of mangoes and pineapples. Heliyon 2020, 6, e04163. [Google Scholar] [CrossRef]
- Schmidt, M.M.; Prestes, R.C.; Kubota, E.H.; Scapin, G.; Mazutti, M.A. Evaluation of antioxidant activity of extracts of banana inflorescences (Musa cavendishii). CYTA J. Food 2015, 13, 498–505. [Google Scholar] [CrossRef]
- Kerio, L.; Wachira, F.; Wanyoko, J.; Rotich, M. Characterization of anthocyanins in Kenyan teas: Extraction and identification. Food Chem. 2012, 131, 31–38. [Google Scholar] [CrossRef]
- Alonso-Salces, R.; Korta, E.; Barranco, A.; Berrueta, L.; Gallo, B.; Vicente, F. Determination of polyphenolic profiles of Basque cider apple varieties using accelerated solvent extraction. J. Agric. Food Chem. 2001, 49, 3761–3767. [Google Scholar] [CrossRef]
- Chen, F.; Sun, Y.; Zhao, G.; Liao, X.; Hu, X.; Wu, J.; Wang, Z. Optimization of ultrasound-assisted extraction of anthocyanins in red raspberries and identification of anthocyanins in extract using high-performance liquid chromatography–mass spectrometry. Ultrason. Sonochemistry 2007, 14, 767–778. [Google Scholar] [CrossRef]
- Office for Official Publications of the European Communities. Reports of the Scientific Committee for Food; Office for Official Publications of the European Communities: Luxembourg, 1992; Available online: https://ec.europa.eu/food/fs/sc/scf/reports/scf_reports_29.pdf#page=3.00 (accessed on 9 August 2024).
- Padhi, S.; Dwivedi, M. Physico-chemical, structural, functional and powder flow properties of unripe green banana flour after the application of Refractance window drying. Future Foods 2022, 5, 100101. [Google Scholar] [CrossRef]
- Alam, M.; Biswas, M.; Hasan, M.M.; Hossain, M.F.; Zahid, M.A.; Al-Reza, M.S.; Islam, T. Quality attributes of the developed banana flour: Effects of drying methods. Heliyon 2023, 9, e18312. [Google Scholar] [CrossRef]
- Pongsuwan, C.; Boonsuk, P.; Sermwittayawong, D.; Aiemcharoen, P.; Mayakun, J.; Kaewtatip, K. Banana inflorescence waste fiber: An effective filler for starch-based bioplastics. Ind. Crops Prod. 2022, 180, 114731. [Google Scholar] [CrossRef]
- Chiang, S.-H.; Yang, K.-M.; Lai, Y.-C.; Chen, C.-W. Evaluation of the in vitro biological activities of Banana flower and bract extracts and their bioactive compounds. Int. J. Food Prop. 2021, 24, 1–16. [Google Scholar] [CrossRef]
- Azian, M.; Anisa, A.I.; Iwai, Y. Mechanisms of ginger bioactive compounds extract using Soxhlet and accelerated water extraction. Int. J. Chem. Mater. Sci. Eng. 2014, 8, 438–442. [Google Scholar]
- Santos, K.L.d.O.; Daccache, I.S.C.; de Castro, R.J.S. Synergistic Action of Multiple Enzymes Resulting in Efficient Hydrolysis of Banana Bracts and Products with Improved Antioxidant Properties. Processes 2022, 10, 1807. [Google Scholar] [CrossRef]
- Ramírez-Bolaños, S.; Pérez-Jiménez, J.; Díaz, S.; Robaina, L. A potential of banana flower and pseudo-stem as novel ingredients rich in phenolic compounds. Int. J. Food Sci. Technol. 2021, 56, 5601–5608. [Google Scholar] [CrossRef]
- Quispe-Fuentes, I.; Vega-Gálvez, A.; Aranda, M. Evaluation of phenolic profiles and antioxidant capacity of maqui (Aristotelia chilensis) berries and their relationships to drying methods. J. Sci. Food Agric. 2018, 98, 4168–4176. [Google Scholar] [CrossRef] [PubMed]
- Begum, Y.A.; Deka, S.C. Chemical profiling and functional properties of dietary fibre rich inner and outer bracts of culinary banana flower. J. Food Sci. Technol. 2019, 56, 5298–5308. [Google Scholar] [CrossRef] [PubMed]
- Singhal, P.; Satya, S.; Naik, S. Effect of different drying techniques on the nutritional, antioxidant and cyanogenic profile of bamboo shoots. Appl. Food Res. 2022, 2, 100036. [Google Scholar] [CrossRef]
- Ghafoor, K.; Al Juhaimi, F.; Özcan, M.M.; Uslu, N.; Babiker, E.E.; Ahmed, I.A.M. Total phenolics, total carotenoids, individual phenolics, and antioxidant activity of ginger (Zingiber officinale) rhizome as affected by drying methods. Lwt-Food Sci. Technol. 2020, 126, 109354. [Google Scholar] [CrossRef]
- Fingolo, C.E.; Braga, J.M.A.; Vieira, A.C.M.; Moura, M.R.L.; Kaplan, M.A.C. The natural impact of banana inflorescences (Musa acuminata) on human nutrition. An. Acad. Bras. Cienc. 2012, 84, 891–898. [Google Scholar] [CrossRef] [PubMed]
- Rosa, R.H.; Granja Arakaki, D.; Vieira de Lima, N.; Santos Leite, L.C.; Espindola, P.R.; Domingos de Souza, I.; Aragão do Nascimento, V.; Saldanha Tschinkel, P.F. Determination of macro-and microelements in the inflorescences of banana tree using ICP OES: Evaluation of the daily recommendations of intake for humans. Sci. World J. 2020, 2020, 8383612. [Google Scholar] [CrossRef] [PubMed]
- Basumatary, S.; Nath, N. Assessment of chemical compositions and in vitro antioxidant properties of Musa balbisiana Colla inflorescence. Int. J. Pharm. Res. 2018, 10, 80–85. [Google Scholar]
- Jha, P.; Meghwal, M.; Prabhakar, P.K. Microwave drying of banana blossoms (Musa acuminata): Mathematical modeling and drying energetics. J. Food Process. Preserv. 2021, 45, e15717. [Google Scholar] [CrossRef]
- Iombor, T.T.; Olaitan, I.N.; Ede, R.A. Proximate composition, antinutrient content and functional properties of soursop flour as influenced by oven and freeze drying methods. Curr. Res. Nutr. Food Sci. J. 2014, 2, 106–110. [Google Scholar] [CrossRef]
- Gunavathy, N.; Padmavathy, S.; Murugavel, S. Phytochemical evaluation of Musa acuminate bract using screening of FTIR and UV-VIS spectroscopic analysis. J. Int. Acad. Res. Multidiscip. 2014, 2, 212–220. [Google Scholar]
- Omar, S.; Yusoff, N.S.M.; Muhamad, M.S.; Hamidon, N.; Hamid, N.H.A.; Harun, H.; Sunar, N.M.; Ali, R. The characterization of banana blossom peel and floret as an adsorbent for the removal of manganese in groundwater. In Postgraduate Symposium on Industrial Science and Technology, SISTEC 2019; Sutjipto, A.G.E., Zulkifli, F.H., Misnon, I.I., Eds.; Trans Tech Publications Ltd.: Zurich, Switzerland, 2020; Volume 981 MSF, pp. 362–368. [Google Scholar]
- Prithivirajan, R.; Narayanasamy, P.; Al-Dhabi, N.A.; Balasundar, P.; Shyam Kumar, R.; Ponmurugan, K.; Ramkumar, T.; Senthil, S. Characterization of Musa paradisiaca L. Cellulosic Natural Fibers from Agro-discarded Blossom Petal Waste. J. Nat. Fibres 2020, 17, 1640–1653. [Google Scholar] [CrossRef]
- Kumar, P.S.; Saravanan, A.; Sheeba, N.; Uma, S. Structural, functional characterization and physicochemical properties of green banana flour from dessert and plantain bananas (spp.). Lwt-Food Sci. Technol. 2019, 116, 108524. [Google Scholar] [CrossRef]
- Amini Khoozani, A.; Birch, J.; Bekhit, A.E.D.A. Textural properties and characteristics of whole green banana flour produced by air-oven and freeze-drying processing. J. Food Meas. Charact. 2020, 14, 1533–1542. [Google Scholar] [CrossRef]
- Amutha, K.; Sudha, A.; Saravanan, D. Characterization of Natural Fibers Extracted from Banana Inflorescence Bracts. J. Nat. Fibres 2020, 19, 872–881. [Google Scholar] [CrossRef]
- Bensemmane, N.; Bouzidi, N.; Daghbouche, Y.; Garrigues, S.; de la Guardia, M.; El Hattab, M. Prediction of total phenolic acids contained in plant extracts by PLS-ATR-FTIR. S. Afr. J. Bot. 2022, 151, 295–305. [Google Scholar] [CrossRef]
- Kumar, N.; Sami, R.; Khojah, E.; Aljahani, A.H.; Al-Mushhin, A.A. Effects of drying methods and solvent extraction on quantification of major bioactive compounds in pomegranate peel waste using HPLC. Sci. Rep. 2022, 12, 8000. [Google Scholar] [CrossRef] [PubMed]
- Boulekbache-Makhlouf, L.; Medouni, L.; Medouni-Adrar, S.; Arkoub, L.; Madani, K. Effect of solvents extraction on phenolic content and antioxidant activity of the byproduct of eggplant. Ind. Crops Prod. 2013, 49, 668–674. [Google Scholar] [CrossRef]
- Bhatta, S.; Stevanovic Janezic, T.; Ratti, C. Freeze-drying of plant-based foods. Foods 2020, 9, 87. [Google Scholar] [CrossRef] [PubMed]
- Borah, T.; Washmin, N.; Bora, N.J.; Saikia, J.; Bomzon, P.S.; Ahmed, T.H.; Manna, P.; Saikia, S.P.; Banik, D. Effect of drying techniques on yield, nutritional, minerals of wild banana pulp (Musa balbisiana Colla): Physicochemical and morphological characterization thereof. Br. Food J. 2021, 123, 3624–3637. [Google Scholar] [CrossRef]
- Bashmil, Y.M.; Ali, A.; Bk, A.; Dunshea, F.R.; Suleria, H.A. Screening and Characterization of Phenolic Compounds from Australian Grown Bananas and Their Antioxidant Capacity. Antioxidants 2021, 10, 1521. [Google Scholar] [CrossRef]
- Gayathry, K.; John, J.A. Phenolic profile, antioxidant, and hypoglycaemic potential of pseudostem and inflorescence extracts of three banana cultivars. Biomass Convers. Biorefin. 2023, 1–9. [Google Scholar] [CrossRef]
- Ehtiati, S.; Alizadeh, M.; Farhadi, F.; Khalatbari, K.; Ajiboye, B.O.; Rahimi, V.B.; Askari, V.R. Promising influences of caffeic acid and caffeic acid phenethyl ester against natural and chemical toxins: A comprehensive and mechanistic review. J. Funct. Foods 2023, 107, 105637. [Google Scholar] [CrossRef]
- Shahbaz, M.; Imran, M.; Alsagaby, S.A.; Naeem, H.; Al Abdulmonem, W.; Hussain, M.; Abdelgawad, M.A.; El-Ghorab, A.H.; Ghoneim, M.M.; El-Sherbiny, M. Anticancer, antioxidant, ameliorative and therapeutic properties of kaempferol. Int. J. Food Prop. 2023, 26, 1140–1166. [Google Scholar] [CrossRef]
- Chiang, M.-C.; Tsai, T.-Y.; Wang, C.-J. The potential benefits of quercetin for brain health: A review of anti-inflammatory and neuroprotective mechanisms. Int. J. Mol. Sci. 2023, 24, 6328. [Google Scholar] [CrossRef] [PubMed]


| Colour | Fresh | CD | FD | IMCD |
|---|---|---|---|---|
| Physic |  |  | 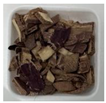 | 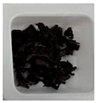 |
| a* Redness | 16.30 ± 0.10 a | 4.77 ± 0.06 c | 7.07 ± 0.12 b | 2.83 ± 0.06 d |
| b* Yellowness | 13.23 ± 0.12 b | 9.60 ± 0.10 c | 15.30 ± 0.10 a | 7.40 ± 0.14 d |
| L* Lightness | 33.77 ± 0.15 a | 15.43 ± 0.15 c | 28.43 ± 0.06 b | 11.8 ± 0.10 d |
| C* Chroma | 20.99 ± 0.15 a | 10.72 ± 0.12 c | 16.85 ± 0.13 b | 7.92 ± 0.02 d |
| h* Hue | 0.68 ± 0.01 d | 1.11 c | 1.14 b | 1.21 ± 0.01 a |
| Drying Method | Moisture % | Ash % | pH | TSS (Brix) | Drying Yield |
|---|---|---|---|---|---|
| CD | 7.89 ± 0.51 b | 14.71 ± 0.58 | 5.20 ± 0.10 b | 18.53 ± 0.42 c | 8.28 ± 0.22 b |
| FD | 8.22 ± 0.51 b | 15.50 ± 0.22 | 5.40 ± 0.20 b | 20.23 ± 0.15 a | 9.73 ± 0.21 a |
| IMCD | 7.40 ± 0.33 b | 14.81 ± 0.05 | 5.17 ± 0.12 b | 19.33 ± 0.12 b | 9.60 ± 0.46 a |
| Fresh (control) * | 92.33 ± 0.58 a | - | 5.83 ± 0.12 a | 17.30 ± 0.10 d | - |
| p-value ** | 0.000 | 0.069 | 0.001 | 0.000 | 0.003 |
| Drying Method | Swelling Capacity | Bulk Density (g/mL) | Tapped Density | Water-Holding Capacity (g/g) | Oil-Holding Capacity (g/g) | C % | H % | N % |
|---|---|---|---|---|---|---|---|---|
| CD | 7.29 ± 0.17 b | 0.46 ± 0.04 b | 0.63 ± 0.02 b | 6.29 ± 0.17 b | 2.52 ± 0.10 b | 42.66 ± 0.74 | 5.07 ± 0.13 | 2.58 ± 0.07 a,b |
| FD | 10.35 ± 0.44 a | 0.13 ± 0.03 c | 0.28 ± 0.02 c | 9.35 ± 0.44 a | 6.01 ± 0.41 a | 41.59 ± 0.24 | 5.08 ± 0.10 | 2.48 ± 0.15 b |
| IMCD | 6.92 ± 0.03 b | 0.58 ± 0.01 a | 0.68 ± 0.01 a | 5.96 ± 0.03 b | 2.23 ± 0.06 b | 42.66 ± 0.74 | 5.03 ± 0.17 | 2.78 ± 0.03 a |
| p-value * | 0.000 | 0.000 | 0.000 | 0.000 | 0.000 | 0.126 | 0.919 | 0.027 |
| Compound | Molecular Formula | RT (min) | Ionization (ESI+/ESI−) | Molecular Weight | Theoretical (m/z) | Observed (m/z) | Fresh (mg/100 g) | CD (mg/100 g) | FD (mg/100 g) | IMCD (mg/100 g) |
|---|---|---|---|---|---|---|---|---|---|---|
| Gallic acid | C7H6O5 | 0.62 | [M–H]- | 170.0215 | 169.0142 | 169.0139 | 0.074 ± 0.02 | 0.063 ± 0.00 | 4.21 ± 0.10 | 0.05 ± 0.00 |
| Syringic acid | C9H10O5 | 0.691 | [M–H]- | 198.1700 | 198.0528 | 197.8081 | 0.27 ± 0.02 | 0.09 ± 0.01 | 20.32 ± 1.59 | 0.114 ± 0.02 |
| Protocatechuic acid | C13H16O9 | 2.3 | [M–H]- | 154.0266 | 153.0193 | 153.019 | 0.02 ± 0.00 | 0.125 ± 0.04 | 5.268 ± 0.30 | 0.222 ± 0.03 |
| Caffeic acid | C9H8O4 | 8.34 | [M–H]- | 180.0423 | 179.035 | 179.0347 | 0.107 ± 0.03 | 0.746 ± 0.17 | 18.035 ± 0.31 | 1.338 ± 0.11 |
| p-coumaric acid | C9H8O3 | 13.17 | [M–H]- | 164.0473 | 163.04 | 163.0397 | 0.041 ± 0.01 | 0.252 ± 0.04 | 5.724 ± 0.34 | 0.44 ± 0.04 |
| Catechin | C15H14O6 | 15.26 | [M–H]- | 290.079 | 289.0717 | 289.0715 | 0.023 ± 0.00 | 0.149 ± 0.03 | 2.966 ± 0.15 | 0.26 ± 0.03 |
| Ferulic acid | C10H10O4 | 18.16 | [M–H]- | 194.0579 | 193.0506 | 193.0503 | 0.08 ± 0.01 | 0.404 ± 0.10 | 7.763 ± 0.27 | 0.687 ± 0.05 |
| Sinapic acid | C11H12O5 | 21.59 | [M–H]- | 224.0685 | 223.0612 | 223.0609 | 0.049 ± 0.00 | 0.279 ± 0.06 | 4.659 ± 0.16 | 0.46 ± 0.05 |
| Kaempferol | C13H16O9 | 16.83 | [M–H]- | 286.0477 | 285.0404 | 285.0397 | 0.244 ± 0.05 | 1.45 ± 0.23 | 28.302 ± 1.60 | 2.485 ± 0.25 |
| Quercetin | C15H10O7 | 40.83 | [M–H]- | 302.0427 | 301.0354 | 301.0343 | 0.254 ± 0.01 | 0.906 ± 0.16 | 10.317 ± 0.32 | 1.397 ± 0.08 |
Disclaimer/Publisher’s Note: The statements, opinions and data contained in all publications are solely those of the individual author(s) and contributor(s) and not of MDPI and/or the editor(s). MDPI and/or the editor(s) disclaim responsibility for any injury to people or property resulting from any ideas, methods, instructions or products referred to in the content. |
© 2024 by the authors. Licensee MDPI, Basel, Switzerland. This article is an open access article distributed under the terms and conditions of the Creative Commons Attribution (CC BY) license (https://creativecommons.org/licenses/by/4.0/).
Share and Cite
Senevirathna, N.; Hassanpour, M.; O’Hara, I.; Karim, A. Investigation of the Effects of Energy-Efficient Drying Techniques and Extraction Methods on the Bioactive and Functional Activity of Banana Inflorescence. Energies 2024, 17, 4119. https://doi.org/10.3390/en17164119
Senevirathna N, Hassanpour M, O’Hara I, Karim A. Investigation of the Effects of Energy-Efficient Drying Techniques and Extraction Methods on the Bioactive and Functional Activity of Banana Inflorescence. Energies. 2024; 17(16):4119. https://doi.org/10.3390/en17164119
Chicago/Turabian StyleSenevirathna, Nuwanthi, Morteza Hassanpour, Ian O’Hara, and Azharul Karim. 2024. "Investigation of the Effects of Energy-Efficient Drying Techniques and Extraction Methods on the Bioactive and Functional Activity of Banana Inflorescence" Energies 17, no. 16: 4119. https://doi.org/10.3390/en17164119