Abstract
Optical current sensors have been developed and improved over the past few decades, and they have been increasingly employed in power systems, including smart and high-voltage grids. This is due to their many advantages over conventional electromagnetic current sensors, such as reduced size and weight, greater operational safety, and electromagnetic immunity. Like any measuring instrument or system, their quality and reliability are associated with measurement uncertainty, which quantifies their precision. This measurement uncertainty depends on a series of influencing quantities, such as the wavelength of light used in the sensor, the birefringence of the optical material used in the construction of the sensor, and environmental conditions, such as temperature and vibration. This article presents a review of the main influences that affect the quality and performance of optical current sensors and how these influences can be used to estimate measurement uncertainty. The main objective is to serve as a guide or reference for the identification and evaluation of uncertainty sources in optical current sensors used in power systems.
1. Introduction
Electromagnetic induction current transformers (CTs) are measuring devices of significant importance in power systems, being used for the most diverse purposes through the measurement of high-voltage electrical currents. Optical current sensors (OCSs) have many advantages over conventional CTs, such as reduced weight and dimensions, facilitating installation, maintenance, and use in remote or difficult-to-access areas; operational safety, as they are constructed using dielectric materials, and potentially catastrophic events will not cause explosions, as is the case for conventional oil-filled transformers, and there will be no critical situations when opening the secondary sides of the current transformers; linearity throughout their dynamic range; relative lower prices; wide bandwidth; absence of magnetic saturation effects; electromagnetic immunity (as they are non-electric sensors); AC and DC measurements; and low power consumption [1,2,3,4]. Table 1 summarizes the main differences between CTs and OCSs.

Table 1.
Main differences between CTs and OCSs.
However, despite the extensive list of advantages of optical current sensors over conventional sensors, CTs are still known to be reliable in terms of accuracy and stability. This is not the case for OCSs, for which evaluations of these properties have not yet yielded conclusive or definitive results. In general, OCSs still need to be better characterized metrologically in terms of error and uncertainty so they can obtain a level of reliability similar to or better than CTs. This is one of the reasons why their use has not yet been disseminated, and it is the current challenge for the development of OCSs [5,6,7,8]. OCSs have several components, and each of these has behaviors and performance that affect their reliability. If the effects of these components on the response of the OCSs are not known and adequately modeled, the measurements performed will include large errors and uncertainty, significantly compromising the reliability of the sensor. Depending on the characteristics of the sensor and the measurement to be performed, these error or uncertainty sources can become significant or insignificant. Temperature fluctuations alone can cause variations in the response of some OCSs of up to a few percent, as will be shown throughout this article. If these variations have not been properly modeled, the measurement uncertainty of the respective OCS will be quite high, making its use unacceptable, depending on the application.
There is little literature available on discussions about the modeling and quantification of each of the OCS error or uncertainty sources and their combination to obtain sensor measurement uncertainty. Some authors deal with the metrological aspects of optical current sensors but focus only on error and accuracy [9,10]. There are still few approaches regarding measurement uncertainty or precision. The main objective of this paper is to serve as a reference or guide for identifying the uncertainty contributions that affect the performance of optical current sensors based on the Faraday effect. Another objective is to propose methods to estimate uncertainty in such a way that they are minimized. It is not the objective of this paper to estimate the identified uncertainty contributions, nor to estimate the measurement uncertainty of OCSs. Contributions from authors who determined the influence of quantities on the performance of optical current sensors were researched and are presented in this article, and it was also evaluated how the results obtained can be used to estimate the uncertainty contribution arising from these influencing quantities. Subsequently, the natures of some uncertainty contributions were analyzed to suggest an appropriate way to carry out their estimation. The main configurations used in optical current sensors were evaluated, and the contribution of each sensor functional module—light source, optical material, detection scheme, and indication of measured values—and its components to measurement uncertainty was evaluated. This paper is divided as follows: Section 2 presents the operating principle and the main characteristics of optical current sensors that are relevant for estimating their measurement uncertainty; Section 3 presents a review and analyzes the main factors that cause variations in the responses of OCSs, affect their performance, and can be considered sources of uncertainty; Section 4 summarizes the main sources of uncertainty and presents some suggestions for their estimation. Finally, Section 5 presents some conclusions and future perspectives.
2. Optical Current Sensors
Currently, optical current sensors (often referred to as optical current transducers, OCTs, or optical current transformers) are used for the most diverse purposes in electrical power systems, such as control, protection, revenue metering, power quality monitoring, measurement of the arbitrary form of primary currents, calibration, and measurement of current transients and impulses [11,12,13,14,15]. Rose et al. [16] presented the use and performance of an optical current sensor with an in-line Sagnac interferometer using a spun polarization-maintaining fiber as the sensing element in measurement and protection applications in high-voltage alternating current systems and in control, measurement, and protection applications in power systems in high-voltage direct current (HVDC) systems. In the area of protection of power systems, Azad et al. [17] present a data-based primary fault detection and identification algorithm for HVDC grids where current measurements are performed by OCSs. The algorithm benefits from the wide bandwidth of OCSs. Lei et al. [18] proposed a method for the measurement of transformer inrush currents using an OCS, taking advantage of its immunity to the effects of magnetic saturation. Ivanov et al. [19] provided a comparison between CT and OCS measurements of a 250 MVA auto-transformer re-energizing inrush current obtained during a field test at a 500 kV substation. Li et al. [20] proposed a transfer standard for the calibration of high-voltage DC currents using an OCS that employed spun optical fibers as the sensing element, which achieved an accuracy of 0.1%. Zhao, Shi, and Sun [21] developed and evaluated an OCS for use in power grids up to 1100 kV DC. Zhou et al. [22] proposed a new operating mechanism for a DC optical current transformer with the aim of overcoming situations of improper operation of a power grid protection system.
Applications of OCSs in high-voltage substations usually require accuracies down to 0.2%, often over a temperature range of tens of degrees Celsius. However, research has shown that ensuring this accuracy is challenging. Several influencing factors, such as mechanical disturbances, temperature variation effects on the optical elements, vibration, residual linear birefringence inside sensing coils, and others, deteriorate the performance of OCSs [23,24].
Regarding smart grids, they have been disseminated in recent years, and their monitoring is increasingly crucial for their reliable and safe operation, which is carried out through sensors that measure the generation and consumption of energy, characterize operating states, and detect the current topology of the network. In electrical systems, the most important electrical parameters to be measured are voltage and current. Considering that optical current sensors have the advantages of reduced weight and dimensions, facilitating their installation and maintenance, and even allowing the measurement of electrical currents without contact with the primary circuit while still having low prices, they become promising alternatives for use in smart grids [1,25].
The optical sensors discussed in this paper have their operating principle based on the Faraday Effect. The Faraday effect describes the relation between light and a magnetic field. Also called the magnetic–optical effect, and first observed by the English physicist Michael Faraday in 1845, this phenomenon consists of the rotation of the polarization direction of a linearly polarized (LP) light wave when subjected to the action of a magnetic field throughout its propagation in a transparent medium. As can be seen in Figure 1, a beam of light with a certain wavelength, when passing through an optical medium under the influence of a magnetic field, undergoes a change in the direction of its electric field. This change in the direction of the electric field is called Faraday rotation. Through this phenomenon, it is possible to measure an electrical current as a function of the magnetic field produced by it, using sensors built using optical materials suitable for this purpose. The magnetic field B produced by an electrical current I in the air is given by Equation (1), where µ0 is the magnetic permeability of air (vacuum). The Faraday rotation angle θF of the electric field E resulting from propagation along a path L under the action of a magnetic field B is given by Equation (2), where V is the Verdet constant of the optical material and depends on the temperature T and on the wavelength of the light λ.
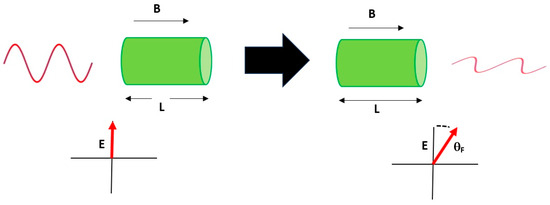
Figure 1.
Faraday effect in linearly polarized light.
The measurement of the Faraday rotation angle can be performed using two methods: polarimetric and interferometric detection. In the polarimetric method, the intensity change due to polarization rotation from the induced magnetic field generated by a current is detected. An LP light wave is injected into the optical sensor that will measure the electrical current. The light wave is then analyzed at the output of the sensor using a second polarizer and a photodetector. The analyzer and photodetector combination converts and modulates polarized light into an electrical signal, which in turn corresponds to the electrical current to be measured [26,27]. The bandwidth of the polarimetric detection scheme is only affected by the response speed of the detector, and its upper measurement frequency can be up to 100 MHz, so it can be used for transient current measurements. Polarimetric devices are severely susceptible to the effect of linear and circular birefringence, which can cause distortion of the polarization rotation as well as reducing sensor accuracy and sensitivity. This results in false current readings from these perturbations [28].
In the interferometric method, the linear polarization of light is divided into two orthogonal circularly polarized light waves: one with circular polarization on the left and one on the right. When light waves pass through the sensor, the magnetic field that is created by the current being measured slows down one component and speeds up the other due to the Faraday effect. The change between the two circularly polarized light waves can be used as a detection signal [14,29].
OCSs can have two types of structure regarding the enclosure of the conductor of the electrical current to be measured by the sensing element. Closed-core sensors completely surround the current conductor and, for this reason, they are less susceptible to certain types of influences, such as vibration and stray magnetic fields. Open-core sensors do not completely surround the conductor and are, therefore, more susceptible to vibration and stray magnetic fields but are easy to install and use [30]. Figure 2 shows both types of OCS structures.
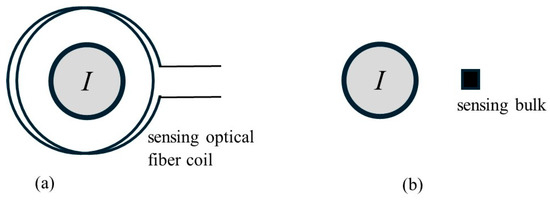
Figure 2.
Types of OCS structure in relation to the position of the conductor of the electrical current I to be measured: (a) closed-core; (b) open-core.
According to their sensing element, OCSs can be classified into two main groups: bulk sensors and fiber sensors. The first group uses a magneto-optical glass structure as a sensor element with a high Verdet constant. Shui et al. [31] used this advantage to build a sensor, the optical material of which had a Verdet constant of approximately 109 rad/(T·m), capable of measuring low currents up to 2.5 A. Bulk sensors have some advantages over fiber sensors. In addition to having a higher Verdet constant, they are smaller and more mechanically rigid in such a way that mechanical gradients, thermal variations, vibrations, and external noise do not significantly alter performance. Bulk sensors are further protected against the influences of temperature variation because they are usually not in contact with the conductor of the electrical current to be measured or are constructed with the encapsulation of a dielectric material. Furthermore, due to their low photoelastic coefficient, their linear birefringence is very small, which allows sensors with high sensitivity to be obtained [32,33,34]. A disadvantage of bulk sensors occurs when they have an open-core structure. In this situation, they become susceptible to the influence of external magnetic fields. This occurs, for example, in power systems or transmission lines with more than one phase, where the current conductors are generally parallel to each other. The current measurement in one phase can be influenced by the magnetic field generated by the current in the other phases.
In fiber optic current sensors, the sensing element is the fiber itself. The main advantage of these sensors is the possibility of involving the entire conductor of the electrical current to be measured. The sensitivity of these sensors can be adjusted by increasing or decreasing the number of fiber turns around their conductors. This way, the sensors can use several meters of fiber, which will make them more sensitive to environmental variables, such as temperature and vibration, when compared with bulk sensors. However, as fiber optic sensors form a closed path along an electrical current conductor, they become insensitive to external magnetic fields [32].
Figure 3 shows an OCS block diagram. This is useful to identify and classify uncertainty sources. In an OCS, a light wave originating from an optical source with a certain operating wavelength is linearly polarized by a polarizer, becoming LP light. It is transmitted through a magneto-optical material, which is subjected to the magnetic field produced by the electrical current to be measured (the sensor itself). After this propagation, the modified light is received by the detection devices (photodetectors), which in turn measure the rotation angle of the polarization plane caused by the magnetic field, transforming it into an electrical signal. This signal is then transformed into a digital signal through an analog–digital (A/D) board or card. These digital signals are processed by software, which presents the measured electrical current to the user through a panel, communication interface, or other means.
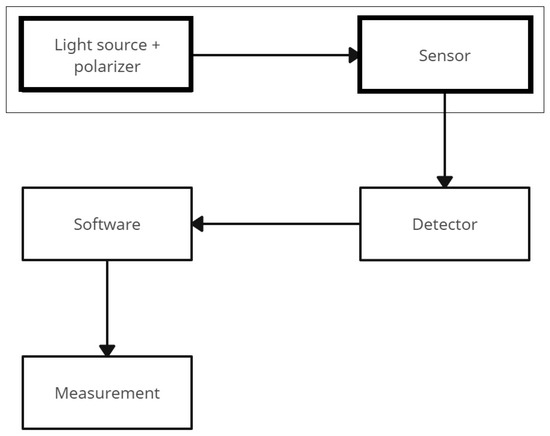
Figure 3.
OCS basic block diagram.
3. Uncertainty Sources
This section presents and discusses the most important contributions to OCS measurement uncertainty. Some of the most important uncertainty contributions are those due to the influence of temperature, vibration, birefringence, and aging and stability of optical and signal processing devices in the sensors [16,34,35]. These sources of uncertainty can also be grouped into two classes: those related to the inherent characteristics of the sensors and their components, such as birefringence and short- and long-term stability, and those arising from the environmental conditions and use of the sensors, such as temperature, vibration, and parasitic magnetic fields. Other environmental conditions do not directly contribute to measurement uncertainty, such as relative humidity and solar radiation. In the case of humidity, if it is very high, it can be a limiting factor for the use of optoelectronic devices, such as A/D boards and photodetectors, since these generally have a maximum limit for ambient humidity declared by their manufacturers.
3.1. Temperature
Temperature variation significantly influences the behavior of OCSs, thus contributing to measurement uncertainty. The main mechanisms of how this influence occurs are the following: (a) the Verdet constant of an optical material is a function of temperature, so temperature variations will cause variations in the Verdet constant; (b) the wavelength of the light generated by the light source is a function of temperature, so variations in temperature will cause variations in the generated wavelength, since the Verdet constant of the optical material depends on the wavelength and the rotation angle and, consequently, the response of an OCS will vary (the wavelength of the light generated by the light source also changes with fluctuations in the driving current); (c) temperature variations change the behavior and response of optoelectronic components used in an OCS, such as photodiodes and data acquisition units; (d) temperature induces linear birefringence in the optical material; and (e) temperature variation causes changes in the dimensions of sensor components, which can cause changes in their behavior. When modeling uncertainty contributions arising from temperature, two main situations can be established: one in which temperature fluctuations during measurement modify the performance of the sensor and its components, and another where the sensor is used at a temperature different from that at which it and its components have been calibrated.
To minimize the effect of temperature on measurement uncertainty, the most immediate solution would be to use OCSs in situations where there is reduced temperature variation. However, this solution is not always practical, especially in outdoor applications. Another solution is to implement temperature compensation schemes. Many temperature compensation schemes have been proposed and can be found in the literature [36,37,38,39,40,41]. Despite this, the residual temperature effects need to be quantified and have an influence on the uncertainty of the measurement evaluated. The temperature-compensated fiber OCS developed by Zhao, Shi, and Sun [21] reached a response variation of about ±0.4% in a temperature range from −40 °C to 70 °C. In a narrower temperature range from 10 °C to 40 °C, this variation was approximately 0.15%. Li et al. [42] evaluated the impact of temperature variations of up to 40 °C on the measurement of the Faraday rotation angle on a bulk sensor, finding values of up to 9% for this variation. Jia et al. [43] proposed a temperature compensation method in a bulk optical current sensor through the insertion of a static bias composed of permanent magnets, where the error due to temperature variation reduced from ±8% to ±1% in a range from −20 °C to 80 °C.
Hoffman [44] presented variations in the Verdet constants of different optical glasses according to wavelength in the visible spectral range. For Schott flint glasses of the SF class, the Verdet constant varies with the inverse square of the wavelength. Figure 4 shows the Verdet constant wavelength dependence of SF-57 flint glass. It was observed that glasses with a higher concentration of PbO presented higher Verdet constants. Chen et al. [45] measured the average wavelength variation of a superluminescent diode (SLD) in a temperature range of 15 °C to 45 °C. When the temperature varied, the variation in the average wavelength had a linear trend. A variation in wavelength of about ±0.6 nm/K was measured in the wavelength region of 1310 nm. Wang et al. [46] measured a ±5 nm variation at the 1310 nm center wavelength of a light source due to temperature fluctuation from 10 °C to 30 °C and a ±12.5 nm variation due to driving current variation from 15 mA to 80 mA. This wavelength variation caused a variation in the Verdet constant of an SF6 glass bulk OCS of ±1.35%. Knowing the values of the variation in the wavelength of the light source as a function of temperature and the variation of the Verdet constant of the sensor’s optical material as a function of the wavelength, it is possible to correct the sensor’s response to the wavelength at the temperature at which it is being used. The uncertainty of these values and the uncertainty in measuring the sensor’s operating temperature must be estimated and considered when estimating the measurement uncertainty. Müller et al. [47] demonstrated a method for self-compensation of the change in the response of an interferometric fiber optic current sensor caused by deviations in the wavelength of the light emitted by the light source caused by temperature variations. This variation in sensor response with respect to wavelength variation is reduced from more than 1% to <0.2% in wavelength ranges of at least 10 nm around 1305 nm.
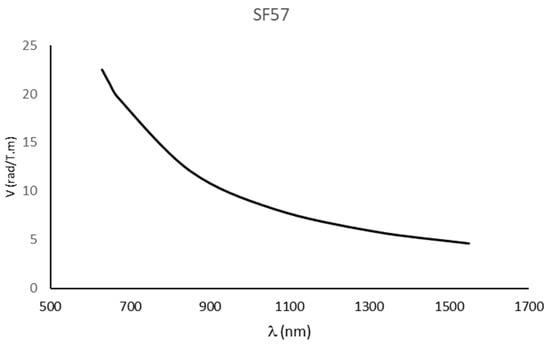
Figure 4.
SF-57 glass Verdet constant wavelength dependence.
Williams et al. [48] measured the temperature dependence of the Verdet constants of SiO2, SF-57, and BK-7. The measured relative Verdet constant variation per K was about (1.35 ± 0.08) × 10−4 for SF-57, about (0.69 ± 0.03) × 10−4 for SiO2, and (0.71 ± 0.06) × 10−4 for BK-7. When the optical material has a high Verdet constant and its linear thermal expansion coefficient is much lower than its coefficient of relative variation of the Verdet constant as a function of temperature, its linear temperature-induced variation becomes non-significant. For example, for the SF-57 glass, the linear thermal expansion coefficient is 8.3 × 10⁻⁶ per K in the range of −30 °C to 70 °C, about 16 times lower than the relative change of the Verdet constant due to temperature [49]. These values of variation in the Verdet constant as a function of temperature can be used to correct the Verdet constant for the temperature at which the sensor is being used, and their uncertainties must be considered when estimating the measurement uncertainty, as well as the uncertainty when measuring the ambient temperature at which the sensor is used.
Temkina et al. [24,50] proposed a method for compensating the response variation of a fiber optic current sensor with an interferometric detection scheme due to the dependence on temperature of the fiber quarter-wave plate. The maximum deviation using the proposed method was ±0.2% in a temperature range of 10 °C to 50 °C. It was also presented that the errors due to dependence of the temperature of the circulator and electro-optical modulator were non-significant, but the errors of the fiber delay line and the spun fiber used as a sensing element due to temperature variation were significant.
3.2. Vibration and Impact
For OCSs with an open core, the conductor of the electrical current to be measured is not surrounded by the optical material of the sensor, meaning that the line integral of the magnetic field along the optical path is not equal to the total current. However, a linear relationship between sensor measurement and electrical current can be determined based on the geometry and distribution of the field. Vibration causes variations in the relative position between the sensor and the conductor. As the magnetic field B is given by Equation (1), variations in the distance between the sensor and the conductor will in turn cause variations in the distribution of the magnetic field across the sensor, introducing changes in the sensor response. Comparing (1) and (2), it is observed that the sensor’s response varies with the inverse square of the distance between it and the conductor, so the greater the distance, the lesser the influence of its variation on the sensor’s response. Samimi et al. [51] showed that vibration causes large errors in open-core OCSs. These errors become smaller with an increase in the distance between the sensor and conductor, the conductor radius, or the sensor length. Deviations in OCS accuracy were about ±0.5% for a vertical displacement of ±0.5 mm when the sensor head and the conductor were 7.5 cm apart.
Short et al. [27] showed that OCSs with a polarimetric detection method cannot differentiate an acoustic vibration disturbance detected in the sensing element from the electrical current to be measured. They also showed that the OCSs with an in-line Sagnac interferometer are immune to acoustic vibrations in the sensing element; however, they are more sensitive to vibrations that occur farther away from the sensing element.
He et al. [52] presented an analysis of errors caused by linear stress on in-line Sagnac fiber OCSs under impact. A bias error, which is mainly caused by the stress acting on the delay coil leading to a non-reciprocity birefringence, was found.
Another contribution of uncertainty related to vibration refers to the introduction of linear birefringence, which will be addressed later in this article.
3.3. Stability
The detector module of an OCS uses optoelectronic devices, such as photodiodes, photodetectors, and A/D boards. These devices, together with the light source and other components or the sensor as polarizers, couplers, etc., contribute to the measurement uncertainty of an OCS due to their metrological characteristics and their short-term and long-term stability. The metrological data of these devices comes from their technical sheets or manuals. The long-term stability refers to the drift since the last calibration.
Aging of the light source device will change the central wavelength of the emitted light, and as the Verdet constant depends on the wavelength, the sensor response will change. Wang and Guan [34] analyzed some OCSs used in 110 kV voltage substations. The results showed that OCS long-term stability was strongly affected by aging and the performance reduction of the main optical devices of the sensors. Lenner et al. [3] investigated the long-term stability of an interferometric fiber OCS from both component and system perspectives. Some components, such as the SLD used as the light source, the phase modulator, and other passive components, were subject to accelerated aging by extended temperature cycling. Investigation results showed that the long-term drift of the center wavelength of the SLDs from two manufacturers varied from ±0.19 nm to ±0.38 nm.
One way to minimize uncertainty due to drift of the sensor or its components is to perform calibration immediately before and immediately after use. However, this option may be unfeasible for practical or economic reasons.
3.4. Linear Birefringence
Linear birefringence is the difference between the refraction index of two LP lights. A birefringent optical material has different indices of refraction for different directions of light propagation. In this way, light propagates at different speeds, according to its polarization, and a phase difference occurs between them, causing the polarization of light to change from linear to elliptical. In OCSs based on the Faraday effect, birefringence causes a shift in the polarization angle that adds to the rotation angle caused by the Faraday effect, disturbing the behavior of the sensors and decreasing their sensitivity to Faraday rotation and accuracy. Thus, to improve Faraday effect measurement quality in OCSs, the linear birefringence must be reduced [53,54,55,56].
The optical fiber birefringence can come from several sources. One of the possibilities is that it is intrinsic to the fiber and generated due to imperfections in the manufacturing process. As multimode fibers disrupt the polarization state of light, single-mode optical fibers are the only option for the sensor head. Unfortunately, single-mode fibers suffer from this inherent birefringence. In general, each type of optical fiber has an intrinsic birefringence characteristic, so several types of optical fibers can be evaluated, and the choice of appropriate fibers can reduce it [9]. Another source of birefringence arises when the fiber is bent to wrap it around the conductor. Curving the fiber breaks the symmetry of its structure because the outer part of the fiber supports stress tension and, on the contrary, the inner part supports compressive stress. The linear birefringence effect is more significant when the fiber is wrapped in many turns around the conductor for higher sensitivity, but it becomes less significant if the coil has a sufficiently large diameter [57]. If the state of polarization (SOP) of the propagating light remains perfectly linear or circular, the sensor response is not affected. But, if the linear birefringence effect causes the SOP to change from linear to elliptical, the behavior of the light polarization angle in the sensing fiber will be affected not only by the Faraday effect but also by the SOP. Thus, sensor performance is degraded, as its response is affected by the polarization evolution due to the linear birefringence [58]. Li, Wang, and Liu [59] demonstrated the effect of linear birefringence on the response of a fiber optic current sensor that used a spun LoBi fiber as the sensing element. For the purpose of evaluating the measurement uncertainty of optical current sensors, the birefringence extrinsic to a sensor’s optical material, such as that caused by the fiber bending process or by external influence quantities such as temperature and vibration, is more important, since the effects of intrinsic birefringence will be present at the time of sensor calibration and will not vary over time. Cheng et al. [60] analyzed the effect of linear birefringence by varying the radius of the sensor’s fiber optic coil. The variation found was ±0.45% for radii between 5 cm and 30 cm and decreased to <±0.2% for radii between >30 cm and 50 cm. Madaschi [58] experimentally evaluated the effect of coil radius and number of turns on the response of a standard silica fiber optic sensor. When the coil diameter varied from 6 cm to 14 cm, the effective Verdet constant of the sensor varied from approximately 0.18 rad/(T·m) to approximately 0.7 rad/(T·m) for a wavelength of 1310 nm. In this situation, the length of the sensor was the same, which meant that for each diameter evaluated, the number of turns was different. When evaluating the number of turns, when it increased from 5 to 16, keeping the coil diameter at 13 cm, the effective Verdet constant reduced from 0.64 rad/(T·m) to 0.53 rad/(T·m). To reduce measurement uncertainty, it is recommended to calibrate the fiber optical current sensor with the number of turns and coil diameter equal to or close to the configuration in which it will be used.
Temperature and vibration effects also induce birefringence in fiber optic sensors. When temperature fluctuates, the different coefficients of thermal expansion between the fiber core and cladding lead to axial deformation, thus inducing linear birefringence [61]. Zhang et al. [62] presented the results of experiments on the influence of temperature and vibration on sensor performance using three different reflection schemes and three distinct types of fiber. The 90° Faraday rotating mirror showed the best results, regardless of the sensor fiber type. Sima et al. [63] proposed a new sensing scheme to improve the robustness of fiber optic current sensors using a polarization detection scheme against the effects of birefringence caused by vibration and temperature by placing a fiber polarization rotator (FPR) at the end of the sensing fiber. In the temperature influence tests, the error variance ratio was less than ±2% in the temperature range from −20 °C to 80 °C, while the maximum type A uncertainty was 0.12%. In the vibration tests, the maximum ratio error variation was less than ±0.4%, with the type A uncertainty of 0.029%. Li et al. [10] analyzed the effect of the temperature variation, and consequently of the linear birefringence induced by the curvature of the fiber variation, on the error of an optical current sensor for various values of the radius of the optical fiber coil and for various numbers of turns. In a temperature range from −40 °C to 80 °C, the error variation was approximately 0.25% for a radius of 20 cm and 0.7% for a radius of 10 cm. In the same temperature range, when the number of fiber turns was 25, the error varied by approximately 0.3%, while for 35 turns, the variation was greater than 1% Tantaswadi et al. [64] analyzed the effects of induced linear birefringence due to vibration on the performance of a reciprocal fiber optic current sensor with polarimetric detection. The deviation due to this effect was within ±0.1%. Huang et al. [65] measured the influence of vibrations in the low-frequency range from 10 Hz to 20 Hz on the response of a fiber optic sensor. The response varied by up to 250%.
In bulk OCSs, temperature variation can cause mechanical stress due to the difference between the thermal expansion coefficients of the optical material and the encapsulation material, leading to the appearance of induced or extrinsic birefringence.
3.5. Other Contributions
Sensors may present variations in their response depending on the electrical current being measured, which is called linearity, and these variations must be estimated as a source of uncertainty for the measurement uncertainty. Shao et al. [66] developed and tested a fiber optic current sensor from 50 kA to 1000 kA, and the measured linearity varied by ±0.03%. Shui et al. [32] developed and tested a bulk OCS at low currents, and its linearity was about ±0.28% from 0.2 A to 2.4 A.
For bulk sensors, the position of the sensing element in relation to the current conductor also influences its response. Mihailovic et al. [67] conducted experiments with a bulk sensor, varying its position in relation to the current conductor, and found a variation of approximately 2.5% in the sensor’s response. To reduce measurement uncertainty, it is recommended that the sensor be used at a distance from the current conductor equal to the distance at which it was calibrated. This concern becomes less important in bulk sensors that have an encapsulation to facilitate their installation next to the conductor, as this will ensure that the position is always the same.
Sensors that do not completely surround the current conductor are influenced by the magnetic field generated by currents from nearby conductors. Shenwang et al. [68] analyzed the influence of neighboring magnetic fields on optical current sensors, varying the distance and length of the sensor. Perciante and Ferrari [69] proposed a modified architecture of a three-phase system, where the sensor’s optical path was parallel to adjacent current conductors and perpendicular to the current conductor to be measured, minimizing the effect of stray magnetic fields. Unfortunately, this solution does not seem to be very practical for existing systems. Xiaojun et al. [70] proposed an architecture for a bulk sensor in order to minimize the effect of stray magnetic fields in a three-phase power system, such that the sensor reaches an accuracy class of 0.2%. Samimi et al. [51] demonstrated that the magnetic fields of neighboring conductors in a three-phase network can cause variations in the response of a bulk sensor of up to 10%. This variation reduces if the distance between the phases is large enough and if the sensors are close to the conductor of the electrical current being measured. If the phase distance is 2 m or more, the sensor can achieve an accuracy class of 0.2%. In outdoor high-voltage substations, the distance between phases is usually greater than 2 m. For example, in the Tucuruí Substation in Brazil, shown in Figure 5, in the 500 kV section, the distance between phases is approximately 9 m. Considering the phase arrangement, the central phase will be more affected by external magnetic fields than the other phases.
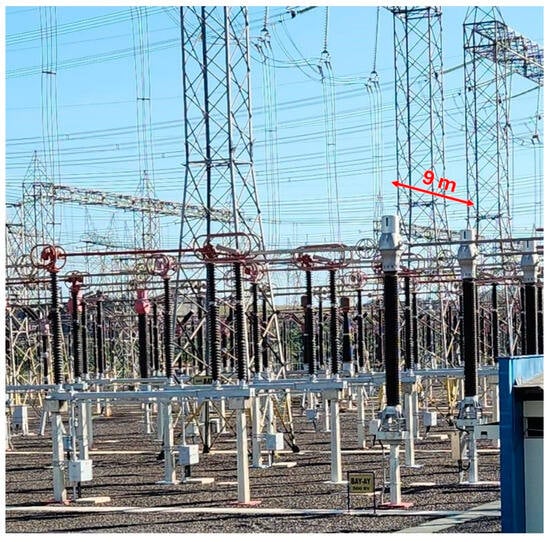
Figure 5.
The 9 m distance between phases at the 500 kV Tucuruí Substation.
The resolution of an instrument or measuring system is the smallest variation that can be observed in its indication and is associated with its capacity in terms of accuracy and precision. An uncertainty is associated with the finite resolution of the instrument or system. Depending on certain conditions of a given measurement process, the contribution of uncertainty associated with resolution is significant in relation to the other contributions. Similar situations can occur in the analog-to-digital conversion process, where electronic resolution impacts the repeated sampling of a signal, leading to digital samples that can differ by just one or two bits. Usually, for a digital indication instrument, its resolution is divided by two to calculate the resolution uncertainty [71,72]. This is the case for sensors that present their measurements in the format of digital indications, such as on a computer or display.
Measurement repeatability is the precision of a measurement taken under repeatable conditions. The repeatable conditions include the same operating conditions, same location, same operator, same measuring systems, and replicated measurements for the measurement of the same measurand (the quantity intended to be measured) [73,74]. In the case of OCSs, performing measurements under these repeatable conditions can be useful to estimate the uncertainty contributions due to the influence of temperature fluctuations and due to the short-term stability of sensor components.
4. Uncertainty Analysis
Reference [75] sets out general rules for evaluating and expressing the measurement uncertainty that are intended to be applicable to a wide range of measurements. Within the scope of this work, it is worth highlighting some rules and good practices that will be used in evaluating the uncertainty contributions of optical current sensors. When dealing with systematic effects, it is assumed that the result of a measurement has been corrected for all effects that are recognized as significant, but it is also assumed that corrections are considered imperfect due to the lack of knowledge about them, so there is always uncertainty associated with the correction of a systematic effect. Sometimes it may be impractical to correct for a systematic effect, so it is necessary to model this effect as a source of uncertainty. However, the best option to improve measurement uncertainty is to perform the correction and estimate an uncertainty contribution due to this correction [76].
Still, according to reference [55] in relation to the evaluation method, whether by statistical analysis of a set of measurements or by other methods, uncertainty contributions can be classified into two types: type A, which is estimated by statistical methods, or type B, which is evaluated by other methods. A type A uncertainty is estimated from the statistical evaluation of a set of observations. Some forms of analysis may be calculating the standard deviation or variance of a series of independent measurements or using a linear regression method to fit a curve. A type B uncertainty can be estimated by means other than statistical evaluation and can be based on scientific evaluations of all available data, such as data from calibration certificates, uncertainties attributed to reference data from publications, effects of environmental conditions on measurement, data from previous measurements, and data published in datasheets or manuals [77]. In some cases, uncertainty contributions that could be assessed as type B are included in a type A assessment when a reasonable number of observations are able to be performed in the measurement process.
When classifying the uncertainty contributions of optical current sensors, uncertainties arising from short-term effects that are difficult to correct are best quantified through a series of observations and are, therefore, defined as type A. This is the case, for example, for uncertainty contributions due to the effects of temperature fluctuation on a light source and other components, as well as the short-term stability of these same components. The combined effect of these uncertainties will be observed if the measurement procedure provides a reasonable number of readings that cover all conditions related to these uncertainty contributions.
On the other hand, effects that allow corrections to be applied to the mathematical model, such as the effect of performing measurements at a temperature different from that at which the sensor components were calibrated, give rise to uncertainty contributions that can be classified as type B. In the case of temperature difference, after applying the correction, the uncertainty due to this correction must be estimated. Other uncertainty contributions that can be classified as type B are those whose assessment using a statistical method is difficult, impractical, or economically unfeasible. This is the case for uncertainties due to the long-term stability of the sensor components and the resolution of the A/D board.
Figure 6 and Table 2 show a summary of the identified relevant uncertainty contributions to the measurement uncertainty of OCSs. Table 2 also presents a suggestion for their classification as type A or type B evaluation. These uncertainties are discussed below.
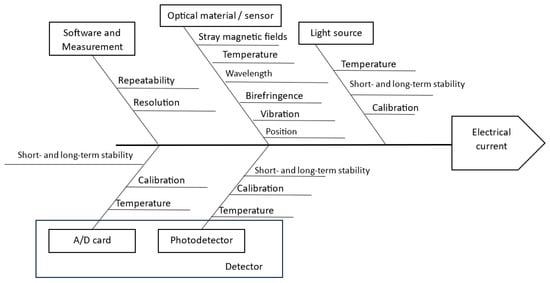
Figure 6.
Main OCS uncertainty sources.
Table 2.
Summary and classification of OCS uncertainty sources.
The uncertainty associated with the calibration of the OCS can be estimated from its last calibration report. Calibration may have been performed on the entire sensor or on each of its parts, according to Figure 3. The OCS calibration can be performed at various current levels according to the measurement range of interest to enable the assessment of the sensor’s linearity and its uncertainty.
The variations in the Verdet constant of the optical material, the light source, the photodetector, and the A/D card caused by use of the OCS at a temperature different from that at which it was calibrated can be estimated by measuring the OCS temperature and the characteristics of each of the OCS components, which can be found in reference data and in the technical documentation provided by their manufacturers. These variations may give rise to correction factors that must be applied to the sensor response; the uncertainties of these corrections can be estimated through the uncertainties declared in the technical documentation and the uncertainty of the sensor temperature measurement.
Variation in the wavelength of a light source due to its use in a driving current different from that used in its calibration may give rise to a correction factor, which can be obtained through the technical documentation of the light source or through experiments to determine the variation in the wavelength of the source as a function of the driving current. This correction will be associated with an uncertainty that can be estimated from the uncertainty of the measurement of the driving current and the characteristics of the light source.
Uncertainties related to the long-term stability or drift since the last calibration of the light source, photodetector, and A/D card can be estimated from the technical documentation provided by their manufacturers. When this information is not available in the technical documentation, this stability or drift can be assessed experimentally, provided that resources are available. If these uncertainties are significant, they can be reduced by calibrating the sensor or its components immediately before and after use. However, this alternative may be inadequate for practical or economic reasons.
To reduce uncertainty due to variations caused by the birefringence effect, it is important to control the factors causing this birefringence. For example, for a fiber OCS, the same radius and number of turns should be used whenever possible. Even with these precautions, a residual uncertainty will be present (such as due to variations in the length of the coil radius) and must be estimated. The influence of temperature on the variation in birefringence is more difficult to assess and must be estimated for each sensor, since it will depend strongly on its peculiar characteristics.
In estimating the uncertainty due to variation of the position of an open-core OCS relative to the conductor or busbar where the current to be measured propagates as a result of vibration, the value of the radial vibration of the conductor or busbar in displacement units (meter or its submultiples, peak-to-peak) can be used, if this is available. Vibration is expected to be much less significant in busbars than in conductors, as the latter are more susceptible to natural phenomena that cause vibration, such as wind.
Uncertainties arising from temperature fluctuations during measurement of the Verdet constant of the optical material, wavelength of the light source, and performance of the photodetector and A/D card, and also uncertainties arising from the short-term stability of the light source (inherent and due to the driving current), the photodetector, and the A/D card, can be statistically estimated together by performing an adequate number of measurements or observations during the measurement. The joint uncertainty assessed through this series of observations will be associated with the repeatability of the OCS.
To estimate the uncertainty due to the position of the OCS in relation to the conductor of the electrical current to be measured, the sensor can be calibrated by setting one or more distances according to the conditions of use of the OCS in the field. The uncertainty will be quantified through the variation of the sensor response obtained for the various distances used in the calibration and also through the uncertainty in the measurement of the distance between the sensor and the conductor.
The uncertainty due to stray magnetic fields caused by adjacent phases in three-phase networks can be evaluated analytically through knowledge of the characteristics of the electrical network where the sensor will be used. Using the distance between the phases and considering that the three-phase network is reasonably balanced, which is the most common situation encountered, uncertainty can be estimated using Equation (2). This estimate can also be made from results found in the literature referring to similar situations, since it will depend mainly on only two characteristics—distance between phases and whether the system is reasonably balanced.
Another point to consider is the fact that some sources of uncertainty can become significant according to certain characteristics of optical current sensors, such as the type of sensing element (fiber or bulk), the enclosure of the current conductor (total or partial), or the detection scheme (polarimetric or interferometric). For example, uncertainty due to vibration will be more significant for sensors that partially enclose the current conductor than for those that enclose it completely, and uncertainty due to birefringence will be more significant in fiber sensors than in bulk sensors. The magnitude of the measurement uncertainty of an optical current sensor, and by how much each uncertainty contribution is more or less significant, will depend on knowledge of the effects that affect its performance, whether they are corrected for, and the form of that correction. As mentioned previously, an uncorrected systematic effect will give rise to a contribution of uncertainty, thus degrading the quality of the sensor. For example, if the effect of extrinsic birefringence of a fiber optic current sensor is not known, its performance will be compromised and there will be an increase in measurement uncertainty.
In the bulk sensor tested by Costa et al. [78], shown in Figure 7, the low thermal coefficient vinyl encapsulation completely encloses the current conductor, but the sensor itself is just a block of SF-57 glass with a polarimetric detection scheme. Its design ensures that the variation in the position of the sensor in relation to the conductor is no more than the diameter of its opening, d = 4.7 cm. Thus, the uncertainty due to vibration can be determined by measuring its response at distances from zero to d. For this sensor, all uncertainties listed in Table 2 apply, with the exception of the uncertainty due to birefringence. On the other hand, for a fiber optic sensor that wraps the electrical current conductor in several turns, the sources of uncertainty due to correction due to vibration, the position of the sensor relative to the conductor, and stray magnetic field influence will be less significant than the others. Some sources of uncertainty will be common and will always be significant in any optical current sensor scheme, such as corrections due to temperature variations in the Verdet constant of the optical material and in the wavelength of the light source and aging of the components.
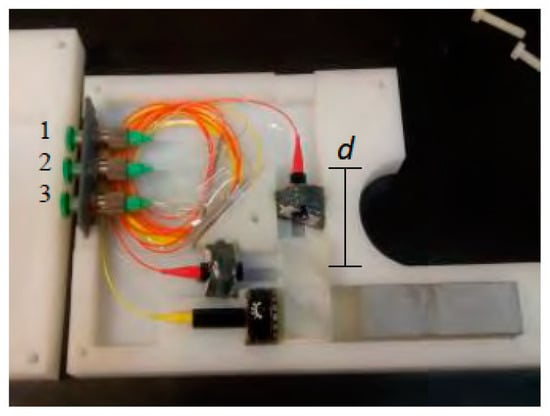
Figure 7.
Experimental bulk OCS constructed with SF-57 glass—numbers 1–3 indicate optical connections [78].
5. Conclusions
This article presented a review of the main uncertainty contributions that affect the accuracy of optical current sensors based on the Faraday effect, including the classification of their estimation as type A or type B. It was observed that contributions of uncertainty arising from influencing quantities such as temperature variation, material birefringence, and aging of components can be quite significant for sensor measurement uncertainty, even when schemes are used to compensate or correct the effects of some of these factors, as it is considered that these compensations or corrections are imperfect and that there is always a contribution from associated uncertainty. Some of these corrections, if not conducted, will take a sensor’s measurement uncertainty to values that are unsuitable for its use. Some uncertainty contributions are significant in any sensor configuration, while other contributions are more significant in a certain configuration and not significant in other configurations. These configurations include the type of sensing element, whether the sensor surrounds the current conductor completely, and the detection scheme.
The evolution of this paper involved the quantification of the identified uncertainties, so the guide proposed in this paper can be complemented with examples where the measurement uncertainty of one or more types of optical current sensors can be obtained.
Author Contributions
Conceptualization, M.M.C.; methodology, M.M.C.; supervision, J.C.W.A.C.; validation, J.C.W.A.C. and M.A.G.M.; formal analysis, J.C.W.A.C. and M.A.G.M.; project administration, J.C.W.A.C.; writing—original draft preparation, M.M.C.; writing—review and editing, J.C.W.A.C. and M.A.G.M. All authors have read and agreed to the published version of the manuscript.
Funding
This research received no external funding.
Data Availability Statement
Data are contained within the article.
Conflicts of Interest
The authors declare no conflict of interest.
References
- Pong, P.W.T.; Annaswamy, A.M.; Kroposki, B.; Zhang, Y.; Rajagopal, R.; Zussman, G.; Poor, H.V. Cyber-enabled grids: Shaping future energy systems. Adv. Appl. Energy 2021, 1, 100003. [Google Scholar]
- Larruskain, M.; Valverde, V.; Torres, E.; Buigues, G.; Santos-Mugica, M. Protection Systems for Multi-Terminal HVDC Grids. Renew. Energy Power Qual. J. 2018, 1, 310–315. [Google Scholar]
- Lenner, M.; Frank, A.; Yang, L.; Roininen, T.M.; Bohnert, K. Long-Term Reliability of Fiber-Optic Current Sensors. IEEE Sens. J. 2020, 20, 823–832. [Google Scholar]
- Kucuksari, S.; Karady, G. Experimental Comparison of Conventional and Optical Current Transformers. IEEE Trans. Power Deliv. 2010, 25, 2455–2463. [Google Scholar] [CrossRef]
- Schon, K. High Voltage Measurement Techniques, Fundamentals, Measuring Instruments, and Measuring Methods, 1st ed.; Springer International Publishing: Basel, Switzerland, 2019. [Google Scholar]
- Wu, J.; Zhang, X. Recent Progress of All Fiber Optic Current Transformers. In Proceedings of the 7th International Forum on Electrical Engineering and Automation (IFEEA), Hefei, China, 25–27 September 2020. [Google Scholar]
- Laurano, C.; Toscani, S.; Zanoni, M. A Simple Method for Compensating Harmonic Distortion in Current Transformers: Experimental Validation. Sensors 2021, 21, 2907. [Google Scholar] [CrossRef] [PubMed]
- N’cho, J.S.; Fofana, I. Review of Fiber Optic Diagnostic Techniques for Power Transformers. Energies 2020, 13, 1789. [Google Scholar] [CrossRef]
- Samimi, M.H.; Akmal, A.A.S.; Mohseni, H. Optical Current Transducers and Error Sources in Them: A Review. IEEE Sens. J. 2015, 15, 4721–4728. [Google Scholar] [CrossRef]
- Li, Y.; Liu, X.; Zhang, W.; Liu, J. Error characteristic analysis and experimental research on a fiber optic current transformer. Appl. Opt. 2018, 57, 8359–8365. [Google Scholar] [CrossRef]
- FOCS—Fiber Optic Current Sensors Enabling Smart Grids and Digital Substations. Available online: https://library.e.abb.com/public/a0c2264f26b94c748f7ef2d54bd0bea2/ABB_FOCS%20Kit%20Flyer_20190723.pdf?x-sign=LYr+kJPJwQ5xVj5qzJbKZJh4FzKJcbujknH4FAtts1Vn3ZBMi2r3CYgbxrCrjws8 (accessed on 1 December 2023).
- Rahmatian, F.; Ortega, A. Applications of Optical Current and Voltage Sensors in High-Voltage Systems. In Proceedings of the IEEE/PES Transmission & Distribution Conference and Exposition, Caracas, Venezuela, 15–18 August 2006. [Google Scholar] [CrossRef]
- Ahmed, S. Performance Evaluation of Optical Fiber Current Transformer based Over-current Protection. FES J. Eng. Sci. 2019, 8, 40–47. [Google Scholar] [CrossRef]
- Tzelepis, D.; Psaras, V.; Tsotsopoulou, E.; Mirsaeidi, S.; Dyśko, A.; Hong, Q.; Dong, X.; Blair, S.; Nikolaidis, V.; Papaspiliotopoulos, V.; et al. Voltage and Current Measuring Technologies for High Voltage Direct Current Supergrids: A Technology Review Identifying the Options for Protection, Fault Location and Automation Applications. IEEE Access 2020, 8, 203398–203428. [Google Scholar] [CrossRef]
- Jogalekar, A.; Katti, P. An overview on renovation and modernization of existing substations. In Proceedings of the International Conference on Nascent Technologies in Engineering (ICNTE), Vashi, India, 27–28 January 2017. [Google Scholar] [CrossRef]
- Rose, A.H.; Hudson, M.C.; Hadley, E.; Perkins, P. Optical Inline-Sagnac Current Sensor, Part II: Performance and Applications. IEEE Trans. Power Deliv. 2022, 37, 5394–5401. [Google Scholar] [CrossRef]
- Azad, S.P.; Leterme, W.; Van Hertem, D. A DC grid primary protection algorithm based on current measurements. In Proceedings of the 17th European Conference on Power Electronics and Applications (EPE’15 ECCE-Europe), Geneva, Switzerland, 8–10 September 2015. [Google Scholar] [CrossRef]
- Lei, C.; Zhizhong, G.; Yue, C.; Guizhong, W. Measurement of inrush current in transformer based on optical current transducer. J. Phys. Conf. Ser. 2019, 1187, 022004. [Google Scholar] [CrossRef]
- Ivanov, N.; Vorobev, P.; Bialek, J.; Kanafeev, R.; Yanin, M. Fiber Optic Current Transformers for Transformer Differential Protection during Inrush Current: A Field Study. In Proceedings of the IEEE Madrid PowerTech, Madrid, Spain, 28 June–2 July 2021. [Google Scholar] [CrossRef]
- Li, C.; Shao, H.; Zhao, W.; Wang, J.; Zhang, H. Fiber-Optic Current Sensor Utilized for DC High Current Calibration. In Proceedings of the 2016 Conference on Precision Electromagnetic Measurements, Ottawa, ON, Canada, 10–15 July 2016. [Google Scholar] [CrossRef]
- Zhao, J.; Shi, L.; Sun, X. Design and Performance Study of a Temperature Compensated ±1100-kV UHVdc All Fiber Current Transformer. IEEE Trans. Instrum. Meas. 2021, 70, 7001206. [Google Scholar] [CrossRef]
- Zhou, S.; Tang, H.; Pan, B.; Zhang, W. Abnormal handling mechanism and improvement measures of optical DC current transformer in smart grid environment. PeerJ Comput. Sci. 2022, 8, 1132. [Google Scholar] [CrossRef]
- Bohnert, K.; Gabus, P.; Nehring, J.; Brandle, H. Temperature and vibration insensitive fiber-optic current sensor. J. Lightwave Technol. 2002, 20, 267–276. [Google Scholar] [CrossRef]
- Temkina, V.; Medvedev, A.; Mayzel, A.; Sivolenko, E.; Poletaeva, E.; Dudnik, I. Experimental Study of Temperature Impact on Fiber Optic Current Sensor Elements. In International Conference on Next Generation Wired/Wireless Networking; Springer International Publishing: Cham, Switzerland, 2022; Volume 13158. [Google Scholar] [CrossRef]
- Oppegård, A.; Katoulaei, M.K.; Oleinikova, I. Complete FEM-based model of a bulk-glass optical current transformer. In Proceedings of the International Conference on Smart Energy Systems and Technologies (SEST), Eindhoven, The Netherlands, 5–7 September 2022. [Google Scholar] [CrossRef]
- Short, S.X.; Tantaswadi, P.; Carvalho, R.T.; Russell, B.D.; Blake, J. An experimental study of acoustic vibration effects in optical fiber current sensors. IEEE Trans. Power Deliv. 1996, 11, 1702–1706. [Google Scholar] [CrossRef]
- Tantaswadi, P.; Tangtrongbenchasil, C. Numerical analysis of localized vibration effects and its compensation technique on reciprocal fiber-optic polarimetric current sensor. In Proceedings of the IEEE International Conference on Industrial Technology, Bangkok, Thailand, 11–14 December 2002. [Google Scholar] [CrossRef]
- Leung, F.Y.C.; Chiu, W.C.K.; Demokan, M.S. Fiber-optic current sensor developed for power system measurement. In Proceedings of the International Conference on Advances in Power System Control, Operation and Management, APSCOM-91, Hong Kong, China, 5–8 November 1991. [Google Scholar]
- Morello, R.; Mukhopadhyay, S.C.; Liu, Z.; Slomovitz, D.; Samantaray, S.R. Advances on Sensing Technologies for Smart Cities and Power Grids: A Review. IEEE Sens. J. 2017, 17, 7596–7610. [Google Scholar] [CrossRef]
- Samimi, M.H.; Akmal, A.A.S.; Mohseni, H.; Jadidian, J. Open-Core Optical Current Transducer: Modeling and Experiment. IEEE Trans Power Deliv. 2016, 31, 2028–2035. [Google Scholar] [CrossRef]
- Shui, H.; Rong, Y.; Dong, T.; Sun, Y.; Yan, W. Current measurement method based on integral reconstruction of magnetic rotation angle. Int. J. Energy 2023, 2, 52–56. [Google Scholar] [CrossRef]
- Silva, R.M.; Martins, H.; Nascimento, I.; Baptista, J.M.; Ribeiro, A.L.; Santos, J.L.; Jorge, P.; Frazão, O. Optical Current Sensors for High Power Systems: A Review. Appl. Sci. 2012, 2, 602–628. [Google Scholar] [CrossRef]
- Shao, J.; Liu, W.; Liu, C.; Xu, D. A passive optical fiber current sensor based on YIG. In Proceedings of the 1st Asia-Pacific Optical Fiber Sensors Conference, Chengdu, China, 7–9 November 2008; pp. 1–4. [Google Scholar] [CrossRef]
- Wang, H.; Guan, Y. Study on Long-Term Operation Stability of Fiber Optical Current Transformer Based on Faraday Effect. In Proceedings of the International Conference on Intelligent Transportation, Big Data and Smart City, Halong Bay, Vietnam, 19–20 December 2015. [Google Scholar] [CrossRef]
- Xu, Z.; Yue, C.; Yan, X.; Fan, J.; Pang, F. Multi-Scale Anomaly Detection in Fiber Optic Current Transformers. In Proceedings of the IEEE 6th International Electrical and Energy Conference (CIEEC), Hefei, China, 12–14 May 2023. [Google Scholar] [CrossRef]
- Müller, G.M.; Gu, X.; Yang, L.; Frank, A.; Bohnert, K. Inherent temperature compensation of fiber-optic current sensors employing spun highly birefringent fiber. Opt. Express 2016, 24, 11164–11173. [Google Scholar] [CrossRef]
- Liu, C.; Wang, D.; Li, C.; Su, K.; Li, D.; Yu, D.; Wang, L.; Si, L.; Jin, J. Fiber optic current sensor temperature compensation through RBF neural network. In Proceedings of the Applied Optics and Photonics China, Beijing, China, 30 November–2 December 2020. [Google Scholar] [CrossRef]
- Petricevic, S.J.; Mihailovic, P.M. Compensation of Verdet Constant Temperature Dependence by Crystal Core Temperature Measurement. Sensors 2016, 16, 1627. [Google Scholar] [CrossRef] [PubMed]
- Müller, G.M.; Frank, A.; Yang, L.; Gu, X.; Bohnert, K. Temperature Compensation of Interferometric and Polarimetric Fiber-Optic Current Sensors with Spun Highly Birefringent Fiber. J. Lightwave Technol. 2019, 37, 4507–4513. [Google Scholar] [CrossRef]
- Madden, I.; Michie, W.; Cruden, A.; Niewczas, P.; McDonald, J. Temperature compensation for optical current sensors. Opt. Eng. 1999, 38, 10. [Google Scholar] [CrossRef]
- Liang, Z.; Han, Q.; Zhang, T.; Tang, Y.; Jiang, J.; Cheng, Z. Nonlinearity Compensation of Magneto-Optic Fiber Current Sensors Based on WOA-BP Neural Network. IEEE Sens. J. 2022, 22, 19378–19383. [Google Scholar] [CrossRef]
- Li, Y.; Zhang, W.; Liu, X.; Liu, J. Characteristic Analysis and Experiment of Adaptive Fiber Optic Current Sensor Technology. Appl. Sci. 2019, 9, 333. [Google Scholar] [CrossRef]
- Jia, Q.; Han, Q.; Liang, Z.; Cheng, Z.; Hu, H.; Wang, S.; Ren, K.; Jiang, J.; Liu, T. Temperature Compensation of Optical Fiber Current Sensors with a Static Bias. IEEE Sens. J. 2022, 22, 352–356. [Google Scholar] [CrossRef]
- Hoffmann, H.J. A survey of isotropic and anisotropic modifications of the refractive index. J. Phys. IV Fr. 1992, 2, 21–30. [Google Scholar] [CrossRef][Green Version]
- Chen, X.; Jiang, L.; Yang, M.; Yang, J.; Shu, X. Research on the mean-wavelength drift mechanism of SLD light source in FOG. J. Phys. Conf. Ser. 2019, 1300, 012047. [Google Scholar] [CrossRef]
- Wang, Z.; Li, Q.; Qi, Y.; Huang, Z.; Shi, J. Wavelength dependence of the sensitivity of a bulk-glass optical current transformer. Opt. Laser Technol. 2006, 38, 87–93. [Google Scholar] [CrossRef]
- Müller, G.M.; Quan, W.; Lenner, M.; Yang, L.; Frank, A.; Bohnert, K. Fiber-optic current sensor with self-compensation of source wavelength changes. Opt. Lett. 2016, 41, 2867–2870. [Google Scholar] [CrossRef]
- Williams, P.A.; Rose, A.H.; Day, G.W.; Milner, T.E.; Deeter, M.N. Temperature dependence of the Verdet constant in several diamagnetic glasses. Appl. Opt. 1991, 30, 1176–1178. [Google Scholar] [CrossRef] [PubMed]
- Schott Optical Glass—Datasheets. Available online: https://refractiveindex.info/download/data/2017/schott_2017-01-20.pdf (accessed on 18 November 2023).
- Temkina, V.; Medvedev, A.; Mayzel, A.; Mokeev, A. Compensation of Fiber Quarter-Wave Plate Temperature Deviation in Fiber Optic Current Sensor. In Proceedings of the IEEE International Conference on Electrical Engineering and Photonics, St. Petersburg, Russia, 17–18 October 2019. [Google Scholar] [CrossRef]
- Samimi, M.H.; Bahrami, S.; Akmal, A.A.S.; Mohseni, H. Effect of Nonideal Linear Polarizers, Stray Magnetic Field, and Vibration on the Accuracy of Open-Core Optical Current Transducers. IEEE Sens. J. 2014, 14, 3508–3515. [Google Scholar] [CrossRef]
- He, X.; Wang, G.; Gao, W.; Wang, Y.; Gao, H. The effect analysis of impact on a fiber optic current sensor. Optik 2021, 238, 166724. [Google Scholar] [CrossRef]
- Sawale, B.A. Effect of induced linear birefringence on Faraday current sensor using Ultra-low birefringence Optical Fiber. In Proceeding of the International Conference on Electrical Power and Energy Systems (ICEPES), Bhopal, India, 14–16 December 2016. [Google Scholar] [CrossRef]
- Ulmer, E. A High-Accuracy Optical Current Transducer for Electric Power Systems. IEEE Trans. Power Deliv. 1990, 5, 892–898. [Google Scholar] [CrossRef]
- Tabor, W.; Chen, F. Electromagnetic Propagation through Materials Possessing Both Faraday Rotation and Birefringence: Experiments with Ytterbium Orthoferrite. J. Appl. Phys. 1969, 40, 2760–2765. [Google Scholar] [CrossRef]
- Forman, P.; Jahoda, F. Linear birefringence effects on fiber-optic current sensors. Appl. Opt. 1988, 27, 3088–3096. [Google Scholar] [CrossRef]
- Madaschi, A.; Brunero, M.; Ferrario, M.; Martelli, P.; Boffi, P.; Martinelli, M. Experimental Evaluation of the Birefringence Effect on Faraday-Based Fiber-Optic Current Sensors. IEEE Sens. Lett. 2022, 6, 1–4. [Google Scholar] [CrossRef]
- Hotate, K.; Konishi, Y. Formulas describing error induced by fiber linear-birefringence in fiber-optic current sensors. In Proceedings of the 15th Optical Fiber Sensors Conference Technical Digest, Portland, OR, USA, 10 May 2002. [Google Scholar] [CrossRef]
- Li, Y.; Wang, B.; Liu, J. Modeling and analysis on the sensing characteristic of fiber optical current transformer. In Proceedings of the IECON 2017—43rd Annual Conference of the IEEE Industrial Electronics Society, Beijing, China, 29 October–1 November 2017. [Google Scholar] [CrossRef]
- Cheng, S. Optimization design of sensing coil of all-fiber optical current transformer. In Proceedings of the 7th International Power Electronics and Motion Control Conference, Harbin, China, 2–5 June 2012. [Google Scholar] [CrossRef]
- Song, C.; Zhizhong, G.; Guoqing, Z.; Wenbin, Y.; Yan, S.; Shixin, J. The Analysis on Temperature Characteristic of Fiber Optic Current Sensor Ratio Error. In Proceedings of the Fifth International Conference on Instrumentation and Measurement, Computer, Communication and Control (IMCCC), Qinhuangdao, China, 18–20 September 2015. [Google Scholar] [CrossRef]
- Zhang, H.; Qiu, Y.; Huang, Z.; Jiang, J.; Li, G.; Chen, H.; Li, H. Temperature and Vibration Robustness of Reflecting All-Fiber Current Sensor Using Common Single-Mode Fiber. J. Lightwave Technol. 2014, 32, 4311–4317. [Google Scholar] [CrossRef]
- Sima, W.; Zeng, L.; Yang, M.; Yuan, T.; Sun, P. Improving the Temperature and Vibration Robustness of Fiber Optic Current Transformer Using Fiber Polarization Rotator. IEEE Trans. Instrum. Meas. 2022, 71, 1–12. [Google Scholar] [CrossRef]
- Tantaswadi, P.; Tangtrongbenchasil, C.; Maheshwari, S. Study of current measurement error due to vibration in reciprocal fiber-optic polarimetric current sensor. In Proceedings of the 4th IEEE International Conference on Power Electronics and Drive Systems, Denpasar, Indonesia, 25 October 2001. [Google Scholar] [CrossRef]
- Huang, J.; Liu, B.; Chen, Y.; Tian, J.; Xia, L. Effect of Low Frequency Vibration of Sensing Coil on Fiber Optic Current Sensors. In Proceedings of the 21st International Conference on Optical Communications and Networks (ICOCN), Qufu, China, 31 July–3 August 2023. [Google Scholar] [CrossRef]
- Shao, H.; Li, C.; Lin, F.; Wang, L.; Liang, B.; Wang, J.; Zhao, W. Development and Applications of Wideband High Current Transducers. In Proceedings of the 2020 Conference on Precision Electromagnetic Measurements, Online, 20–24 August 2020. [Google Scholar] [CrossRef]
- Mihailovic, P.; Petricevic, S.; Stojkovic, Z.; Radunovic, J. Development of a portable fiber-optic current sensor for power systems monitoring. IEEE Trans. Instrum. Meas. 2004, 53, 24–30. [Google Scholar] [CrossRef]
- Shenwang, L.; Zhizhong, G.; Guoqing, Z.; Wenbin, Y.; Yan, S.; Zhiqing, L.; Dong, Y.; Guopeng, W. Research on Magnetic Crosstalk Characteristics of Straight Light Path Type Optical Current Transformer. In Proceedings of the Sixth International Conference on Instrumentation & Measurement, Computer, Communication and Control (IMCCC), Harbin, China, 21–23 July 2016. [Google Scholar] [CrossRef]
- Perciante, C.; Ferrari, J. Magnetic Crosstalk Minimization in Optical Current Sensors. IEEE Trans. Instrum. Meas. 2008, 57, 2304–2308. [Google Scholar] [CrossRef]
- Xiaojun, Z.; Zhuohang, L.; Yansong, L.; Jun, L. Clustered magneto-optical current sensor to eliminate the interference of a phase-to-phase magnetic field. Opt. Contin. 2022, 1, 197–214. [Google Scholar] [CrossRef]
- Hogan, R. How to Determine Resolution Uncertainty. Cal Lab Mag. 2017, 24, 20–26. [Google Scholar]
- Phillips, S.D.; Toman, B.; Estler, W.T. Uncertainty Due to Finite Resolution Measurements. J. Res. Natl. Inst. Stand. Technol. 2008, 113, 143–156. [Google Scholar] [PubMed]
- De Bièvre, P. Measurement uncertainty is not synonym of measurement repeatability or measurement reproducibility…. Accredit. Qual. Assur. 2008, 13, 61–62. [Google Scholar] [CrossRef]
- Alvarez-Prieto, M.; Jiménez-Chacón, J.; Montero-Curbelo, Á. Do we need to consider metrological meanings of different measurement uncertainty estimations? Accredit. Qual. Assur. 2009, 14, 623–634. [Google Scholar] [CrossRef]
- Evaluation of Measurement Data—Guide to the Expression of Uncertainty in Measurement—JCGM 100:2008—GUM 1995 with Minor Corrections. Available online: https://www.bipm.org/documents/20126/2071204/JCGM_100_2008_E.pdf/cb0ef43f-baa5-11cf-3f85-4dcd86f77bd6 (accessed on 19 December 2023).
- Cohen, E.R. Error and Uncertainty in Physical Measurements. In Modeling Complex Data for Creating Information. Data and Knowledge in a Changing World; Dubois, J.E., Gershon, N., Eds.; Springer: Berlin/Heidelberg, Germany, 1996. [Google Scholar] [CrossRef]
- Farrance, I.; Frenkel, R. Uncertainty of Measurement: A Review of the Rules for Calculating Uncertainty Components through Functional Relationships. Clin. Biochem. Rev. 2012, 33, 49–75. [Google Scholar]
- Costa, M.M.; Reis, S.M.L.; Brígida, A.C.S.; Gonçalves, C.S.L.; Costa, J.C.W.A.; Jorge, P.A.S.; Martinez, M.A.G. High Voltage Compact Optical Current Sensor Experimental Tests. In Proceedings of the Nineteenth Brazilian Symposium on Microwaves and Optoelectronics and Fourteenth Brazilian Congress on Electromagnetism, Online, 8–12 November 2020. [Google Scholar]


Disclaimer/Publisher’s Note: The statements, opinions and data contained in all publications are solely those of the individual author(s) and contributor(s) and not of MDPI and/or the editor(s). MDPI and/or the editor(s) disclaim responsibility for any injury to people or property resulting from any ideas, methods, instructions or products referred to in the content. |
© 2024 by the authors. Licensee MDPI, Basel, Switzerland. This article is an open access article distributed under the terms and conditions of the Creative Commons Attribution (CC BY) license (https://creativecommons.org/licenses/by/4.0/).