Article

On the Influence of H2 Addition on NH3 Laminar Flame Speed under Engine-like Conditions

Dipartimento di Ingegneria, Università degli Studi della Basilicata, 85100 Potenza, Italy
*
Author to whom correspondence should be addressed.
Energies 2024, 17(16), 4181; https://doi.org/10.3390/en17164181
Submission received: 23 July 2024 / Revised: 9 August 2024 / Accepted: 14 August 2024 / Published: 22 August 2024

Abstract

:
As zero-carbon fuels, hydrogen and ammonia are of great interest in the transition toward a climate-neutral transportation system. In order to use these fuels and their blends in reciprocating engines, a characterization of the combustion of NH3/H2/air mixtures at high pressures and temperatures is needed. The aim of this work is to compute the Laminar Flame Speed (LFS) of NH3/H2/air mixtures by varying the thermochemical conditions of the reactants. For this purpose, several simulations have been carried out using different kinetic reaction mechanisms. The accuracy of the model has been assessed by comparing the results with experimental data available in the scientific literature. Finally, the influence of mixture composition and thermodynamic conditions of the reactants on LFS has been assessed by considering temperature and pressure values relevant to automotive applications and not yet explored in the literature. By adding H2 to NH3/air mixtures, LFS increases exponentially. By plotting the logarithm of LFS as a function of the H2 mole fraction, the numerical results are well fitted by using a second-degree polynomial regression. However, a linear regression is accurate enough if the H2 mole fraction does not exceed 0.6. Regarding the effect of pressure, the decrease in LFS with increasing pressure is less important as pressure increases. On the other hand, LFS increases with temperature, and this effect is more pronounced as the H2 mole fraction decreases and pressure increases.

1. Introduction

Over the last few years, ammonia (NH3) has been carefully taken into account for use as an alternative fuel. Synthetic fuels are generally classified with different colors based on the production process, on the sources to be used during the production process, and on the amount of carbon emissions [1]. Ammonia synthesized using hydrogen that is produced by water electrolysis, powered by renewable energy sources, is a green fuel, typically known as e-ammonia, and is characterized by no-direct CO2 emissions. The use of e-ammonia instead of green hydrogen can overcome the concerns and inefficiencies related to hydrogen storage and transport. As a matter of fact, hydrogen is characterized by the highest gravimetric energy density of any fuel, but the low volumetric mass density of hydrogen under ambient conditions results in a relatively low volumetric energy density. This usually requires to store hydrogen at cryogenic conditions [2]. Ammonia, on the other hand, liquifies, for example, at atmospheric temperature (298 K) and 0.998 MPa or at atmospheric pressure (0.1 MPa) and 239.57 K [3], thus making its transport and distribution much easier than hydrogen. In this scenario, ammonia may play an important role in the decarbonization process of the automotive industry.
Nonetheless, ammonia combustion also presents some drawbacks, such as high toxicity and very low Laminar Flame Speed (LFS). A solution to improve ammonia combustion is the addition of hydrogen, as shown in the literature by both experimental and numerical approaches. Ichikawa et al. [4] measured the laminar flame speed of ammonia/hydrogen/air stoichiometric mixtures by observing the spherically propagating premixed flame in a constant volume chamber. The initial temperature of the mixture was set at 298 K and three pressures, namely 0.1, 0.3 and 0.5 MPa, were considered, whereas hydrogen mole fraction was varied in the range 0–1. The results show that by adding hydrogen to ammonia the LFS exponentially increases. Even if the LFS decreases by increasing the pressure, the presence of hydrogen provides a similar behavior for all values of pressure. The same authors also carried out numerical simulations by using five different kinetic reaction mechanisms, thus finding qualitative but not quantitative agreement with experimental data. More recently, Han et al. [5] measured the LFS of NH3/air, NH3/H2/air, NH3/CO/air and NH3/CH4/air mixtures at atmospheric pressure by using a heat flux burner and by considering different equivalence ratios and composition ratios. Hydrogen was found to be the most effective additive fuel to increase the LFS of ammonia. The equivalence ratio that maximizes the LFS of NH3/H2 blends is equal to about 1.05 and increases with the H2 mole fraction. Li et al. [6] developed a detailed chemical mechanism and a reduced one for NH3/H2 mixtures. The comparison with available experimental data under atmospheric conditions shows that a good agreement was obtained for lean and stoichiometric mixtures, whereas both mechanisms over-predict LFS for rich mixtures. Simulations of turbulent non-premixed jet flames were performed and the structure of the reaction region was analyzed, showing that NO concentration significantly increases in the high-temperature zone, where near-stoichiometric conditions occur. In addition, NO2 increases in the lean regions. LFS correlations for NH3/H2 mixtures were proposed by Pessina et al. [7], who used a fitting procedure of the simulation data. Such correlations were used to carry out Computational Fluid Dynamics (CFD) simulations, with ad hoc combustion models, to predict the LFS at engine-like conditions. The results show that by adding hydrogen with mole fractions between 0.4 and 0.6, the LFS of NH3/H2 mixtures approaches the value obtained with gasoline, even under high temperature and pressure conditions, namely 820 K and 4 MPa, 948 K and 8 MPa, and 1012 K and 10 MPa.
To the best of our knowledge, the LFS of NH3/H2 mixtures has been experimentally measured up to 0.7 MPa. This was carried out by Shrestha et al. [8] at 473 K, for H2 content up to 20% and for an equivalence ratio equal to 1.1. On the other hand, in the literature, different chemical kinetic mechanisms for NH3/H2 mixtures have been proposed by several authors [5,9,10,11,12,13], for pressures and temperatures relatively low with respect to operating thermodynamic conditions typical of thermal engines. The characterization of the flame structure and speed with temperatures and pressures reached at end-of-compression stroke in engines is of the utmost importance for engine combustion simulations. Therefore, five kinetic mechanisms [9,10,11,12,13] have been used to analyze the laminar flame structure and speed of NH3/H2 blends under several temperatures and pressures for different fuel mixture compositions and equivalence ratios. The numerical results have been compared with available experimental data and the most accurate kinetic models have been used for further analyses at much higher pressures and temperatures. Specifically, in this work, the laminar flame structure and speed of NH3/H2 blends have been analyzed under thermodynamic conditions that have not yet been investigated in the literature. The major contribution of this work is to assess whether the linear trend proposed by Ichikawa et al. [4] to correlate LFS and H2 mole fraction, X(H2), in a semi-logarithmic scale, based on experimental data up to 0.3 MPa for stoichiometric mixtures, also occurs for higher pressures and lean/rich mixtures. Furthermore, for each pressure, several values of X(H2), ranging from 0.0 to 1.0, have been considered, whereas in Ref. [4] the upper limit of X(H2) has been reduced as pressure increases. Indeed, in Ref. [4], X(H2) ranges from 0.0 to 1.0 at 0.1 MPa, from 0.0 to 0.6 at 0.3 MPa, and from 0.0 to 0.4 at 0.5 MPa. The thermodynamic conditions of this work are summarized in Table 1. Two correlations, i.e., a linear regression and a second-degree polynomial regression, have been proposed to predict LFS as a function of X(H2) in a semi-logarithmic scale. The results of the two correlations have carefully been compared. The measurements of Ref. [4] show that the influence of hydrogen addition is similar at 0.1, 0.3 and 0.5 MPa. By extending the range of conditions up to 8.0 MPa, the numerical results show that the influence of hydrogen addition decreases with increasing pressure and equivalence ratio. Finally, the steady flame structure, under laminar conditions, and its thickness have been analyzed to assess the influence of H2 addition to the fuel composition and to explore the kinetics that lead to LFS enhancement by the addition of H2.
This work is organized as follows: first, the numerical model is described and validated against experimental data, then the results obtained at pressure up to 8.0 MPa are discussed, and, finally, the conclusions are summarized.

2. The Model

2.1. Governing Equations

Ansys® Academic Research Chemkin-Pro Release 20.2 software [14] has been used to study the laminar flame structure and speed of NH3/H2 mixtures. This code has been implemented for premixed, one-dimensional laminar flames under steady-state conditions and isobaric combustion. The governing equations are the flow rate continuity, the energy conservation, the mass balance of each chemical species and the thermally perfect gas equation of state, which can be, respectively, written as follows:
= ρ u A r ,
d T d x 1 c p d d x λ A r dT dx + A r c p k = 1 K ρ Y k V k c p k dT dx + A r c p k = 1 K ω ˙ k h k W k   = 0 ,
d Y k d x + d d x ρ A r Y k V k A r ω ˙ k W k   = 0 ,
ρ = p W ¯ R T .
In the above equations, Ṁ is the mass flow rate, ρ is the mass density, u is the gas velocity, Ar is the area of the reactor section (whose default value is equal to 1 m2), T is the temperature, c p is the specific heat at constant pressure of the gas mixture, λ is the thermal diffusivity of the mixture, Y k is the mass fraction of the k-th chemical species, K is the number of species, V k is the diffusion velocity of the k-th species, c p k is the specific heat at constant pressure of the k-th species, ω ˙ k is the chemical production rate of the k-th species, hk is the specific enthalpy of the k-th species, Wk is the molecular weight of the k-th species, p is the pressure, W - is the molecular weight of the mixture and R is the universal gas constant.
The chemical production rate is computed by assuming that kinetics is governed by the law of mass action and the forward rate coefficients, kf, are computed by using the modified Arrhenius equation, which reads:
k f = A T β exp E A R T ,
where A is the pre-exponential factor, β is a nondimensional factor, and EA is the activation energy of the reaction.
A multi-component diffusion model has been employed together with the Soret effect to take into account the thermal diffusion. This effect is especially required for mixtures with large molar fractions of hydrogen. The multi-component model evaluates the transport properties using the Dixon–Lewis method [15] and the diffusion velocity is computed as follows:
V k = V k + V k ,
where V k is the ordinary diffusion velocity and V k is the thermal diffusion velocity, which are evaluated as follows [16]:
V k = 1 X k W ¯ j k K W j D k , j d j ,
V k = D k T ρ Y k 1 T T ,
with:
d j = X j + X j Y j 1 p p .
In the above equations, X k is the mole fraction of the k-th species, D k , j is the diffusion coefficient of the species k in species j and D k T is the thermal diffusion coefficient of the k-th species.
In this work, five different reaction mechanisms have been selected under different temperature and pressure conditions and the numerical results have been compared with experimental data available in the scientific literature. Specifically, the mechanisms considered are summarized in Table 2, where a label is given to identify each mechanism and the numbers of chemical species and reactions of each mechanism are provided. All the mechanisms have been used to investigate the combustion of NH3/H2 mixtures with mole fractions of hydrogen ranging between 0.0 and 1.0. The oxidant is air, which is composed of 79% nitrogen and 21% oxygen by mole concentration.

2.2. Numerical Method

A one-dimensional computational domain of 0.1 m in length has been considered. Such a length has been chosen based on a numerical test on the independence of the results on the length of the computational domain in the range of 0.05–0.15 m. The domain has been discretized by using an adaptive numerical grid by setting a maximum number of grid points equal to 1000.
The numerical solution procedure is based on a finite difference approach, to reduce the boundary problem to a system of algebraic equations. Such a system has been solved by Newton’s algorithm. In the case such an algorithm fails to converge, a solution estimate is conditioned by a pseudo-time integration of the governing equations, thus providing an initial estimate closer to the steady-state solution. The numerical model discretizes the domain into a number of grid points in order to satisfy specific criteria on the maximum gradient and curvature of the solution vector between two adjacent grid points. The criteria to be satisfied for each pair of points [j − 1, j] are:
Φ n , j Φ n , j 1 δ Φ n m a x Φ n m i n ,
d Φ n d x j d Φ n d x j 1 γ d Φ n d x m a x d Φ n d x m i n ,
where Φ n is the n-th component of the solution vector and δ and γ are the gradient and curvature parameters, respectively. The numerical algorithm keeps adding intermediate points in each subinterval until the above criteria have been satisfied. It follows that by reducing the values of the two parameters, the number of grid points and the accuracy of the results increase. In the computations, four consecutive grid refinements with decreasing values of gradient and curvature parameters have been considered, as specified in Table 3. For particular stiffness cases, the gradient parameter in the last refinement has been set equal to 0.015 to obtain an increase in the numerical accuracy of the results. For instance, Figure 1 shows the LFS versus the number of grid points of each continuation for two cases with both a stoichiometric mixture of NH3/H2/air at 300 K and different H2 molar fractions and pressures. The figure shows that with four consecutive continuations, a very accurate value of LFS is obtained. Indeed, the difference between the final and the previous continuation values of LFS is less than 0.3% for all cases. For the sake of completeness, Figure 2 shows the grid size distribution along the x-axis in the flame region for the initial, the second and the fourth continuations. The temperature profile is also given for the last continuation. The figure shows that, in the flame region, the grid size decreases as the continuations increase, leading to an increase in the numerical accuracy in terms of LFS.
In order to reduce the computational time and to speed up the numerical convergence for each simulation, an inlet velocity of the reactant mixture close to the expected one has been set. The timestep has been set in the range of 1010–106 s, depending on the stiffness of the problem to be solved.

3. Results and Discussion

In the first instance, the model was validated by comparing the results with available experimental data, summarized in Table 4. Two sets of data have been considered. The first set accounts for stoichiometric mixtures at three different pressures, namely 0.1, 0.3 and 0.5 MPa, with different H2 content in the NH3/H2 blend, at about 300 K. The second set accounts for three different temperatures, i.e., 298 K, 373 K and 473 K and different equivalence ratios and fuel blending ratios at 0.1 MPa. Then, a parametric study was carried out to analyze the LFS of different NH3/H2 mixtures for temperatures and pressures higher than those used for the model validation. To this end, three mechanisms have been selected based on the best agreement with available experimental data. Finally, the laminar flame structure under steady conditions has been analyzed to understand the role of H2 on the production and consumption of the most important chemical species for the case with reactants at 800 K and 4.0 MPa. Such conditions correspond to typical SI engine thermodynamic conditions at spark timing.

3.1. Model Validation

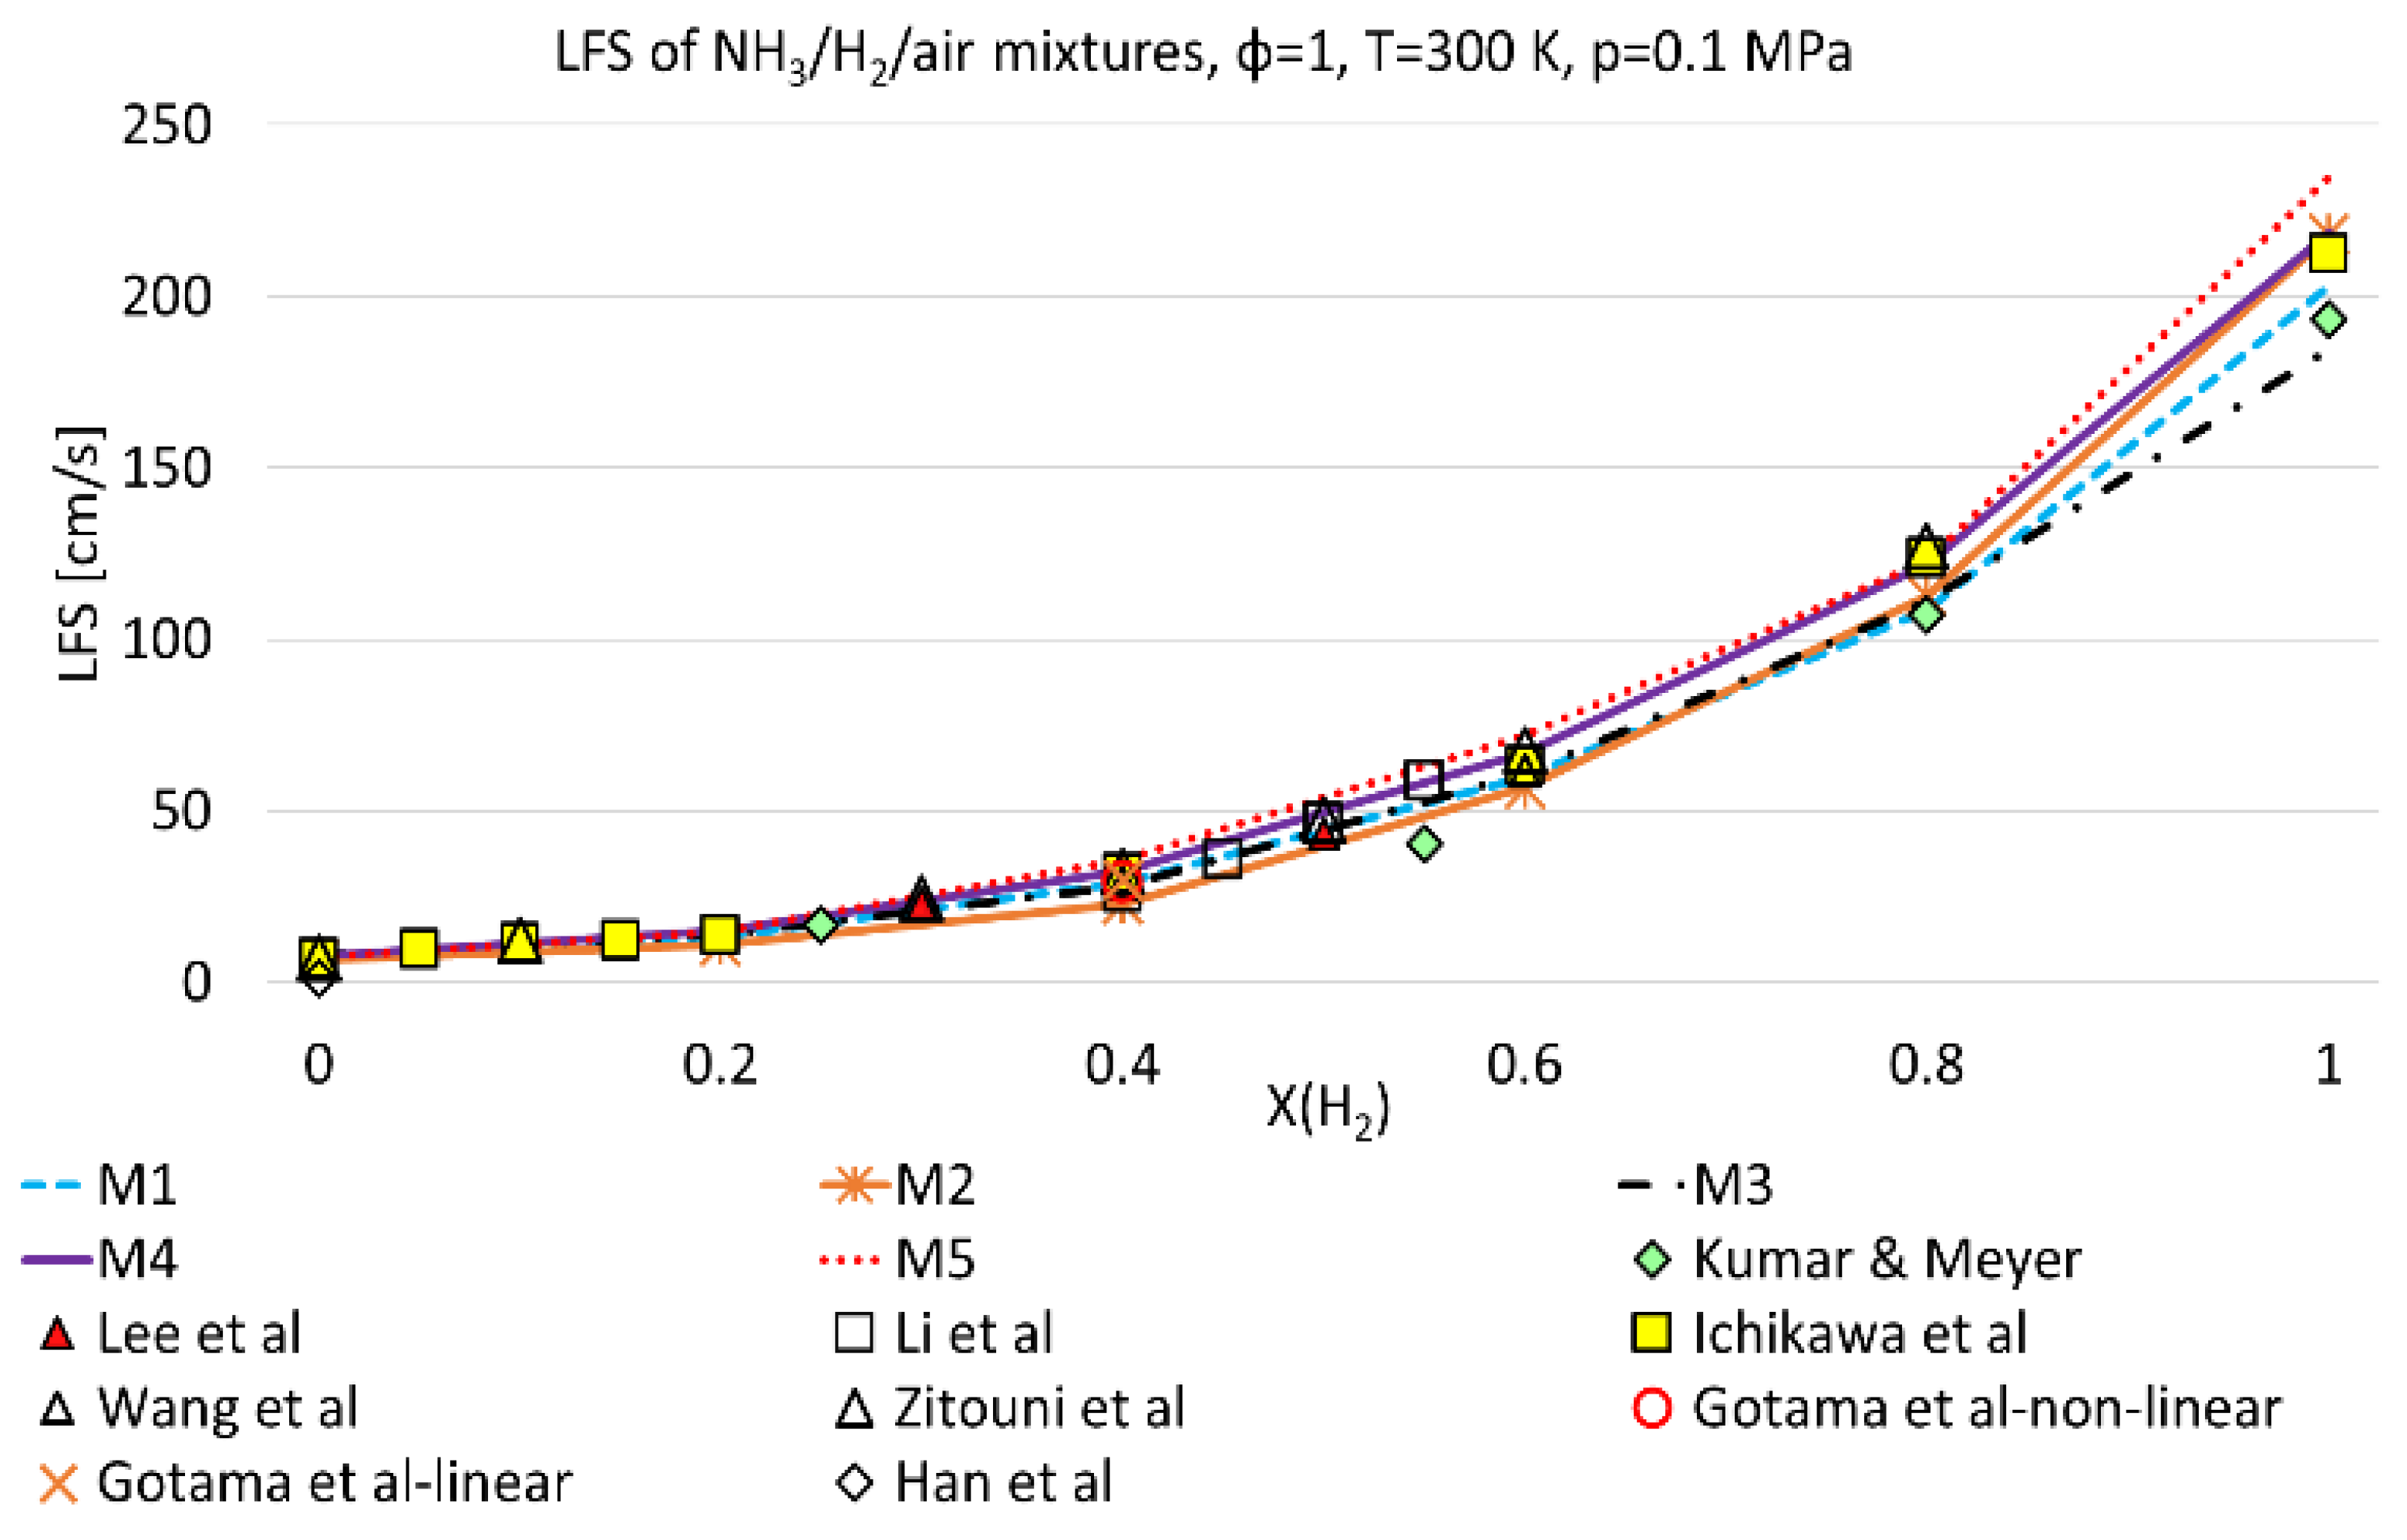
Figure 3 shows the numerical results for stoichiometric mixtures at 300 K and 0.1 MPa, obtained by using the kinetic models of Table 2 and compared with several measurements [4,11,17,18,19,20,21,22]. The figure shows that LFS increases exponentially with H2 molar content in the fuel blend, in agreement with Ref. [4]. Both experimental data and the simulations give similar results for low values of X(H2), whereas some discrepancies arise as hydrogen content increases. The mechanism proposed by Singh et al. [13] predicts the highest values of LFS for any value of X(H2), whereas Otomo et al. [10] mechanism predicts the lowest values of LFS for X(H2) less than 0.6. For pure hydrogen, the mechanism by Gotama et al. [11] provides the lowest LFS. However, the dispersion of the numerical data is comparable to the variability of the measurements by different authors.
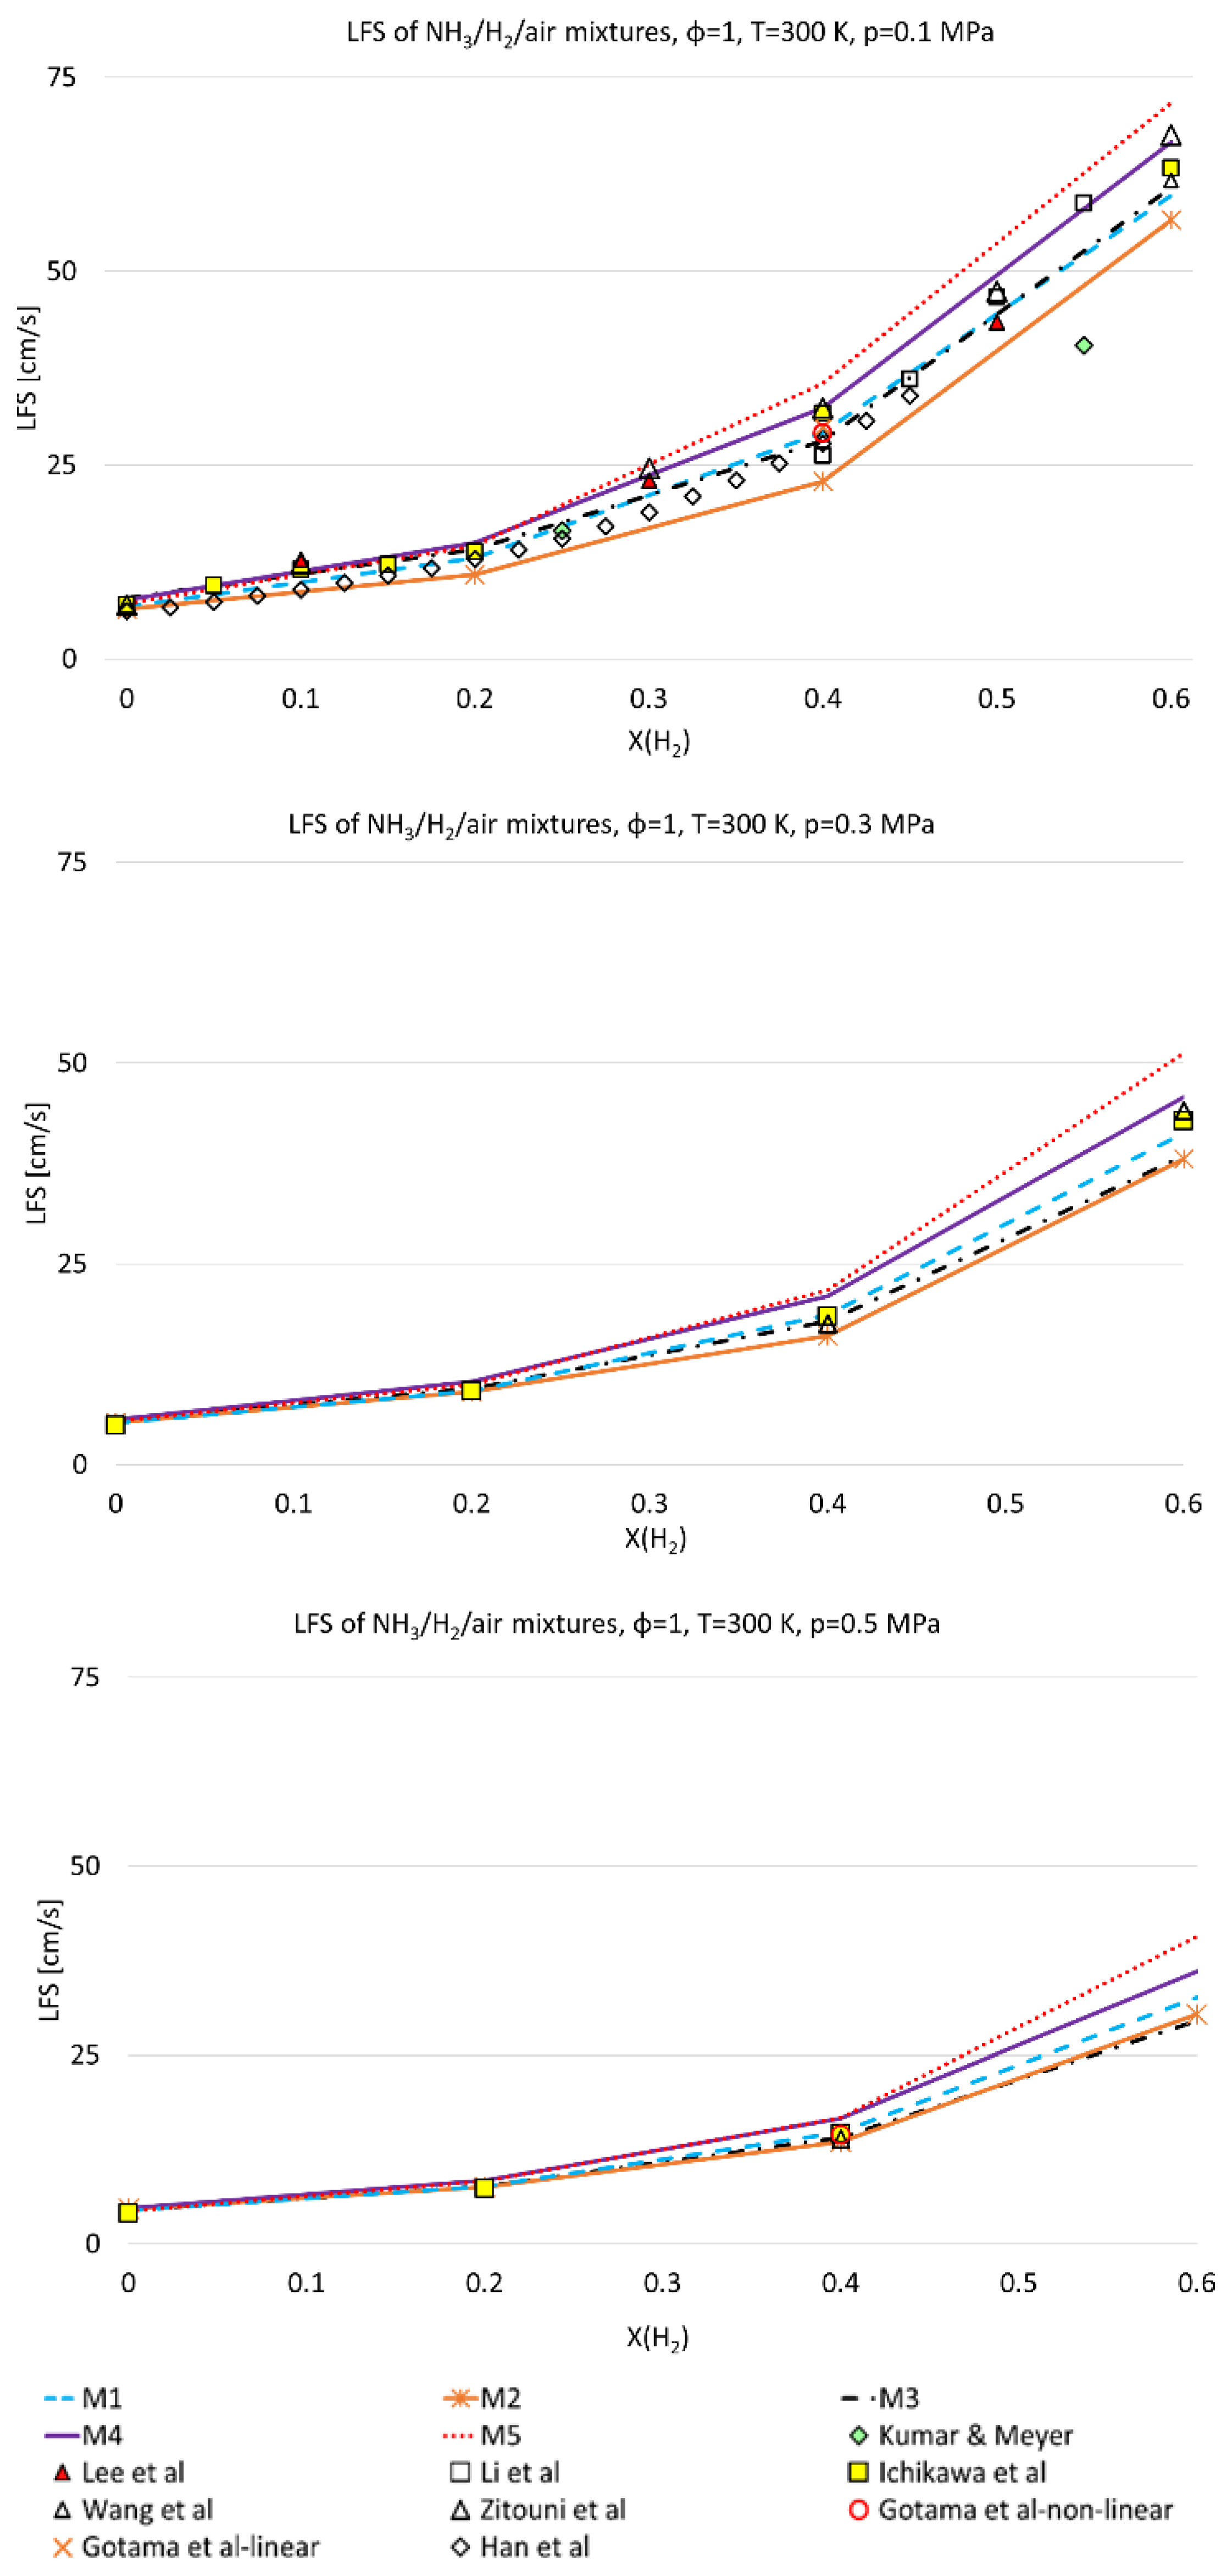
Figure 4 shows the comparison between the experimental data and the present numerical results in terms of LFS as a function of hydrogen mole fraction of the NH3/H2 mixture, in the range 0.0–0.6, at T = 300 K, ϕ = 1 and different pressures, namely 0.1, 0.3 and 0.5 MPa. The conditions used for the experiments are listed in Table 4. Figure 4 shows an additional set of experimental data by Han et al. [5] with pressure equal to 0.1 MPa. For the sake of clarity, this set is not reported in Figure 3. For all the selected pressures, the numerical results fall between those obtained with the mechanism of Singh et al. [13] and those obtained with the mechanism of Otomo et al. [10]. With a hydrogen molar content equal to 60%, the numerical values of LFS range from 56.6 to 71.7 cm/s at 0.1 MPa, from 38.1 to 51.3 cm/s at 0.3 MPa, and from 29.5 to 40.6 cm/s at 0.5 MPa. At 0.3 and 0.5 MPa, although all mechanisms give reasonable results, Zhang et al. [9] mechanism provides the best agreement with measurements [4,11,22] for any hydrogen molar content.
Thus, the results have been analyzed to assess the influence of pressure on LFS. For this purpose, the percentage reduction in LFS with pressure, L F S % r e d , as a function of the H2 mole fraction has been evaluated for each of the mechanisms from Table 2. The expression used to compute L F S % r e d by increasing pressure from p i to p f reads:
L F S % r e d = L F S p i L F S ( p f ) L F S ( p i ) ,
where L F S p i and L F S p f are the laminar flame speeds for the lower and the higher values of pressure, respectively.
Two different data sets have been considered to analyze the influence of pressure increase from 0.1 to 0.3 MPa and from 0.1 to 0.5 MPa. The mean percentage reduction in LFS has been computed across the five mechanisms for each H2 mole fraction. Such a percentage reduction is shown in Figure 5 together with the bars that represent the variability between the maximum and minimum percentage reduction across the five mechanisms. The figure shows that this percentage reduction is less pronounced as pressure increases. For example, at X(H2) equal to 0.4, where the maximum decrease occurs, reductions of 35% and 48% are observed with a pressure increase by a factor of 3 and 5, respectively. Moreover, the figure shows that, for a molar fraction of H2 equal to 0.2, the mean values are closer to the upper limit of the range of variability. This is because the mechanism of Otomo et al. [10] gives a percentage reduction in LFS by increasing pressure from 0.1 to 0.3 MPa and from 0.1 to 0.5 MPa close to 16% and 30%, respectively, whereas higher and closer values are predicted by the other mechanisms. The highest percentage reduction in LFS is predicted by using Gotama et al.’s [11] mechanism for all X(H2) values, except for X(H2) = 0.4. For such a case, the highest reduction is observed by using Singh et al. [13] mechanism.
In the next section, the influence of pressure will be analyzed to assess whether a further increase in pressure provides the same behavior discussed here.
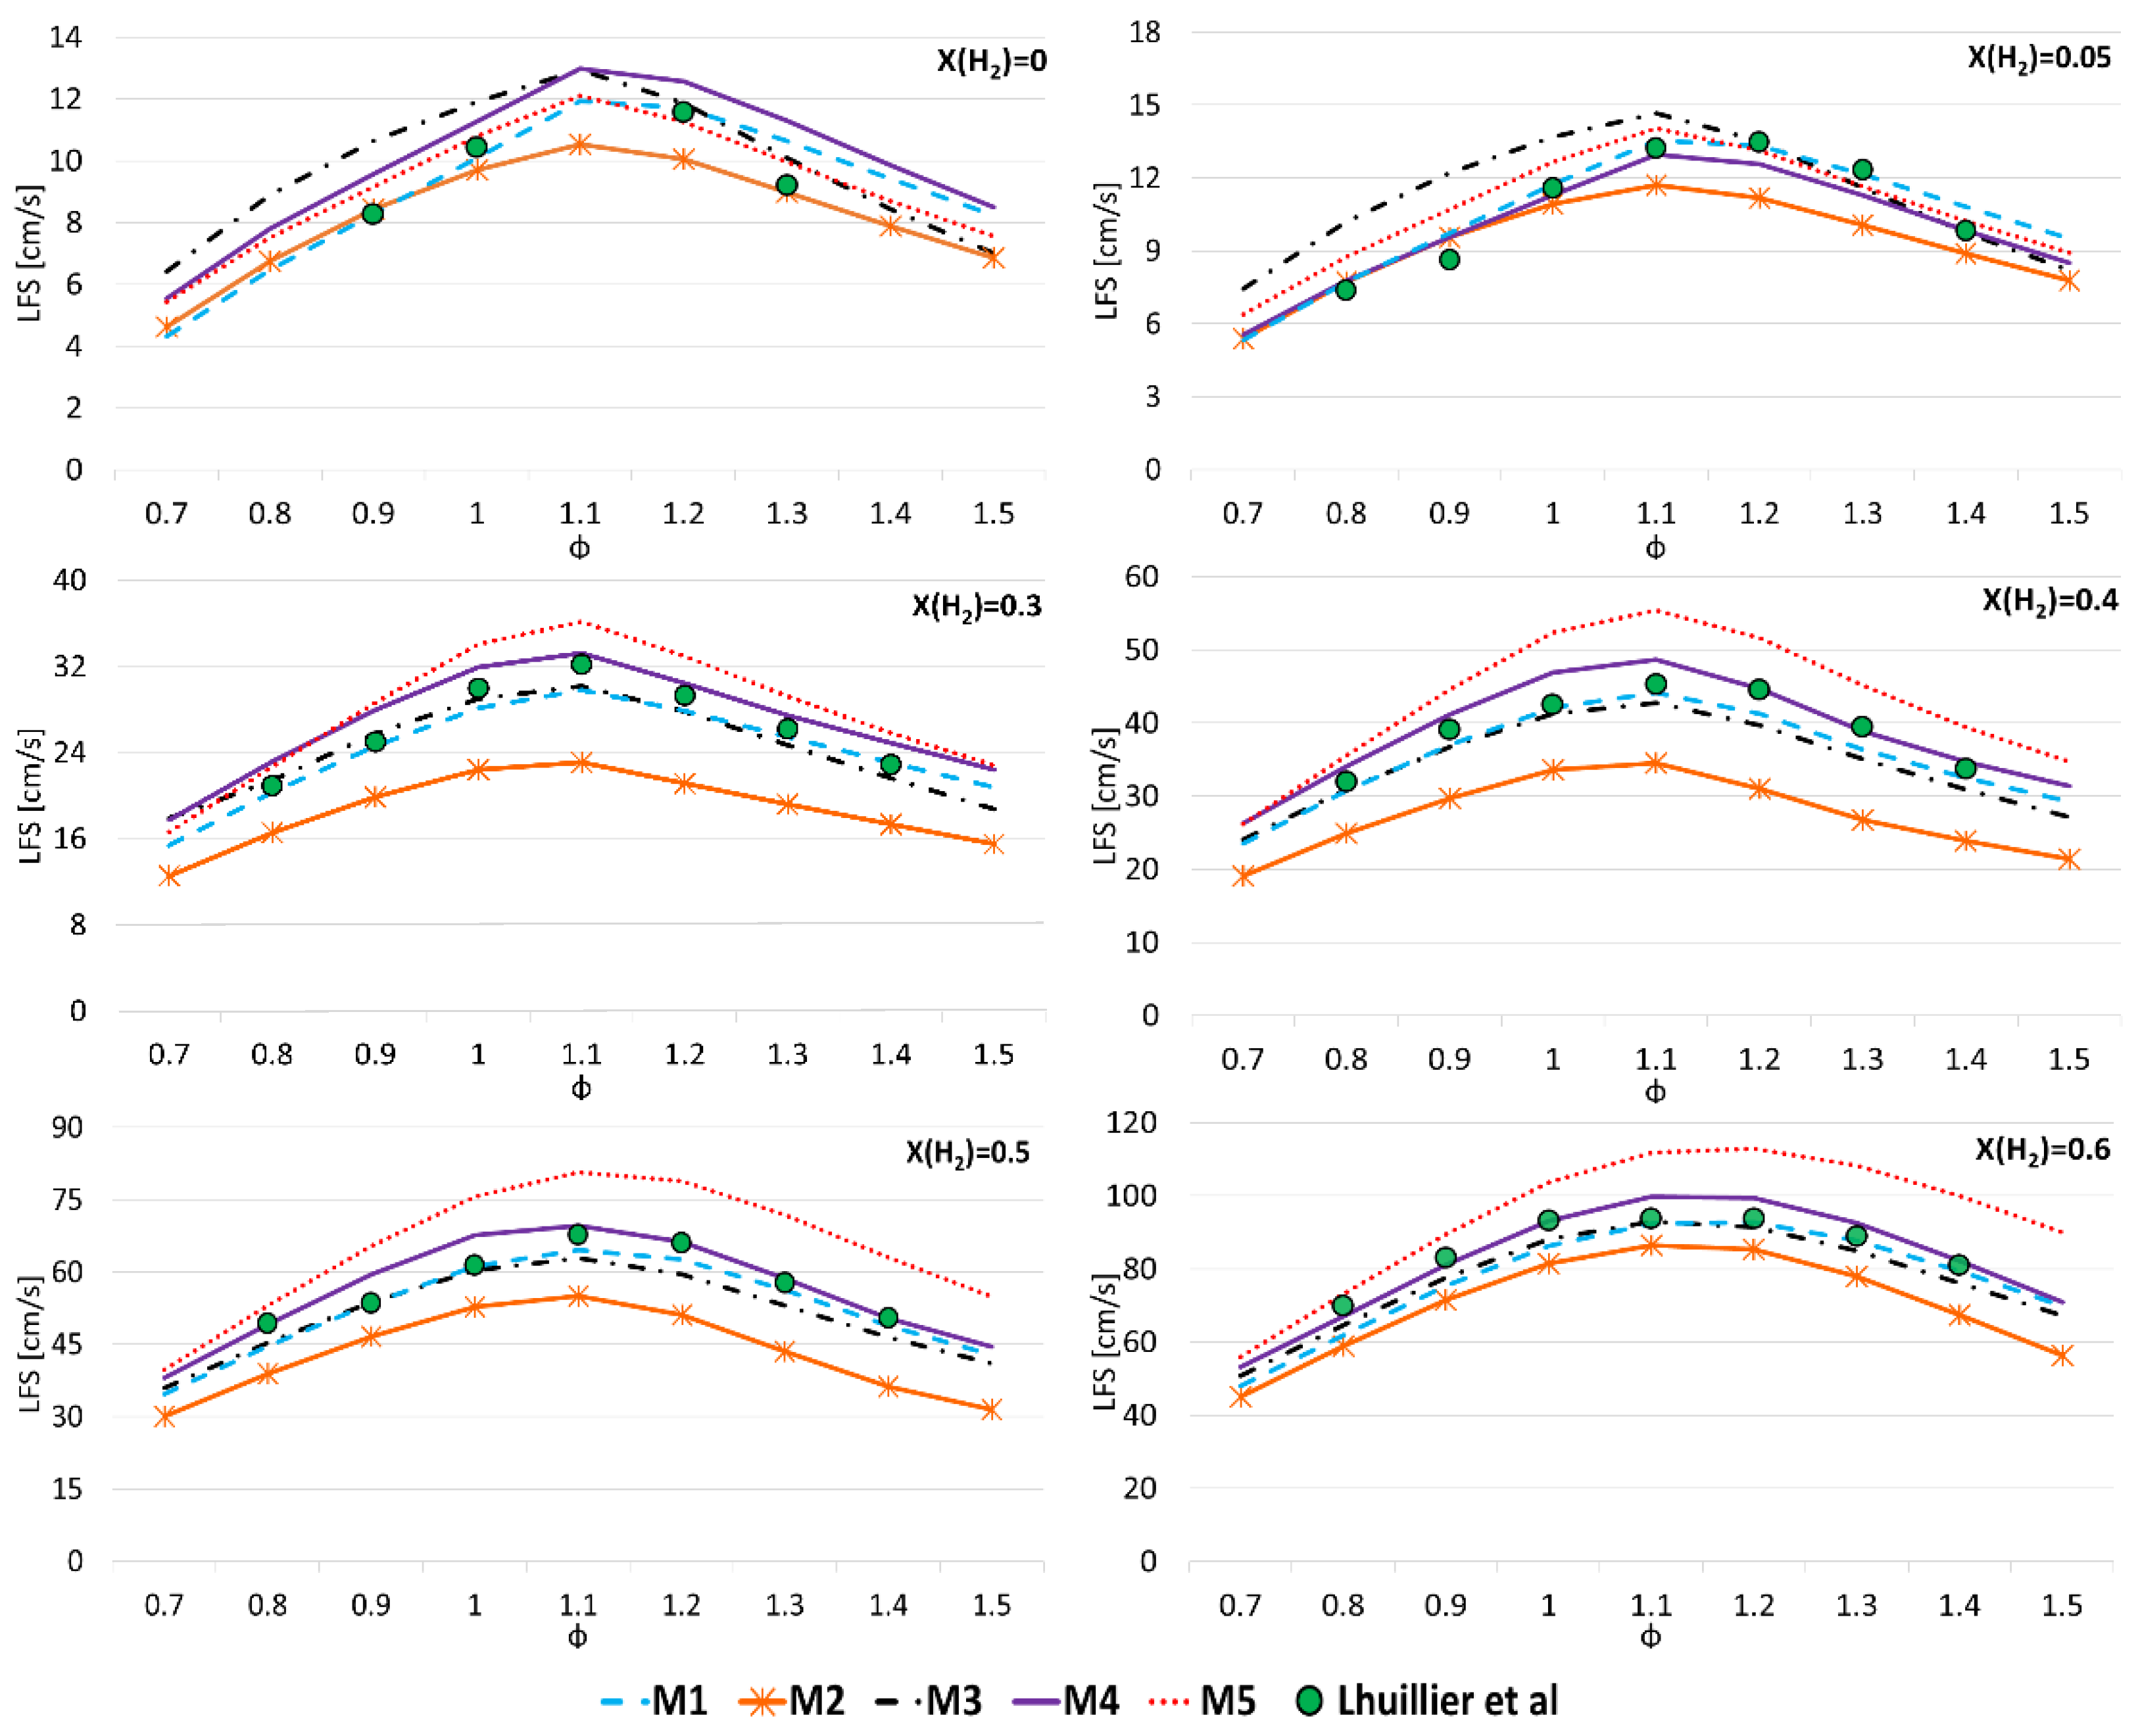
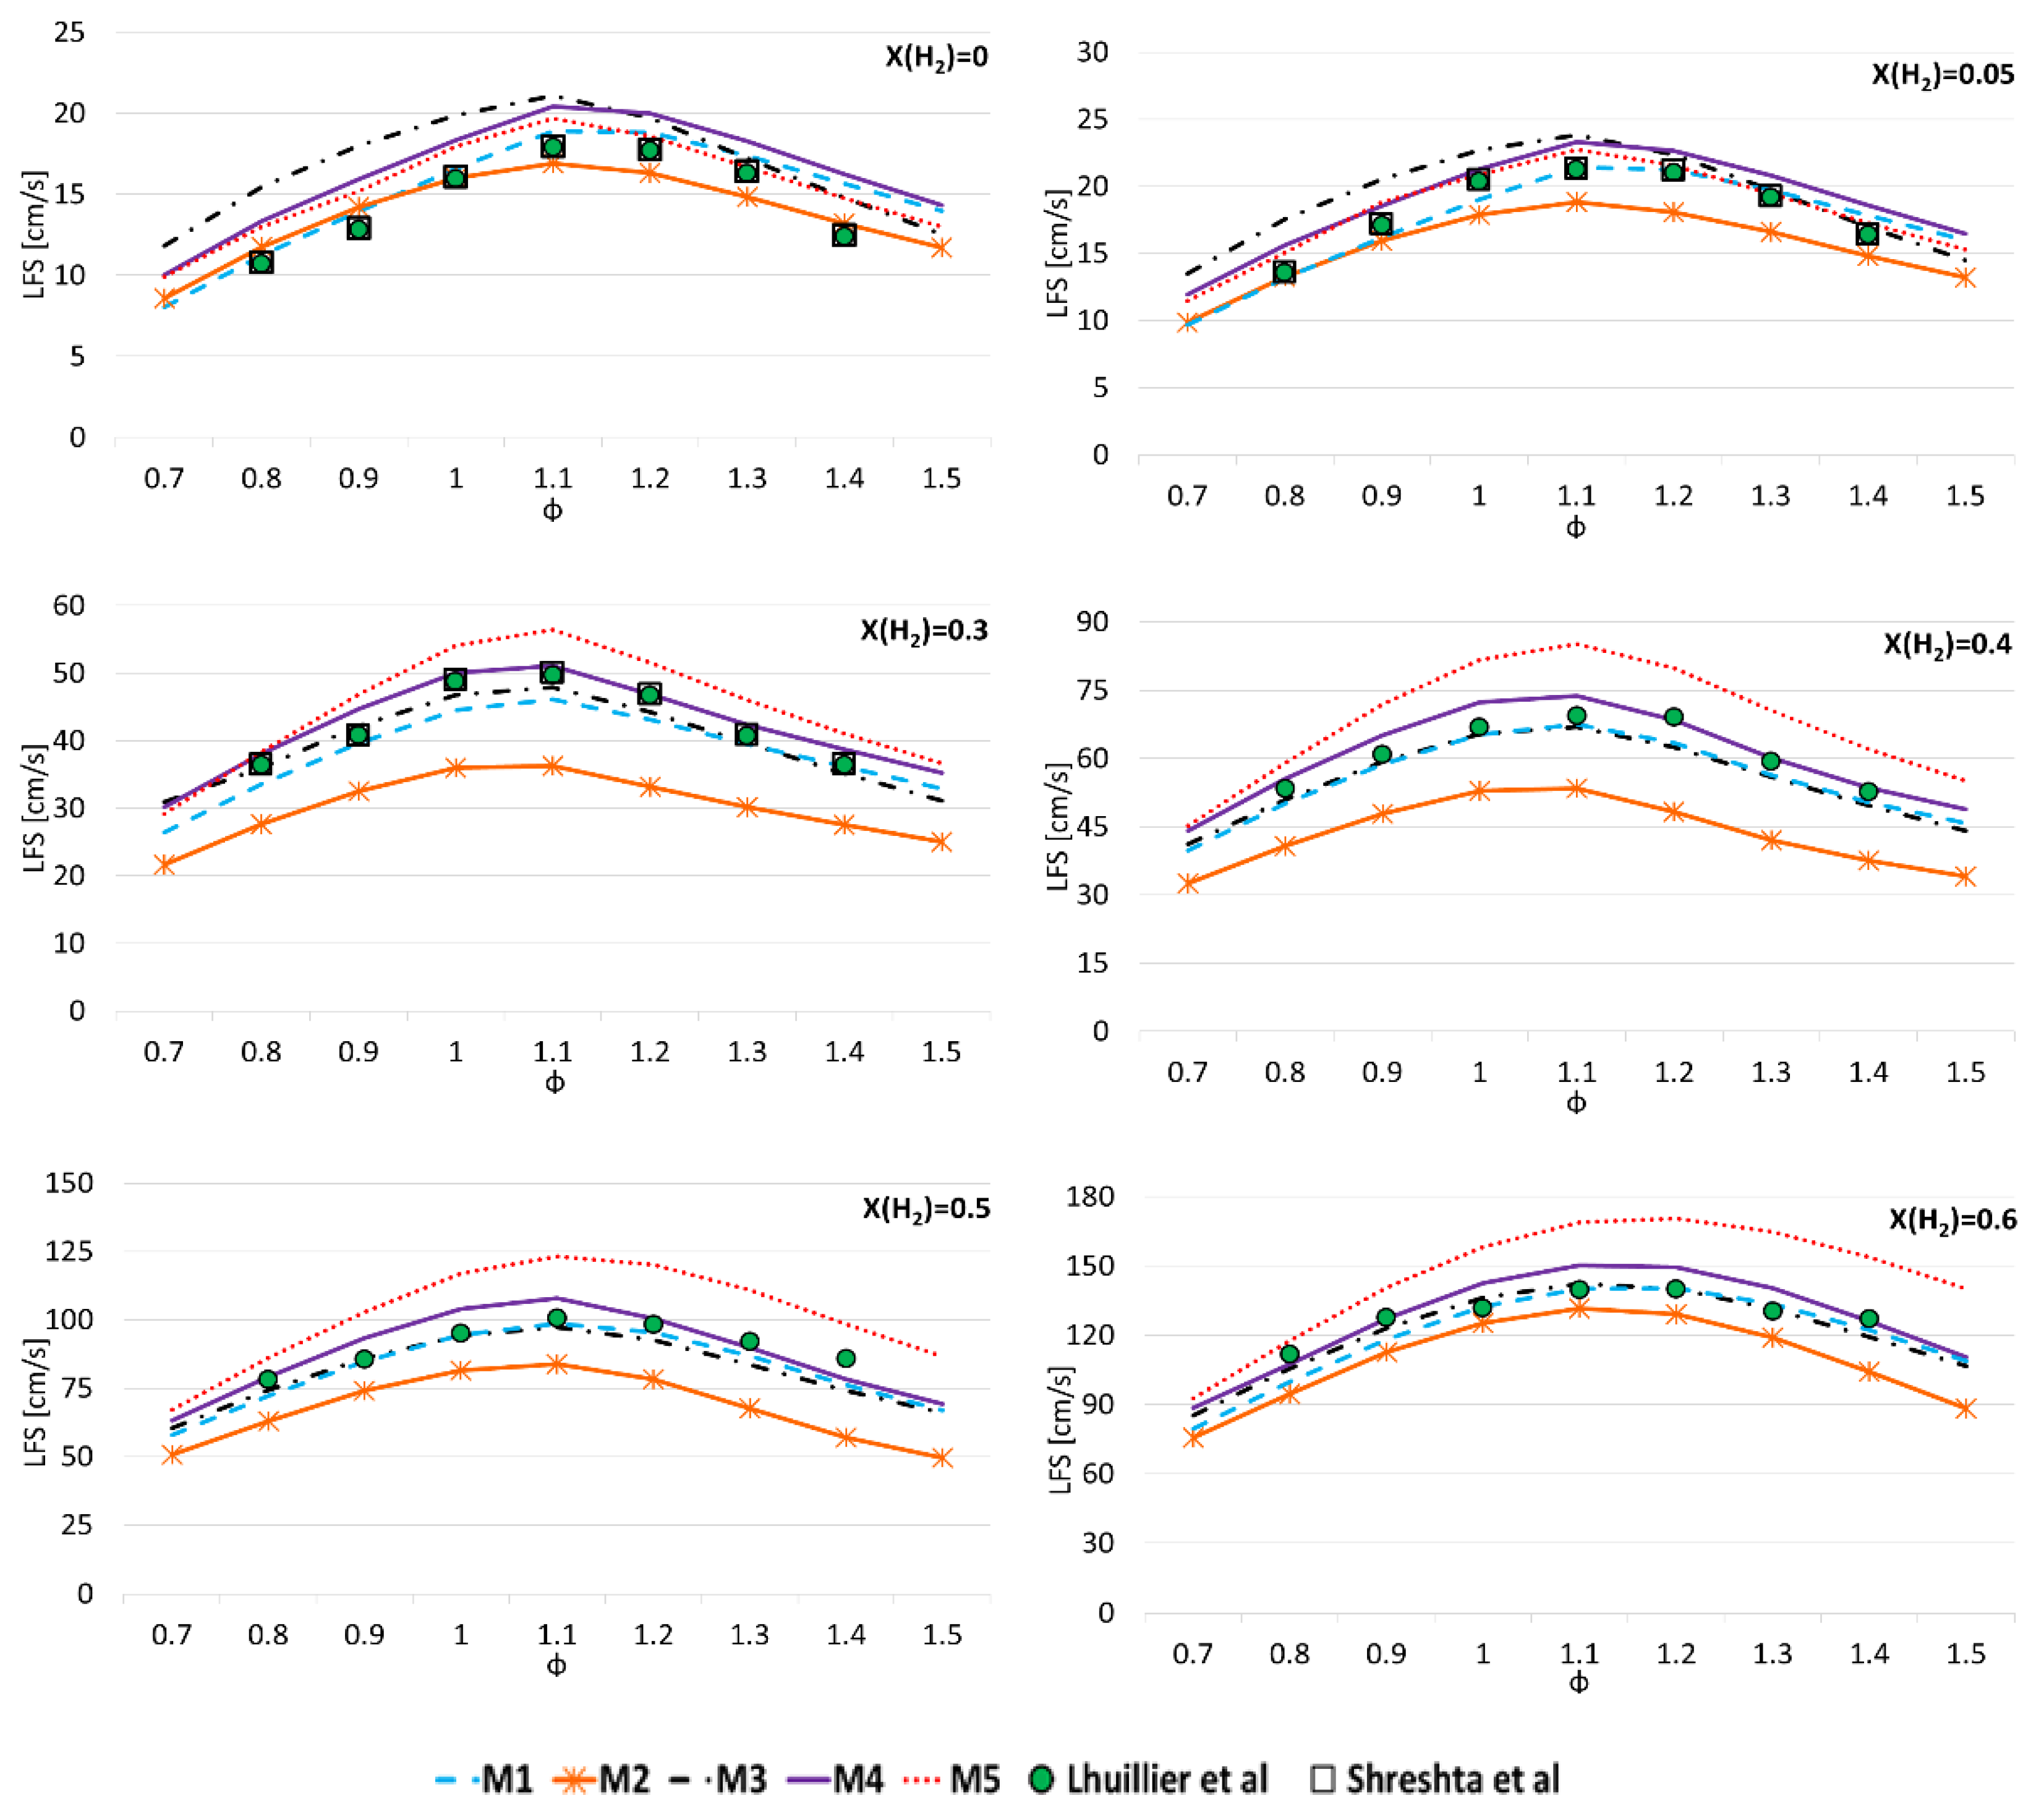
Several simulations have been carried out in order to study the LFS of different NH3/H2 fuel mixtures as a function of equivalence ratio at 0.1 MPa by using the kinetic mechanisms from Table 2. Six H2 mole fractions, i.e., 0.0, 0.05, 0.3, 0.4, 0.5 and 0.6, and three temperatures, i.e., 298, 373 and 473 K, have been considered. Figure 6, Figure 7 and Figure 8 show the numerical results obtained at 298, 373 and 473 K, respectively, together with the measured data in Table 4. Once again, for cases with many available measurements, the dispersion of the numerical data obtained by using different mechanisms is comparable to the variability of measurements by different authors. For all temperatures, numerical results show that the maximum value of LFS is obtained for rich mixtures, with ϕ close to 1.1 or higher, and X(H2) equal to 0.6.
For lower hydrogen mole fractions, i.e., 0.0 and 0.05, the M3 mechanism predicts higher values of LFS as the equivalence ratio is lower than 1.1, whereas, for richer mixtures, M4 gives higher LFS than the other mechanisms. On the other hand, the M2 mechanism gives the lowest values of LFS, except for lean mixtures, where the lowest values are found with the M1 mechanism. For other H2 mole fractions, M2 gives the lowest LFS, whereas the highest values are obtained by using M5 for most cases. Specifically, M3 and M4 give higher values of LFS than M5 for X(H2) = 0.3 with an equivalence ratio less than 0.8 for each temperature of interest; this is also the case for hydrogen mole fraction equal to 0.4 with the temperature equal to 298 K.
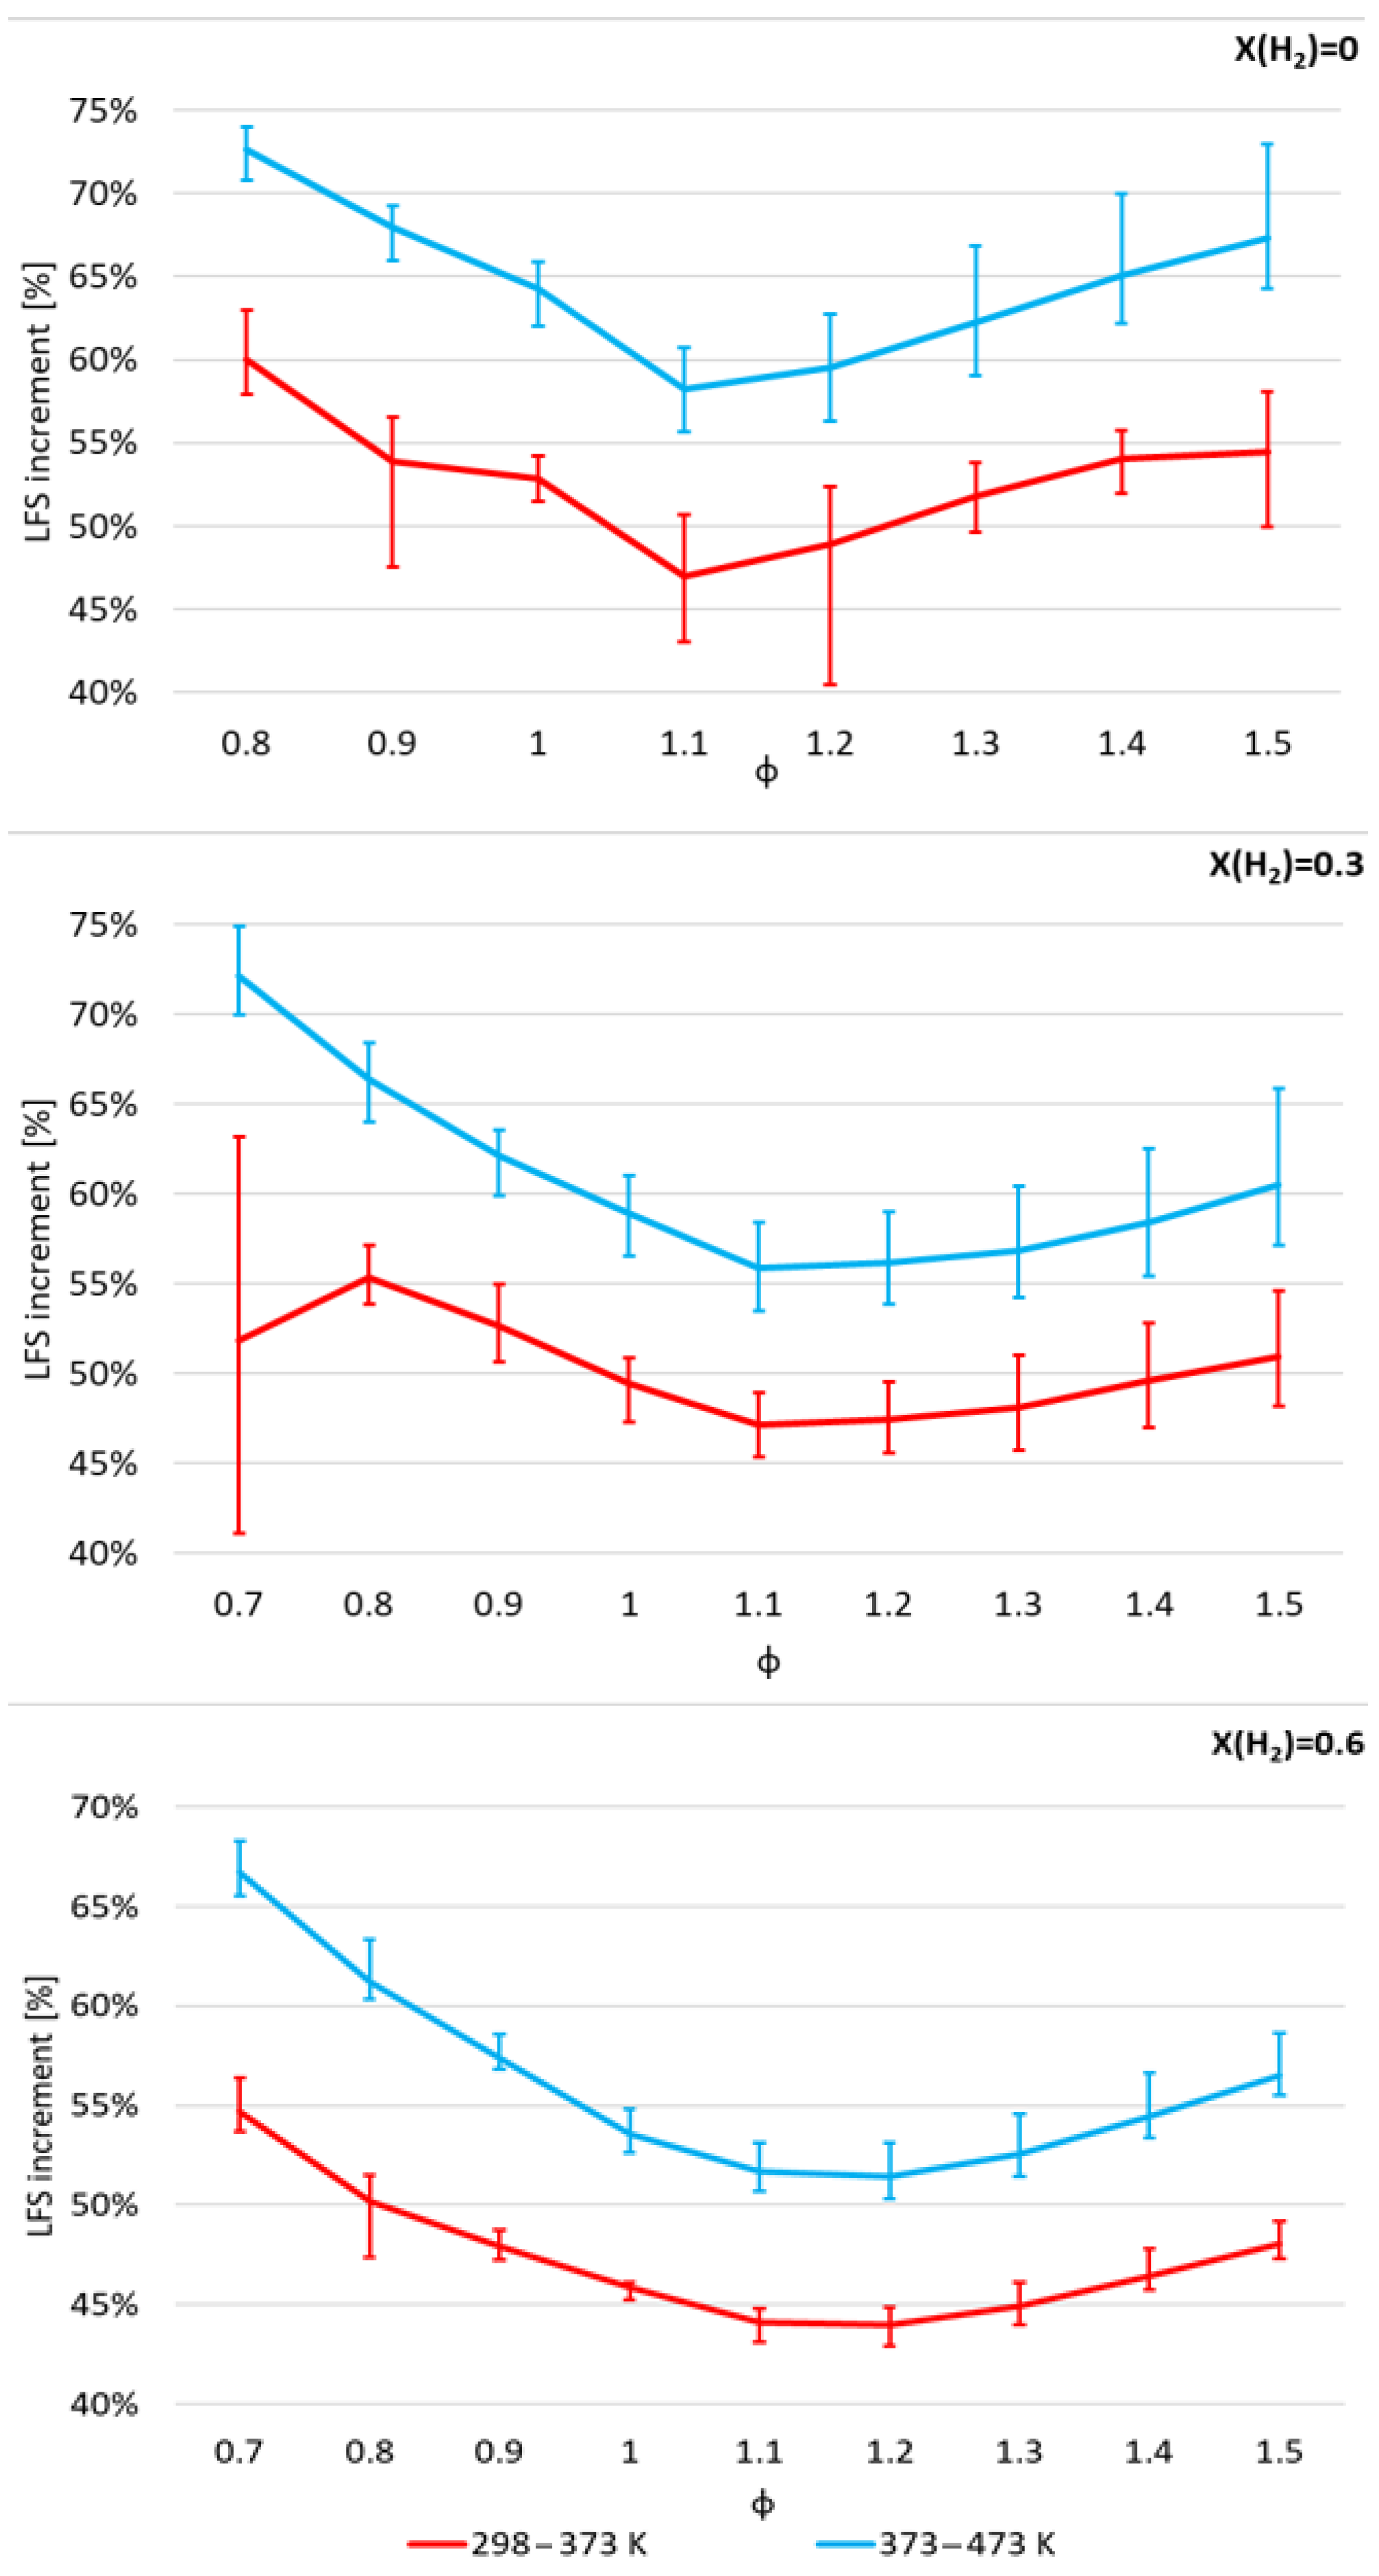
Figure 9 shows the percentage increment of LFS with temperature, L F S % i n c , as a function of equivalence ratio for three values of X(H2), namely 0.0, 0.3 and 0.6, at 0.1 MPa. Increasing the temperature from T i to T f , L F S % i n c is evaluated as follows:
L F S % i n c = L F S T f L F S ( T i ) L F S ( T i ) ,
where L F S T i and L F S T f are the laminar flame speeds for the lower and the higher values of temperature, respectively. L F S % i n c is computed for each mechanism, and the mean value is shown in Figure 9. The bars represent the range of variability for the entire set of reaction mechanisms. Two data sets are plotted. The first set refers to an increase in temperature from 298 to 373 K, and the second set refers to an increase in temperature from 373 to 473 K.
An increase in temperature by 75 K starting from 298 K results in a lower percentage increase in LFS with respect to that obtained with an increase of 100 K starting from 373 K. However, the trends as a function of equivalence ratio are similar for the two data sets, regardless of the mole fraction of hydrogen. The only exception is the case with X(H2) = 0.3 and ϕ equal to 0.7, for which the largest differences are obtained depending on the kinetic mechanism. For each H2 mole fraction, the highest increase in LFS is found for either ϕ = 0.7 or ϕ = 0.8, whereas the minimum occurs at about ϕ = 1.1.
The influence of temperature on LFS decreases with increasing H2 mole fractions, therefore the case with pure ammonia provides the highest increase. Finally, with X(H2) = 0.6, the lowest variability of the numerical results is found. In the next paragraph, the influence of temperature on LFS has been investigated for hydrogen/ammonia mixtures under engine-like thermodynamic conditions.

3.2. A Parametric Analysis

A parametric study has been carried out to analyze the laminar flame speed of NH3/H2 mixtures under engine-relevant thermodynamic conditions. Three mechanisms, namely Zhang et al. [9], Gotama et al. [11] and Stagni et al. [12], have been chosen since they provide results that are in better agreement with available experimental data at pressure (Figure 4) and temperature (Figure 7 and Figure 8) conditions above the ambient. Hence, the M2 and M5 mechanisms have not been employed for the parametric analysis discussed in this section. Indeed, for the stoichiometric mixtures of Figure 4, the M5 mechanism [13] overpredicts LFS measurements at 300 K with pressure equal to 0.1 and 0.3 MPa and a molar fraction of H2 greater than 0.4. For cases at ambient pressure and temperature equal to 373 K (Figure 7) and 473 K (Figure 8), the M5 mechanism overestimates the measurements when the H2 molar fraction is higher than 0.3 for all equivalence ratios considered in this work. On the other hand, the M2 mechanism [10] underestimates the experimental data of Figure 7 and Figure 8 with a molar fraction of H2 higher than 0.3 for all equivalence ratios.
First, the influence of pressure, in the range 0.1–3.0 MPa, has been investigated by considering different NH3/H2 mixtures, with three equivalence ratios, namely 0.8, 1.0 and 1.2, at 300 K. The results obtained with the M1 mechanism are shown in Figure 10. Similar trends are obtained with the M3 and M4 mechanisms, though they are not shown for the sake of conciseness. A semi-logarithmic scale is used in order to assess whether a linear trend between the logarithm of LFS and the H2 mole fraction, as proposed by Ichikawa et al. [4] based on experimental data up to 0.3 MPa for stoichiometric mixtures, occurs for higher pressures and lean/rich mixtures. Furthermore, for each pressure, X(H2) ranges from 0.0 to 1.0, whereas in Ref. [4] the upper limit of the H2 molar fraction has been reduced as pressure increases. Specifically, in Ref. [4], X(H2) ranges from 0.0 to 1.0 at 0.1 MPa, from 0.0 to 0.6 at 0.3 MPa, and from 0.0 to 0.4 at 0.5 MPa.
From Figure 10, a quasi-linear dependence between the logarithm of LFS and the H2 mole fraction is observed, according to the following equation:
L F S L F S 0 = e α X H 2 ,
where LFS0 is the laminar flame speed of pure ammonia and α is the slope of the linear interpolation of the numerical data, computed by means of the method of the least squares. The coefficient of determination, R2, has also been considered to assess the accuracy of such a fitting. R2 is evaluated as:
R 2 = 1 i = 1 n L F S i L F S a , i 2 i = 1 n L F S i L F S m e a n 2   ,
where n is the number of data, L F S i is the i-th laminar flame speed, L F S a , i is the corresponding fitting value and L F S m e a n is the mean value of the computed LFSs.
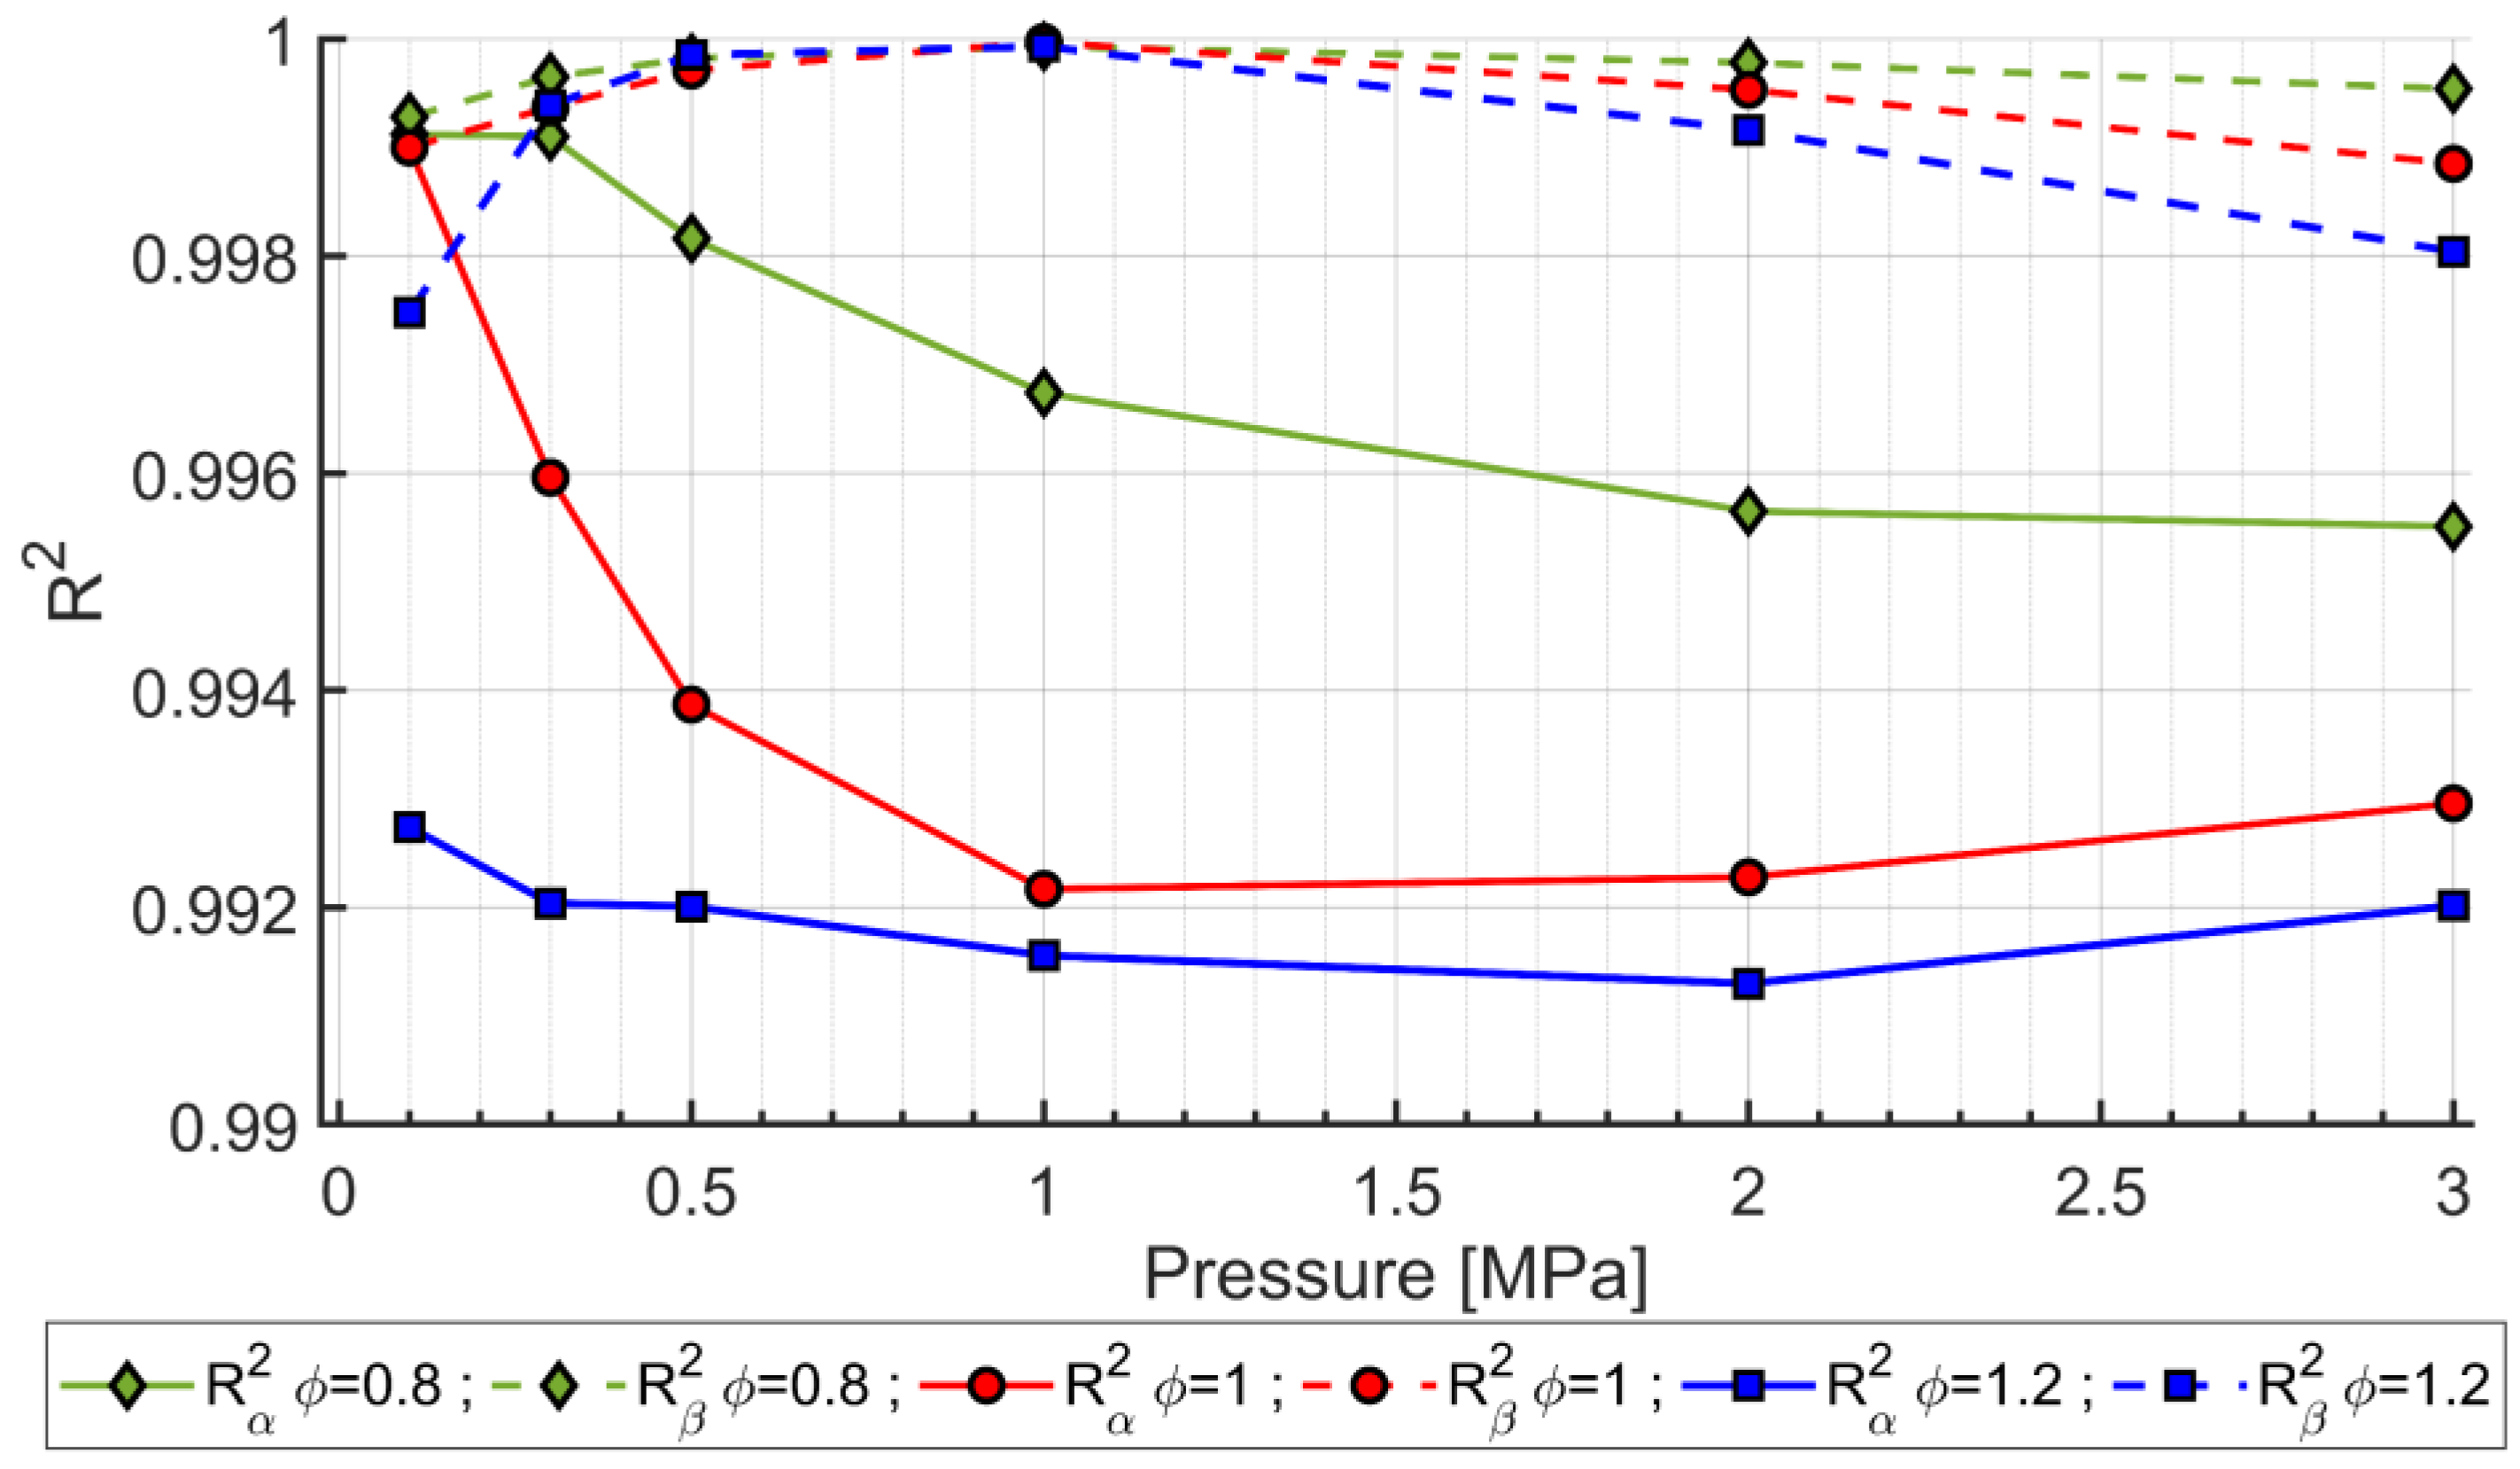
For all mechanisms, R2 decreases as pressure increases for any equivalence ratio, thus suggesting that the accuracy of the linear correlation worsens with increasing pressure. In order to address this issue, α and R2 have been computed by fitting the numerical data, obtained by using the M1 mechanism, up to X(H2) equal to 0.6. Indeed, Figure 10 shows that linear correlations (solid lines) accurately fit the numerical data with H2 mole fraction ranging from 0 to 0.6. The results are summarized in Table 5, where the determination coefficient is denoted as R α 2 , which is also given in Figure 11 as a function of pressure for the three equivalence ratios under consideration. For each equivalence ratio, α monotonically decreases as pressure increases, which suggests that the influence of hydrogen addition to the mixture is reduced. This is because, as a matter of fact, with more hydrogen in the fuel mixture, mass diffusivity should increase but this is counterbalanced by the increase in pressure. For each pressure value, α decreases with increasing equivalence ratio, since the H2 Lewis number increases and thermal diffusion plays a more important role. On the other hand, R α 2 is always higher than 0.99, it decreases as ϕ increases and approaches 1.0 for lean mixtures and low pressures, as shown in Figure 11. R α 2 decreases with increasing pressure for the lean case, reaches a minimum value at 1.0 MPa under stoichiometric conditions, and only slightly changes for the rich case.
A further improvement on the fitting of the numerical data for the entire range of H2 mole fractions is proposed as a second-degree polynomial fit, which reads:
L F S L F S 0 = e β 1 X H 2 + β 2 X H 2 2 ,
where β1 and β2 are the correlation coefficients, given in Table 5 together with the coefficients of determination, R β 2 , which are also shown in Figure 11. The second-degree polynomial regressions are shown as dashed lines in Figure 10. Such regressions are computed by using the method of least squares, i.e., by minimizing the sum of the squares of the difference between the numerical value of LFS for each X(H2) and the value provided by the polynomial fit. The figure shows a very good fitting of the numerical data for the entire range of H2 mole fractions. Moreover, Table 5 and Figure 11 show that R β 2 is always higher than R α 2 , thus suggesting that the second-degree polynomial fit is also an improved approximation in the range [0.0–0.6]. β1, like α, decreases as pressure and equivalence ratio increase, whereas β2 has the opposite trend, i.e., it increases as pressure and equivalence ratio increase. It is worth noting that β2, which represents the concavity of the second-degree polynomial, is negative for cases with pressure equal to 0.1 MPa and ϕ equal to 0.8 and 1.0. Moreover, Figure 11 shows that R β 2 has a maximum value of 1.0 MPa for all the three equivalence ratios under consideration.
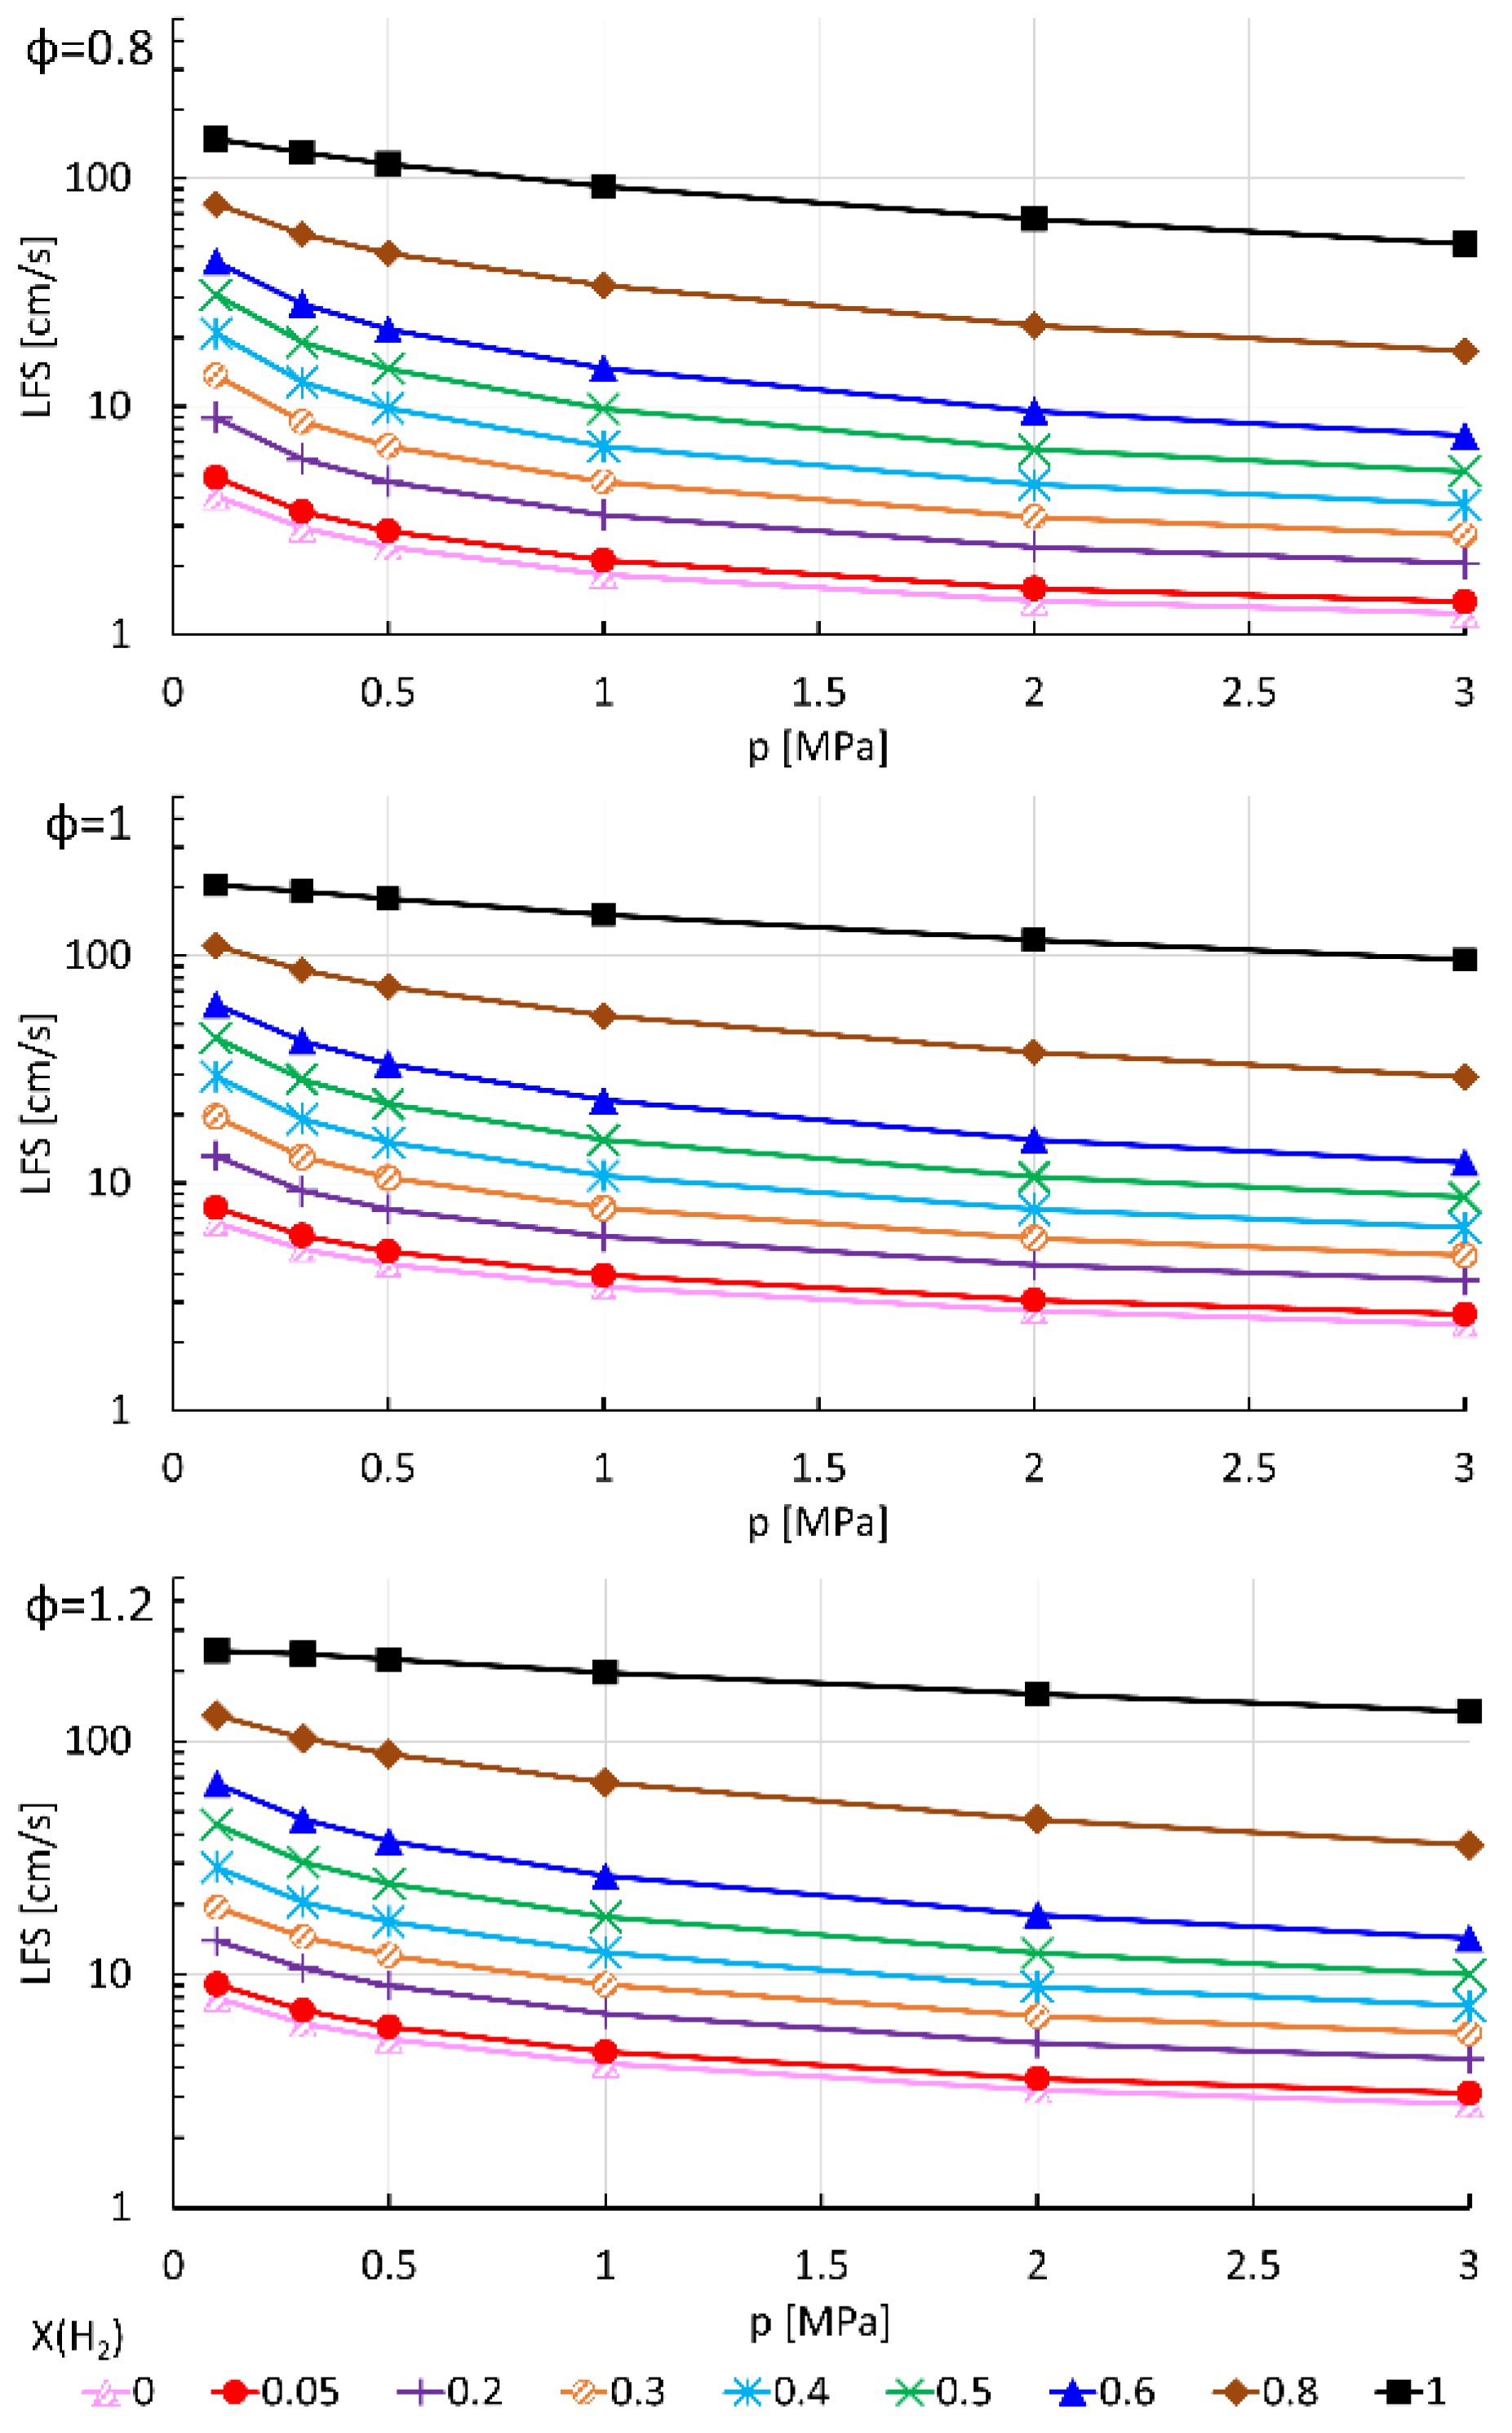
Figure 12 shows LFS as a function of pressure in a semi-logarithmic scale for different H2 mole fractions in the fuel mixture and different equivalence ratios using the M1 mechanism from Table 2 at T = 300 K. As expected, LFS decreases as pressure increases for all cases. The reduction is almost linear when pure hydrogen is used, while for the other cases, a more noticeable influence of pressure is observed especially with pressures lower than 0.5 MPa.
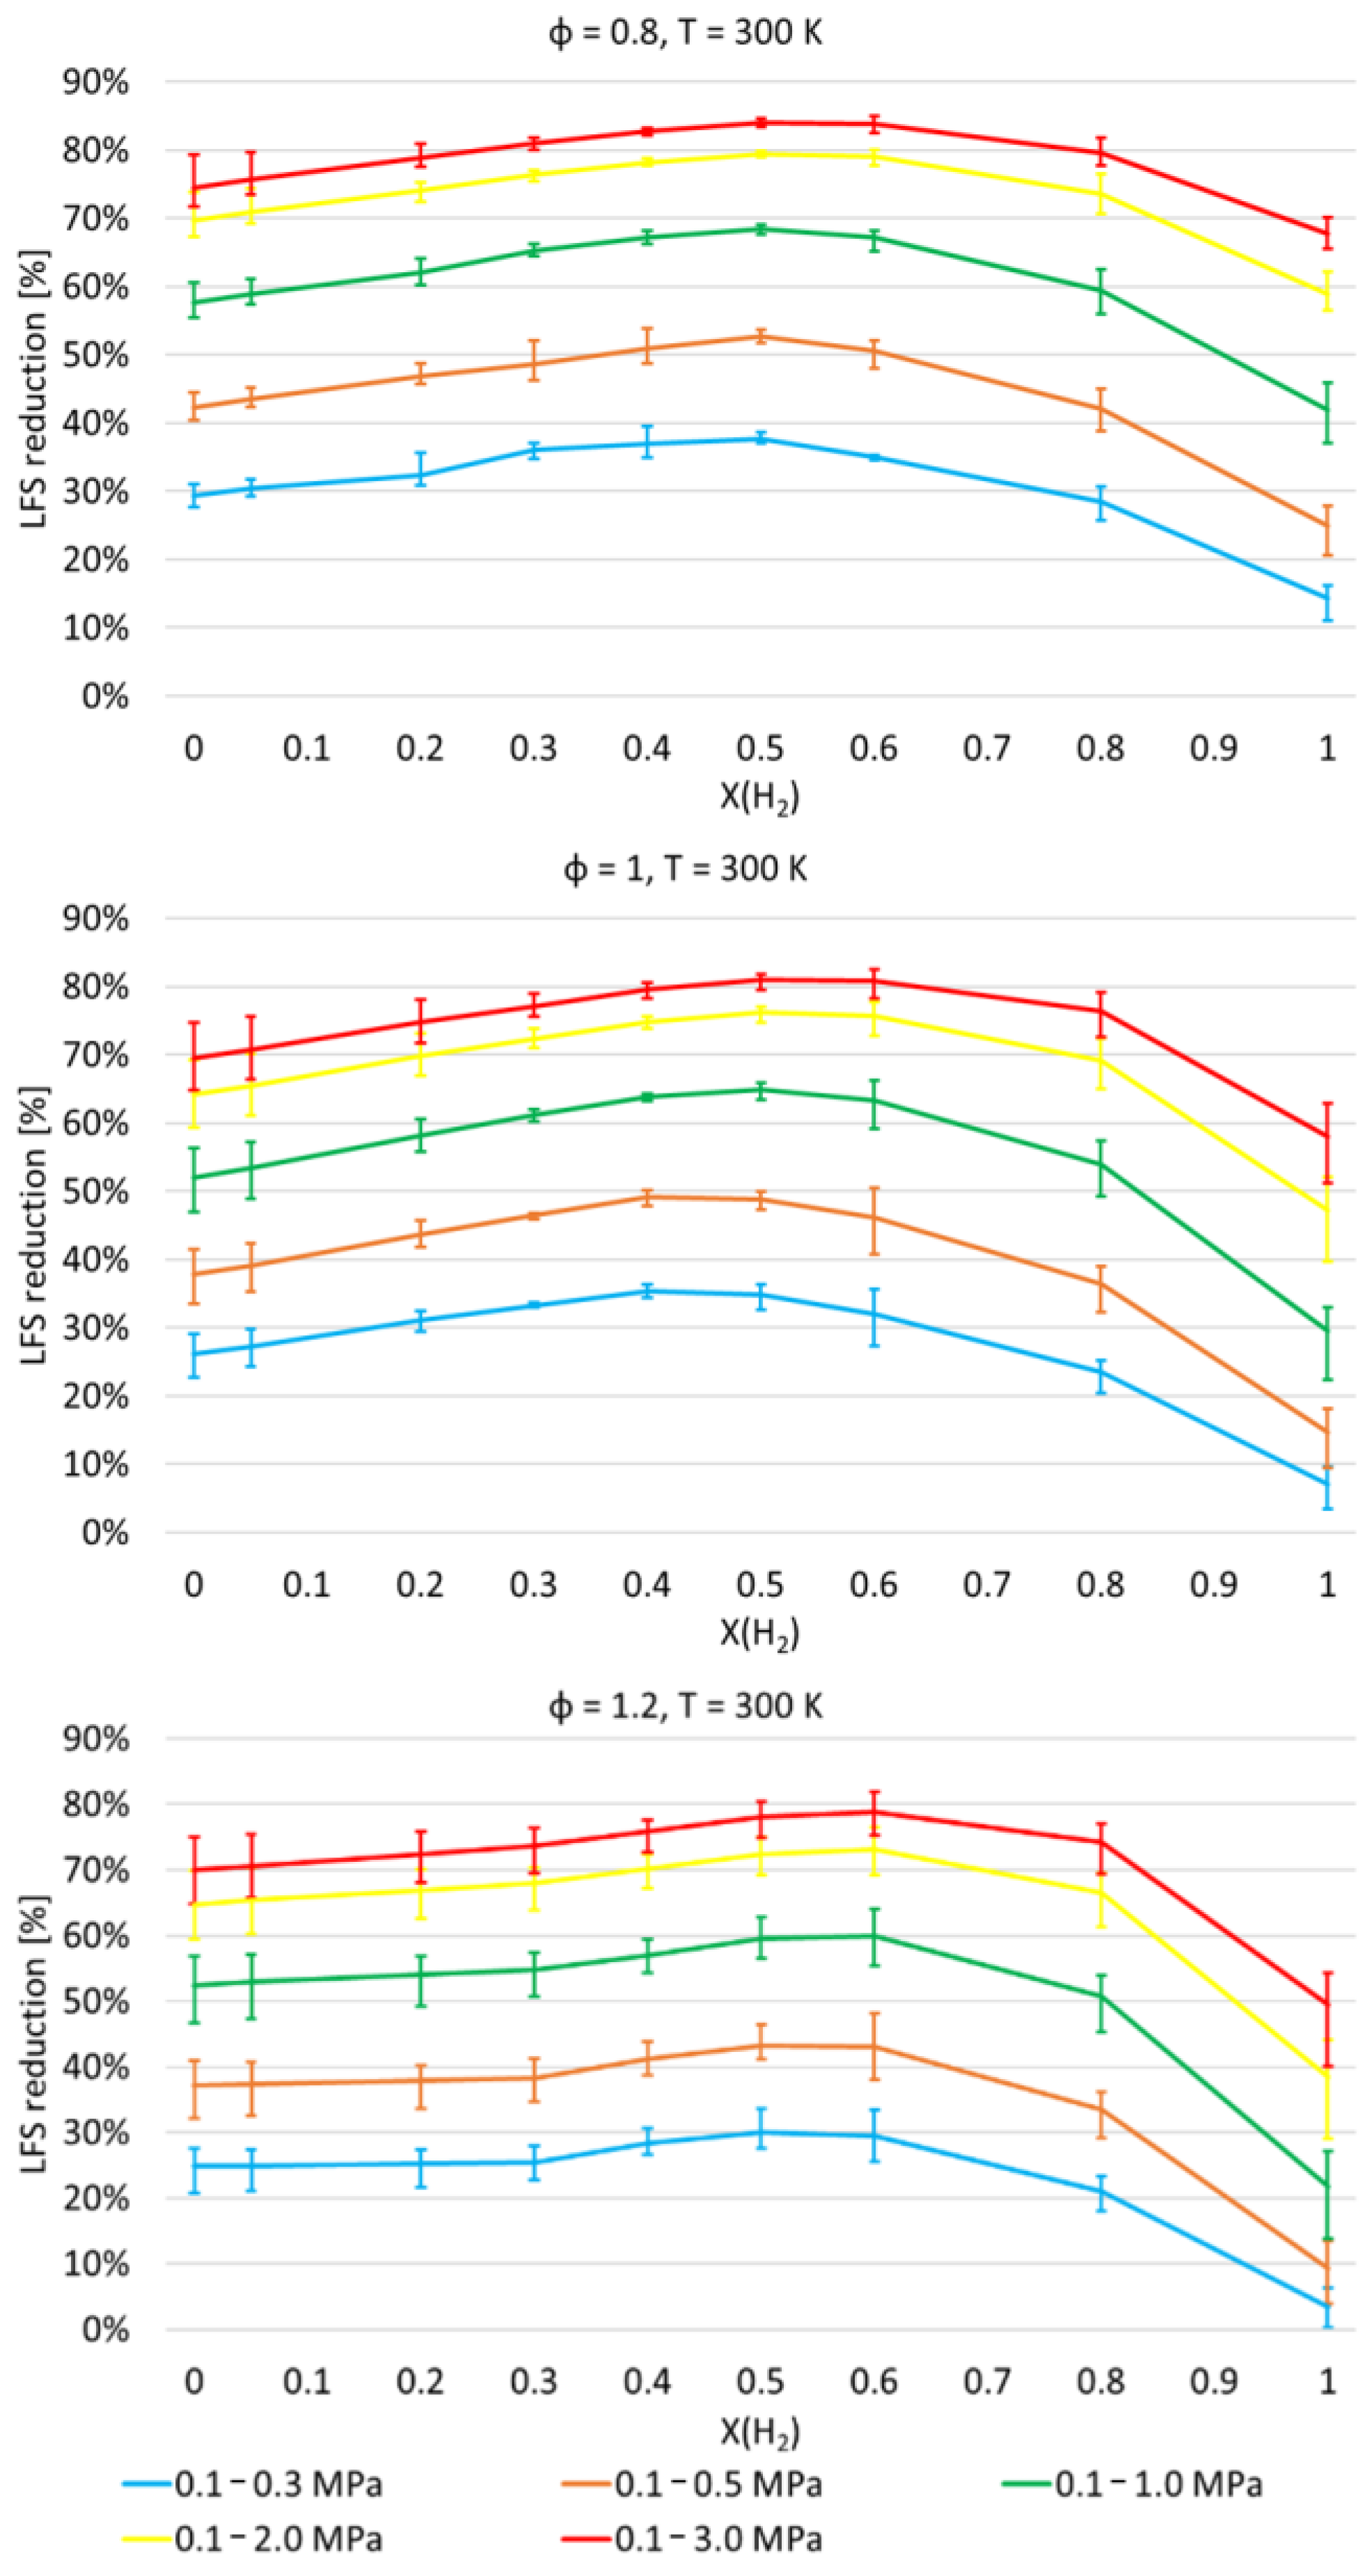
In order to assess the influence of pressure, Figure 13 shows the percentage reduction in LFS, with respect to the case at 0.1 MPa, as pressure increases for three equivalence ratios. As previously, the lines represent the mean reduction across the three mechanisms used for the computations, i.e., M1, M3 and M4, whereas the bars represent the range of variability between the maximum and the minimum reduction for each H2 molar fraction. The figure shows that the variability of the numerical results is generally lower for intermediate values of X(H2). This is less evident for ϕ = 1.2, but it still occurs, especially for higher pressures.
The figure shows that the largest LFS reduction is observed with X(H2) in the range [0.4–0.6], depending on the value of pressure and ϕ. For the highest H2 mole fractions, the LFS percentage reduction decreases and reaches the minimum for the combustion of pure hydrogen.
Furthermore, the influence of pressure on LFS is more pronounced at lower pressures. For instance, for ϕ = 0.8 and X(H2) = 0.0, by increasing pressure from 0.1 to 0.3 MPa and from 0.1 to 1.0 MPa, LFS decreases by about a factor of two, i.e., 30% and 58%, respectively. For the same case, at 2.0 MPa and 3.0 MPa, the LFS percentage reduction is about 70% and 75% compared to LFS under atmospheric conditions.
Finally, stoichiometric mixtures of NH3/H2 with X(H2) up to 0.8 with temperature equal to 800 K and pressure varying from 0.5 to 8.0 MPa, which represent engine-like thermodynamic conditions, have been investigated. For the sake of conciseness, the simulations have been performed using only the mechanism by Zhang et al. [9]. The results are shown in Figure 14, where numerical data are given by symbols, whereas the correlations are plotted by using a solid line for the first-degree polynomial and a dashed line for the second-degree polynomial. The first-degree polynomial has been calculated for 0.0 ≤ X(H2) ≤ 0.6, whereas the second-degree polynomial has been extended to the entire range of the hydrogen molar fraction.
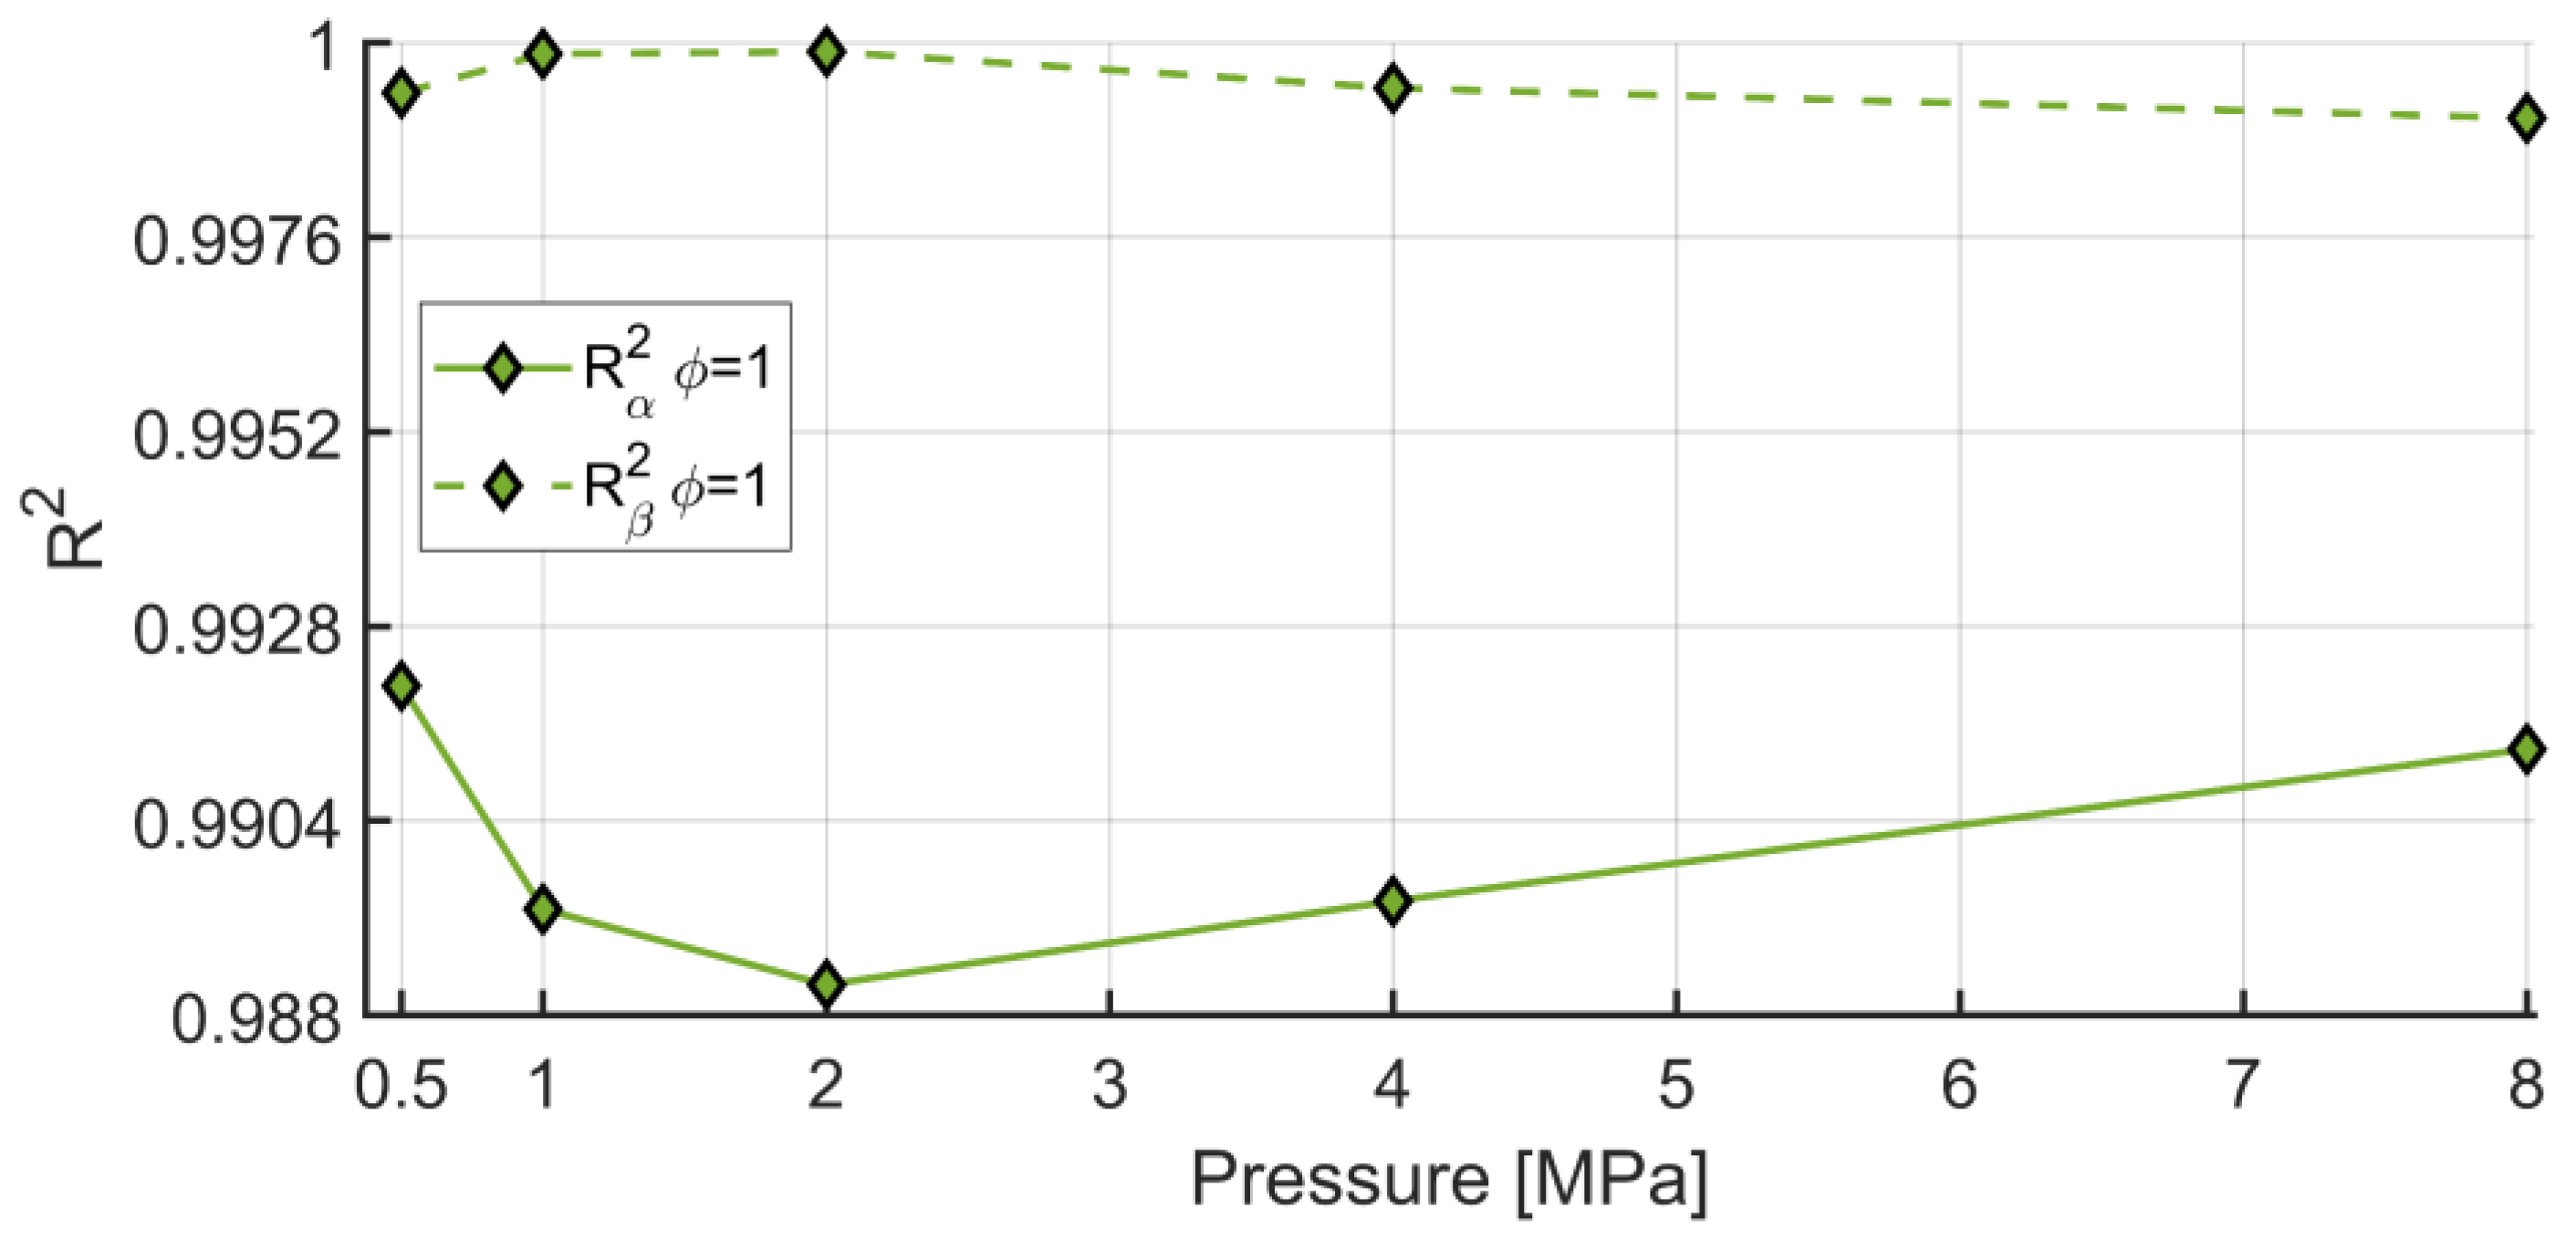
Table 6 summarizes the correlation coefficients, as well as the coefficients of determination of such fittings. The table shows that R α 2 is less than that obtained with temperature equal to 300 K, indicating that the first-degree approximation is even less accurate as temperature increases. On the other hand, the coefficient of determination obtained with the second-degree polynomial is always higher than 0.999, thus suggesting that the proposed fitting model is adequate and very accurate. Both correlation coefficients α and β1 show a monotonic decrease with increasing pressure, as already seen at T = 300 K, whereas β2 increases up to 2.0 MPa and then decreases. By comparing α and β1 with those computed at lower temperature for the same pressure, it is noticeable that both coefficients decrease as temperature increases. In Figure 15, the determination coefficients as a function of pressure are given. The figure shows that R α 2 and R β 2 have opposite trends, with a minimum and a maximum value, respectively, at 2.0 MPa.
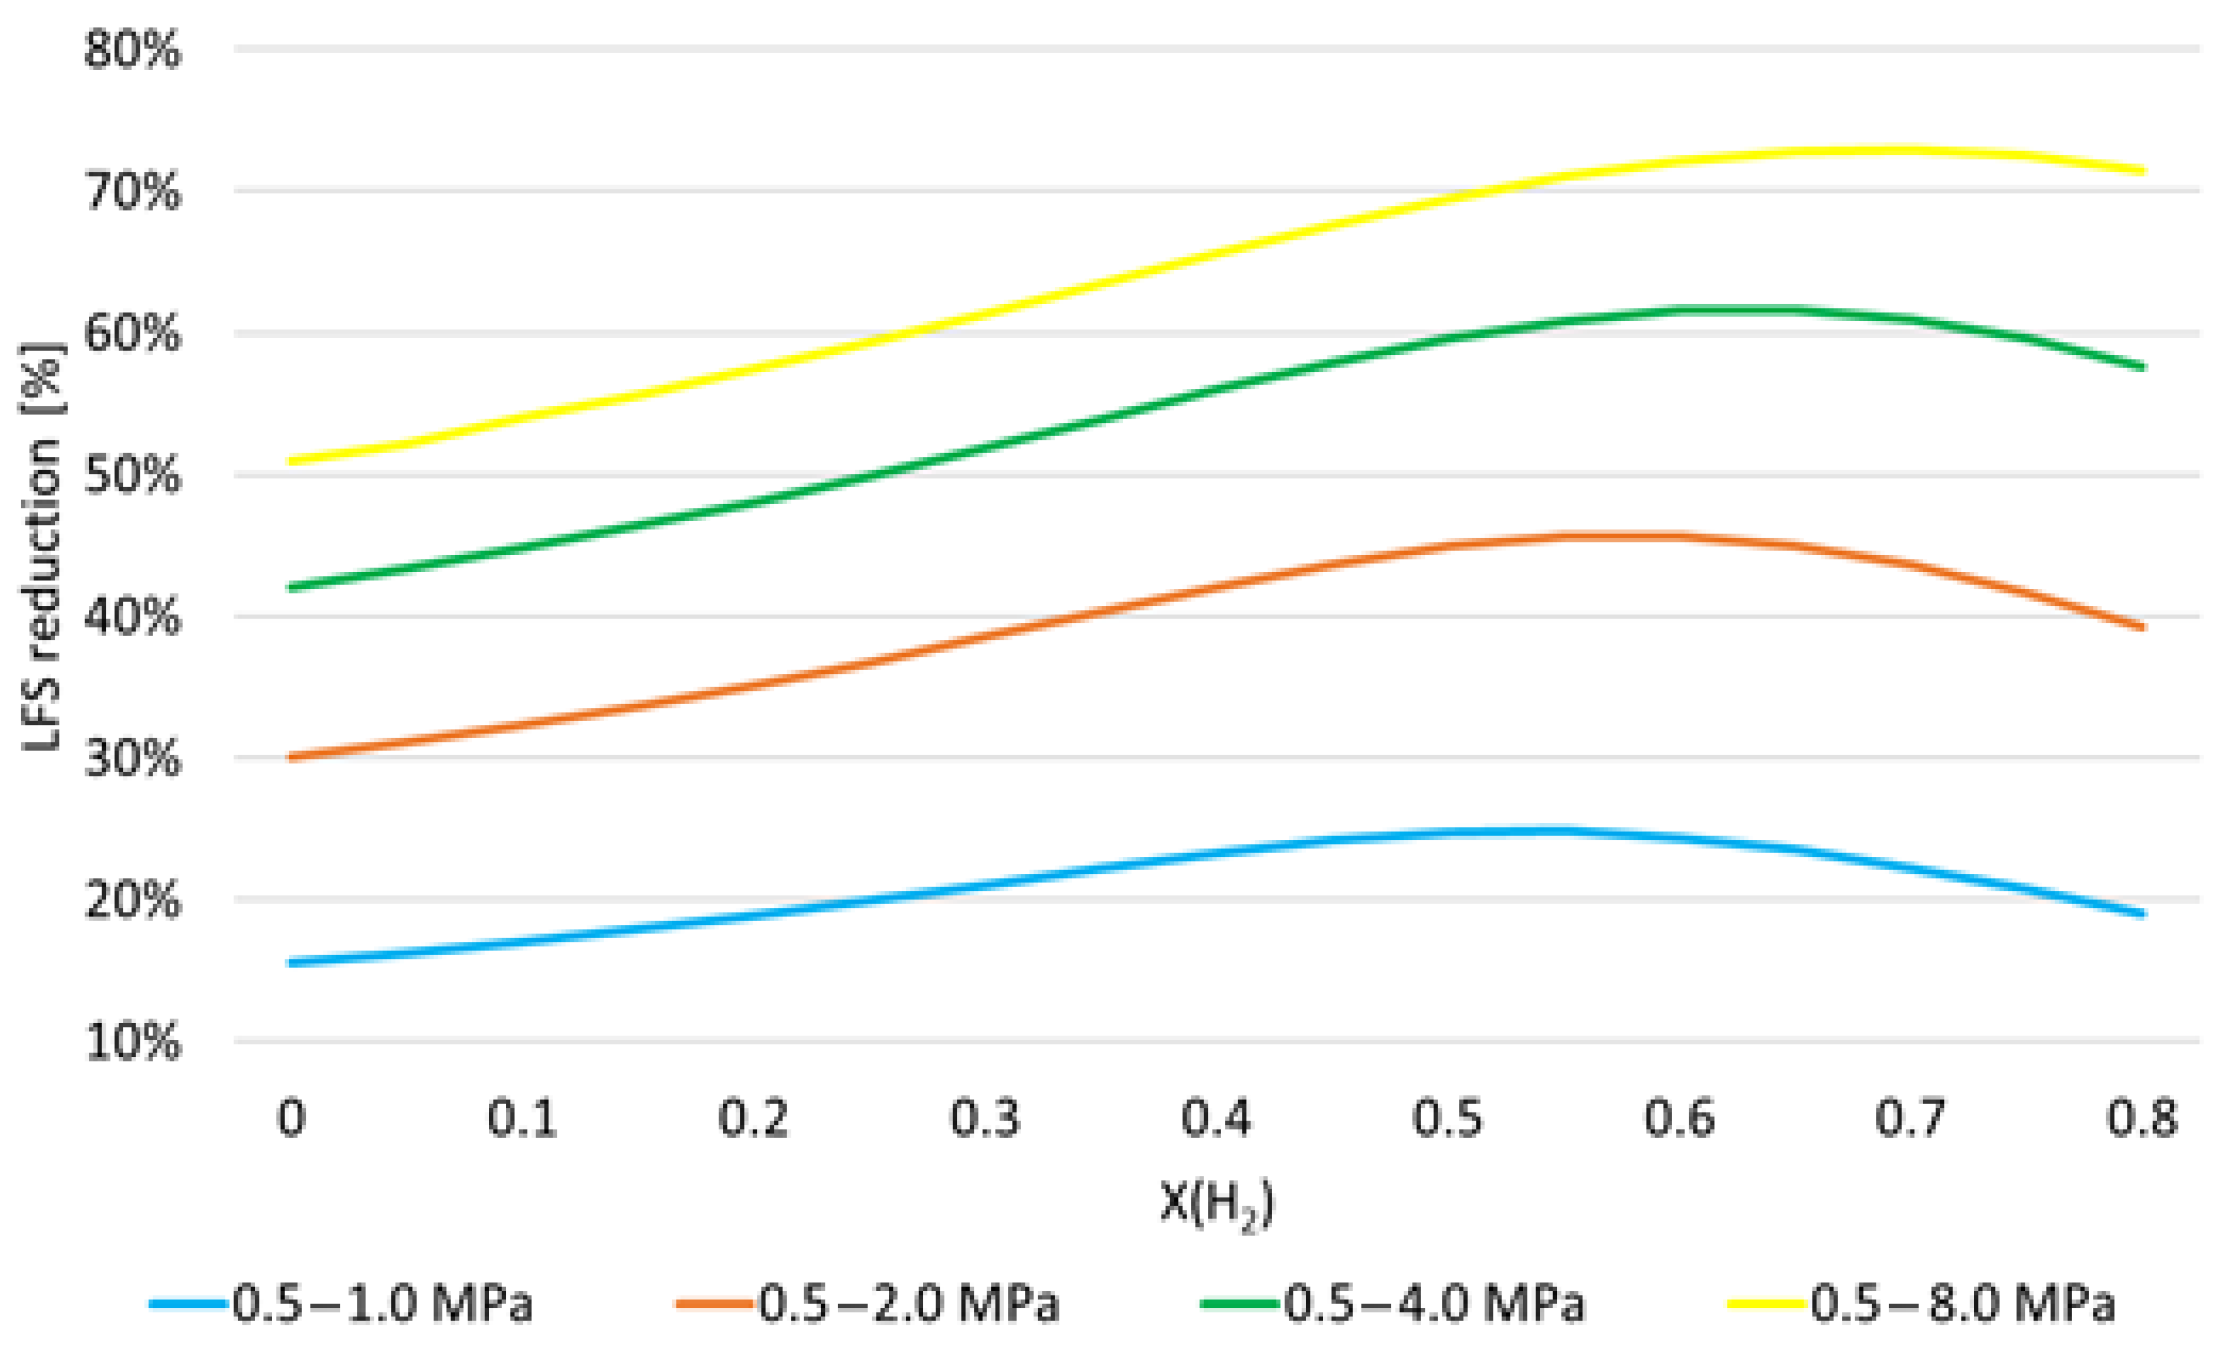
Figure 16 shows the percentage reduction in LFS with increasing pressure from 0.5 to 1.0, 2.0, 4.0 and 8.0 MPa, as a function of H2 mole fraction for the stoichiometric fuel mixture at 800 K. Only the mechanism by Zhang et al. [9] has been used; therefore, bars are not provided. For all pressure increments, the trends are similar: LFS reduction initially increases as H2 mole fraction increases, reaches a maximum, and then decreases. As pressure increases from 0.5 to 1.0 MPa, LFS decreases by 15% with pure ammonia and reaches a maximum decrease of about 25% where X(H2) is about 0.55. As pressure increases from 0.5 to 2.0 MPa, LFS reduction is about 30% with pure ammonia, whereas the maximum reduction is about 45% where X(H2) is approximately 0.6. A further increase in pressure leads to a further reduction in LFS, up to about 50% for pure ammonia when pressure increases from 0.5 to 8.0 MPa, whereas the maximum shifts towards higher values of H2 mole fraction, reaching a value of about 73%. Therefore, the more the pressure increases, the less it influences the LFS.
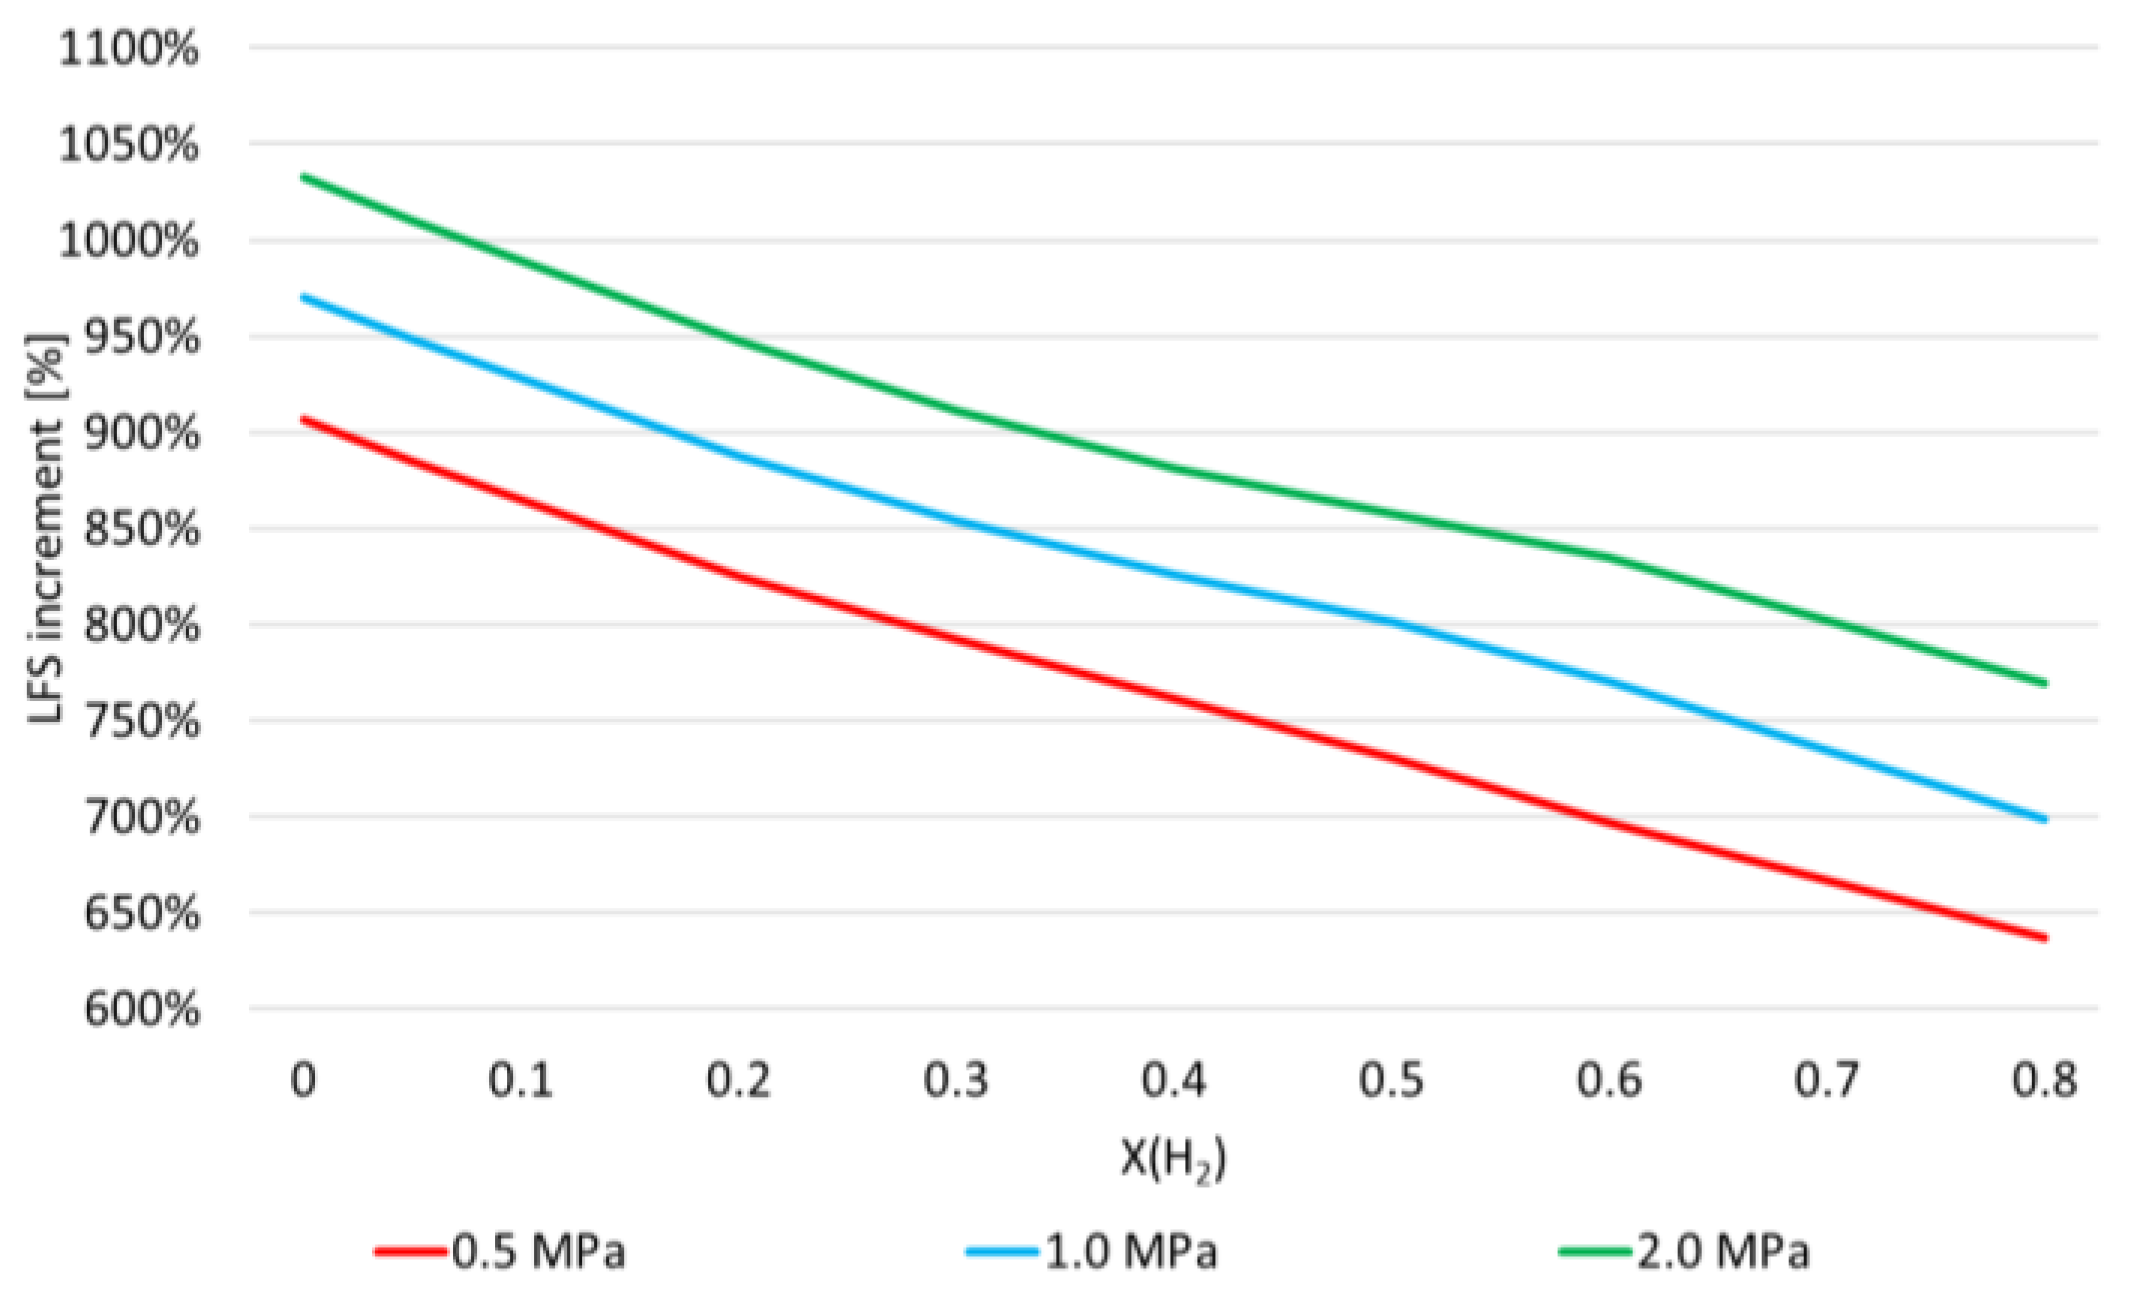
Finally, the influence of temperature on LFS has been analyzed by comparing the numerical results at 300 and 800 K. As expected, LFS increases with temperature for all pressures and mixture compositions. Figure 17 shows the percentage increment of LFS as temperature increases from 300 to 800 K as a function of H2 mole fraction in the fuel mixture for three different pressures, namely 0.5, 1.0 and 2.0 MPa, for ϕ = 1. The figure shows that the influence of temperature on LFS is higher for pure ammonia, and it reduces almost linearly as H2 mole fraction increases. Furthermore, the increase in LFS with temperature is higher as pressure increases. As an example, for the case of pure ammonia at 2.0 MPa, the LFS at 800 K is 10.3 times the LFS at 300 K, whereas for the mixture with 80% by mole of H2 at 0.5 MPa the LFS at 800 K is 6.4 times that at 300 K.

3.3. Structure of the NH3/H2 Flame

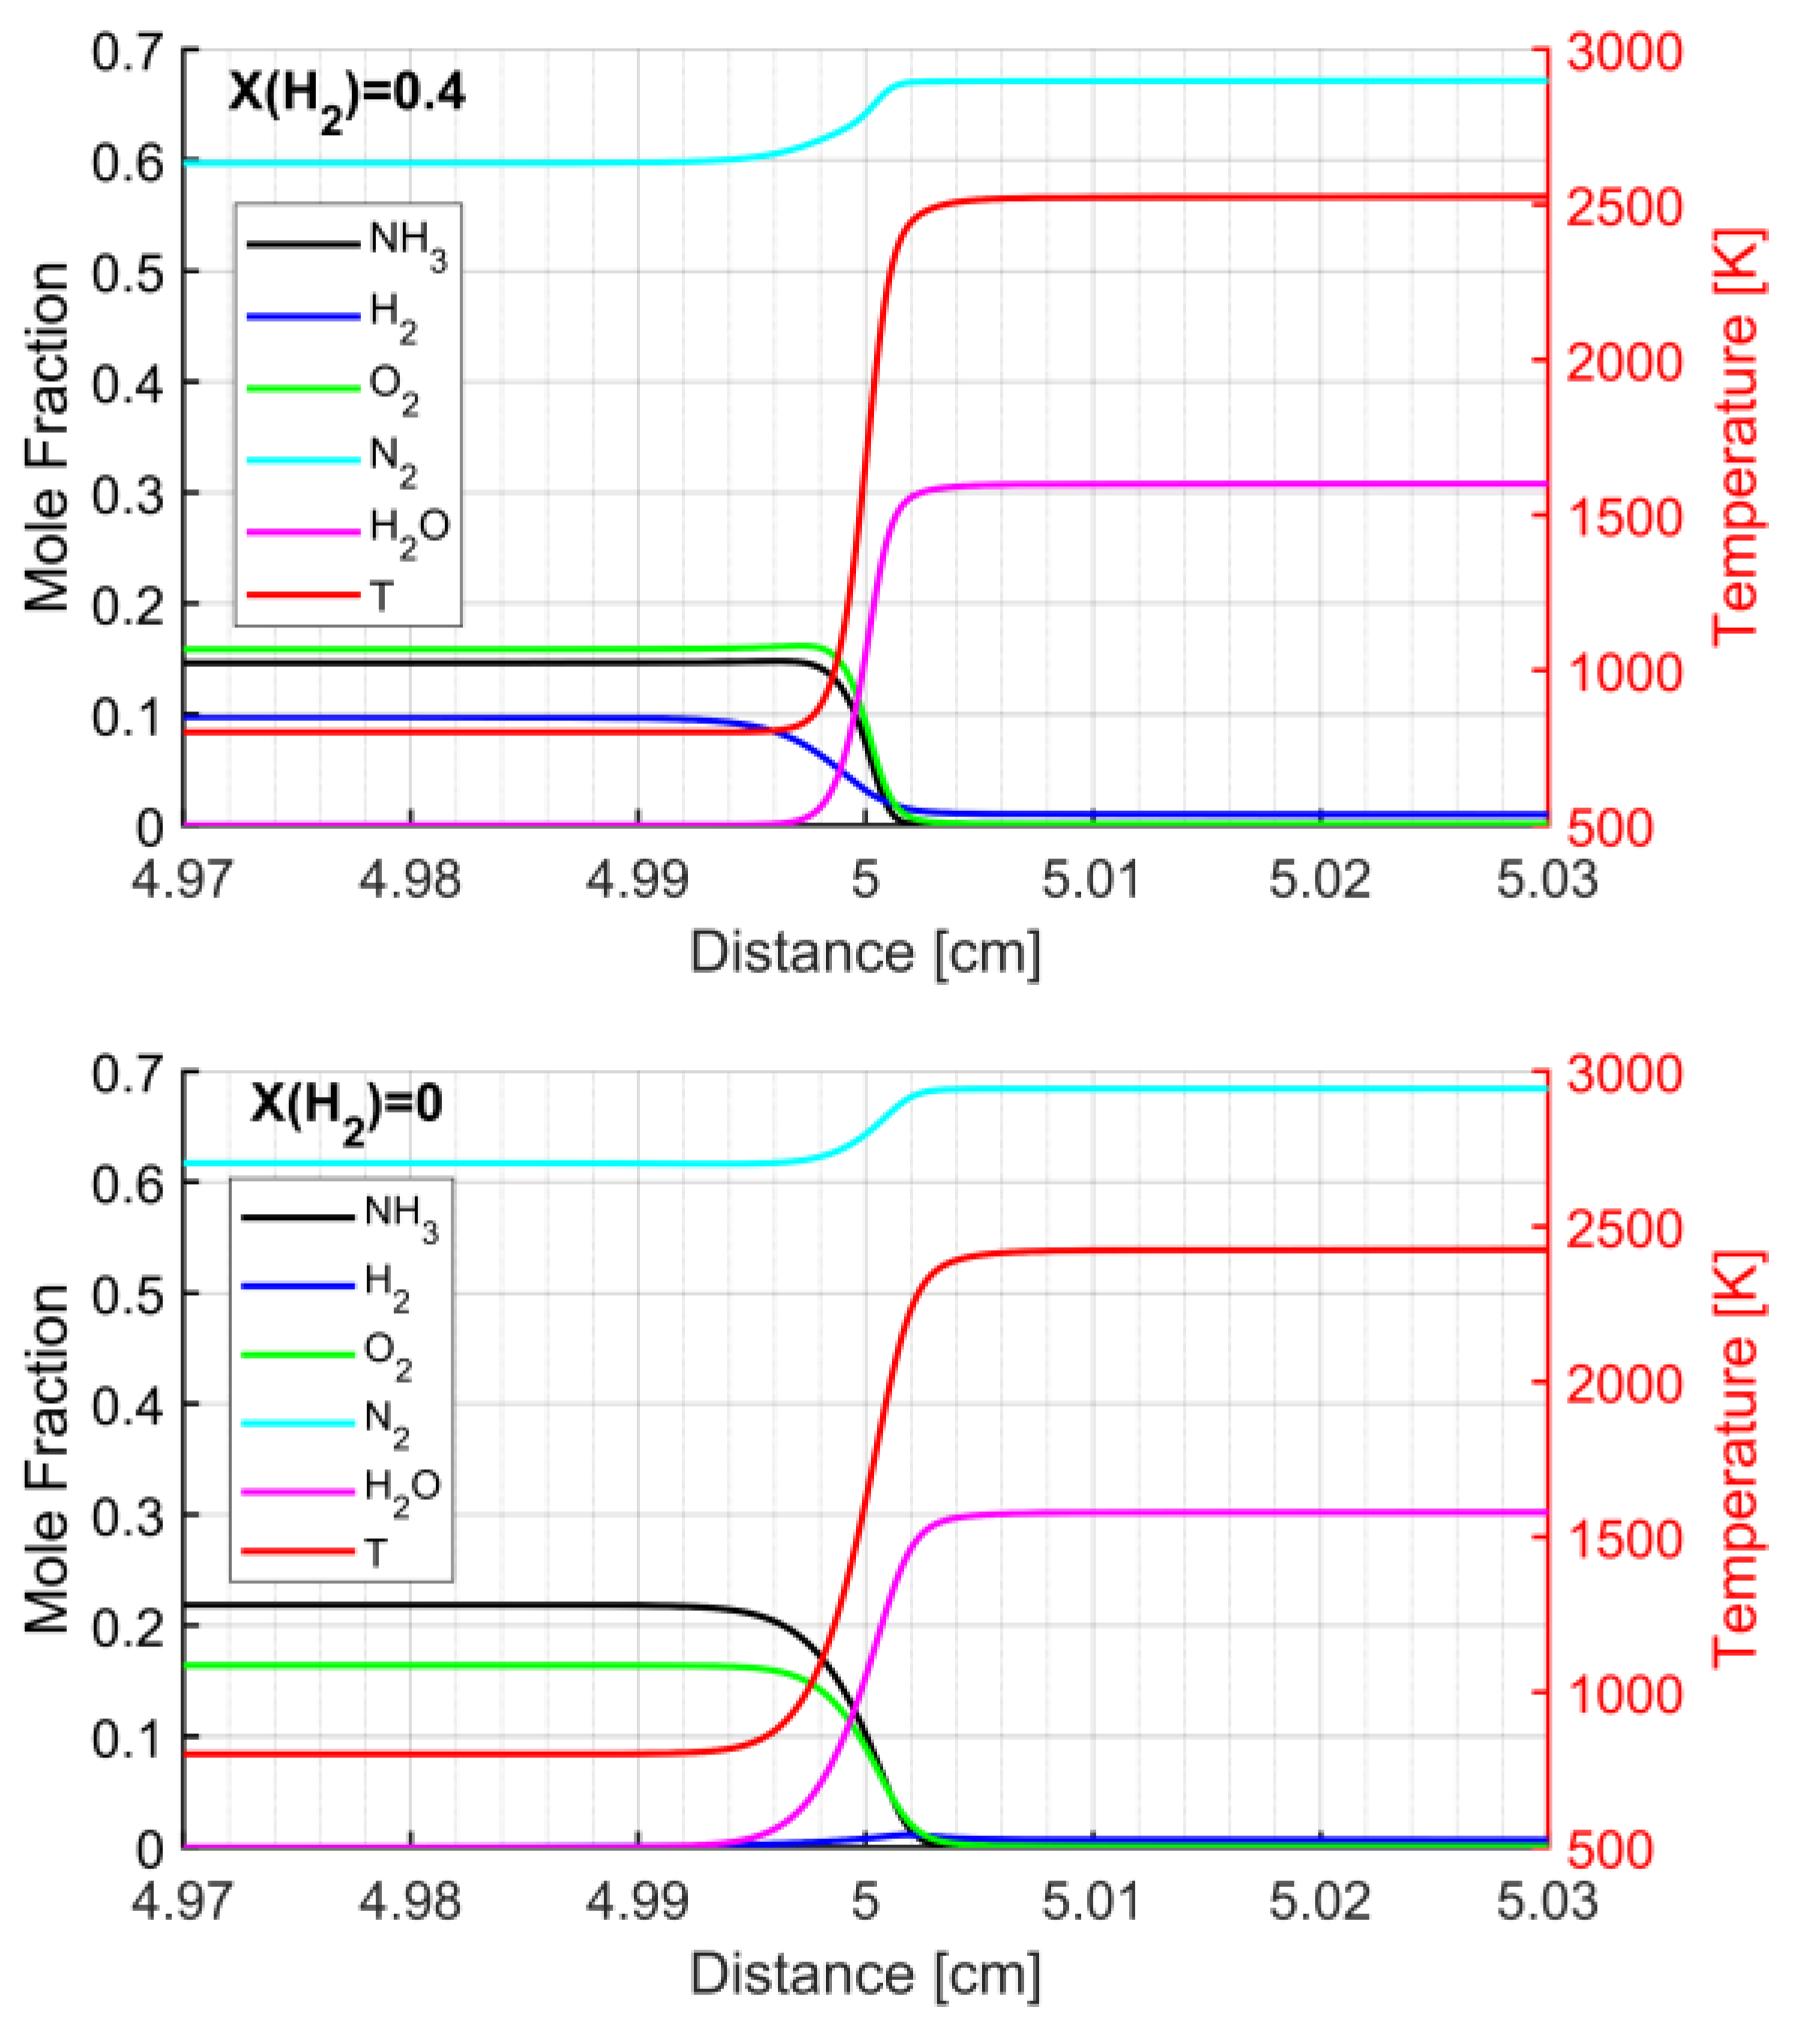
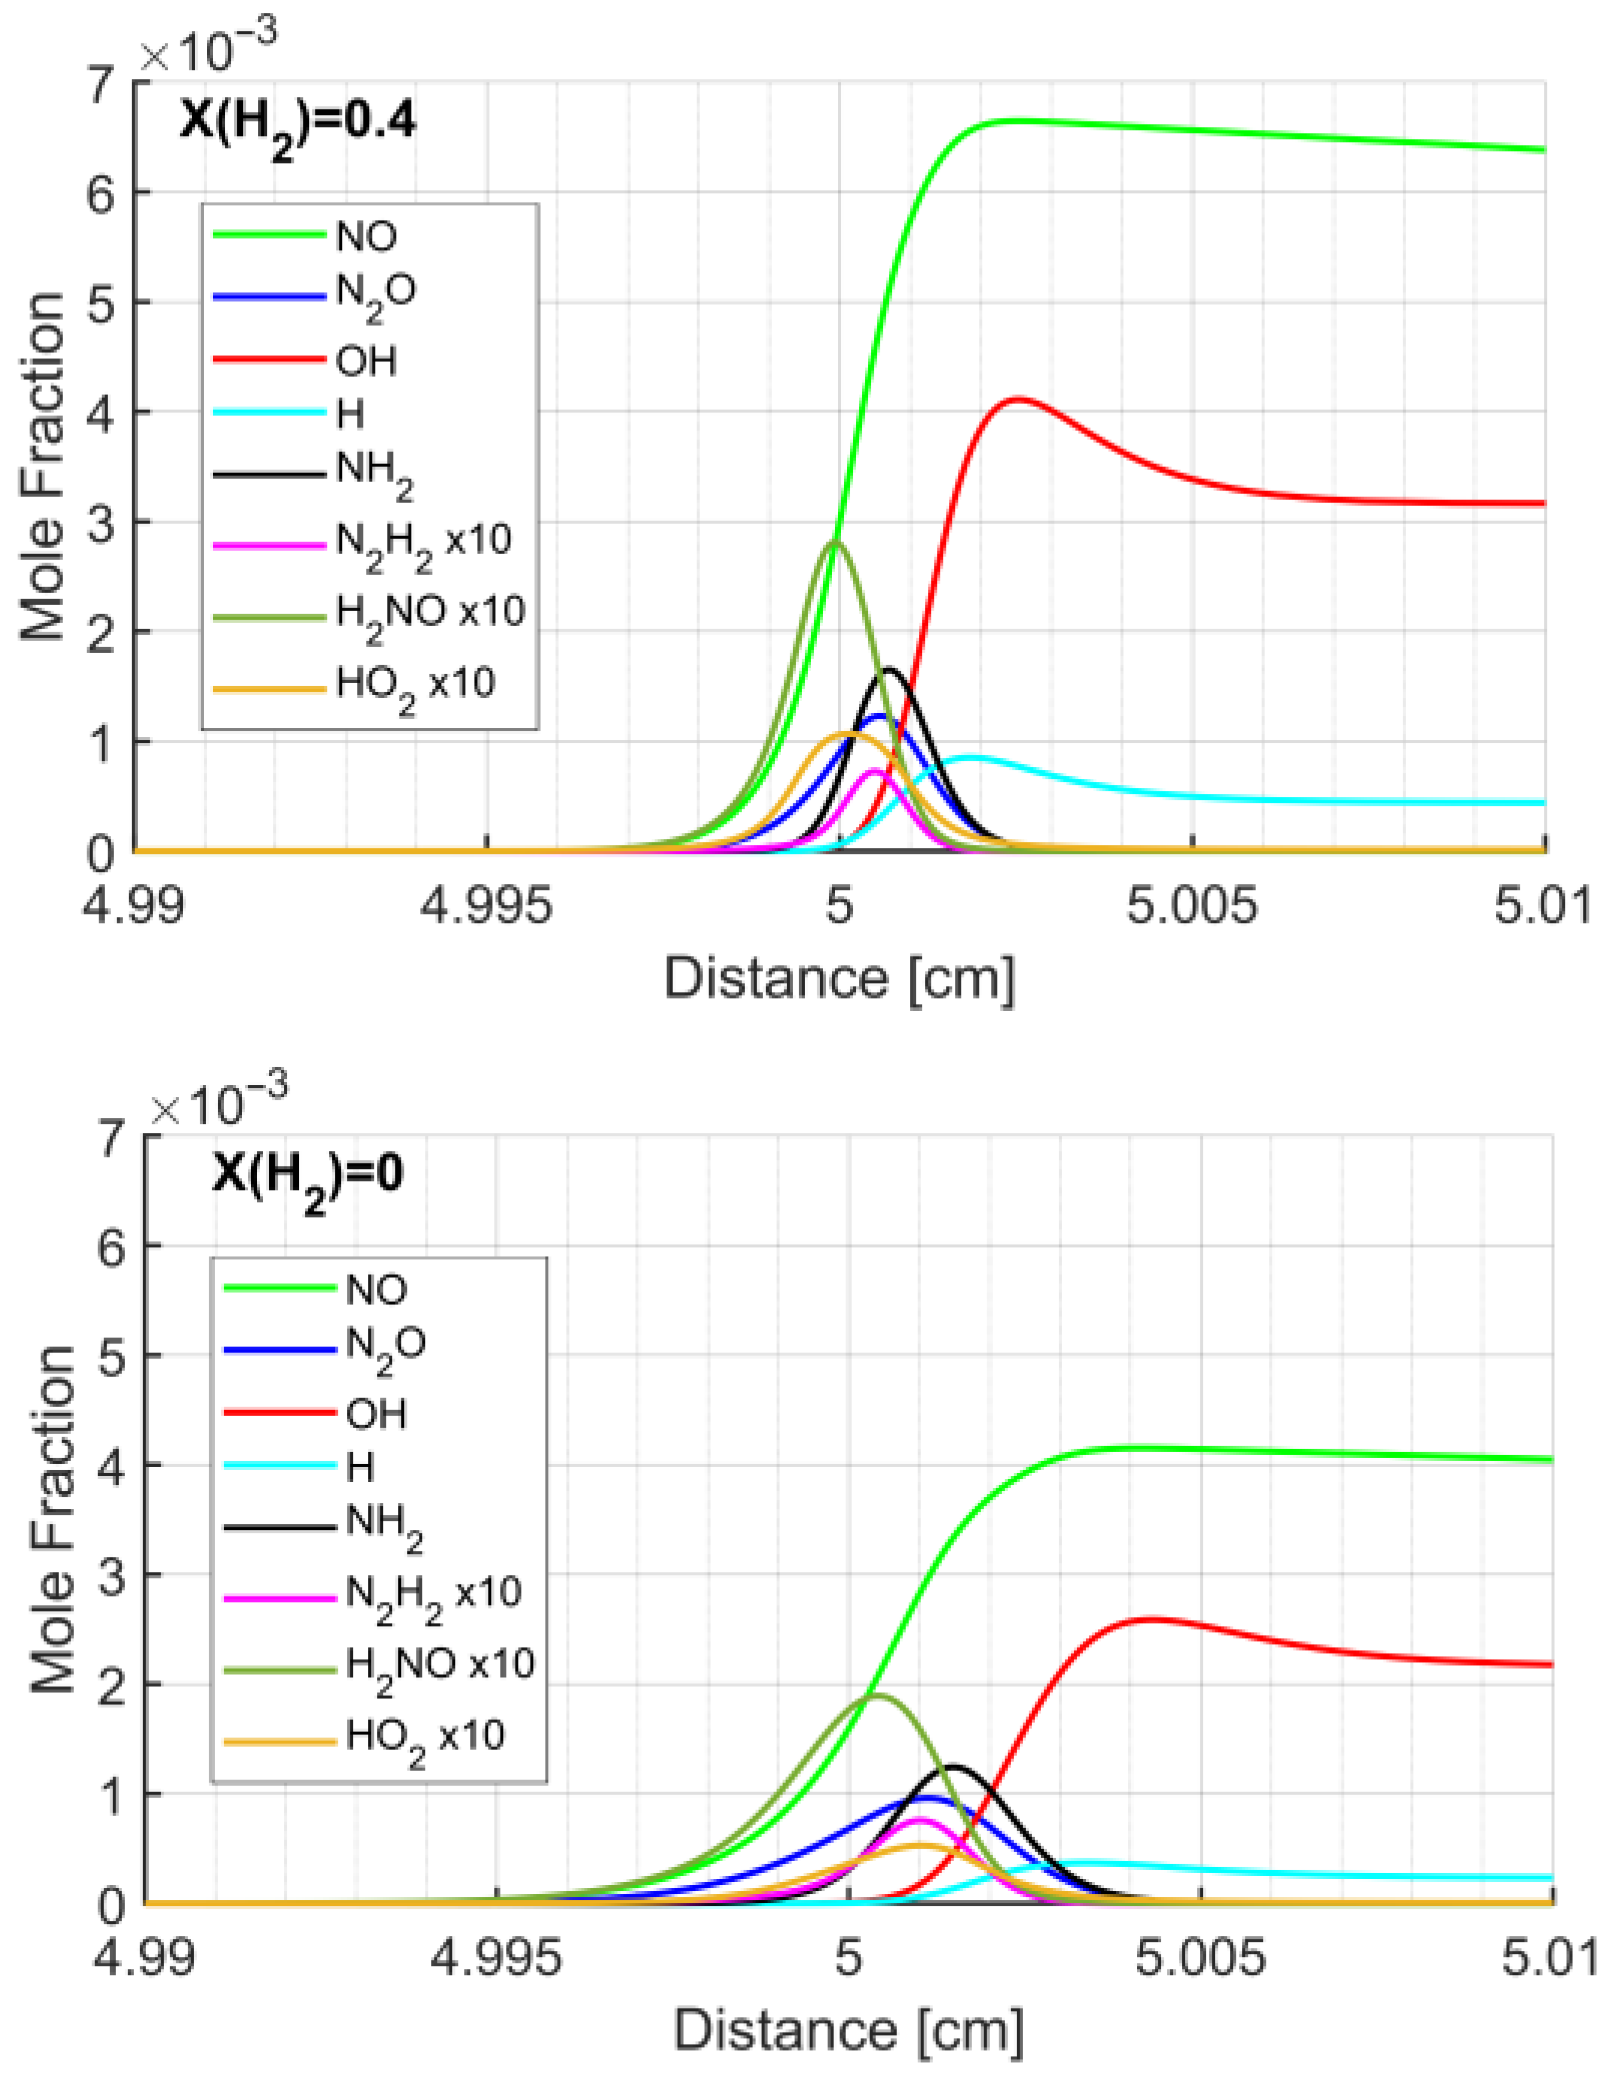
The steady laminar flame structure of stoichiometric NH3/H2 mixtures has been analyzed at 800 K and 4.0 MPa. These thermodynamic conditions are mostly encountered at spark timing of SI engines. Two cases with and without hydrogen addition have been compared, i.e., X(H2) = 0.4 and X(H2) = 0.0. The kinetic mechanism of Zhang et al. [9] has been used for the simulations. Figure 18 shows the temperature, reactants and major products profiles for the two cases.
The figure shows that the burnt gas temperature with hydrogen addition is above 2500 K, whereas a lower burnt gas temperature occurs for the pure ammonia case. The flame thickness ,   δ t h , has been evaluated by using the following relation:
δ t h = T b T u               d T d x m a x   ,
where T b and T u are the burnt and unburned gas temperatures, respectively. The flame thickness is 21 μ m and 42 μ m for the cases with and without hydrogen, respectively. It means that, with 40% by mole of H2 in the fuel blend, the thickness is halved compared to the case of pure ammonia.
Figure 19 shows the major intermediate species profiles of N H 3 / H 2 / Air flames for the cases with and without hydrogen addition. When hydrogen is added to the fuel blend, intermediate species are produced and depleted faster than those of the case of pure ammonia, and higher peak molar fractions occur.
The main oxidation reaction of ammonia is NH 3 + OH = N H 2 + H 2 O , which produces NH 2 , which in turn is oxidized mainly by OH through the reaction NH 2 + OH = NH + H 2 O , as well as by H and O radicals. However, in the pre-heating zone, at low and medium temperatures, NH 2 is quickly converted to H 2 NO through the reaction N H 2 + H O 2 = H 2 NO + OH . Indeed, as shown in Figure 19 for both cases with and without hydrogen, in the pre-heating zone, H 2 NO mole fraction is higher than that of the other chemical species. After the peak, H 2 NO decomposes into lighter molecules such as NO, OH and H. On the other hand, at high temperature NH 2 is also depleted through the reaction N H 2 + O = HNO + H , which produces HNO, which reacts with O, OH and O2 to produce NO. NO is also produced by the reaction N 2 + O = N + NO . As shown in Figure 18, hydrogen addition in the fuel mixture reduces the amount of ammonia, so NO consumption through the reactions with NH and NH 2 is reduced, leading to higher NO concentrations in the burnt gases, as shown in Figure 19.
Furthermore, the presence of hydrogen increases the amount of H radicals through the reactions H 2 + O = OH + H and H 2 + OH = H + H 2 O , and, as a result, O radicals produced by H + O 2 = O + OH also increase. Thus, higher HO2 concentrations occur in the pre-heating zone. Finally, both the role of H radicals in the conversion of ammonia to NH2 and NH and the role of O radicals in the conversion of NH2 and NH to HNO, NO and N2O increase, as shown in Figure 19, making the mixture more reactive and resulting in a higher laminar flame speed, as shown in Section 3.2.

4. Conclusions

Numerical simulations have been carried out to analyze the speed and structure of laminar flames of NH3/H2 mixtures under conditions that have not yet been experimentally investigated. To this end, one-dimensional simulations have been performed by using three kinetic reaction mechanisms. These mechanisms have been selected based on the best agreement with available experimental data of NH3/H2 mixtures at 300 K and pressure up to 0.5 MPa, and at 0.1 MPa and temperature up to 473 K. Although the results of this numerical study need to be definitely compared with more experiments under engine-like thermochemical conditions, the outcome of this work provides insights for further studies on NH3/H2 flames. The main findings can be summarized as follows:
  • LFS exponentially increases with H2 mole fraction, at 300 K and 800 K and for all pressures and equivalence ratios considered in this work;
  • In a semi-logarithmic scale, a second-degree polynomial regression accurately predicts the numerical results, with R β 2 varying in the range of 0.99748–0.99997. However, even a linear regression provides a good accuracy with H2 mole fractions in the range of 0.0–0.6, and such a regression may be employed for less time-consuming computations. Both regressions may be used for further studies, specifically for CFD simulations of engines fueled with synthetic fuels;
  • α values show that the enhancement of LFS as the H2 mole fraction increases in the range of 0.0–0.6 is lower as pressure and temperature increase, and as ϕ increases from 0.8 to 1.2;
  • As expected, LFS decreases as pressure increases. However, the more pressure increases, the less it influences the LFS. Furthermore, the increase in LFS with temperature is higher as pressure increases and H2 mole fraction decreases;
  • Under thermodynamic engine-relevant conditions, i.e., 800 K and 4.0 MPa, the flame thickness for a stoichiometric mixture of N H 3 / H 2 / Air with 40% by mole of H2 in the fuel blend is halved compared to the case of pure ammonia;
  • The analysis of the flame structure shows the kinetics that leads to LFS enhancement by H2: the presence of hydrogen in the fuel mixture enhances the formation of radicals, such as H, O and OH, thus increasing the reactivity of the mixture and, subsequently, the laminar flame speed.

Author Contributions

Conceptualization, V.M. and A.V.; methodology, F.B., M.D., V.M. and A.V.; software, F.B. and M.D.; validation, F.B., M.D., V.M. and A.V.; formal analysis, F.B. and M.D.; investigation, F.B., M.D., V.M. and A.V.; resources, V.M. and A.V.; data curation, F.B. and M.D.; writing—original draft preparation, F.B. and M.D.; writing—review and editing, V.M. and A.V.; visualization, F.B. and M.D.; supervision, V.M. and A.V.; project administration, A.V. All authors have read and agreed to the published version of the manuscript.

Funding

This research received no external funding. The APC was waived.

Data Availability Statement

The original contributions presented in the study are included in the article, further inquiries can be directed to the corresponding author/s.

Conflicts of Interest

The authors declare no conflicts of interest.

References

  1. Incer-Valverde, J.; Korayem, A.; Tsatsaronis, G.; Morosuk, T. Colors of hydrogen: Definitions and carbon intensity. Energy Convers. Manag. 2023, 291, 117294. [Google Scholar] [CrossRef]
  2. Shinde, B.J.; Karunamurthy, K. Recent progress in hydrogen fuelled internal combustion engine (H2ICE)—A comprehensive outlook. Mater. Today Proc. 2022, 51, 1568–1579. [Google Scholar] [CrossRef]
  3. Lemmon, E.W.; Bell, I.H.; Huber, M.L.; McLinden, M.O. Thermophysical Properties of Fluid Systems, NIST Chemistry WebBook, NIST Standard Reference Database Number 69; Linstrom, P.J., Mallard, W.G., Eds.; National Institute of Standards and Technology: Gaithersburg, MD, USA, 2023. [Google Scholar] [CrossRef]
  4. Ichikawa, A.; Kitagawa, Y.; Hayakawa, A.; Somarathne, K.D.K.A.; Kudo, T.; Kobayashi, H. Laminar burning velocity and Markstein length of ammonia/hydrogen/air premixed flames at elevated pressures. Int. J. Hydrogen Energy 2015, 40, 9570–9578. [Google Scholar] [CrossRef]
  5. Han, X.; Wang, Z.; Costa, M.; Sun, Z.; He, Y.; Cen, K. Experimental and kinetic modeling study of laminar burning velocities of NH3/air, NH3/H2/air, NH3/CO/air and NH3/CH4/air premixed flames. Comb. Flame 2019, 206, 214–226. [Google Scholar] [CrossRef]
  6. Li, R.; Konnov, A.A.; He, G.; Qin, F.; Zhang, D. Chemical mechanism development and reduction for combustion of NH3/H2/CH4 mixtures. Fuel 2019, 257, 116059. [Google Scholar] [CrossRef]
  7. Pessina, V.; Berni, F.; Fontanesi, S.; Stagni, A.; Mehl, M. Laminar flame speed correlations of ammonia/hydrogen mixtures at high pressure and temperature for combustion modeling applications. Int. J. Hydrogen Energy 2022, 47, 25780–25794. [Google Scholar] [CrossRef]
  8. Shrestha, K.P.; Lhuillier, C.; Barbosa, A.A.; Brequigny, P.; Contino, F.; Mounaïm-Rousselle, C.; Seidel, L.; Mauss, F. An experimental and modeling study of ammonia with enriched oxygen content and ammonia/hydrogen laminar flame speed at elevated pressure and temperature. Proc. Combust. Inst. 2021, 38, 2163–2174. [Google Scholar] [CrossRef]
  9. Zhang, X.; Moosakutty, S.P.; Rajan, R.P.; Younes, M.; Sarathy, S.M. Combustion chemistry of ammonia/hydrogen mixtures: Jet-stirred reactor measurements and comprehensive kinetic modeling. Comb. Flame 2021, 234, 111653. [Google Scholar] [CrossRef]
  10. Otomo, J.; Koshi, M.; Mitsumori, T.; Iwasaki, H.; Yamada, K. Chemical kinetic modeling of ammonia oxidation with improved reaction mechanism for ammonia/air and ammonia/hydrogen/air combustion. Int. J. Hydrogen Energy 2018, 43, 3004–3014. [Google Scholar] [CrossRef]
  11. Gotama, G.J.; Hayakawa, A.; Okafor, E.C.; Kanoshima, R.; Hayashi, M.; Kudo, T.; Kobayashi, H. Measurement of the laminar burning velocity and kinetics study of the importance of the hydrogen recovery mechanism of ammonia/hydrogen/air premixed flames. Comb. Flame 2022, 236, 111753. [Google Scholar] [CrossRef]
  12. Stagni, A.; Cavallotti, C. H-abstractions by O2, NO2, NH2, and HO2 from H2NO: Theoretical study and implications for ammonia low-temperature kinetics. Proc. Combust. Inst. 2023, 39, 633–641. [Google Scholar] [CrossRef]
  13. Singh, A.S.; Dash, S.K.; Reddy, V.M. Chemical kinetic analysis on influence of hydrogen enrichment on the combustion characteristics of ammonia air using newly proposed reaction model. Int. J. Engine Res. 2022, 46, 6144–6163. [Google Scholar] [CrossRef]
  14. Ansys® Academic Research Chemkin-Pro, Release 20.2. Available online: https://www.ansys.com/products/fluids/ansys-chemkin-pro (accessed on 13 November 2020).
  15. Dixon-Lewis, G. Flame structure and flame reaction kinetics II. Transport phenomena in multicomponent systems. Proc. R. Soc. Lond. Ser. A. Math. Phys. Sci. 1968, 307, 111–135. [Google Scholar] [CrossRef]
  16. Curtiss, C.F.; Hirschfelder, J.O. Transport properties of multicomponent gas mixtures. J. Chem. Phys. 1949, 17, 550–555. [Google Scholar] [CrossRef]
  17. Smallbone, A.; Tsuneyoshi, K.; Kitagawa, T. Turbulent and Stable/Unstable Laminar Burning Velocity Measurements from Outwardly Propagating Spherical Hydrogen-Air Flames at Elevated Pressures. J. Therm. Sci. Technol. 2006, 1, 31–41. [Google Scholar] [CrossRef]
  18. Lee, J.H.; Lee, S.I.; Kwon, O.C. Effects of ammonia substitution on hydrogen/air flame propagation and emissions. Int. J. Hydrogen Energy 2010, 35, 11332–11341. [Google Scholar] [CrossRef]
  19. Li, J.; Huang, H.; Kobayashi, N.; He, Z.; Nagai, Y. Study on using hydrogen and ammonia as fuels: Combustion characteristics and NOx formation. Int. J. Engine Res. 2014, 38, 1214–1223. [Google Scholar] [CrossRef]
  20. Kumar, P.; Meyer, T.R. Experimental and modeling study of chemical-kinetics mechanisms for H2–NH3–air mixtures in laminar premixed jet flames. Fuel 2013, 108, 166–176. [Google Scholar] [CrossRef]
  21. Zitouni, S.; Brequigny, P.; Mounaїm-Rousselle, C. Influence of hydrogen and methane addition in laminar ammonia premixed flame on burning velocity, Lewis number and Markstein length. Comb. Flame 2023, 253, 112786. [Google Scholar] [CrossRef]
  22. Wang, S.; Wang, Z.; Elbaz, A.M.; Han, X.; He, Y.; Costa, M.; Konnov, A.A.; Roberts, W.L. Experimental study and kinetic analysis of the laminar burning velocity of NH3/syngas/air, NH3/CO/air and NH3/H2/air premixed flames at elevated pressures. Comb. Flame 2020, 221, 270–287. [Google Scholar] [CrossRef]
  23. Lhuillier, C.; Brequigny, P.; Lamoureux, N.; Contino, F.; Mounaïm-Rousselle, C. Experimental investigation on laminar burning velocities of ammonia/hydrogen/air mixtures at elevated temperatures. Fuel 2020, 263, 116653. [Google Scholar] [CrossRef]
  24. Lee, J.H.; Kim, J.H.; Park, J.H.; Kwon, O.C. Studies on properties of laminar premixed hydrogen-added ammonia/air flames for hydrogen production. Int. J. Hydrogen Energy 2010, 35, 1054–1064. [Google Scholar] [CrossRef]
  25. Mei, B.; Zhang, X.; Ma, S.; Cui, M.; Guo, H.; Cao, Z.; Li, Y. Experimental and kinetic modeling investigation on the laminar flame propagation of ammonia under oxygen enrichment and elevated pressure conditions. Comb. Flame 2019, 210, 236–246. [Google Scholar] [CrossRef]
  26. Zakaznov, V.F.; Kursheva, L.A.; Fedina, Z.I. Determination of normal flame velocity and critical diameter of flame extinction in ammonia-air mixture. Combust. Explos. Shock. Waves 1978, 14, 710–713. [Google Scholar] [CrossRef]
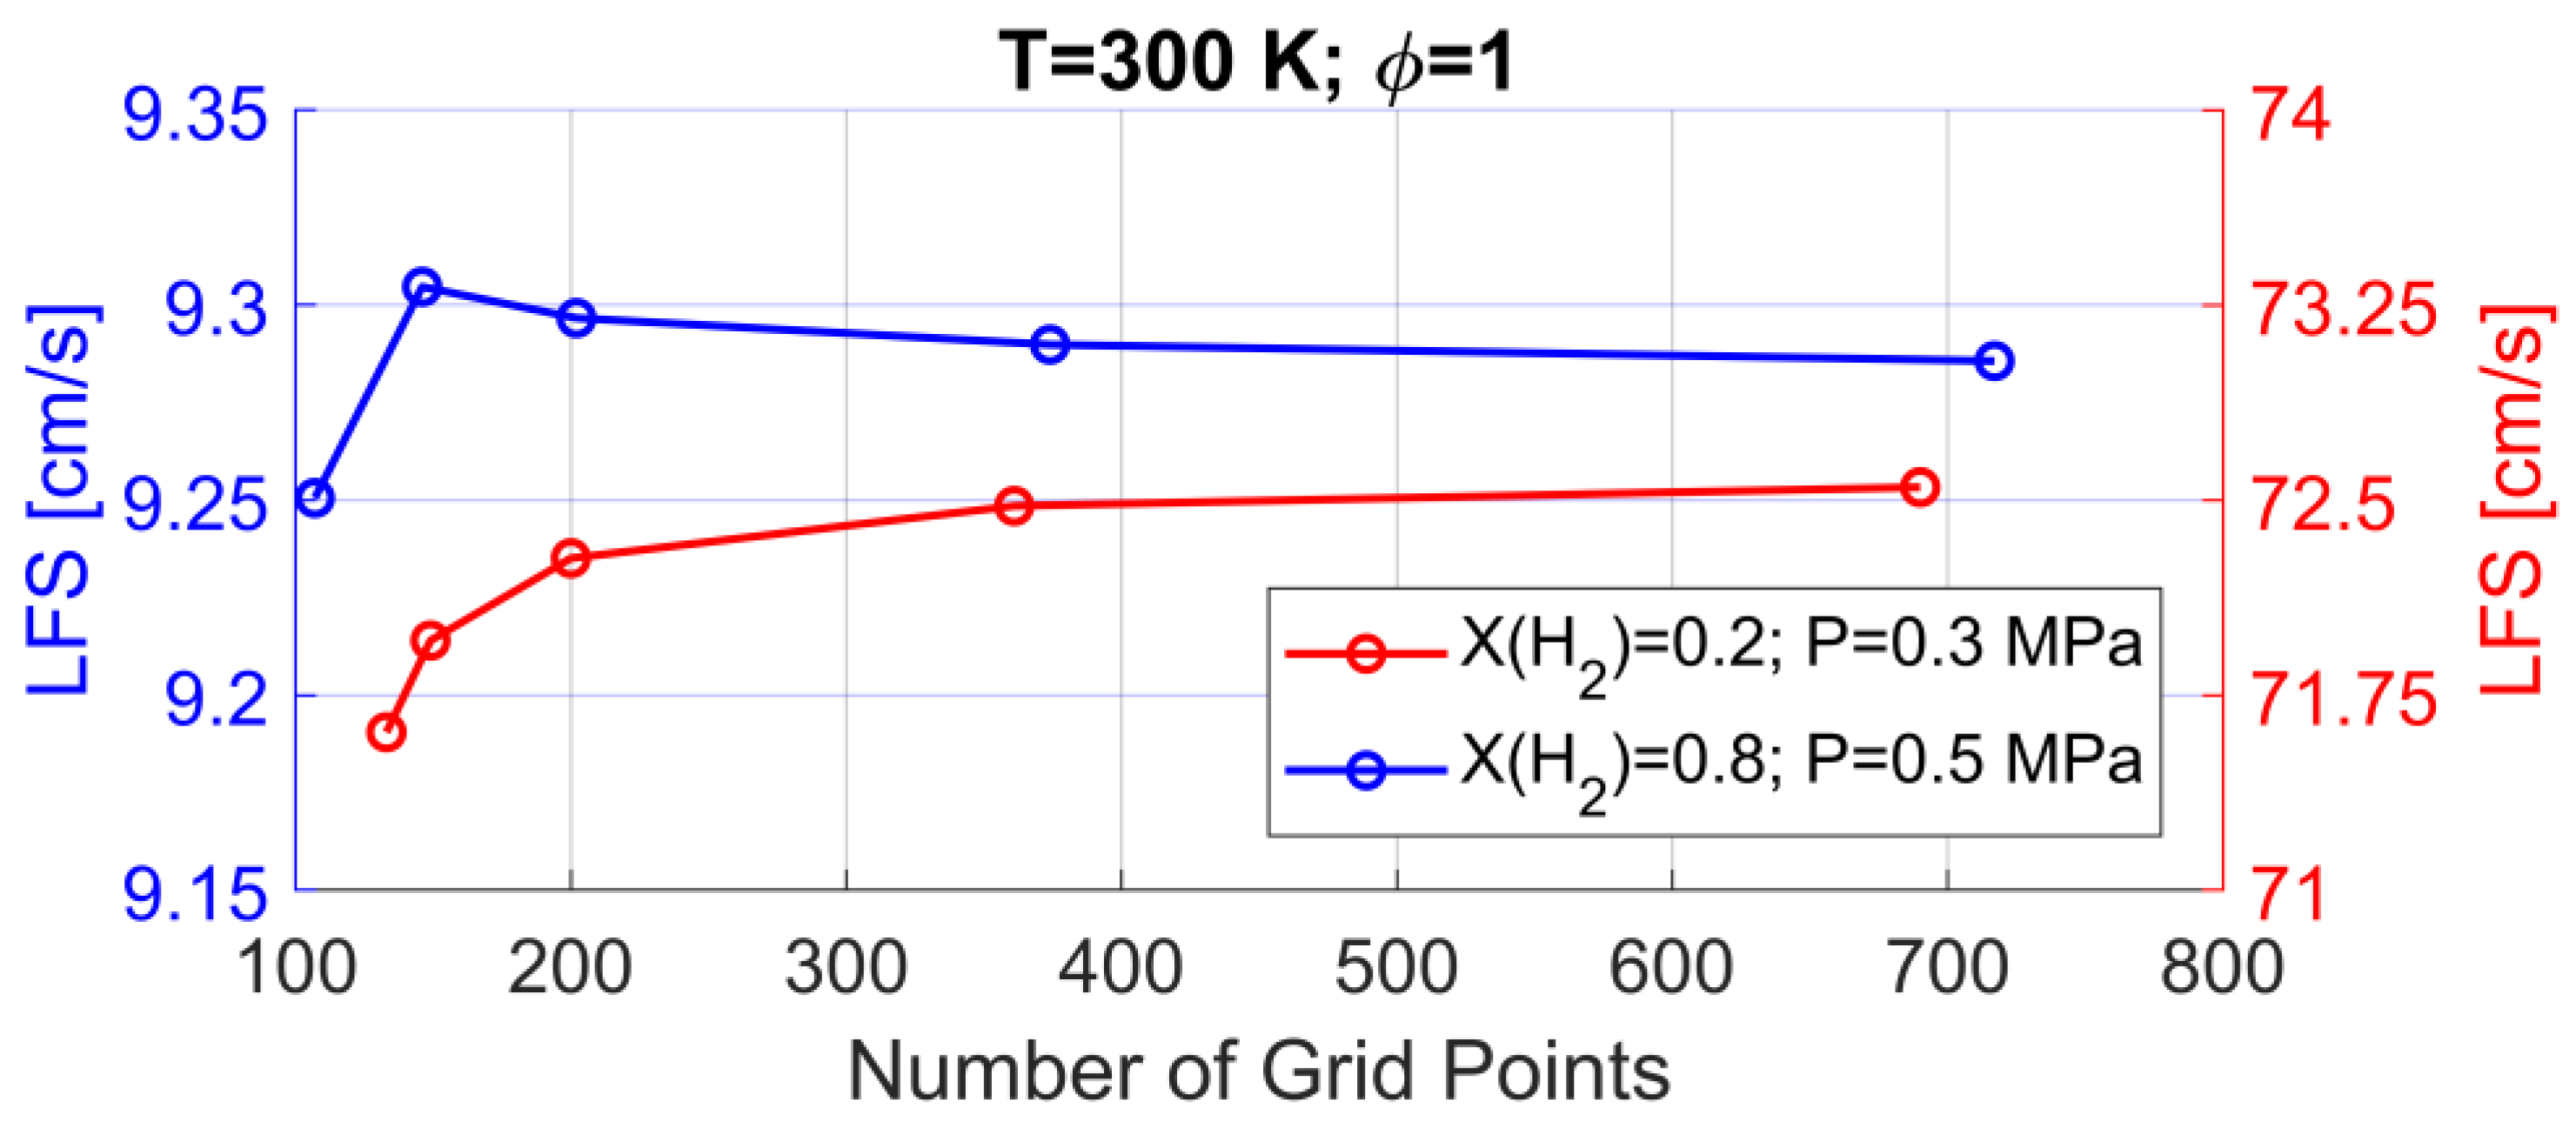
Figure 1. Laminar Flame Speed (LFS) values versus the number of grid points of each continuation for a stoichiometric mixture of NH3/H2/air at 300 K with different values of X(H2) and pressure.
Energies 17 04181 g001
Figure 2. Grid size distribution in the flame region for the initial, the second and the fourth continuations, and temperature profile for the last continuation.
Energies 17 04181 g002
Figure 3. Comparison between measurements [4,5,11,18,19,20,21,22] (symbols) and present numerical results (lines) in terms of LFS as a function of hydrogen mole fraction of the NH3/H2 mixture, at p = 0.1 MPa, T = 300 K and ϕ = 1.
Energies 17 04181 g003
Figure 4. Comparison between measurements [4,5,11,18,19,20,21,22] (symbols) and present numerical results (lines) in terms of LFS as a function of hydrogen mole fraction of the NH3/H2 mixture in the range 0–0.6, at T = 300 K, ϕ = 1 and different pressures: 0.1 MPa, 0.3 MPa and 0.5 MPa.
Energies 17 04181 g004
Figure 5. Mean percentage decrease in LFS with a pressure increase as a function of hydrogen mole fraction of the NH3/H2 mixture at T = 300 K and ϕ = 1. The bars represent the range of variability.
Energies 17 04181 g005
Figure 6. Comparison between measurements [4,5,11,19,21,22,23,24,25,26] (symbols) and present numerical results (lines) in terms of LFS as a function of equivalence ratio for six hydrogen mole fractions of the NH3/H2 mixture at p = 0.1 MPa and T = 298 K.
Energies 17 04181 g006
Figure 7. Comparison between measurements [23] (symbols) and present numerical results (lines) in terms of LFS as a function of equivalence ratio for six hydrogen mole fractions of the NH3/H2 mixture at p = 0.1 MPa and T = 373 K.
Energies 17 04181 g007
Figure 8. Comparison between measurements [8,23] (symbols) and present numerical results (lines) in terms of LFS as a function of equivalence ratio for six hydrogen mole fractions of the NH3/H2 mixture at p = 0.1 MPa and T = 473 K.
Energies 17 04181 g008
Figure 9. Mean percentage increment of LFS with temperature as a function of equivalence ratio for X(H2) = 0, 0.3, 0.6, and p = 0.1 MPa. The bars represent the range of variability.
Energies 17 04181 g009
Figure 10. LFS as a function of H2 mole fraction in the fuel mixture for different pressures and equivalence ratios by using the M1 mechanism from Table 2 at T = 300 K. Comparison among present numerical results (symbols), first-degree correlations (solid lines) and second-degree correlations (dashed lines).
Energies 17 04181 g010
Figure 11. Determination coefficients for the linear regression and the second-order polynomial regression as a function of pressure for different equivalence ratios by using the M1 mechanism from Table 2 at T = 300 K.
Energies 17 04181 g011
Figure 12. LFS as a function of pressure for different H2 mole fractions in the fuel mixture and equivalence ratios by using the M1 mechanism from Table 2 at T = 300 K.
Energies 17 04181 g012
Figure 13. Mean percentage reduction in LFS with increasing pressure as a function of hydrogen mole fraction in the NH3/H2 fuel mixture obtained with M1, M3 and M4 mechanisms from Table 2 and ϕ = 0.8, 1 and 1.2, at T = 300 K. The bars represent the range of variability.
Energies 17 04181 g013
Figure 14. Comparison among present numerical results (symbols), first-degree correlations (solid lines) and second-degree correlations (dashed lines) for different pressures by using the M1 mechanism from Table 2 at T = 800 K and ϕ = 1.
Energies 17 04181 g014
Figure 15. Determination coefficients for the linear regression and the second-order polynomial regression as a function of pressure for stoichiometric mixtures by using the M1 mechanism from Table 2 at T = 800 K.
Energies 17 04181 g015
Figure 16. Percentage reduction in LFS with increasing pressure as a function of hydrogen mole fraction in the NH3/H2 fuel mixture by using the M1 mechanism from Table 2 at T = 800 K and ϕ = 1.
Energies 17 04181 g016
Figure 17. Percentage increment of LFS as temperature increases from 300 K to 800 K as a function of hydrogen mole fraction in the NH3/H2 fuel mixture by using the M1 mechanism from Table 2 for ϕ = 1 and pressure equal to 0.5, 1.0 and 2.0 MPa.
Energies 17 04181 g017
Figure 18. Temperature, reactants and major products profiles of stoichiometric NH3/H2/Air flames at p = 4.0 MPa and T = 800 K, with X(H2) equal to 0.4 and 0.0, by using the M1 mechanism from Table 2.
Energies 17 04181 g018
Figure 19. Intermediate major chemical species profiles of stoichiometric N H 3 / H 2 / Air flames at p = 4.0 MPa and T = 800 K with X ( H 2 ) equal to 0.4 and 0.0 by using the M1 mechanism from Table 2.
Energies 17 04181 g019
Table 1. Thermodynamic conditions and mixture compositions used for the simulations.
Pressure [MPa]Temperature [K]Equivalence RatioH2 Mole Fraction in the Fuel Mixture
0.1, 0.3, 0.5, 1.0, 2.0, 3.0, 4.0, 8.0300, 373, 473, 800[0.7–1.5][0.0–1.0]
Table 2. Reaction mechanisms used for the simulations.
ReferenceLabelNumber of SpeciesNumber of Reactions
Zhang et al. [9]M138263
Otomo et al. [10]M232231
Gotama et al. [11]M332165
Stagni et al. [12]M441203
Singh et al. [13]M532259
Table 3. Gradient and curvature parameters for each grid refinement.
Grid RefinementGradient ParameterCurvature Parameter
00.10.5
10.080.3
20.060.1
30.030.07
40.01/0.0150.05
Table 4. Experimental conditions used for the model validation.
Referencep [MPa]T [K]X(H2)ϕ
Ichikawa et al. [4]0.1, 0.3, 0.5298[0–1][0.8–1.2]
Han et al. [5]0.1298[0–0.45][0.8–1.4]
Shrestha et al. [8]0.1473[0–0.3][0.8–1.4]
Smallbone et al. [17]0.129811
Lee et al. [18]0.12980.1, 0.3, 0.51
Li et al. [19]0.1293[0.4–0.6]1, 1.3, 1.4
Kumar and Meyer [20]0.12980.25, 0.55, 0.8, 11
Zitouni et al. [21]0.1298[0–0.8][0.8–1.4]
Wang et al. [22]0.1, 0.3, 0.52980.4, 0.6[0.7–1.5]
Gotama et al. [11]0.1, 0.52980.4[0.8–1.4]
Lhuillier et al. [23]0.1298, 373, 473[0–0.6][0.8–1.4]
Lee et al. [24]0.12980.50.8, 1
Mei et al. [25]0.13000[0.9–1.3]
Zakaznov et al. [26]0.12930[0.8–1.3]
Table 5. Correlation coefficients and coefficients of determination obtained with the M1 mechanism from Table 2 for different pressures and equivalence ratios at T = 300 K.
p [MPa]α R α 2 β1β2 R β 2
ϕ = 0.8
0.14.015350.999124.46199−0.853820.99928
0.33.784170.999103.664470.133470.99965
0.53.654000.998163.284950.579630.99982
1.03.442290.996742.766351.133540.99993
2.03.164640.995652.247631.566850.99978
3.02.970800.995511.981151.696050.99954
ϕ = 1.0
0.13.745080.999004.01731−0.549840.99900
0.33.515410.995963.213020.450000.99937
0.53.357290.993872.775960.949520.99971
1.03.106130.992172.180101.576540.99997
2.02.842560.992281.655412.043740.99953
3.02.690210.992961.416442.190240.99885
ϕ = 1.2
0.13.515140.992743.385370.144720.99748
0.33.310570.992042.734520.962450.99939
0.53.204500.992012.411791.357720.99985
1.03.039990.991561.944491.894750.99993
2.02.825800.991301.445502.383500.99916
3.02.673500.992021.168522.589800.99804
Table 6. Correlation coefficients and coefficients of determination obtained with the M1 mechanism from Table 2 for different pressures, ϕ = 1, and T = 800 K.
p [MPa]α R α 2 β1β2 R β 2
ϕ = 1.0
0.53.008380.992072.337941.073920.99938
12.792480.989311.856831.549540.99986
22.537400.988381.452361.829000.99989
42.271640.989411.196171.828090.99944
82.017770.991281.082601.592530.99907
Disclaimer/Publisher’s Note: The statements, opinions and data contained in all publications are solely those of the individual author(s) and contributor(s) and not of MDPI and/or the editor(s). MDPI and/or the editor(s) disclaim responsibility for any injury to people or property resulting from any ideas, methods, instructions or products referred to in the content.